Article

Phenomenological Over-Parameterization of the Triple-Fitting-Parameter Diffusion Models in Evaluation of Gas Diffusion in Coal

1
Beijing Key Laboratory for Precise Mining of Intergrown Energy and Resources, China University of Mining & Technology, Beijing 100083, China
2
Faculty of Emergency Management & Safety Engineering, China University of Mining & Technology, Beijing 100083, China
*
Authors to whom correspondence should be addressed.
Processes 2019, 7(4), 241; https://doi.org/10.3390/pr7040241
Submission received: 22 March 2019 / Revised: 23 April 2019 / Accepted: 23 April 2019 / Published: 25 April 2019
(This article belongs to the Special Issue Dynamic Modeling and Control in Chemical and Energy Processes)

Abstract

:
Gas diffusivities of coal are not measured directly but are normally regressed by fitting mathematical diffusion models to fractional sorption data measured in sorption experiments. This paper firstly measured three fractional adsorption curves at various equilibrium pressures with the manometric method. The measured fractional adsorption curves were then modeled with one single-fitting-parameter (SFP) model and three triple-fitting-parameter (TFP) models. The modeling results showed that the TFP models were phenomenologically over-parameterized due to the usage of three fitting parameters, which may be excessive for curve fitting. The phenomenological over-parameterization resulted in multiple pressure-dependences of gas diffusivity for the TFP models. The TFP models should thus be carefully used. On the other hand, the dual-fitting-parameter (DFP) models also have excellent performance in curve fitting and can produce interpretable modeling results. The DFP models can be used as an alternative to the TFP model in the future.

1. Introduction

Coalbed methane (CBM) recovery and carbon dioxide (CO2)-enhanced CBM production have flourished in many countries [1]. The development of these projects requires detailed and reliable information on gas sorption and flow [2]. Gas sorption determines methane (CH4) reserves [3,4] and CO2 sorption capacity in coal [2,5]. Since gas sorption is normally assumed instantaneous [6,7,8], CBM production and CO2 injection rates are mainly determined by gas flow processes. Gas flow in coal is often considered as a two-stage process: laminar flow in cleats and diffusion in coal matrices [9,10,11]. This paper focuses on gas diffusion and does not include the laminar flow in cleats.
Gas diffusivities of coal are not measured directly but are normally regressed by fitting mathematical diffusion models to fractional sorption data measured in sorption experiments [2,12,13]. The diffusion models can be classified into three categories in terms of the number of fitting parameters: single-fitting-parameter model (SFP model), double-fitting-parameter model (DFP model), and triple-fitting-parameter model (TFP model), as shown in Table 1. Normally, the DFP and TFP models have better performance in curve fitting than the SFP models do [13,14]. The SFP and DFP models normally predict monotonic dependences of diffusivity on gas and coal properties such as gas pressure [15,16], gas type [14,17,18], temperature [19,20], particle size [15,21], and moisture content [13,14,22]. However, the TFP models can predict non-monotonic dependences of diffusivity on gas and coal properties [13,22,23,24].
Although the single-fitting-parameter models predict opposite dependences of diffusivity on gas and coal properties, both dependences can be physically interpreted. For example, Nandi and Walker [15] predicted a positive gas pressure dependence of diffusivity while Pillalamarry et al. [16] predicted a negative gas pressure dependence with the unipore model. The positive gas pressure dependence is normally attributed to the increase in surface diffusion, which becomes pronounced with increasing surface loading [29]. The negative gas pressure dependence may be due to two causes: one is the intensive collisions between gas molecules and the other is gas sorption-induced coal swelling [30]. However, the non-monotonic dependences predicted by the TFP have not been well-interpreted yet.
This paper presents the experimental measurements of three fractional adsorption curves at various equilibrium pressures. The measured fractional adsorption curves are then modeled with the TFP models. The modeling results will be compared and discussed to obtain insights into the TFP models and to illustrate why the TFP models can predict non-monotonous dependences of diffusivity on gas and coal properties. The results will show that this kind of models is phenomenologically over-parameterized.

2. Summary of the TFP Models

Physical meanings of all model parameters are shown in Nomenclature.

2.1. Ruckenstein Bidisperse Model

Ruckenstein et al. [26] used Equation (1) to represent sorbate diffusion and sorption in a spherical macroporous sphere consisting of small spherical microporous particles with a uniform radius. They solved Equation (1) by assuming constant macropore and micropore diffusivities, invariant surface sorbate concentration, and linear isotherm. The solution is shown in Equation (2):
ϕ a C a t + S a C s a t + 4 π n R i 2 D i ϕ i C i r i r i = R i = D a ϕ a r a 2 r a r a 2 C a r a ϕ i C i t + S i C s i t = D i ϕ i r i 2 r i r i 2 C i r i
M t M = r = 1 s = 1 r 2 [ 1 exp ( α ξ r s 2 D a t ) ] ξ r s 4 [ 1 + α β + cot 2 ξ r s ( 1 r 2 π 2 β ) 1 ξ r s 2 ] r = 1 s = 1 r 2 ξ r s 4 [ 1 + α β + cot 2 ξ r s ( 1 r 2 π 2 β ) 1 ξ r s 2 ] β ( 1 ξ r s cot ξ r s ) + α ξ r s 2 = r 2 π 2 D a = D a R a 2 ( 1 + S a H a ϕ a ) α = D i D a
Ruckenstein et al. [26] subsequently reduced Equation (2) into two limiting cases. One case is that the total sorption is a two-stage diffusion process: a faster diffusion in macropores and a slower diffusion in micropores. This case is applicable when 0 < α < 10−3 and Equation (2) reduces to [13,22,26]:
M t M = θ a 1 6 π 2 n = 1 1 n 2 exp n 2 π 2 D a t + 1 θ a 1 6 π 2 n = 1 1 n 2 exp n 2 π 2 α D a t θ a = M a M = 1 + 1 3 β / α
The other case is that the sorbate concentration in micropores is considered to equilibrate with the corresponding local concentration in macropores. This case is applicable when α > 102 and Equation (2) reduces to [26]:
M t M = 1 6 π 2 n = 1 1 n 2 exp θ a n 2 π 2 D a t
When 10−3 < α < 102, both macropore sorption and micropore sorption are important and Equation (2) should be used.
When evaluating gas diffusion in coal, Equation (3) is used commonly while the usage of Equations (2) and (4) is rare. Therefore, Equation (3) is referred to as the Ruckenstein bidisperse model (RB model) in this paper.

2.2. Fickian Diffusion-Relaxation Model

Berens and Hopfenberg [27] assumed that the sorption process in glassy polymers is a linear superposition of Fickian diffusion and polymeric relaxation. The total sorption can thus be calculated by:
M t = M F t + M R t
where M F t and M R t are the contributions of Fickian diffusion and polymeric relaxation, respectively [27]:
M F t = M F 1 6 π 2 n = 1 1 n 2 exp n 2 π 2 D F t
M R t = M R 1 exp k R t
where M F and M R are the contributions of Fickian diffusion and polymeric relaxation at equilibrium, respectively.
Substituting Equations (6) and (7) into Equation (5) leads to [27,31]:
M t M = θ F 1 6 π 2 n = 1 1 n 2 exp n 2 π 2 D F t + 1 θ F 1 exp k R t θ F = M F M
Equation (8) is referred to as the Fickian diffusion-relaxation model (FDR model) in this paper. When D F k R , the sorption process is Fickian diffusion-controlled. When k R D F , the sorption process is relaxation-controlled. When D F and k R are comparable, the sorption process is controlled by both diffusion and relaxation.

2.3. Double Exponential Model

Busch et al. [28] proposed a double exponential function to describe gas diffusion in coal:
Q r e s = θ f exp k f t + 1 θ f exp k s t
Q r e s can be calculated by:
Q r e s = P t P P 0 P
Equation (9) is proposed for practical purposes. It is thus empirical and lacks scientific foundations. Because this equation calculates unoccupied capacity, it cannot fit fractional sorption data directly. Several steps are needed to convert it to a proper form.
Fractional sorption can be represented by [5]:
M t M = M 0 M t M 0 M
Equation (11) can be written into the following equation with the isothermal assumption:
M t M = P 0 V z 0 R T P t V z t R T P 0 V z 0 R T P V z R T = P 0 z 0 P t z t P 0 z 0 P z
When the pressure step is small or the gas pressure is much lower or greater than the critical pressure, the compressibility factor can be assumed to remain constant with pressure. Equation (11) can then be simplified to:
M t M P 0 P t P 0 P = P 0 P P t P P 0 P = 1 P t P P 0 P = 1 Q r e s
Substituting Equation (9) into Equation (13) leads to:
M t M = 1 θ f exp k f t + 1 θ f exp k s t
Equation (14) is an alternate form of Equation (9) and can fit fractional sorption data directly. In this paper. Equation (14) is referred to as the double exponential model (DE model).

3. Experimental Measurements of Fractional Sorption Curves

3.1. Sample

The coal samples used in this study were prepared from an anthracite lump that was taken from Yuwu Coal Mine in Changzhi City, Shanxi Province. Coal fragments were pulverized into powders and the fractions between 0.18–0.25 mm were selected and preserved in a big jar for subsequent experimental measurements. Little samples were taken to measure coal properties and the results are listed in Table 2. Sample density was measured following the method described in GB/T 217-2008. Proximate analysis was conducted by using a GF-A2000 auto proximate analyzer (Huanuo Electron Science and Technology Co., Ltd, China, 2013).

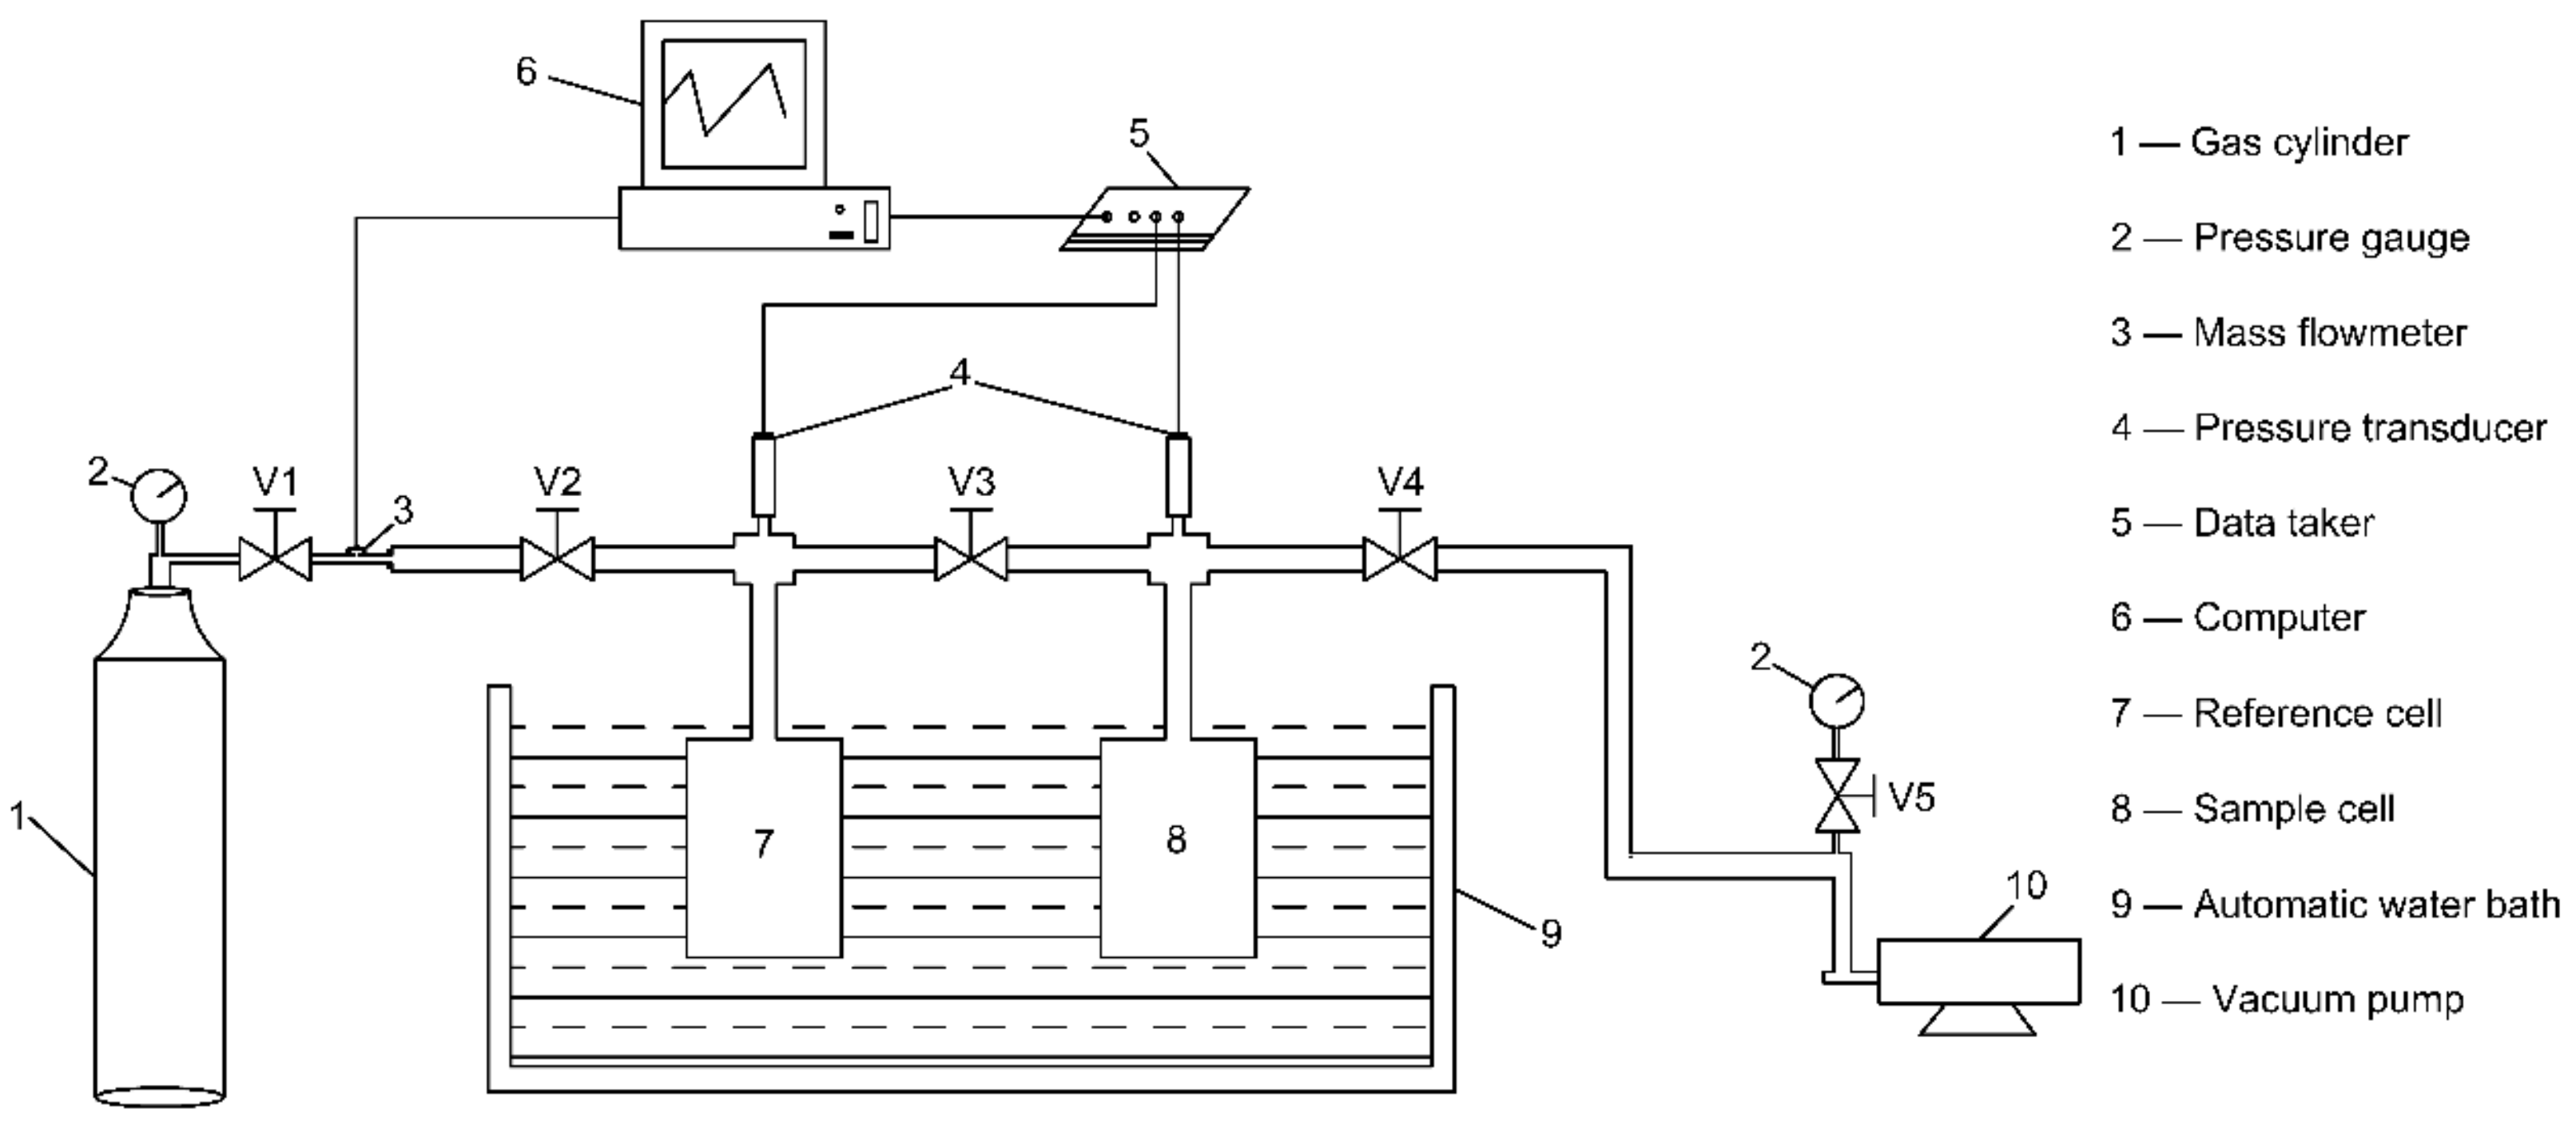
3.2. Experimental Setup

The experimental apparatus used in this study was a manometric sorption system, as shown in Figure 1. The reference and sample cells were cylindrical (diameter is 50 mm and length is 100 mm). Each cell linked a gas pressure transducer (UNIK5600, Baker Hughes, USA, 2016). The mass flowmeter (SevenStar D07, Beijing Sevenstar Flow Co.,Ltd., China, 2016) was introduced to record the gas amount releasing into the tubes and the two cells. A data taker (DT800, Thermo Fisher Scientific Ltd., Australia, 2016) connecting the three transducers was used to transduce the recorded signals into mathematical data. The reference and sample cells were immersed in a water bath, of which the temperature was kept invariant (298 K ± 0.2 K). The extraction pump was used to vacuum the tubes and the two cells. The values were used to partition the system and to control measurement procedures.

3.3. Measurement Procedures

The void volumes without and with samples were calibrated by using helium expansion. Air-tightness was also detected before measuring fractional adsorption data. The manometric method uses gas pressure change in the sample cell to represent sorption rates and to compute fractional sorptions. Measurements were conducted according to the following procedures:
(1)
Implement the sample into the sample cell.
(2)
Evacuate the air in the system and shut all valves.
(3)
Opening V1.
(4)
Open V2 slowly and inject CH4 gas from a gas cylinder into the reference cell.
(5)
When the gas pressure in the reference cell increased to about 1.0 MPa, close V2 and open V3 rapidly.
(6)
Record gas pressure change in the sample cell with a time interval of one second.
(7)
When the gas pressure in the sample cell kept invariant in two hours, terminate recording the gas pressure and close V3.
(8)
Repeat (3)–(6) two times.
Three gas injection runs were conducted. For each injection run, the gas pressure in the sample cell increased at first and then decreased with time. This indicates that a maximum gas pressure existed in the sample cell. Table 3 shows the maximum and equilibrium gas pressures of the three injection runs. The difference between the maximum and equilibrium gas pressures decreased with continuing gas injection.

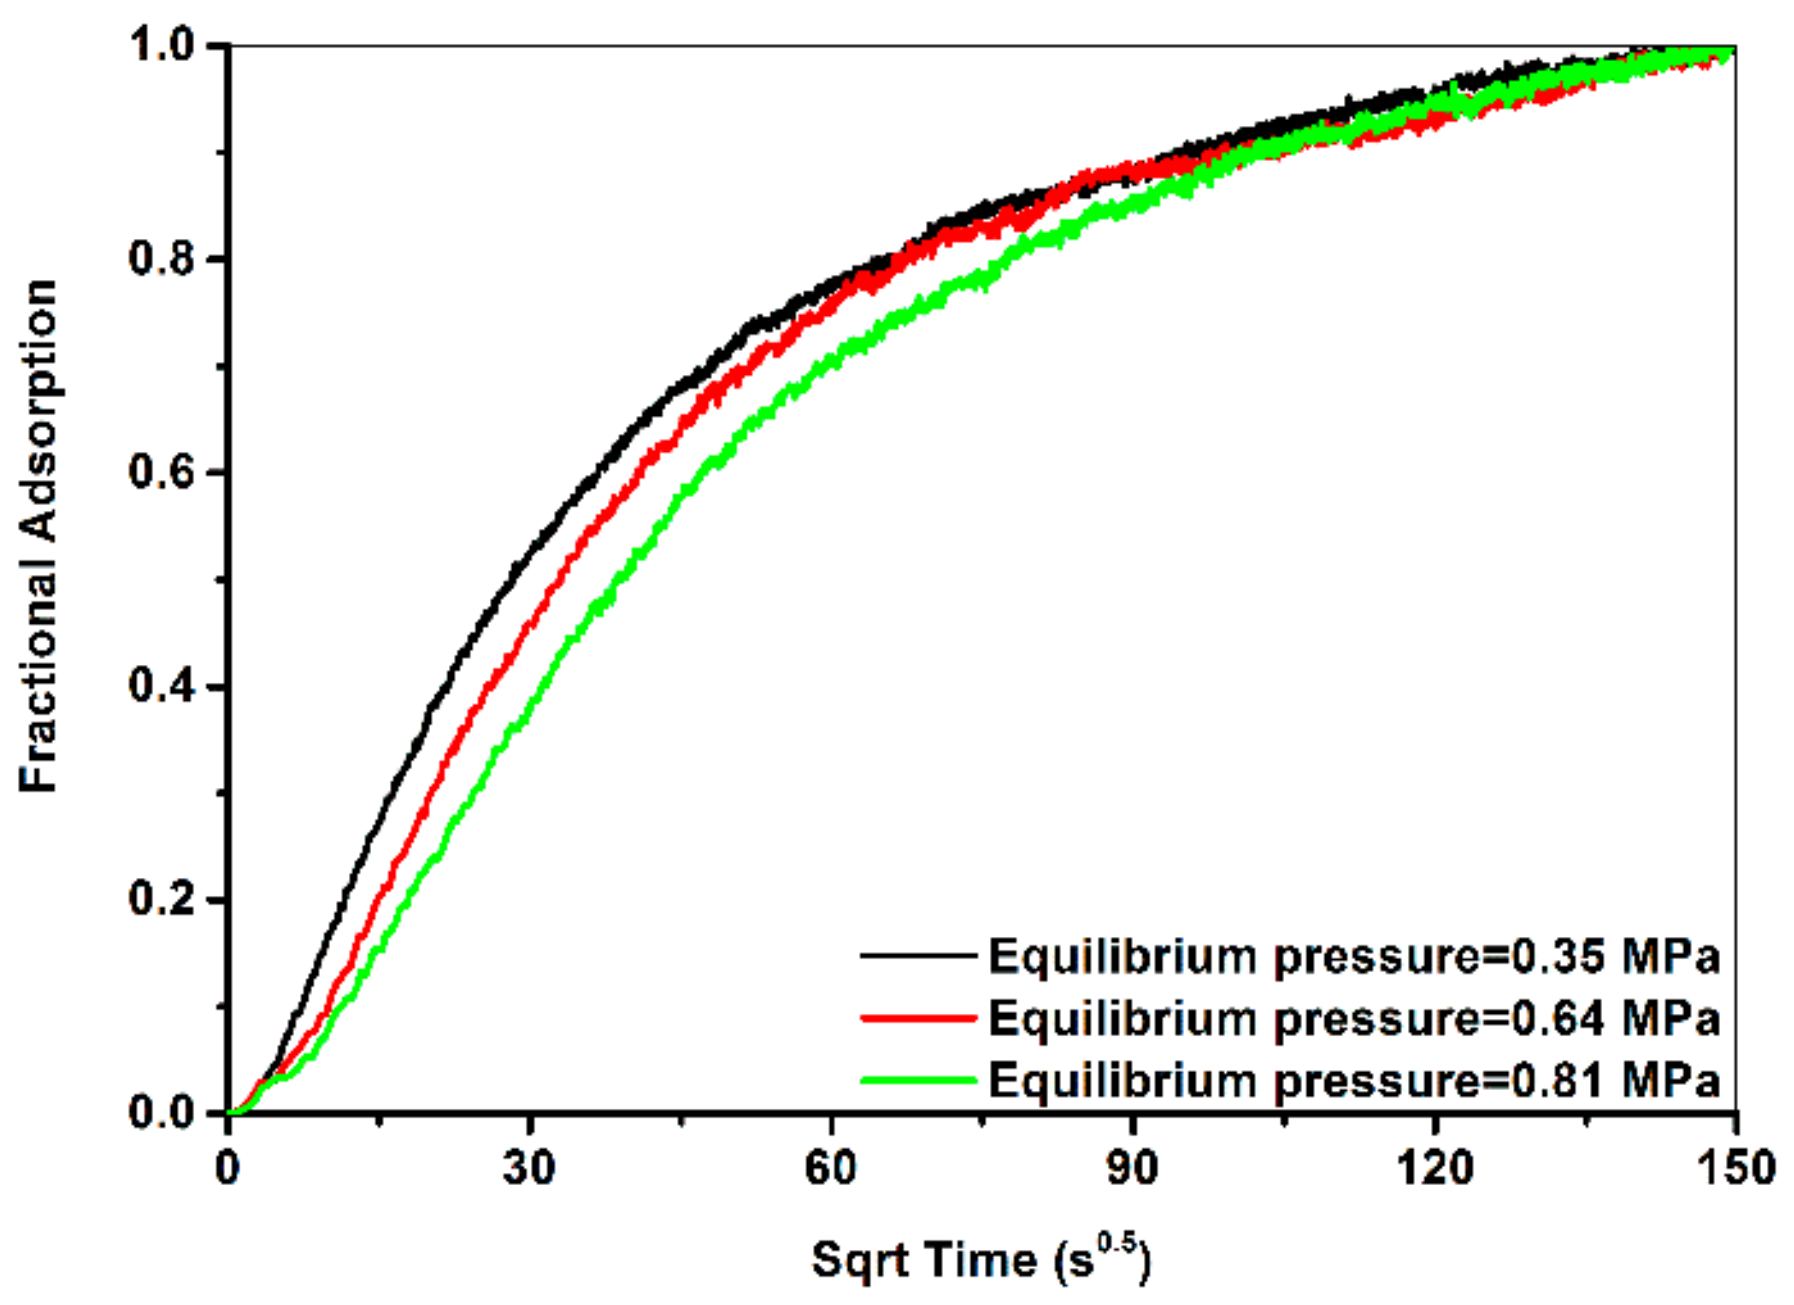
3.4. Measured Fractional Adsorption Curves

Fractional adsorption curves were computed according to the method presented in literature [2]. The initiation time of diffusion was defined as the time when the gas pressure in the sample cell reached a maximum. The three measured fractional adsorption curves are shown in Figure 2. The fractional adsorption curves of the three injection runs reached equilibrium within about six hours. Although the three curves nearly overlap after four hours, the adsorption rate seems to be negatively proportional to gas pressure.

4. Modeling the Measured Fractional Adsorption Curves with the TFP Models

4.1. Modeling Configuration

Modeling the measured fractional adsorption curves were conducted by using the nonlinear curve fit module within the OriginPro 9.0 Package (OriginLab Corp., MA, USA) [32]. In order to compare the modeling results between the unipore (UP) model (Equation (15)) and the TFP models, the measured fractional adsorption curves were also modeled with the UP model:
M t M = 1 6 π 2 n = 1 1 n 2 exp n 2 π 2 D u t
The DE model was implemented into OriginPro 9.0 with an explicit function. The UP model, RB model, and FDR model have infinite series. They were thus implemented into Origin by writing three C functions. The infinite series were computed with iterations. Iterations were terminated when the following inequality was established:
M t M n M t M n 1 M t M n < 10 5
where M t M n is the computed fractional sorption at the nth iteration step and M t M n 1 is the computed fractional sorption at the (n − 1)th iteration step.
The TFP models all have three fitting parameters. One represents the sorption fraction ( θ ) of one diffusion process and the other two represent the diffusivities or rate parameters of the two diffusion processes. The upper bounds of the three fitting parameters were unity and the lower bounds were zero.
When conducting modelings with the RB model, an optimal fit needed a long time to achieve convergence. In order to obtain quick convergence, the optimal fit was obtained through a three-step procedure. The first step was dividing the whole span of θ into ten uniform parts and the size of each sub-span was 0.1. The second step was obtaining the optimal fit of each sub-span. The third step was selecting the final optimal fit by comparing the optimal fits of the ten sub-spans.
Ruckenstein et al. [26] developed the RB model with the assumption of 0 < α < 10−3. However, many studies misused this model by expanding the upper bound of α to unity. In order to evaluate this misusage, modeling with the RB model was conducted twice, one with the assumption of 0 < α < 10−3 and the other with the assumption of 0 < α < 1.0.

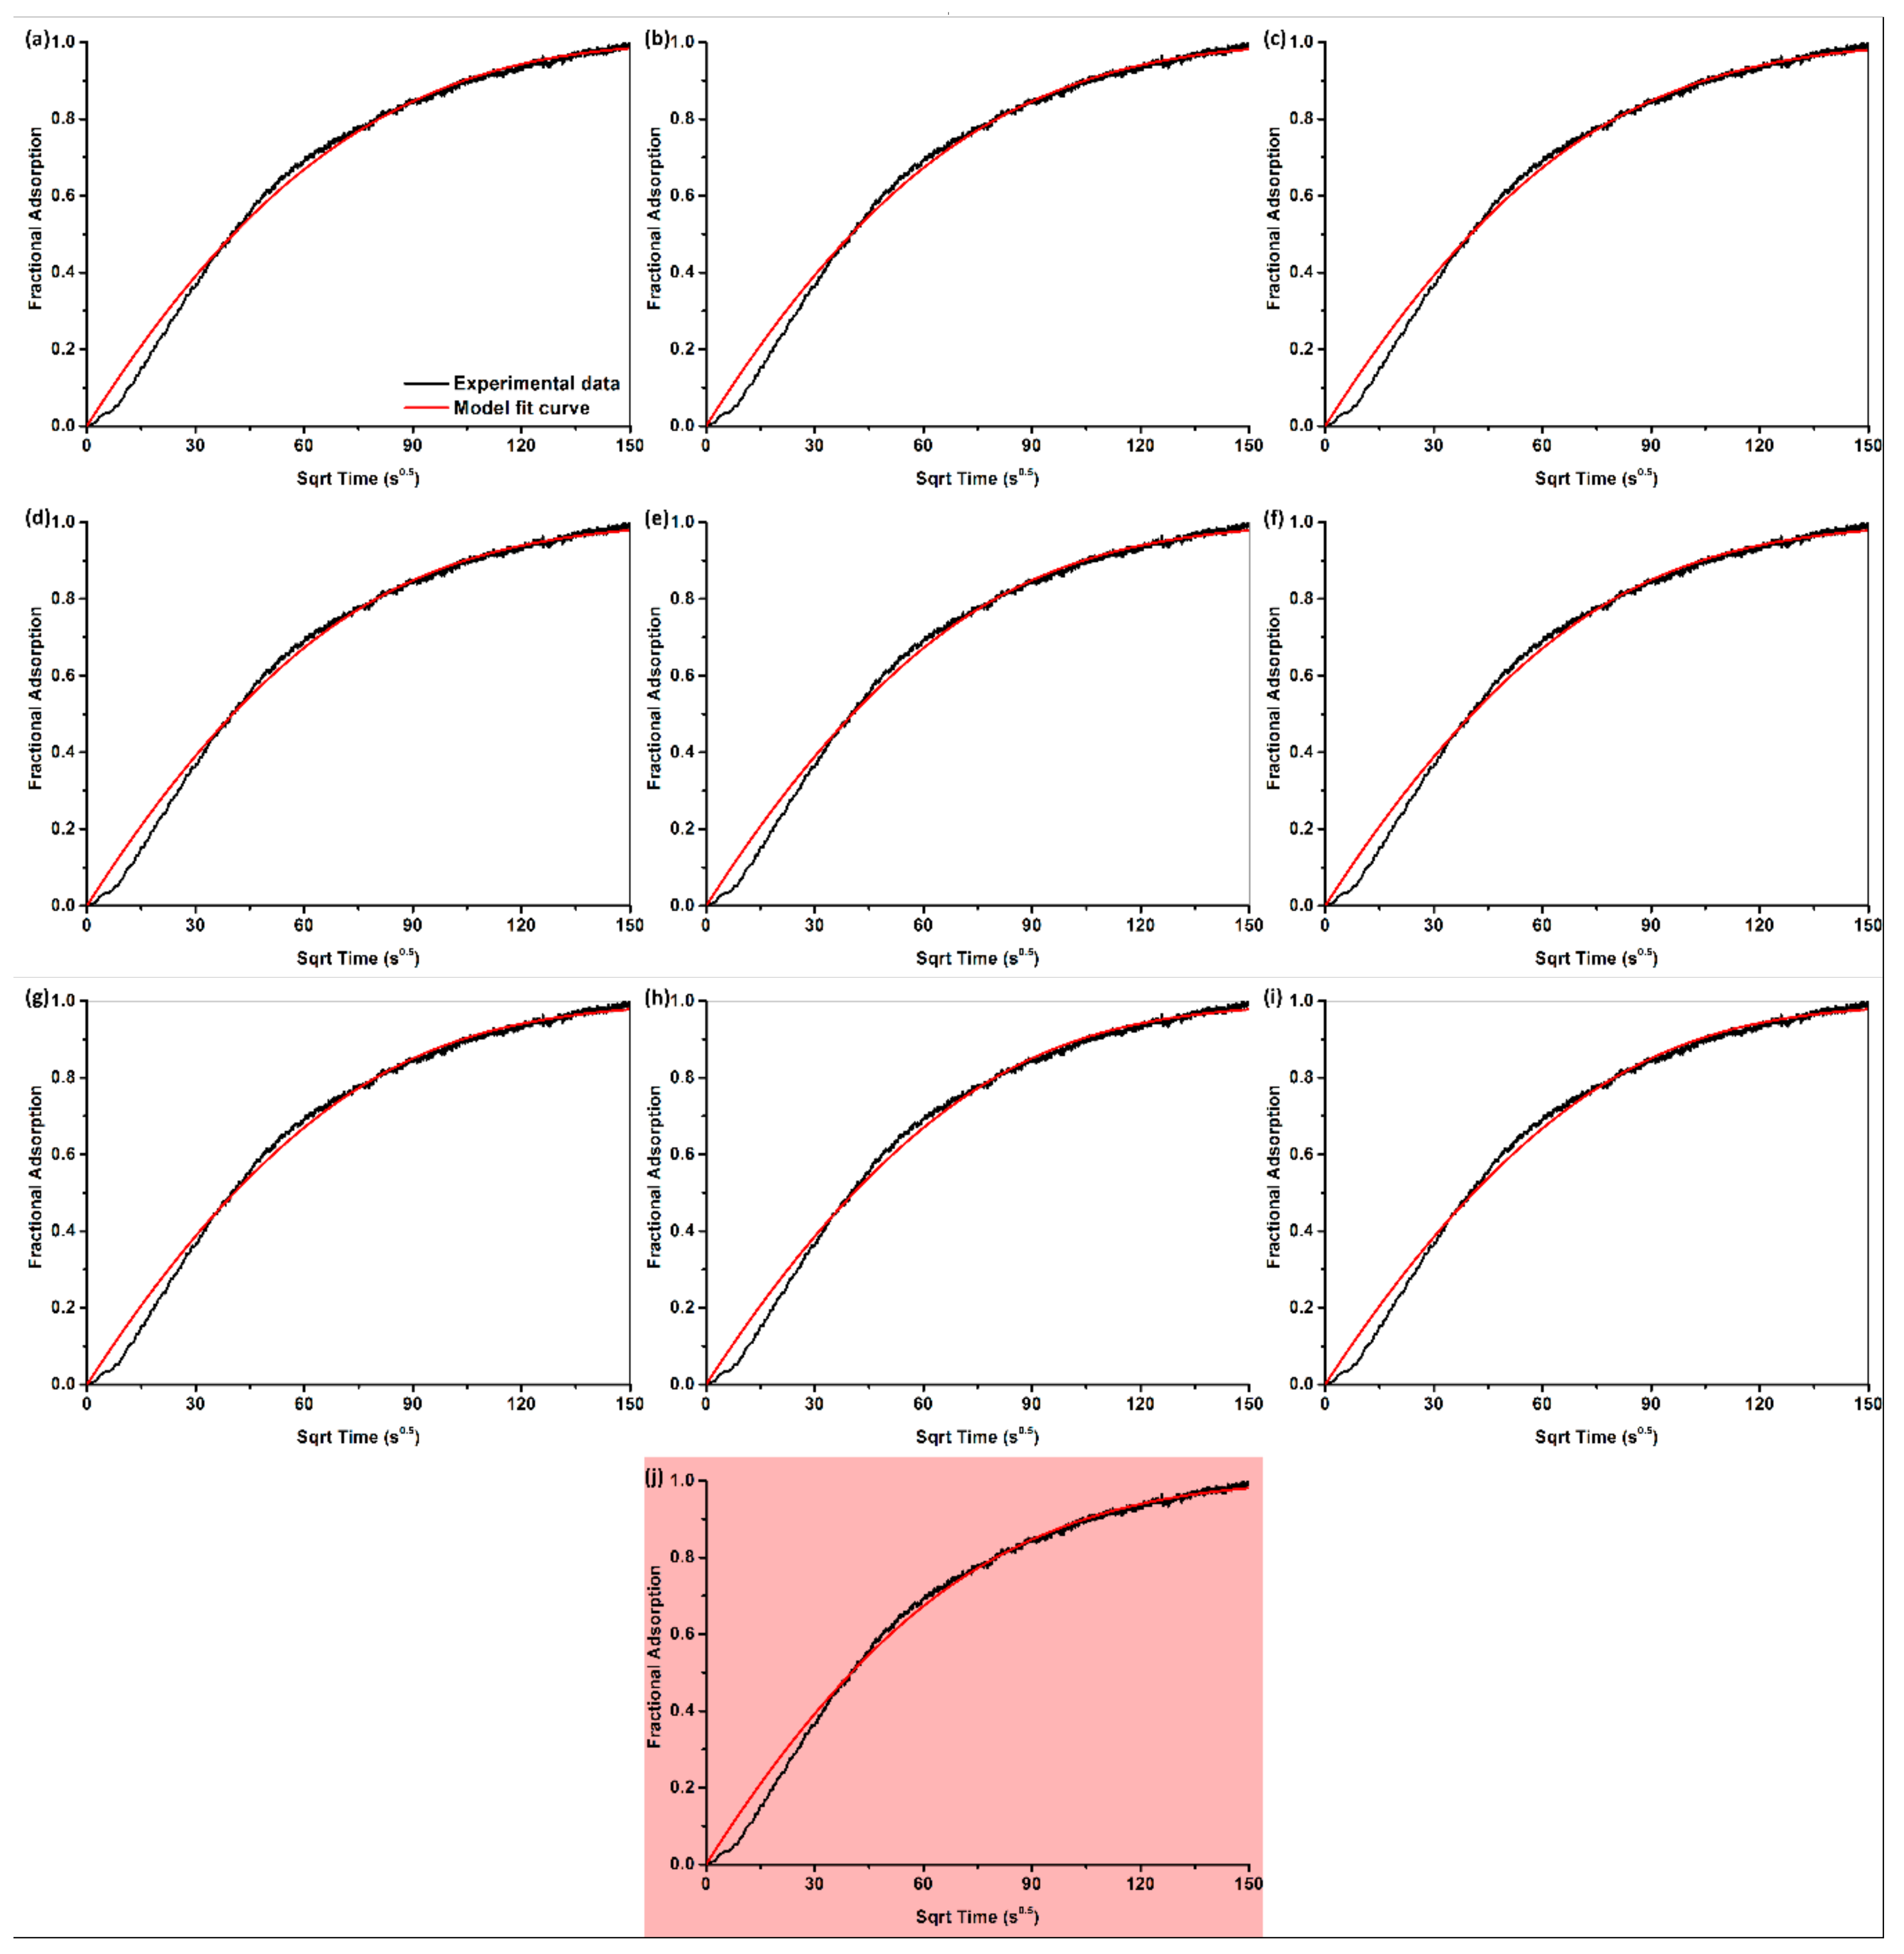
4.2. Modeling Results

Table 4 lists the optimal fit parameters of the UP model and the TFP models. Note that an optimal fit is defined as the fit obtains a R 2 value higher than all the other fits. All TFP models agreed better with the measured fractional adsorption curves than the UP model did. Similar results have also been reported in literature that the TFP models normally had better performance in curve fitting than the UP model did [13,14].
Table 4 shows that the correlation between diffusivity/rate parameter and gas pressure is model-dependent. The UP-diffusivity and the RB-diffusivity with the assumption of 0 < α < 10−3 decreases with increasing gas pressure. The DE-fast rate parameter and the RB-macropore diffusivity with the assumption of 0 < α < 1.0 are also negatively proportional to gas pressure. However, the RB-micropore diffusivity with the assumption of 0 < α < 1.0, the FDR-diffusivity and relaxation rate, and the DE-slow rate parameter show non-monotonic dependence on gas pressure.
When fitting the TFP models to the measured fractional adsorption curves, several non-optimal fits produced highly similar coefficients of determination but evidently different diffusivities/rate parameters compared with the corresponding optimal fit. In this paper, the non-optimal fit that meets the following inequality is defined as quasi-optimal fit:
R 2 q u a R 2 o p t 0.99
where the subscripts ‘opt’ and ‘qua’ represent the optimal fit and quasi-optimal fit, respectively.
Table 5, Table 6, Table 7 and Table 8 list the quasi-optimal fit parameters of the RB model with the assumption of 0 < α < 10−3, the RB model with the assumption of 0 < α < 1.0, the FDR model, and the DE model, respectively. The RB model with the assumption of 0 < α < 10−3 had only one quasi-optimal fit at 0.81 MPa while the other three models had multiple quasi-optimal fits at each equilibrium pressure.
Figure 3 compares the optimal and quasi-optimal fit curves of the RB model with the assumption of 0 < α < 1.0 at 0.81 MPa. Visual inspection cannot discern the difference between the optimal and quasi-optimal fit curves. Similar results can be observed from the regular residual curves. The optimal and quasi-optimal fits have nearly overlapped regular residuals, as shown in Figure 4. Although the quasi-optimal fit curves were highly close to each other, their diffusivities were quite diverse, as shown in Table 6, Table 7 and Table 8. For example, when fitting the RB model with the assumption of 0 < α < 1.0 to the measured fractional adsorption curve at 0.81 MPa, the macropore diffusivity decreased from 6.53 × 10⁻⁵ s−1 to 2.02 × 10⁻⁵ s−1 when θa increased from 0.10 to 0.90.

5. Discussion

5.1. Phenomenological Over-Parameterization of the TFP Models

When fitting the TFP models to the measured fractional adsorption curves, multiple fits had highly similar fit curves. This indicates the TFP models may be over-parameterized when three fitting parameters are used. When reducing the three fitting parameters to one or two parameters, the over-parameterization may be eliminated. Since the TFP models are mathematically sound, the over-parameterization observed in Section 4.2 may be a phenomenological issue rather than a mathematical one. Therefore, this issue is defined as phenomenological over-parameterization in this paper.
Phenomenological over-parameterization makes optimal fit non-unique and all quasi-optimal fits are potentially optimal. As shown in Figure 2, the measured fractional adsorption curves are not smooth but are fluctuant with respect to time due to temperature fluctuation, pressure transducer error, or other system errors. Therefore, both optimal and quasi-optimal fit curves deviated slightly from the measured curves. Although the optimal fit curves agreed slightly better with the measured fractional adsorption curves than the quasi-optimal fit curves did, this slightly better agreement may be offset by the system errors within the measured curves. Therefore, both optimal and quasi-optimal fits are potentially optimal.
Phenomenological over-parameterization makes the regressed diffusivity/rate parameter fluctuate within an upper bound and a lower bound. In order to evaluate this fluctuation, a fluctuation ratio is introduced, as expressed in the following equation:
F R = D u p p e r D l o w e r
where D u p p e r is the upper bound of the regressed diffusivity/rate parameter for a measured fractional adsorption curve, and D l o w e r denotes the lower bound.
When F R is equal to unity, phenomenological over-parameterization is absent and the optimal diffusivity/rate parameter is a unique value. When F R is greater than unity, phenomenological over-parameterization is evident and the optimal diffusivity/rate parameter fluctuates within a value range rather than being a unique value. As F R increases, phenomenological over-parameterization becomes more significant.
Table 9 lists the F R values of the TFP models. Although the RB model with the assumption of 0 < α < 10−3 have only one quasi-optimal fit when fitting to the measured fractional adsorption curve at 0.81 MPa, the fluctuation ratios are quite high. This high fluctuation ratio indicates that the quasi-optimal fit at 0.81 MPa is anomalous and can be omitted artificially. However, the fluctuation ratios of the other three TFP models are moderate and all lower than 10. The quasi-optimal fits of these models cannot be omitted artificially. Generally, the RB model with the assumption of 0 < α < 1.0 and FDR model produced greater fluctuation ratios than the DE model did. The RB model with the assumption of 0 < α < 1.0 produced higher fluctuation ratios than the RB model with the assumption of 0 < α < 10−3 when fitting to the fractional adsorption curves at 0.35 MPa and 0.64 MPa. Therefore, expanding the upper bound of α in curve fitting makes the RB model phenomenologically over-parameterized.
When plotting the diffusivity/rate parameter of both optimal and quasi-optimal fits with respect to equilibrium pressure, multiple correlations between diffusivity/rate parameter and gas pressure can be obtained. Taking the RB-diffusivity with the assumption of 0 < α < 1.0 for example, as shown in Figure 5, the black solid line indicates a monotonically negative gas pressure dependence, the red solid line indicates a monotonically positive gas pressure dependence, and the green solid line indicates a non-monotonic gas pressure dependence. Since both optimal and quasi-optimal fits are potentially optimal, the multiple correlations are potentially reasonable. This makes the modeling results difficult to interpret in physics.
Due to phenomenological over-parameterization, the RB model with the assumption of 0 < α < 1.0 can predict non-monotonic gas pressure dependence of diffusivity. The literature have also reported non-monotonic dependences of the RB-diffusivity with the assumption of 0 < α < 1.0 on gas pressure and other influencing factors. Both Pan et al. [22] and Zheng et al. [23] reported a non-monotonic gas pressure dependence. Guo et al. [24] observed a non-monotonic particle size dependence. Both Pan et al. [22] and Wang et al. [13] reported a non-monotonic moisture dependence. These non-monotonic dependences are normally uninterpretable in physics. On the other hand, correct usage of the RB model with the assumption of 0 < α < 10−3 predicted a negative gas pressure dependence of diffusivity in this paper. This dependence can be interpretable and is normally attributed to coal swelling and decreasing molecular diffusion rate with increasing gas pressure [30]. Therefore, the anomalously non-monotonic dependences discussed above may be due to the misuse of the RB model out of its boundary condition by expanding the upper bound of α to unity.
Although correct usage of the RB model can predict interpretable gas pressure dependence of diffusivity, an anomaly also exists within the modeling results. As shown in Table 4, the RB model predicted anomalously high macropore adsorption fractions, which were close to unity (θa < 0.95). This indicates that most CH4 adsorption occurred in macropores for the samples used in this study. However, low-temperature nitrogen adsorption experiments showed that the samples used for CH4 adsorption were dominant in pores lower than 10 nm (Figure 6). No visible macropores were found in these samples. The literature have observed that gas adsorption mainly occurs in micropores rather than in macropores. Radliński et al. [33] scattered CO2 adsorption in coal with small angle X-ray and the results show that smaller pores are filled prior to larger pores. Therefore, micropore adsorption should be dominant and high macropore adsorption fractions are anomalous.

5.2. Implications for Future Work

Since the UP model normally deviated evidently from experimental fractional adsorption curves, the TFP models were introduced to substitute the UP model. However, although the TFP models have better performance in curve fitting than the UP model does, their modeling results seem to have little physical meanings, as discussed in Section 4.1. The excellent curve fitting performance of the TFP models is seemingly due to the usage of three fitting parameters. John von Neumann once said that “With four parameters I can fit an elephant, and with five I can make him wiggle his trunk.” Therefore, three fitting parameters may be excessive and unnecessary. The correct usage of the TFP models may be reduced the three fitting parameters to one or two parameters.
Clarkson and Bustin [14] developed a numerical bidisperse diffusion model that has only two fitting parameters: macropore diffusivity and micropore diffusivity. Clarkson and Bustin [14] reported that their numerical bidisperse diffusion model also has excellent performance in curve fitting and the results can be physically interpretable. Cui et al. [30] used this model and predicted interpretable results as well. Therefore, the numerical bidisperse diffusion model developed by Clarkson and Bustin [14] may be a good alternative of the TFP models in future studies.

6. Conclusions

This paper measured three fractional adsorption curves at various equilibrium pressures by using the manometric method. The measured fractional adsorption curves were modeled with the TFP models. The modeling results were compared and discussed to obtain insights into the TFP models. Based on this study, the following major conclusions are made:
(1)
The measured adsorption rate was negatively proportional to gas pressure. This correlation can be attributed to coal swelling and decreasing molecular diffusion rate with increasing gas pressure.
(2)
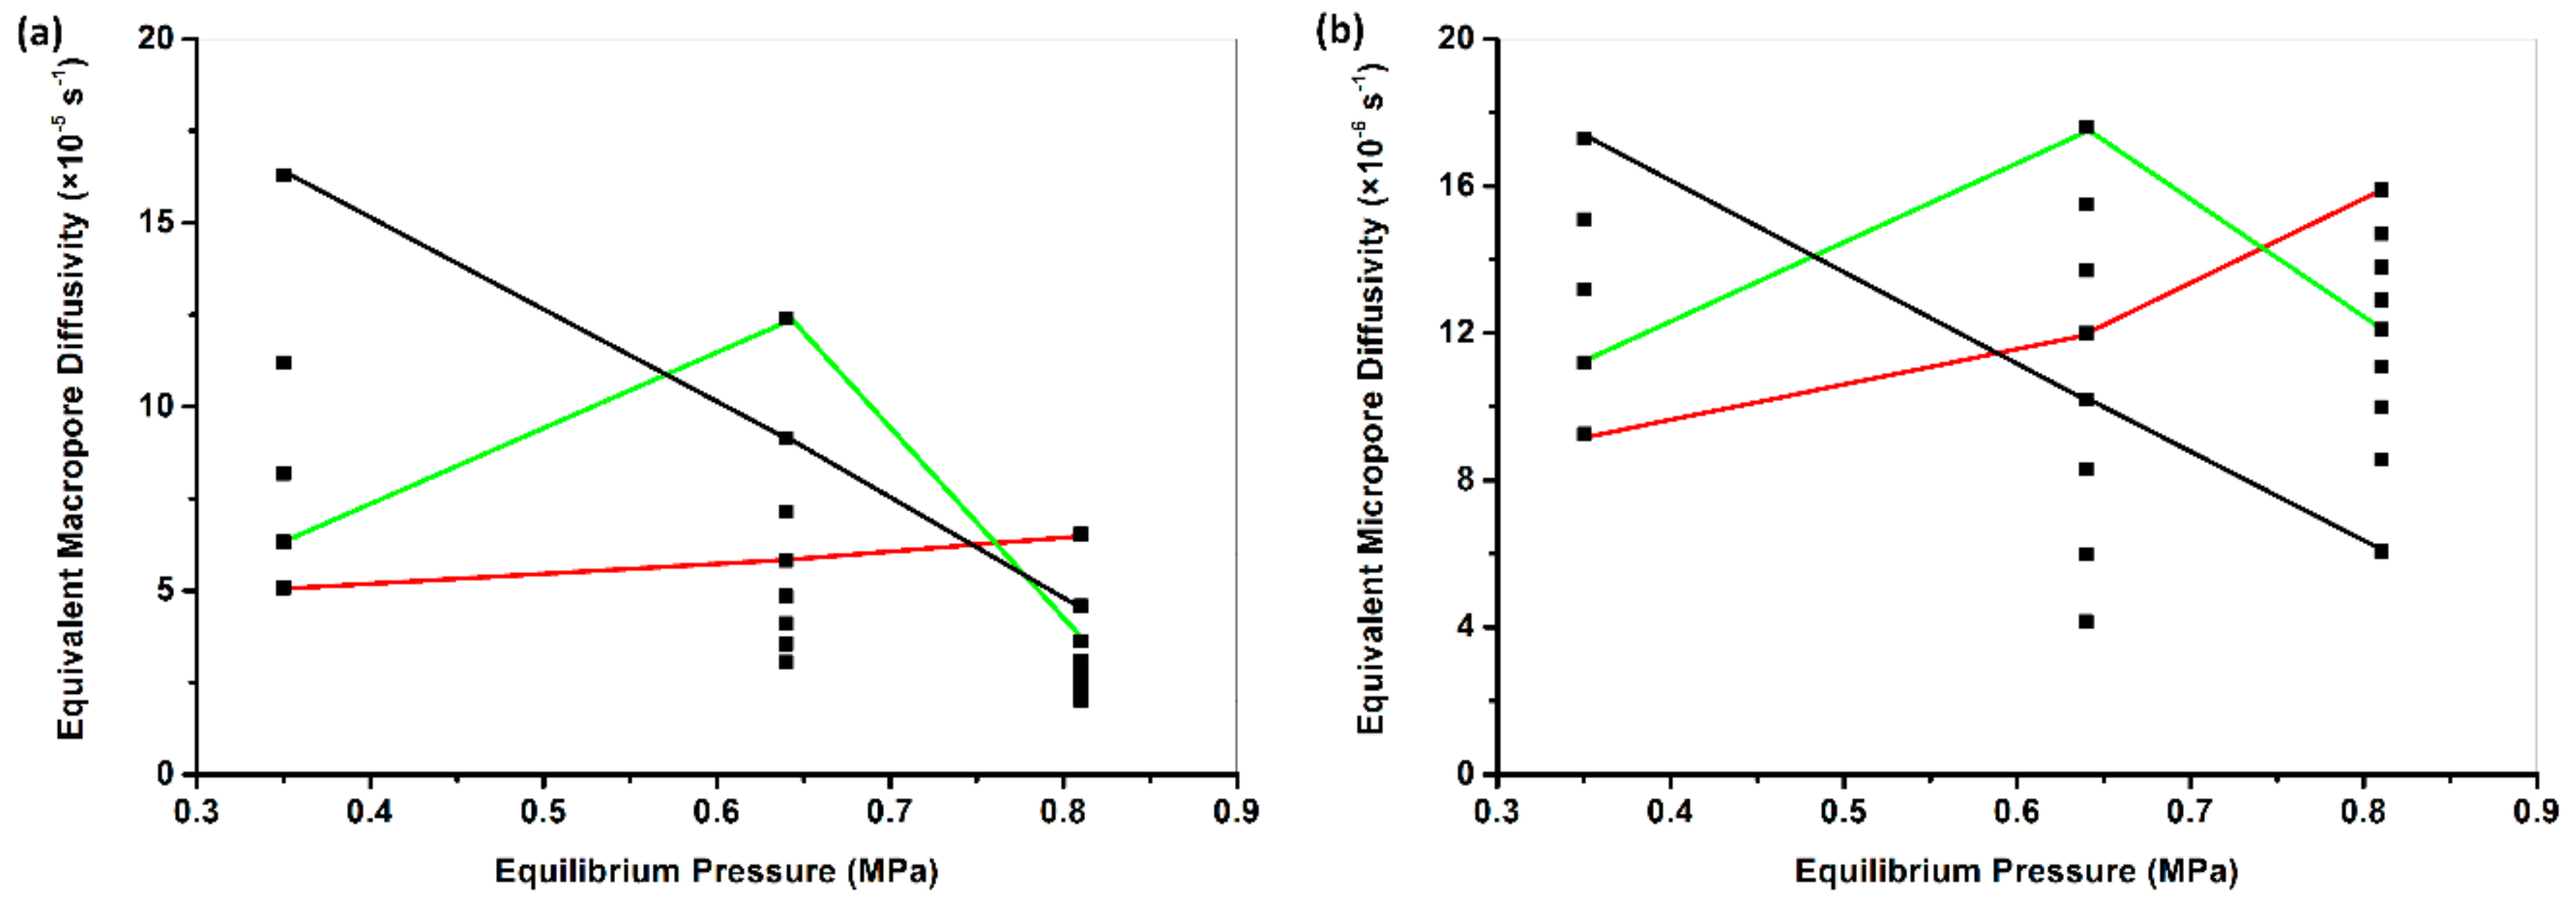
The TFP models had better performance in curve fitting than the UP model did. The gas pressure dependence of diffusivity/rate parameter was dependent on the chosen model. The UP-diffusivity and the RB-diffusivity with the assumption of 0 < α < 10−3 decreased with increasing gas pressure. The RB-macropore diffusivity with the assumption of 0 < α < 1.0 and the DE-fast rate parameter were also negatively proportional to gas pressure. However, the RB-micropore diffusivity with the assumption of 0 < α < 1.0, the FDR-diffusivity and relaxation rate, and the DE-slow rate parameter showed non-monotonic dependence on gas pressure.
(3)
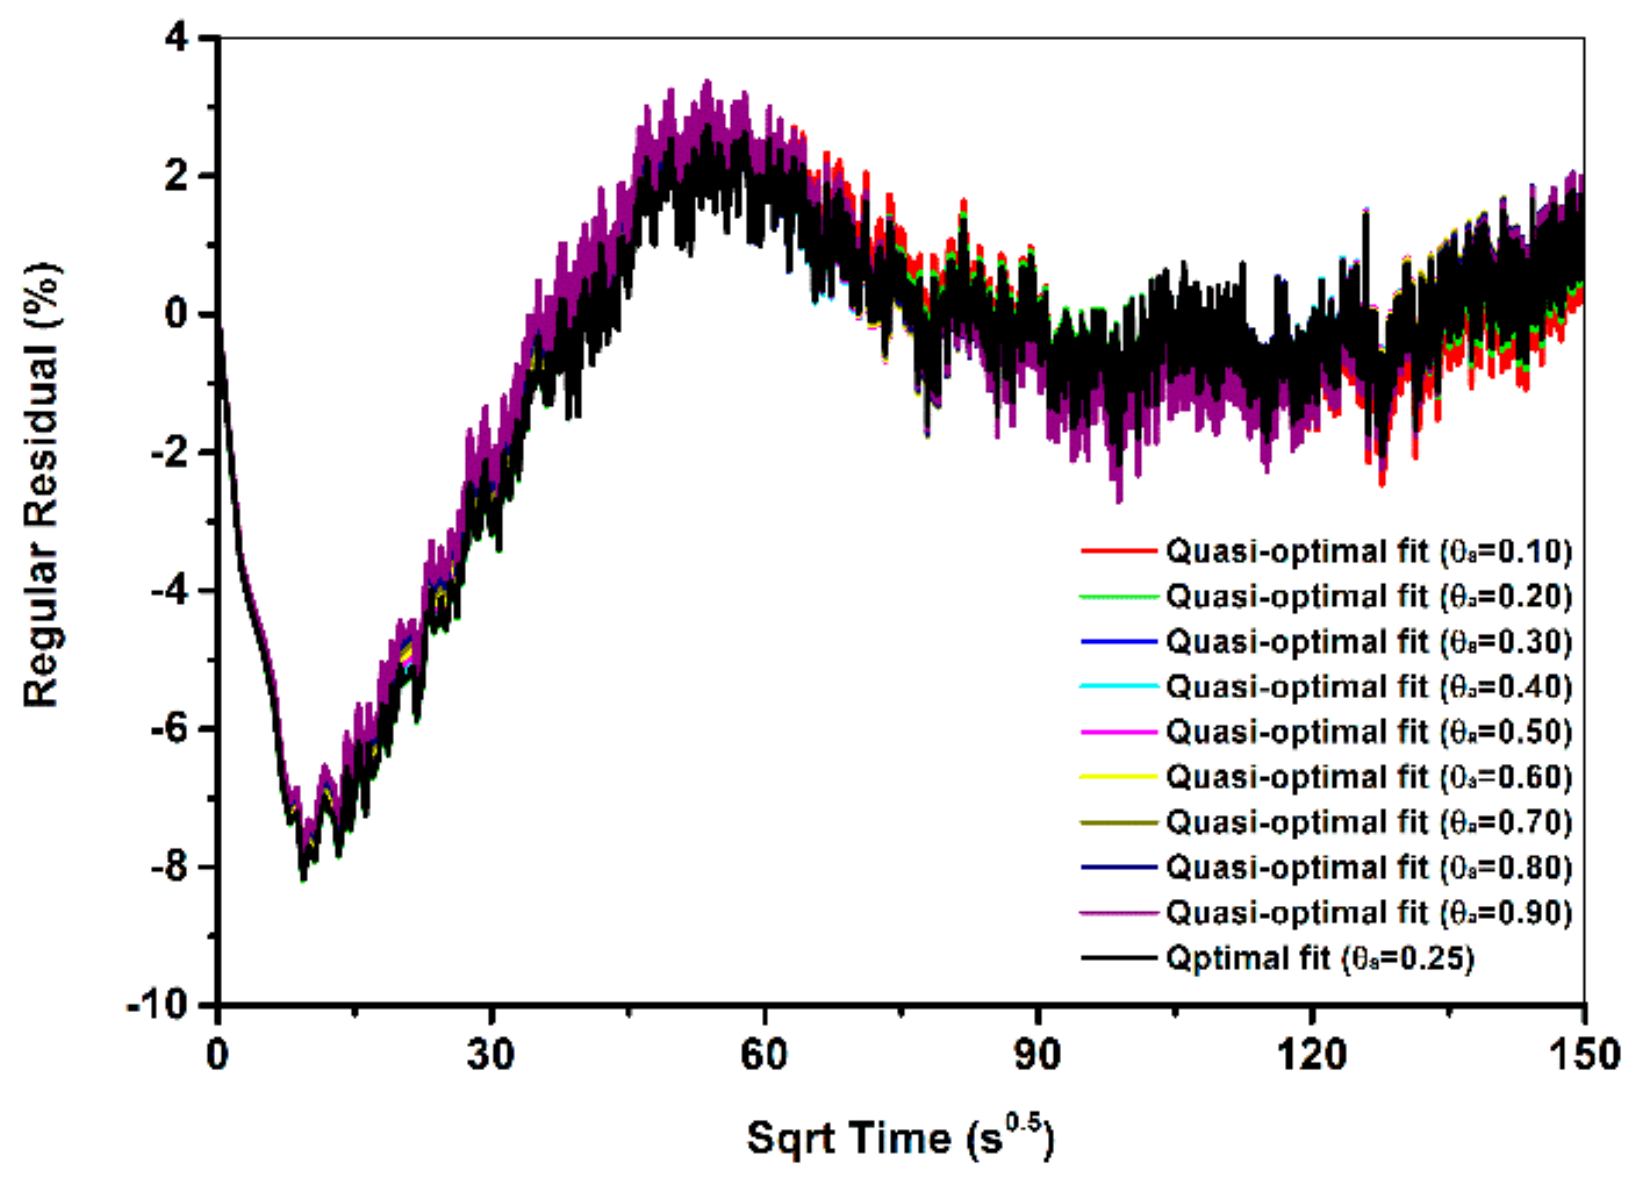
In addition to optimal fits, the TFP model produced multiple quasi-optimal fits that were highly close to the corresponding optimal fit in fit curves. This issue was defined as phenomenological over-parameterization in this paper. Phenomenological over-parameterization makes optimal fit non-unique and all optimal and quasi-optimal fits re potentially optimal. Phenomenological over-parameterization also makes the modeling results of the TFP models uninterpretable in physics.
(4)
Expanding the upper bound of α made the RB model phenomenologically over-parameterized in curve fitting. This misusage induced the literature-reported anomalous non-monotonic dependence of diffusivity on gas and coal properties such as gas pressure, moisture content, and particle size. Although the correct usage of RB model with the assumption of 0 < α < 10−3 is absent of phenomenological over-parameterization, anomalously high macropore adsorption fraction was regressed when fitting to the fractional adsorption curves measured in this study.
(5)
Although the TFP models have better performance in curve fitting than the UP model does, their modeling results are seemingly uninterpretable in physics. Their excellent curve fitting performance may be due to the usage of three fitting parameters. Clarkson and Bustin [14] developed a numerical bidisperse diffusion model that has only two fitting parameters. This also has excellent performance in curve fitting and the results can be physically interpretable. Therefore, this numerical bidisperse diffusion model may be a good alternative to the TFP models in future studies.

Author Contributions

Conceptualization, J.Z.; Methodology, J.Z.; Validation, A.L.; Visualization, K.W.; Writing—original draft, J.Z.

Funding

This research was funded by the National Natural Science Foundation of China (51804312).

Acknowledgement

The authors gratefully acknowledge Chuan Wang for his assistance on pore structure evaluation.

Conflicts of Interest

The authors declare no conflict of interest.

Nomenclature

C a Sorbate concentration in macropores mol·m−3
C i Sorbate concentration in micropores, mol·m−3
C s a Sorbate concentration on macropore surfaces, mol·m−2
C s i Sorbate concentration on micropore surfaces, mol·m−2
D a Macropore diffusion coefficient, m2·s−1
D a Equivalent macropore diffusivity, s−1
D F Equivalent Fickian diffusivity in the FDR model, s−1
D i Micropore diffusion coefficient, m2·s−1
D i Equivalent micropore diffusivity, s−1
D u Equivalent unipore diffusivity, s−1
H a Henry constant, m3·m−2
k f Fast sorption rate parameter in the DE model, s−1
k R Relaxation rate parameter in the FDR model, s−1
k s Slow sorption rate parameter in the DE model, s−1
M 0 Initial sorption amount, mol
M t Sorption amount at time t, mol
M Sorption amount at infinite time, mol
P 0 Initial gas pressure, MPa
P t Gas pressure at time t , MPa
P Final gas pressure, MPa
Q r e s Residual (unoccupied) sorption capacity in the DE model, mol
R Universal gas constant, J·mol−1·K−1
R a Macropore radius, m
R i Microsphere radius, m
S a Macropore surface area, m2
T Temperature, K
V Void volume of the experimental system, m3
z 0 Compressibility factors at P 0 , dimensionless
z t Compressibility factors at P t , dimensionless
z Compressibility factors at P , dimensionless
α Ratio of equivalent micropore diffusivity to equivalent macropore diffusivity, fraction
θ a Macropore sorption fraction in the RB model, fraction
θ f Sorption fraction of the fast sorption stage in the DE model, fraction
θ F Sorption fraction due to Fickian diffusion in the FDR model, fraction
ϕ a Macroporosity, fraction
ϕ i Microporosity, fraction

References

  1. Moore, T. Coalbed methane: A review. Int. J. Coal Geol. 2012, 101, 36–81. [Google Scholar] [CrossRef]
  2. Busch, A.; Gensterblum, Y. CBM and CO2-ECBM related sorption processes in coal: A review. Int. J. Coal Geol. 2011, 87, 49–71. [Google Scholar] [CrossRef]
  3. Bustin, R.; Clarkson, C. Geological controls on coalbed methane reservoir capacity and gas content. Int. J. Coal Geol. 1998, 38, 3–26. [Google Scholar] [CrossRef]
  4. Bodden, W.R.; Ehrlich, R. Permeability of coals and characteristics of desorption tests: Implications for coalbed methane production. Int. J. Coal Geol. 1998, 35, 333–347. [Google Scholar] [CrossRef]
  5. Li, D.Y.; Liu, Q.F.; Weniger, P.; Gensterblum, Y.; Busch, A.; Krooss, B. High-pressure sorption isotherms and sorption kinetics of CH4 and CO2 on coals. Fuel 2010, 89, 569–580. [Google Scholar] [CrossRef]
  6. Crosdale, P.; Beamish, B.; Valix, M. Coalbed methane sorption related to coal composition. Int. J. Coal Geol. 1998, 35, 147–158. [Google Scholar] [CrossRef]
  7. Smith, D.M.; Williams, F.L. Diffusion models for gas production from coal: Determination of diffusion parameters. Fuel 1984, 63, 256–261. [Google Scholar] [CrossRef]
  8. Bhowmik, S.; Dutta, P. Adsorption rate characteristics of methane and CO2 in coal samples from Raniganj and Jharia coalfields of India. Int. J. Coal Geol. 2013, 113, 50–59. [Google Scholar] [CrossRef]
  9. Pan, Z.J.; Connell, L. Modelling permeability for coal reservoirs: A review of analytical models and testing data. Int. J. Coal Geol. 2012, 92, 1–44. [Google Scholar] [CrossRef]
  10. Wang, K.; Zang, J.; Wang, G.D.; Zhou, A.T. Anisotropic permeability evolution of coal with effective stress variation and gas sorption: Model development and analysis. Int. J. Coal Geol. 2014, 130, 53–65. [Google Scholar] [CrossRef]
  11. Zang, J.; Wang, K. A numerical model for simulating single-phase gas flow in anisotropic coal. J. Nat. Gas Sci. Eng. 2016, 28, 153–172. [Google Scholar] [CrossRef]
  12. Zang, J.; Wang, K. Gas sorption-induced coal swelling kinetics and its effects on coal permeability evolution: Model development and analysis. Fuel 2017, 189, 164–177. [Google Scholar] [CrossRef]
  13. Wang, K.; Zang, J.; Feng, Y.; Wu, Y. Effects of moisture on diffusion kinetics in Chinese coals during methane desorption. J. Nat. Gas Sci. Eng. 2014, 21, 1005–1014. [Google Scholar] [CrossRef]
  14. Clarkson, C.; Bustin, R. The effect of pore structure and gas pressure upon the transport properties of coal: A laboratory and modeling study. 2. Adsorption rate modeling. Fuel 1999, 78, 1345–1362. [Google Scholar] [CrossRef]
  15. Nandi, S.P.; Walker, J.; Philip, L. Activated diffusion of methane from coals at elevated pressures. Fuel 1975, 54, 81–86. [Google Scholar] [CrossRef]
  16. Pillalamarry, M.; Harpalani, S.; Liu, S. Gas diffusion behavior of coal and its impact on production from coalbed methane reservoirs. Int. J. Coal Geol. 2011, 86, 342–348. [Google Scholar] [CrossRef]
  17. Staib, G.; Sakurovs, R.; Gray, E. Dispersive diffusion of gases in coals. Part II: An assessment of previously proposed physical mechanisms of diffusion in coal. Fuel 2015, 143, 620–629. [Google Scholar] [CrossRef]
  18. Staib, G.; Sakurovs, R.; Gray, E. Dispersive diffusion of gases in coals. Part I: Model development. Fuel 2015, 143, 612–619. [Google Scholar] [CrossRef]
  19. Charrière, D.; Pokryszka, Z.; Behra, P. Effect of pressure and temperature on diffusion of CO2 and CH4 into coal from the Lorraine basin (France). Int. J. Coal Geol. 2010, 81, 373–380. [Google Scholar] [CrossRef]
  20. Švábová, M.; Weishauptová, Z.; Přibyl, O. The effect of moisture on the sorption process of CO2 on coal. Fuel 2012, 92, 187–196. [Google Scholar] [CrossRef]
  21. Zhang, J. Experimental Study and Modeling for CO2 Diffusion in Coals with Different Particle Sizes: Based on Gas Absorption (Imbibition) and Pore Structure. Energy Fuels 2016, 30, 531–543. [Google Scholar] [CrossRef]
  22. Pan, Z.J.; Connell, L.; Camilleri, M.; Connelly, L. Effects of matrix moisture on gas diffusion and flow in coal. Fuel 2010, 89, 3207–3217. [Google Scholar] [CrossRef]
  23. Zheng, G.Q.; Pan, Z.J.; Tang, S.H.; Ling, B.C.; Lv, D.W.; Connell, L. Laboratory and modeling study on gas diffusion with pore structures in different-rank Chinese coals. Energy Explor. Exploit. 2013, 31, 859–877. [Google Scholar] [CrossRef]
  24. Guo, J.; Kang, T.; Kang, J.; Zhao, G.; Huang, Z. Effect of the lump size on methane desorption from anthracite. J. Nat. Gas Sci. Eng. 2014, 20, 337–346. [Google Scholar] [CrossRef]
  25. Crank, J. The Mathematics of Diffusion; Clarendon Press: Gloucestershire, UK, 1975. [Google Scholar]
  26. Ruckenstein, E.; Vaidyanathan, A.; Youngquist, G. Sorption by solids with bidisperse pore structures. Chem. Eng. Sci. 1971, 26, 1305–1318. [Google Scholar] [CrossRef]
  27. Berens, A.; Hopfenberg, H. Diffusion and relaxation in glassy polymer powders: 2. Separation of diffusion and relaxation parameters. Polymer 1978, 19, 489–496. [Google Scholar] [CrossRef]
  28. Busch, A.; Gensterblum, Y.; Krooss, B.; Littke, R. Methane and carbon dioxide adsorption–diffusion experiments on coal: Upscaling and modeling. Int. J. Coal Geol. 2004, 60, 151–168. [Google Scholar] [CrossRef]
  29. Karacan, C.O. An effective method for resolving spatial distribution of adsorption kinetics in heterogeneous porous media: Application for carbon dioxide sequestration in coal. Chem. Eng. Sci. 2003, 58, 4681–4693. [Google Scholar] [CrossRef]
  30. Cui, X.J.; Bustin, R.; Dipple, G. Selective transport of CO2, CH4, and N2 in coals: Insights from modeling of experimental gas adsorption data. Fuel 2004, 83, 293–303. [Google Scholar] [CrossRef]
  31. Staib, G.; Sakurovs, R.; Gray, E. A pressure and concentration dependence of CO2 diffusion in two Australian bituminous coals. Int. J. Coal Geol. 2013, 116–117, 106–116. [Google Scholar] [CrossRef]
  32. OriginLab Corp. OriginPro 9.0 User Guide. 2015. Available online: http://www.originlab.com/doc/User-Guide (accessed on 20 March 2019).
  33. Radliński, A.P.; Busbridge, T.L.; Gray, E.M.A.; Blach, T.P.; Cookson, D.J. Small angle X-ray scattering mapping and kinetics study of sub-critical CO2 sorption by two Australian coals. Int. J. Coal Geol. 2009, 77, 80–89. [Google Scholar]
Figure 1. Schematic of the manometric sorption system.
Processes 07 00241 g001
Figure 2. Measured fractional sorption curves of the three injection runs.
Processes 07 00241 g002
Figure 3. Optimal and quasi-optimal fit curves when fitting the RB model with the assumption of 0 < α <1.0 to the measured fractional adsorption data at 0.81 MPa: (a) θa = 0.10; (b) θa = 0.20; (c) θa = 0.30; (d) θa = 0.40; (e) θa = 0.50; (f) θa = 0.60; (g) θa = 0.70; (h) θa = 0.80; (i) θa = 0.90; and (j) θa = 0.25 (optimal fit). Note that the red background color highlights the optimal fit.
Processes 07 00241 g003
Figure 4. Regular residual curves of the optimal and quasi-optimal fits when fitting the RB model 0 < α < 1.0 to the measured fractional adsorption data at 0.81 MPa.
Processes 07 00241 g004
Figure 5. Gas pressure dependence of the diffusivity regressed by the ERB model: (a) macropore diffusivity; (b) micropore diffusivity. Note that the black solid line indicates a monotonically negative gas pressure dependence, the red solid line indicates a monotonically positive gas pressure dependence, and the green solid line indicates a non-monotonic gas pressure dependence.
Processes 07 00241 g005
Figure 6. Experimental results of low-temperature nitrogen adsorption in the coal samples used for fractional adsorption measurements: (a) adsorption-desorption curves; (b) pore size distribution. The low-temperature nitrogen adsorption data were measured by using a JW-BK112 pore analyzer (Beijing JWGB SCI & Tech Co., Ltd., China, 2016). The used samples were 0.18–0.25 mm. The pore size distribution data were computed with the BJH theory.
Processes 07 00241 g006
Table 1. Representative mathematical diffusion models.
Model ClassificationModel NameAuthors
Single-fitting-parameter modelUnipore modelCrank [25]
Numerical unipore modelClarkson and Bustin [14]
Linear driving force modelCharrière et al. [19]
Double-fitting-parameter modelStretched exponential modelStaib et al. [17], Staib et al. [18]
Numerical bidisperse modelClarkson and Bustin [14]
Triple-fitting-parameter modelRuckenstein bidisperse modelRuckenstein et al. [26]
Fickian diffusion-relaxation modelBerens and Hopfenberg [27]
Double exponential modelBusch et al. [28]
Table 2. Coal sample properties.
True Density (g/cm3, Dry)Apparent Density (g/cm3, Dry)Proximate Analysis
Mad (%)Ad (%)Vdaf (%)Fixed Carbon (%)
1.491.400.6111.027.5080.87
Table 3. Maximum and equilibrium gas pressures in the sample cell for the three gas injection runs.
First InjectionSecond InjectionThird Injection
Maximum gas pressure (MPa)Equilibrium gas pressure (MPa)Maximum gas pressure (MPa)Equilibrium gas pressure (MPa)Maximum gas pressure (MPa)Equilibrium gas pressure (MPa)
0.600.350.800.640.890.81
Table 4. Optimal fit parameters of the UP model and the TFP models.
ModelFit ParametersEquilibrium Pressure (MPa)
0.350.640.81
UP model D u (s−1)2.59 × 10−52.24 × 10−51.75 × 10⁻⁵
R 2 (%)94.8196.0199.15
RB model
(0 < α < 10−3)
θa0.9620.9560.986
D a (s−1)3.18 × 10−52.82 × 10−51.86 × 10⁻⁵
D i (s−1)3.18 × 10−82.82 × 10−81.86 × 10⁻⁸
R 2 (%)97.0298.1299.27
RB model
(0 < α < 1.0)
θa0.4160.5270.250
D a (s−1)1.06 × 10−45.52 × 10−54.03 × 10⁻⁵
D i (s−1)1.48 × 10−51.15 × 10−51.42 × 10⁻⁵
R 2 (%)99.7199.2199.42
FDR modelθF0.630.690.52
D F (s−1)6.45 × 10−43.74 × 10−43.75 × 10⁻⁴
k R (s−1)9.36 × 10−47.35 × 10−48.99 × 10⁻⁴
R 2 (%)99.7599.2899.56
DE modelθf0.580.620.48
k f (s−1)1.28 × 10−27.58 × 10−36.87 × 10⁻³
k s (s−1)1.03 × 10−38.43 × 10−49.25 × 10⁻⁴
R 2 (%)99.5399.4699.84
Table 5. Quasi-optimal fit parameters of the RB model with the assumption of 0 < α < 10−3.
Equilibrium Pressure (MPa)θa D a   ( s 1 ) D i   ( s 1 ) R 2   ( % )
0.011.08 × 10−11.08 × 10−499.15
Table 6. Quasi-optimal fit parameters of the RB model with the assumption of 0 < α < 1.0.
Equilibrium Pressure (MPa)θa D a   ( s 1 ) D i   ( s 1 ) R 2   ( % )
0.350.301.63 × 10−41.73 × 10−599.45
0.401.12 × 10−41.51 × 10−599.71
0.508.18 × 10−51.32 × 10−599.61
0.606.32 × 10−51.12 × 10−599.29
0.705.07 × 10−59.26 × 10−698.84
0.640.201.24 × 10−41.76 × 10−598.25
0.309.14 × 10−51.55 × 10−598.80
0.407.14 × 10−51.37 × 10−599.10
0.505.81 × 10−51.20 × 10−599.21
0.604.85 × 10−51.02×10−599.18
0.704.11 × 10−58.30 × 10−699.04
0.803.55 × 10−55.98 × 10−698.80
0.903.06 × 10−54.18 × 10−698.44
0.810.106.53 × 10−51.59 × 10−599.37
0.204.58 × 10−51.47 × 10−599.41
0.303.63 × 10−51.38 × 10−599.42
0.403.09 × 10−51.29 × 10−599.40
0.502.75 × 10−51.21 × 10−599.39
0.602.51 × 10−51.11 × 10−599.38
0.702.32 × 10−51.00 × 10−599.36
0.802.16 × 10−58.56 × 10−699.34
0.902.02 × 10−56.06 × 10−699.32
Table 7. Quasi-optimal fit parameters of the FDR model.
Equilibrium Pressure (MPa)θF D F   ( s 1 ) k R   ( s 1 ) R 2   ( % )
0.350.501.14 × 10−31.21 × 10−398.96
0.607.26 × 10−49.93 × 10−499.71
0.704.84 × 10−47.98 × 10−499.57
0.803.36 × 10−46.05 × 10−498.90
0.640.507.28 × 10−41.09 × 10−398.34
0.605.08 × 10−49.02 × 10−499.08
0.703.68 × 10−47.26 × 10−499.28
0.802.74 × 10−45.44 × 10−499.10
0.902.07 × 10−43.05 × 10−498.65
0.810.309.97 × 10−41.21 × 10−398.63
0.406.06 × 10−41.05 × 10−399.36
0.504.01 × 10−49.20 × 10−499.56
0.602.85 × 10−48.08 × 10−499.52
0.702.15 × 10−47.06 × 10−499.43
0.801.70 × 10−46.00 × 10−499.36
0.90 1.39 × 10−44.54 × 10−499.32
Table 8. Quasi-optimal fit parameters of the DE model.
Equilibrium Pressure (MPa)θf k f   ( s 1 ) k s   ( s 1 ) R 2   ( % )
0.350.501.74 × 10−21.20 × 10−399.09
0.601.18 × 10−29.82 × 10−499.48
0.640.501.09 × 10−21.08 × 10−398.80
0.608.00 × 10−38.78 × 10−499.45
0.706.04 × 10−36.86 × 10−499.12
0.810.409.07 × 10−31.04 × 10−399.65
0.506.45 × 10−38.96 × 10−499.83
0.604.85 × 10−37.58 × 10−499.49
Table 9. F R values of the TFP models.
Equilibrium Pressure (MPa)ORB ModelERB ModelFDR ModelDE Model
F R D a F R D i F R D i F R D i F R D F F R k R F R k f F R k s
0.351.001.003.211.873.392.001.471.22
0.641.001.004.046.753.523.581.811.57
0.81927.80927.803.252.627.182.671.871.37

