Article

A Machine Learning-based Pipeline for the Classification of CTX-M in Metagenomics Samples

by
Diego Ceballos
1,2,*,
Diana López-Álvarez
3,
Gustavo Isaza
2,*,
Reinel Tabares-Soto
1,
Simón Orozco-Arias
1,2 and
Carlos D. Ferrin
4
1
Department of Electronics and Automatization, Universidad Autónoma de Manizales, Manizales 1700, Colombia
2
Universidad de Caldas, Manizales 1700, Colombia
3
Universidad Nacional de Colombia-Palmira, Palmira 763531, Colombia
4
Universidad del Valle, Cali 760001, Colombia
*
Authors to whom correspondence should be addressed.
Processes 2019, 7(4), 235; https://doi.org/10.3390/pr7040235
Submission received: 16 February 2019 / Revised: 2 April 2019 / Accepted: 8 April 2019 / Published: 24 April 2019
(This article belongs to the Special Issue Bioinformatics Applications Based On Machine Learning)

Abstract

:
Bacterial infections are a major global concern, since they can lead to public health problems. To address this issue, bioinformatics contributes extensively with the analysis and interpretation of in silico data by enabling to genetically characterize different individuals/strains, such as in bacteria. However, the growing volume of metagenomic data requires new infrastructure, technologies, and methodologies that support the analysis and prediction of this information from a clinical point of view, as intended in this work. On the other hand, distributed computational environments allow the management of these large volumes of data, due to significant advances in processing architectures, such as multicore CPU (Central Process Unit) and GPGPU (General Propose Graphics Process Unit). For this purpose, we developed a bioinformatics workflow based on filtered metagenomic data with Duk tool. Data formatting was done through Emboss software and a prototype of a workflow. A pipeline was also designed and implemented in bash script based on machine learning. Further, Python 3 programming language was used to normalize the training data of the artificial neural network, which was implemented in the TensorFlow framework, and its behavior was visualized in TensorBoard. Finally, the values from the initial bioinformatics process and the data generated during the parameterization and optimization of the Artificial Neural Network are presented and validated based on the most optimal result for the identification of the CTX-M gene group.

1. Introduction

Within the field of bioinformatics, researchers use metagenomics approaches to characterize microbial genomes directly isolated from the environment [1]. For this, new sequencing technologies generate large volumes of data to be analyzed, due to the abundant varieties of species that can be found in metagenomics samples, which are characterized by sequences of short length and high complexity. In addition, with the possibility of discovering new species, the problem of taxonomic assignment of reads of short DNA sequences becomes extremely challenging [2]. In this respect, metagenomics is considered as the field of study of many genomes in different environments that may even be compartments or regions of living beings, such as mucous membranes and intestines, among others. Therefore, metagenomics is a challenge for computer science researchers who seek to develop methods to understand such amount of genetic information [3]. Concerning the area of computational intelligence, this work deals with a technique already known and validated with artificial neural networks. According to [3] Soueidan and Hayssam (2016), machine learning techniques currently offer a large set of promising tools to build predictive models for the classification of biological data. These tools are built under different frameworks offering the possibility of implementing supervised and unsupervised techniques (clustering), among others.
CTX-M-type enzymes are a group of class A extended-spectrum β-lactamases (ESBLs) that are rapidly spreading among Enterobacteriaceae worldwide. The first recognition of the appearance of CTX-M β-lactamases occurred almost simultaneously in Europe and South America in early 1989. The first publication to recognize an ESBL from the CTX-M group was a report presenting a species of E. coli resistant to cefotaxime but susceptible to ceftazidime, isolated from the ear of a four-month-old child suffering from otitis media in Munich [4].
At the regional level, the Manizales Antibiotic Resistance Group (GRAM) is in charge of presenting the accumulated antibiotic resistance data of the main hospitals in the city. Among total isolates from patients in intensive care units, non-intensive care units and emergencies, the main bacteria identified are Enterobacteriaceae such as Escherichia coli, Klebsiella pneumoniae, and Eneterobacter cloacae, among others. All of these species display the capacity to carry ESBL genes of the CTX-M group. In addition, according to the antibiotic susceptibility analyses carried out by different clinics in the city, resistance to cefotaxime (cephalosporin with a broad hydrolysable spectrum by CTX-M) ranges between 15% and 35% [5]. This means that, in Manizales, up to one out of every three isolates of this bacterial group is suspected of carrying a CTX-M-type ESBL. The high frequency of this type of ESBL in our context highlights the importance of this type of developments for antibiotic surveillance processes based on metagenomic data.
The validation of this pipeline allows us to extend this analysis for other important genes such as TEM, SHV, metalloenzymes, carbapenemases that are probably prevalent in our regional context, considering the characteristics of the population, the clinical management protocols of patients and health, and asepsis in operating rooms. Since this is a common problem, the development of a pipeline that allows the identification of resistance variants becomes a fundamental step in the establishment of a modern antibiotic surveillance system. The subsequent goal of this study will be to test this development on metagenomic data derived from the surveillance process, in collaboration with research groups in this field.

1.1. Metagenomics

According to the National Center for Biotechnology Information (NCBI) [6], metagenomics is an area of bioinformatics that has evolved significantly in the last ten years, contributing on a large scale to microbiology. In the same manner, this relatively new “omic” science has made surprising discoveries in microbial taxonomy, revealing new capabilities and functionalities of different biomes [7].
Metagenomics is analyzed through computation and bioinformatics, especially with the use of different information discovery techniques. From this field, we try to discover patterns within this data to extract information that may be relevant for biologists, pharmacologists, chemists and/or bioinformaticians. This information contributes to the solution of different pathologies related to microbial attacks.
New techniques have been developed to analyze large volumes of information from large amounts of metagenomic data, being big data and machine learning the most widely used [8]. These techniques use distributed computational environments of large capacity that allow more efficient processing and reduce computing times in a significant way.

1.2. Machine Learning

Machine learning seeks to answer a very concrete question: How can we build computer systems that automatically improve with experience, and what fundamental laws govern this teaching process? [9]
Through this discipline, it is possible to implement new methods that help researchers in making new findings. Machine learning techniques are used, for example, to learn about models of gene expression in cells and other applications in bioinformatics, more specifically in metagenomics [10]. One can talk about three types of algorithms within the current machine learning techniques:
Supervised: Data training consists of labeled entries and known outputs that the machine analyzes while relabeling. There are many applications of supervised algorithms in bioinformatics to solve problems [11], which are based on information from adequately characterized genes.
Unsupervised: This type of analysis of unlabeled and categorized data is based on similarities that have been identified. In this case, the machine can cluster the data based on shared characteristics. Techniques that use unsupervised algorithms are often used for problems in which humans cannot clearly infer patterns, that is, it requires exhaustive observation to identify such patterns. It is also a technique that allows determining behaviors based on different interpretations.
Semi-supervised: This analysis refers to a combination of the two previously mentioned techniques. It is used in large data sizes when the labels of some of these data are known. Unsupervised learning is based on the analysis of unlabeled data to group them, while techniques of supervised learning are used to predict the labels of this group formed by the first technique. Artificial Neural Networks (ANN) are a known approach to address complex problems, as neural networks can be implemented at the hardware or software level and, in turn, can use a variety of topologies and learning algorithms.

2. Materials and Methods

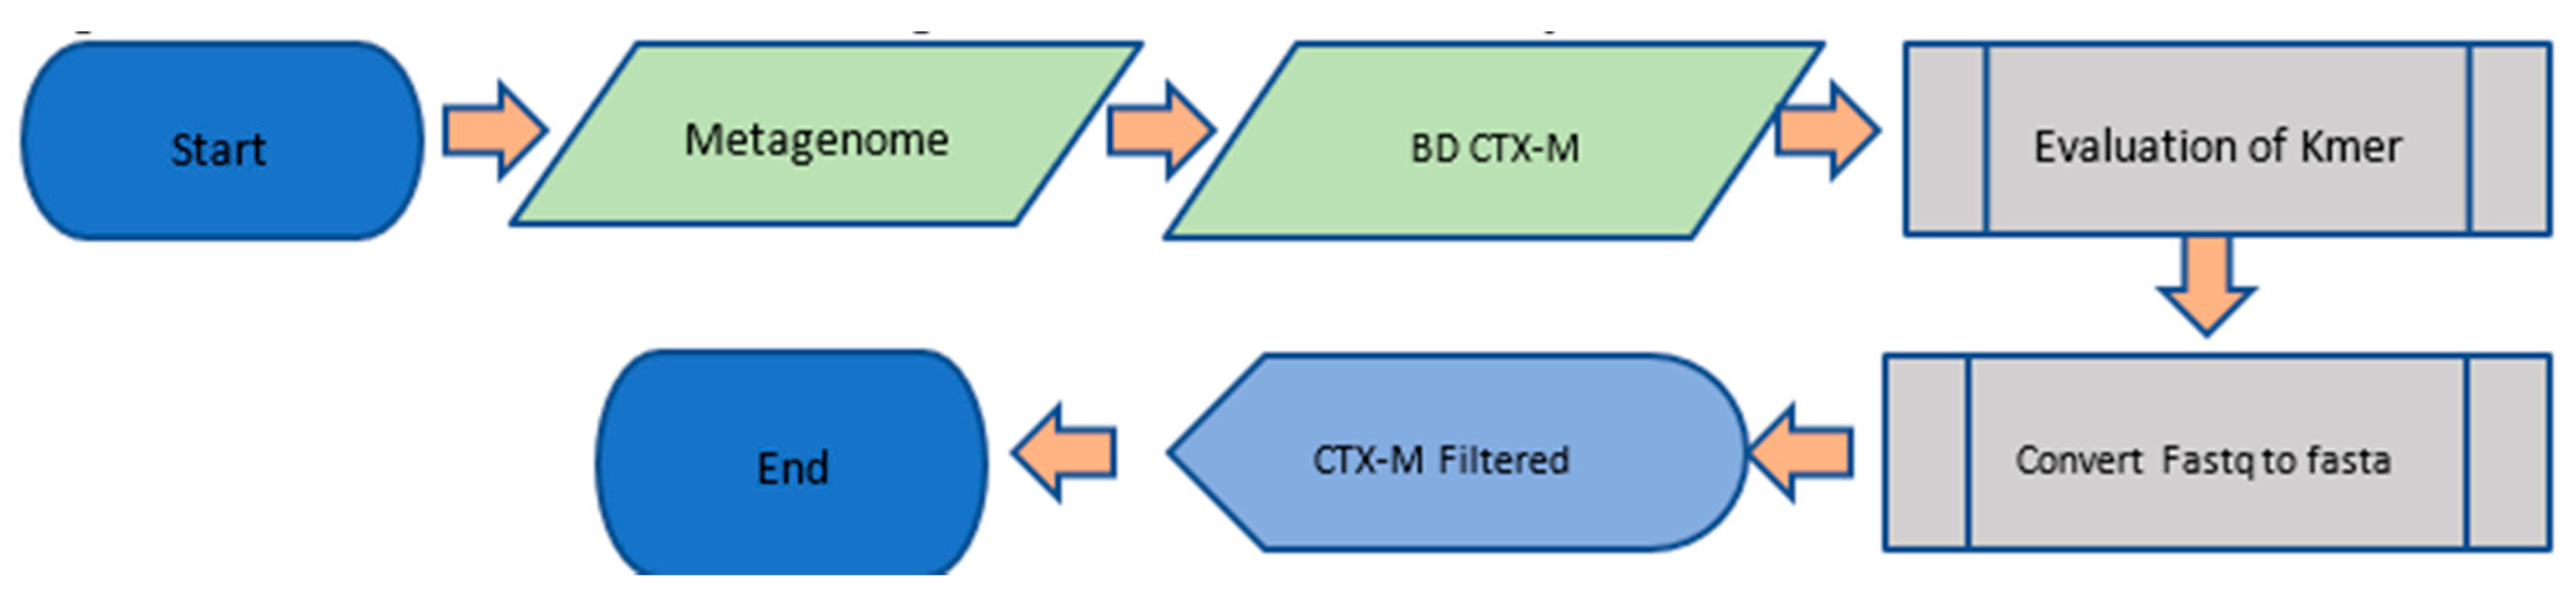
2.1. Selection of the CTX-M and Metagenome Baseline Reference Database for the Study

First, we based our selection on previous work by [12] Núñez in 2016 (unpublished data), where all the CTX-M reported groups are already considered. After a review of the state of the art, we consolidated the CTX-M database, previously filtered by the analysis of phylogenetic trees carried out by [12] Núñez. Subsequently, the reference metagenome to be studied was selected through a search in the EBI-Metagenomics database (https://www.ebi.ac.uk/metagenomics/), considering the high probability that the CTX-M gene was present. We reviewed the following four metagenomes and selected only one as input to develop the prototype:
The metagenome selected was antibiotic resistance within the preterm infant gut (https://www.ebi.ac.uk/ena/data/view/PRJEB15257). Upon selection of the reference metagenome, we filtered the data by following the pipeline described in Figure 1. The filtered metagenomics data was then prepared and machine learning techniques were applied according to the computational pipeline shown in Figure 2, where we assessed the accuracy and cost of the artificial neural network. A brief description is as follows: the filtered metagenome from the first pipeline is provided as input; the data are transformed by the conversion of nucleotide to binaries and the resulting binarized data are input to the ANN (Artificial Neural Network); the ANN is implemented; and accuracy and cost metrics are assessed.
We mapped the CTX-M reference database to the sample metagenome using Duk tool (Li, Mingkun, et al., 2018) to eliminate information not relevant for the study. We obtained a consolidated CTX-M database with a total of 211 reference sequences in FASTA (file format for bioinformatics data). As initial mapping parameters, we used k-mers of 16 (default) and 63 for test mappings. Next, we optimized mapping parameters following Algorithm 1.
Algorithm 1. Bioinformatic pipeline for filtering and formatting input data.
Parameterize the initial mapping with Duk using odd K-mers.
Execute tests using different K-mers.
Name: Pre-filter CTX-M
Start
          For k-mer values between 17 and 65
          Do
               Execute duk with each k-mer against the reference database
               Save results in a single file “duk_results”
          Finish do
          Best_K-mer < 0
          Best p-value < 0
          For each line in “duk_results” file
          Do
               Find p-value of each k-mer
               If (P-value found is larger than Best p-value)
                    Best p-value < p-value found
                    Best_K-mer < k-mer found
               End if
               Convert output file of best k-mer to FASTA format
               Format the FASTA file for the ANN (X, y)
               For each end of CTX-M sequence
               Do
                    Separate CTX-M group from each sequence.
          Finish do
End
Based on the initial analysis, k-mers 17, 19 and 21 were found to be the best. Additionally, we validated the results through an NCBI BLAST search of the contig obtained after adjusting the k-mer to 17 and 19 to conclusively verify that this sequence corresponds to bacteria with the CTX-M gene. The pipeline can be downloaded here:

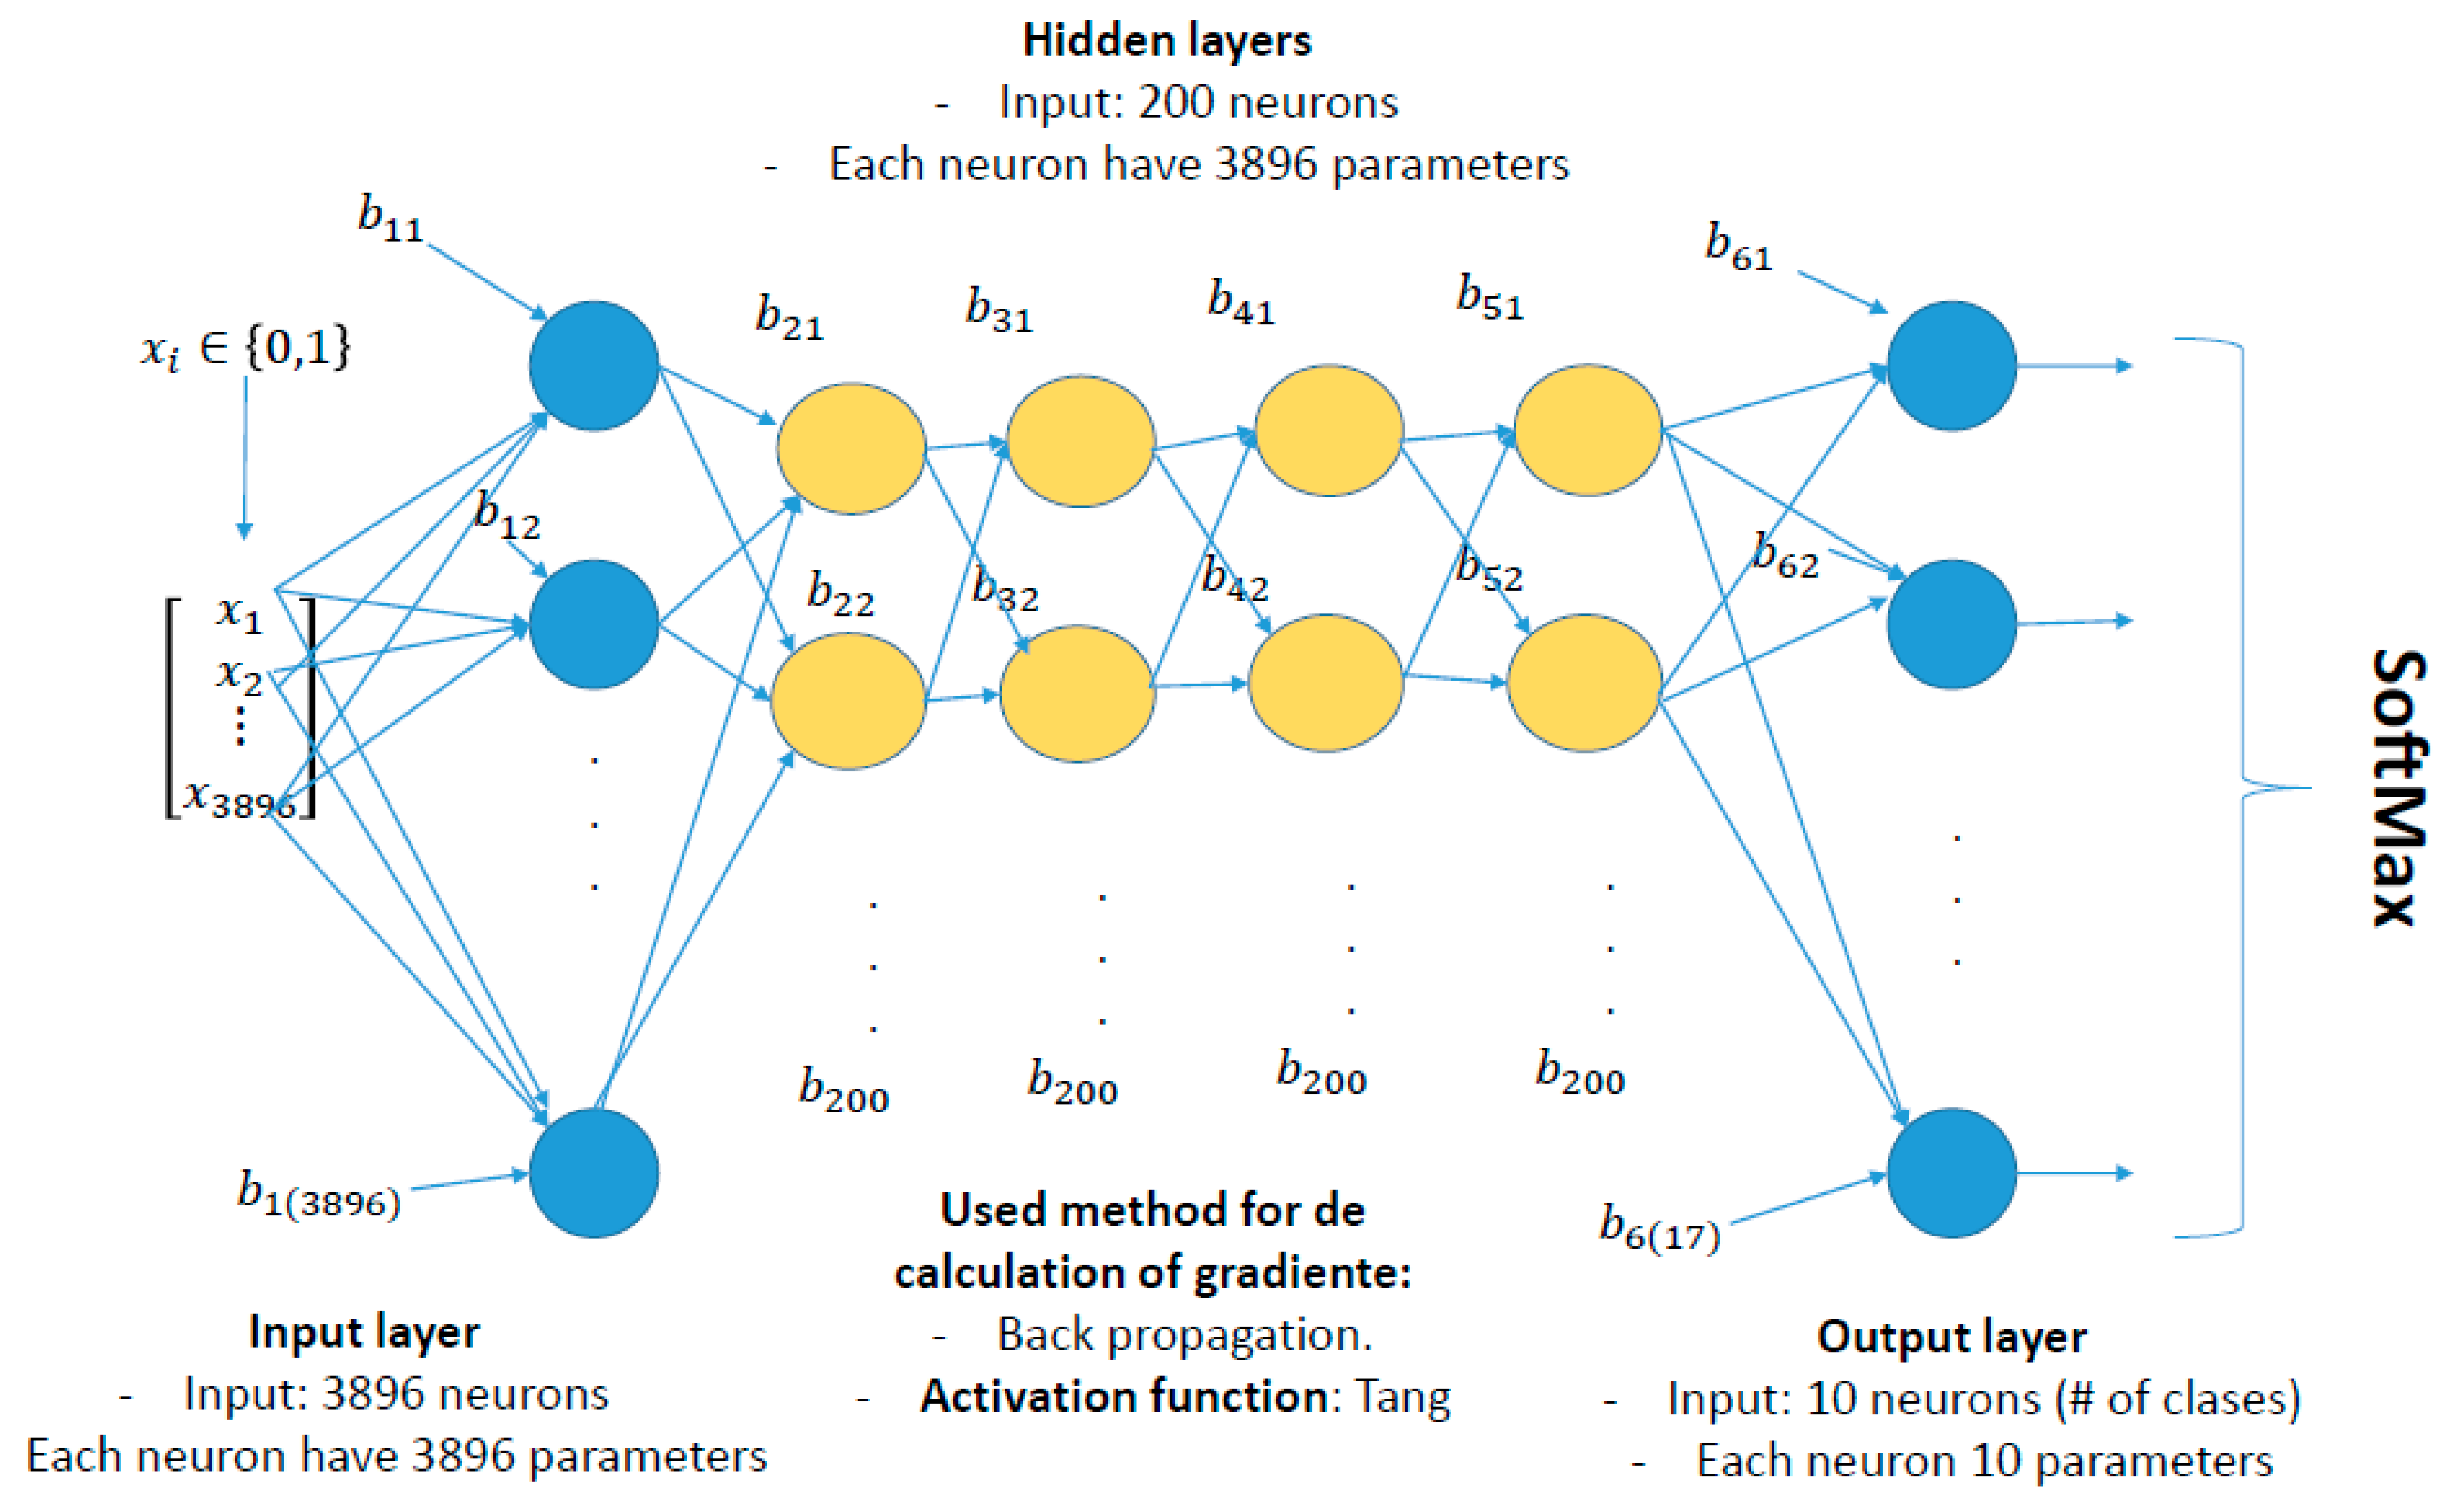
2.2. Defining an Optimal Neural Network Architecture

An exhaustive review of the existing literature was performed to define the architecture of the neural network for metagenomics. We evaluated different machine learning models focused on improving the precision of the techniques applied in neural networks, such as random forest, or algorithms based on decision trees [13]. None of the studies reviewed take into account a particular architecture, whereby the main goal is to obtain a reduction in the cost function to guarantee that the neural network apprenticeship is being carried out. Conversely, this study proposes an architecture of a multi-layer perception neuronal network (Figure 3), because of the importance of the high sensitivity that different neurons show in each of their layers concerning the activation functions, weights, and epochs. This interaction allows considering more parameters when training and validating such an architecture, taking into account its performance [14].

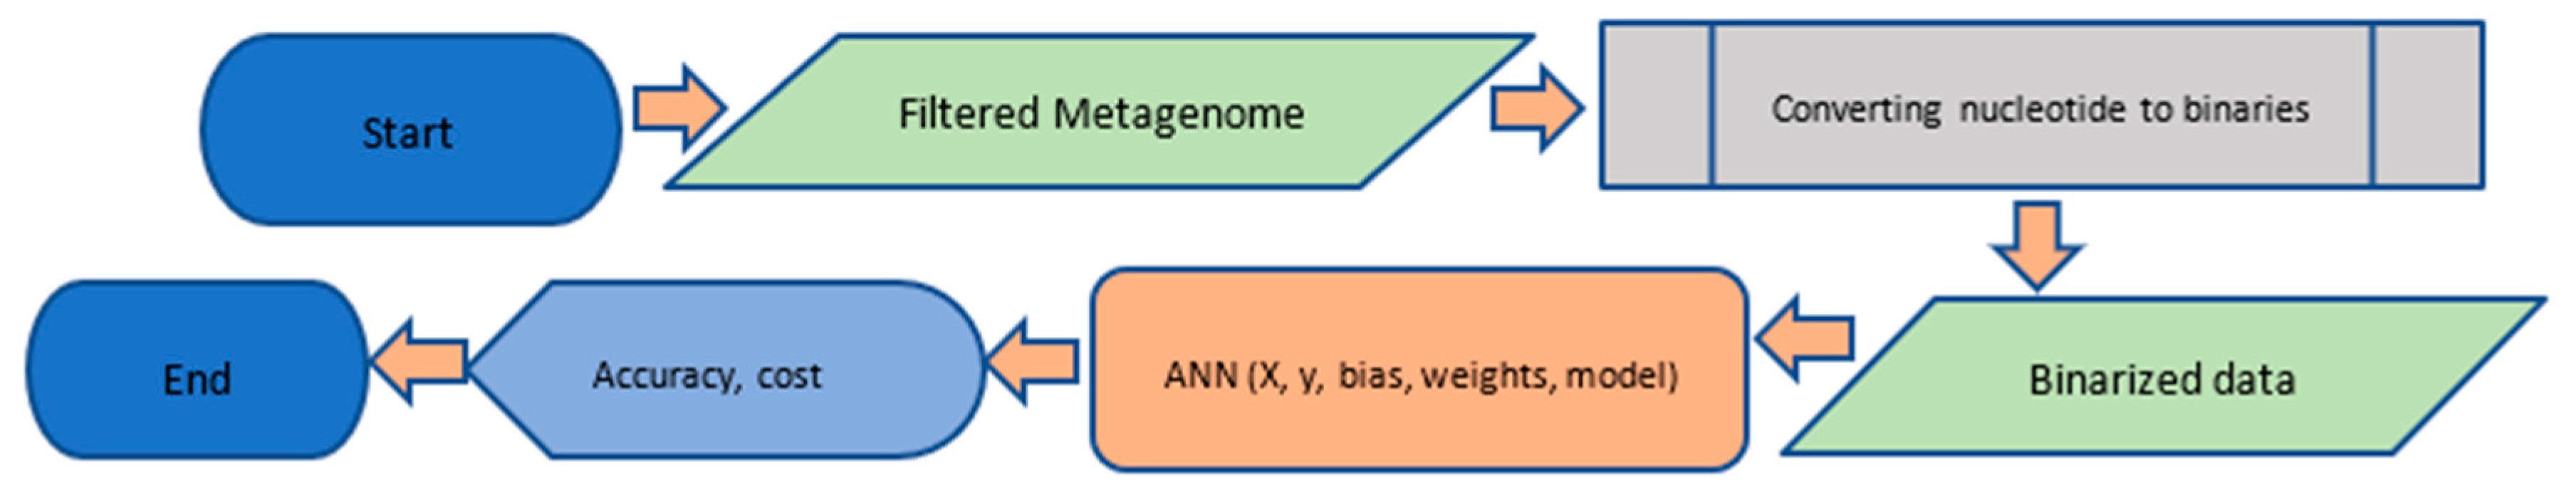
2.3. Data Standardization for the Neural Network

To establish an appropriate training dataset for the proposed neuronal network, we developed a routine in Python 3 in charge of normalizing the data obtained, where basically a binarization of the CTX-M nucleotide sequences is carried out. All sequences are standardized to the value of the longest identified sequence, and additional spaces are defined by the value N. The result is the file “dataGen.csv”, where a total of 3896 values are generated for X and the 10 groups of CTX-M (Table 1). The 10 most representative classes were selected to ensure a uniform distribution of classes for stratified cross validation in Stage 2 (validation). Initially, there were 17 classes from which only those with sequences represented at least four times within the test and validation dataset were selected. Each of the 10 classes corresponds to the following CTX-M groups, respectively (Table 1).

3. Analysis of Results

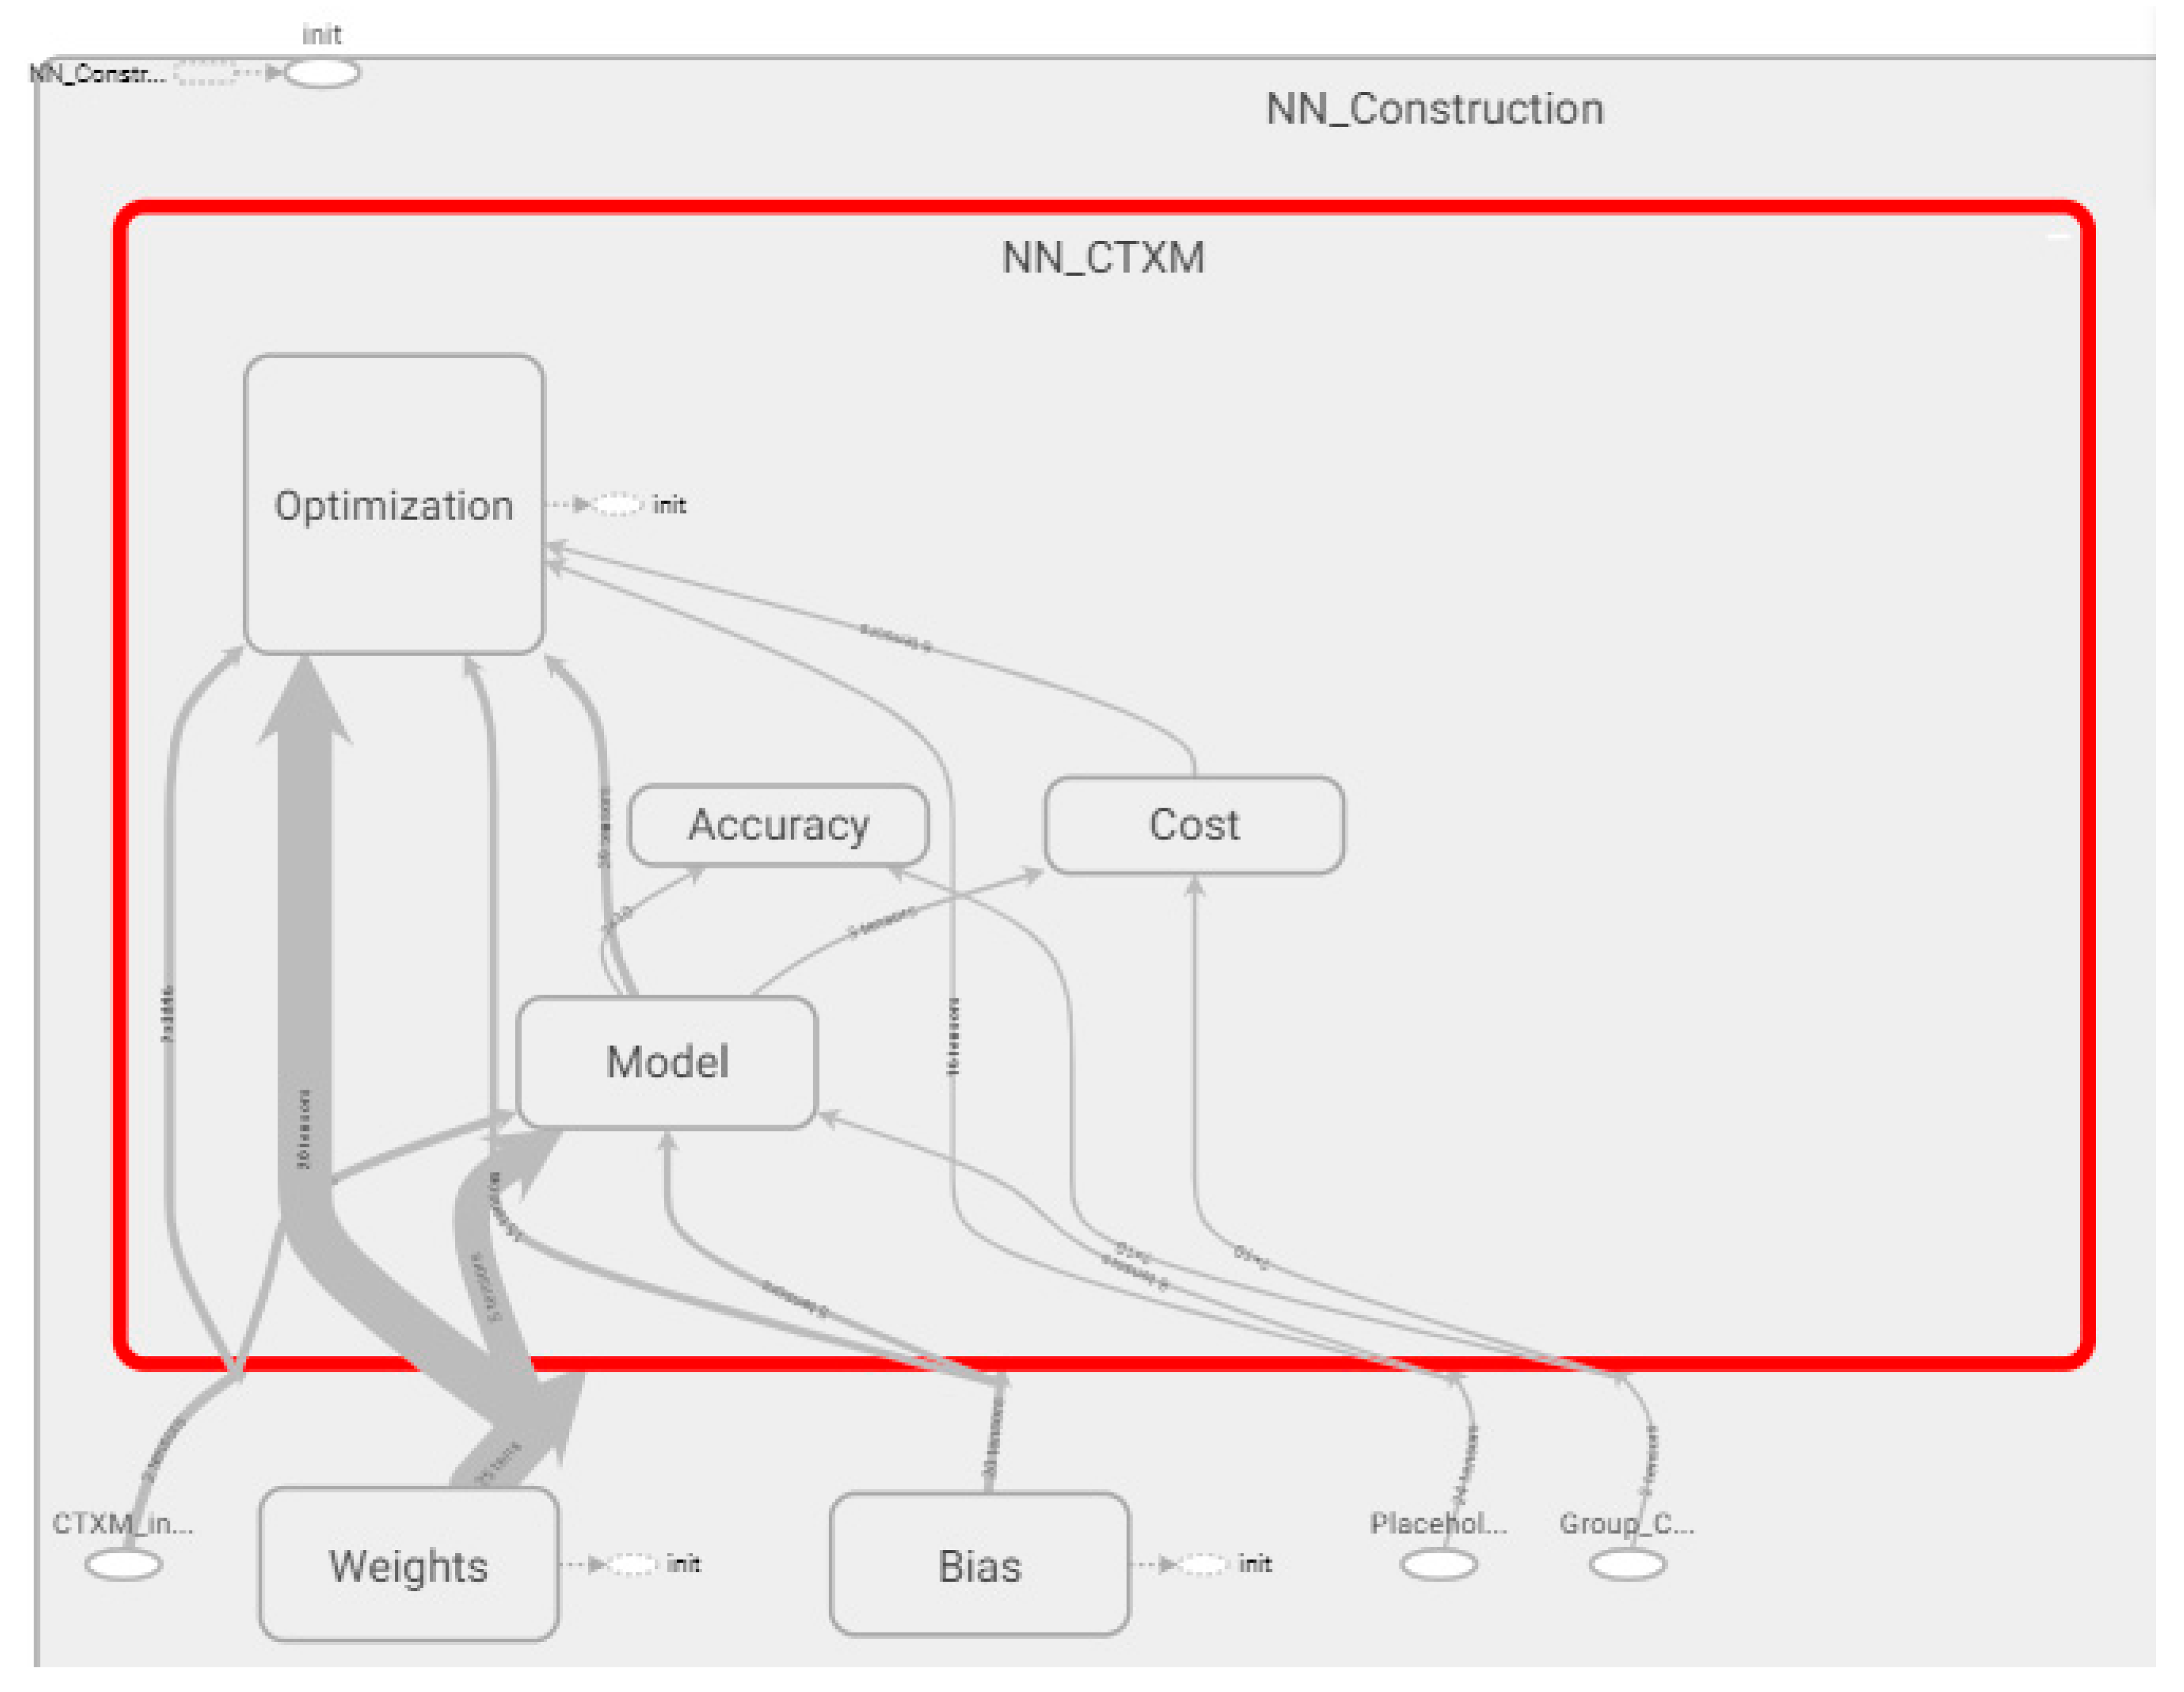
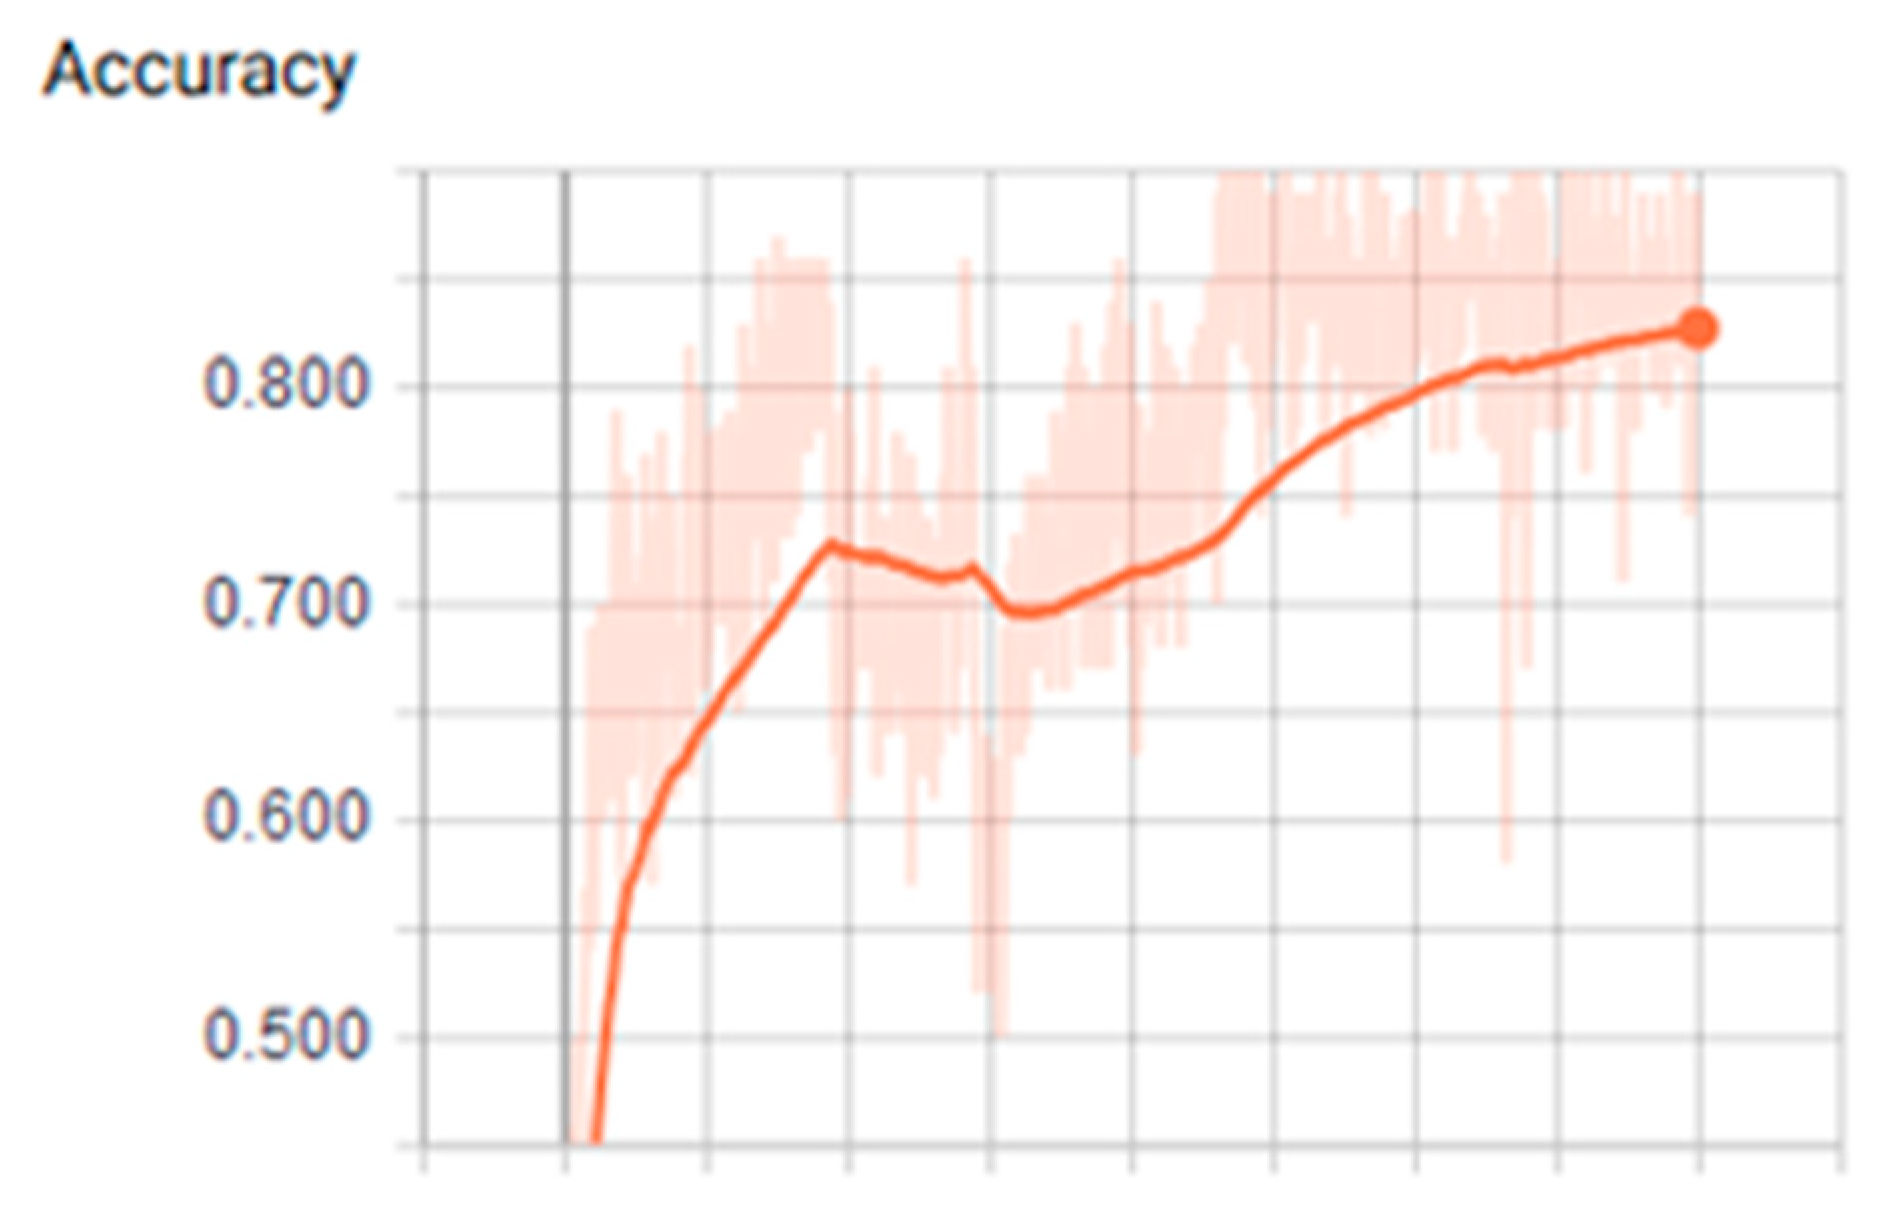
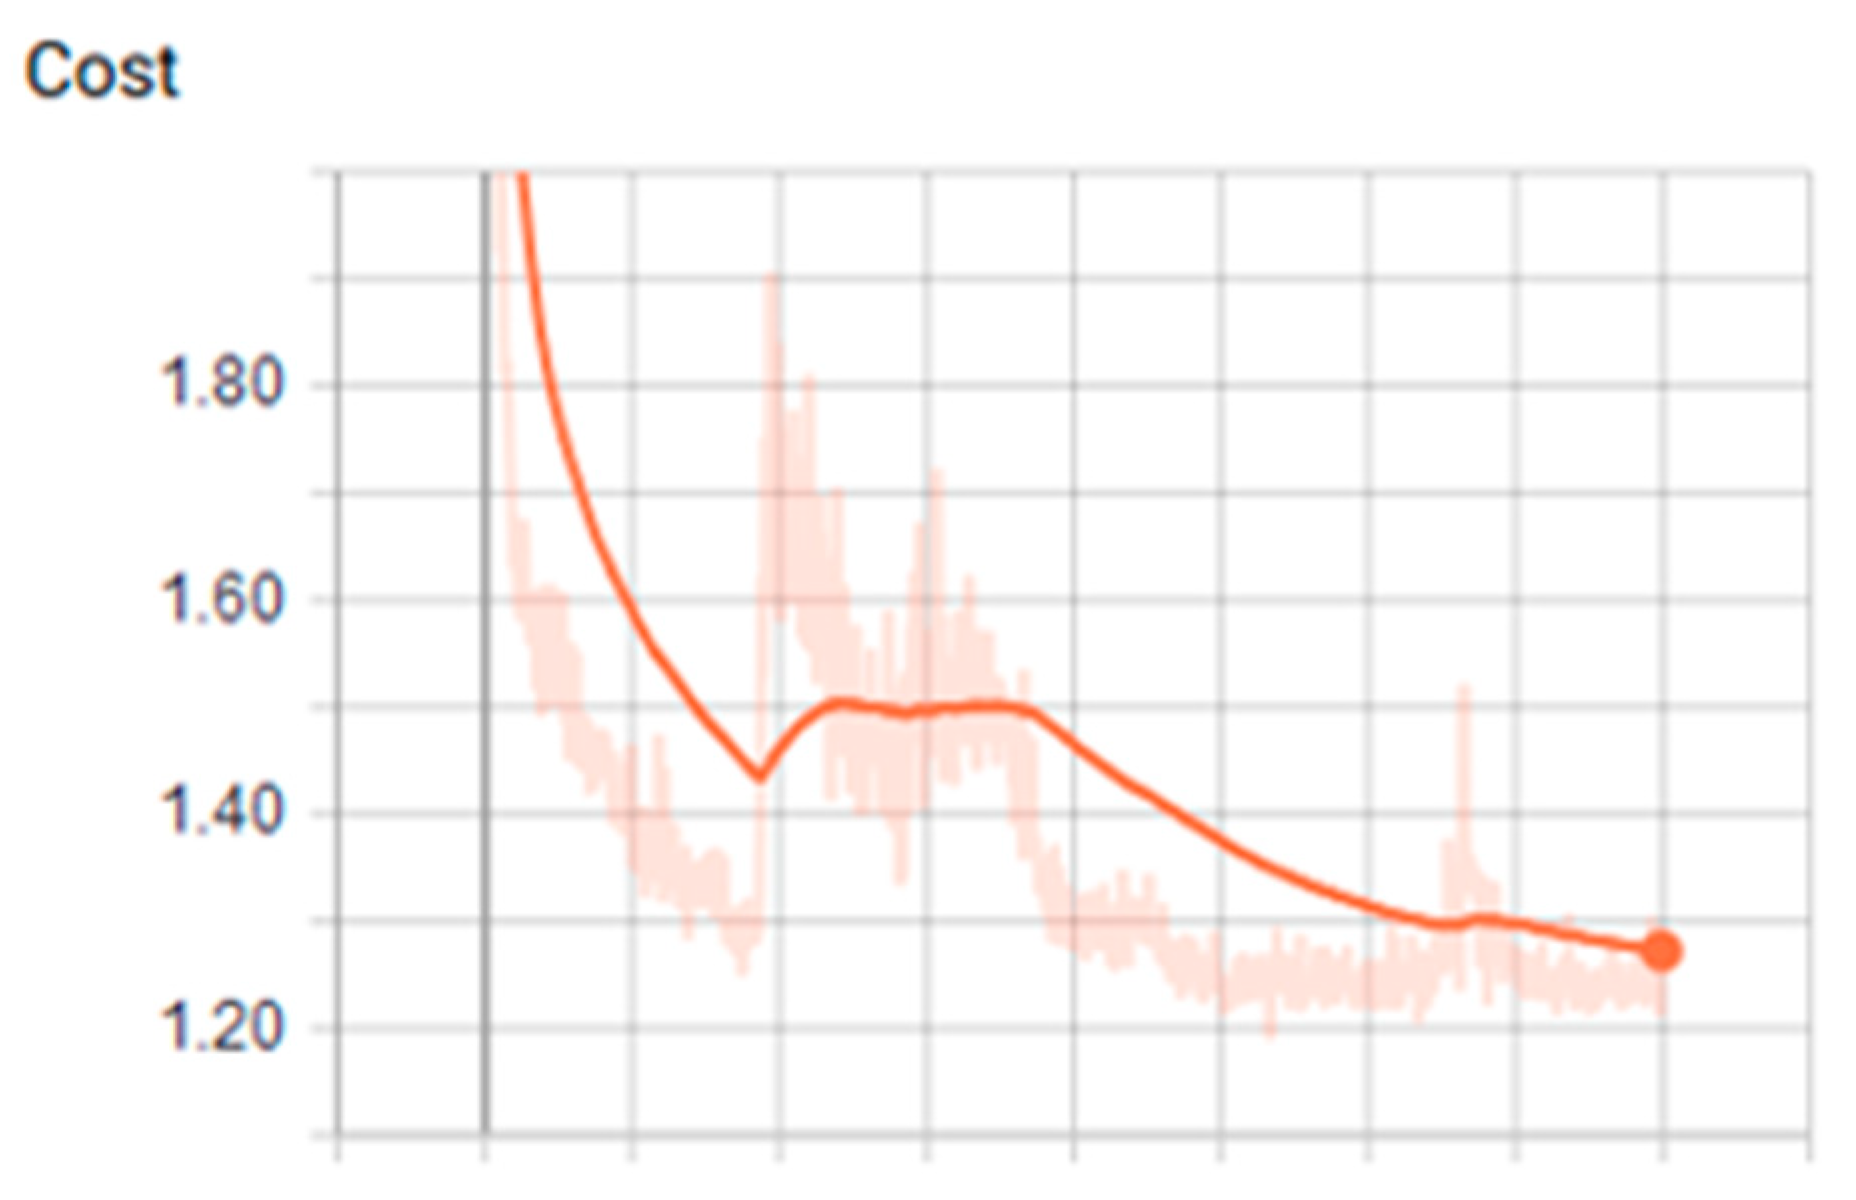
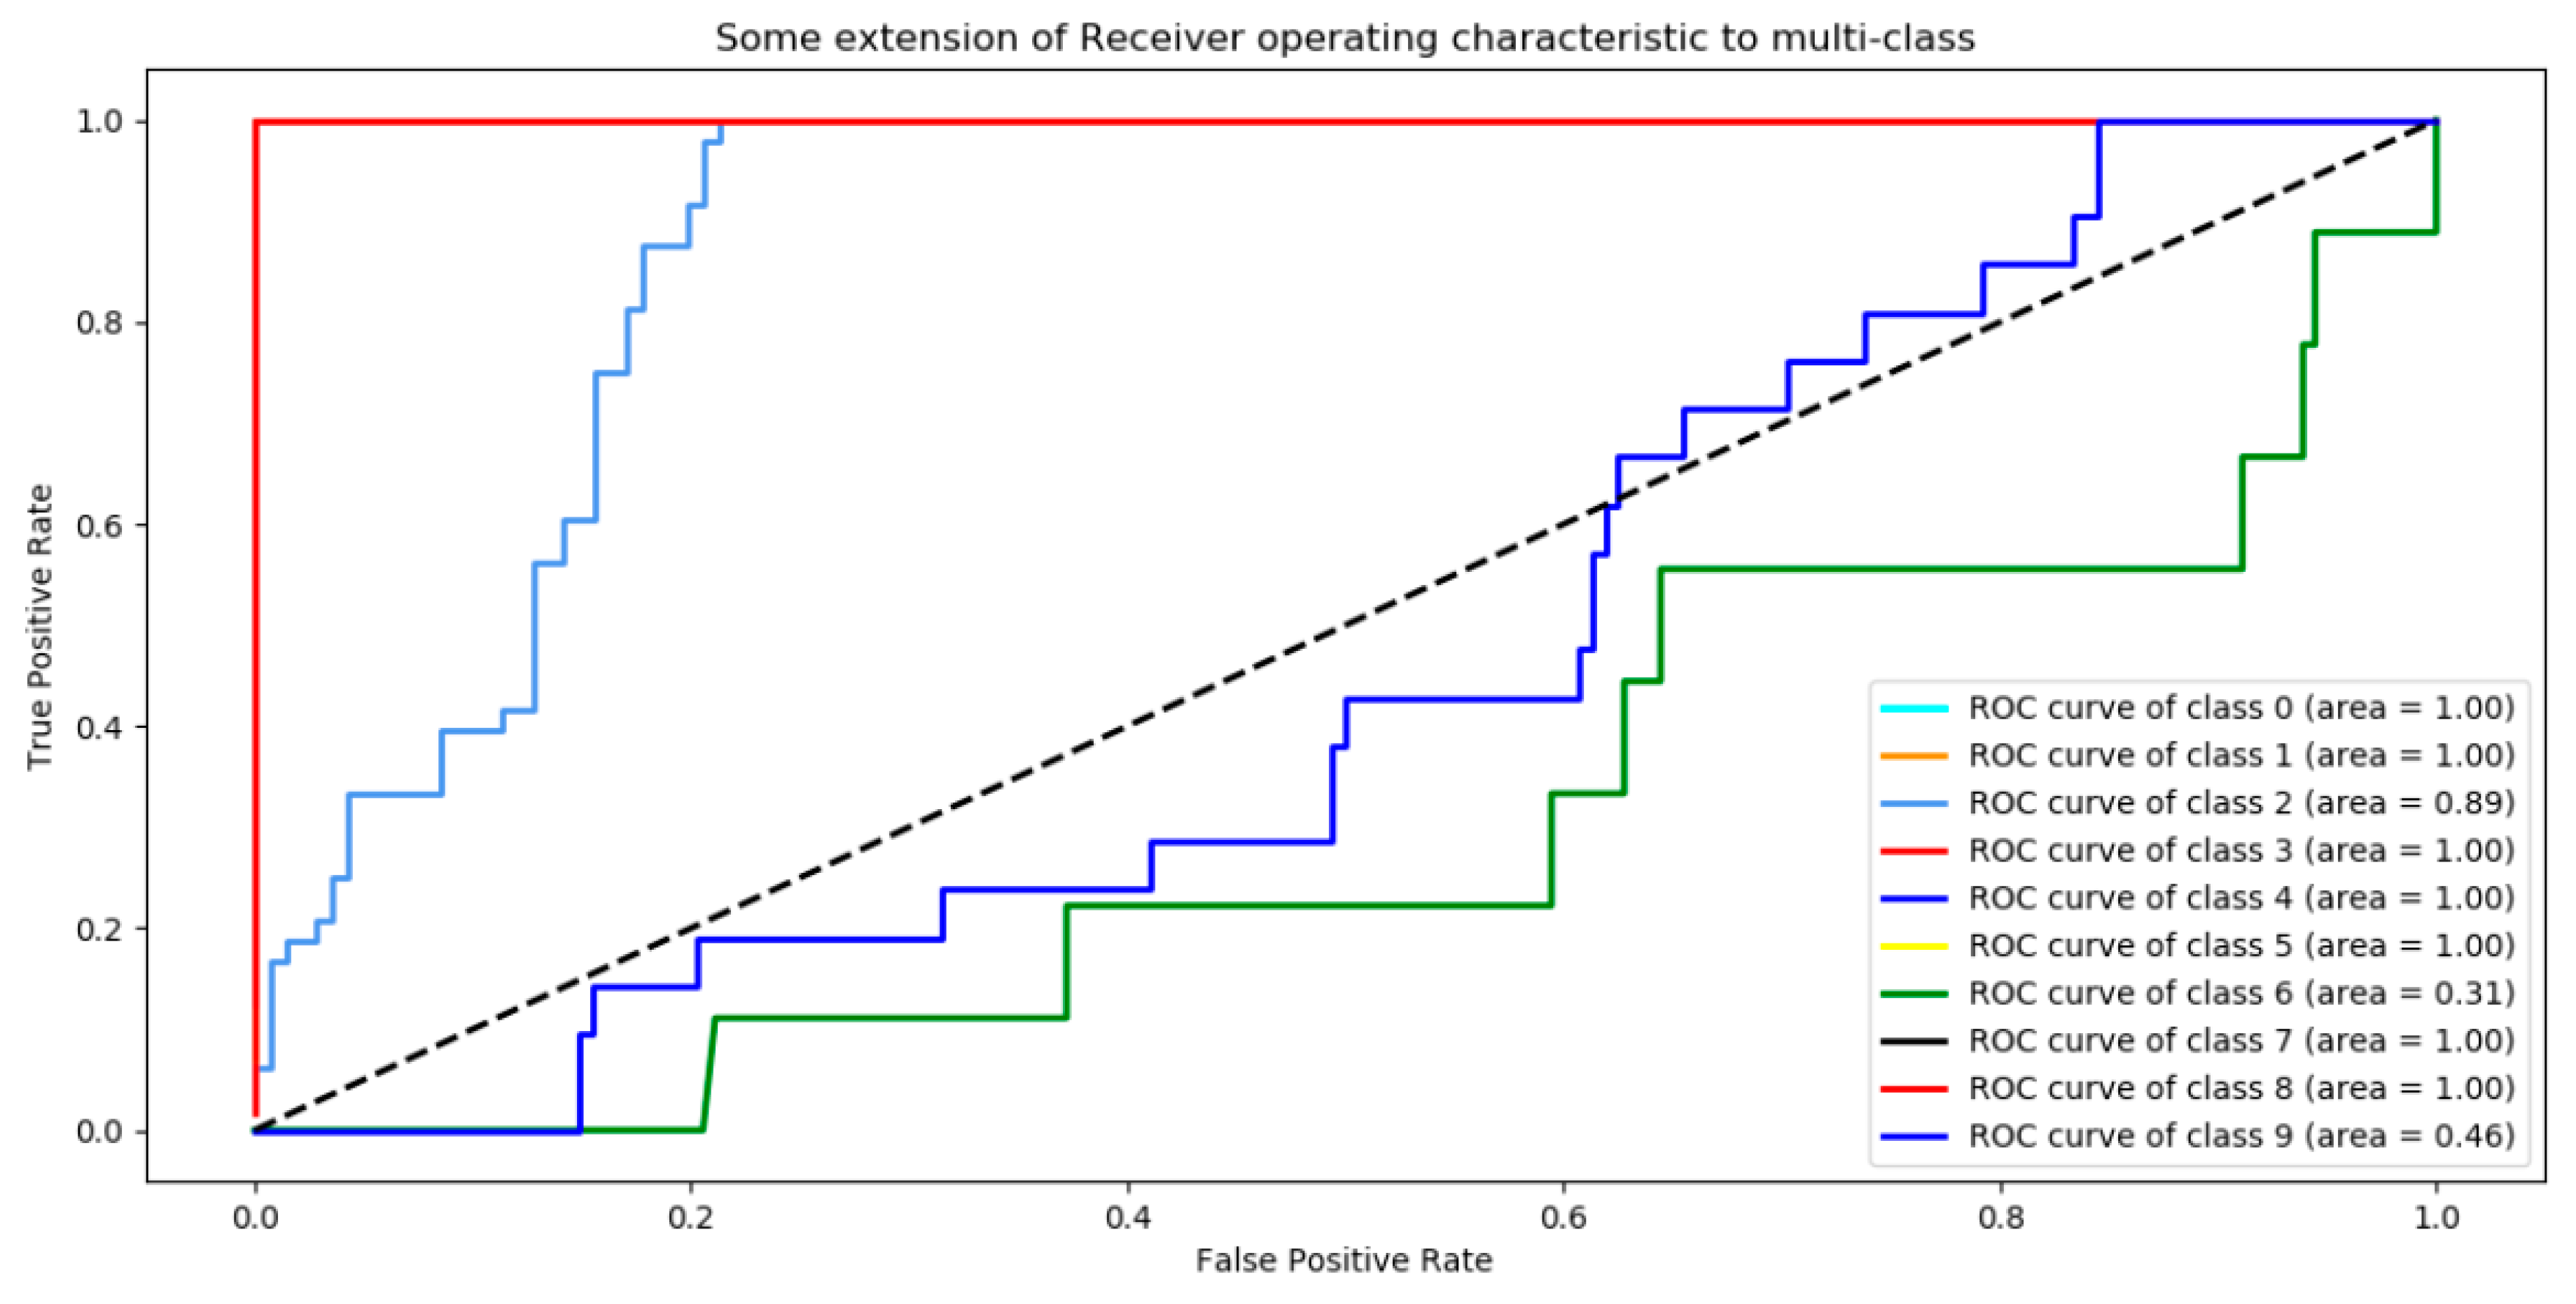
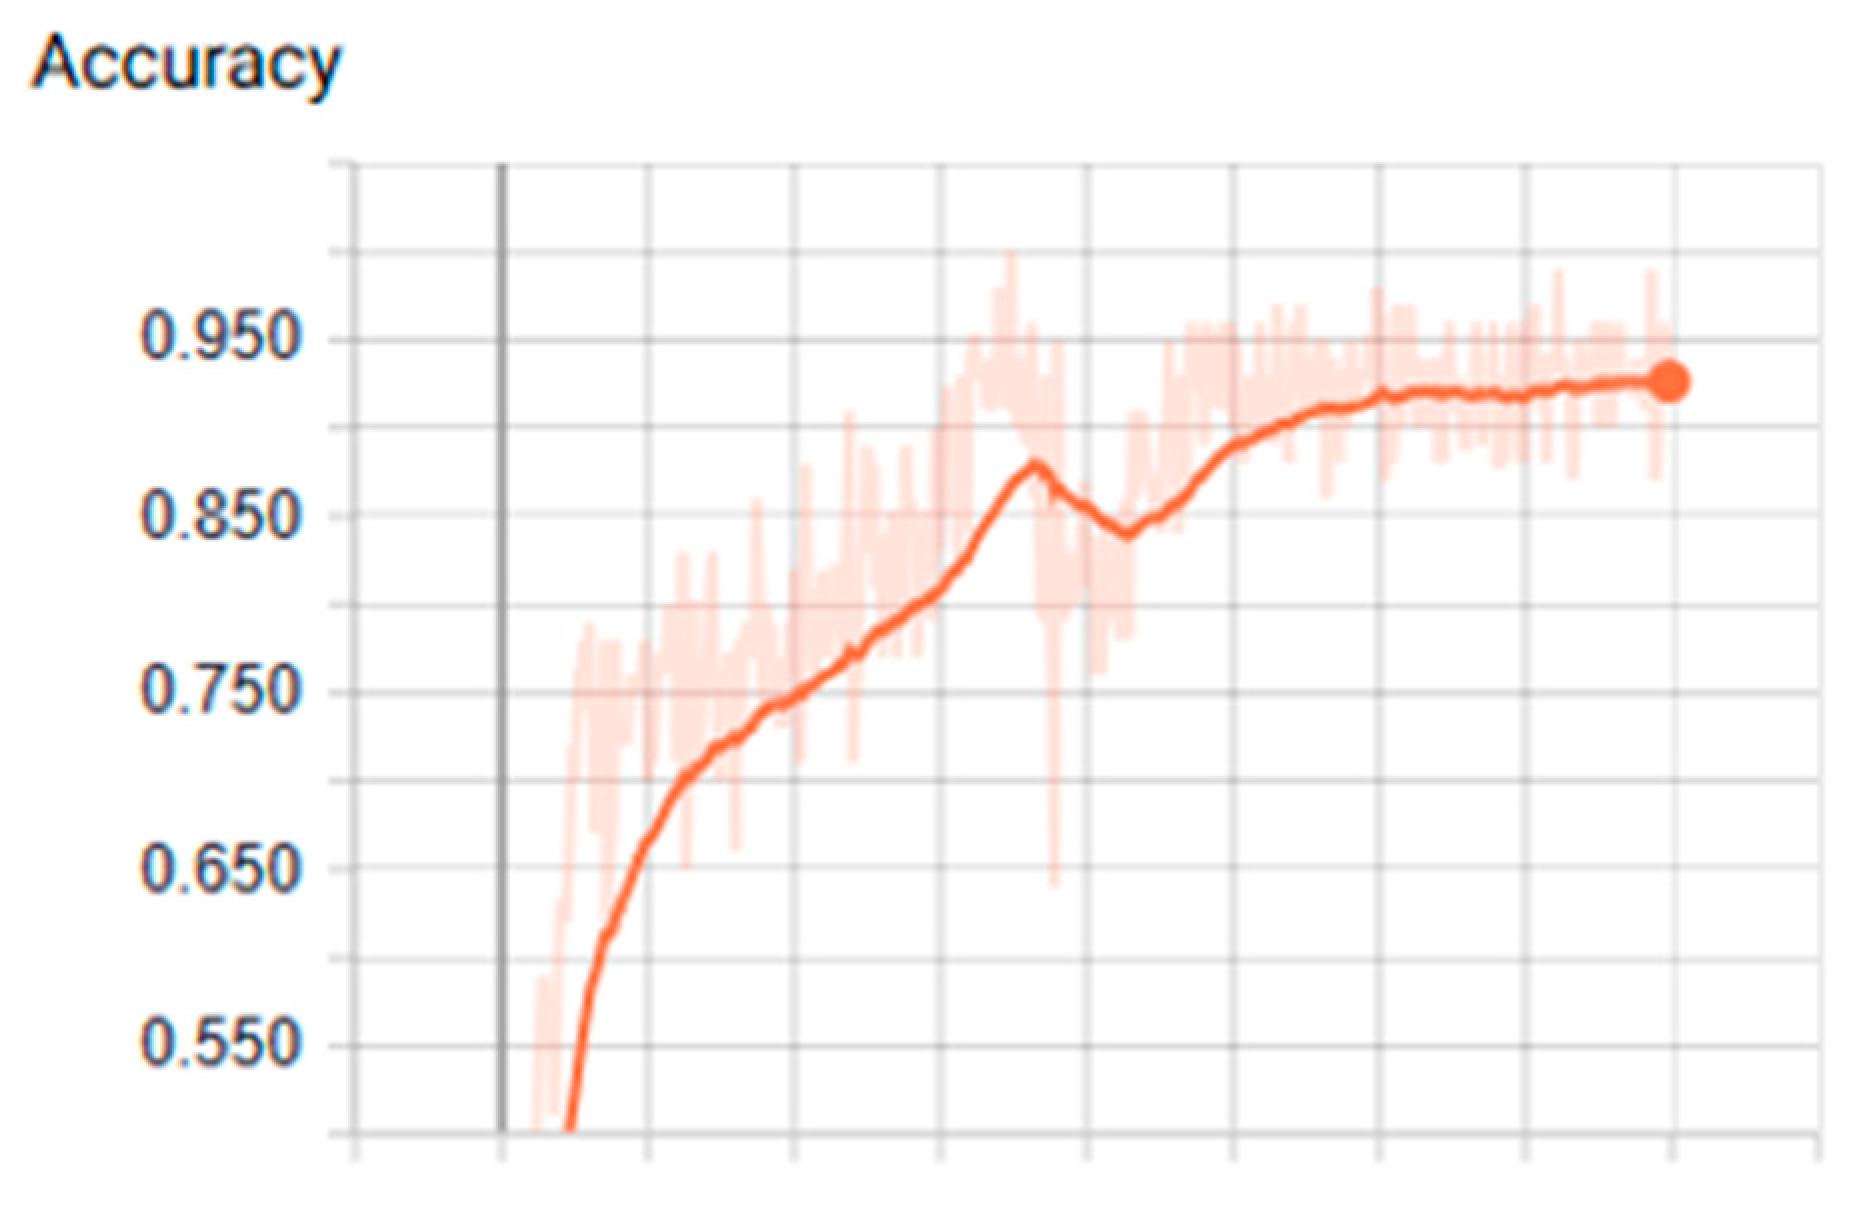
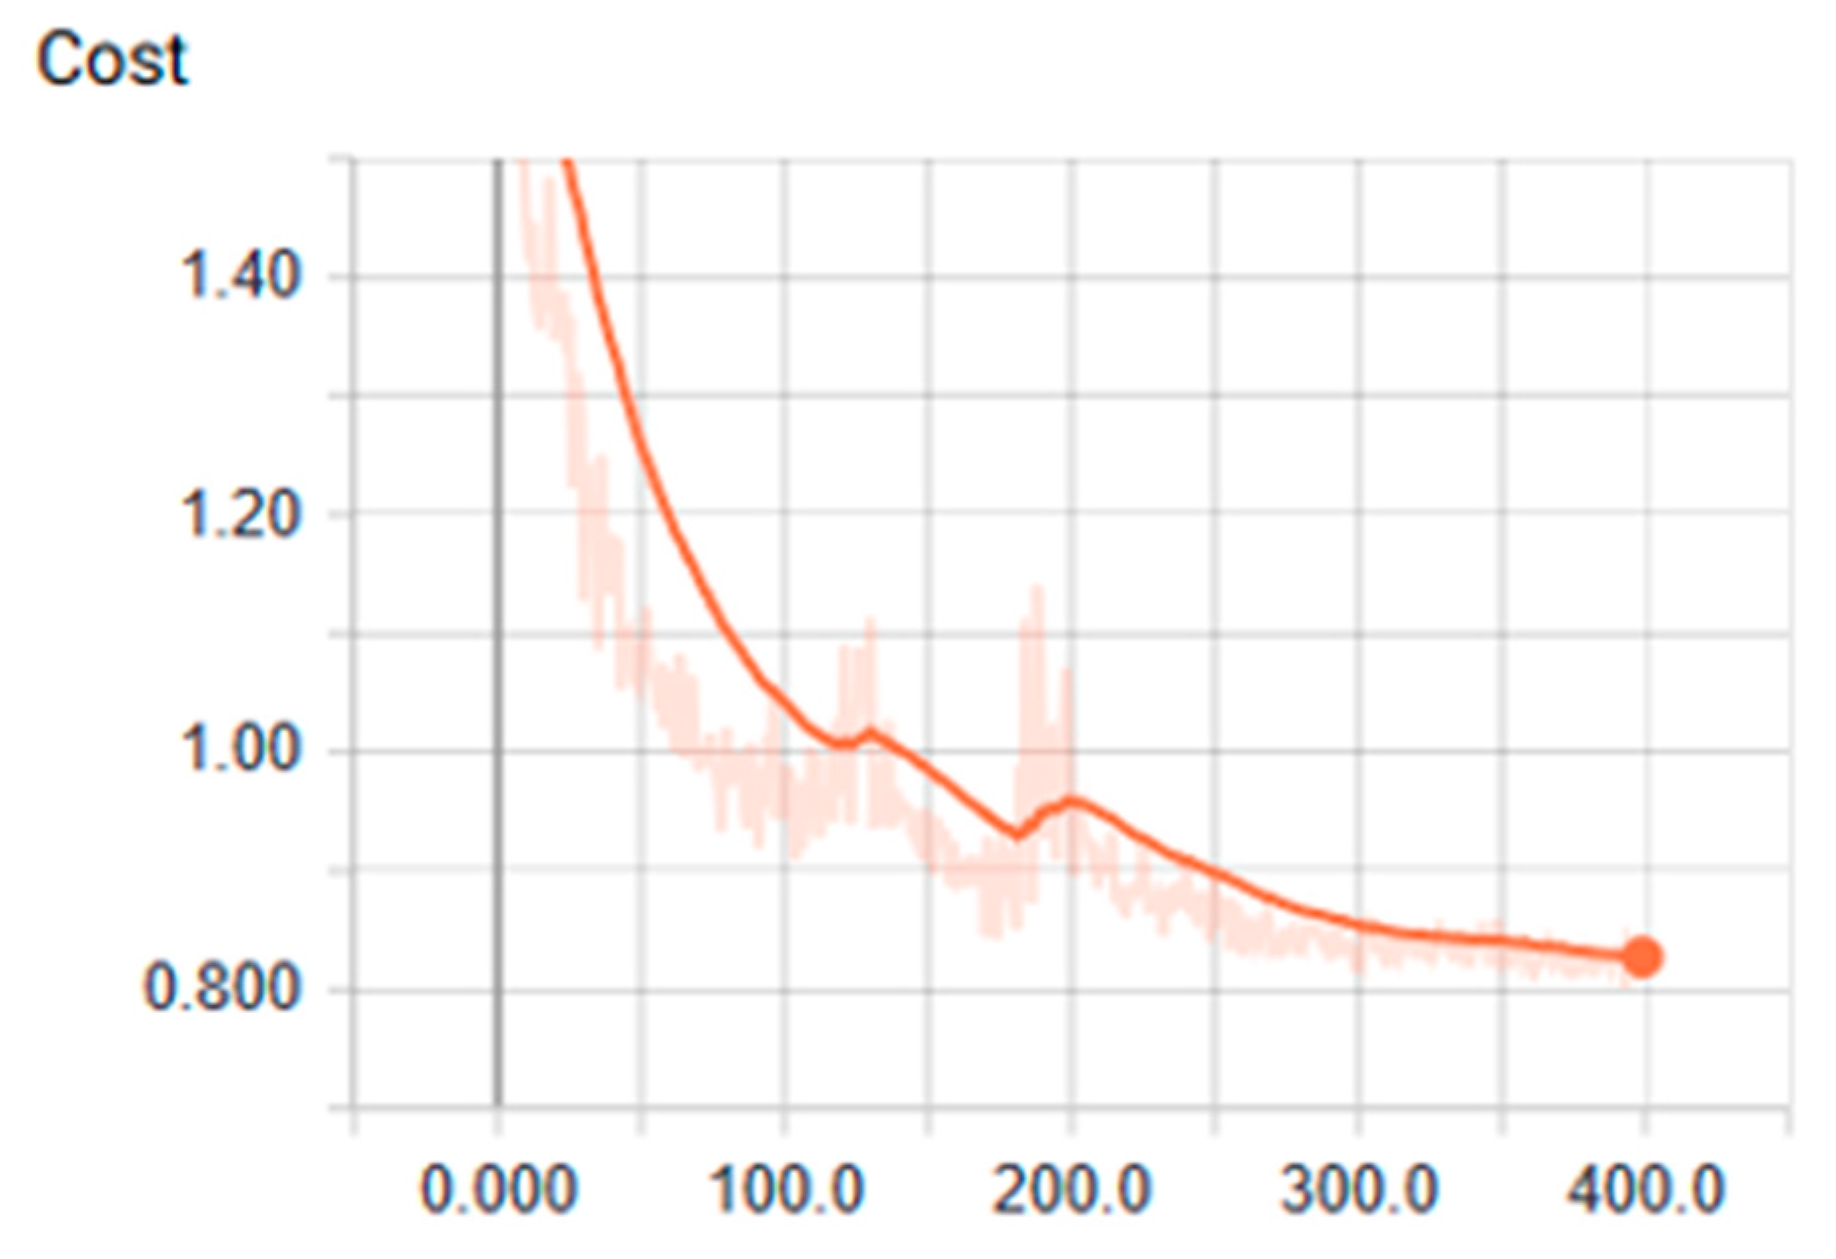
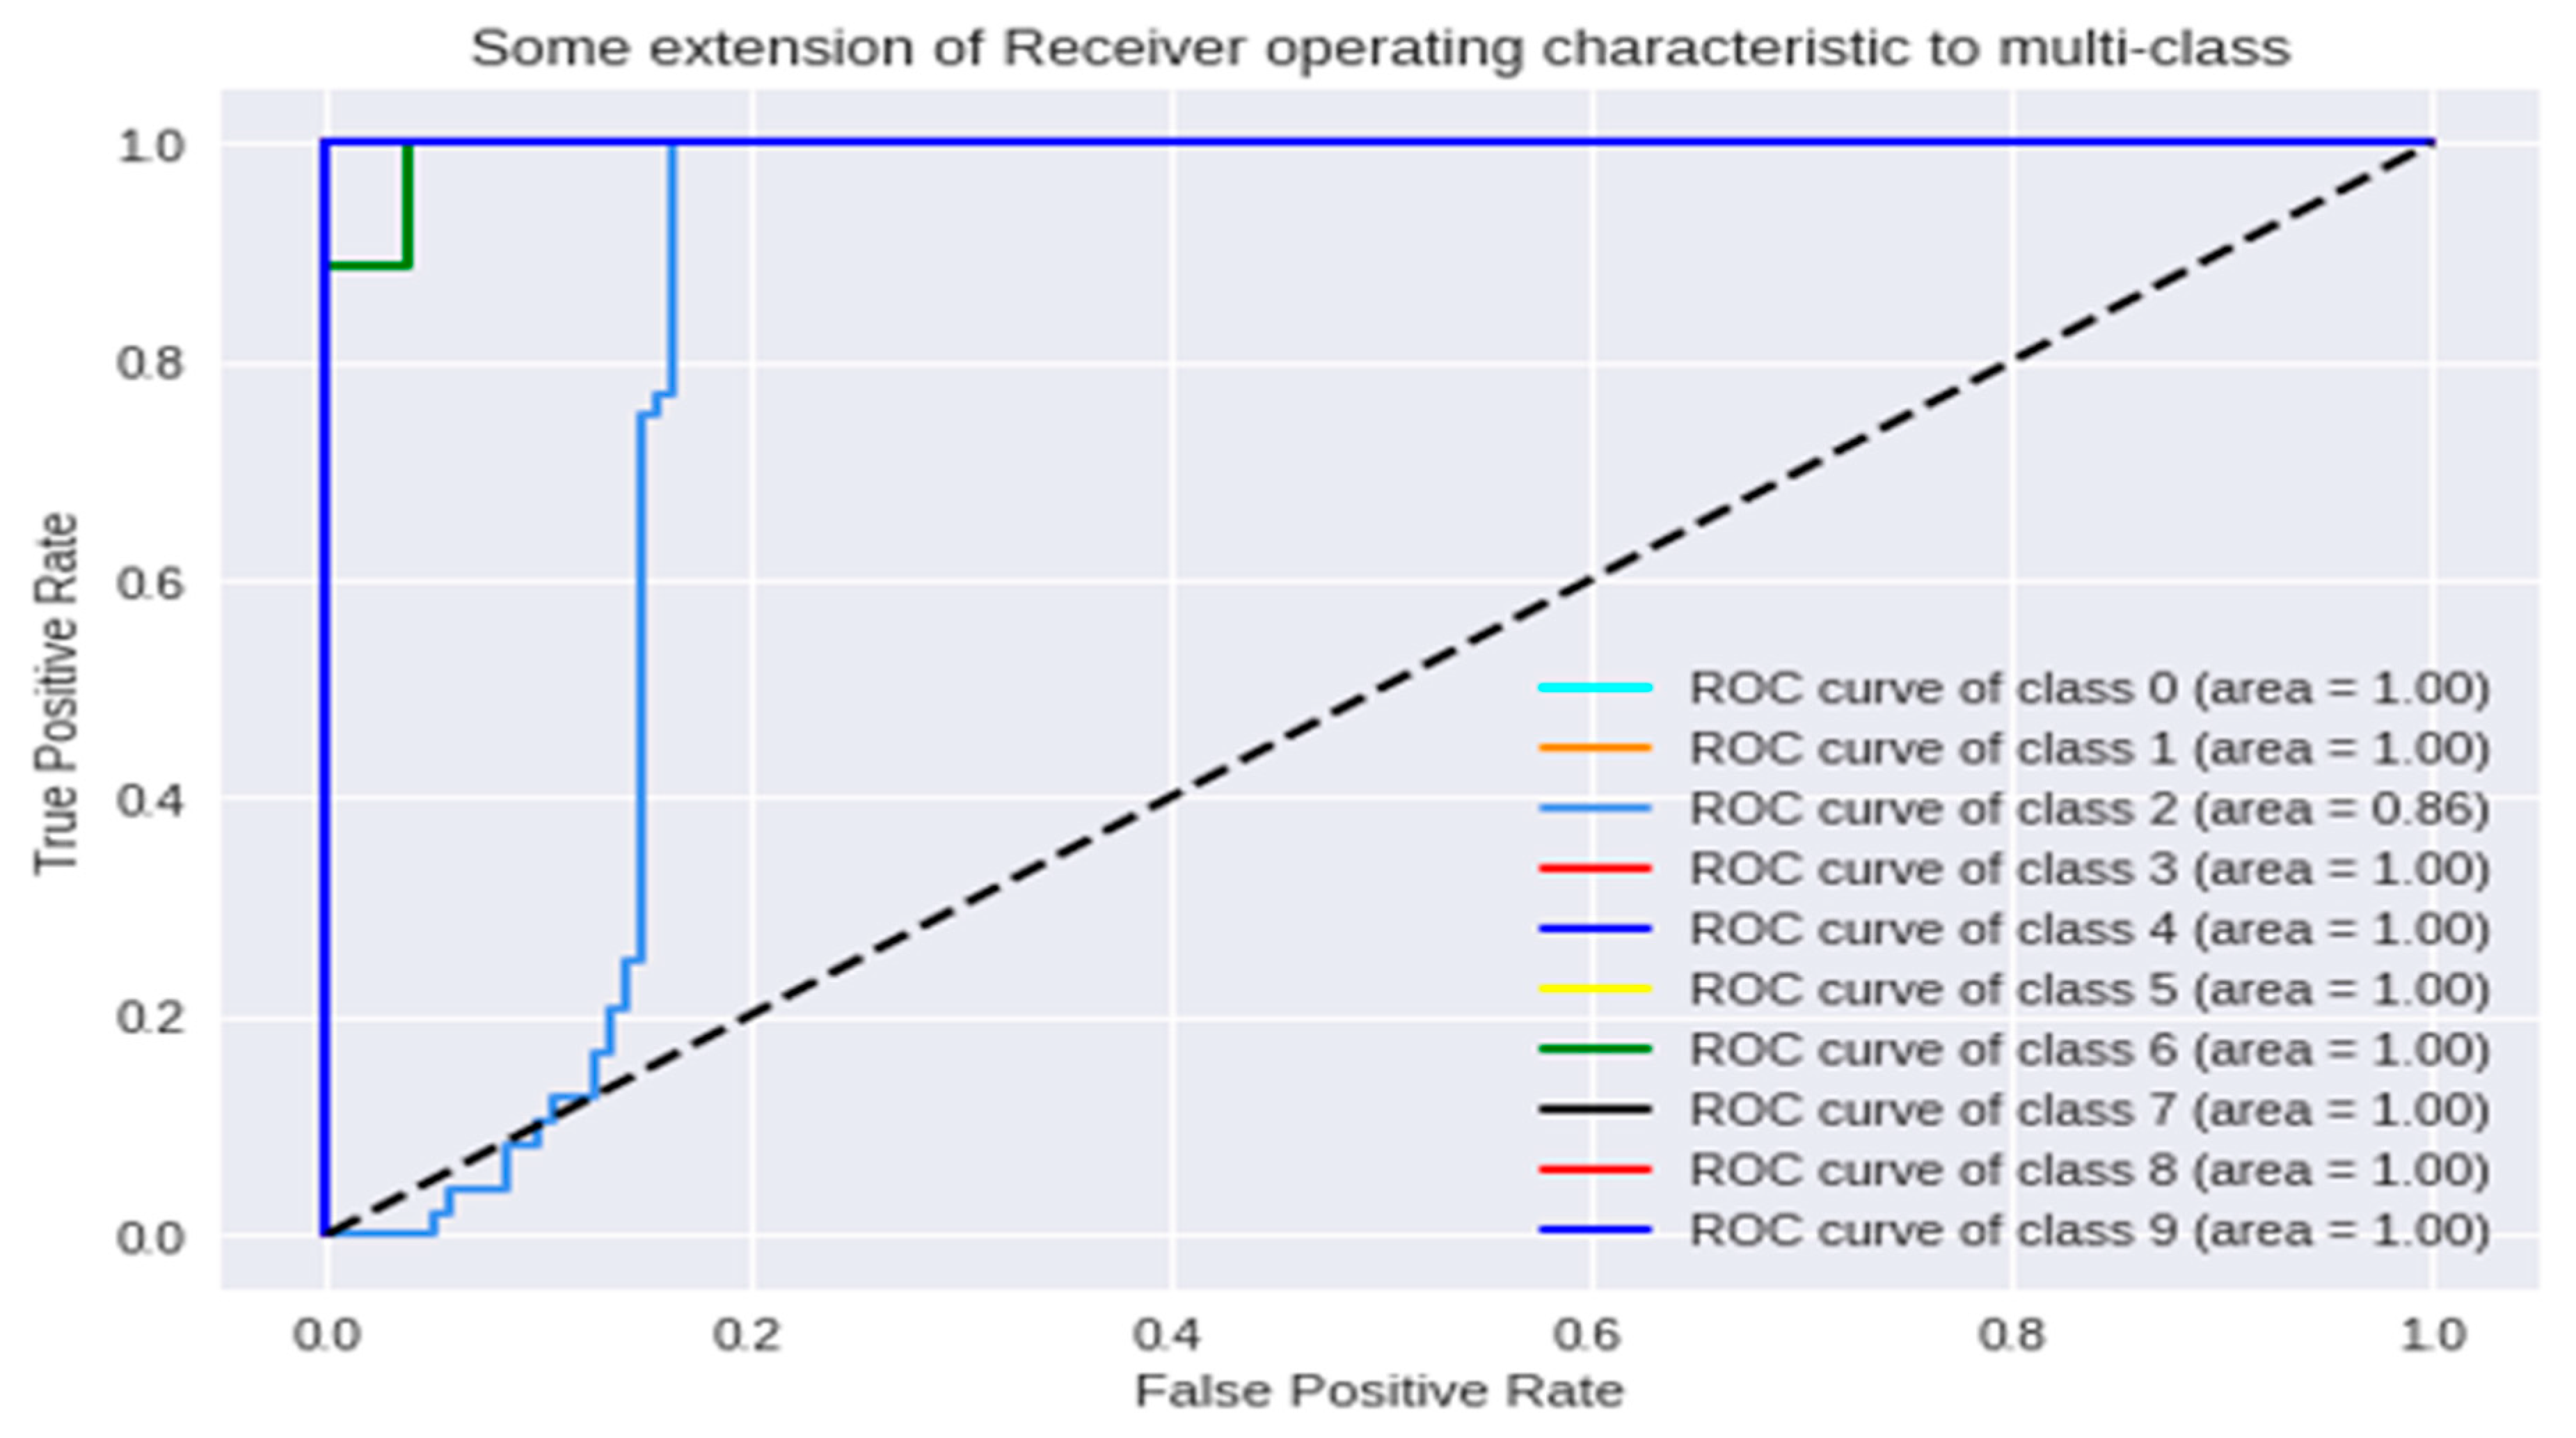
3.1. Analysis of the Graph Resulting from the ANN

Figure 4 shows how the graph of the ANN is built. In this graph, it is possible to observe how the nodes are distributed and how these interaction to the process data.

3.2. Training Stage Over CPU an GPGPU

The activation functions tanh and sigmoid were experimented with RELU (Rectified Linear Units), where the parameters LEARNING_RATE, TRAINING_EPOCHS, and HIDDEN_SIZE were varied, obtaining the results presented below for each function. Table 2 shows the parameters that varied in each experiment. The Figure 5, Figure 6 and Figure 7 show the correspond graphics.
The best values were obtained using the tanh activation function in the other step, the Table 3 show the values ant the Figure 8, Figure 9 and Figure 10 show the correspond graphics.

4. Discussion

4.1. Conclusions for the Tanh Activation Function

We found that the ANN showed the most optimal behavior under the tanh activation function for the training stage. The reference value was 0.879 for the precision test that varied the training epoch and hidden size parameters. Precision and cost behaviors were as expected, considering that the cost decreased and the precision increased for all the evaluations proposed under different parameters. Another relevant conclusion is that, according to the ROC analysis, the classes that are least likely to be identified under these ANN parameters are classes 2 and 6.

4.2. Conclusions About the Dataset

Regarding the dataset, we can conclude that, for future work, it is advisable to consider more CTX-M contigs. In this study, the 10 most representative groups were considered, yet some of the groups were not representative enough to be able to carry out a stratified cross validation. This was particularly true for the experimentation in the validation stage, in which 20% of the initial dataset was used for this validation. Regarding the dataset, we can conclude that more CTX-M contigs should be considered for future studies.

4.3. Perspective

In a future study, we propose to validate a more significant number of metagenomes corresponding to the geographical area of influence, aiming to support the design of public policies related to the prevention and detection of infectious diseases. To corroborate the final results more accurately, other types of metrics, especially histograms, would be considered, taking advantage of the fact that they can be generated by the TensorBoard tool. Finally, we recommended to continue with the training process with other genes such as TEM, SHV, metalloenzymes, carbapenemases, so that this software can identify a higher number of infectious diseases with the same characteristics.

Author Contributions

Conceptualization: D.C., D.L.A., G.I. and C.D.F.; formal analysis: D.L.A., G.I.E., S.O.A. and C.D.F.; investigation: D.C.; methodology: D.C.; software: S.O.A., R.T.S. and C.D.F.; supervision: D.L.A. and G.I.; writing–original draft: D.C.; writing—review and editing: D.L.A., G.I., S.O.A. and C.D.F.

Funding

This research was funded by Universidad Autónoma de Manizales.

Conflicts of Interest

The authors declare no conflict of interest.

References

  1. Hoff, K.J.; Tech, M.; Lingner, T.; Daniel, R.; Morgenstern, B.; Meinicke, P. Gene prediction in metagenomic fragments: A large scale machine learning approach. BMC Bioinform. 2008, 9, 217. [Google Scholar] [CrossRef] [PubMed]
  2. Rasheed, Z.; Rangwala, H. Metagenomic Taxonomic Classification Using Extreme Learning Machines. J. Bioinform. Comput. Biol. 2012, 10, 1250015. [Google Scholar] [CrossRef] [PubMed]
  3. Soueidan, H.; Nikolski, M. Machine learning for metagenomics: Methods and tools. arXiv 2015, arXiv:1510.06621. [Google Scholar] [CrossRef]
  4. Cantón, R.; González-Alba, J.M.; Galán, J.C. CTX-M enzymes: origin and diffusion. Front. Microbiol. 2012, 3, 110. [Google Scholar] [CrossRef] [PubMed]
  5. Salazar, J.D.; Loaiza, S.; Ibáñez, J.P.; Hernandez, J.S. Primera mirada a la resistencia antibiótica de la ciudad de Manizales. Segundo Simposio Regional de Resistencia Antibiótica–Eje Cafetero, 2018. Universidad de Manizales, noviembre 3 de 2018.
  6. Thomas, T.; Gilbert, J.; Meyer, F. Metagenomics—A guide from sampling to data analysis. Microb. Inform. Exp. 2012, 2, 3. [Google Scholar] [CrossRef] [PubMed]
  7. Johnson, J.; Jain, K.; Madamwar, D. 2—Functional Metagenomics: Exploring Nature’s Gold Mine. In Current Developments in Biotechnology and Bioengineering; Elsevier: Amsterdam, The Netherlands, 2017; pp. 27–43. ISBN 9780444636676. Available online: http://www.sciencedirect.com/science/article/pii/B978044463667600002X (accessed on 11 October 2018).
  8. Ma, C.; Zhang, H.H.; Wang, X. Machine learning for Big Data analytics in plants. Trends Plant Sci. 2014, 19, 798–808. [Google Scholar] [CrossRef] [PubMed]
  9. Mitchell, T.M. The Discipline of Machine Learning. CMU-ML-06-108; School of Computer Science, Carnegie Mellon University: Pittsburgh, PA, USA, 2006. [Google Scholar]
  10. Vervier, K.; Mahé, P.; Tournoud, M.; Veyrieras, J.B.; Vert, J.P. Large-scale Machine Learning for Metagenomics Sequence Classication. Bioinformatics 2015, 32, 1023–1032. [Google Scholar] [CrossRef] [PubMed]
  11. Lu, P.; Abedi, V.; Mei, Y.; Hontecillas, R.; Philipson, C.; Hoops, S.; Carbo, A.; Bassaganya-Riera, J. Emerging Trends in Computational Biology, Bioinformatics, and Systems Biology; Elsevier: Amsterdam, The Netherlands, 2015; ISBN 9780128025086. [Google Scholar]
  12. Nuñez, A. Anábioimutendifetide blaCTX-M. 2016. [Google Scholar]
  13. Krachunov, M.; Sokolova, M.; Simeonova, V.; Nisheva, M.; Avdjieva, I.; Vassilev, D. Quality of Different Machine Learning Models In Error Discovery For Parallel Genome Sequencing. Comptes Rendus De L Academie Bulgare Des Sciences 2017, 71, 922–929. [Google Scholar]
  14. Zeng, X.; Yeung, D.S. Sensitivity analysis of multilayer perceptron to input and weight perturbations. IEEE Trans. Neural Netw. 2001, 12, 1358–1366. [Google Scholar] [CrossRef] [PubMed]
Figure 1. Details of the bioinformatic pipeline.
Processes 07 00235 g001
Figure 2. Details of the computational pipeline.
Processes 07 00235 g002
Figure 3. Details of the architecture of ANN (Artificial Neural Network).
Processes 07 00235 g003
Figure 4. Details of the ANN (Artificial Neural Network) components and the cost, accuracy, optimization and model definition tensors.
Processes 07 00235 g004
Figure 5. Values of accuracy using tanh function over CPU (Central Process Unit).
Processes 07 00235 g005
Figure 6. Values of cost using tanh function over CPU (Central Process Unit).
Processes 07 00235 g006
Figure 7. ROC (Receiver operating characteristics) analysis for the tanh activation function over CPU (Central Process Unit).
Processes 07 00235 g007
Figure 8. Values of accuracy using tanh function over GPU (Graphics Process Unit).
Processes 07 00235 g008
Figure 9. Values of cost using tanh function over GPU (Graphics Process Unit).
Processes 07 00235 g009
Figure 10. ROC (Receiver operating characteristics) analysis for the tanh activation function over GPU (Graphics Process Unit).
Processes 07 00235 g010
Table 1. CTX-M group and correspond class selected for the study.
Group CTX-MClass
1.00
9.01
14.02
15.03
22.04
24.05
27.06
55.07
59.08
65.09
Table 2. Summary of target values during the training stage under CPU (Central Process Unit).
Activation FunctionLEARNING_RATETRAINING_EPOCHHIDDEN_SIZEInitial Cost ValueFinal Cost ValueAccuracy of Initial TrainingAccuracy of Final TrainingPrecision Test
Tanh0.0014002002.170.800.2600.9600.879
Sigmoid0.0014002002.191.610.0300.6800.698
RELU0.0013002002.190.000.11011
The best values were obtained using the tanh activation function in this experiment.
Table 3. Summary of target values during the training stage under GPU (Graphics Process Unit).
Activation FunctionLEARNING_RATETRAINING_EPOCHHIDDEN_SIZEInitial Cost ValueFinal Cost ValueAccuracy of Initial TrainingAccuracy of Final TrainingPrecision Test
Tanh0.0014002002.160.840.3800.9200.909
Sigmoid0.0014002002.201.670.4400.5600.628
RELU0.0013002001.901.000.59011

