Modeling of Future Electricity Generation and Emissions Assessment for Pakistan


 ,
,
Abstract
1. Introduction
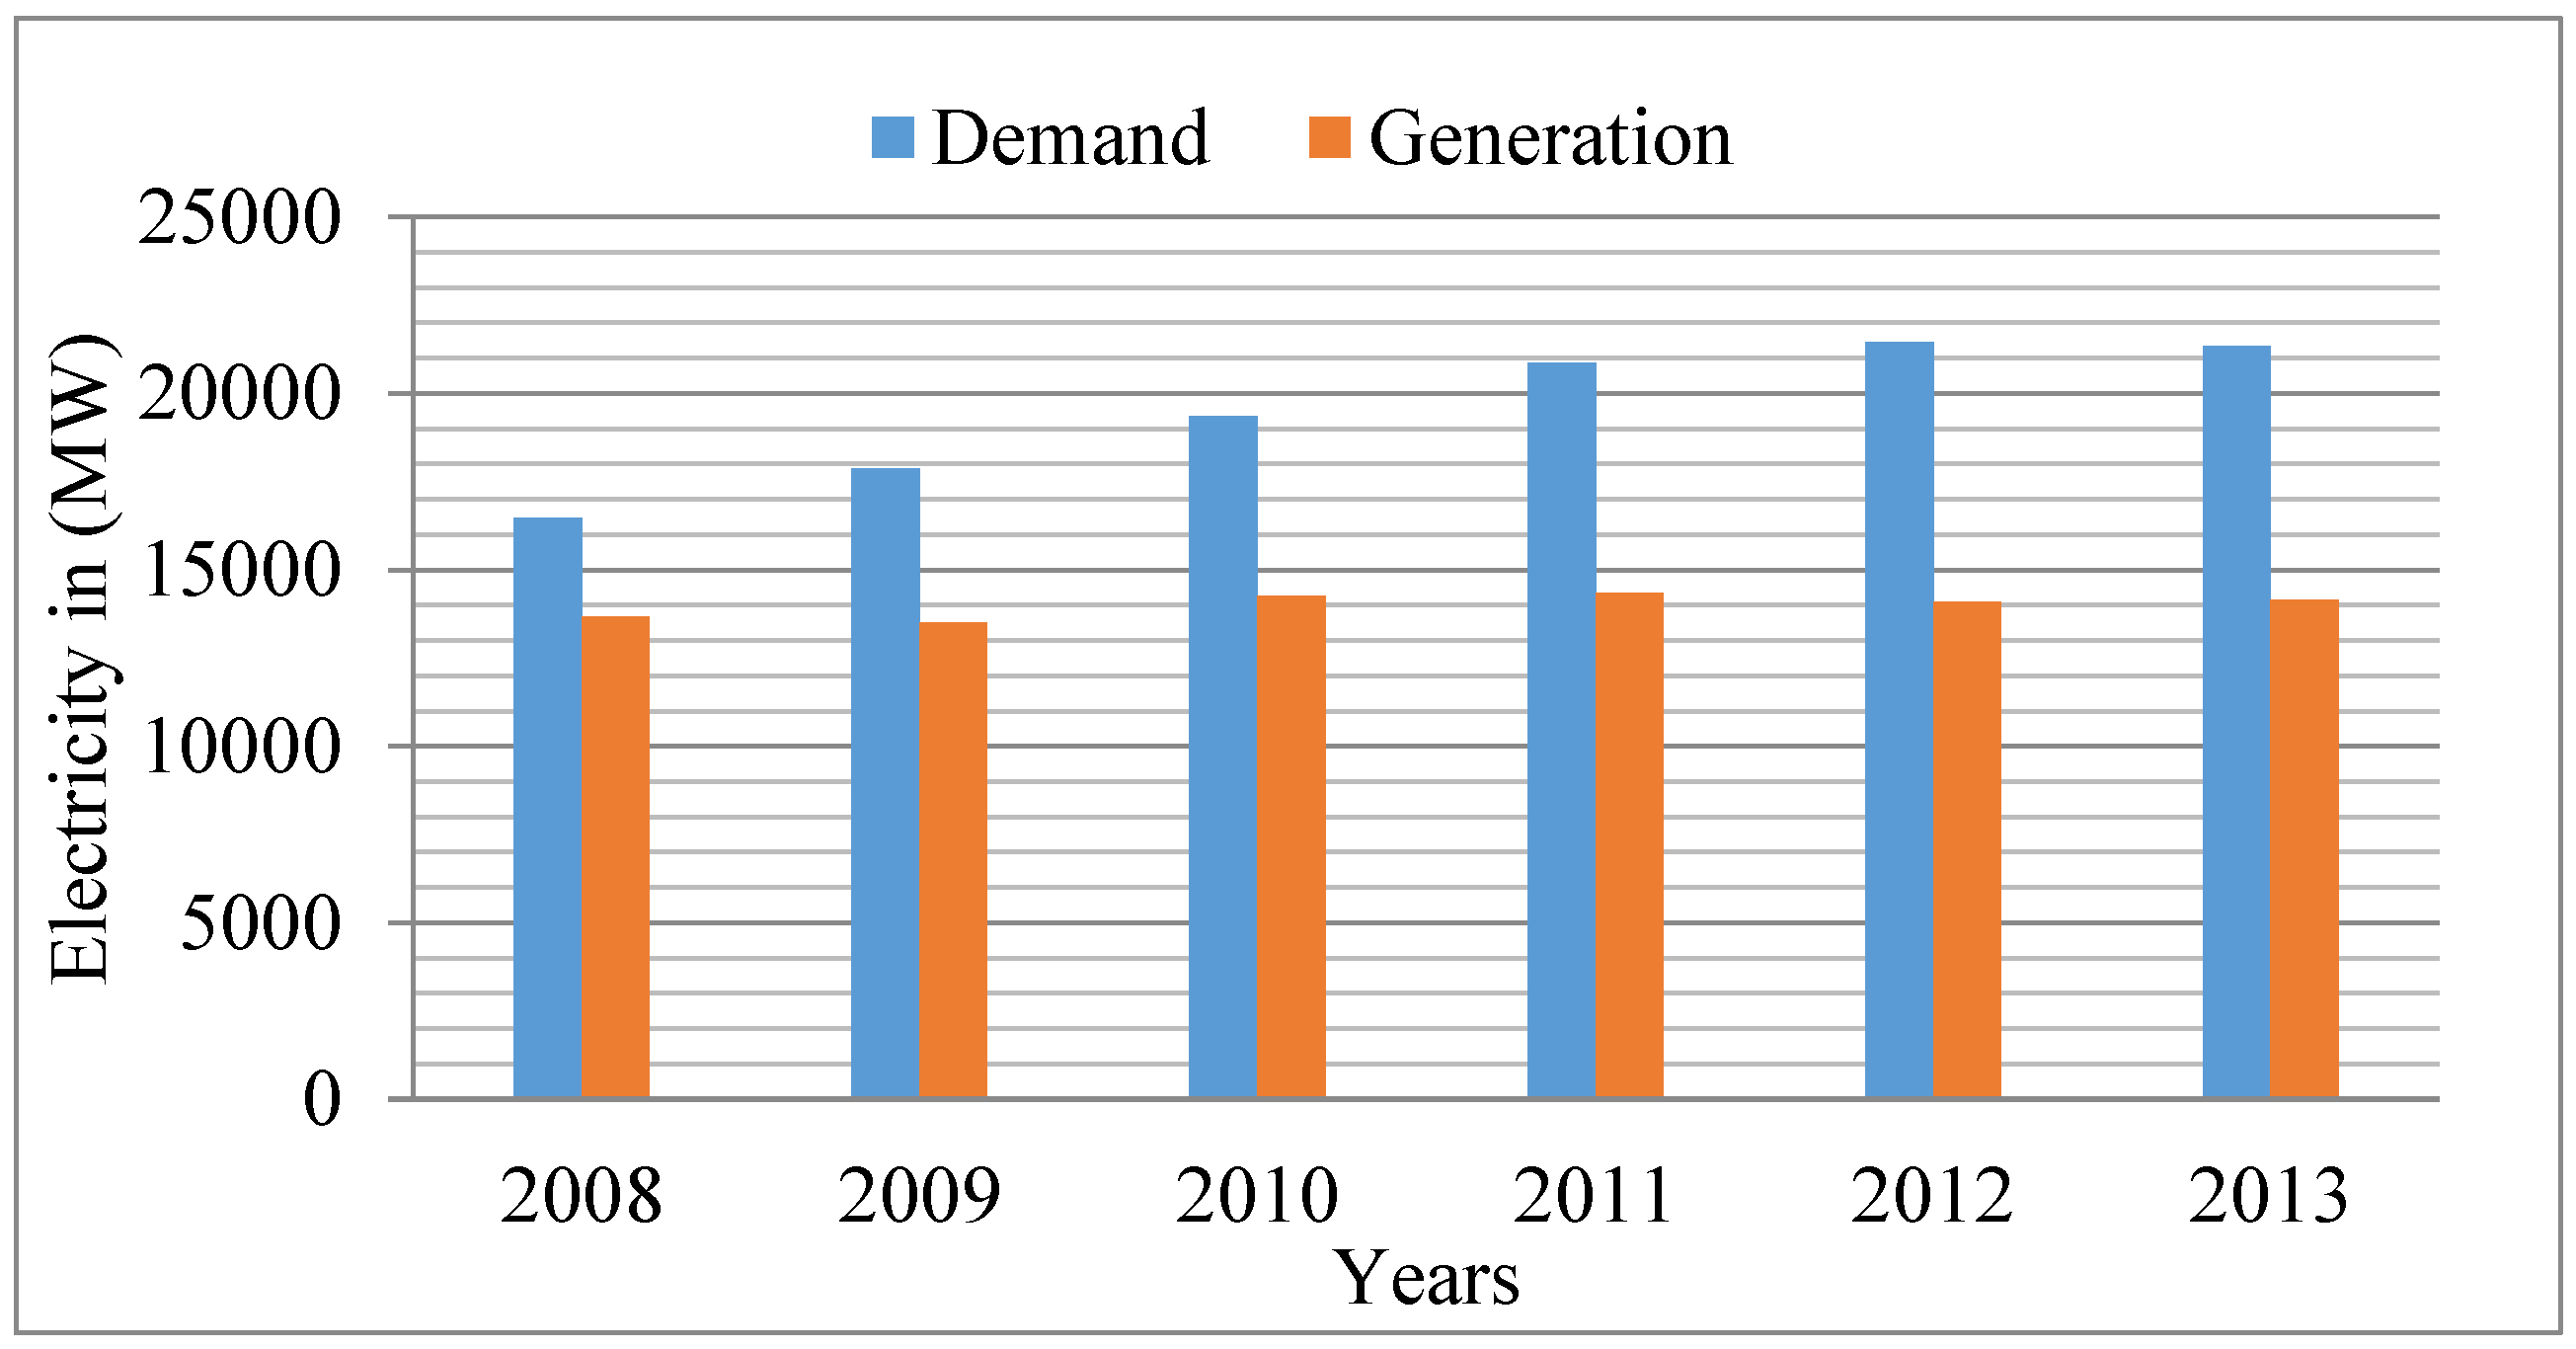
2. Electricity Supply and Demand Situation in Pakistan
3. Future Electricity Generation Plans
3.1. Hydroelectric Power Plants
3.2. Coal Power Plants
3.3. Oil and Natural Gas Power Plants
3.4. Nuclear Power Plants
3.5. Renewable Energy Power Plants
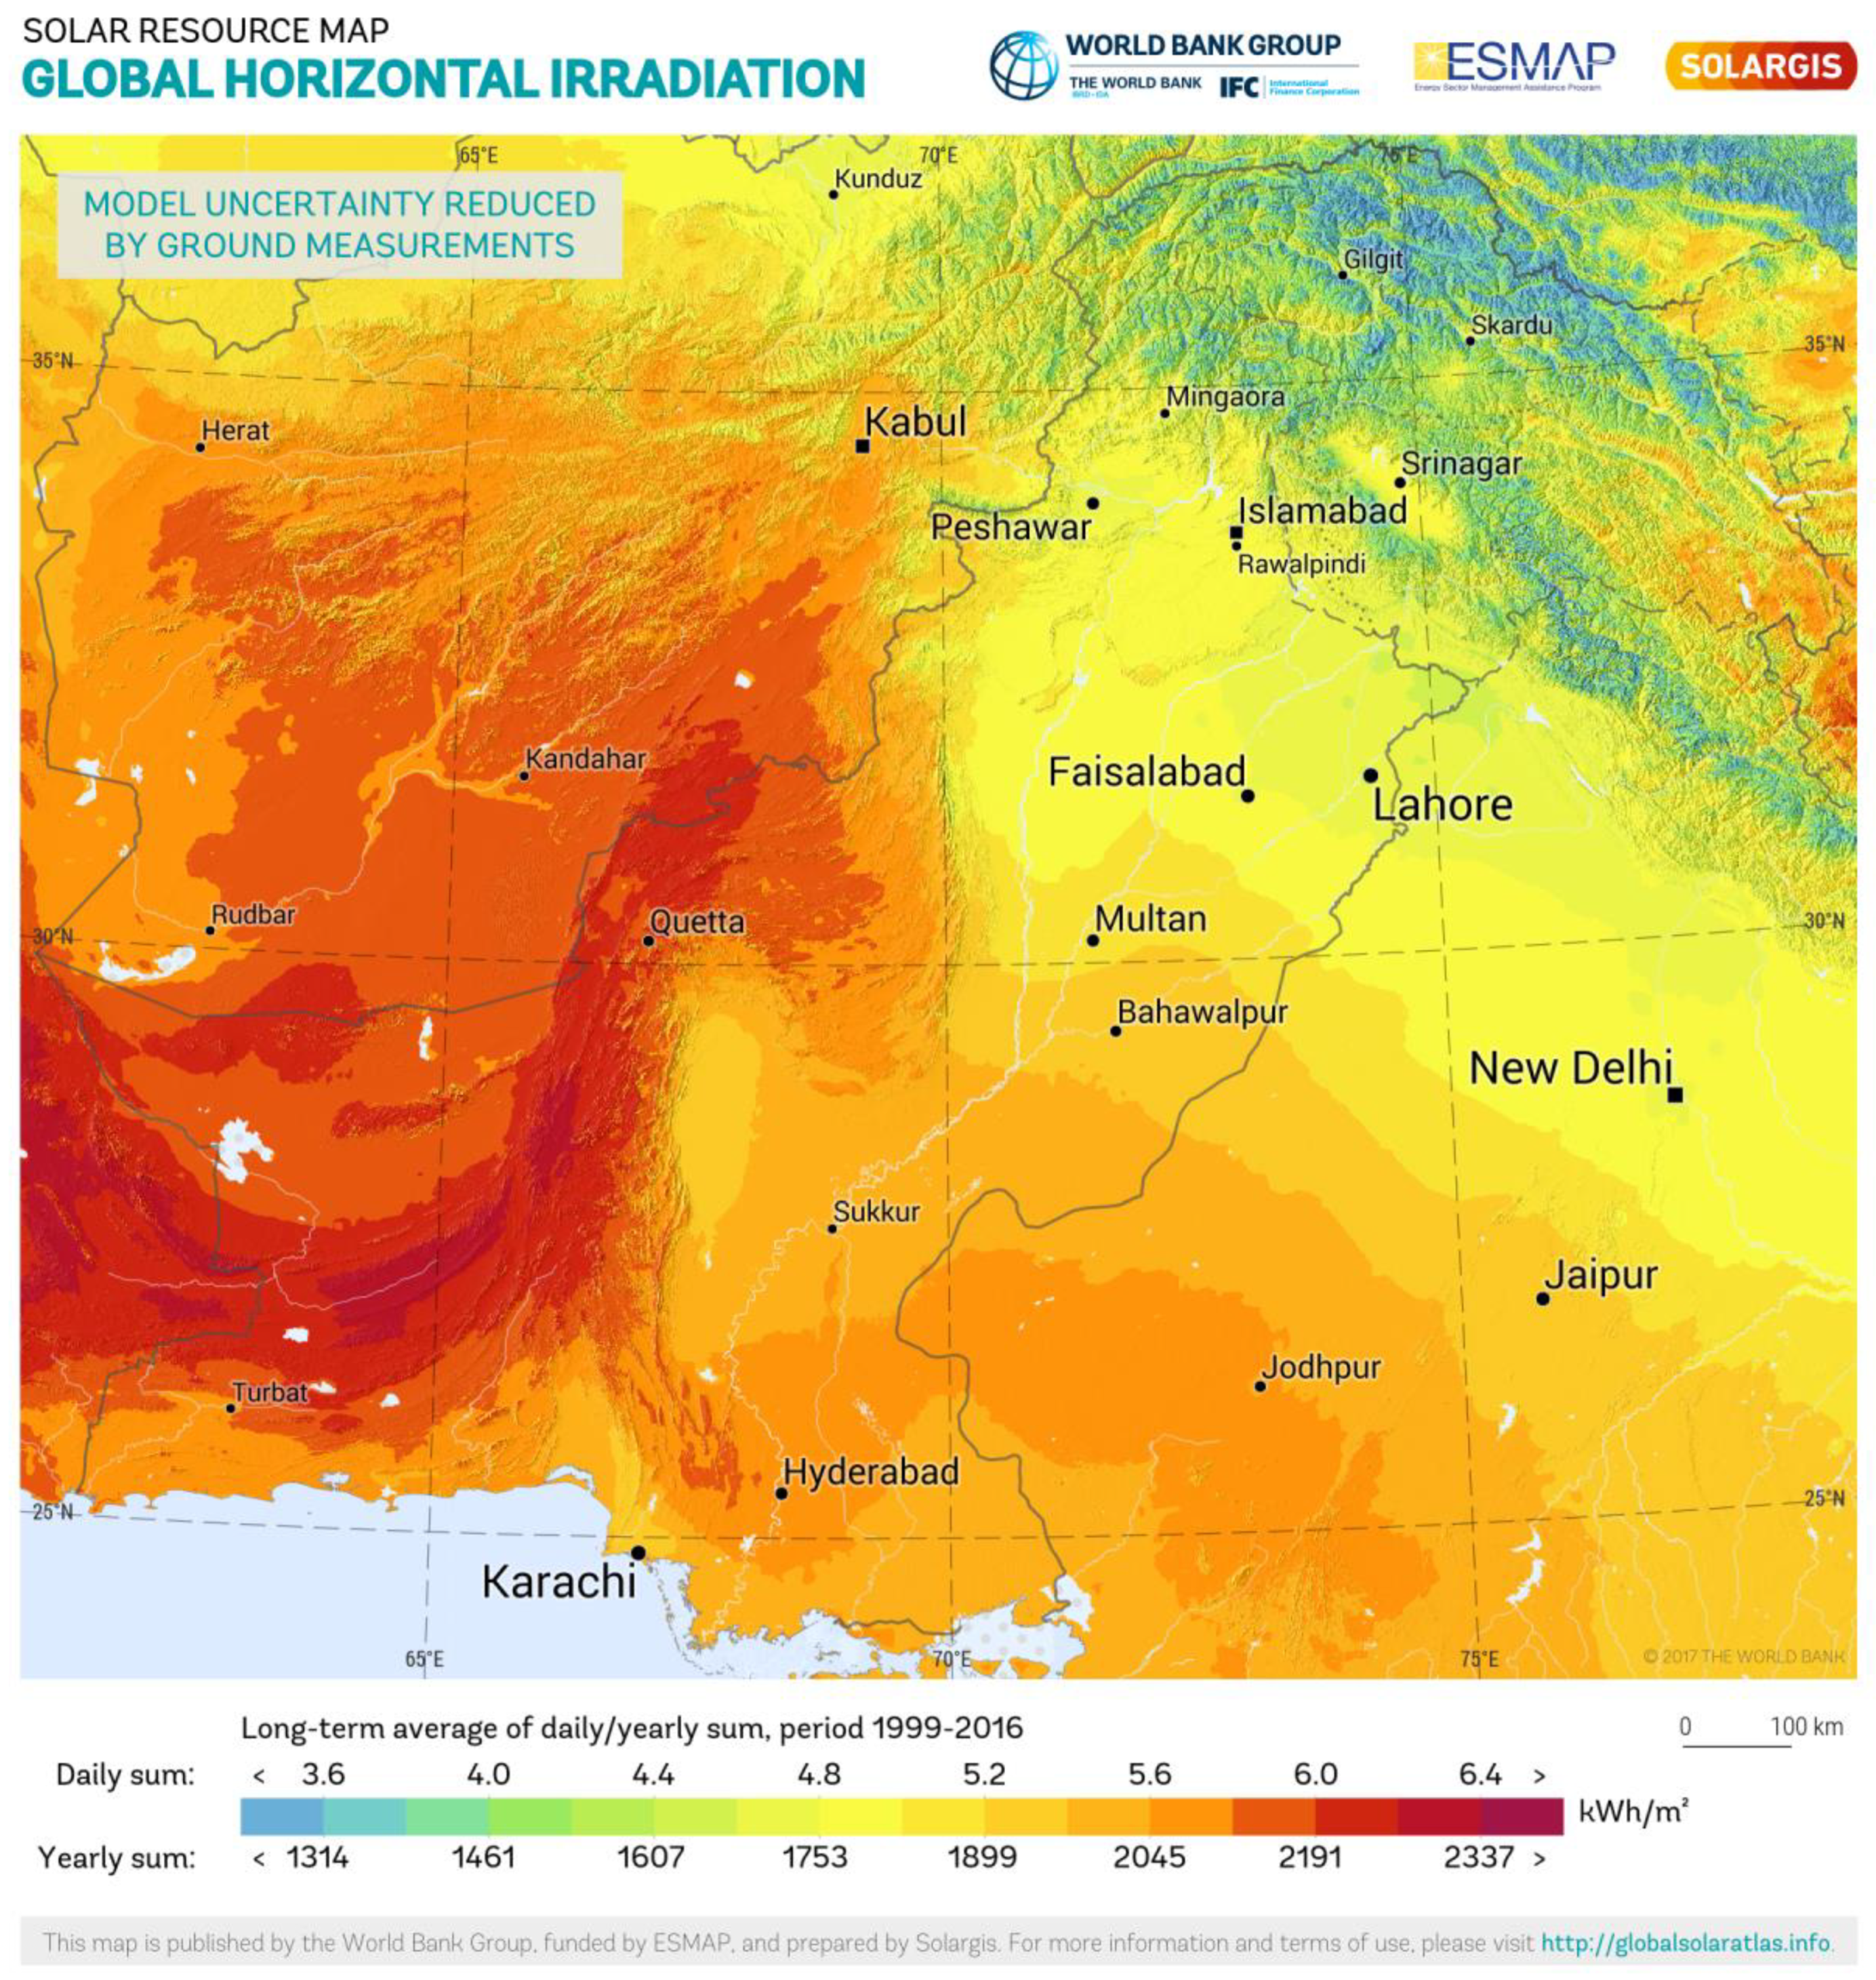
3.5.1. Solar PV Power Plants
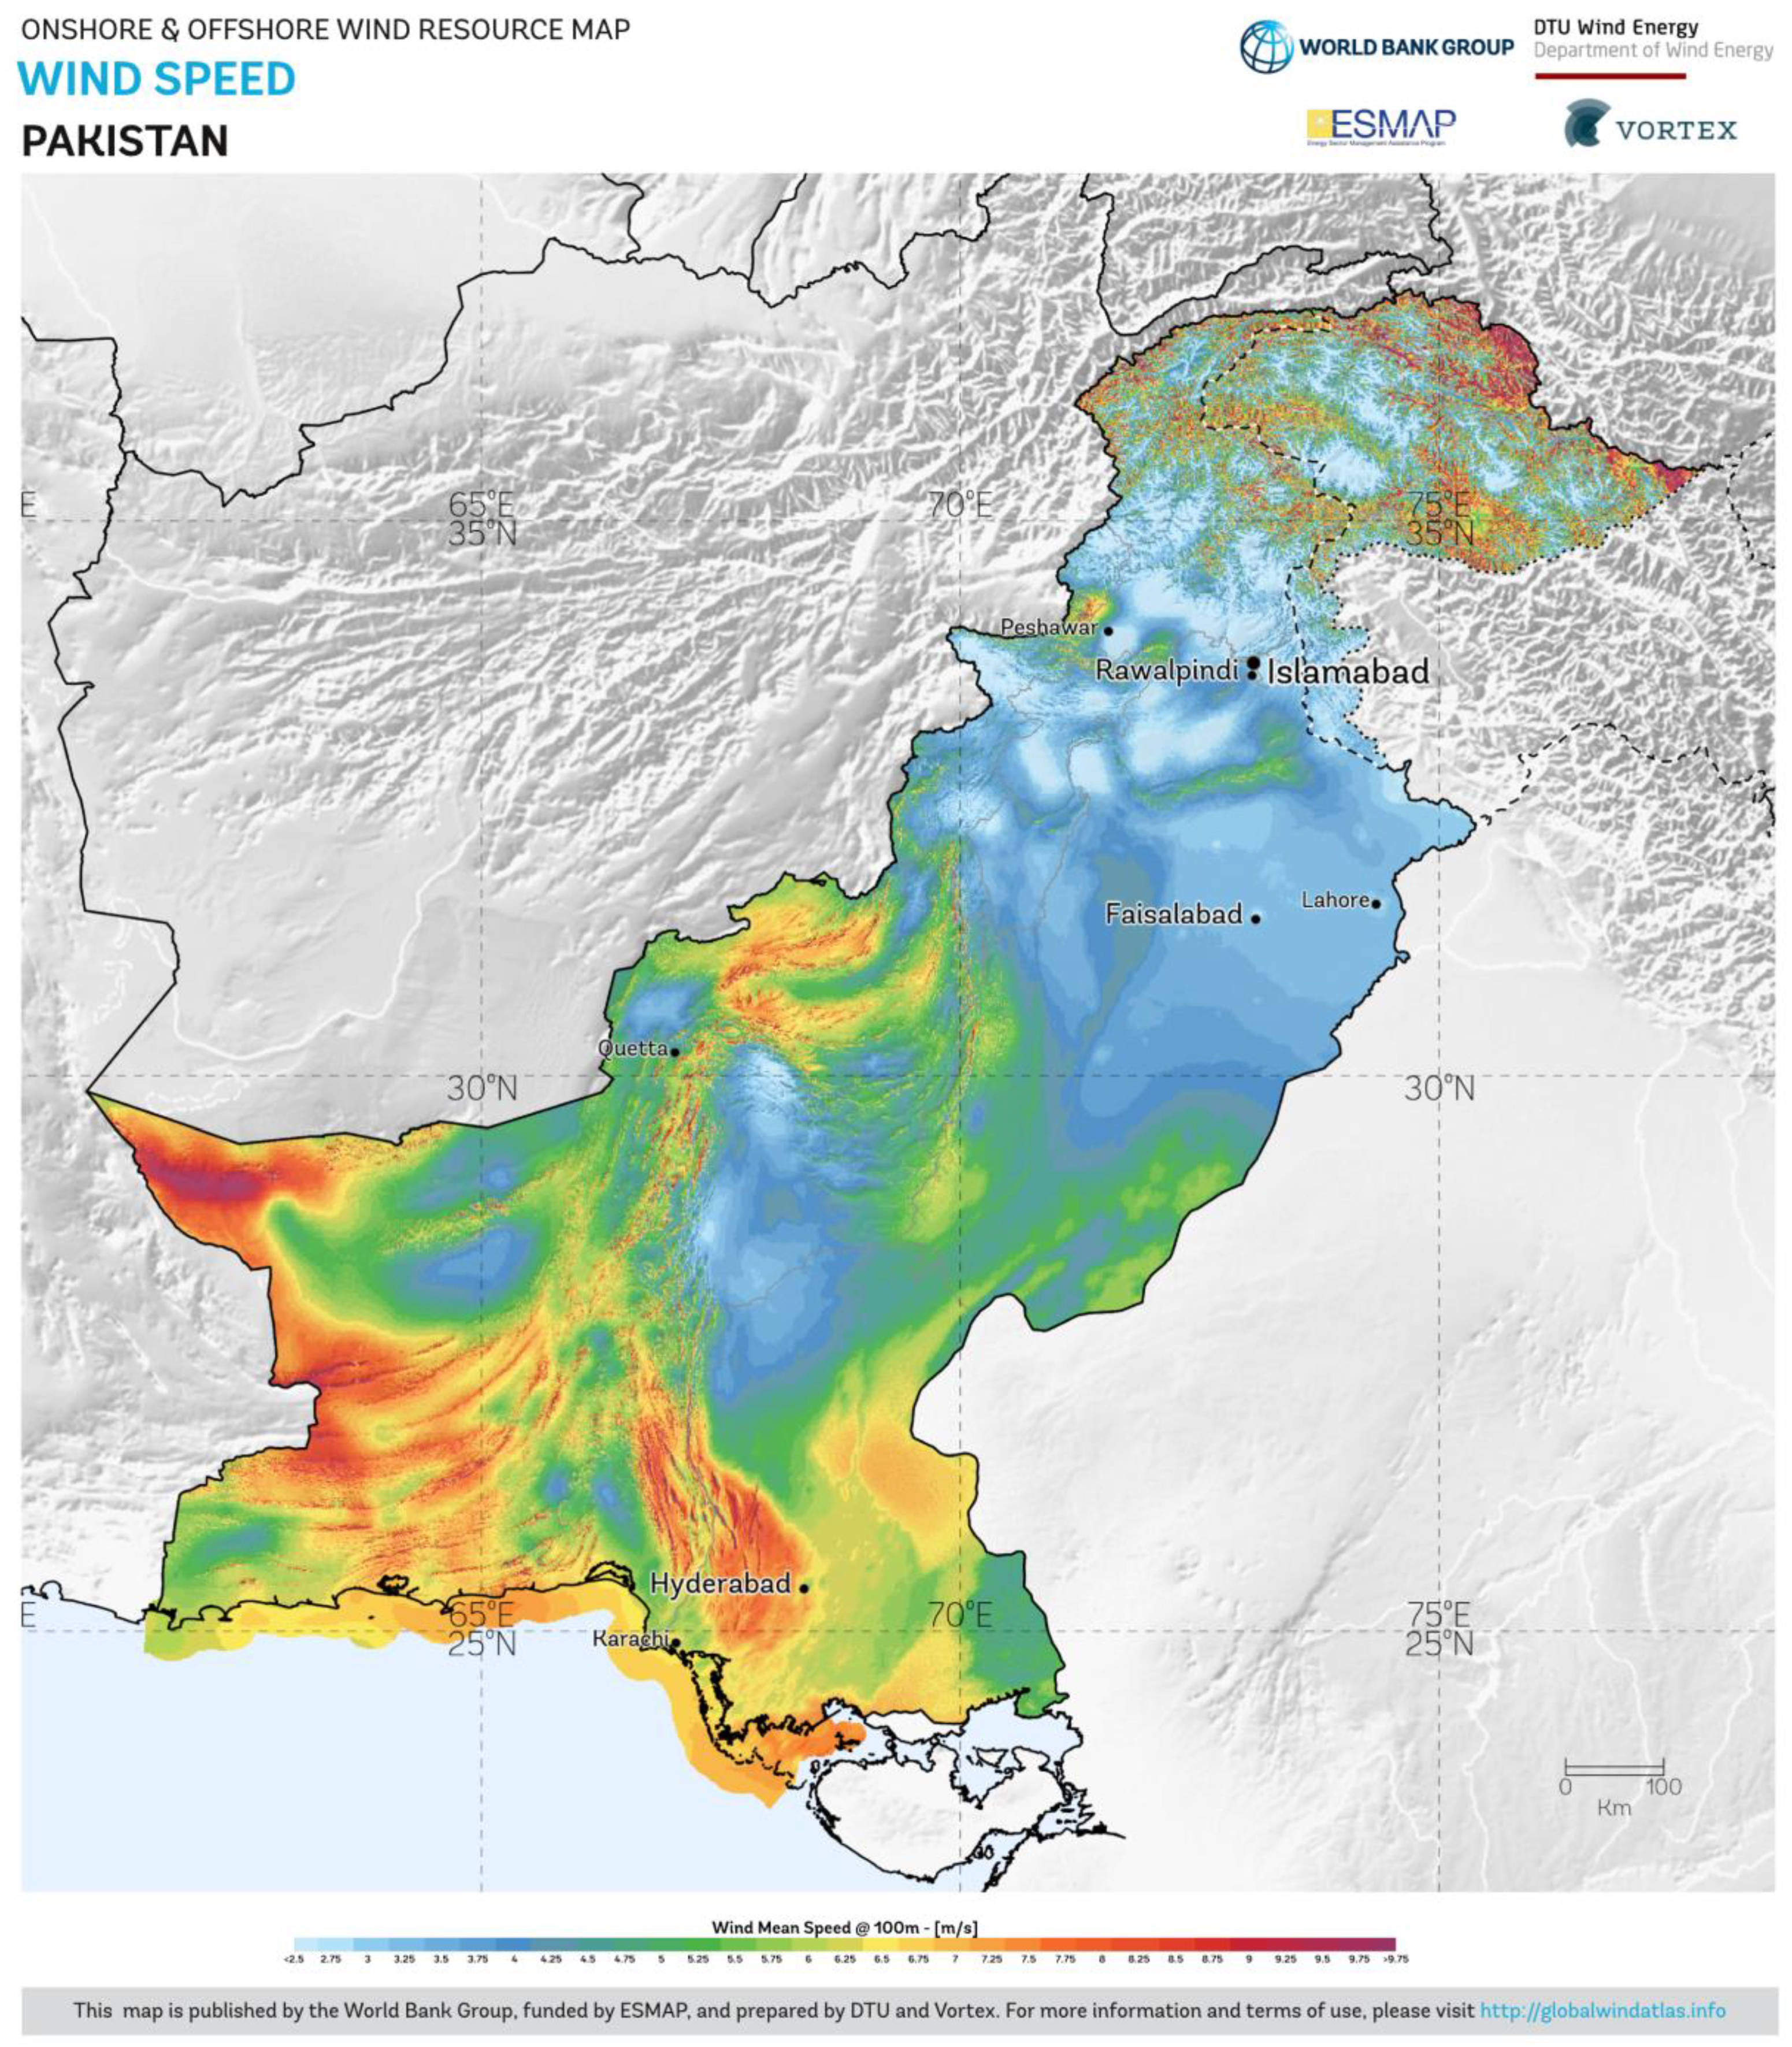
3.5.2. Wind Power Plants
3.5.3. Biomass Power Plants
4. Methodology
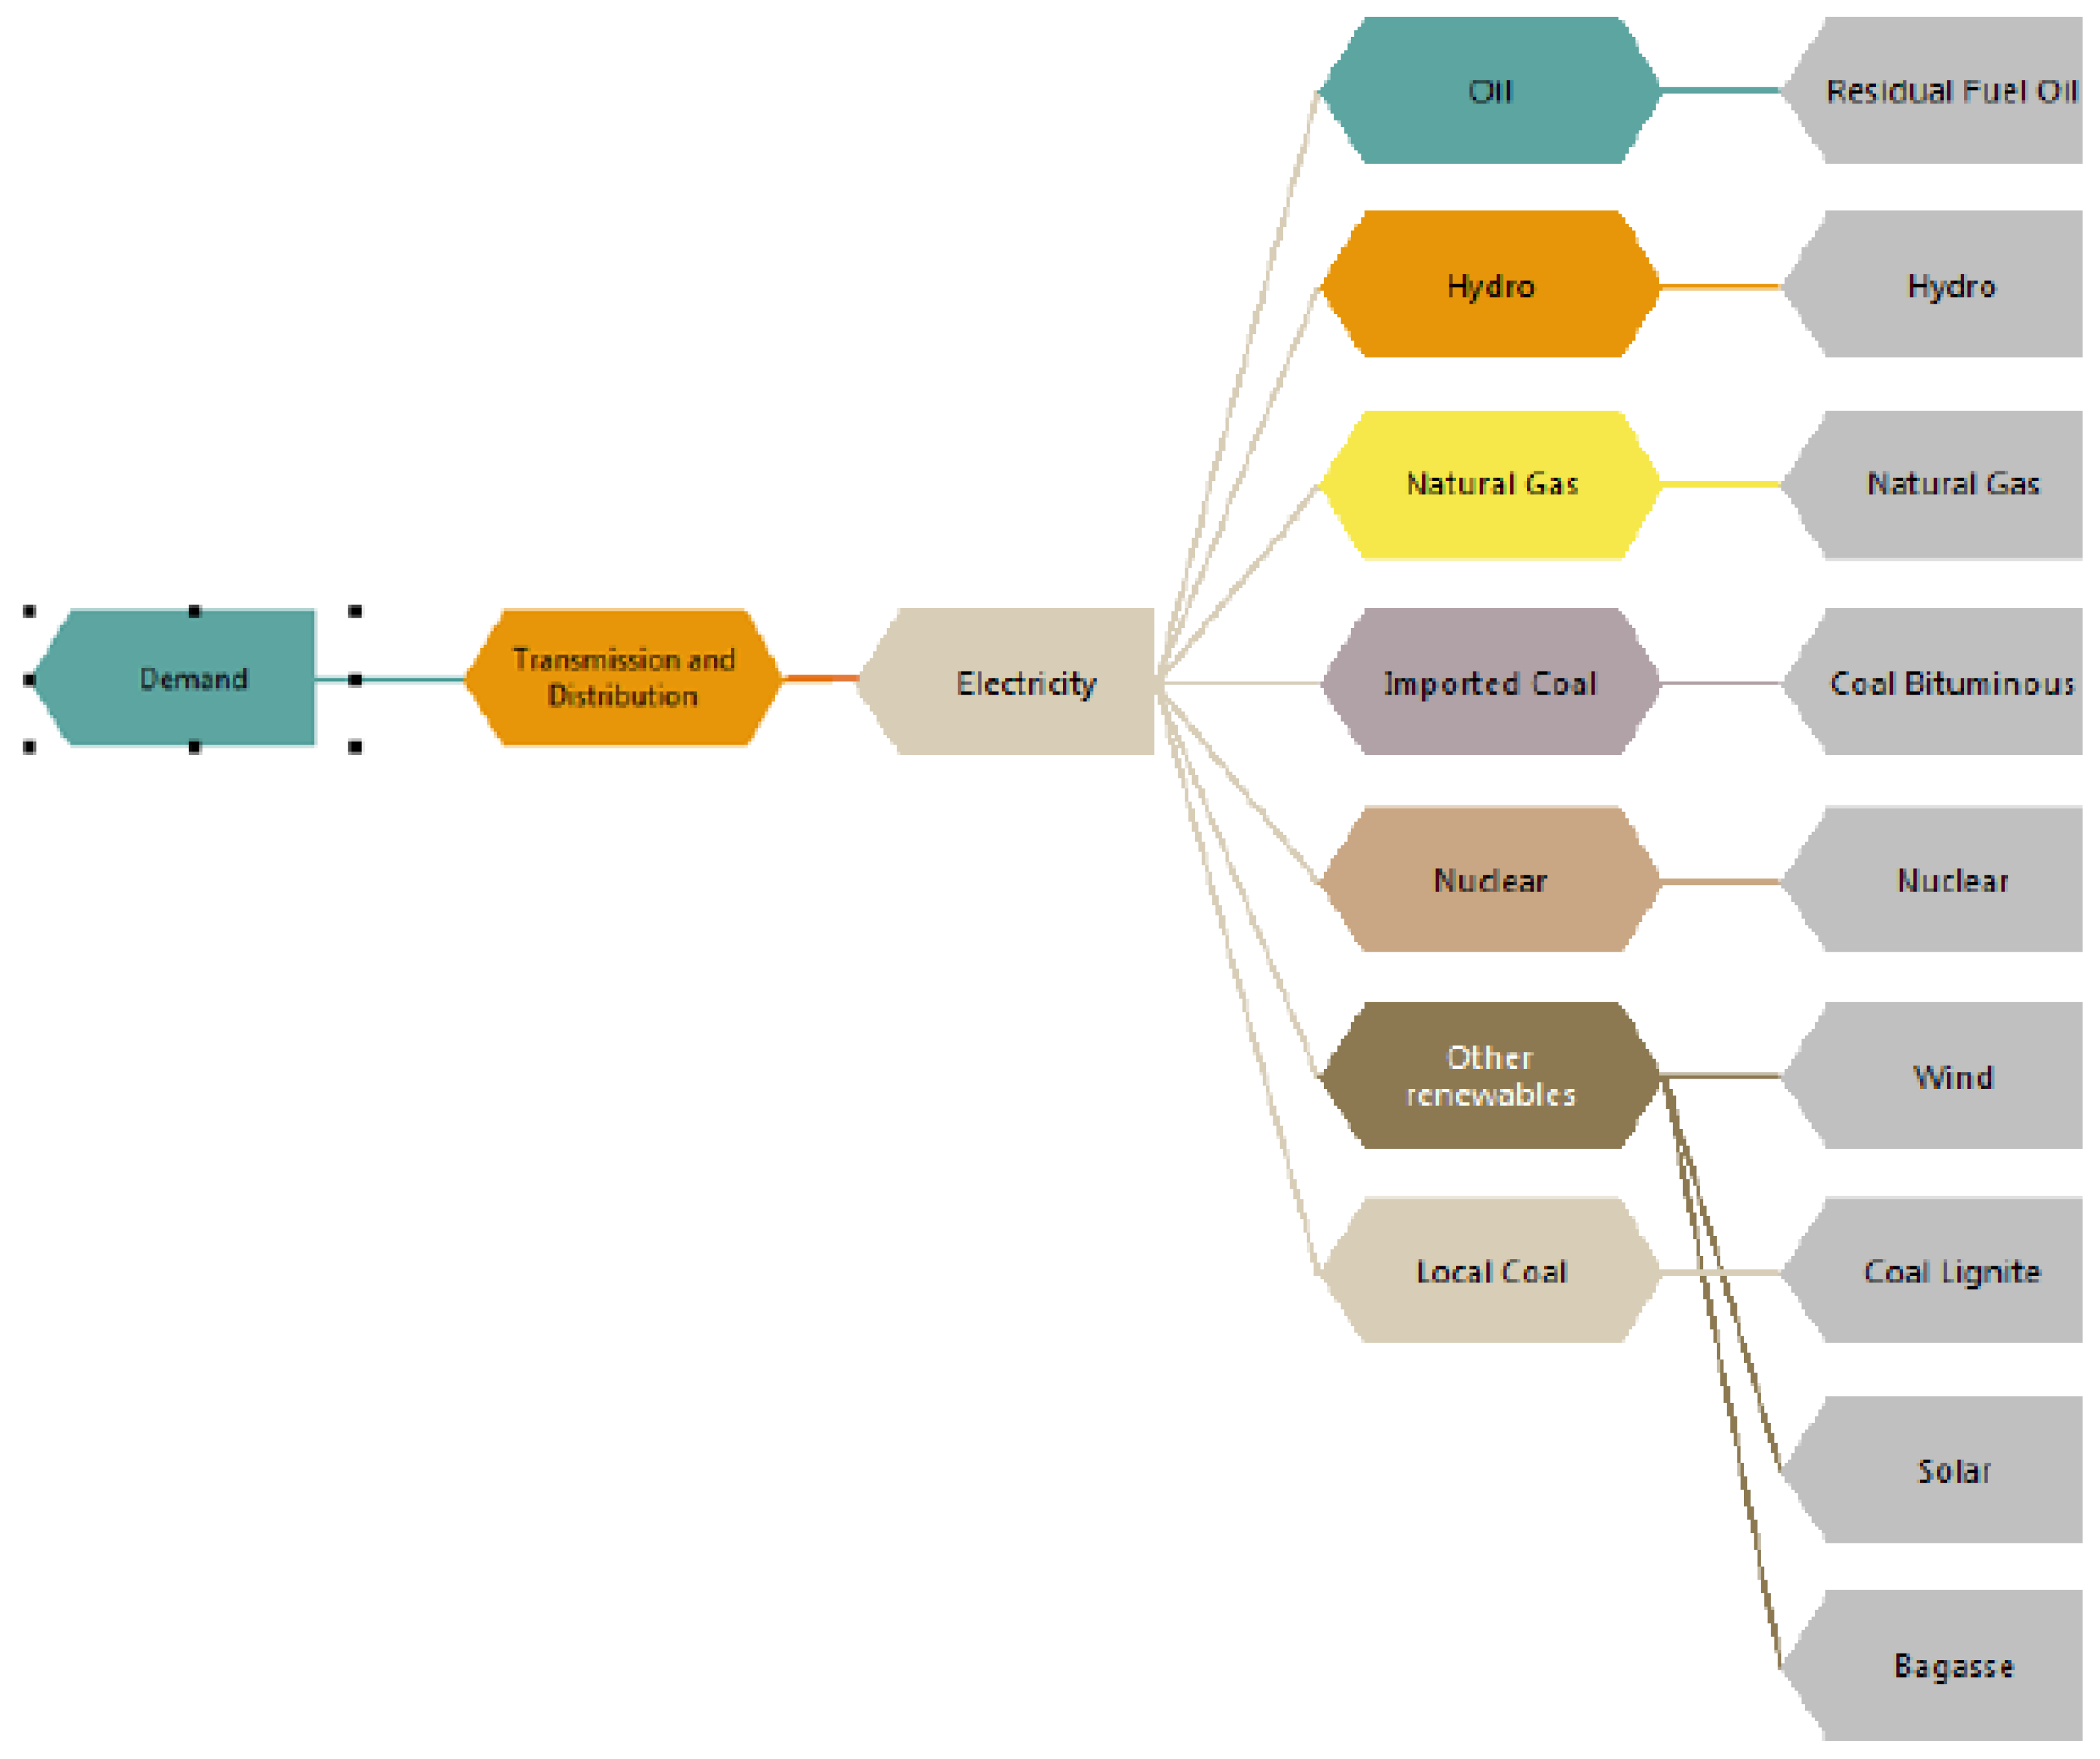
4.1. LEAP Energy Model Framework Development
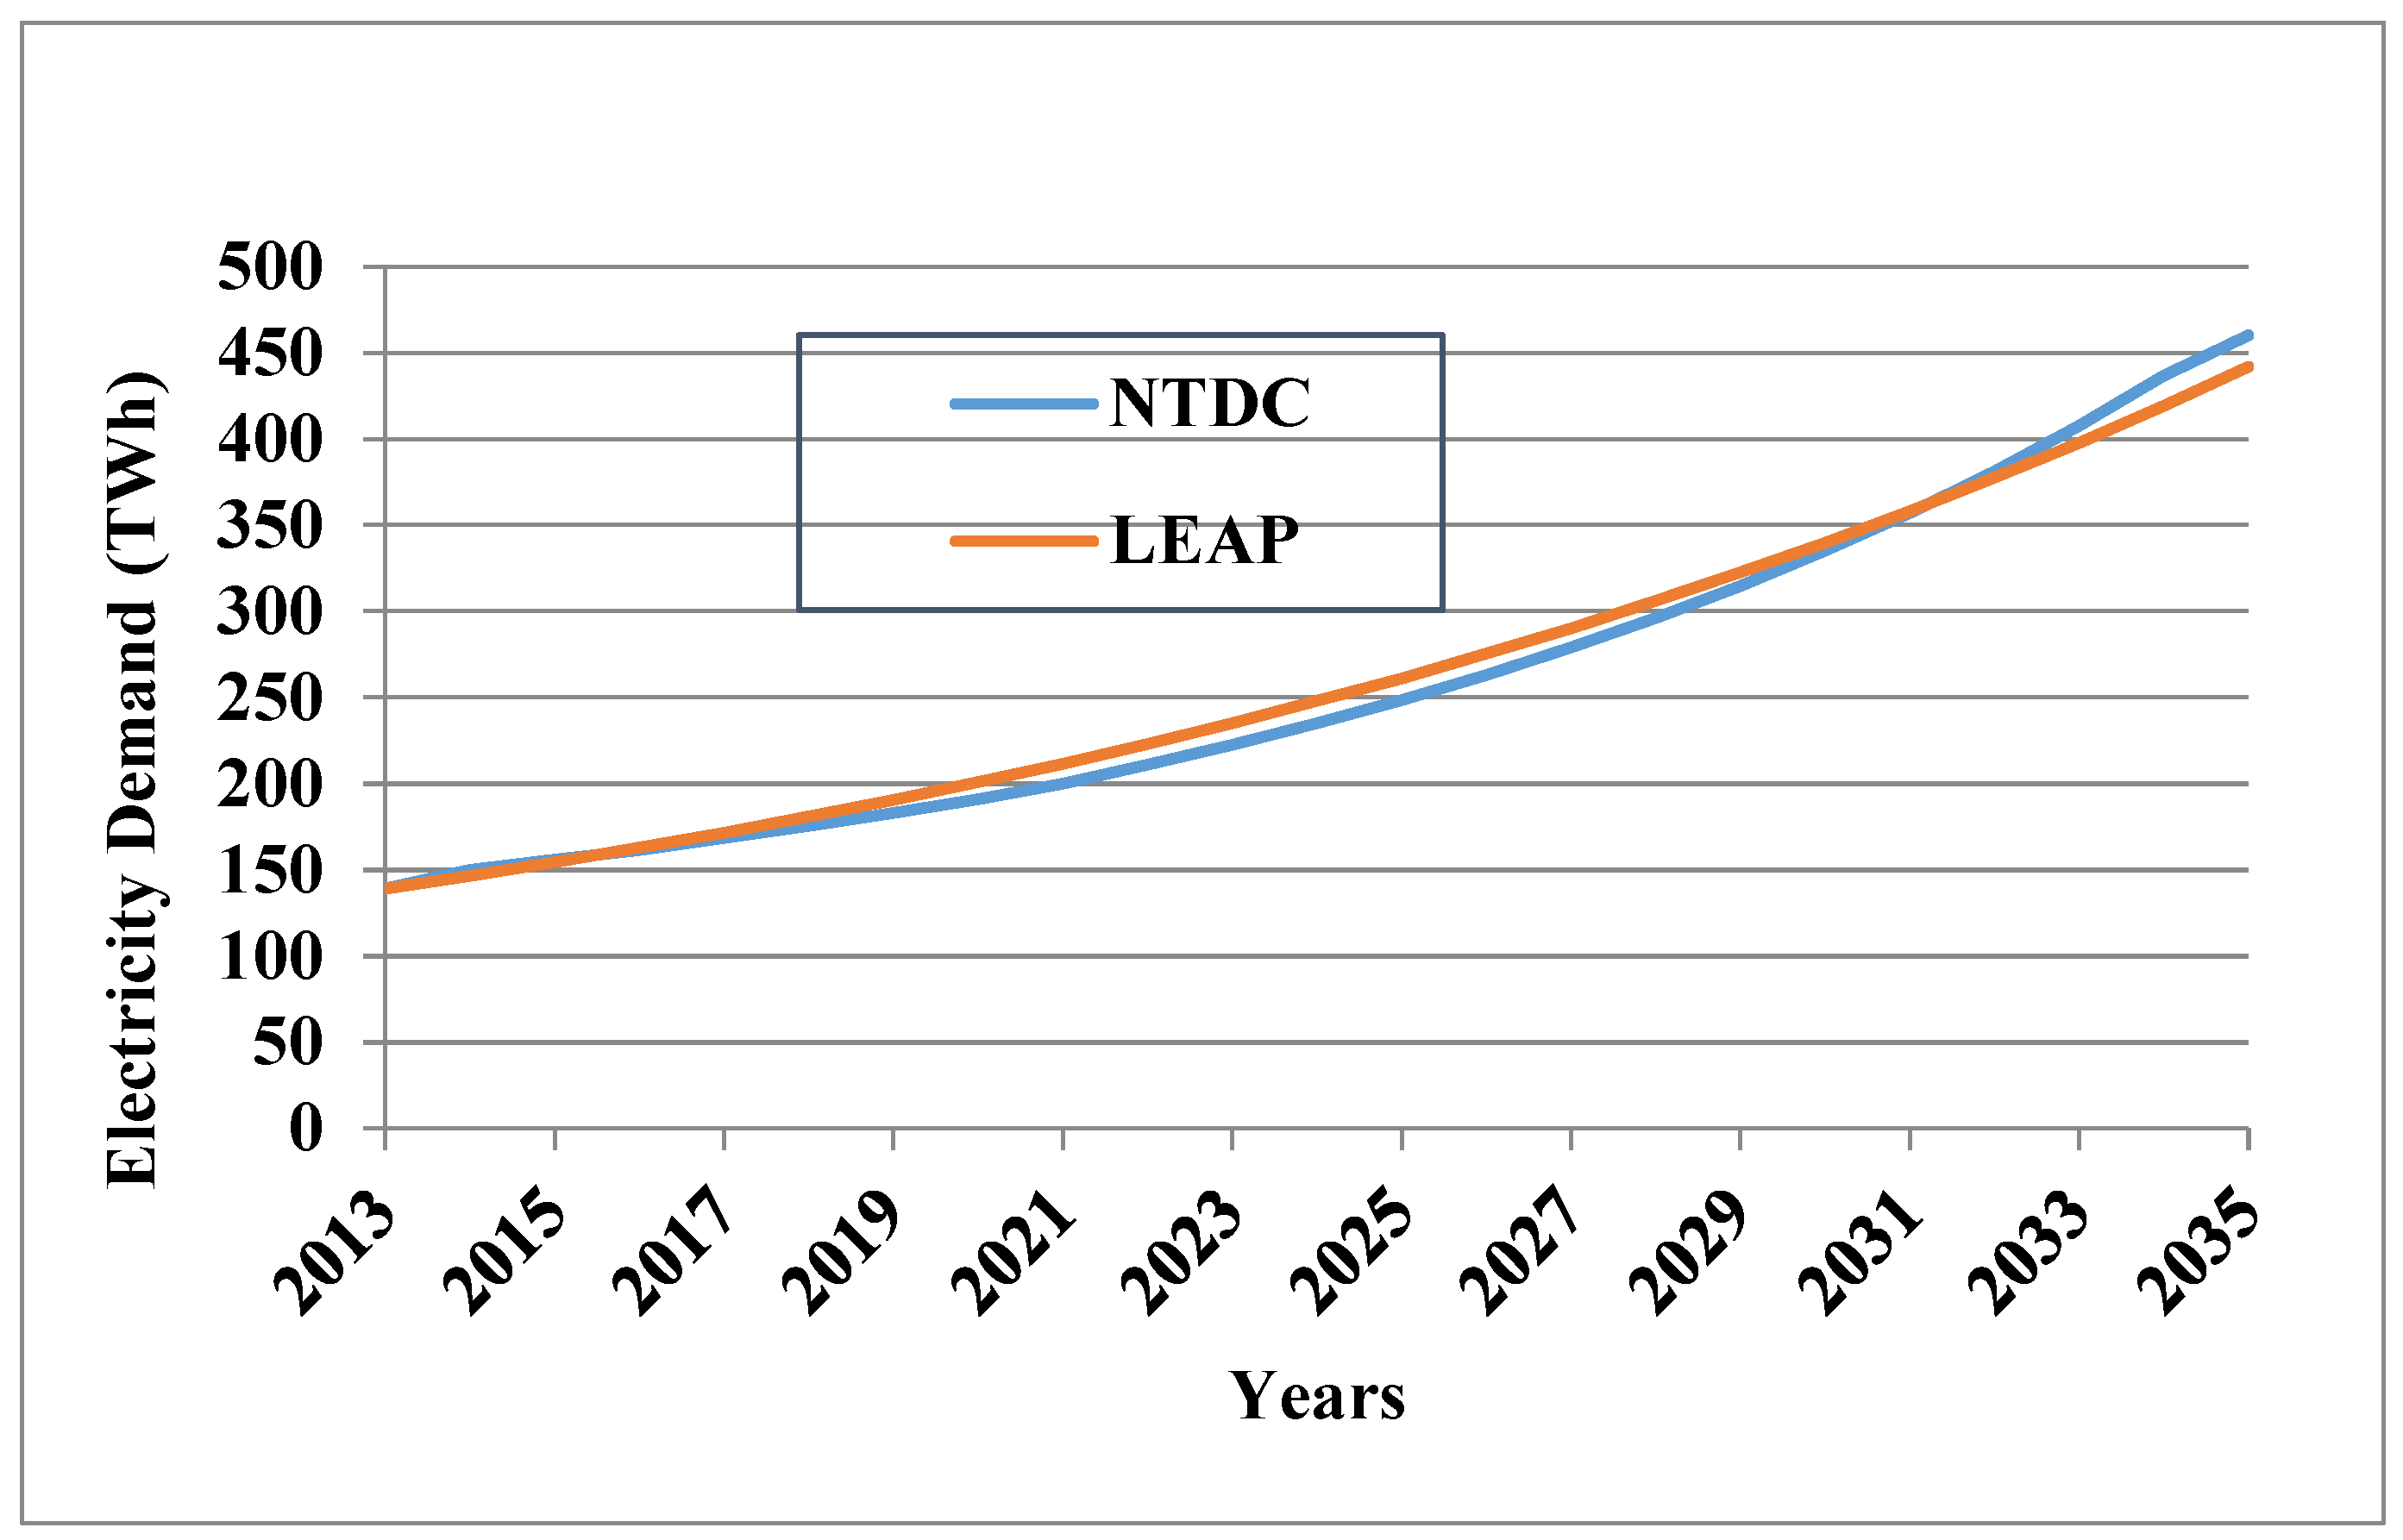
4.2. Electricity Demand Forecast
4.3. Basic Assumptions for LEAP Modeling
4.4. Reference or Base Scenario
4.5. Alternative Scenarios
4.5.1. More Renewable Energy (MRR) Scenario
4.5.2. More Hydro Energy (MRH) Scenario
4.5.3. More Hydro Nuclear Energy (MRHN) Scenario
5. Results and Discussions
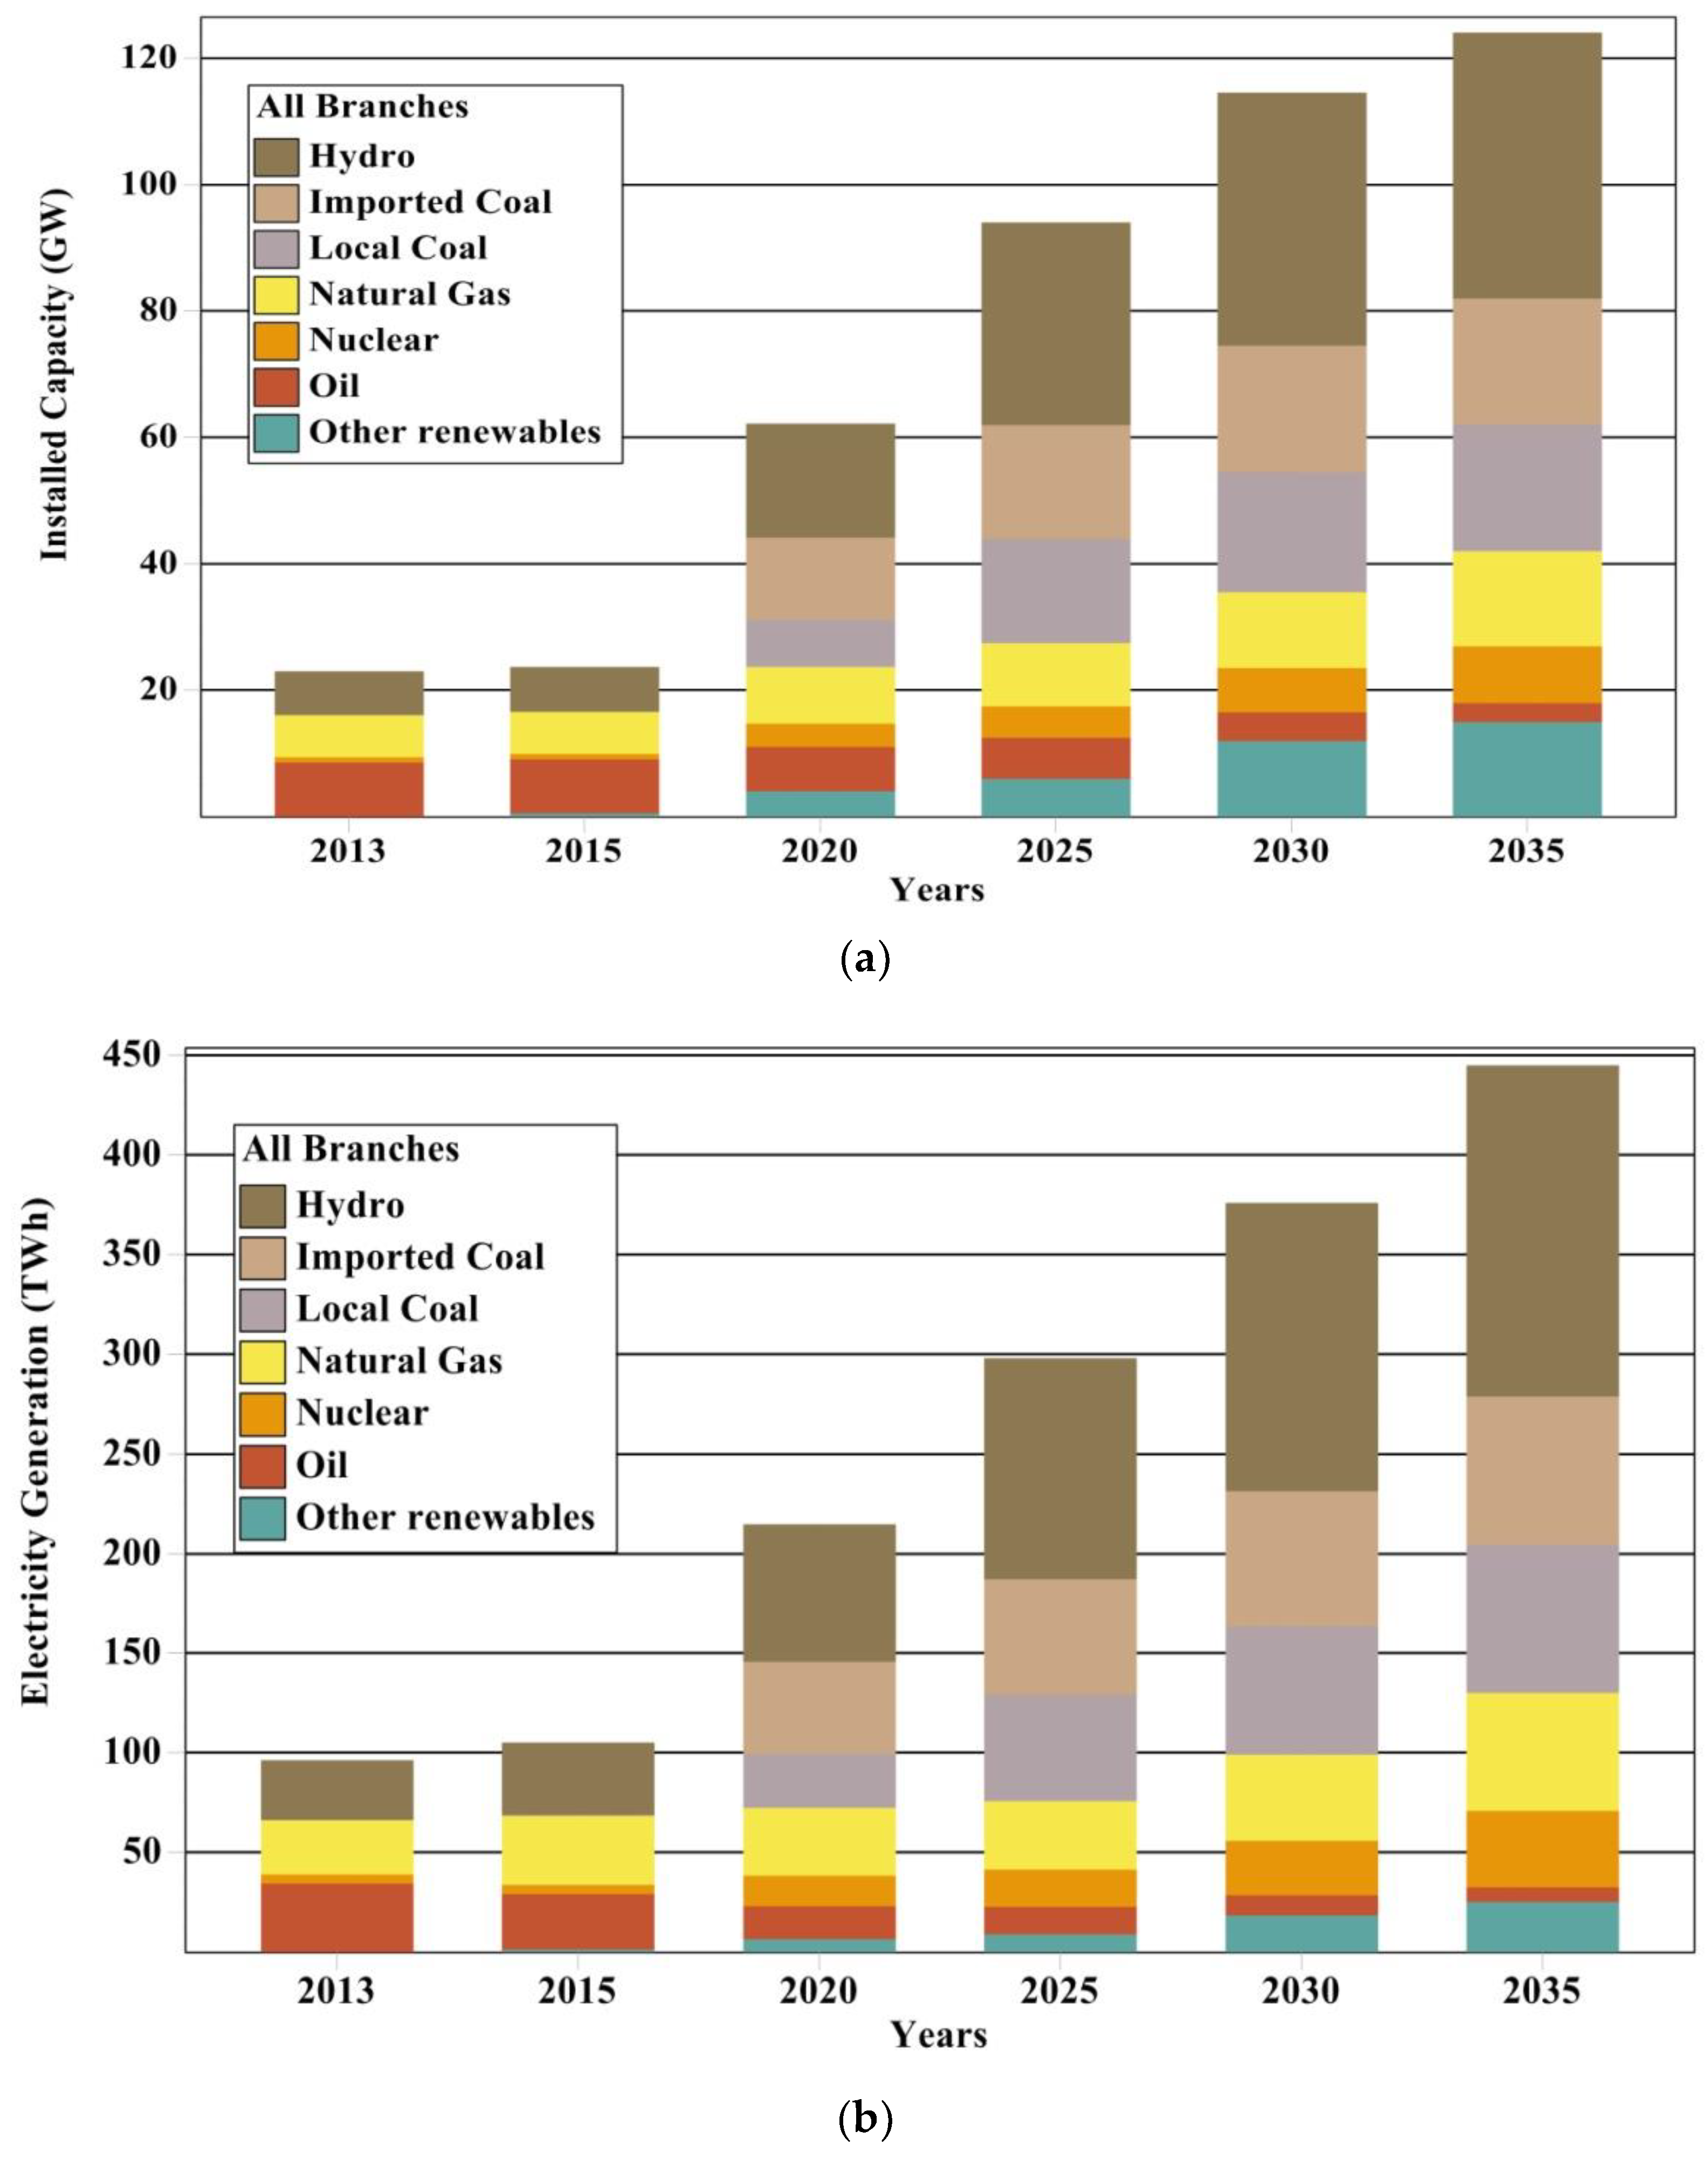
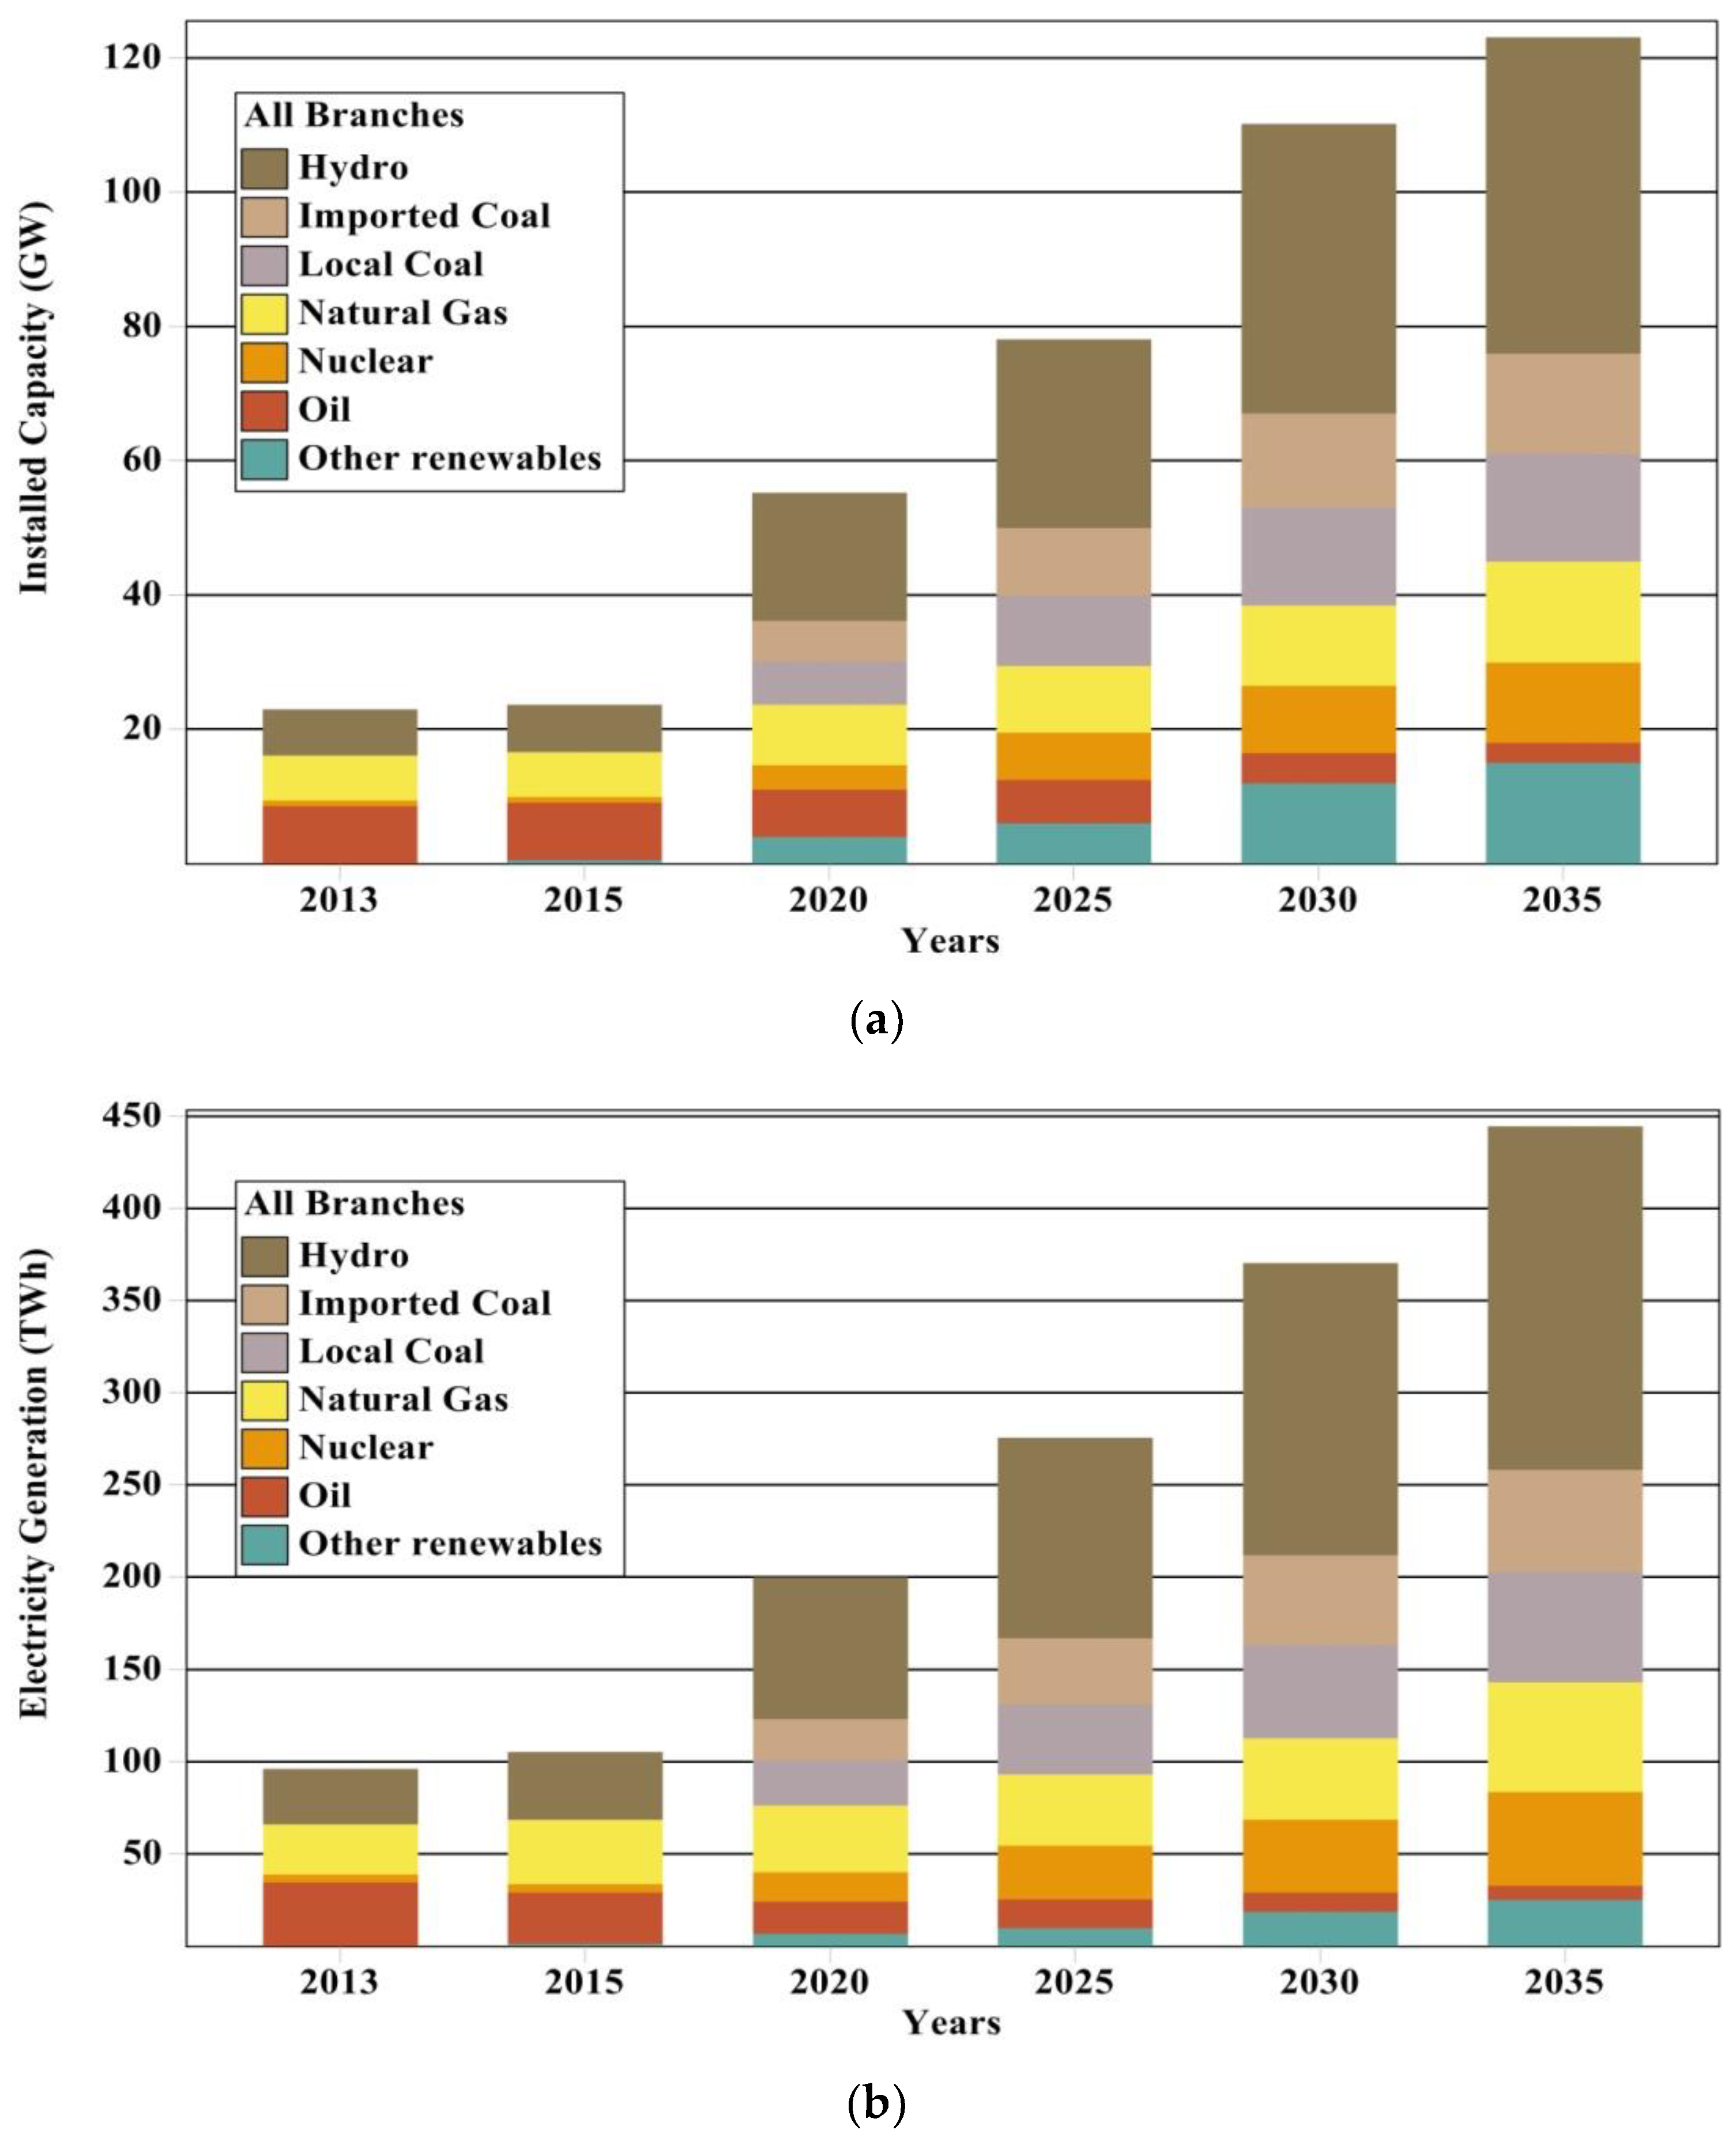
5.1. Reference or Base Scenario
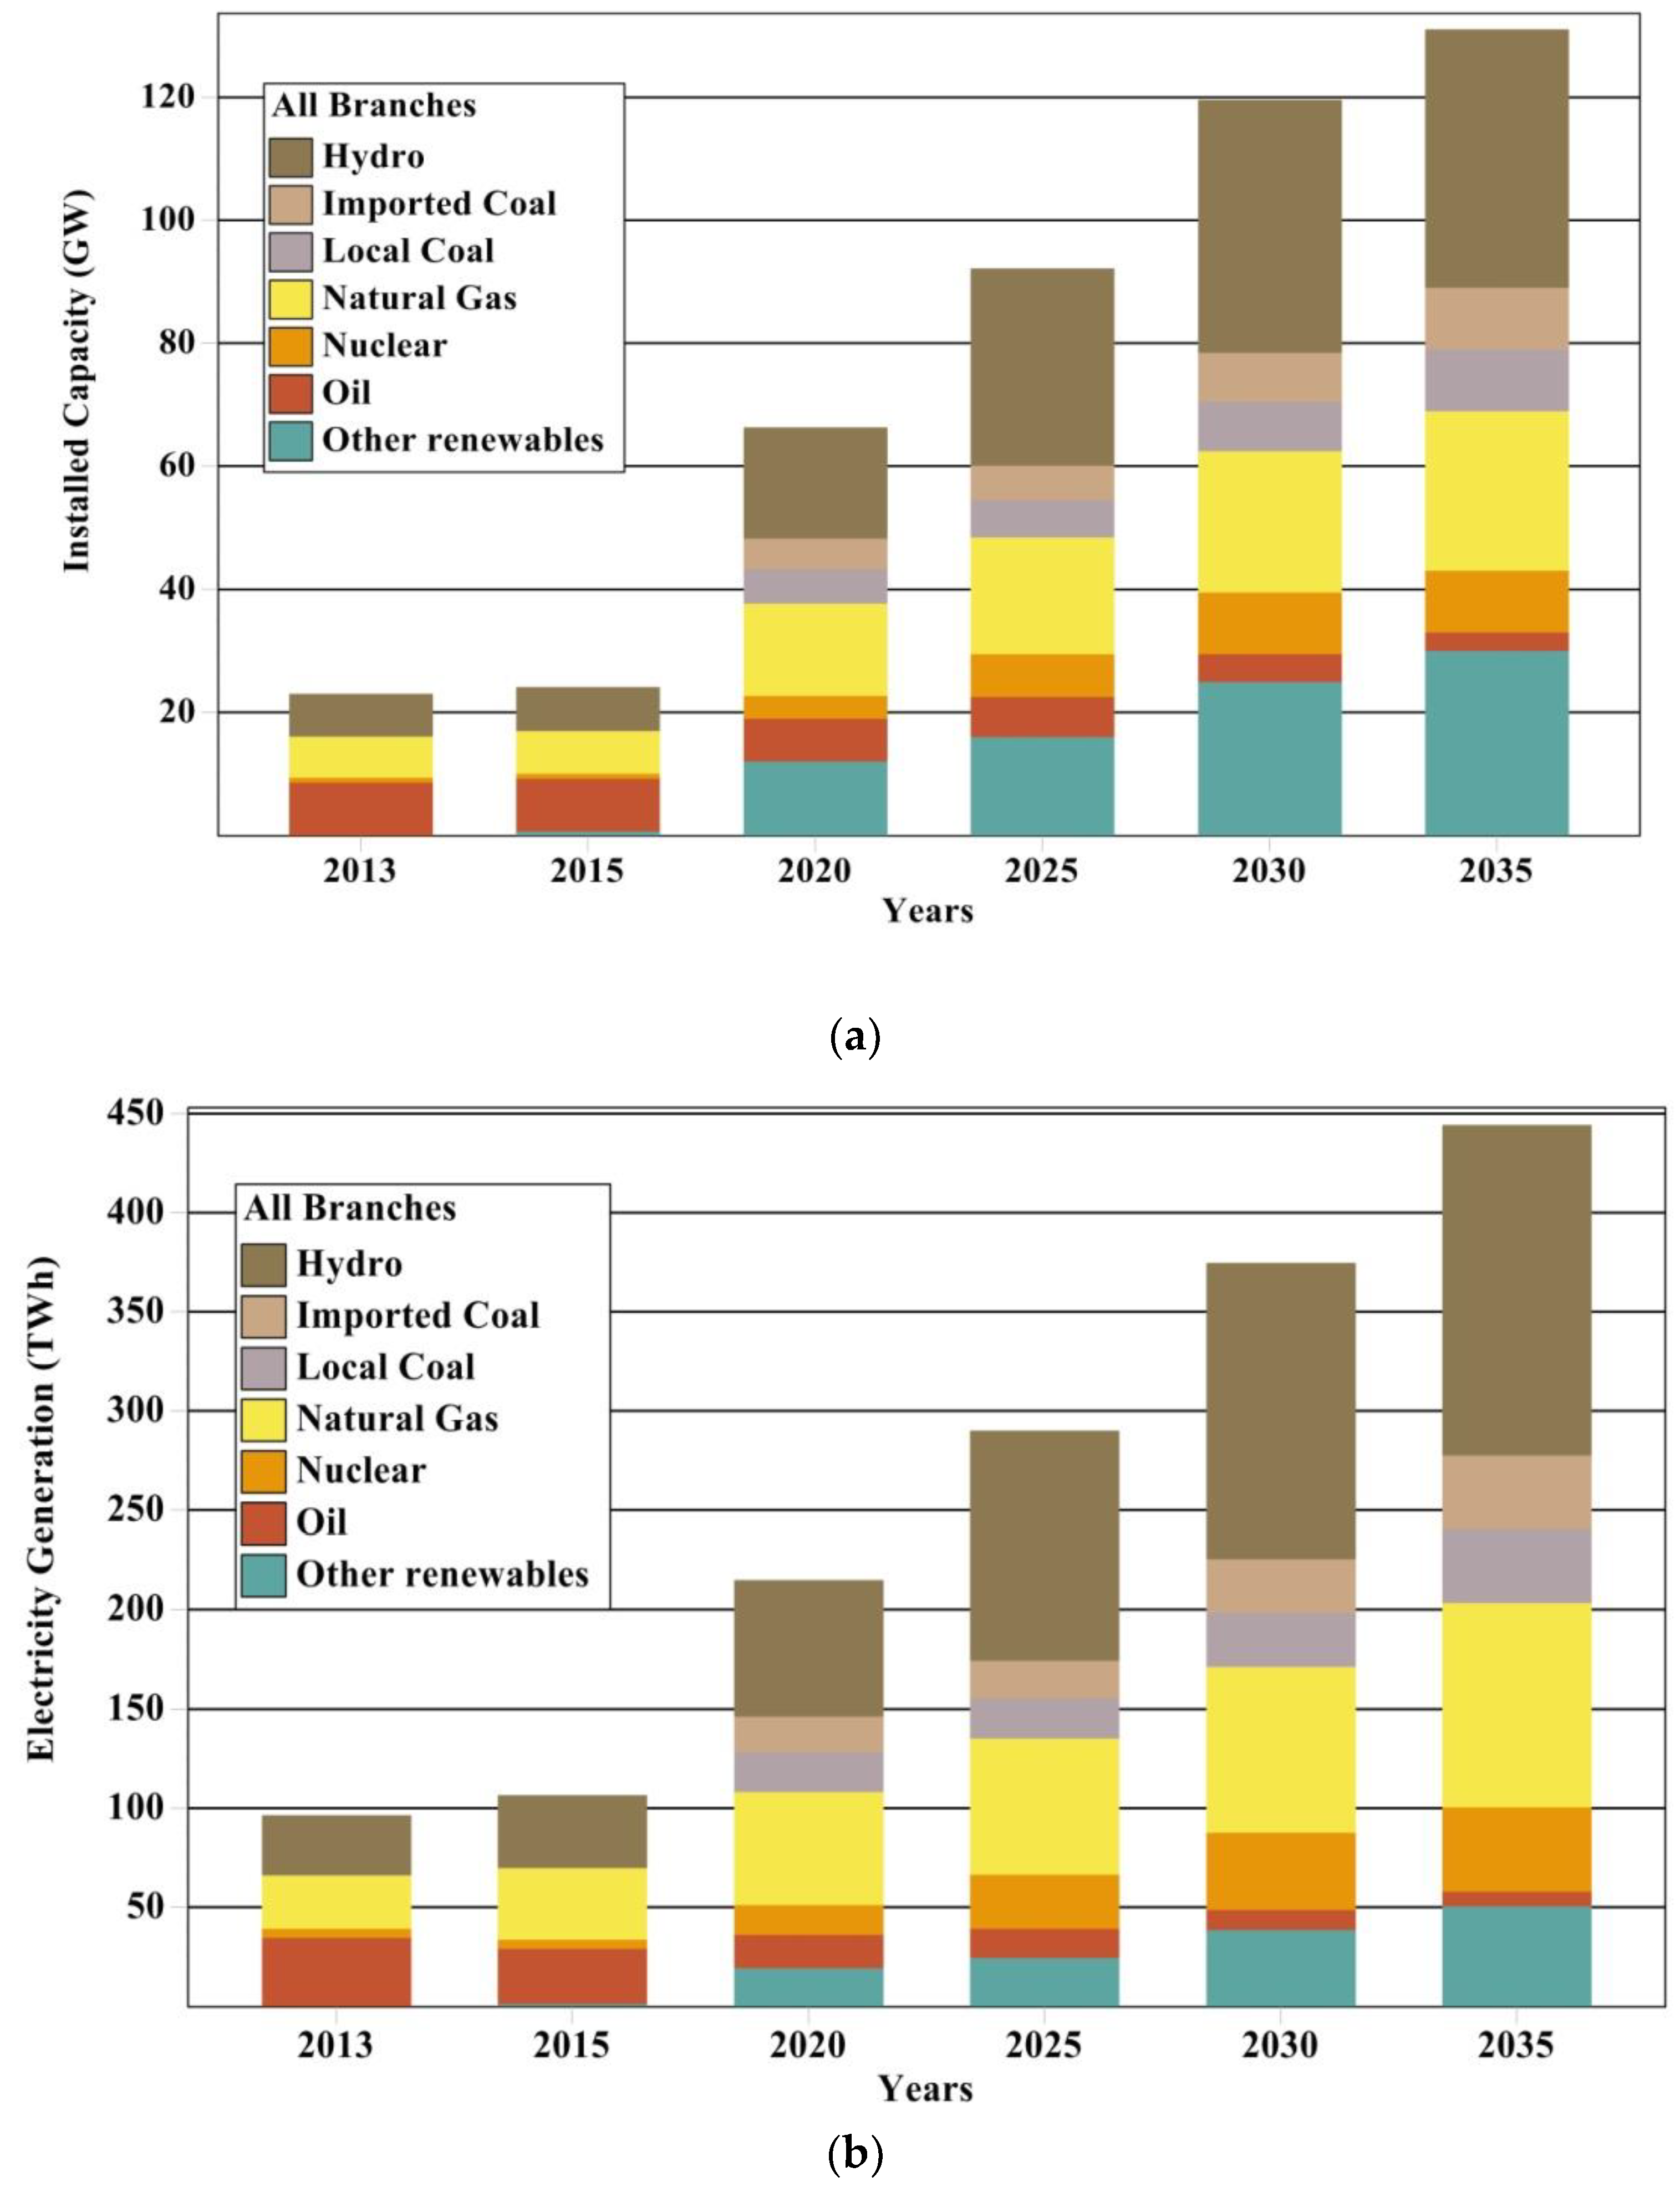
5.1.1. MRR Scenario
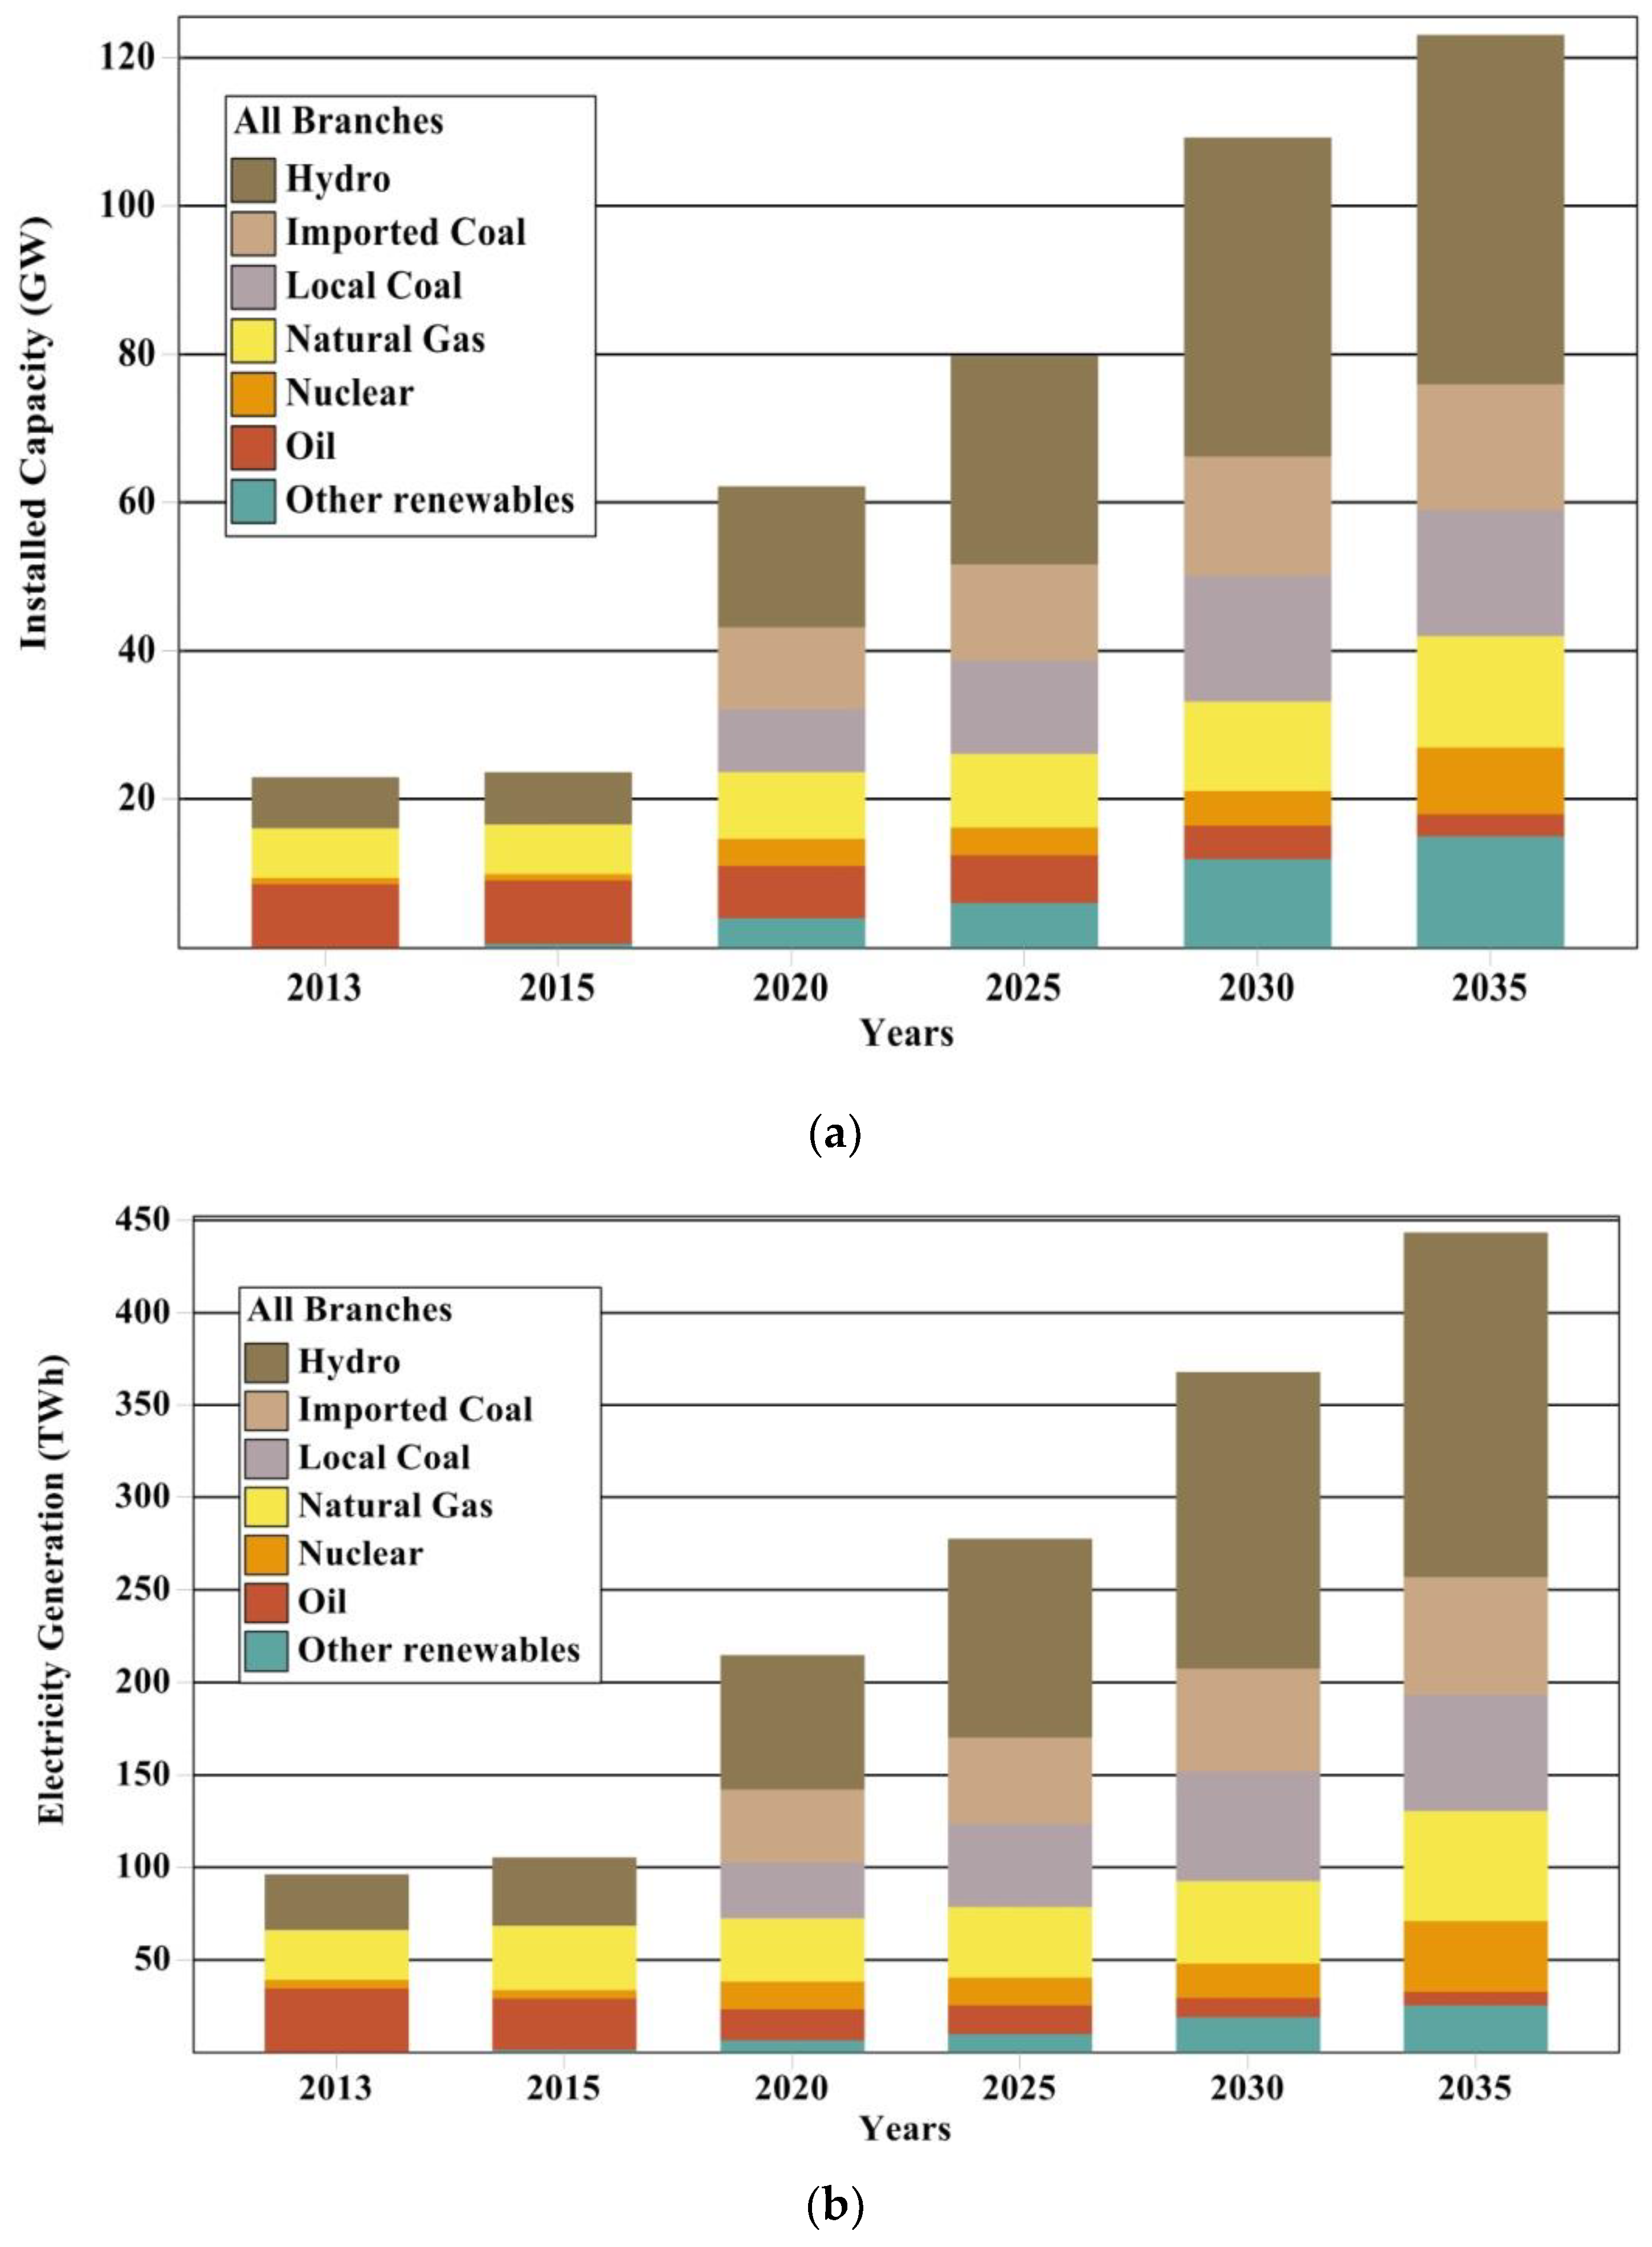
5.1.2. MRH Scenario
5.1.3. MRHN Scenario
5.2. Environmental Emissions in Reference and All Alternative Scenarios
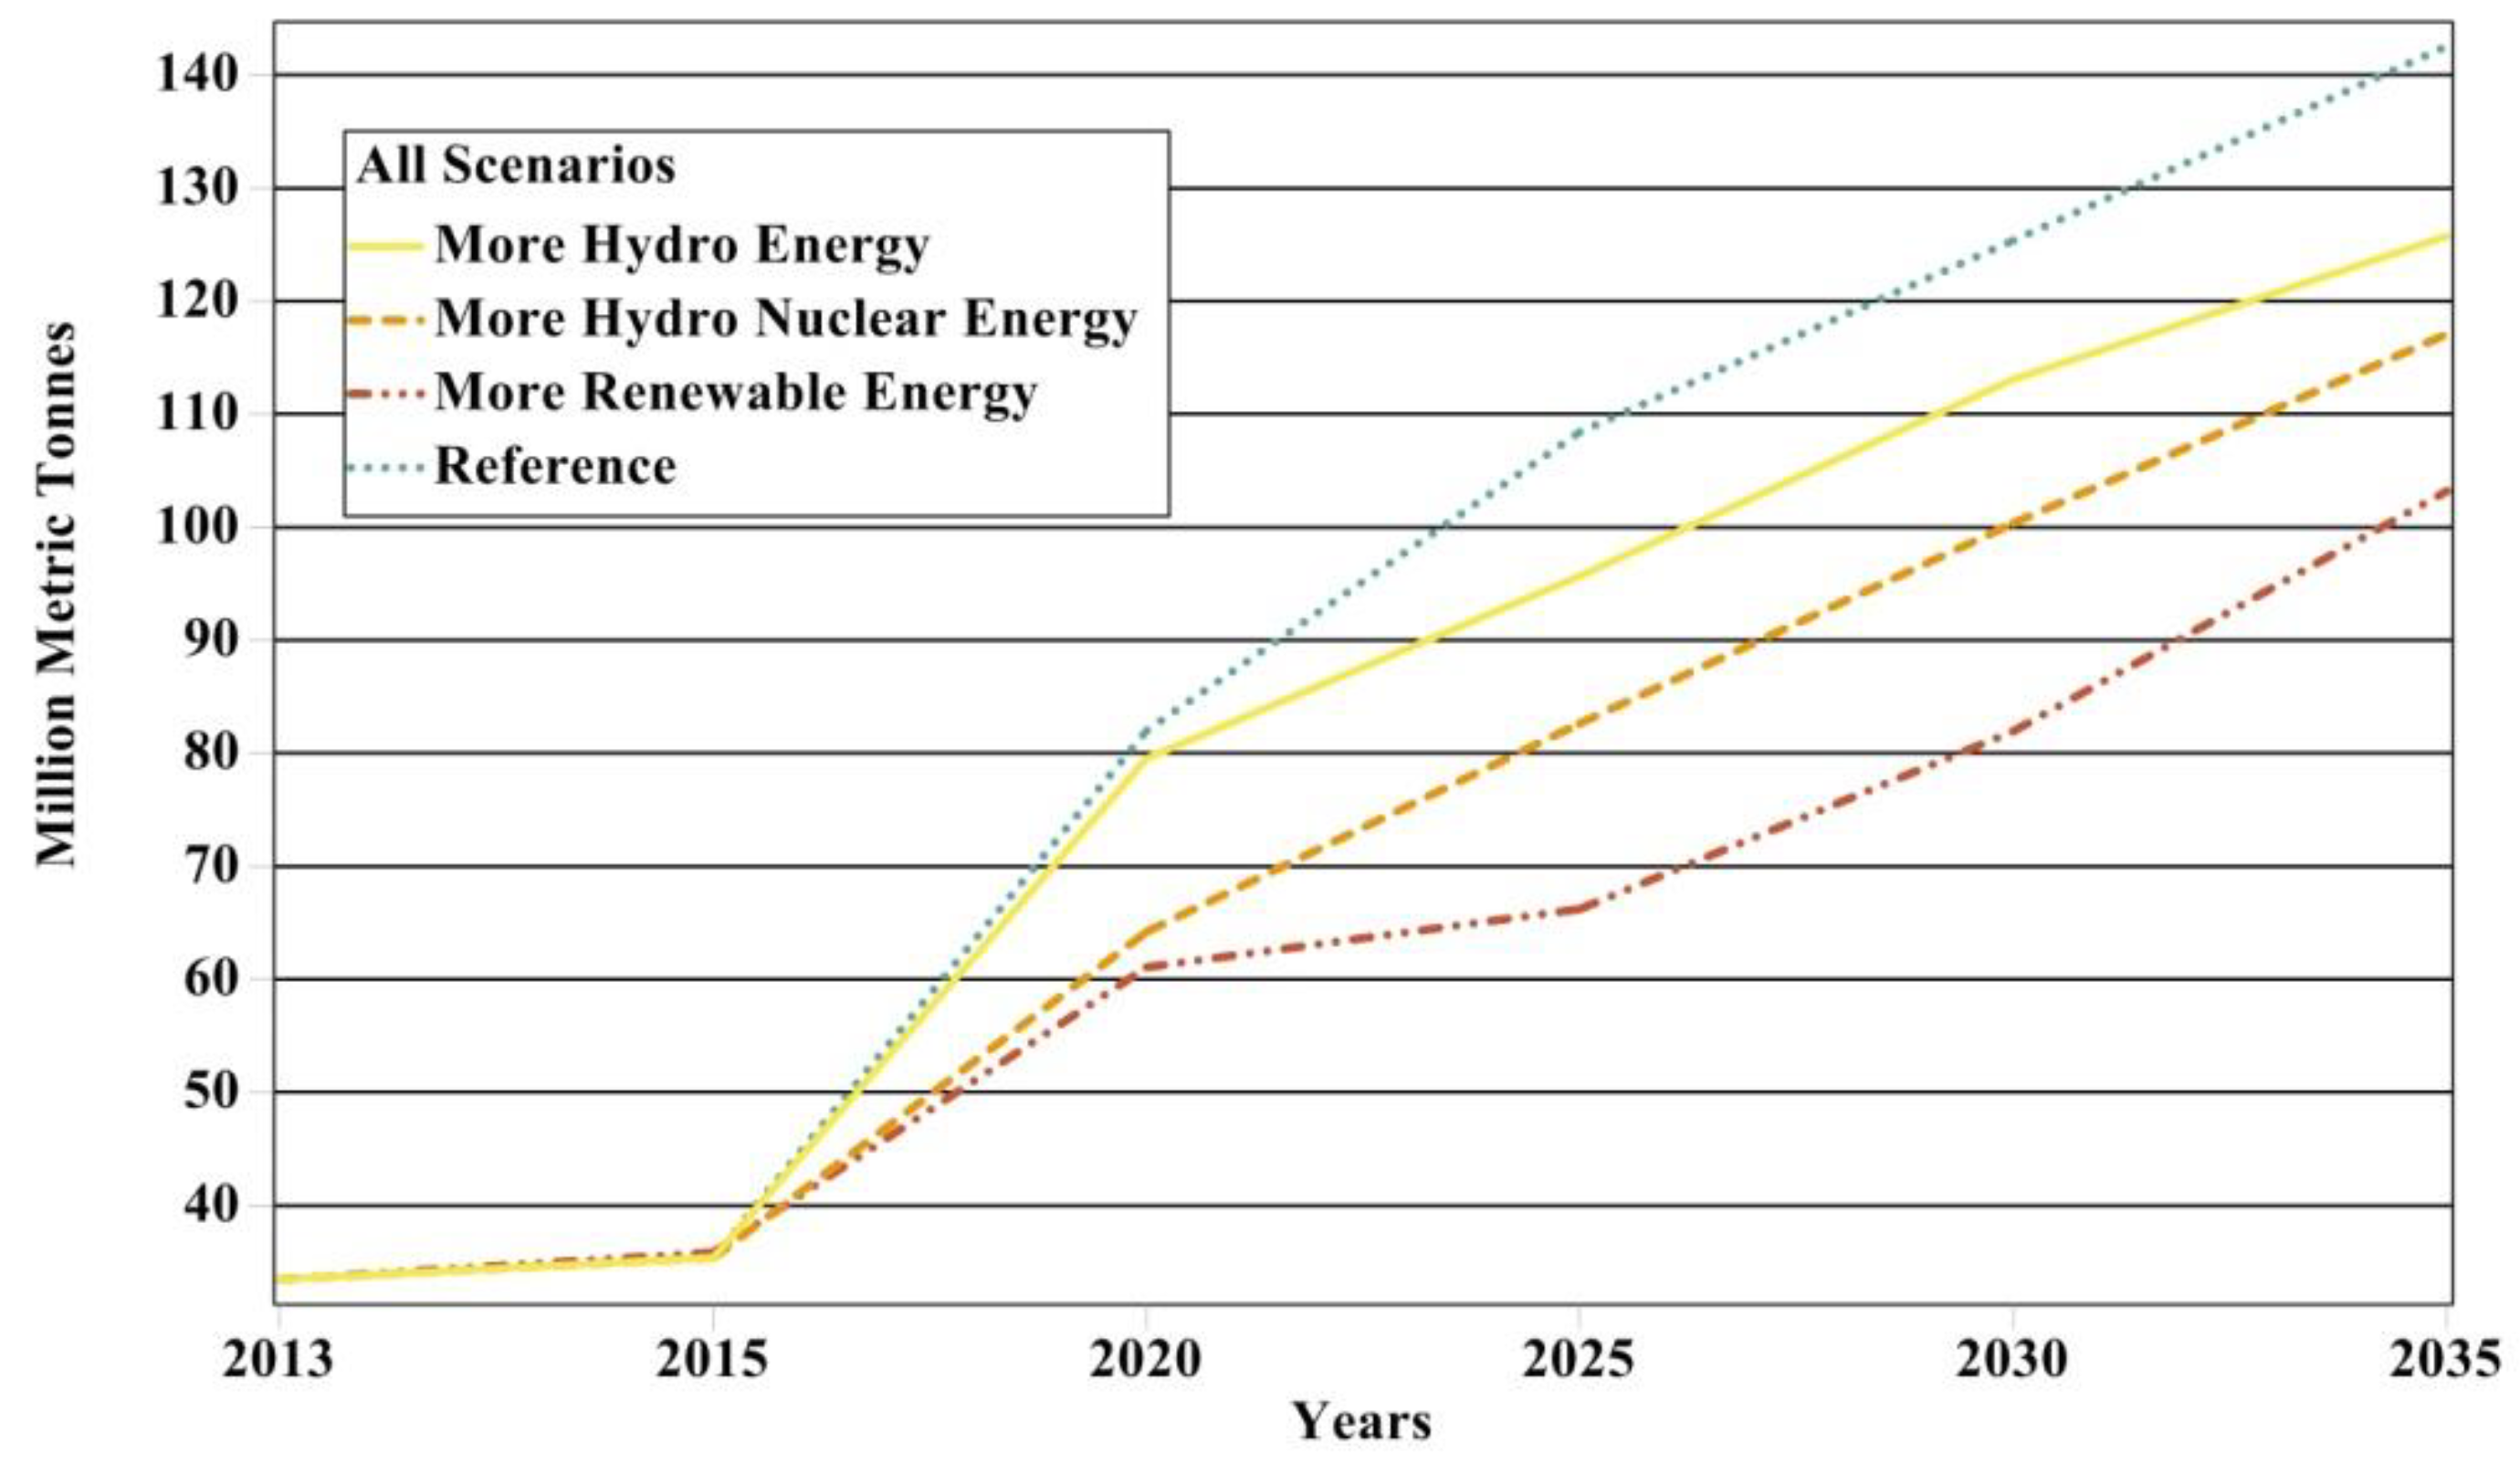
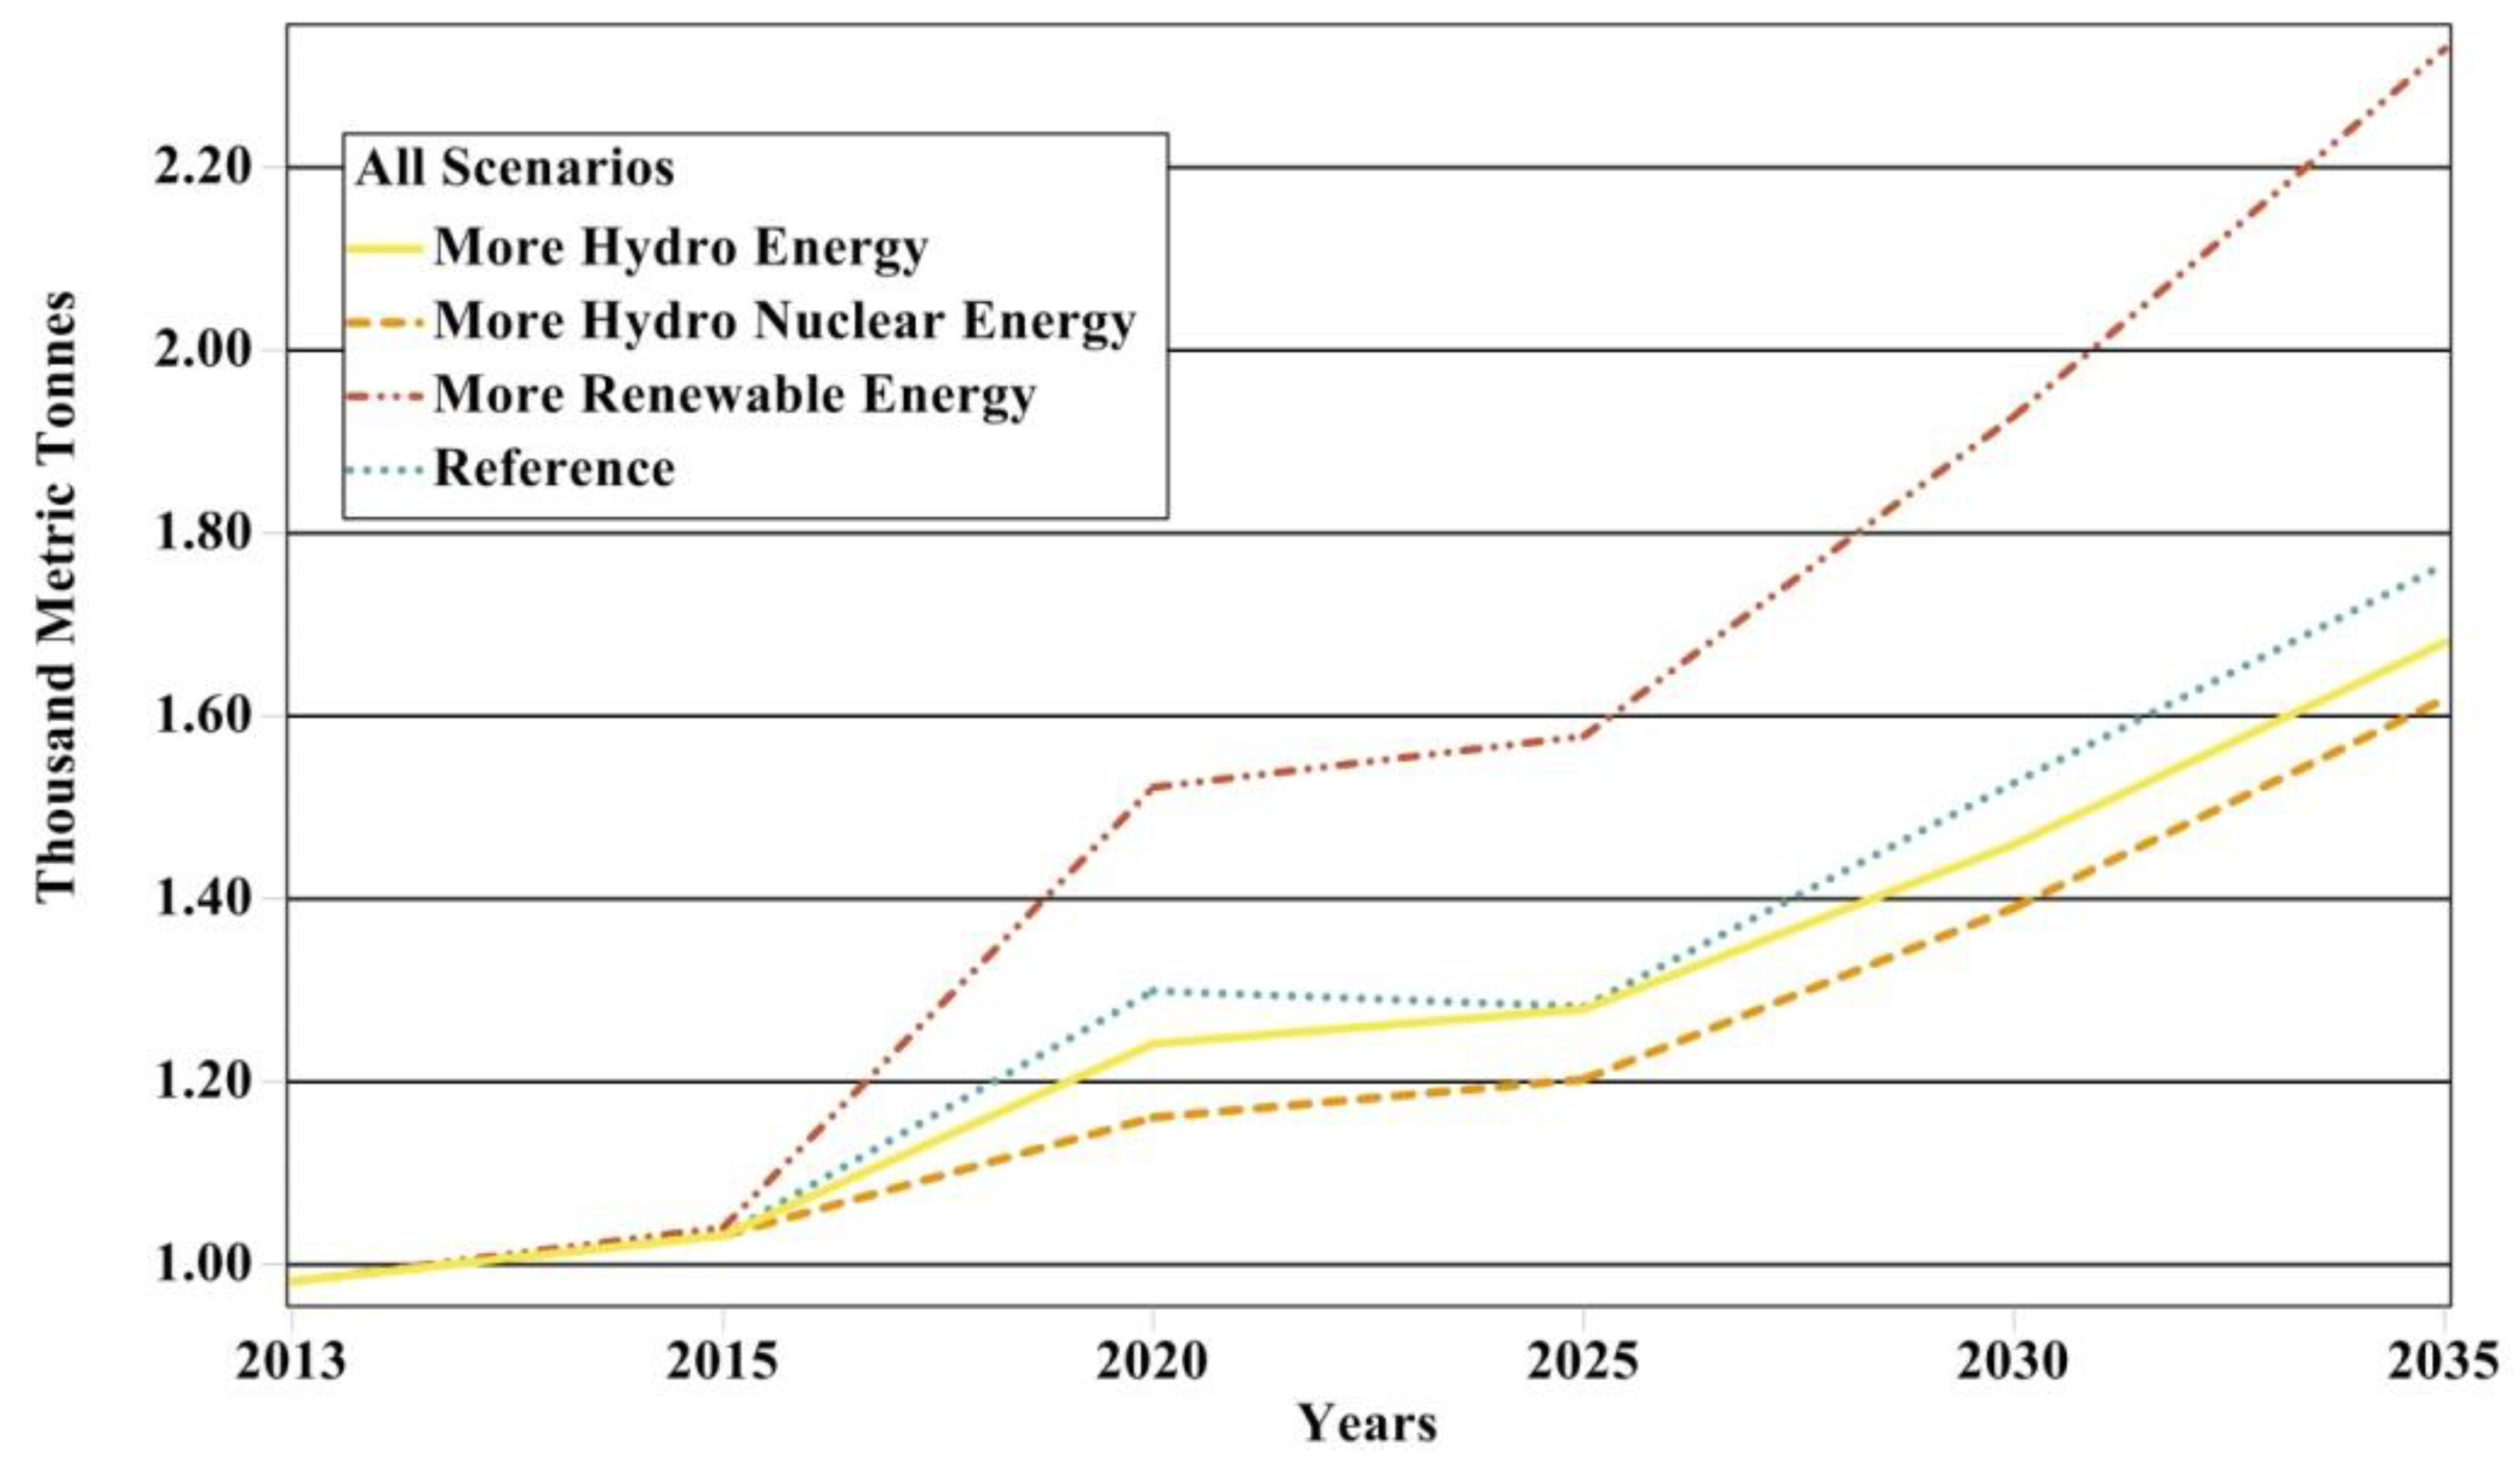
5.2.1. CO2 Emission
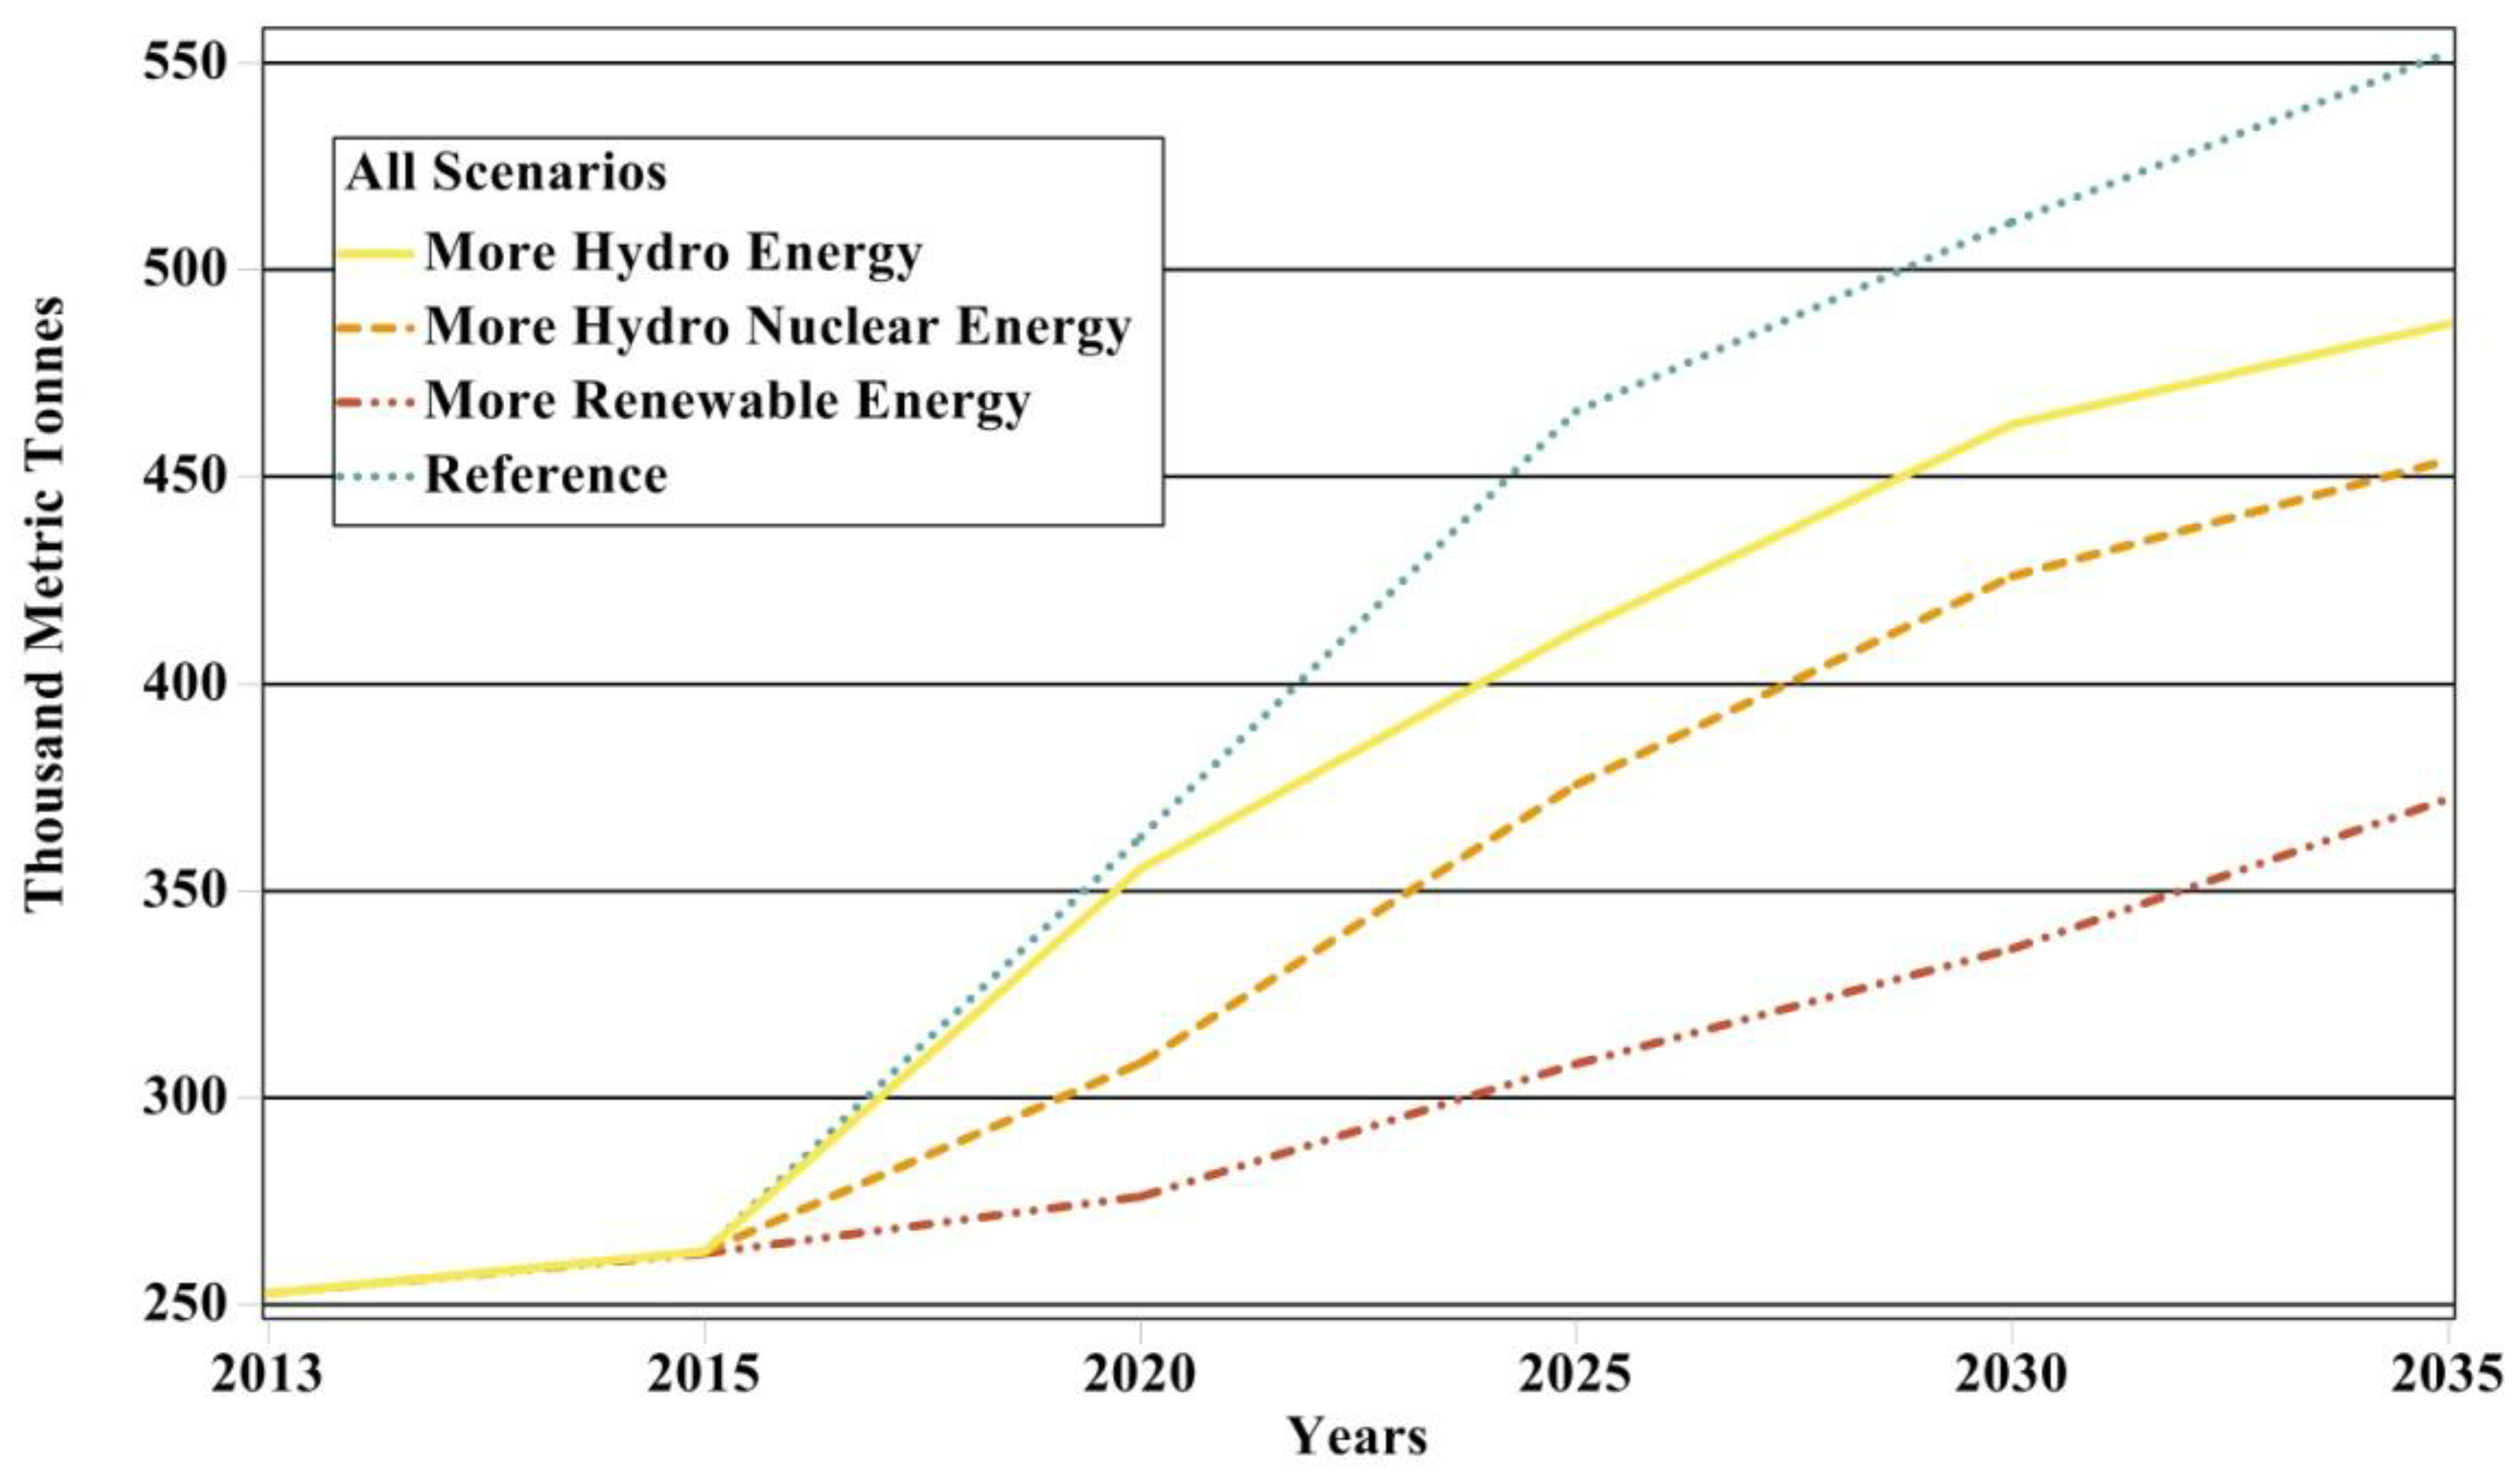
5.2.2. SO2 Emissions
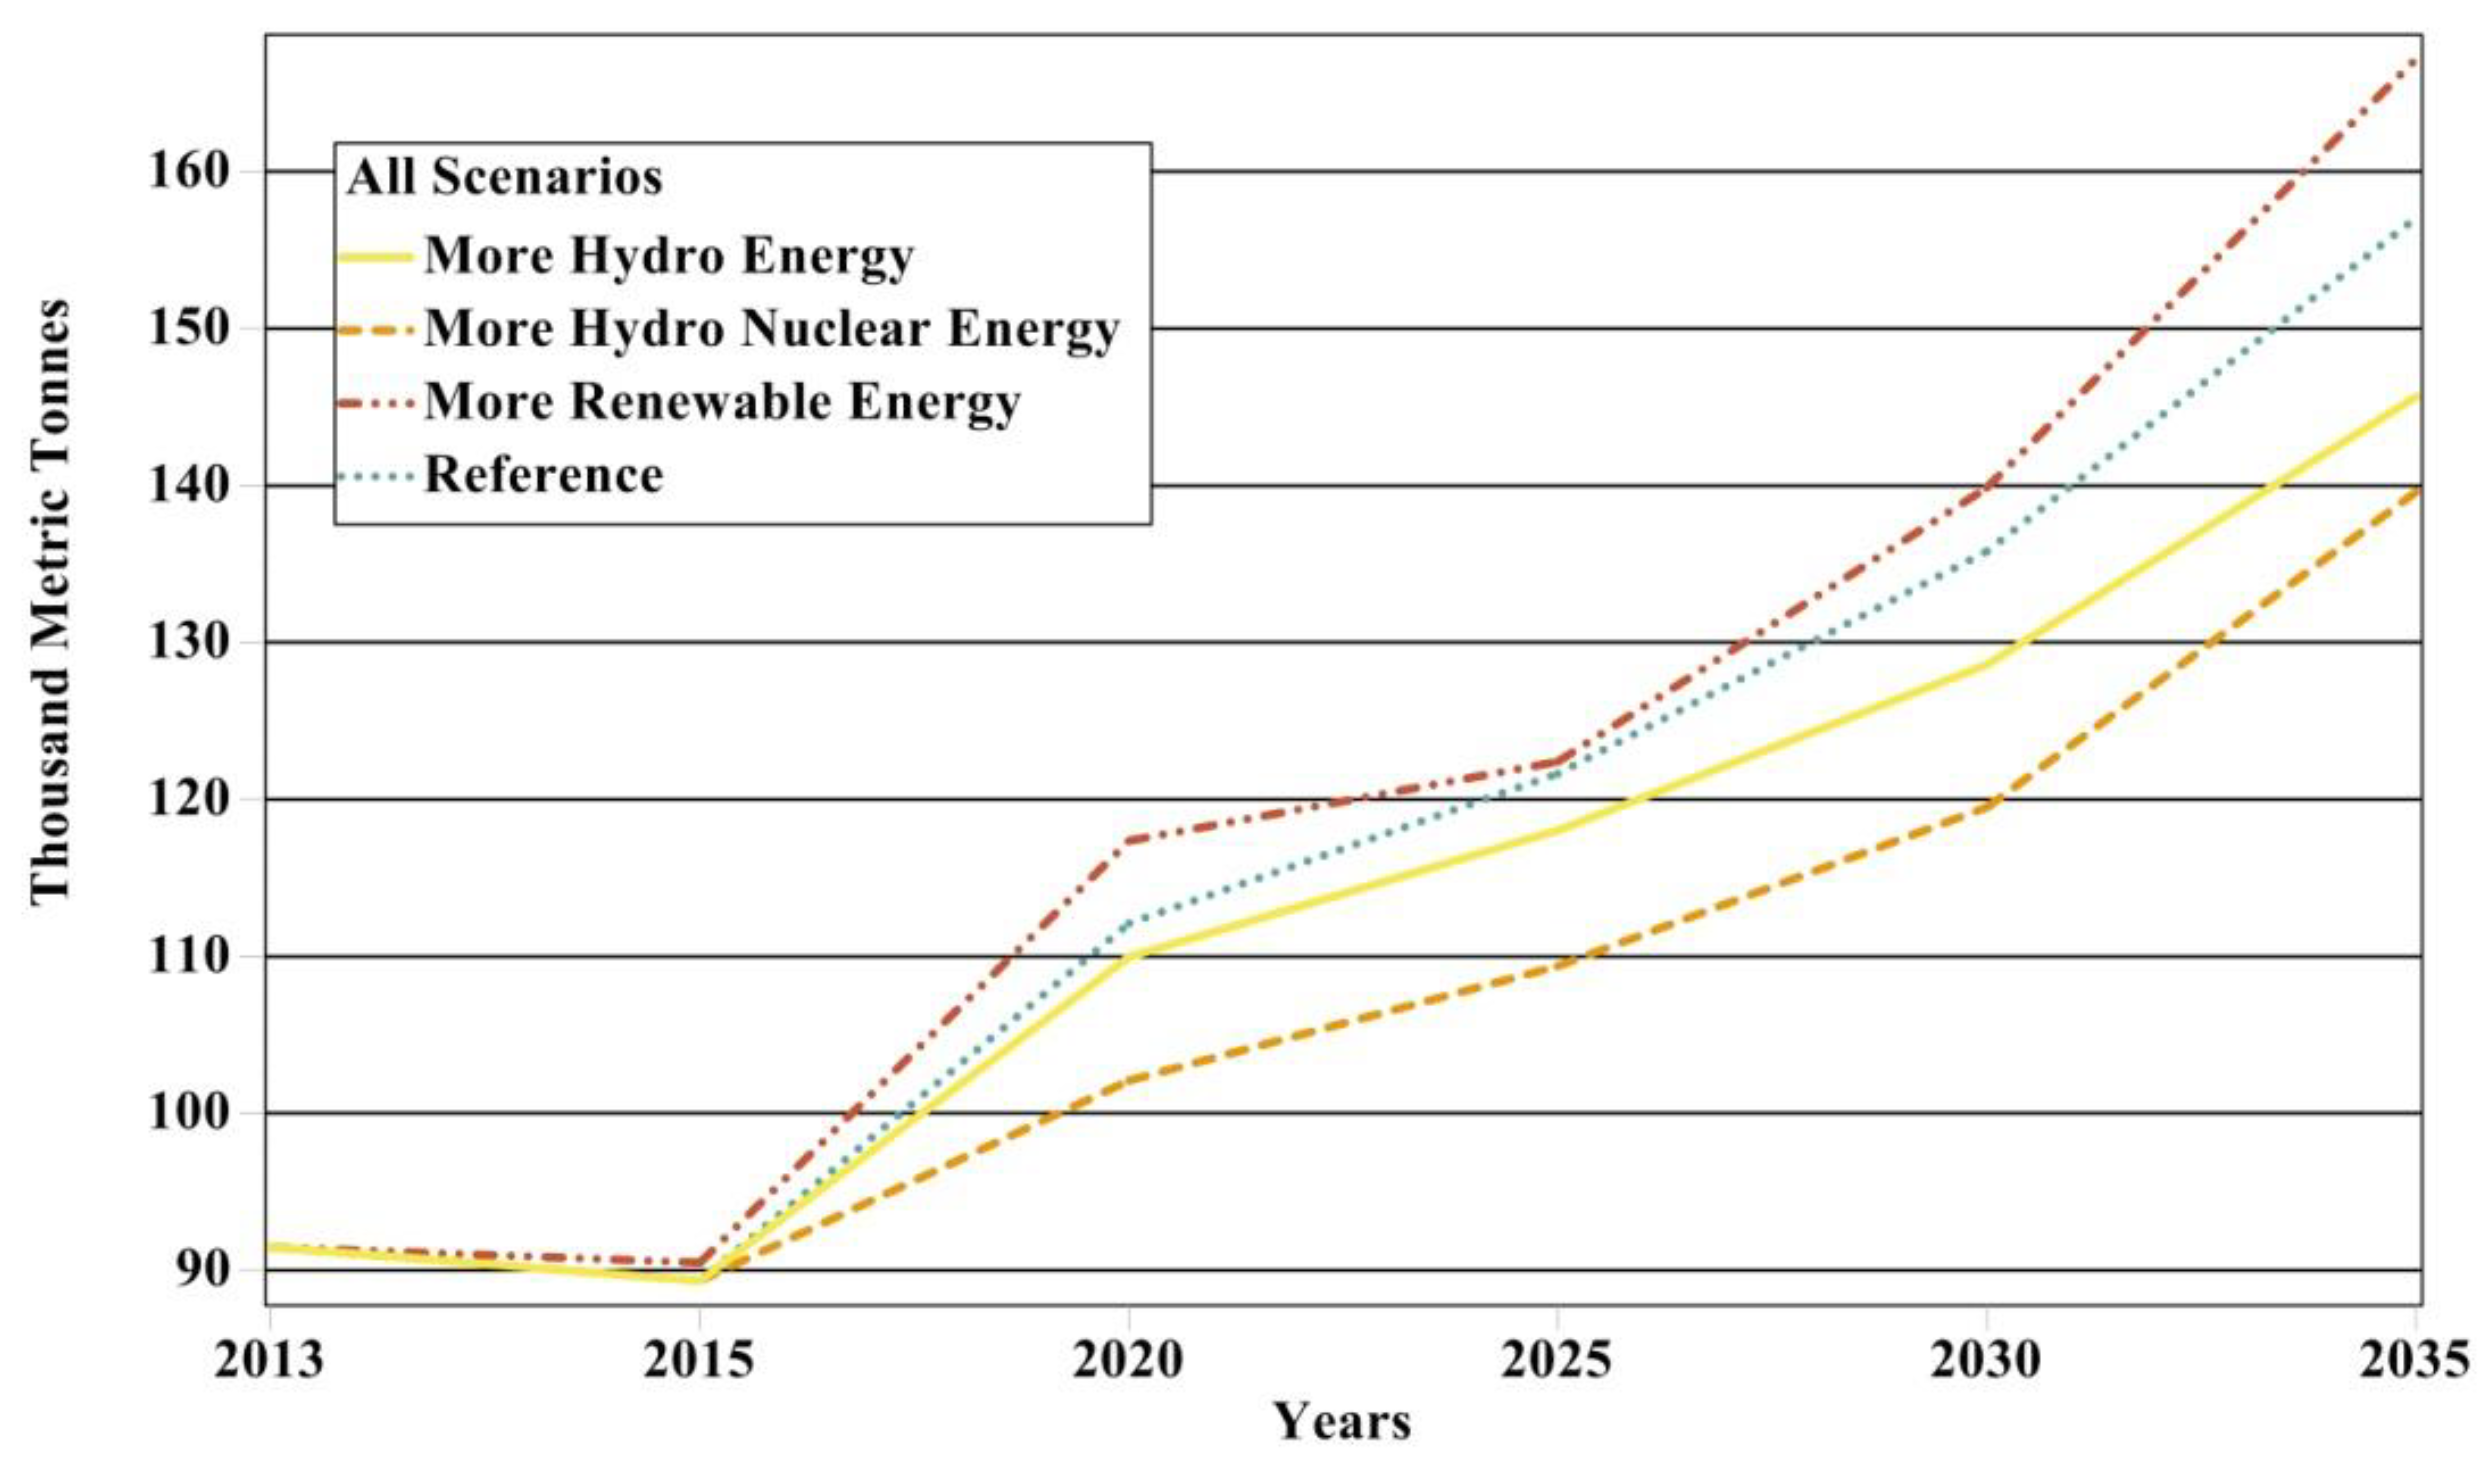
5.2.3. NOX Emissions
5.2.4. CH4 Emissions
5.2.5. N2O Emissions
6. Conclusions and Recommendations
- The REF scenario based on government plans suggests a reduction of oil-based power generation, however, conversion of certain power plants to coal and addition of new coal-based power plants in this scenario lead to more emission which are highest compared to other alternative scenarios.
- The MRR scenario mainly emphasized the renewable sources for electricity generation wherein the share of renewables increases to be 11% of total electricity output in 2035. This scenario has minimum emissions resulting from power generation during the modeling period.
- The MRH scenario prefers hydroelectric-based power generations to the tune of 42% in the total energy mix by the year 2035. The coal-based generation forms about 28% in this scenario, as such, environmental emissions in the scenario are found to next highest to the REF scenario.
- In the MRHN scenario, the share of electricity output of hydroelectric and nuclear power is projected to increase from 31% to 42% and 5% to 11%, respectively, by the end year 2035, as such, environmental emissions, in this case, are minimum but second to those of the MRR scenario.
- All alternative scenarios (MRR, MRH, and MRHN) are more environmentally friendly and acceptable compared to the base or REF scenario, and
- Coal-based power generation is the major sources of emission with local coal (indigenous lignite) emitting more emissions than imported (bituminous) coal.
Author Contributions
Funding
Acknowledgments
Conflicts of Interest
References
- Abas, N.; Kalair, A.; Khan, N.; Kalair, A.R. Review of GHG emissions in Pakistan compared to SAARC countries. Renew. Sustain. Energy Rev. 2017, 80, 990–1016. [Google Scholar] [CrossRef]
- Mirjat, N.H.; Uqaili, M.A.; Harijan, K.; Valasai, G.D.; Shaikh, F.; Waris, M. A review of energy and power planning and policies of Pakistan. Renew. Sustain. Energy Rev. 2017, 79, 110–127. [Google Scholar] [CrossRef]
- Mirjat, N.H.; Uqaili, M.A.; Harijan, K.; Walasai, G.D.; Mondal, M.A.H.; Sahin, H. Long-term electricity demand forecast and supply side scenarios for Pakistan (2015–2050): A LEAP model application for policy analysis. Energy 2018, 165, 512–526. [Google Scholar] [CrossRef]
- Perwez, U.; Sohail, A. GHG Emissions and Monetary Analysis of Electric Power Sector of Pakistan: Alternative Scenarios and it’s Implications. Energy Procedia 2014, 61, 2443–2449. [Google Scholar] [CrossRef]
- HDIP. Pakistan Energy Year Book, 2016; Government of Pakistan: Islamabad, Pakistan, 2016.
- Lin, B.; Raza, M.Y. Analysis of energy related CO2 emissions in Pakistan. J. Clean. Prod. 2019, 219, 981–993. [Google Scholar] [CrossRef]
- Kessides, I.N. Chaos in power: Pakistan’s electricity crisis. Energy Policy 2013, 55, 271–285. [Google Scholar] [CrossRef]
- Rauf, O.; Wang, S.; Yuan, P.; Tan, J. An overview of energy status and development in Pakistan. Renew. Sustain. Energy Rev. 2015, 48, 892–931. [Google Scholar] [CrossRef]
- Bhutto, A.W.; Bazmi, A.A.; Zahedi, G. Greener energy: Issues and challenges for Pakistan—Wind power prospective. Renew. Sustain. Energy Rev. 2013, 20, 519–538. [Google Scholar] [CrossRef]
- National Electric Power Regulatory Authority (NEPRA). Pakistan Coal Power Generation Potential, National Electric Power and Regulatory Authority; NEPRA: Islamabad, Pakistan, 2004. [Google Scholar]
- Farooqui, S.Z. Prospects of renewables penetration in the energy mix of Pakistan. Renew. Sustain. Energy Rev. 2014, 29, 693–700. [Google Scholar] [CrossRef]
- Yousuf, I.; Ghumman, A.; Hashmi, H.; Kamal, M. Carbon emissions from power sector in Pakistan and opportunities to mitigate those. Renew. Sustain. Energy Rev. 2014, 34, 71–77. [Google Scholar] [CrossRef]
- Perwez, U.; Sohail, A.; Hassan, S.F.; Zia, U. The long-term forecast of Pakistan’s electricity supply and demand: An application of long range energy alternatives planning. Energy 2015, 93, 2423–2435. [Google Scholar] [CrossRef]
- HDIP. Pakistan Energy Year Book, 2013; Government of Pakistan: Islamabad, Pakistan, 2013.
- MOW&P. National Power Policy 2013; Ministry of Water and Power, Government of Pakistan: Islamabad, Pakistan, 2013.
- Water and Power Development Authority (WAPDA). Hydro Potential Pakistan; Water and Power Development Authority: Lahore, Pakistan, 2011.
- Ministry of Finance, Revenue and Economic Affairs. Economic Survey of Pakistan 2016–2017; Ministry of Finance, Revenue and Economic Affairs: Islamabad, Pakistan, 2017.
- China-Pakistan Economic Corridor (CPEC). China-Pakistan Economic Corridor, Updated Energy Projects; CPEC, 2016. Available online: http://cpec.gov.pk/energy (accessed on 6 June 2016).
- BOI. Coal Based Projects; Board of Investment Prime Minister’s Office, 2014. Available online: http://boi.gov.pk/ (accessed on 14 September 2014).
- Coutinho, M.; Butt, H.K.; Rauf, S. Environmental Impact Assessment Guidance for Coal Fired Power Plants in Pakistan, IUCN Pakistan (National Impact Assessment Programme); International Union for Conservation of Nature and Natural Resources (IUCN): Gland, Switzerland, 2014. [Google Scholar]
- Thar Coal & Energy Board (TCEB). Projects, Thar Coal Energy Board, Sindh Governement; TCEB, 2015. Available online: http://sindhcoal.gos.pk/ (accessed on 15 April 2016).
- Uqaili, M.A.; Hussain, N.; Mengal, A.; Harijan, K. Supply side initiatives for overcoming electricity crisis in Pakistan. In Proceedings of the 14th International Conference on Sustainable Energy Technologies, SET 2015, Nottingham, UK, 25–27 August 2015; pp. 572–580. [Google Scholar]
- GOP. Pakistan Economic Survey 2013–2014; Ministry of Finance, Finance Division, Government of Pakistan, 2015. Available online: http://www.finance.gov.pk/survey_1314.html (accessed on 15 June 2017).
- Farooq, M.K.; Kumar, S. An assessment of renewable energy potential for electricity generation in Pakistan. Renew. Sustain. Energy Rev. 2013, 20, 240–254. [Google Scholar] [CrossRef]
- Private Power and Infrastructure Board (PPIB). 2016. Available online: www.ppib.gov.pk (accessed on 16 August 2017).
- PAEC. Nuclear Power: A Viable Option for Electricity Generation. Available online: http://www.paec.gov.pk/NuclearPower/ (accessed on 26 March 2014).
- Javaid, M.A.; Hussain, S.; Maqsood, A.; Arshad, Z.; Arshad, A.; Idrees, M. Electrical energy crisis in Pakistan and their possible solutions. Int. J. Basic Appl. Sci. 2011, 11, 38–52. [Google Scholar]
- Alternative Energy Development Board (AEDB), Government of Pakistan. 2014. Available online: http://www.aedb.org/ (accessed on 13 June 2016).
- PM launches solar power plant in Bahawalpur. Dawn, 9 May 2014.
- Harijan, K.; Uqaili, M.A.; Mirza, U.K. Assessment of solar PV power generation potential in Pakistan. J. Clean Energy Technol. 2015, 3, 54–56. [Google Scholar] [CrossRef]
- Energy Sector Management Assistance Program (ESMAP). Global Solar Atlus; ESMAP: Washington, DC, USA, 2018. [Google Scholar]
- Harijan, K.; Uqaili, M.A.; Memon, M.; Mirza, U.K. Assessment of centralized grid connected wind power cost in coastal area of Pakistan. Renew. Energy 2009, 34, 369–373. [Google Scholar] [CrossRef]
- Mengal, A.; Uqaili, M.A.; Harijan, K.; Memon, A.G. Competitiveness of wind power with the conventional thermal power plants using oil and natural gas as fuel in Pakistan. Energy Procedia 2014, 52, 59–67. [Google Scholar] [CrossRef]
- Energy Sector Management Assistance Program (ESMAP). Renewable Energy Resource Mapping in Pakistan; ESMAP: Washington, DC, USA, 2017; Available online: http://pubdocs.worldbank.org/en/344131489521020746/Solargis-Presentation-Pakistan-Solar-Mapping-Final-Results-07Mar2017.pdf (accessed on 4 April 2017).
- Zuberi, M.J.S.; Hasany, S.Z.; Tariq, M.A.; Fahrioglu, M. Assessment of biomass energy resources potential in Pakistan for power generation. In Proceedings of the 4th International Conference on Power Engineering, Energy and Electrical Drives, Istanbul, Turkey, 13–17 May 2013; pp. 1301–1306. [Google Scholar]
- Perwez, U.; Sohail, A. Forecasting of Pakistan’s net electricity energy consumption on the basis of energy pathway scenarios. Energy Procedia 2014, 61, 2403–2411. [Google Scholar] [CrossRef]
- SEI. Long-range Energy Alternatives Planning System—LEAP; Stockholm Environment Institute: Stockholm, Sweden, 2014. [Google Scholar]
- Meryem, S.S.; Ahmad, N.A.; Aziz, N. Evaluation of biomass potential for renewable energy in Pakistan using LEAP model. Int. J. Emerg. Trends Eng. Dev. 2013, 1, 243–249. [Google Scholar]
- COMMEND. An Introduction to LEAP. 2015. Available online: http://www.energycommunity.org/default.asp?action=47 (accessed on 23 March 2016).
- NTDC. Electricity Demand Forecast Based on Multiple Regression Analysis; National Transmission and Distribution Company, Government of Pakistan: Lahore, Pakistan, 2013.
- Mariam Gul, W.A.Q. Modeling Diversified Electricity Generation Scenarios for Pakistan. In Proceedings of the IEEE Power and Energy Society General Meeting, San Diego, CA, USA, 22–26 July 2012. [Google Scholar]
- IRG. Pakistan Integrated Energy Model (Pak-IEM) Policy Analysis Report; International Resources Group: Washington, DC, USA, 2011. [Google Scholar]
- Taliotis, C.; Bazilian, M.; Welsch, M.; Gielen, D.; Howells, M. Grand Inga to power Africa: Hydropower development scenarios to 2035. Energy Strategy Rev. 2014, 4, 1–10. [Google Scholar] [CrossRef]
- Van der Zwaan, B. The role of nuclear power in mitigating emissions from electricity generation. Energy Strategy Rev. 2013, 1, 296–301. [Google Scholar] [CrossRef]
- IAEA. Climate Change and Nuclear Power 2014; International Atomic Energy Agency: Vienna, Austria, 2014. [Google Scholar]


| Name of Power Plant | Capacity (MW) |
|---|---|
| Hydro Neelum–Jhelum Hydroelectric | 969 |
| Tarbela 4 th,5th extension | 1910 |
| Patrind Hydroelectric | 147 |
| Akhori dam project | 600 |
| Sehra Hydroelectric Project | 130 |
| Dasu Hydroelectric Project | 4320 |
| Diamer–Basha Dam | 4500 |
| Suki Kinari Hydroelectric | 870 |
| Karot Hydroelectric Project | 720 |
| Bunji Hydroelectric | 7100 |
| Azad Pattan Hydroelectric | 640 |
| Lower Palas Hydroelectric | 665 |
| Lower Spat Gah Hydroelectric | 496 |
| Kohala Hydroelectric Project | 1100 |
| Mahl Hydroelectric Project | 590 |
| Thakot Hydroelectric | 2800 |
| Patan Hydroelectric | 2800 |
| Munda dam project | 740 |
| Mohmand dam Hydroelectric | 800 |
| Shyok dam project | 690 |
| Chakoti–Hattan Hydroelectric | 500 |
| Name of Power Plant | Capacity (MW) |
|---|---|
| Imported Coal | |
| Coal power plants at Punjab | 2 × 660 |
| Coal power plants at Punjab | 5280 |
| Coal power plants at Jamshoro | 2 × 660 |
| Coal power plants at Hub | 2 × 660 |
| Coal power plants at Gawadar | 300 |
| Coal power at Port Qasim | 2 × 660 |
| Conversion of Jamshoro Power Plant from Oil to Coal | 850 |
| Conversion of Muzaffargarh Power Plant from Oil to Coal | 1350 |
| Conversion of Guddu Power Plant from Oil to Coal | 640 |
| Conversion of K-Electric Power Plant from Oil to Coal | 1260 |
| Conversion of HUBCO Power Plant from Oil to Coal | 1292 |
| Local coal | |
| Sino Sindh Resources (Pvt.) Limited (SSRL) (China | 7500 |
| Thar Power Company Ltd. (THARCO) SECM | 5000 |
| Oracle Coalfields UK | 1400 |
| GENCOS | 1320 |
| Sindh/ETON Japan Power | 3960 |
| Name of Power Plant | Capacity (MW) |
|---|---|
| Uch-II power plant | 404 |
| Guddu power plant | 747 |
| RLNG based power plant Bhikki Punjab | 1180 |
| RLNG based power plant Balloki Punjab | 1223 |
| RLNG based power plant Haveli Punjab | 1230 |
| RLNG based power plant Jhang Punjab | 1250 |
| Name of Power Plant | Capacity (MW) |
|---|---|
| Chashma Nuclear Power Plant Units-3 (C-3) and Unit-4 (C-4) | 680 |
| Karachi Nuclear Power Plants (K-2) and (K-3) | 2200 |
| Chashma Nuclear Power Plant Unit-5 | 1000 |
| Coastal Nuclear Power Hub Balochistan | 2200 |
| Name of Power Plant | Capacity (MW) |
|---|---|
| Solar PV power park Punjab | 1000 |
| Chinese solar Company | 500 |
| Zorlu Wind Energy Sindh | 56 |
| Fuji Fertilizer Energy Sindh | 50 |
| Capacity of wind power to be Commissioned | 2726 |
| Bagasse based power plant | 83 |
| Parameters | Assumptions |
|---|---|
| Transmission and Distribution (T&D) losses | Assumed to reduce from 17.37% in 2013 to 12.5% in 2020 and about 11.7% by 2035 as published by NTDC. |
| Emission factors of fuels | Default emission factors published by IPCC are available in LEAP TED database. |
| Reserve Margin | Assumed 12% according to the previous studies |
| Dispatch rule | Followed as merit order according to the government of Pakistan’s regulating body. |
| Load Duration Curve (LDC) | Calculated according to the published data in the “Pakistan energy yearbook 2013”. |
| Capacity credit | Capacity credit is assumed by previous studies. |
| Plant development | For presently operational oil and gas steam turbines existing technologies whereas for coal, combined cycle gas turbines, solar, wind and biomass new mature technologies are assumed. |
| Scenario | Objective | Main Resources |
|---|---|---|
| Reference (REF) | In this scenario, the government’s current plan and policy is followed. | As per the government plan and policy. |
| More Renewable Energy (MRR) | Under this scenario, the share of renewable energy resources (other than hydro) is increased while share of coal is decreased. | Renewable energy resources, solar, wind, and biomass. |
| More Hydro Energy (MRH) | Under this scenario, share of hydroelectric is increased while the share of coal is decreased. | Renewable energy resources, hydro, solar, wind, and biomass. |
| More hydro Nuclear Energy (MRHN) | Under this scenario, the share of hydro and nuclear is increased while reducing the share of coal. | Energy resources, hydro, nuclear, solar, wind, and biomass. |
| Fuel | Efficiency (%) | Output (GWh) | Capacity (GW) | Maximum Availability (%) |
|---|---|---|---|---|
| Hydro | 80 | 29,857 | 68 | 60 |
| Coal | 45 | 61 | 0.01223 | 75 |
| Natural Gas | 50 | 27,116 | 6.59 | 70 |
| Nuclear | 34 | 4553 | 0.75 | 85 |
| Oil | 40 | 34,534 | 8.2 | 50 |
| Other Renewable | 34 | 0 | 0 | 34 |
| Fuel Source | Percentage Share 2013 | Percentage Share 2035 |
|---|---|---|
| Oil | 36 | 2 |
| Natural Gas | 28.2 | 13 |
| Nuclear | 5 | 9 |
| Coal | 0.1 | 34 |
| Hydro | 31 | 37 |
| Renewable | 0.0 | 6 |
| Emissions | Units | 2013 | 2035 | |||
|---|---|---|---|---|---|---|
| REF | MRR | MRH | MRHN | |||
| CO2 | million tons | 34 | 143 | 103 | 126 | 117 |
| SO2 | kilo tons | 253 | 553 | 372 | 487 | 454 |
| NOx | kilo tons | 92 | 157 | 167 | 146 | 140 |
| CH4 | kilo tons | 1 | 1.8 | 2.3 | 1.7 | 1.6 |
| N2O | kilo tons | 0.2 | 82 | 41 | 70 | 63 |
© 2019 by the authors. Licensee MDPI, Basel, Switzerland. This article is an open access article distributed under the terms and conditions of the Creative Commons Attribution (CC BY) license (http://creativecommons.org/licenses/by/4.0/).
Share and Cite
Mengal, A.; Mirjat, N.H.; Walasai, G.D.; Khatri, S.A.; Harijan, K.; Uqaili, M.A. Modeling of Future Electricity Generation and Emissions Assessment for Pakistan. Processes 2019, 7, 212. https://doi.org/10.3390/pr7040212
Mengal A, Mirjat NH, Walasai GD, Khatri SA, Harijan K, Uqaili MA. Modeling of Future Electricity Generation and Emissions Assessment for Pakistan. Processes. 2019; 7(4):212. https://doi.org/10.3390/pr7040212
Chicago/Turabian StyleMengal, Abdullah, Nayyar Hussain Mirjat, Gordhan Das Walasai, Shoaib Ahmed Khatri, Khanji Harijan, and Mohammad Aslam Uqaili. 2019. "Modeling of Future Electricity Generation and Emissions Assessment for Pakistan" Processes 7, no. 4: 212. https://doi.org/10.3390/pr7040212
APA StyleMengal, A., Mirjat, N. H., Walasai, G. D., Khatri, S. A., Harijan, K., & Uqaili, M. A. (2019). Modeling of Future Electricity Generation and Emissions Assessment for Pakistan. Processes, 7(4), 212. https://doi.org/10.3390/pr7040212