Article

An Analysis of Antimicrobial Resistance of Clinical Pathogens from Historical Samples for Six Countries

1
Department of Chemical Engineering, Villanova University, Villanova, PA 19085, USA
2
Department of Health, Nutrition & Exercise Sciences, Immaculata University, Immaculata, PA 19345, USA
*
Author to whom correspondence should be addressed.
Processes 2019, 7(12), 964; https://doi.org/10.3390/pr7120964
Submission received: 2 October 2019 / Revised: 27 November 2019 / Accepted: 2 December 2019 / Published: 17 December 2019
(This article belongs to the Special Issue Big Data in Biology, Life Sciences and Healthcare)

Abstract

:
The spread of antimicrobial resistance pathogens in humans has increasingly become an issue that threatens public health. While the NCBI Pathogen Detection Isolates Browser (NPDIB) database has been collecting clinical isolate samples over time for various countries, few studies have been done to identify genes and pathogens responsible for the antimicrobial resistance in clinical settings. This study conducted the first multivariate statistical analysis of the high-dimensional historical data from the NPDIB database for six different countries from majorly inhabited landmasses, including Australia, Brazil, China, South Africa, the UK, and the US. The similarities among different countries in terms of genes and pathogens were investigated to understand the potential avenues for antimicrobial-resistance gene spreading. The genes and pathogens that were closely involved in antimicrobial resistance were further studied temporally by plotting time profiles of their frequency to evaluate the trend of antimicrobial resistance. It was found that several of these significant genes (i.e., aph(3″)-Ib, aph(6)-Id, blaTEM-1, and qacEdelta1) are shared among all six countries studied. Based on the time profiles, a large number of genes and pathogens showed an increasing occurrence. The most shared pathogens responsible for carrying the most important genes in the six countries in the clinical setting were Acinetobacter baumannii, E. coli and Shigella, Klebsiella pneumoniae and Salmonella enterica. South Africa carried the least similar antimicrobial genes to the other countries in clinical isolates.

1. Introduction

In a post-antibiotic era, an increasing prevalence of antimicrobial resistance, often abbreviated as “AMR”, has been identified as a critical health hazard on a global scale. An evaluation of 1606 inpatient and outpatient samples from an African country in 2014 revealed that pathogenic resistance to older established antibiotics is rising; furthermore, if unchecked, the magnitude of mortality attributable to AMR may climb to 10 million lives by 2050 [1]. The inappropriate regulation and use of basic medications, including antibiotics, are frequently cited reasons for the spread of this phenomenon. Global human antibiotic consumption in 2000 was at 54,083,964,813 single dose units (also considered standard units, or SU’s) and had spiked by 36% within a decade [2], with the World Health Organization estimating that only half of prescribed antibiotics are currently used correctly [3]. The common cold, for instance, is incorrectly believed by a third of people to be treatable with antibiotics and is also the most common condition for prescription [4]. Overexposure to antimicrobials enables pathogens to gain adaptive survivability via mutation or by acquiring resistance genes through horizontal transfer, in which plasmids containing genetic material disperse and pass between different species of bacteria.
Distinct regional variations in AMR occurrence have been observed to exist. For example, differences in methicillin-resistant Staphylococcus aureus (MRSA) rates were found among the United States, Canada, Latin America, and Europe [5]. Opportunely, the NCBI Pathogen Detection Isolates Browser (NPDIB), designed for studying genetic similarity and AMR repertoires in isolate profiles, has partnered with organizations like the CDC and WHO, allowing large volumes of data to be collected from tens of thousands of strains in the search for bacterial genomes with AMR genes [6]. Zhang et al. 2019 [7] presented the first study on the information from the NPDIB database. In particular, Zhang et al. analyzed the data for foodborne pathogen samples from six states in the US and studied the correlation between the location and resistance genes in foodborne pathogens. However, they did not incorporate a time-based analysis, but they did address gene transport in relation to the agricultural and livestock industries on a small scope.
The objective of this work was to investigate the status and trend of pathogens in the clinical setting and AMR genes relative to geographic location and time. Six different countries, each representing population-heavy regions of majorly inhabited landmasses, were selected and sampled: Brazil, China, Australia, South Africa, the United Kingdom, and the United States. Multivariate statistical analysis methods, i.e., principal component analysis (PCA) [8,9] and hierarchical clustering [10,11,12], were utilized to analyze high-dimensional clinical samples from the NPDIP database. The genes and pathogens that are heavily involved in antimicrobial resistance were identified for individual countries. From this, we aimed to study the status and trend of antimicrobial resistance for individual countries and then investigate the similarities and differences in time-based gene profiles between countries.

2. Materials and Methods

This work collected the data from the NCBI database, which was adapted into spreadsheets for multivariate statistical analysis. PCA was then performed on this data set on both pathogens and genes to represent the multidimensional data into a two-dimensional plot. This allows us to identify which gene or pathogen trends differed from the rest of the group, and could be deemed as ‘important’. The occurrence profiles over years for those important genes and pathogens were further used to study the trend of antimicrobial resistance. PCA and hierarchical clustering were also used to study the similarity of antimicrobial resistance in the six countries on the basis of the important genes and pathogens identified for those countries. The following hypotheses were tested in this study: (1) the microbial resistance in the clinical setting had an increasing trend over time; and (2) there were a certain amount of AMR genes and pathogens shared by different countries, which evidenced the occurrence of gene transfer between those selected countries.

2.1. Data Extracted from the NCBI Pathogen Detection Isolates Browser

The NCBI database provides the following information for each sample: the location of the sampling, time of the sampling, the name of the pathogen, antimicrobial resistant genotypes, isolation source, isolation type (i.e., clinical versus environmental samples), and others. The data utilized during this project were collected between 2010 and 2019, as most countries other than the US did not have data for other years in the NPDIP database. Clinical samples, which were sampled from human stool, blood, urine, sputum and other sources, were separately downloaded and pre-processed in MATLAB for each of the following six countries: Australia, Brazil, China, South Africa, the UK, and the US. Important pathogens and AMR genes were then identified from these samples. The pre-processed datasets were saved into Excel files for statistical analysis in the R language, which is one of the most commonly used tools in analyzing high-dimensional datasets. The data matrix imported into R for each individual country was organized in the following format: each row represents one clinical sample while each column provides the information for that sample. As seen in Figure 1, the information contained in the columns included the scientific name of the pathogen detected in the sample, the sampling year, the isolation sources, the number of AMR genes detected in the sample (i.e., number_amr_genes), and whether or not genes were detected in the sample (with a value of 1 indicating the gene shown in the column was found in the sample). Typically, the data matrix for a country contains thousands of rows (i.e., samples) and one to two hundred columns (i.e., most columns used for representing genes). Therefore, the data matrix is typically of one to two hundred dimensions.

2.2. Principal Component Analysis (PCA) and Hierarchical Clustering

PCA is one of the most commonly used approaches to visualize a multidimensional data set in a two-dimensional space. The new coordinate dimensions (e.g., principle component 1, i.e., PC1 in Figure 2A) are the linear combination of the original coordinate dimensions (e.g., x and y in Figure 2A). A lower principal component number, with 1 being the lowest, indicates a larger variance in the projections into that coordinate direction. In other words, more information about each of the points’ distinguishability is contained in that projected coordinate direction. This allows for more efficient discernment of individual data points, as it is impossible to visualize the data in more than three dimensions. By projecting the data points onto a plot characterized by principle components 1 and 2, it is possible to visualize the variation and identify possible outliers; in the case of this experiment, that means the important pathogens or important genes. The function prcomp() from R was used to perform principal component analysis on the data matrix for each of the six countries. Before implementing PCA to identify important genes, a data matrix was created for PCA in such a way that each gene was represented in a single row and each pathogen was listed in a column to record the occurrences of each gene in each detected pathogen in the samples for each country. This data matrix was transposed to identify the pathogens that carried AMR genes.
Once the high-dimensional data was projected onto the PC1~PC2 space, hierarchical clustering was further used to determine the important genes and pathogens by finding those that are the least similar to the rest of the genes and pathogens. Depicted in Figure 2B is a graph of genes along with a hierarchical clustering of them. Hierarchical clustering is a tool that groups similar items (e.g., genes and pathogens) into groups called clusters. It does so by finding the Euclidean distance between all pairs of points. The program then finds the pair closest to each other and graphs it on the hierarchical clustering graph as a tree. The program then replaces the two points with a single point at the midpoint of the two points mentioned and repeats this process slowly moving up the tree and replacing points until it comes down to a single point. From the hierarchy, it can be noted that branches that are higher up on the tree are the farthest from certain central branches. Data points associated with these branches are typically the outliers shown in the PC1~PC2 space, which correspond to the genes and pathogens that are mostly involved in antimicrobial resistance. The hierarchical clustering tree along with the outliers in the PC1~PC2 space was thus used in this work to identify both the important genes and important pathogens in the data.
On the basis of those genes identified as important for antimicrobial resistance in individual countries, the genes that were common in all six countries were further used to construct a data matrix in which each row corresponded to one country and each column represented one gene. The matrix recorded the occurrences of each gene in each country during 2010 to 2019. PCA and hierarchical clustering were then implemented to the data matrix to cluster the six countries and study the similarity of those countries in carrying those AMR genes. Similarly, a data matrix was built for the occurrences of those common pathogens that were found in the six countries. In other words, each column in the data matrix represented one clinical pathogen, while each row was associated with one of the six countries. The similarity of the six countries in carrying those important clinical pathogens was then studied from the results returned by PCA and hierarchical clustering.

2.3. Investigation of the Trend of Antimicrobial Resistance

The historical profiles of the genes and pathogens mostly involved in antimicrobial resistance were plotted to study the trend of antimicrobial resistance. In particular, the historical profiles of those important genes and pathogens were plotted over years. In order to account for differences in the number of samples collected each year, we normalized these historical profiles by dividing the total occurrences of genes/pathogens that were detected in that year with the number of samples obtained in the same year. This can resolve the bias due to the fact that some years have more samples than others.

3. Results

3.1. Identification of Important Genes in Clinical Samples from Australia, Brazil, China, South Africa, the UK, and the US

The PCA and clustering approaches described in the Materials and Methods section were used to identify significant resistance genes from the six selected countries. The projection and detailed visualization of data, made possible by hierarchical clustering, enabled the schematic comparison of those AMR genes. The result of hierarchical clustering for the US is shown in Figure 3 as an example for illustration. As there are more than 100 AMR genes in the dataset for the United States, those genes, especially those with few occurrences, are lumped together in the PC1~PC2 space. It is thus challenging to show all these genes clearly in the PC1~PC2 space. That is why only the result of hierarchical clustering is shown below. The genes that were heavily tested in the antimicrobial-resistance pathogens are typically those outliers in the PC1~PC2 space and those in the top few levels of branches in the hierarchical clustering tree. For example, the genes in the branches excluded by the red rectangle were identified as the genes important for antimicrobial resistance in the pathogens in the clinical samples. A similar approach was applied to identify important AMR genes for the other five countries. Table 1 summarizes the important AMR genes for the six countries. It can be seen that Brazil has the largest amount of important AMR genes, while South Africa harbors a significantly lower quantity. The genes that are shared by five and six countries are marked in the colors of blue and red, respectively. They can be generally categorized into: aminoglycoside phosphotransferase (aph(3″)-Ib and aph(6)-Id), beta-lactamase (blaEC and blaTEM-1), macrolide 2′-phosphotransferase (mph(A)), quaternary ammonium compound-resistance protein (qacEdelta1), and sulfonamide resistance genes (sul1 and sul2).
The genes shown in Table 1 were further used to study the similarities of the six countries in carrying those AMR genes in the clinical samples. In particular, the occurrences of these genes were recorded in a data matrix in which each row represented one country and each column is associated with one gene. Figure 4 shows the results of principal component analysis and hierarchical clustering on the data matrix. The UK and the US are the most similar in terms of genes with a total of 16 genes in common (as shown in Table 1). The aadA genes produce resistance to antibiotics streptomycin and spectomycin [13]. The sul genes produce resistance to sulfonamides [14] and tet genes produce resistance to tetracyclines [15]. All of the genes found in the UK were also found in the US. Australia and Brazil also are similar to each other based on the hierarchical clusters. South Africa appears to be an outlier among the countries in terms of genes. It tends to share the least number of genes in common with other countries. South Africa and China share merely four genes (aph(3″)-Ib, aph(6)-Id, blaTEM-1, qacEdelta1), which are also the same genes shared by all countries.

3.2. Identification of Important Clinical Pathogens That Carried Antimicrobial Resistance Genes in Australia, Brazil, China, South Africa, the UK, and the US

In addition to studying the genes mostly involved in antimicrobial resistance, PCA and hierarchical clustering were performed on the datasets to identify the clinical pathogens mostly involved in carrying AMR genes within each country. Table 2 below lists the important pathogens from the six countries. Seven pathogens, including Acinetobacter baumannii, E. coli and Shigella, Enterobacter, Klebsiella pneumoniae, Listeria monocytogenes, Mycobacterium tuberculosis, and Salmonella enterica, were found to be important to more than one of the analyzed countries, with the exception of Vibrio cholerae and Pseudomonas aeruginosa (the former only found important in China and the latter in Brazil). E. coli and Shigella and Klebsiella pneumoniae are the two pathogens that are common in all six countries. Acinetobacter baumannii and Salmonella enterica are shared by all countries other than South Africa. Mycobacterium Tuberculosis is important only in South Africa and Australia.
The occurrence of the important pathogens listed in Table 2 were further used to study the similarities of the six selected countries in carrying those clinical pathogens. It can be seen in Figure 5 that South Africa shows the least similarity in its clinical pathogens to the other five countries. Following South Africa, China contains the least similar clinical pathogens to the other four countries. Compared to Austria and Brazil, the UK is clustered with the US in the same group in the hierarchical clustering tree in Figure 5B. This indicates that the UK and the US share more similar clinical pathogens than the other selected countries.

3.3. Investigation of the Trend in Antimicrobial Resistance from the Historical Profiles of Genes and Pathogens that Were Mostly Involved in Antimicroibal Resistance in Australia, Brazil, China, South Africa, the UK, and the US

The historical occurrence profiles of the important genes and pathogens identified in Section 3.1 and Section 3.2 were plotted in this section to investigate the trend of antimicrobial resistance in the six selected countries. The genes and pathogens with an increasing trend were then identified from their profiles. For example, Figure 6A shows the profiles of the four antimicrobial genes with an increasing trend in the US dataset, while Figure 6B illustrates the profiles of the important clinical pathogens with a generally increasing trend in the US in recent years. In particular, the portion of E. coli and Shigella in the annual clinical samples went down from 2010 to 2013 and then generally went up after 2013. This pathogen was regarded as a pathogen with an increasing occurrence recently. The occurrence of Salmonella enterica generally increased from 2013, although fluctuation was observed over time. Similar profiles were obtained for the important pathogens from the other five countries, and pathogens showing a similar historical trend were regarded as pathogens with increasing occurrences. Table 3 and Table 4 list the genes and pathogens from Table 1 and Table 2 that show an increasing trend for each country.
Table 3 below displays the important genes listed in Table 1 that show generally increasing occurrences in the six countries. Among those genes shown in Table 1, the portions of genes with increasing occurrence over time for individual countries are: 54.5% for Australia, 56.3% for Brazil, 50% for China, 16.7% for South Africa, 75% for UK and 12.5% for US. While each country has certain genes with increasing occurrence, South Africa and the US have the lowest portions of genes with increasing trends.
Table 4 lists the clinical pathogens listed in Table 2 with increasing occurrence over time. Among those important pathogens shown in Table 2, the portions of clinical pathogens with increasing occurrence are: 40% for Australia, 40% for Brazil, 33.3% for China, 40% for South Africa, 0% for the UK and 40% for the US. This implies that 30 to 40% of the important clinical pathogens in most countries (with the exception of the UK) generally had increasing occurrences in the last 9 years.

4. Discussions and Conclusions

4.1. Common Genes and Pathogens in the Six Studied Countries

The important genes shown in Table 1 represent the AMR genes most often carried by pathogens in a particular country. It was further analyzed to identify the AMR genes unique to each studied country (Table 5). Genes aac(3)-I and blaADC-30 are both unique to Australia. The genes unique to Brazil include aac(3)-IIa, aac(6′)-Ib, aadA7, aph(3′)-IIb, blaCTX-M-15, blaOXA, blaOXA-494, blaOXA-56, blaPDC-5, blaSPM-1, catB7, cmx, crpP, and rmtD1. For China, there are the unique genes armA, blaSHV-11, mcr-1.1, mph(E), and msr(E). South Africa contains the unique genes aac(2′)-Ic, blaA, erm37, fosX, and lin. The UK does not have any unique genes. Lastly, the US has the unique genes blaCMY-2 and fosA7.
The important genes shared by three or more countries in Table 1 were further identified and are listed in Table 6. They can be categorized by function: antibiotic-degrading enzymes, efflux pump, and modified antibiotic binding target. The majority of the genes produce antibiotic-degrading enzymes (aadA1, aadA2, aph(3″)-Ib, aph(3′)-Ia, aph(6)-Id, blaEC, blaTEM-1, catA1, mph(A), sat2). Three of these common genes produce efflux pumps (qacEdelta1, tet(A), tet(B)), and one causes a modified antibiotic binding target (dfrA1, sul1, sul2). All countries share the genes aph(3″)-Ib, aph(6)-Id, blaTEM-1, and qacEdelta1. In particular, aph genes produce aminoglycoside modifying enzymes that catalyze ATP-dependent phosphorylation of a hydroxyl group [16]. bla genes produce beta-lactamases, which hydrolyze the beta-lactam bond in susceptible beta-lactam antibiotics [17]. The gene qacEdelta1 produces resistance to quaternary ammonium compounds [18].
In addition to the AMR genes shared by the six selected countries, all countries also share the pathogens E. coli and Shigella, and Klebsiella pneumoniae, as seen in Table 7. E. coli and Shigella were found to be responsible for carrying the genes aph(3″)-Ib, aph(6)-Id, blaEC, blaTEM-1, mph(A), qacEdelta1, sul1, and sul2 across the six countries. Klebsiella pneumonia is responsible for carrying the same eight genes as E. coli and Shigella, excluding blaEC. In addition, Salmonella enterica, which is shared by five countries, is largely responsible for carrying the same eight genes as E. coli and Shigella, excluding blaEC and mph(A). The pathogens Listeria monocytogenes, Mycobacterium tuberculosis, Pseudomonas aeruginosa, and Vibrio cholerae are unique to each country. These unique pathogens were not found to be the ones mostly carrying AMR genes. The pathogens shared by the most countries were also found to carry the greatest number of AMR genes.

4.2. Similarites of the Six Selected Countries in Carrying AMR Genes and Clinical Pathogens

Figure 4 and Figure 5 show that the six countries are clustered into three groups according to the AMR genes and pathogens carried in them: the US and the UK in one group, Australia and Brazil and China in one group, and South Africa in one group. The number of AMR genes that are shared between every two countries is listed in Figure 7. In contrast to Figure 4, the occurrence frequencies of those shared genes are not reflected in Figure 7. In spite of this, Figure 7 shows that the US and the UK contain a large number of AMR genes and that South Africa has the lowest number of AMR genes in common with other countries.
Some countries may be more similar than others due to the number of interactions that occur in between the countries. For example, the US and UK are the most similar based on AMR genes. The US imported $60,783 million goods from the UK and exported $66,312 million goods to the UK in 2018 [19]. On the other hand, South Africa is the least similar to the US, and the US trade in goods with South Africa in 2018 included $5,517 million in imports and $8,467 million in exports [19]. Interactions, like trade, may allow for the transfer of genes between countries as they can be carried along with the traded goods. For example, genes carried by microorganisms in livestock products (e.g., meats) can be transferred between countries. These microorganisms then spread genes to other microorganisms in human bodies or in the environment.
Climate factors may be a contributing factor to the countries’ similarities. The US and UK both share similar conditions with a mostly temperature climate. The similarity in conditions would allow for similar species of pathogens to be present in the different countries. In addition, Australia and Brazil also share similar annual average temperatures, which could be a contributing factor to their similarity based on pathogens. Another factor contributing to similarity could be the amount of tourism or travel to the countries. High levels of travel to certain countries could cause pathogen or gene transfer among tourists and residents of the country, which would lead to similarities in pathogens and genes to other countries. For example, the US and the UK are both contained in a cluster that does not include South Africa. Both the UK and the US have high levels of tourism (the UK with 36 million international tourist arrivals in 2016 and the US with 76 million international tourist arrivals in 2016 [20]), while South Africa has a lower level (10 million international tourist arrivals in 2016 [20]). The differences in the levels of travel could have contributed to the differences in cluster placement.

4.3. The Implication of AMR Gene Transfer in the Studied Countries

Due to the number of shared AMR genes and pathogens found across the studied countries and the comparatively small number of unique ones, it can be inferred that pathogenic similarities are occurring between continents. This gene transfer among pathogens of different countries would result in increased occurrences of AMR genes and increased similarity among the countries. This validated our hypothesis that gene transfer existed between the countries studied. The important genes shared by at least five countries were studied to determine which pathogens carry and transfer those genes. This was determined by identifying which pathogens had the highest frequency of those particular genes. The genes were found to be carried by four pathogens: Acinetobacter baumannii, E. coli and Shigella, Klebsiella pneumoniae and Salmonella enterica. Acinetobacter baumannii carries the genes aph(3″)-Ib and aph(6)-Id. E. coli and Shigella carries the genes aph(3″)-Ib, aph(6)-Id, aph(3″)-Ib, blaEC, blaTEM-1, mph(A), qacEdelta1, sul1, and sul2. Klebsiella pneumoniae carries the genes aph(3″)-Ib, aph(6)-Id, aph(3″)-Ib, blaTEM-1, mph(A), qacEdelta1, sul1, and sul2. Salmonella enterica carries the genes aph(3″)-Ib, aph(6)-Id, aph(3″)-Ib, blaTEM-1, qacEdelta1, sul1, and sul2.
Gene transfer could be due to increased travel and migration between countries, as passenger numbers are predicted to increase at more than 5% per year in the next 10 years [5]. With the continued rise in globalization and travel, it is becoming easier for pathogens to travel across countries and interact with other pathogens. These interactions include gene transfer, which can result in new resistance and diseases. A study in 2016 found that new antimicrobial resistance in colonizing E. coli was associated with international travel [7].

4.4. The Trend of Amtimicrobial Resistance Indicated from the Histroical Profiles of AMR Genes and Clinical Pathogens

The normalized historical profiles of the AMR genes and clinical pathogens shown in Figure 6 are replotted with the actual numbers of samples containing those genes and pathogens in Figure 8. The year 2019 was not considered in the analysis of the historical profiles because data still has yet to be collected for the remainder of the year 2019. It can be seen that the numbers of samples are low in early years when compared to those for recent years. This may be due to the following reasons: (1) people did not collect samples as often in the beginning of this decade; (2) limited resources were available to collect and input the samples into the NPDIB database; (3) the antimicrobial-resistance became more severe and thus caused more resistance cases. Therefore, the increase in the actual numbers of samples over the years may not be mainly due to the increase in antimicrobial resistance. That is why the normalized profiles (i.e., Figure 6) were used in this work to evaluate the trend of antimicrobial resistance from the data.
Based on the normalized values of the gene frequency over time, certain portions of important AMR genes listed in Table 1 showed an increasing occurrence. In particular, 54.5% AMR genes for Australia, 56.3% AMR genes for Brazil, 50% AMR genes for China, 16.7% AMR genes for South Africa, 75% AMR genes for the UK and 12.5% AMR genes for the US showed an increasing occurrence, especially in the recent years from 2014 to 2018. When the absolute values are used, the increasing trend is even more apparent. The trend is contributing to the worsening AMR epidemic that is posing a critical health hazard on a global scale. It can be correlated to the global increase in antibiotic consumption in recent years. One study involving 76 countries found that global consumption increased 65% and the antibiotic consumption rate increased 39% between 2000 and 2015 [21]. The increase in AMR genes could be linked to increased travel between countries. International tourist arrivals increased by 6% from 2017 to 2018 [22]. One study found a correlation between new AMR and international travel, with 9% of participants acquiring new strains of ESBL-producing E. coli [23].

Author Contributions

Conceptualization, Q.J. and Z.H.; methodology, K.L., J.Z., T.D., J.P., D.D., Q.J., and Z.H.; formal analysis, K.L., J.Z., T.D., J.P., D.D., Q.J. and Z.H.; resources, Q.J. and Z.H.; data curation, Q.J. and Z.H.; writing—original draft preparation, K.L., J.Z., T.D., J.P., and D.D.; writing—review and editing, Q.J., and Z.H.; supervision, Q.J., and Z.H.; project administration, Q.J., and Z.H.

Funding

This research received no external funding.

Conflicts of Interest

The authors declare no conflict of interest.

References

  1. O’Neill, J. Antimicrobial Resistance: Tackling a Crisis for the Health and Wealth of Nations; The Review on Antimicrobial Resistance: London, UK, 2014. [Google Scholar]
  2. Van Boeckel, T.P.; Gandra, S.; Ashok, A.; Caudron, Q.; Grenfell, B.T.; Levin, S.A.; Laxminarayan, R. Global Antibiotic Consumption 2000 to 2010: An Analysis of Cross Mark 742 National Pharmaceutical Sales Data. Lancet Infect. Dis. 2014, 14, 742–750. [Google Scholar] [CrossRef]
  3. Bank, W. Drug-Resistant Infections: A Threat to Our Economic Future; World Bank: Washington, DC, USA, March 2017. [Google Scholar]
  4. McNulty, C.A.; Boyle, P.; Nichols, T.; Clappison, P.; Davey, P. The public’s attitudes to and compliance with antibiotics. J. Antimicrob. Chemother. 2007, 60, I63–I68. [Google Scholar] [CrossRef] [PubMed] [Green Version]
  5. Diekema, D.J.; Pfaller, M.; Shortridge, D.; Zervos, M.; Jones, R.N. Twenty-year trends in antimicrobial susceptibilities among Staphylococcus aureus from the SENTRY antimicrobial surveillance program. Open Forum Infect. Dis. 2019, 6, S47–S53. [Google Scholar] [CrossRef]
  6. Available online: https://www.ncbi.nlm.nih.gov/pathogens/about/ (accessed on 15 August 2019).
  7. Zhang, N.N.; Liu, E.; Tang, A.; Ye, M.C.; Wang, K.; Jia, Q.; Huang, Z.Y. Data-Driven Analysis of Antimicrobial Resistance in Foodborne Pathogens from Six States within the US. Int. J. Environ. Res. Public Health 2019, 16, 4835. [Google Scholar] [CrossRef] [Green Version]
  8. Qin, S.J. Statistical process monitoring: Basics and beyond. J. Chemom. 2003, 17, 480–502. [Google Scholar] [CrossRef]
  9. Kourti, T. Application of latent variable methods to process control and multivariate statistical process control in industry. Int. J. Adapt. Control. Signal. Process. 2005, 19, 213–246. [Google Scholar] [CrossRef]
  10. Arnau, V.; Mars, S.; Marin, I. Iterative cluster analysis of protein interaction data. Bioinformatics 2005, 21, 364–378. [Google Scholar] [CrossRef] [PubMed] [Green Version]
  11. Wang, X.Z.; Smith, K.; Hyndman, R. Characteristic-based clustering for time series data. Data Min. Knowl. Discov. 2006, 13, 335–364. [Google Scholar] [CrossRef]
  12. Bar-Joseph, Z.; Demaine, E.D.; Gifford, D.K.; Srebro, N.; Hamel, A.M.; Jaakkola, T.S. K-ary clustering with optimal leaf ordering for gene expression data. Bioinformatics 2003, 19, 1070–1078. [Google Scholar] [CrossRef] [Green Version]
  13. Clark, N.C.; Olsvik, O.; Swenson, J.M.; Spiegel, C.A.; Tenover, F.C. Detection of a streptomycin/spectinomycin adenylyltransferase gene (aadA) in Enterococcus faecalis. Antimicrob. Agents Chemother. 1999, 43, 157–160. [Google Scholar] [CrossRef] [Green Version]
  14. Pei, R.T.; Kim, S.C.; Carlson, K.H.; Pruden, A. Effect of River Landscape on the sediment concentrations of antibiotics and corresponding antibiotic resistance genes (ARG). Water Res. 2006, 40, 2427–2435. [Google Scholar] [CrossRef]
  15. Liu, M.M.; Zhang, Y.; Yang, M.; Tian, Z.; Ren, L.R.; Zhang, S.J. Abundance and Distribution of Tetracycline Resistance Genes and Mobile Elements in an Oxytetracycline Production Wastewater Treatment System. Environ. Sci. Technol. 2012, 46, 7551–7557. [Google Scholar] [CrossRef] [PubMed]
  16. Janssen, G.R.; Ward, J.M.; Bibb, M.J. Unusual Transcriptional and Translational Features of the Aminoglycoside Phosphotransferase Gene (Aph) from Streptomyces-Fradiae. Genes Dev. 1989, 3, 415–429. [Google Scholar] [CrossRef] [PubMed] [Green Version]
  17. Literak, I.; Dolejska, M.; Radimersky, T.; Klimes, J.; Friedman, M.; Aarestrup, F.M.; Hasman, H.; Cizek, A. Antimicrobial-resistant faecal Escherichia coli in wild mammals in central Europe: Multiresistant Escherichia coli producing extended-spectrum beta-lactamases in wild boars. J. Appl. Microbiol. 2010, 108, 1702–1711. [Google Scholar] [CrossRef] [PubMed]
  18. Sidhu, M.S.; Sorum, H.; Holck, A. Resistance to quaternary ammonium compounds in food-related bacteria. Microb. Drug Resist.-Mech. Epidemiol. Dis. 2002, 8, 393–399. [Google Scholar] [CrossRef] [PubMed]
  19. Trade, F.U.S. Trade in Goods by Country. Available online: https://www.census.gov/foreign-trade/balance/index.html (accessed on 20 November 2019).
  20. Antunes, P.; Machado, J.; Sousa, J.C.; Peixe, L. Dissemination of sulfonamide resistance genes (sul1, sul2, and sul3) in Portuguese Salmonella enterica strains and relation with integrons. Antimicrob. Agents Chemother. 2005, 49, 836–839. [Google Scholar] [CrossRef] [PubMed] [Green Version]
  21. Blyth, D.M.; Mende, K.; Maranich, A.M.; Beckius, M.L.; Harnisch, K.A. Antimicrobial resistance acquisition after international travel in U.S. travelers. Trop. Dis. Travel Med. Vaccines 2016, 2. [Google Scholar] [CrossRef] [PubMed] [Green Version]
  22. CDC. What Is Salmonella. 2019. Available online: https://www.cdc.gov/salmonella/general/index.html (accessed on 15 August 2019).
  23. Murray, C.K.; Blyth, D.M. Acquisition of Multidrug-Resistant Gram-Negative Organisms during Travel. Mil. Med. 2017, 182, 26–33. [Google Scholar] [CrossRef] [PubMed] [Green Version]
Figure 1. Snapshot of a section of the extracted data from the NCBI Pathogen Detection Isolates Browser for the US.
Processes 07 00964 g001
Figure 2. 
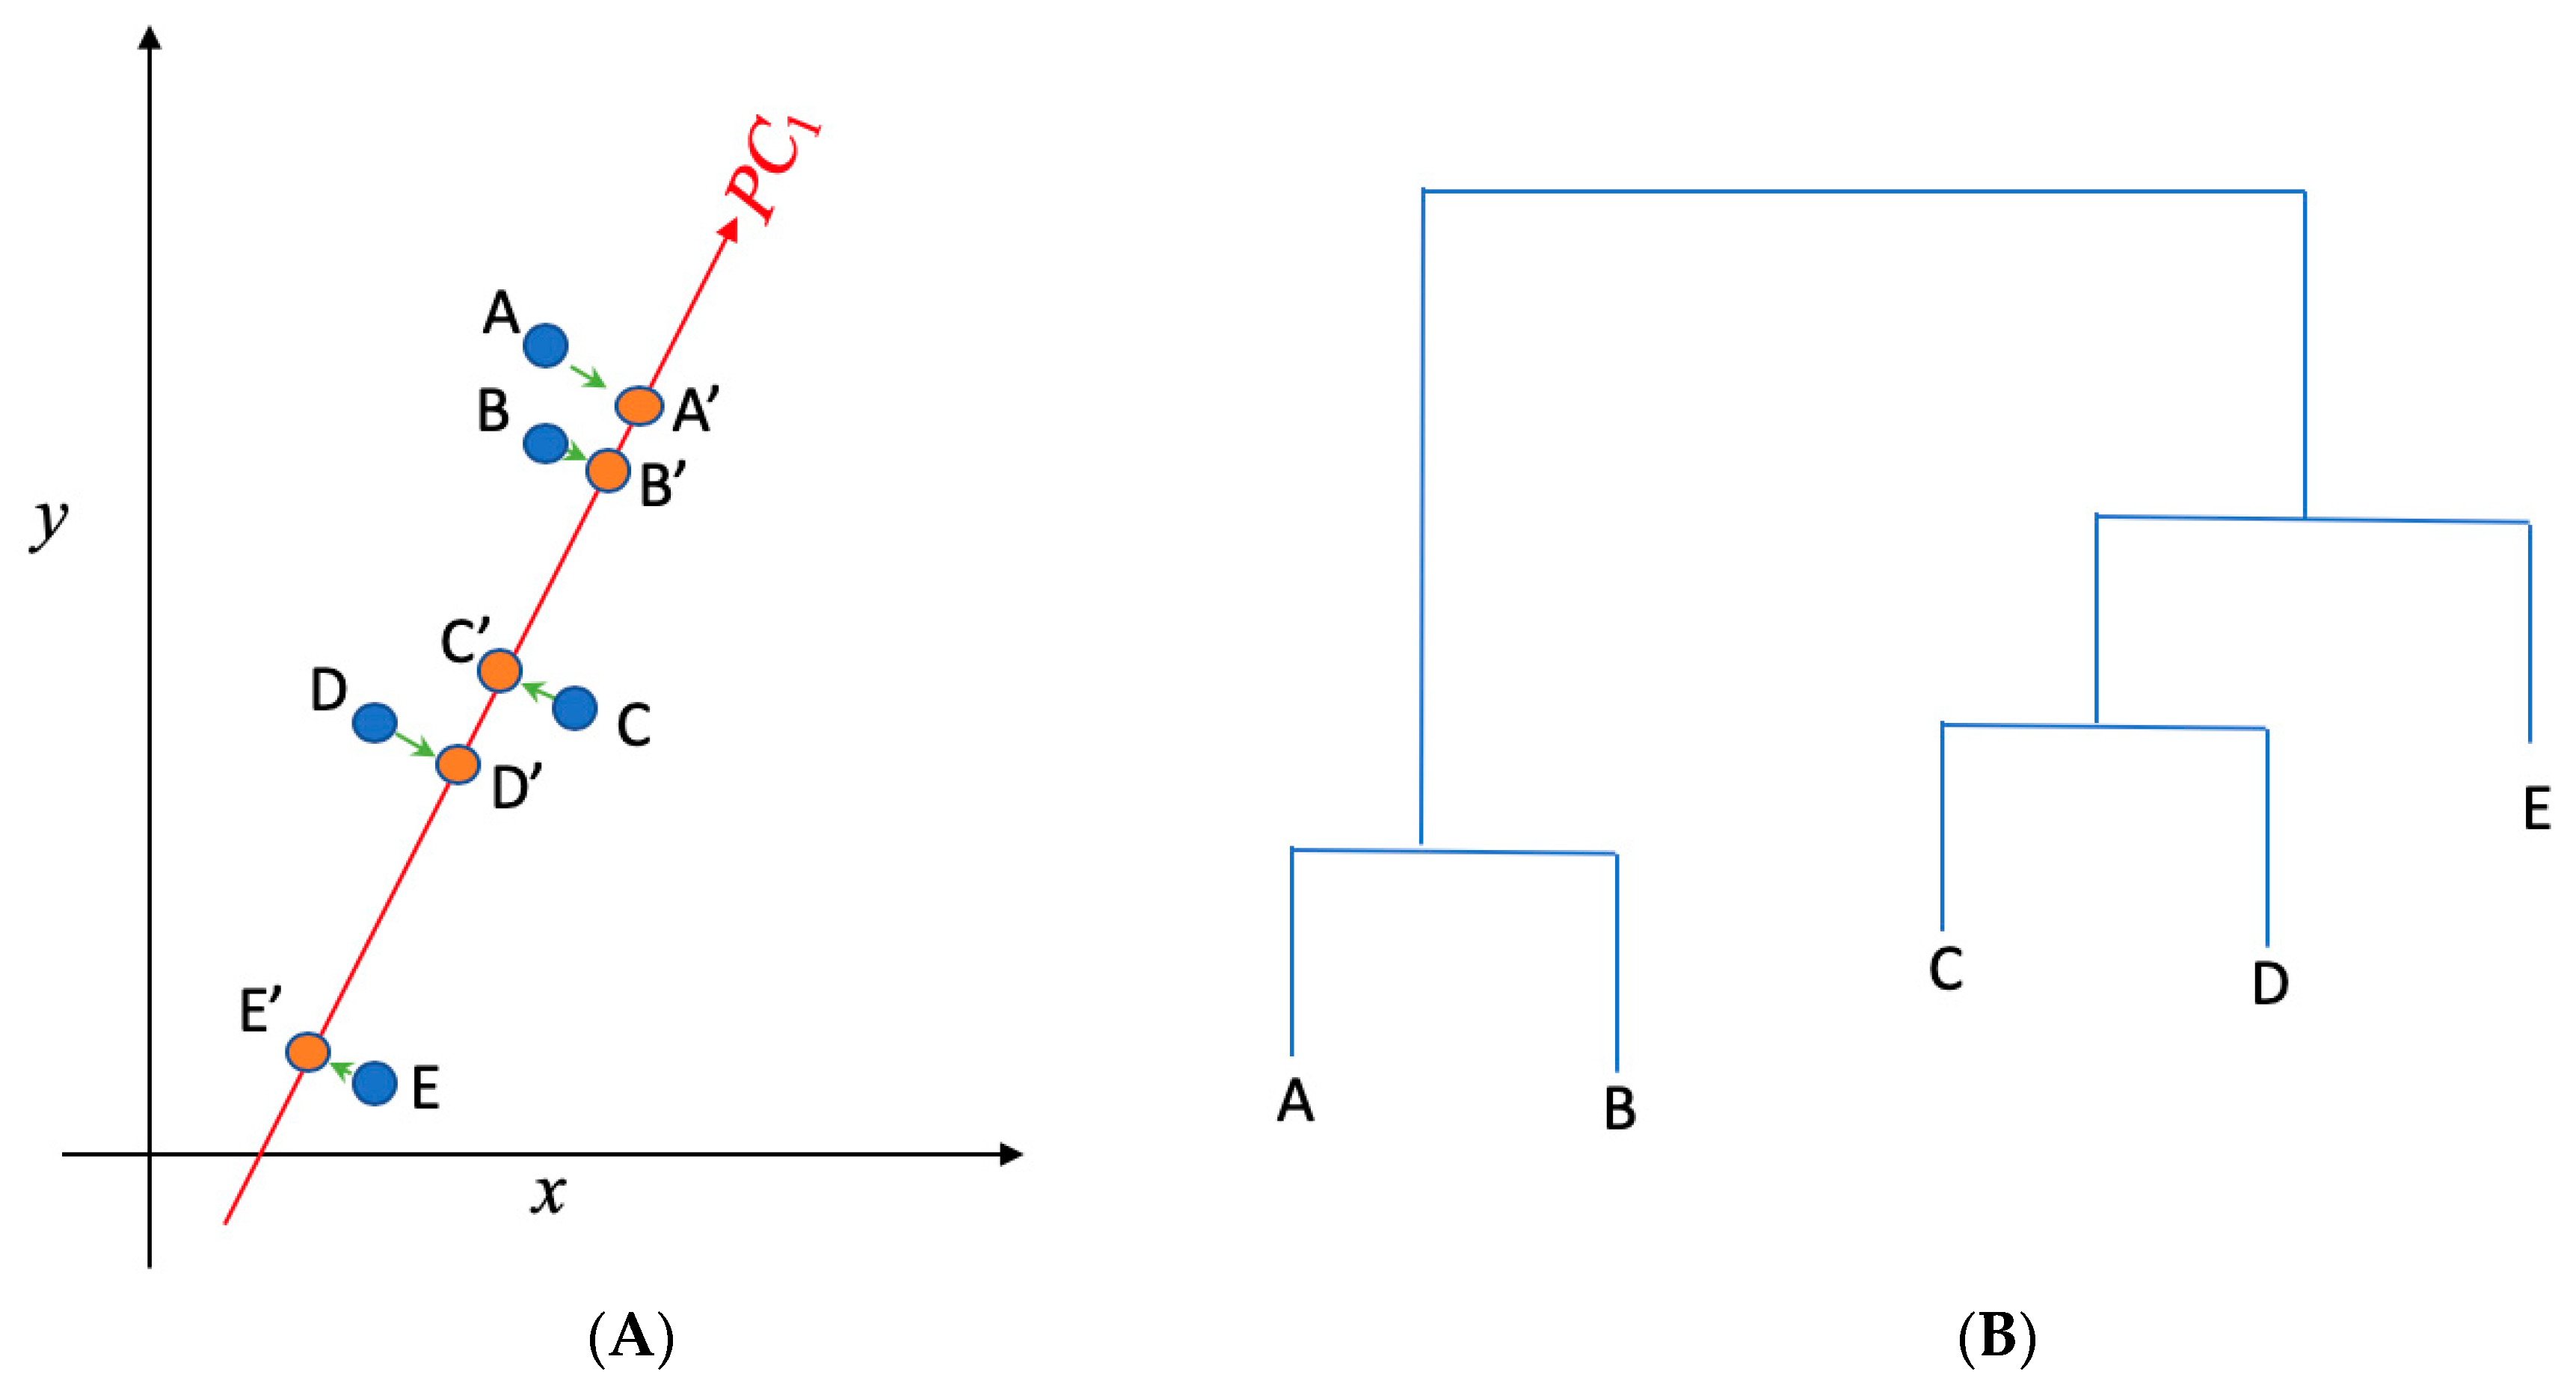
(A) Principal component analysis is used to present the two dimensional (x,y) gene data into one dimensional space (PC1); (B) hierarchical clustering is implemented to cluster genes in (A) into separate groups. A, B, C, D, and E present the data in the x~y space in (A), while A′, B′, C′, D′, and E′ present the projections of those data points in the PC1 space. While A, B, and C are not distinguishable in the x direction (as they have the similar projections onto x), they can be separated in the PC1 direction. PC1 represents the direction that returns the largest variance in the data projections onto it. Steps shown in (A) and (B) were used to separate and identify important AMR genes and clinical pathogens from the data.
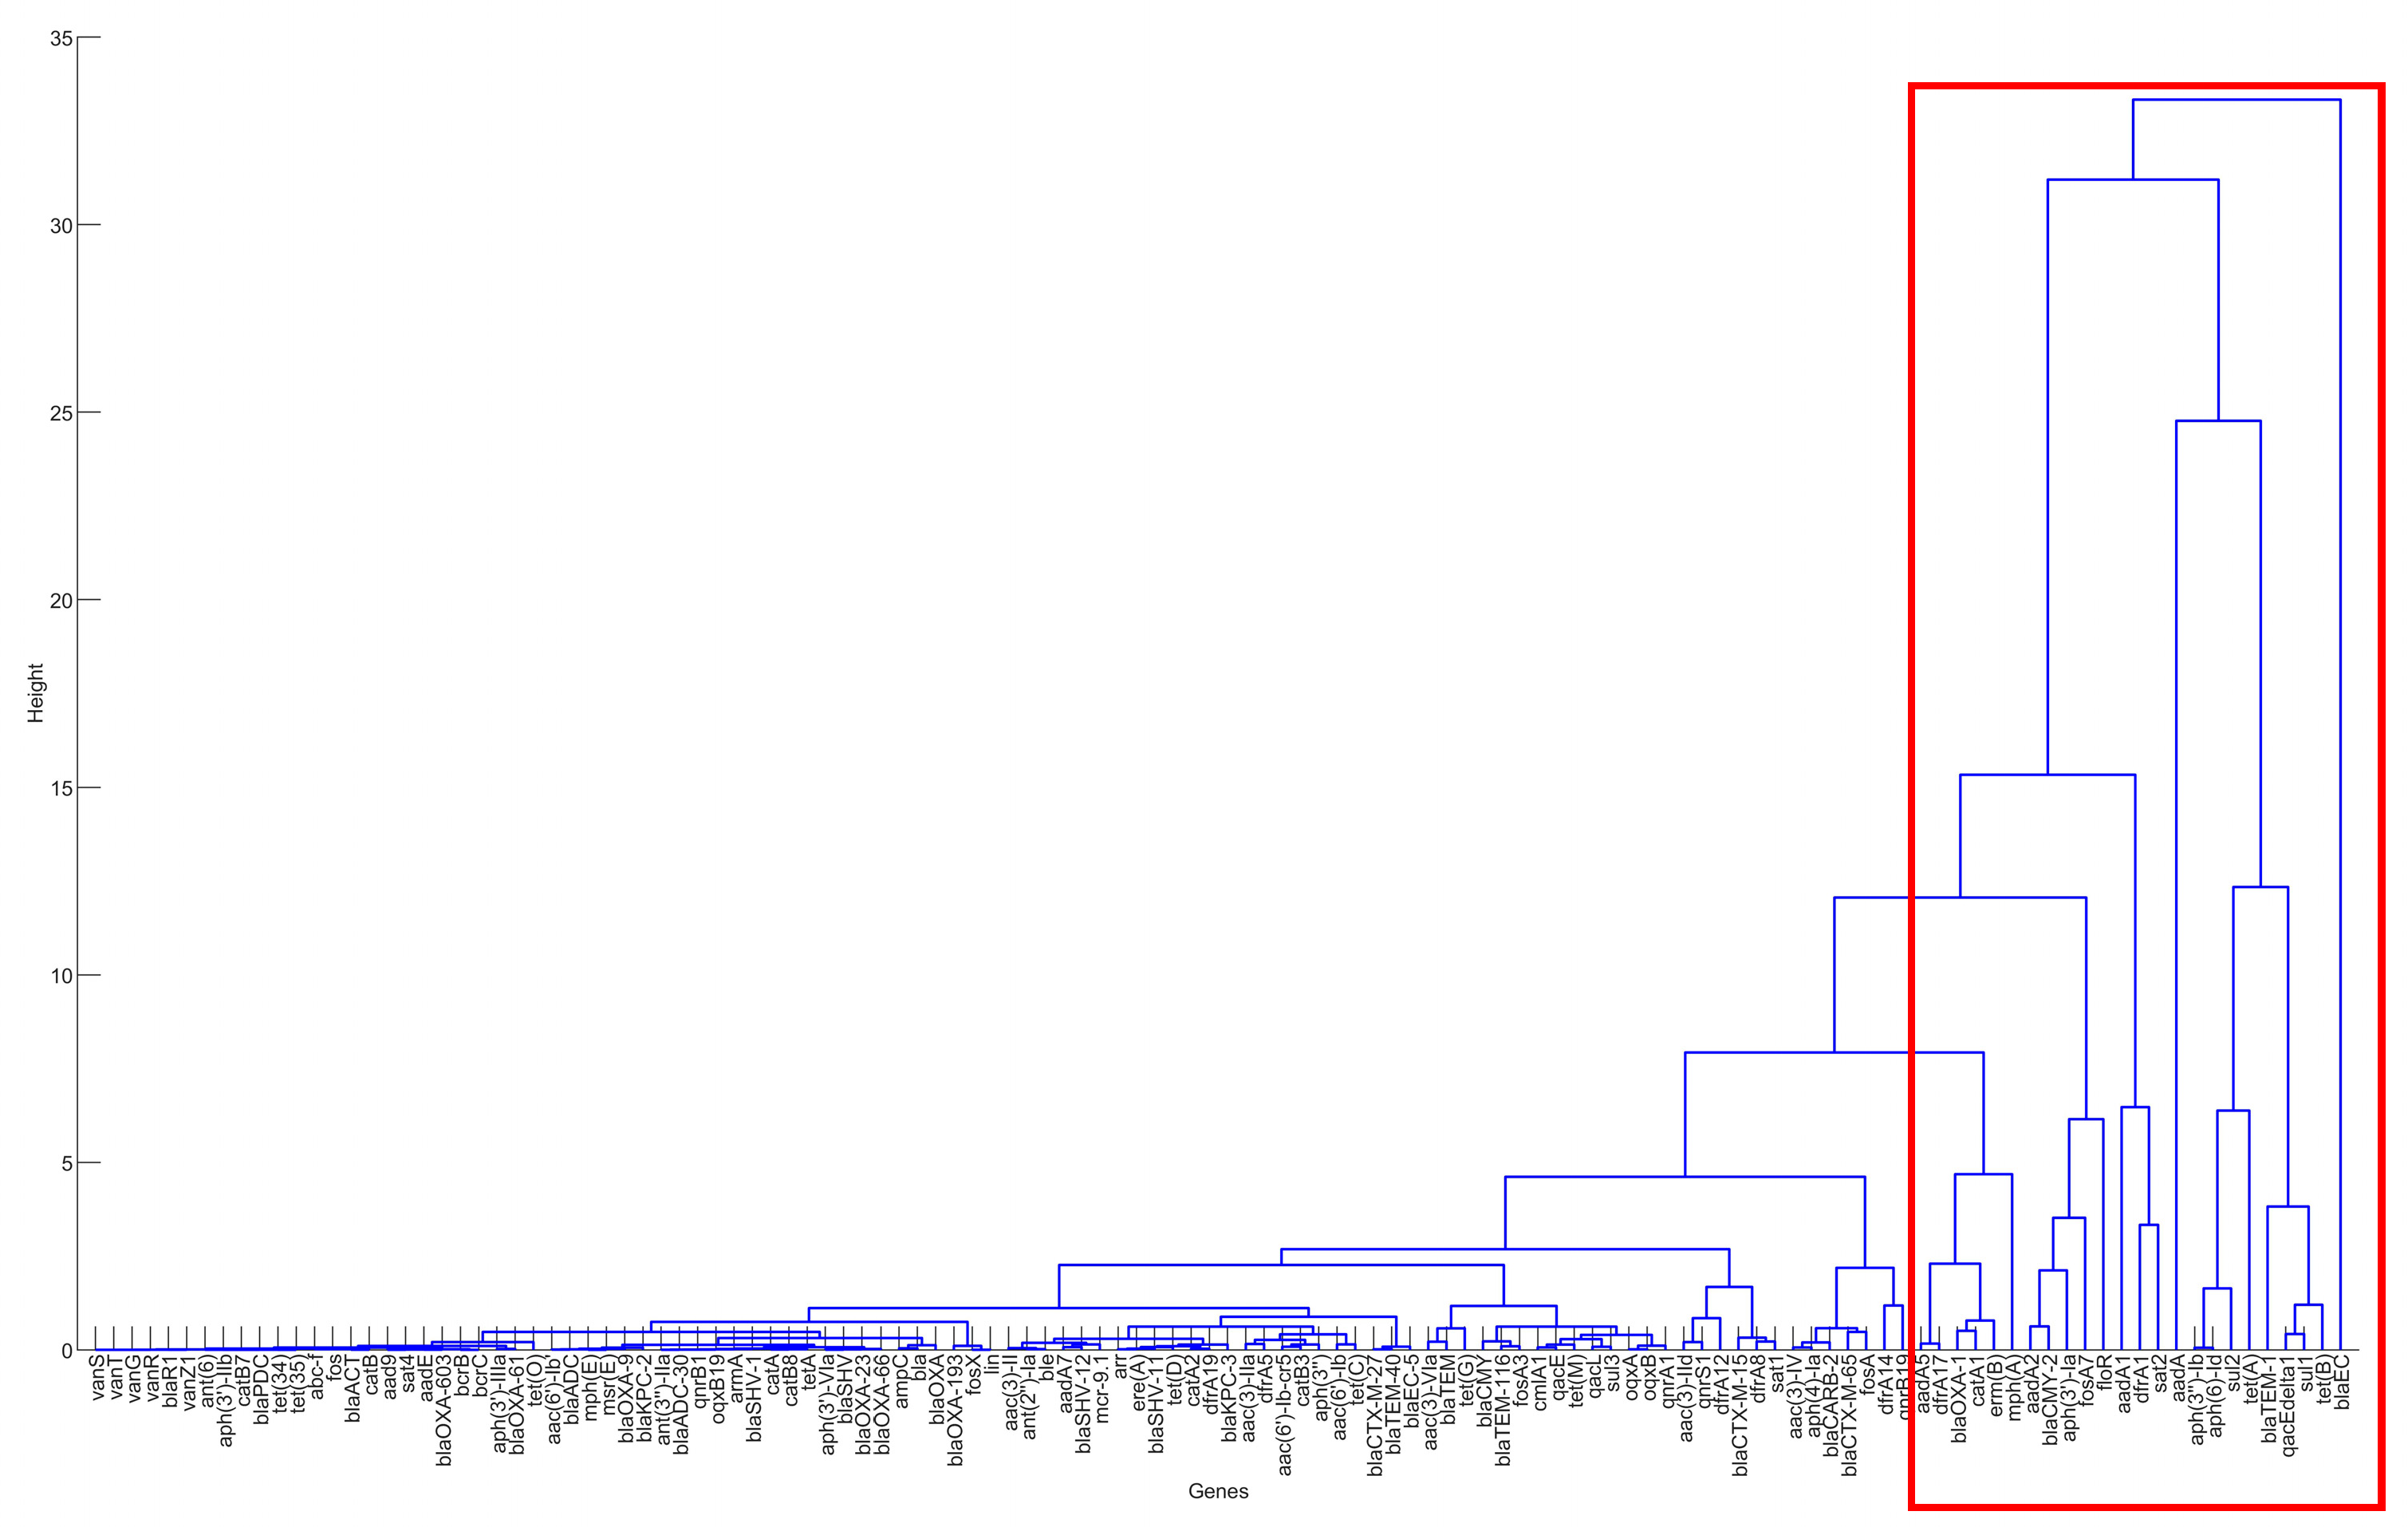
Processes 07 00964 g002
Figure 3. The result of hierarchical clustering for the genes in the clinical samples for the United States, 2010–2019.
Processes 07 00964 g003
Figure 4. 
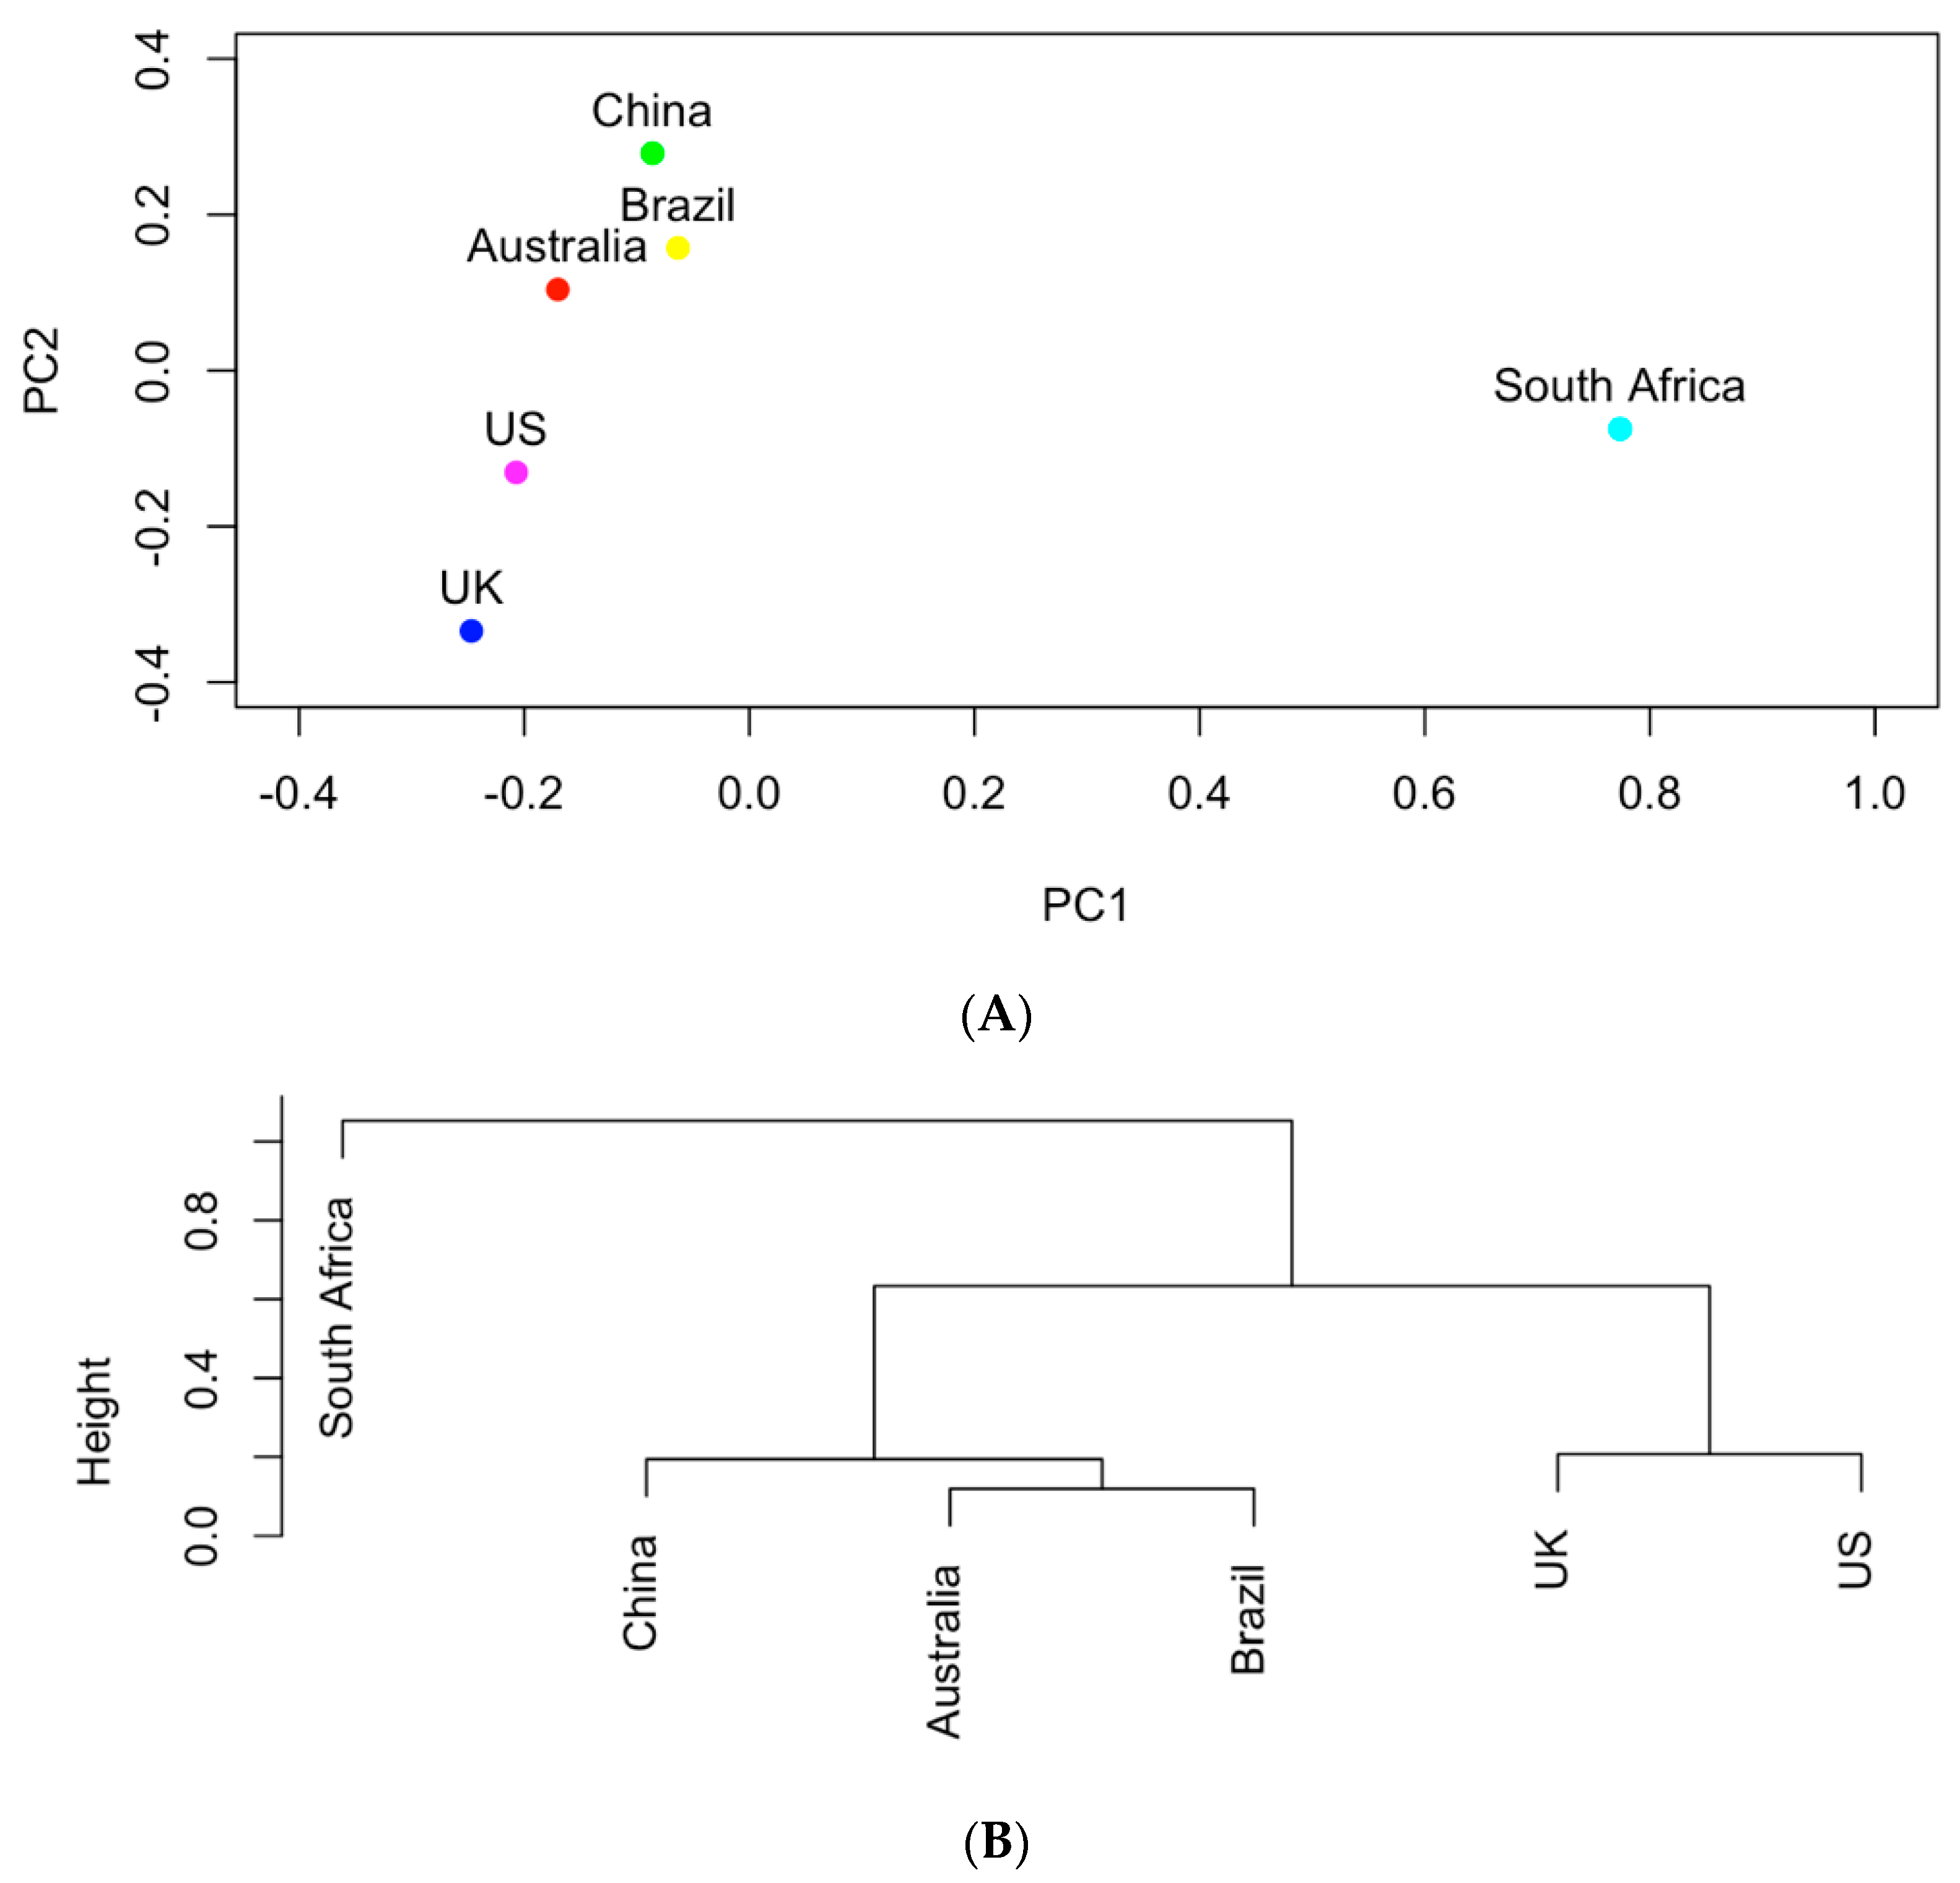
(A) The projection of the six countries onto the PC1~PC2 space based on AMR genes; (B) hierarchical clustering analysis of the similarities of the six countries in carrying AMR genes.
Processes 07 00964 g004
Figure 5. (A) PCA analysis of countries based on the occurrence data of clinical pathogens listed in Table 2; (B) hierarchical clusters of countries based on the occurrence data of clinical pathogens listed in Table 2.
Processes 07 00964 g005
Figure 6. 
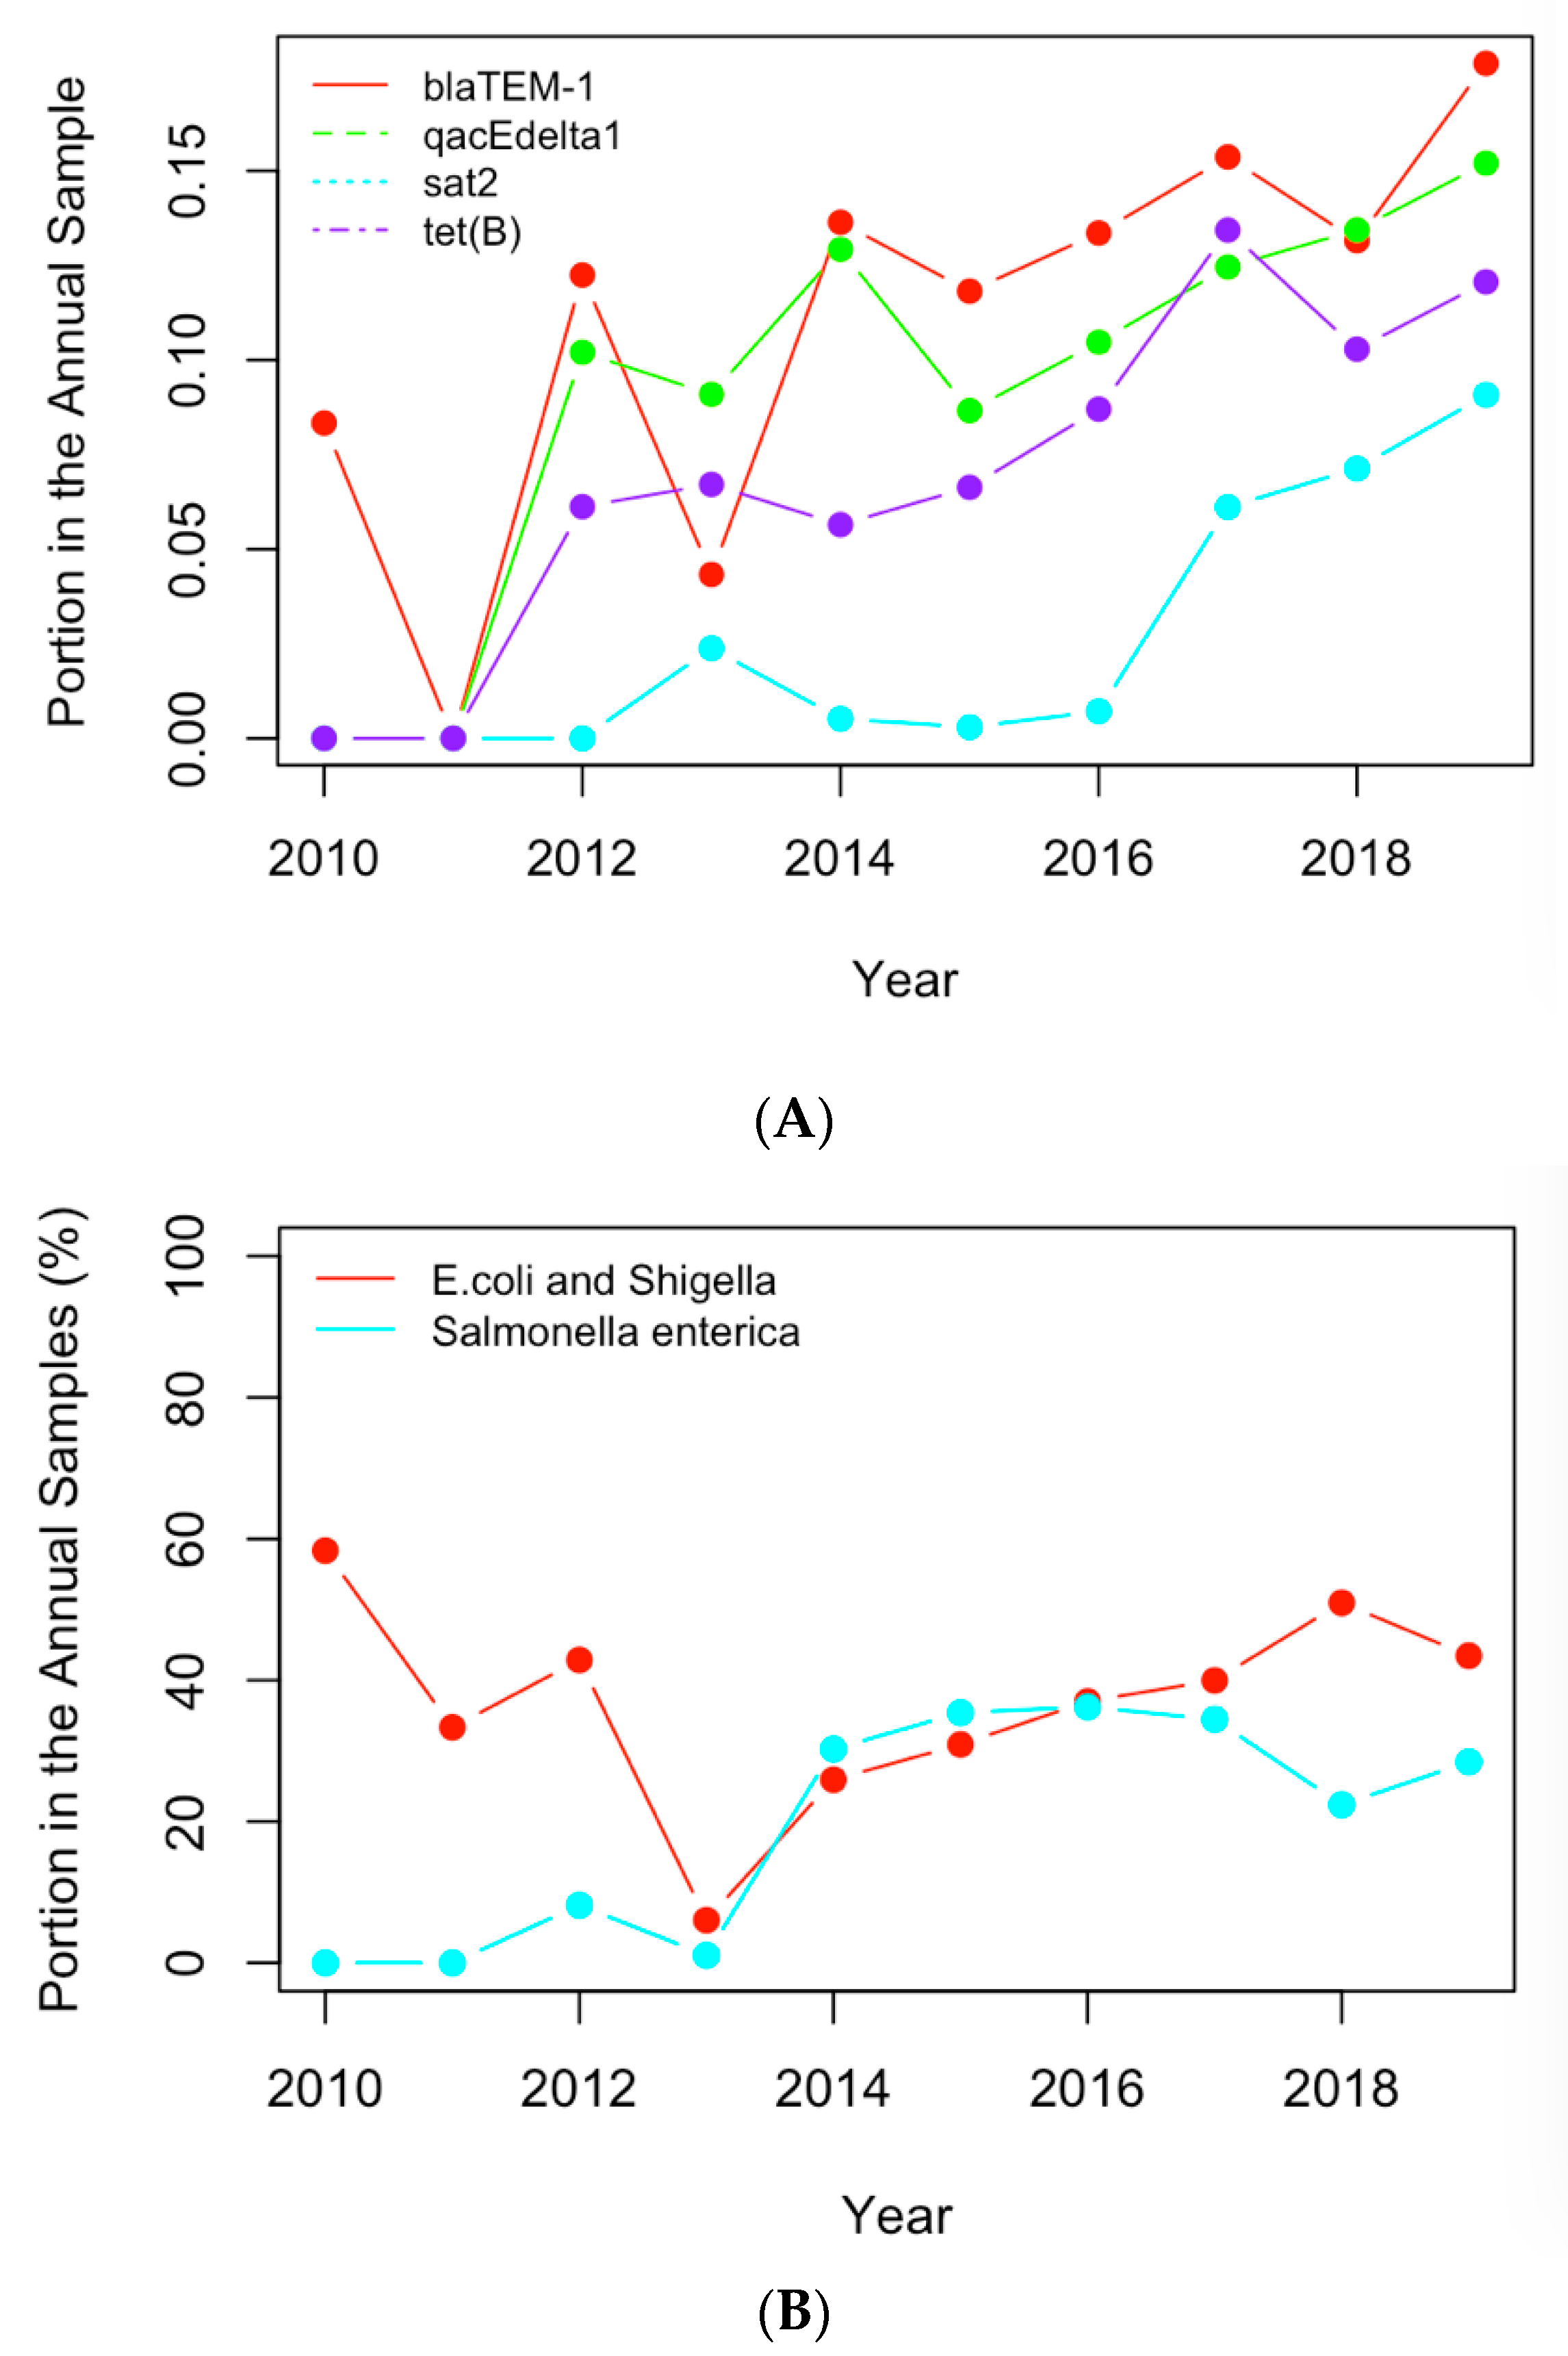
(A) The historical profiles of the AMR genes with a generally increasing trend in their occurrence in the clinical samples collected in the US; (B) the historical profiles of the clinical pathogens with a generally increasing trend in their occurrence in the clinical samples collected in the US.
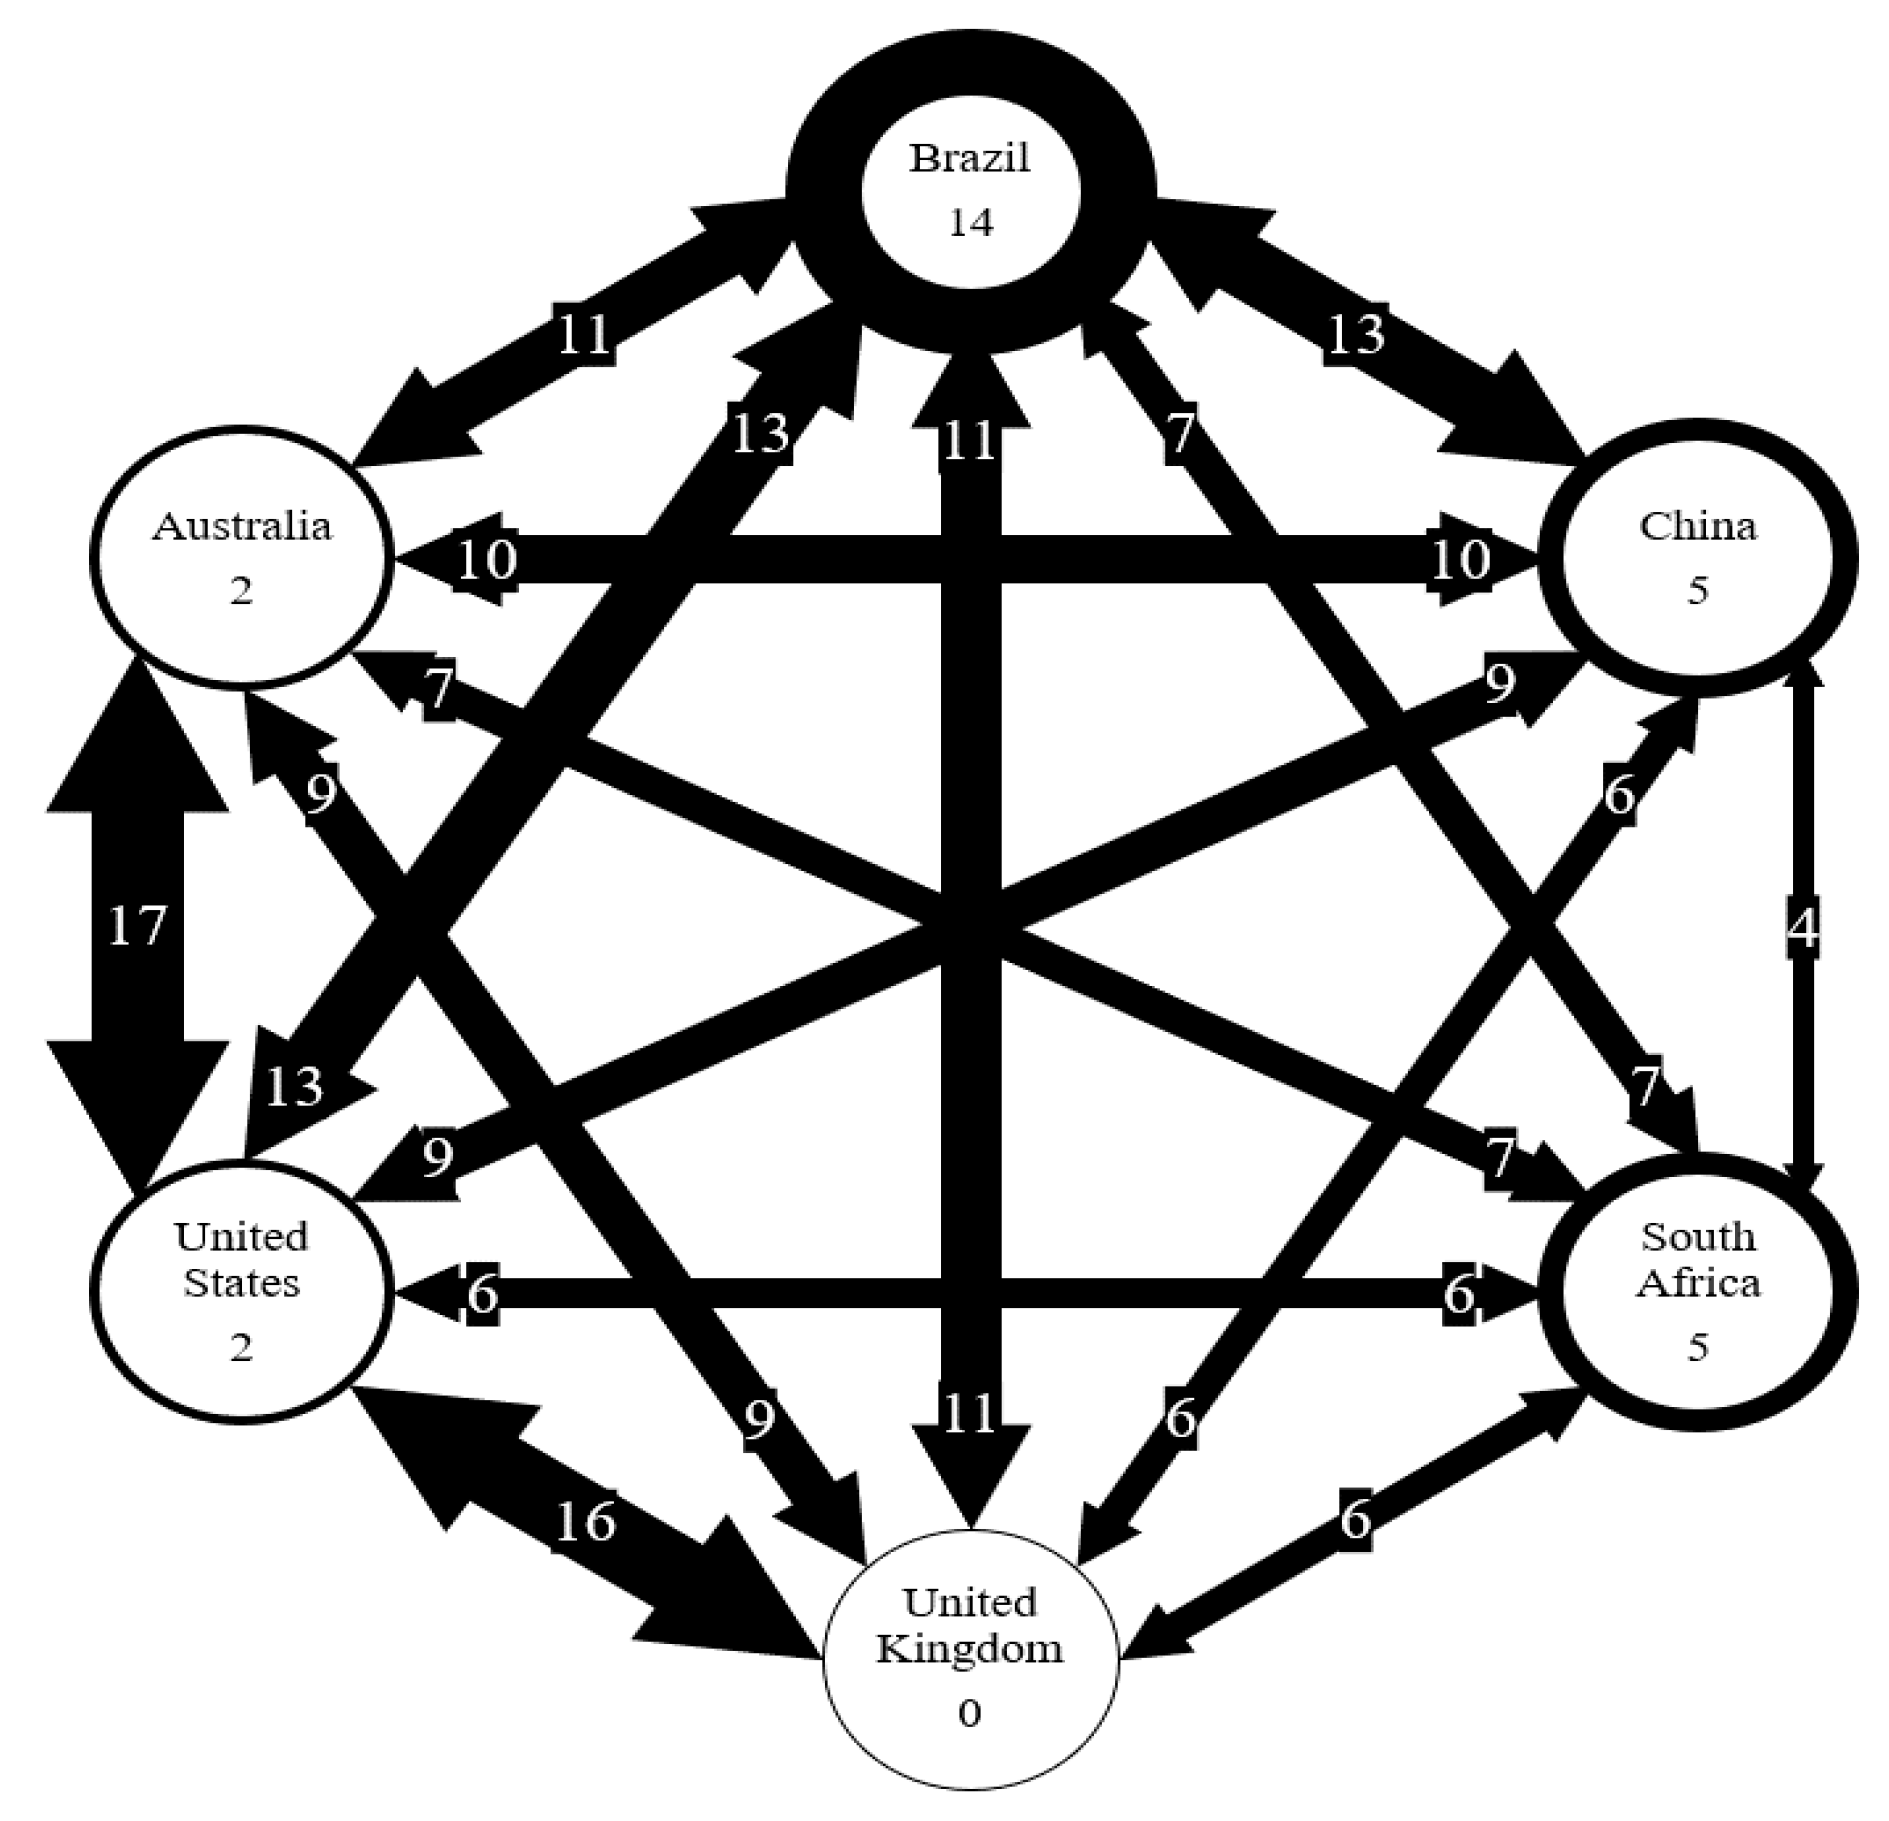
Processes 07 00964 g006
Figure 7. Number of AMR genes shared between six countries. Number on arrows represent the number of genes shared. Thickness of arrow correlated to the number of genes shared. Number in circles represents the number of genes unique to each country.
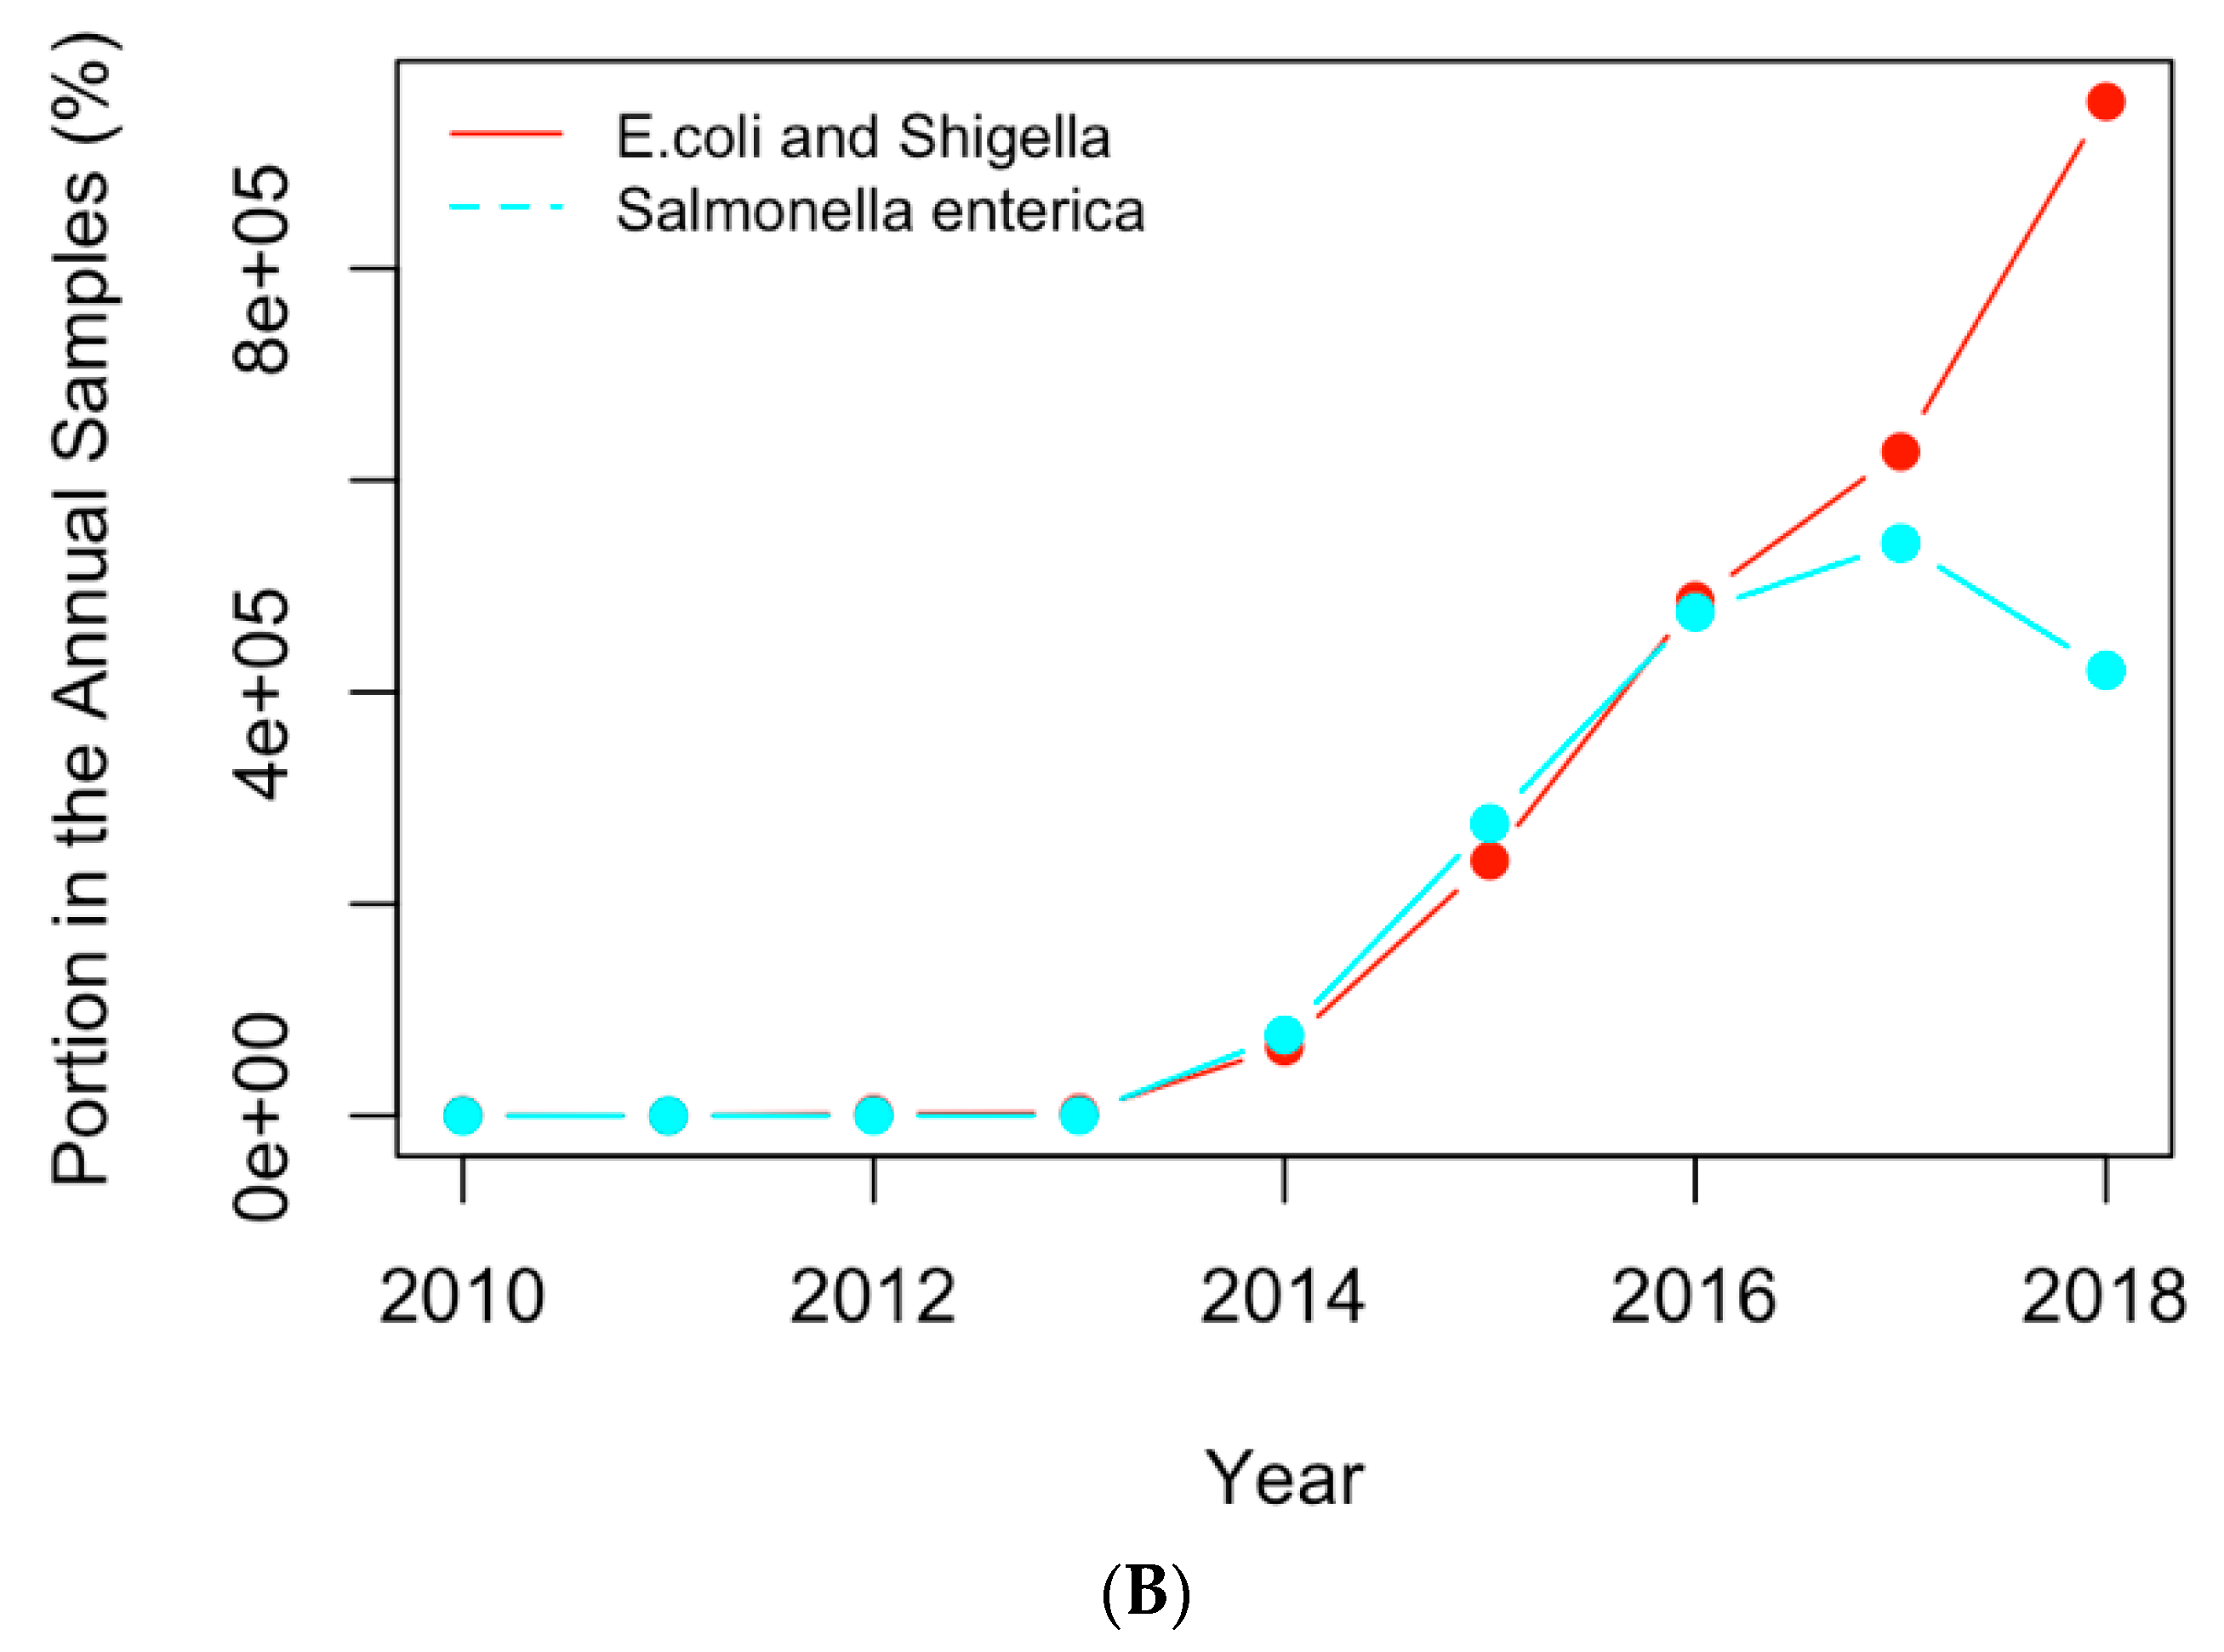
Processes 07 00964 g007
Figure 8. Replotting Figure 6 with the actual numbers of samples containing the AMR genes (A) and clinical pathogens (B) in USA.
Processes 07 00964 g008aProcesses 07 00964 g008b
Table 1. The genes mostly involved in antimicrobial resistance in the six countries. Red text indicates the genes shared by all six countries, while blue denotes genes common to five countries.
AustraliaBrazilChinaSouth AfricaUKUS
aac(3)-Iaac(3)-IIaaadA2aac(2′)-IcaadAaadA
aadA1aac(6′)-Ibant(3″)-IIaaph(3″)-IbaadA1aadA1
aadA5aadA2aph(3″)-Ibaph(6)-Idaph(3″)-IbaadA2
ant(3″)-IIaaadA7aph(3′)-IablaAaph(6)-IdaadA5
aph(3″)-Ibaph(3″)-Ibaph(6)-IdblaCTX-M-15blaECaph(3″)-Ib
aph(3′)-Iaaph(3′)-IIbarmAblaTEM-1blaOXA-1aph(3′)-Ia
aph(6)-Idaph(3′)-IablaECerm(37)blaTEM-1aph(6)-Id
blaADC-30aph(6)-IdblaKPC-2fosXcatA1blaCMY-2
blaECblaCTX-M-15blaOXA-23lindfrA1blaEC
blaOXA-23blaECblaOXA-66qacEdelta1mph(A)blaOXA-1
blaOXA-66blaKPC-2blaSHV-11sul1qacEdelta1blaTEM-1
blaTEM-1blaOXAblaTEM-1sul2sat2catA1
dfrA1blaOXA-494dfrA12 sul1dfrA1
dfrA17blaOXA-56floR sul2dfrA17
erm(B)blaPDC-5fosA tet(A)erm(B)
mph(A)blaSHV-11mcr-1.1 tet(B)floR
qacEdelta1blaSPM-1mph(A) fosA7
sat2blaTEM-1mph(E) mph(A)
sul1catA1msr(E) qacEdelta1
sul2catB7oqxA sat2
tet(A)cmxoqxB sul1
tet(B)crpPqacEdelta1 sul2
dfrA12 tet(A)
fosA tet(B)
mph(A)
oqxA
oqxB
qacEdelta1
rmtD1
sul1
sul2
tet(A)
Table 2. The important pathogens for the six countries. Pathogens were identified through hierarchical clustering.
AustraliaBrazilChinaSouth AfricaUKUS
Acinetobacter baumanniiAcinetobacter baumanniiAcinetobacter baumanniiE. coli and ShigellaE. coli and ShigellaAcinetobacter baumannii
E. coli and ShigellaE. coli and ShigellaE. coli and ShigellaEnterobacterEnterobacterE. coli and Shigella
Klebsiella pneumoniaeKlebsiella pneumoniaeEnterobacterKlebsiella pneumoniaeKlebsiella pneumoniaeEnterobacter
Mycobacterium tuberculosisPseudomonas aeruginosaKlebsiella pneumoniaeListeria monocytogenesSalmonella entericaKlebsiella pneumoniae
Salmonella entericaSalmonella entericaSalmonella entericaMycobacterium Tuberculosis Salmonella enterica
Vibrio cholerae
Table 3. The important genes from Table 1 with a generally increasing occurrence.
ChinaSouth AfricaBrazilAustraliaUKUS
aadA2fosXaadA7aac(3)-IaadA1blaTEM-1
blaEClimaph(3″)-IbblaADC-30aph(3″)-IbqacEdelta1
blaKPC-2 aph(3′)-IIbblaOXA-66aph(6)-Idsat2
blaSHV-11 aph(3′)-IaaadA1blaTEM-1
blaTEM-1 aph(6)-Idaph(3″)-IbdfrA1
dfrA12 blaCTX-M-15aph(6)-Idmph(A)
floR blaOXA-49sul2qacEdelta1
fosA blaPDC-5aadA5sat2
oqxA blaSHV-11dfrA17sul1
oqxB blaSPM-1dfrA1sul2
qacEdelta1 catB7erm(B)tet(A)
crpPsat2tet(B)
dfrA1
fosA
mph(A)
oqxB
rmtD1
sul1
Table 4. The important pathogens from Table 2 with an increasing occurrence.
AustraliaBrazilChinaSouth AfricaUKUS
Acinetobacter baumanniiKlebsiella pneumoniaeE. coli and ShigellaListeria monocytogenesNoneE. coli and Shigella
E. coli and ShigellaPseudomonas aeruginosaKlebsiella pneumoniaeMycobacterium TuberculosisNoneSalmonella enterica
Table 5. Genes unique to each country.
AustraliaBrazilChinaSouth AfricaUnited KingdomUnited States
aac(3)-Iaac(3)-IIaarmAaac(2′)-Ic blaCMY-2
blaADC-30aac(6′)-IbblaSHV-11blaA fosA7
aadA7mcr-1.1erm37
aph(3′)-IIbmph(E)fosX
blaCTX-M-15msr(E)lin
blaOXA
blaOXA-494
blaOXA-56
blaPDC-5
blaSPM-1
catB7
cmx
crpP
rmtD1
Table 6. Genes carried by different countries sorted by frequency. Only genes with a frequency of 3 or higher are shown.
AustraliaBrazilChinaSouth AfricaUKUSTotal
aph(3″)-Ib1111116
aph(6)-Id1111116
blaTEM-11111116
qacEdelta11111116
blaEC1110115
mph(A)1110115
sul11101115
sul21101115
aph(3′)-Ia1110014
tet(A)1100114
aadA11000113
aadA20110013
catA10100113
dfrA11000113
sat21000113
tet(B)1000113
Table 7. Important pathogens carrying AMR genes from different countries sorted by frequency (Red: shared by all six countries; Orange - shared by five countries; Green: shared by four countries; and Blue: unique to one country.
AustraliaBrazilChinaSouth AfricaUKUSTotal
E. coli and Shigella1111116
Klebsiella pneumoniae1111116
Salmonella enterica1110115
Acinetobacter baumannii1110014
Enterobacter0011114
Listeria monocytogenes0001001
Mycobacterium tuberculosis1000001
Mycobacterium Tuberculosis0001001
Pseudomonas aeruginosa0100001
Vibrio cholerae0010001

