Article

Optimization of the Technology Transfer Process Using Gantt Charts and Critical Path Analysis Flow Diagrams: Case Study of the Korean Automobile Industry

School of Industrial Management, Korea University of Technology and Education (KOREATECH), Cheonan 31253, Korea
*
Author to whom correspondence should be addressed.
Processes 2019, 7(12), 917; https://doi.org/10.3390/pr7120917
Submission received: 16 September 2019 / Revised: 19 November 2019 / Accepted: 27 November 2019 / Published: 3 December 2019
(This article belongs to the Special Issue Advances in Sustainable Supply Chains)

Abstract

:
This research is focused on the technology transfer process in the automobile industry using project management tools. The aim of this research is the development of a technology-transfer model using Gantt charts and Critical Path Analysis flow diagrams to achieve a sustainable planning process in the global environment. To achieve this goal, the authors use Gantt charts and Critical Path Analysis flow diagrams. The hypothesis and three research questions are presented, which suggest a relationship between project management tools and the sustainable planning process of technology transfer. During the research, we use the case study of the Korean automobile industry as an excellent example of the technology-transfer process in global markets. A single project of technology transfer is discussed: the technology knowledge transfer from Korean headquarters to a Russian manufacturing subsidiary (Hyundai Motor Corporation). Quantitative data were collected through the open resources of the corporation; the qualitative data were analyzed through a case study and model parameter evaluation. The significant result that the combination of Gantt Charts and Critical Path Analysis flow diagrams methods improves the planning process for technology-transfer projects was found in this survey. It is noticed that (a) it is useful to apply project-management tools for technology transferring models; (b) Gantt Charts and Critical Path Analysis flow diagrams have a sustainable impact on technology transfer projects; and (c) critical paths and operational reserves in network diagrams help to optimize the planning process for technology transfer.

1. Introduction

The global economy is rapidly changing, and technological innovation has become more important due to the trajectory of technology, short product life cycles, and globalization. It is necessary to develop new models of planning in project management and transferring technologies to achieve sustainability in global markets. For the automobile industry, acquiring innovative technologies can be a source of a firm’s long-term success. The technology strategy has become one of the most significant factors for a firm to consider when making a business decision. There are two ways to obtain technology to increase a firm’s competitiveness: self-research and development (R&D) and technology transfer.
Parker, D., et al., 1998, suggested that technology transfer is a strategic component of innovation activity [1]. According to the efficient implementation of technologies, the transmission mechanism industry can intensify the implementation and development processes of high-tech innovations in production activities and gain additional competitive advantages. Effective technology transfer accelerates innovation processes at regional, national and transnational levels [2,3]. The study of the process of technological transfer is necessary to evaluate benefits of technology transfer and ways to achieve these benefits. Dyer (1998) and Stuart (1988) have studied the relationship characteristics between alliance partners, including the effects of the relative position and reputation of each partner firm, the strategic similarity of the firms, and their former relationship [4,5,6].
The commercialization of technology in developed and innovation-driven countries (USA, Germany, South Korea, etc.) is the foundation of global competitiveness, which actualizes the need for significant efforts to support and develop the production of knowledge, high technology, and innovation in various fields of activity. One of the catalyzers for the development of innovation is scientific activity, as a basis for the development of knowledge and the creation of high technology. Many empirical studies have examined how technology transfer influences investment in self-R&D expenditure. Most authors (Odagiri, 1983; Braga and Wilmore, 1991; Deolalikar and Evenson, 1993; Zhao, 1995; Hu et al., 2005) show that a complementary relationship exists between technology transfer and self-R&D, confirming that there is a positive effect [7,8,9,10,11].
In global practice, the construction of infrastructure for support innovation is carried out within a number of organizational forms, such as “Technopolice”, zones for the development of innovative and high technologies, science and technology parks, innovation and technology centers, centers for the commercialization of technologies, and business incubators [12].
To create a mechanism for the optimal interaction of organizations in national and transnational dimensions, modeling should be defined which allows the implementation of the process of technology transfer in the most efficient way. The peculiarity of these parameters is that goals and objectives of each of the participants in the process of technology transfer should be determined well.
In global markets, the technology-transfer process has many risks; for example:
  • Differences in industry standards;
  • Different levels of infrastructure;
  • Unstable logistic systems;
  • Fluctuations in investment;
  • Problem with intellectual property rights and technological protection;
  • Difference in legal and economic national levels;
  • Difference in competencies and innovation development, etc.
The selection of a technology transfer implementation mechanism should be based on an analysis of the technology itself, the specifics of the future cooperation strategy with its developer, investment opportunities, and the technical ability of organizations in the implementation of innovative technology. When choosing a transfer method, it should be understood that the more complex and larger the scale of technology, the closer an interaction should be organized between its buyers and creators.
Global experience in technology transfer indicates that technological intermediation is necessary to reduce barriers to ways to transfer information awareness technologies, technology management, financing innovative projects, etc. In this case, project management can help global managers to improve technology transfer processes; all the steps of the technology transfer process could be recognized as operations of the project, and so managers may evaluate resources, build an effective network for transfer, and arrange control over the process of technology transfer. For example, Hu et al. (2005) explain the impact of project management tools on effectiveness of R&D in technology transfer process; they confirm that optimization and an effective planning process may reduce R&D transfer risks and create effective transfer process [11]. Rodgers et al. (1982) discussed the influence of project management tools on communication process in a technology-transfer model [12].
So, three research questions were submitted during the survey to improve the clarity of tasks.
  • How could project management be used for technology transfer process?
  • How do Gantt Charts and Critical Path Analysis flow diagrams impact technology transfer projects?
  • Which results could be achieved in the application of project management tools for technology transfer models?
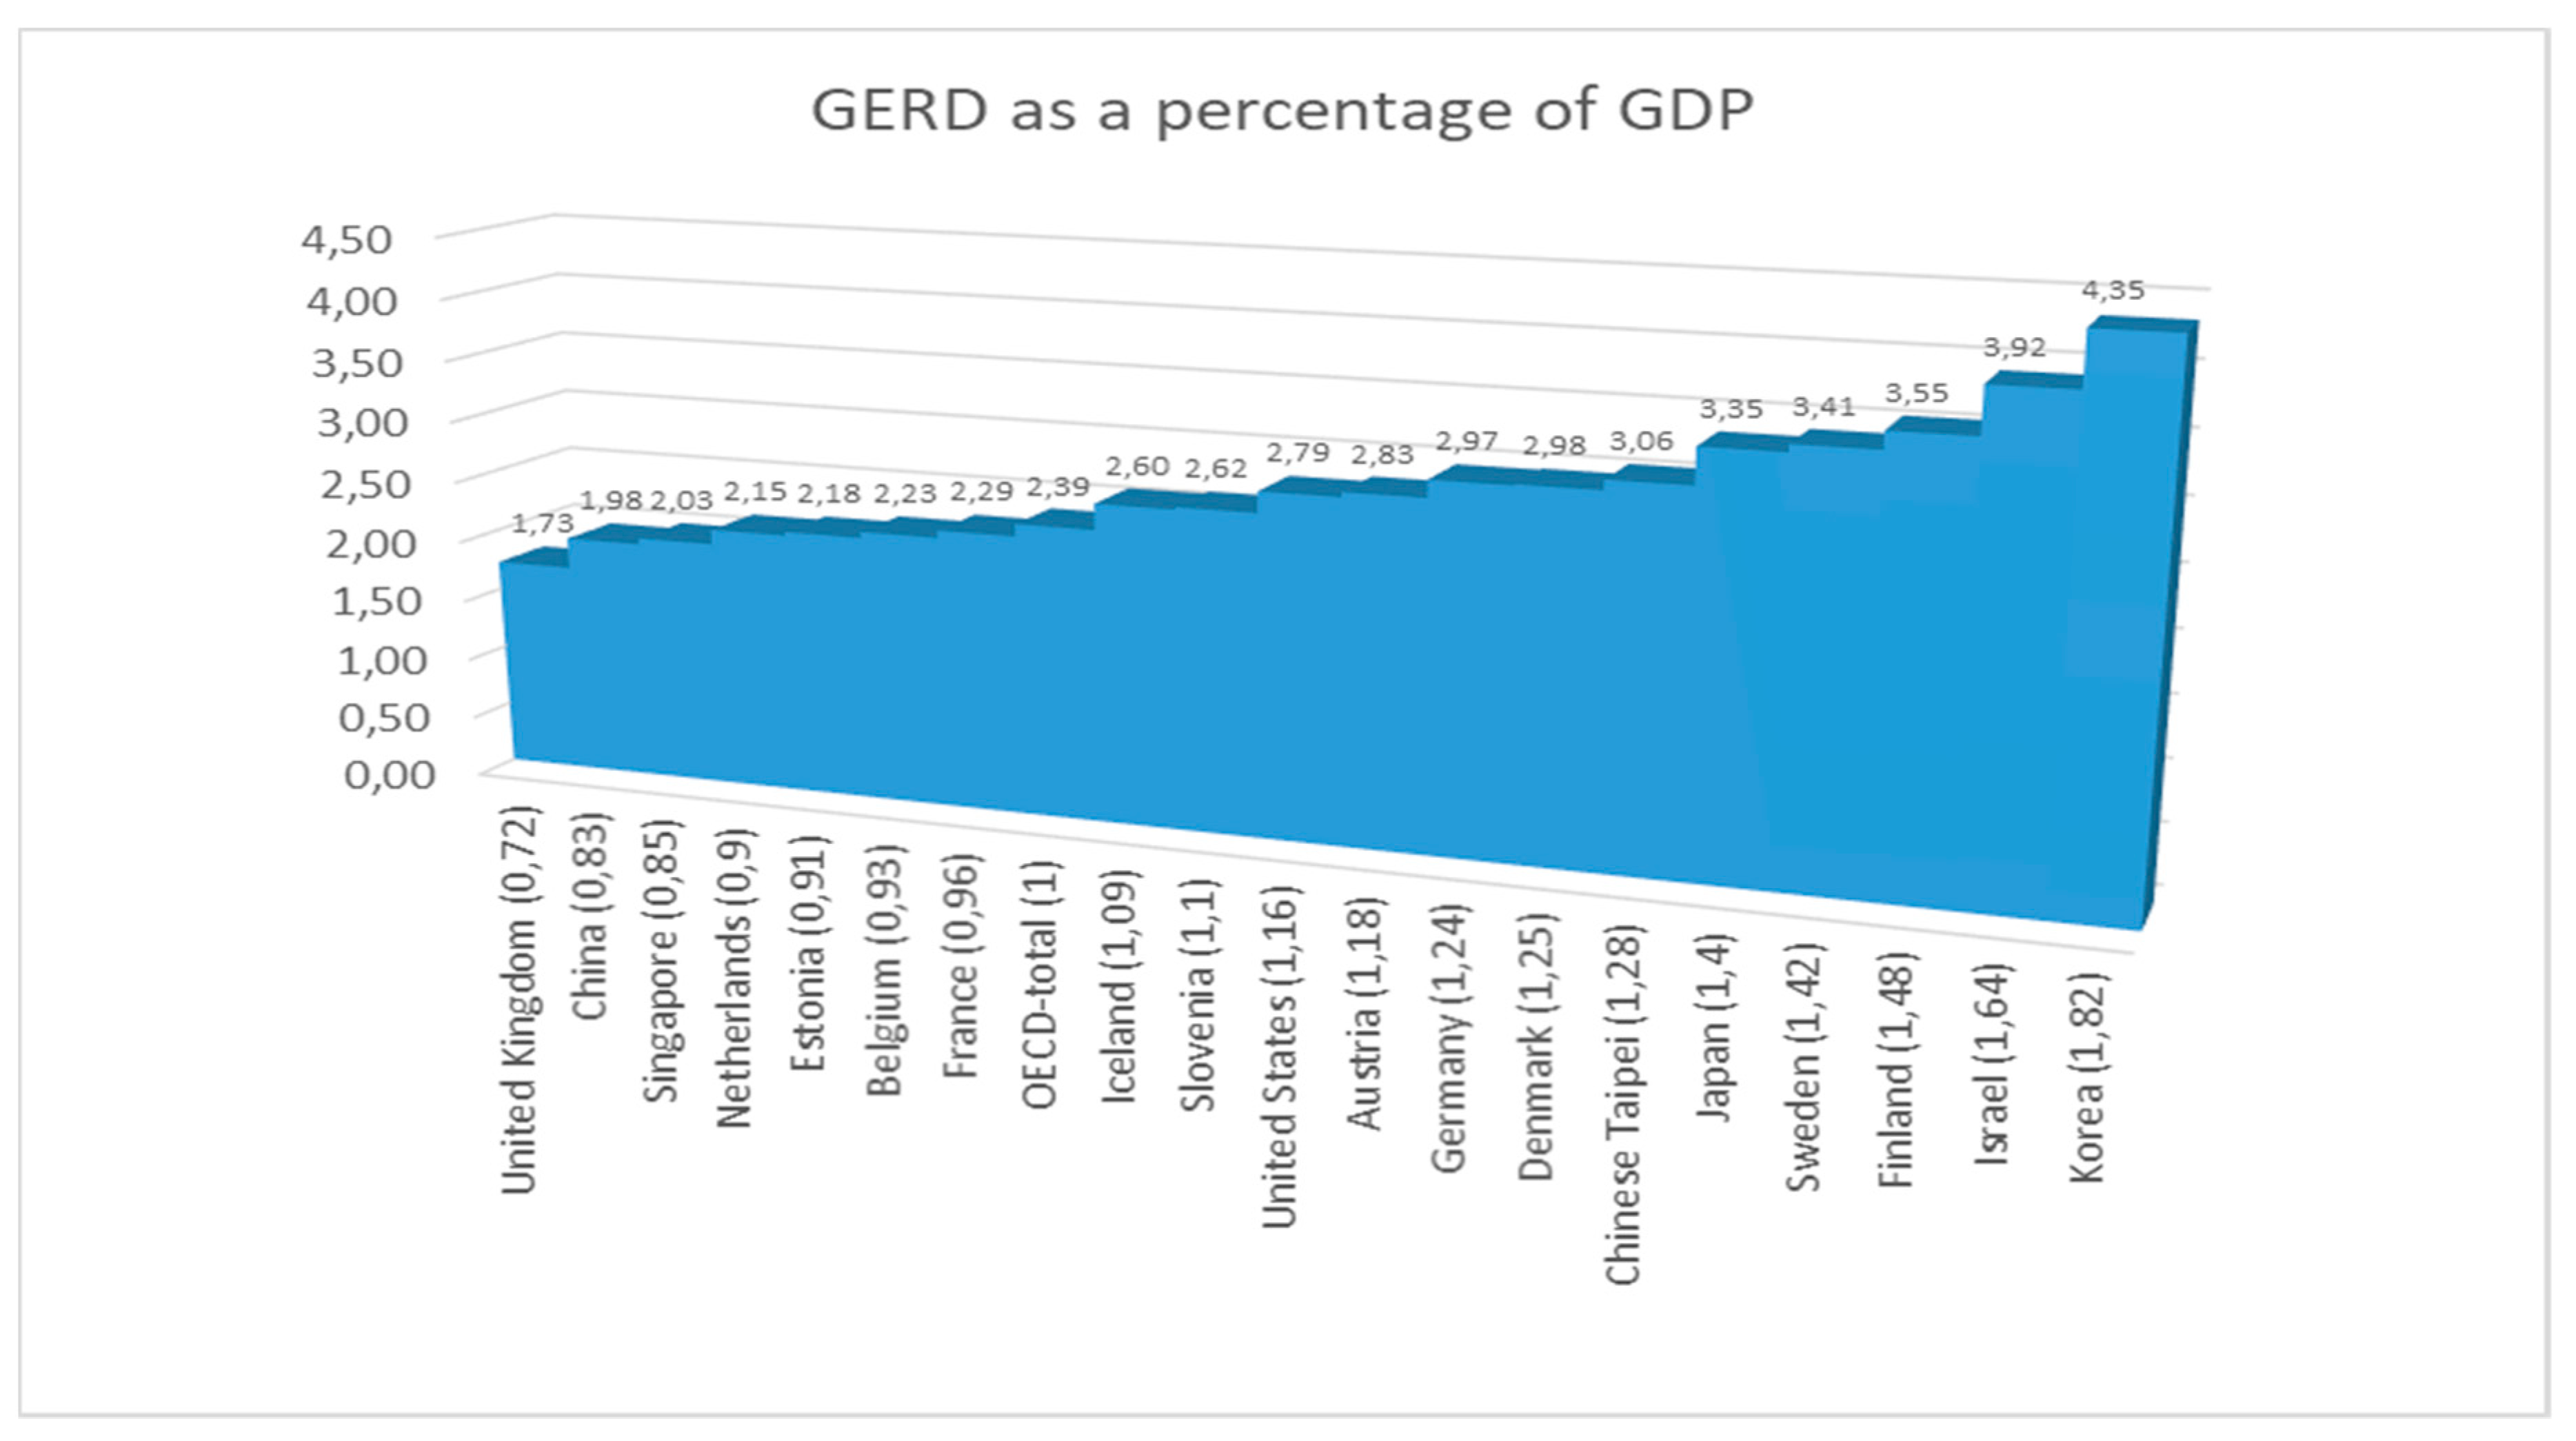
Research into the transfer of R&D results also emphasizes the role of intermediaries in the innovation process; i.e., technology transfer entities (Figure 1).
Figure 1 shows the gross domestic expenditure on research and development (GERD) against the economic scales of each country. It presents the R&D investment amount against the gross domestic product (GDP), based on the data given by the Organization for Economic Cooperation and Development (OECD) in July 2017. When the OECD average was taken as “1”, Korea invested 1.8 times more than the average of OECD and comparatively small countries, such as Israel, Finland, Sweden, and Korea, showed high percentages of R&D investment against their GDPs [13]. Data subjects build communication between users and technology providers, help create connections in networks and systems through communication between organizations, and encourage interaction within the system and help accomplish search tasks, evaluation, and the dissemination of innovation. The main partners in the technology transfer process in global markets are the headquarters, subsidiary, cluster center, technology broker, consulting agency, training and competence center, R&D center, and financial agency.
Technology intermediaries can act with specialized government agencies, transfer centers technologies, non-governmental organizations, innovation relay centers, departmental university technology transfer, regional technology centers, research and technology organizations, international transfer networks technology, and so on, Korean corporations (such as Samsung; Hyundai; etc.) are currently trying to develop an innovative ecosystem in global markets, which will help them to produce and transfer more innovations and innovative technologies [14]. The aim of this strategy is to increase global competitiveness and achieve continuous improvement. For example, the Hyundai corporation developed very quickly in the automobile industry—not only in domestic but also in foreign markets—using a technology transfer strategy. For example, Hyundai built its first automobile factory in Russia in 2007, and in 2019, it opened the Global Training Center in Moscow [15]. This is a good example of the development concept for innovation transfer in a global environment.
An effective planning process plays a main role in the technology transfer process, because it may prevent the risks and problems which were discussed earlier and encourage a more competitive strategy. For this reason, the planning process and its impact on the technology transfer process are discussed in this paper.

2. Theory Framework

2.1. Project Management for Technology Transfer. Technology Transfer Models

There are many definitions of technology transfer by various researchers. Foster (1971) refers to two different methods of technology transfer [16]: horizontal technology transfer is the transfer of technological knowledge or innovation between projects, organizations, industries, and nations; vertical technology transfer is the transfer of technological knowledge or innovation, from basic to advanced research, from development through to commercialization. Camp and Sexton (1992) define technology transfer as the path of technological knowledge, ideas, and research results from the initial conceiving organization to the user organization, focusing on licensing-in and technological cooperation [17]. Both approaches to technology transfer involve acquiring innovation from an outside source as well as sharing technological knowledge of their products or processes. Therefore, Camp and Sexton’s definition of technology transfer is based upon Foster’s definition of horizontal technology transfer.
Most of the technology transfer models are based on a project management approach, which means that all the operations in transfer are considered as steps in a project. For example, concerning the content found in the literature, the findings can be divided into three groups. The first refers to papers that present models of technological transfer (Bozeman et al., 2015; Malik, 2002) [18,19].
The second group of findings is characterized by case studies where the authors present their experiences in transferring a technology (Burnside and Witkin, 2008; Gorschek et al., 2006) [20,21]. Although these papers do not present a model; it is possible to describe the technology transfer process as the elements that are necessary to transfer a technology. This group describes the basic elements that must exist in a technology transfer. It should be noted that in this group a contribution is made in the division of transfer modalities and a mapping between the state of technology and the transfer mechanism.
The third group of findings presents the complementary elements in technology transfer process (Waroonkun and Stewart, 2008; Khabiri et al., 2012) [22,23]. These elements are not fundamental to the transfer models; however, they are very helpful for the transfer process as a project to be carried out in the best way.
All of these groups should be evaluated for technology transfer process, so the most popular qualitative technology transfer models are presented in Table 1.
There are also other non-qualitative models of technology transfer. For example, according to Devine et al., there are three mostly accepted models of technology transfer. They are the most accepted by managers of international corporations according to their corporate goals. For example, first model is the Appropriability Model. It emphasizes the importance of the quality of research and competitive market pressures in achieving technology transfer. This model assumes that good technologies take care of themselves and are successful, but this is seldom true in the real world. So, this model solves the problem of technology customization during the technology-transfer process [29].
The second model is the Dissemination Model. It focuses on the diffusion of innovation. The goal is to disseminate innovations to individual users. So, this model follows a corporate goal of business diversification [30].
The third model is the Knowledge Utilization Model, which emphasizes the importance of (1) interpersonal communication between researchers and users; and (2) organizational barriers and facilitators of transfer. So, this model tries to prevent and manage technology transfer risks of communication as a corporate goal.
Radosevich and Radosevich and Smith studied a model for entrepreneurship infrastructure development in the creation of a technopolis [29,30]. In their study, they analyzed how to commercialize technologies that are developed by public sector institutions. The two primary modes of commercialization are transferring the technology to an existing firm—i.e., the inventor–entrepreneur model—or working with a new entrepreneurial effort—i.e., the external entrepreneur model [31].
Jolly (1997) introduced the process perspective into technology commercialization [32]. He argues that technology commercialization is about performing successfully in a range of activities, each adding value to the technology as it progresses along the commercialization process. Five of these activities constitute the key subprocesses involved in bringing new technologies to market: imagining a techno-market insight; incubating the technology to define its commercializability; demonstrating it contextually in production and/or processes; promoting the latter’s adoption; and sustaining commercialization. As important as these subprocesses are the four bridges between them. These bridges are:
  • Between bringing new technologies to market and imagining a techno-market insight—the bridge is market-push strategy;
  • Between incubating the technology to define its commercializability and demonstrating it contextually in production and/or processes—the bridge is market research;
  • Between demonstrating it contextually in production and/or processes and promoting the latter’s adoption—the bridge is R&D and design concept’s improvement;
  • Between promoting the latter’s adoption and sustaining commercialization—the bridge is market-pull strategy.
To overcome the limitations of the above-mentioned models, the following four levels of technology transfer are suggested based on Gibson and Smilor’s four-level technology transfer model [33]. At Level I—technology creation—individuals conduct state-of-the-art research or develop the best practices into knowledge and announce these results by such varied means as research publications, videotapes, teleconferences, news, personal communications, and anecdotes. Level II—technology transfer—calls for the beginnings of shared responsibility between technology developers and users. Success occurs when technology is transferred across personal, functional, or organizational boundaries, and it is accepted and understood by designated users. In Level III transfer, success is marked by the timely and efficient implementation of technology. Technology implementation can occur within the user organization in terms of manufacturing or other processes, or it can occur in terms of services or best practices. Level IV transfer—technology utilization—centers on commercialization. Level IV builds cumulatively on the successes achieved in attaining the objectives of the three previous stages, but market strength is required. Success is measured in terms of the return on investment (ROI) or market share.
Gibson et al. introduce two basic kinds of technology transfer—from research to commercial application—which directly impact the creation of wealth and high-value jobs: (1) the transfer of creative and innovative technologies to established firms; and (2) the spinning-out of technologies into start-up companies [34].
As it is important to adapt project management tools to the technology transfer process, we here present a comparison of the most useful of them (Table 2). Technology transfer process requires more significant efforts for risk’s prevention. For example, identifying and sequencing parallel and interdependent activities and stages may help to achieve a partner’s goal during the transfer process. Critical Path Analysis flow diagrams method helps us to manage this risk. On another hand, the Gantt Chart method helps manager to arrange monitoring, forecasting, reporting an international transfer process.
Fishbone diagrams are also useful for brainstorming and identifying causal factors which might otherwise be forgotten. For complex proposals, or when you lack experience in the issues, it is important to involve others in the brainstorming process. Thereafter, it is a question of putting the issues in the right order, and establishing relationships and links between each issue. Complex projects will have a number of activities running in parallel. Some parts of the plan will need other parts of the plan to be completed before they can begin or progress. Such “interdependent” parts of a project need particularly careful consideration and planning. Sometimes, they will require a feasibility stage before the completion of a detailed plan. Thus, Gantt Charts and Critical Path Analysis flow diagrams are two commonly used tools for detailed project management planning, enabling scheduling, costing and budgeting and other financials, and project management and reporting.

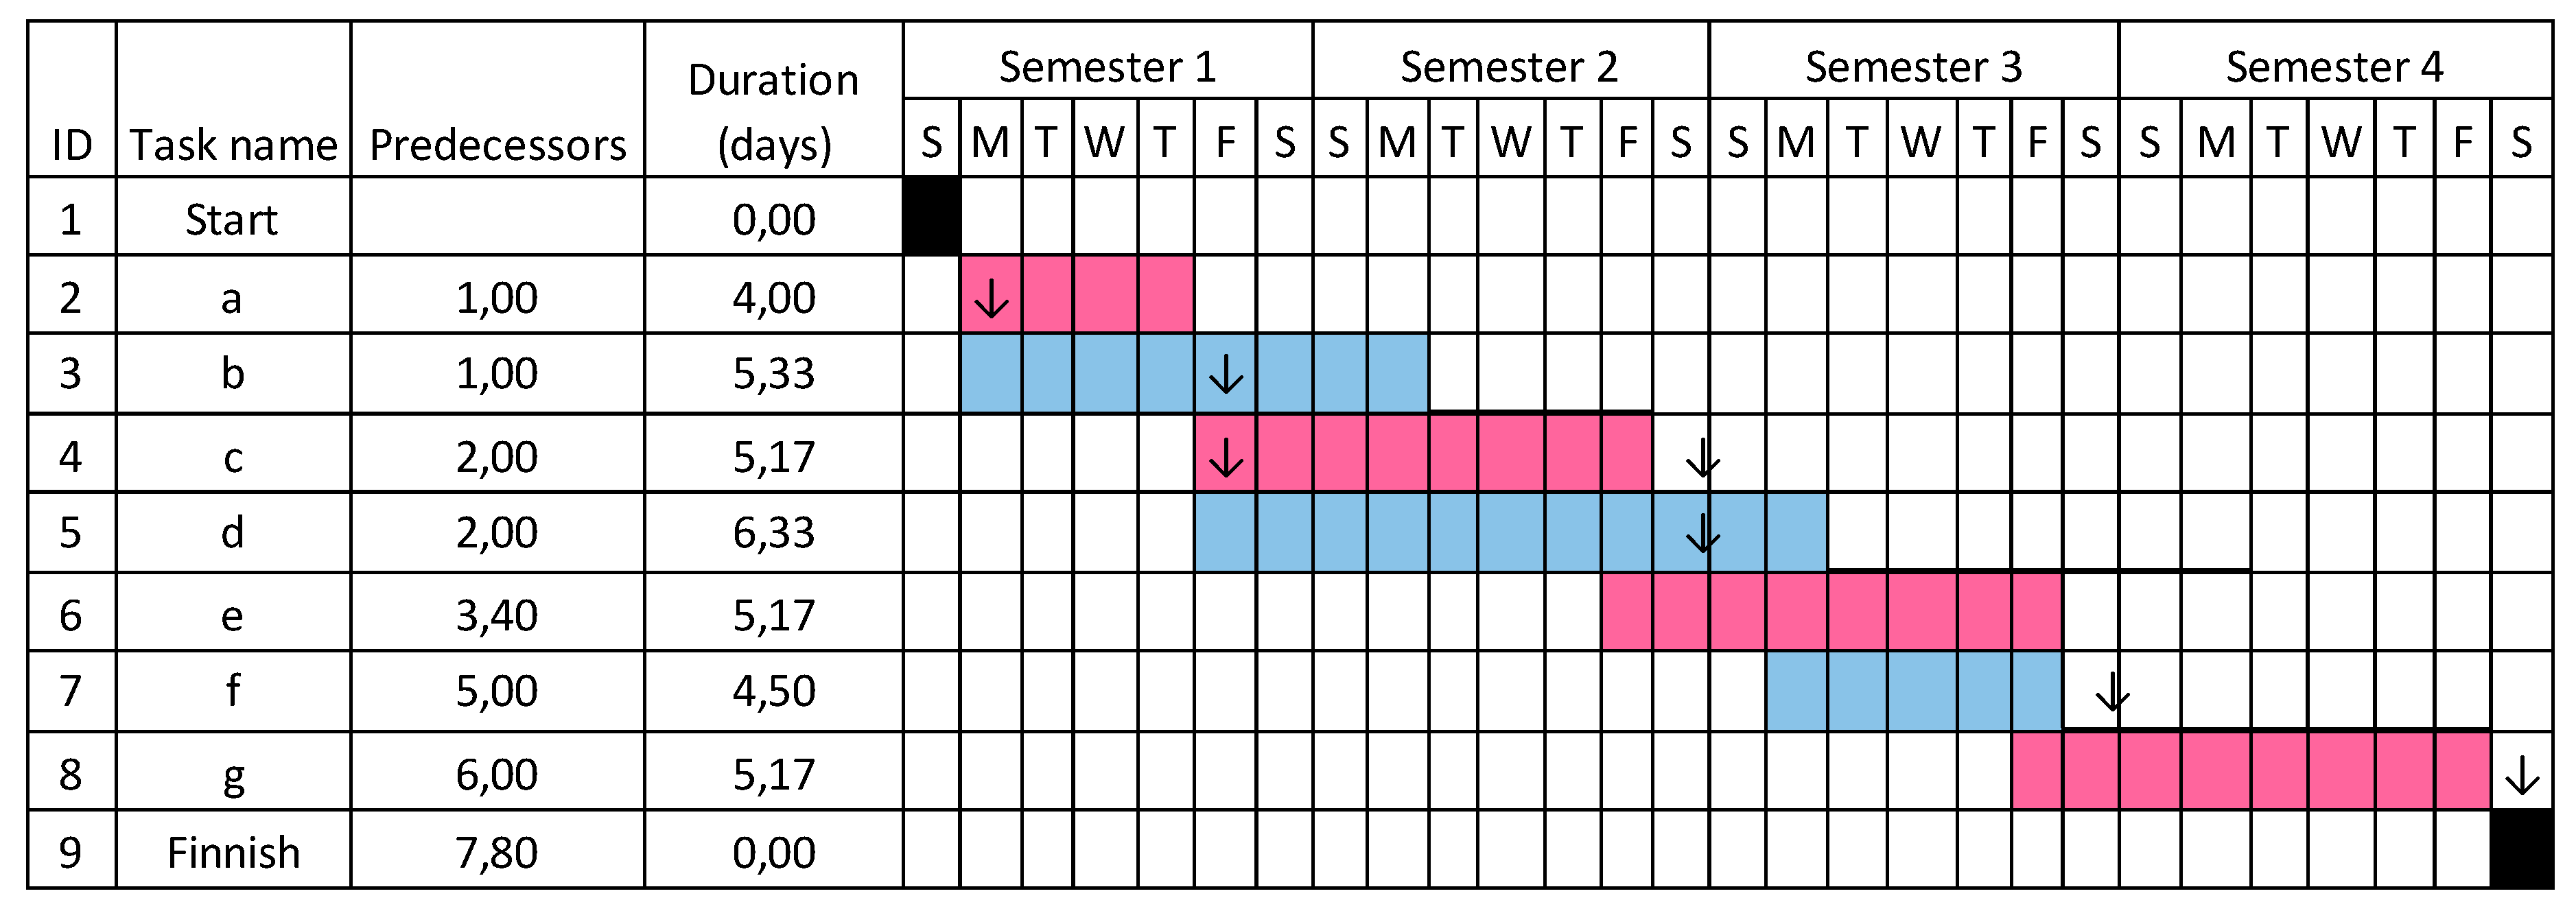
2.2. Gantt Charts (GC) and Critical Path Analysis (CPA) Flow Diagrams

A Gantt Chart (GC) planning method (hereafter called a network diagram) is a popular type of chart (invented by Henry Gantt) used to plan and monitor the implementation of a project. A GC is a type of bar chart that illustrates a project schedule and is named after its inventor, Henry Gantt (1861–1919), who designed such a chart between 1910–1915 [35]. Modern GCs also show the dependency relationships between activities and the current schedule status. They are usually created initially using an early start time approach, where each task is scheduled to start immediately when its prerequisites are complete. This method maximizes the float time available for all tasks. This interactive network diagram is presented in almost all project management systems. A GC method helps to follow these steps of project management:
  • understand scope and stages in technology transfer, and its success criteria including;
  • forming the transfer team and developing the project charter;
  • consolidating knowledge for transfer and developing a technology transfer proposal;
  • identifying risks, conducting risk assessments and developing technology transfer plan;
  • executing the transfer;
  • finalizing the transfer and performing the review.
GC presents the systematic (step-by-step and planned) procedure that is followed in order to pass the documented knowledge and experience gained during development and/or commercialization to an appropriate, responsible, and authorized party. Technology transfer embodies both the transfer of documentation and the demonstrated ability of a receiving unit to effectively perform the critical elements of transferred technology, to the satisfaction of all parties and any, or all, applicable regulatory bodies.
The network diagram shows the tasks and stages of the project, considering their length over time. The tasks in the diagram can be dependent on each other (for example, one task can only begin after the completion of another). In addition, the percentage of completion of each task and the person responsible for its implementation can be displayed.
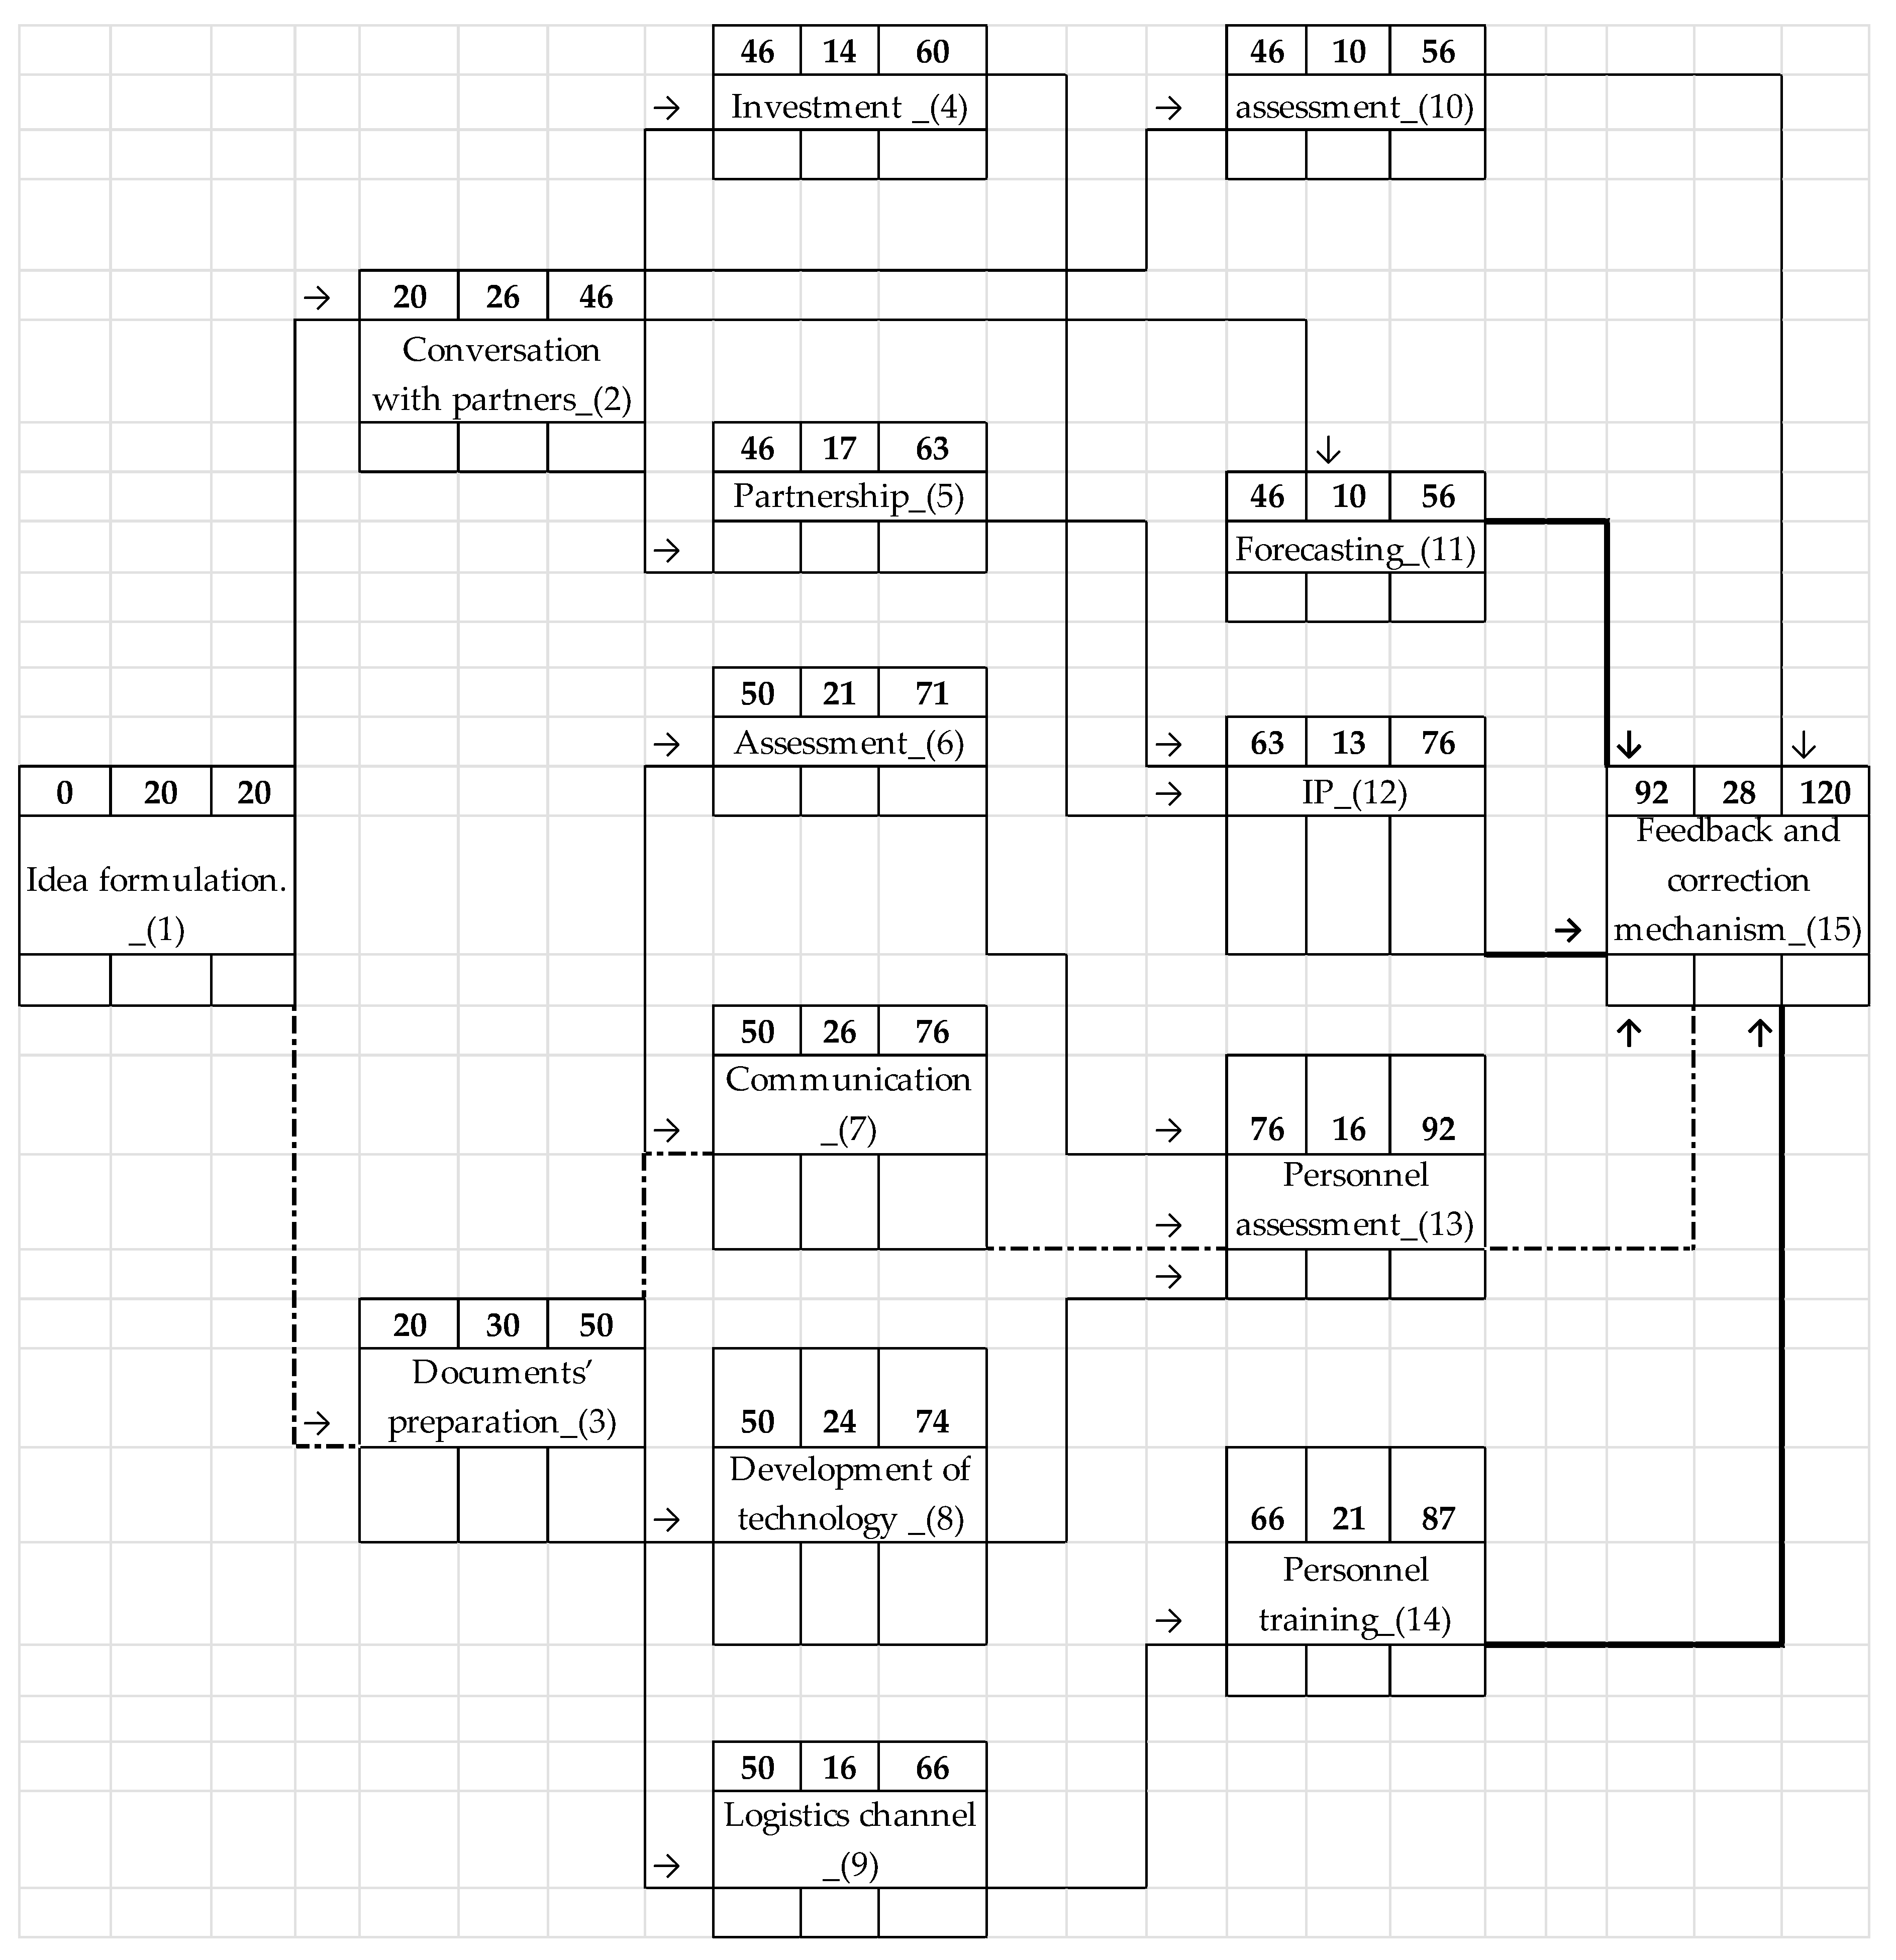
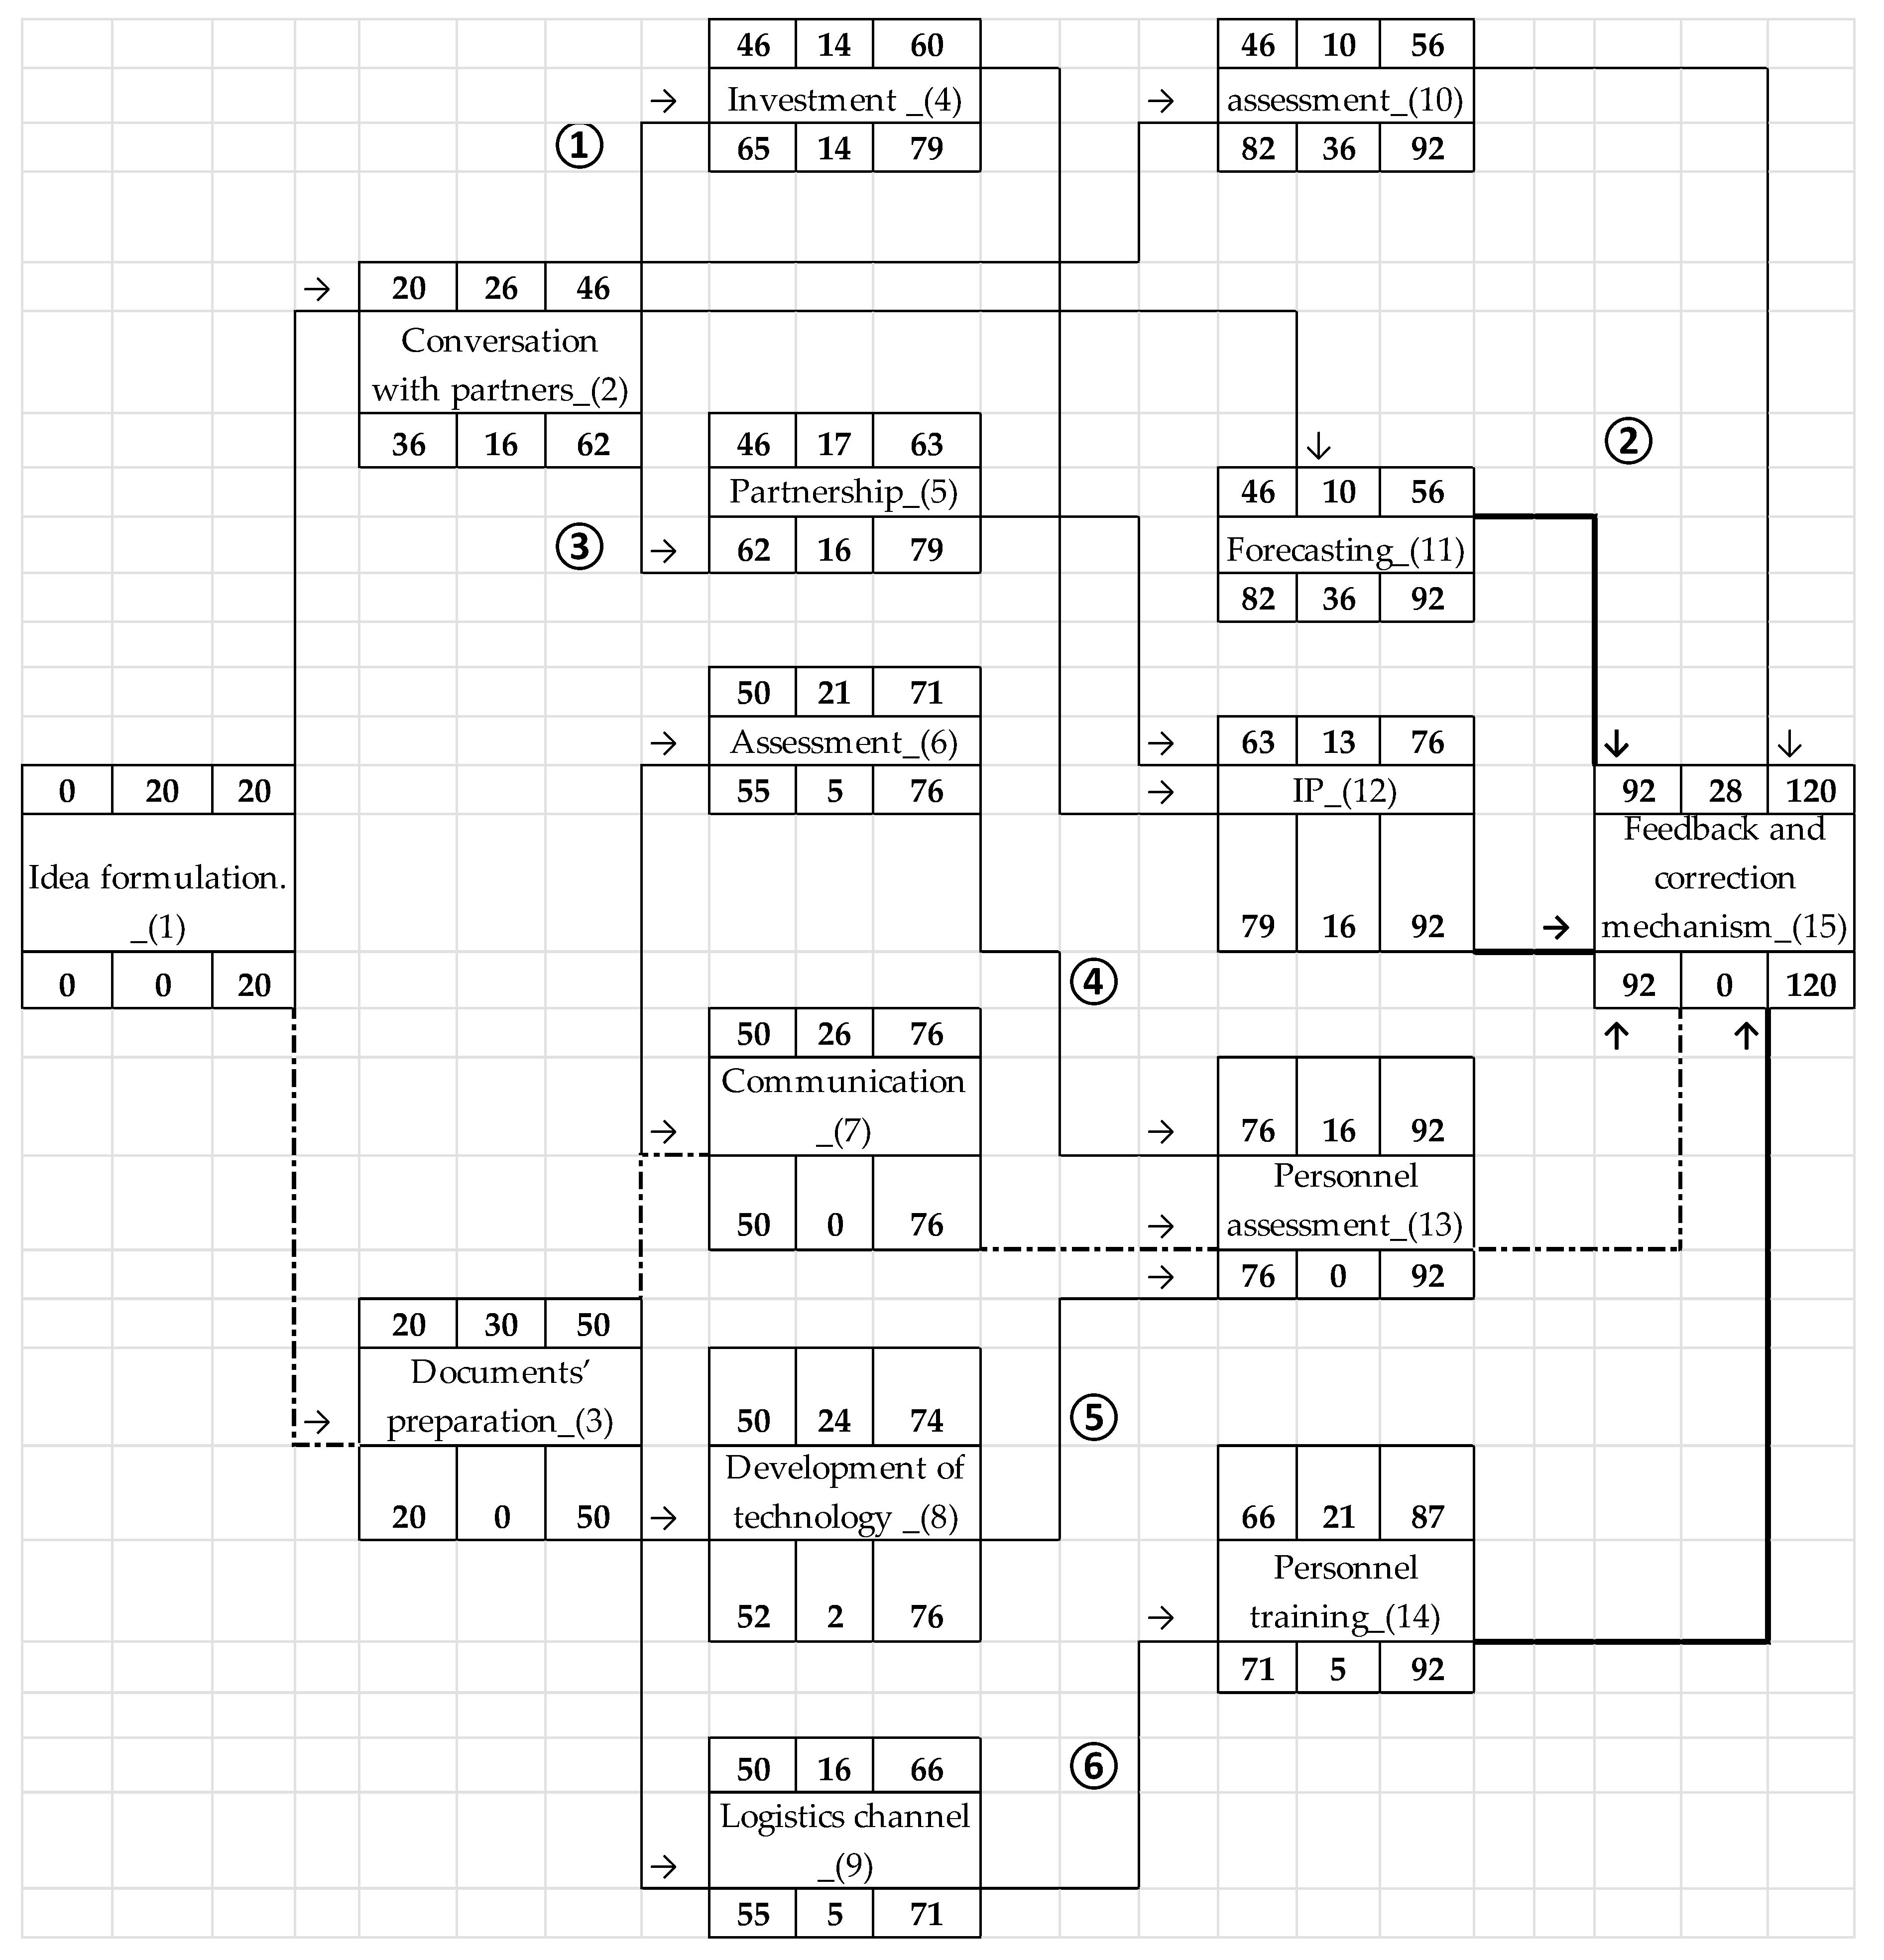
Critical Path Analysis (CPA) was developed in the 1950s to control large defense and technology projects and has been used routinely since then. As with GC, CPA helps managers to plan all tasks that must be completed as part of a project [35]. It acts as the basis both for the preparation of a schedule and for resource planning. During the management of a project, it allows managers to monitor the achievement of project goals. which helps users to see where remedial action needs to be taken to get a project back on course.
Critical path analysis is a project-management technique that lays out all of the activities needed to complete a task, the time it will take to complete each activity and the relationships between the activities. Also called the “critical path method”, critical path analysis can help predict whether a project can be completed on time and can be used to reorganize the project both before starting it, and as it progresses, to keep the project’s completion on track and ensure that deliverables are ready on time. Either manually or using computer software, the project manager first lists each activity, the order it must be completed in and how long it is expected to take, and then diagrams the process. This method impacts on effectiveness of communication and tasks between different steps of transfer project.
Within a project, it is likely that a manager will display a final project plan as a GC (using Microsoft Project or other software for projects of medium complexity or an Excel spreadsheet for projects of low complexity). The benefit of using CPA within the planning process is that it helps develop and test a plan to ensure that it is robust [36]. CPA formally identifies tasks which must be completed on time for the whole project to be completed on time. It also identifies which tasks can be delayed if resources need to be reallocated to catch up on missed or overrunning tasks.
Clark, W. (1922) tells that networking is convenient for managing project time. By setting the planned duration of each task and the relationship between tasks, the manager can easily get the theoretical duration of the project (critical path) [37]. Furthermore, if a manager is looking at the network diagram during the implementation of the project, they can quickly assess the extent to which the planned deadlines are being achieved to make appropriate adjustments.
Tsinarakis (2018), Haji and Darabi (2007) discuss other approaches of project management (simulation; lean concept; waterfall; scrum, Petri net (1996), etc.), but they have more limitations for practical application in comparison with the Gantt Chart and Critical Path Analysis [38,39,40].

3. Materials and Methods

3.1. Methodology

3.1.1. Research Goals and Hypothesis

The main goal of this research is to build an optimization model of technology transfer in the automobile industry. To achieve this goal, the authors combine and use two methods: Gantt Charts and Critical Path Analysis flow diagrams. Thus, hypothesis was submitted during the survey.
The process of technology transfer, which aims to bring research to an industrial product, is an important point of innovation (Cohen et al., 2002) [41]. It is necessary to close the gaps between research and commercialization to generate competitiveness in the industry. This can be achieved by using an optimization model (Nilsson et al., 2010) [42]. In the particular case of headquarter-subsidiary cooperation, it can be seen that the two business units are clear about the need to close planning process gaps and through them the process of technological transference optimize.
Furthermore, headquarters have an objective (third mission) to support the innovation of the subsidiaries through the creation of technological developments (and knowledge) and research that are useful for commercialization and competitiveness. Therefore, they need additional project’s efforts and effective planning activities (Etzkowitz and Ranga, 2013) [43].
The hypothesis is—The combination of Gantt Charts and Critical Path Analysis flow diagrams methods optimize the planning process of a technology transfer project by development of critical path way and minimizing crushing operations.
So, there are several research directions, which support hypothesis and refer to research questions, which is mentioned in Introduction section:
  • We define project of technology transfer and describe how could project management be used for technology transfer process;
  • We study the influence of Gantt Charts and Critical Path Analysis flow diagrams on technology transfer projects;
  • We investigate all results which could be achieved in the application of project management tools for technology transfer models.

3.1.2. Structure of Research

This survey has several steps, with goals for each of them (Figure 2).
There are five steps of the research:
  • step 1: define the scope of the study and design steps of the project;
  • step 2: define the model’s parameters, principles and methods for planning;
  • step 3: use a three-step approach to build the model of technology transfer using the project management concept;
  • step 4: find and evaluate additional model parameters to increase effectiveness;
  • step 5: results discussion and determine the area of investigation of future projects [44].

3.2. Project’s Definition. Technology Knowledge Transfer from the Headquarters to Subsidiary in the Automobile Industry

This research studies a project of technology transfer in the Korean automobile industry; this concerns the Hyundai Corporation.
The Hyundai Motor Corporation has successfully developed its automobile industry in Russia since 2007. In December 2007, an agreement on the construction of a Hyundai automobile factory (manufacturing subsidiary) in Russia was signed. Construction of the plant began in June 2008 in St. Petersburg; the volume of investment amounted to 400 million US dollars. The factory began operation in September 2010. The design capacity of 200 thousand cars per year was divided between Hyundai and its sister Kia Motors [45].
The plant carries out a full cycle of manufacturing of bodies from Russian steel—stamping, welding and painting—with a stated localization of 46% [45].
In 2013, the factory produced 229,400 cars, including 128,400 related to the Hyundai brand. In 2018, the volume of production exceeded 235,000 cars. In 2019, the manufacturing subsidiary announced the creation of an engine assembly plant with a capacity of up to 150,000 units per year [46].
In February 2019, Hyundai opened the Moscow Hyundai Training Academy—one of the largest training centers in the world, which has modern equipment and the latest technical support. Thus, the main task of this corporation in Russian market is now the support and development of technology transfer activity, including knowledge transfer. This research is related to a technology knowledge transfer project of the Hyundai Motor Corporation in the Russian market.
In this study, we consider the small example of the local part of the complex of construction and installation of operations within the framework of a significant project implementation. The performance of calculations and modeling using the CPA method and the classical tabular method is presented.
At first, we build a network diagram based on the first iteration of the calendar plan, made in the form of a GC. For purposes of clarity, we propose not to use the relationship of precedence and to simplify the sequence of actions as much as possible. Although this rarely happens in practice, we imagine in this case that operations are arranged in an end-to-start sequence.
Table 3 shows the operations of the technology transfer project from the Hyundai corporation’s headquarters (automobile branch), located in South Korea, to its subsidiary, located in Russia.
Table 3 shows 15 steps in the technology transfer project with a total duration of 292 weeks. To optimize the planning process of this project and prevent financial and source-based risks, we present a survey of GC and CPA methods.

3.3. Terms and Conditions of GC and CPA Method Planning

Here are some of the terms used in network graphics (CPA method):
  • Operation (or work). For project managers, an operation is an indivisible element of a project that requires time to complete. Its implementation may also be associated with the consumption of other resources. Typically, the execution of operations involves time and labor, although sometimes this may just include time. Examples of this are the operation of waiting for a contract to be signed or waiting for the receipt of materials, approval from the government, customs clearance of goods, etc. Operations typically consist of one or more jobs from work sets [47].
  • Merge operation. This is an operation that has more information about the operation immediately preceding it.
  • Parallel operations. These are operations that can, at the request of the manager, be performed simultaneously. However, it is not necessary to carry out parallel operations simultaneously.
  • Way. A sequence of related, interdependent operations.
  • Critical path. This is the longest path in the entire system of operations; if the operation on this segment is delayed, the execution of the entire project is delayed by the same time.
  • Event. The term is used to indicate the timestamp of the start or end of an operation. The event does not take time.
  • Crushing operation. This is an operation that is immediately followed by several operations (more than one arrow denoting a dependence comes from it).
It is useful to investigate eight basic rules for the development of network graphics (CPA method):
  • The network is deployed from left to right;
  • An operation cannot be started until all previous related operations are completed;
  • The arrows in the network graph show the relationship of precedence and succession. In the figure, arrows may intersect;
  • Each operation must have its own number;
  • The number of the subsequent operation must be greater than the number of any previous operation;
  • The formation of loops is unacceptable (in other words, there should be no looping of the progress of the established set of operations);
  • Conditional transitions from one operation to another are not allowed (meaning the definition of the sequence of operations with the conditions) [48].

3.4. Principles of Construction and Analysis of Network Graphics (CPA Method)

The operation is presented as a block. A block may have various shapes, but recently, a block has most often been represented as a rectangle. The relationship between operations is shown on the chart by arrows between the rectangles (blocks). The arrows show how the operations are related and the sequence of their execution. The length and slope of the arrow are arbitrary and are selected in a way that is most convenient for compiling a network. The letters in the blocks are used simply to indicate operations. In practice, certain numbers and a brief description correspond to operations (Figure 3).
Figure 3A gives an example of what actions should be performed after something has already been done. Such a schedule shows the project manager that operation A should be completed before operation B begins, and operation B should be completed before operation C. Figure 3B shows that operations Y and Z cannot be started until operation X is completed. This figure also shows that operations Y and Z can occur in parallel or simultaneously, at the request of the manager, but this is not a prerequisite. For example, project development (operation Y) may occur during the investment process (operation Z), but the environmental analysis (operation X) must be completed before operations Y and Z commence. Operations Y and Z are considered parallel. Parallel operations allow a manager to take actions at the same time, which can reduce the time it takes to complete a series of operations. Operation X is sometimes called a crushing operation, since more than one arrow leaves the block. The number of arrows indicates how many operations directly follow operation X. Figure 3C shows that operations J, K, L, if desired, can occur simultaneously, and operation M cannot be started until operations J, K, L are completed. The operations J, K, L are parallel. Operation M may be called a merger, since more than one operation must be completed before operation M can be started. Operation M can also be called as a key. In Figure 3D operations Y and X are parallel and can occur simultaneously; operations Z and AA are also parallel. However, operations Z and AA cannot be started until both operations X and Y are completed.
It is necessary to present some important equations which are used for the calculation of the network diagram’s parameters. The main parameters which are necessary to determine during the construction of the model are presented below:
  • The early start of the current work, which includes several links from previous operations. We select the maximum value from all early endings of previous operations:
    T i j e f = T i j e s + T i j ; T i j e s = max T h i e f .
    T i j e f —early finish time of operation, T i j e s —early start time of operation, T i j —operation time, ij—code of current operation, hi—code of operation preceding current operation.
  • Late end of the current action, from which several links come out. We select the minimum value from all the late beginnings of subsequent actions.
    T i j e s = T i j l f ; T i j e f = T j k l f ,
    T i j l f —late finish time of operation, jk—code of operation following the final event of the current operation.
  • The sequence of works forming a critical path. For these actions, the early and late beginnings are equal, as are the early and late ends, respectively. The reserve of such an operation is 0.
    T i j l s = T i j l f t i j ; T i j l f = min T j k l s ,
    T i j l s —late start time of operation.
  • Full and private reserves.
    R i j = T i j l f T i j e f ; R i j = T i j l s T i j e s ; r i j = T j k e s T i j e f ,
    R i j —full reserve of current operation time, r i j —free reserve of current operation time. Reserve is one of the most essential elements of the project management life cycle in the sense that it provides the project management team and the project management team leader with the ability to help minimize risks [49]. Specifically speaking, the reserve typically appears as a provision of a clause in the currently drawn project management plan that is utilized to mitigate all costs that are expected to be incurred, as well as any schedule risks that may exist or could arise [50]. The term reserve, in the concept of project management terminology, can be utilized with any particular modifiers of sorts (for example, management reserve, contingency reserve, etc.), which can provide some specific detail as to the element of the project management function that the reserve applies to, and exactly which project management related risk are expected to be mitigated by that particular reserve [51].
  • The coefficients of the intensity of work. We will consider the logic of the reserve formulas and the work stress coefficient (coefficient of tension) in a special section.
    K ten = 1 R i j T Lcritical t critical ( c ) ,
    K t e n —coefficient of operation’s tension, L—way, TL—way’s length. T L c r i t i c a l —length of diagram’s critical way.
In some project systems, the work timing is measured by the ratio of the durations of mismatching segments and the duration of the maximum path passing through this work. Also, the critical path is considered. This ratio is called the stress ratio or coefficient of tension [52].
Determining these basics of building network diagrams using the CPA method, managers can try to develop a simple network (GC method) using the computer program “MS Project” (Figure 4). Note that the arrows may intersect (for example, Figure 3D), may be bent, or be of any length and inclination. The quality criteria of the network schedule are as follows:
(a)
The exact inclusion of all project operations;
(b)
Their logical dependence;
(c)
Time evaluation.
To ensure the construction, analysis and management of the project schedule, it is necessary to calculate the following parameters of the network schedule: cost, resources involved, and duration of work. The required resources must be calculated before determining the duration of operations, since their duration over time, as a rule, depends on the composition of the resource support involved. In addition, it is important to understand how calendar resources are available, which, in turn, affects the terms of work and their duration. Obviously, the key parameter is precisely the duration of operations. A number of special methods are used to evaluate it, a brief description of which is given in tabular form below (Table 4).
The assessment methods are used at different steps in the project planning as they help to reduce planning risks [53]. The manager should choose the appropriate assessment method according to the case, goals and requirements.

4. Results. Building a Model of Technology Transfer

4.1. Construction of Operation Network Diagram

In Section 3.1.2 we mentioned five steps of the research. Now we have to explain the significant task and risk of technology transfer in each step.
  • step 1: define the scope of the study and design steps of the project—(a) define scope of market segment, industry standards and market barriers; (b) make a consideration about scope of the technology transfer (what exactly we need to transfer);
  • step 2: define the model’s parameters, principles and methods for planning—check the priority of CPA and GC methods; apply for the technology (computer model);
  • step 3: use a three-step approach to build the model of technology transfer using the project management concept—identify all the resources, apply for three step process with problem markers interruptions.
  • step 4: find and evaluate additional model parameters to increase effectiveness—manage the appropriate resources for technology replacement and knowledge improvement.
  • step 5: results discussion and determine the area of investigation of future projects—further considerations within partnership and technology delivery.
The network diagram’s construction begins by placing the task rectangles sequentially from left to right, applying the rules described in Section 3.4. Kaiser. D et al. (2016) suggest that when performing the vertex-work simulation, the main element of the diagram is a seven-segment rectangle, which contains the parameters of the beginning, end, duration, time reserve, and the name or number of operations [54]. A representation of the parameters is shown in Table 5.
Table 5 presents the definition and main parameters of each graph (element = operation) in the planning model.
For the next step, it is necessary to develop the structure of the diagram using a three-steps procedure:
  • In accordance with the logic of the sequence of operations using a specialized program, MS Visio (or any other similar editor), it is necessary to place images of work in the format specified below (Figure 5). First of all, we fill in the names of the actions (operations) performed, their numbers and duration. Then, it is necessary to calculate the early start and early end using the formula for the early start of the current operation within the conditions of several incoming connections. Thus, we reach the step of the operation ending the fragment. At the same time, in the project discussed, the same Gantt chart does not provide outgoing connections from operations 11, 12, 13, and 14. It is unacceptable to “suspend” them on the network model; therefore, it is necessary to add fictitious connections to the final work of the fragment, highlighted with bold arrows in Figure 5.
  • It is necessary to find the critical path. It is known that the critical path is a path that has the longest duration of operations that enter into it. Looking at the model, it is necessary to select the relationships between jobs that have maximum values for the early termination of actions (Figure 6). The critical path is marked with dotted arrows. The result obtained is presented in the intermediate scheme below.
    The critical path connects only five operations in this project (1; 3; 7; 13; 15).
  • Fill in the values of the late end, late start and full reserve of work. To perform the calculation, it is necessary to proceed to the final steps and take it as the last operation of the critical path. This means that the late values of the ending and the beginning are identical to the early ones, and from the last operation of the fragment, it is possible to begin moving in the opposite direction, filling in the bottom line of the schematic representation of the action. The calculation model is shown in Figure 7.
    There is a description of the calculation in the scheme above (highlighted fragments); the early start, early finish, late start, late finish, and the operation’s duration are included in this calculation. Then, it is possible to construct the final planning operation network of technology transfer (Figure 8).
  • The fourth step of the network modeling and calculation algorithm is the calculation of reserves and tension coefficients. First of all, it makes sense to pay attention to the full reserves of non-critical direction (R) paths:
    R way1 = 120 − 101 = 19;
    R way2 = 120 − 84 = 36;
    R way3 = 120 − 104 = 16;
    R way4 = 120 − 115 = 5;
    R way5 = 120 − 118 = 2;
    R way6 = 120 − 115 = 5.
    These reserves are determined by subtracting the time duration of each of these paths from the critical path duration, as numbered on the final network diagram.

4.2. Additional Parameters for the Model

The calculation of the total reserve of the current operation is carried out by subtracting from the value of the late beginning of the early beginning or from the late end of the early end (see the calculation scheme above). The total (full) reserve shows us the possibility of starting the current work later or increasing the duration by the duration of the reserve. However, it is important to understand that full reserves should be used with great care, because work that is farthest from the current event may be without a reserve of time.
In addition to full reserves in network modeling, private or free reserves are also used, which are the difference between the early start of subsequent work and the early end of the current one. Several authors (Pietrosemoli, L.; Rodríguez Monroy, C., 2013; Dmitriev V., Simmons V., Truong Y., Palmer M., Schneckenberg D., 2014; Allard G., Allard S., 2017; Kuo P. S., Lin Y. S., Peng C. H., 2016) considers that this helps to achieve the sustainable development of the planning and monitoring processes [55,56,57,58]. The private reserve shows whether it is possible to advance the beginning of the operation earlier without prejudice to the beginning of the next procedure and the whole schedule. It should be remembered that the sum of all private reserve values is identical to the full reserve value for the path under consideration.
The main task of performing calculations of various parameters is to optimize the network schedule and assess the likelihood of a project being completed on time. One of these parameters is the coefficient of tension, which shows us the level of difficulty of implementing the work on time. The coefficient of tension (Kten) is defined as the difference between the unit and the quotient from dividing the total reserve of the operating time by the difference in the duration of the critical path and the special calculated value. This value includes a number of segments of the critical path that coincide with the maximum possible path to which the current operation (i − j) can be assigned. The following is a calculation of private reserves and work stress ratios for our example (Table 6).
The coefficient of tension varies from 0 to 1.0. A value of 1.0 is set for jobs that are on a critical path. The closer the value of the non-critical operation is to 1.0, the more difficult it is to adhere to the planned terms of its implementation. After the coefficient values for all actions of the chart are calculated, operations, depending on the level of this parameter, can be categorized:
  • Critical zone (Ki − j over 0.8);
  • Sub-specific zone (Ki − j is more than or equal to 0.6, but less than or equal to 0.8);
  • Reserve zone (Ki − j less than 0.6).
The optimization of the network model, aimed at reducing the overall duration of the project, as a rule, is ensured by the following activities:
  • Redistribution of resources in favor of the most demanding procedure;
  • Reducing the complexity of operations located on a critical path;
  • Parallelization of critical path operations;
  • Processing the network structure and operations.
Reddy, A. M. and Zhao, L., and Flouris, T. G. and Christinsen, D.S. state that the generally recognized scheduling software (MS Project, Primavera Suretrack, OpenPlan, etc.) are able to calculate the key parameters of a project’s network model [59,60]. In this paragraph, by using the tabular method, we show that it is possible to configure this calculation using not only the usual instruments of MS Excel. The fragment of a project’s operations is taken in the field of construction for the operations’ installation. The main parameters of the network diagram are in the columns of the spreadsheet (Table 7).
The advantage of performing calculations in a tabular way is the ability to easily automate calculations and to avoid a large number of errors related to the human factor. The numbers of operations located on the critical path are highlighted with bold (column 5), and the estimated positions of private reserves exceeding zero are highlighted with italic (column 10).
Below, we present a step-by-step analysis of the calculation of the network parameters for the main positions:
  • Early beginnings of operations following current work. We configure the calculation algorithm to select the maximum value from the early end time of several alternative previous actions. Take, for example, operation 13: it is preceded by works 6, 7, 8. Of the three early endings (71, 76, 74, respectively), it is necessary to select the maximum value of 76 and put it down as the early start of operation 13.
  • The critical path. Performing the calculation procedure according to paragraph 1 of the algorithm, it is necessary to reach the end of the fragment, finding the value of the critical path duration, which was 120 days in the example of the discussed project. The values of the largest early endings among the alternative actions indicate operations that are on the critical path. These operations were marked in the constructed graph.
  • Late end of operations preceding current work. Starting from the end of work, managers begin to move in the opposite direction from actions with large numbers to operations with smaller ones. Moreover, from several alternatives of outgoing work, managers select the least knowledge of the late start. Late beginnings are calculated as the difference between the selected values of late endings and the duration of operations.
  • Reserves of operations. The calculation of the total (general) reserves using the difference between the late beginnings and early beginnings or between late end and early end is performed. The values of private (free) reserves are obtained by subtracting the early end of the current operation from the early start of the next operation.

5. Discussion

The combination of Gantt Charts and Critical Path Analysis flow diagrams methods obtained significant success in that it improved the planning process for technology transfer projects, helped managers to understand another aspect of a sustainable project’s development: how risk-management tools impact the technology transfer project’s planning process.
Some limitations of this research were investigated.
1.
This research is based on one project: technology knowledge transfers between a headquarters and subsidiary (South Korea–Russia).
The critical path indicators and operations may have different variations depending on type and area of project. For example, some external factors (partnership communication process; standards change in industry, so on) and internal factors (access to resources; management style; corporate goals; so on) may affect the decision-making process in the project management system.
2.
The period of the survey is only from January 2019 until now.
The project which is the object of this survey has been started from the beginning of running year (2019) and will be continued until 2025. So, we calculated the critical path way of the project to optimize all the resources and improve effectiveness. But there could be unexpected influences in future (from 2020 till 2025) in internal and external environments, which is why we discuss risk-analysis in the discussion section. Unfortunately, we cannot arrange forecasting now which refers to any possible changes in this project of technology transfer. Using Critical Path Analysis within the planning process helped us develop and test a plan (292 weeks) to ensure that it is robust. Critical Path Analysis formally identifies the tasks which must be completed on time for the whole project to be completed on time. We obtained 292 weeks of transfer project duration, because we calculated all the requirement indicators, including parallel, crushing operations and critical path way.
3.
The scope of this survey is focused on the automobile industry.
The Korean automobile industry develops very fast and manage a lot of changes. For example, it is necessary to adapt Korean technologies to local markets, share knowledge, communicate with local suppliers and compete with other global transport companies. All these factors dictate the special corporate goals and define the steps of the transfer project. In another industry there are other trends and changes, so the project management results vary.
To manage these limitations in future it is useful to study risk management tools in technology transfer process.
The risk evaluation problem should be investigated in future research, because some questions and uncertainties in the current survey have been raised:
  • Critical path analysis and a model parameters evaluation are included in the project’s planning process, but there is nothing about risk analysis;
  • Risk factors may have a negative impact on project management, and they should be submitted in the Gantt Chart model;
  • Different risk management tools should be estimated, and only one tool (or sustainable combination of the tools) should be chosen.
Abba, W.F. (1995) stated that there should be an application of integrated (comprehensive) risk analysis and the optimization of the project network schedule [61]. Integral risk analysis implies the structuring of possible risk events, allocation of macro and micro risks, qualitative and quantitative assessment of identified risks, and the development of regulations for activities related to risk management (Figure 9).
In the network graph, the parameters of time and cost of work and risk factor parameters are introduced, with the last parameter determined by constructing risk matrices. The network diagram model is a non-linear optimization task according to the criteria of the minimum time, cost and risk of the project. The application of the proposed methodology, as its testing on a real project to create technological innovation for automobile industry shows, can significantly improve project performance and thereby increase the chances of its successful implementation.
It is necessary to emphasize that a technology-transfer process differs in some subjects; for example, the receiver can often become the sender and vice versa for a single transfer. In the specific case of the collaboration between a headquarter and a subsidiary, there is a process of validation and learning that is cyclical. Considering the Heslop, L. A. (2001) [63] model, the “message”—which for the technology transfer process is technology, scientific knowledge, or any research result—can be presented in different ways of project management and the transfer process can be performed by different mechanisms, which are known as transfer mechanisms (Heinzl et al. 2013) [64].
It should be noted that authors such as Shvetsova O. (2018); Bozeman (Bozeman 2000; Bozeman et al. 2015), Rubiralta (2004), Malik (2002), Waroonkun and Stewart (2008), and Khakbaz, P. P. (2012) did not differentiate between the strategy and risk-management mechanism for the technology transfer processes [65,66,67]. However, other authors such as Landau (Landau et al. 1982) (who separated the middle element of the package from the marketing mechanism), Mayer and Blaas (2002) (who separated what the initiative business unit sends and what the accepter business unit receives), and Hoffmann (Hoffmann et al. 2009) (for whom, according to the level of the object, the headquarter uses a different strategy and the transfer is performed in a different mechanism) differentiated the strategies from the mechanisms [67,68,69].
Berg H. P. (2010) suggested that risk in project management is often understood as the probability of not receiving a planned result at a given level of quality and on time [70]. The nature of the risks is quite diverse, but an analysis of the reasons for the unsuccessful implementation of projects showed that the main one is a lack of resources or time. A very important aspect of the problem is the consideration of two types of project risk influence: temporary (risk of failure to complete operation on time), and cost (risk of exceeding the cost of operation). Selig, G. J. (2008) suggested that the presence of a significant number of operations with temporary and cost risks leads to risk for the entire project or program (exceeding the project implementation deadlines, or the costs of its implementation) [71]. Resource support parameters and time limits, as a rule, are placed at the stage of pre-project preparation, thereby confirming the position that the reasons for successful or unsuccessful project implementation are present at the preliminary planning stage; thus, at the planning stage, it is necessary to provide for the necessary compensation measures and take adequate organizational and managerial decisions, but for these purposes, it is necessary to have information about the nature of potential risks. This makes it necessary to evaluate the risks that arise during the implementation of the project at the planning stage to estimate—preferably quantitatively—their impact on results and the necessary compensation for adverse conditions. The whole range of measures for the accounting and assessment of and compensation for project risks is implemented within the framework of the risk-management methodology [71]. The methods of accounting and risk assessment are quite diverse, and the success of their application largely depends on the correct classification, which involves considering the nature of the risk.

6. Conclusions

During this research, the authors chose the case study of the Korean automobile industry as an excellent example of technology transfer in global markets. A single project of technology transfer was discussed: technology knowledge transfers from a Korean headquarters to a Russian manufacturing subsidiary (Hyundai Motor Corporation). The quantitative data were collected through the open resources of the Corporation; the qualitative data were analyzed through a case study and model parameter evaluation.
A significant result of the combination of Gantt Charts and Critical Path Analysis flow diagrams methods, which improved the planning process of the technology-transfer project, was found from this survey.
The authors examined the practical mechanisms for compiling a network schedule and calculating the main parameters of the time duration of the project. Thus, the authors came close to exploring the possibilities of an analysis carried out in order to optimize the network model and formulate an action plan directly to improve its quality for a sustainable project planning process. This topic takes up little space in the project manager’s complex of knowledge and is not particularly difficult to grasp. In any case, each planning manager must be able to reproduce the visualization of the schedule and perform the associated calculations at a good professional level.
Therefore, the authors explained the significant task and risk of technology transfer in each step to exclude the trivial application of CPA and GC methods:
  • Defining the scope of the study and design steps of the project—(a) defined scope of market segment, industry standards and market barriers; (b) made a consideration about scope of the technology transfer (what exactly we needed to transfer); risks of this stage, which were managed by CPA and GC methods: strategy uncertainty avoidance; partnership considerations for long-term period.
  • Defining the model’s parameters, principles and methods for planning—checked the priority of CPA and GC methods; applied for the technology (computer model). Risks of this stage, which were managed by CPA and GC methods: planning mistakes can be excluded; evaluation of resource capacity can be arranged.
  • Using a three-step approach to build the model of technology transfer using the project management concept—identified all the resources, applied for three step process with problem markers interruptions. Risks of this stage, which were managed by CPA and GC methods, were: correction of the technology transfer project schedule; contribution with correction markers into the optimization of planning process.
  • Finding and evaluating additional model parameters to increase effectiveness—managed the appropriate resources for technology replacement and knowledge improvement. Risks of this stage, which were managed by CPA and GC methods, were: correction of the resources and capabilities in technology transfer project schedule; contribution with correction markers into the optimization of resource planning process.
  • Arranging results discussion and determining the area of investigation of future projects—further considerations within partnership and technology delivery. Risks of this stage, which were managed by CPA and GC methods, were: correction of the future considerations in project schedule; contribution with correction markers into the optimization of future planning process and partnership.
The main results of this research are as follows:
  • Hypothesis “The combination of Gantt Charts and Critical Path Analysis flow diagrams methods improves the planning process for a technology transfer project” is proved by this study.
  • It is useful to apply project management tools for technology transfer models;
  • Gantt Charts and Critical Path Analysis flow diagrams have a sustainable impact on technology transfer projects;
  • The critical path and operation reserves in a network diagram help to optimize the planning process for technology transfer.
For future research, it will be necessary to investigate the correlation between risk-management tools and project management tools for sustainable technology transfer in the automobile industry.

Author Contributions

S.L. and O.A.S. created the conceptualization; O.A.S. designed the methodology; S.L. carried out the investigation; S.L. and O.A.S. made the analyses, validation, and data curation; O.A.S. wrote the paper, and S.L. contributed to reviewing and editing all sections; S.L. supervised the work.

Funding

This research received research funding (2019) from Korea University of Technology and Education (KOREATECH).

Conflicts of Interest

The authors declare no conflict of interest.

References

  1. Parker, D.; Zilberman, D.; Castillo, F. Offices of Technology Transfer. Choices Mag. Food Farm Resour. 1998, 13, 19–25. [Google Scholar]
  2. Danquah, M.; Ouattara, B.; Quartey, P. Technology Transfer and National Efficiency: Does Absorptive Capacity Matter? Afr. Dev. Rev. 2018, 30, 162–174. [Google Scholar] [CrossRef]
  3. Markman, G.; Siegel, D.; Wright, M. Research and Technology Commercialization. J. Manag. Stud. 2008, 45, 1407. [Google Scholar] [CrossRef]
  4. Dyer, J.H.; Singh, H. The relational view: Cooperative strategy and sources of inter-organizational competitive advantage. Acad. Manag. Rev. 1998, 23, 660–679. [Google Scholar] [CrossRef] [Green Version]
  5. Stuart, T.E. Network positions and propensities to collaborate: An investigation of strategic alliance formation in a high-technology industry. Adm. Sci. Q. 1998, 43, 668–698. [Google Scholar] [CrossRef]
  6. Stuart, T.E. Inter-organizational alliances and the performance of firms: A study of growth and innovation rates in a high-technology industry. Strateg. Manag. J. 2000, 21, 791–811. [Google Scholar] [CrossRef]
  7. Odagiri, H. R&D Expenditures, Royalty Payments, and Sales Growth in Japanese Manufacturing Corporations. J. Ind. Econ. 1983, 32, 61–71. [Google Scholar]
  8. Braga, H.; Wilmore, L. Technological imports and technological effort: An analysis of their determinants in Brazilian firms. J. Ind. Econ. 1991, 39, 421–432. [Google Scholar] [CrossRef]
  9. Deolalikar, A.; Evenson, R.E. Technology production and technology purchase in Indian industry: An econometric analysis. Rev. Econ. Stat. 1989, 71, 687–692. [Google Scholar] [CrossRef]
  10. Zhao, H. Technology imports and their impact on the enhancement of China’s indigenous technological capability. J. Dev. Stud. 1995, 31, 585–602. [Google Scholar] [CrossRef]
  11. Hu, A.; Jefferson, G.Z.; Jinchang, Q. R&D and Technology Transfer: Firm-Level Evidence from Chinese Industry. Rev. Econ. Stat. 2005, 87, 780–786. [Google Scholar]
  12. Rogers, E.M.; Kincaid, D.L. Communication Networks: A New Paradigm for Research; The Free Press: New York, NY, USA, 1982. [Google Scholar]
  13. OECD, July 2017. Available online: http://www.oecd.org/statistics/ (accessed on 15 August 2019).
  14. Hyundai Motor to launch car-sharing service in Russia. Available online: https://pulsenews.co.kr/view.php?year=2019&no=366591 (accessed on 20 August 2019).
  15. Temkin, A. Korean Enclave in St. Petersburg. 2013. Available online: http://english.spbu.ru/news/3284-the-minister-of-culture-of-the-republic-of-korea-visited-st-petersburg-university-during-the-international-cultural-forum (accessed on 15 November 2019).
  16. Foster, G. Traditional Cultures and the Impact of Technological Change; Harper & Row: New York, NY, USA; Evanston, IL, USA, 1971. [Google Scholar]
  17. Camp, S.M.; Sexton, D.L. Technology Transfer and Value creation: Extending the theory beyond information exchange. J. Technol. Transf. 1992, 17, 68–76. [Google Scholar] [CrossRef]
  18. Bozeman, B.; Heather, R.; Youtie, J. The evolving state-of-the-art in technology transfer research: Revisiting the contingent effectiveness model. Res. Policy 2015, 44, 34–49. [Google Scholar] [CrossRef]
  19. Malik, K. Aiding the technology manager: A conceptual model for intra-firm technology transfer. Technovation 2002, 22, 427–436. [Google Scholar] [CrossRef]
  20. Burnside, B.; Witkin, L. Forging Successful University-Industry Collaborations. Res. Technol. Manag. 2008, 51, 26–30. [Google Scholar] [CrossRef]
  21. Gorschek, T.; Garre, P.; Larsson, S.; Wohlin, C. A Model for Technology Transfer in Practice. IEEE Softw. 2006, 23, 88–95. [Google Scholar] [CrossRef]
  22. Waroonkun, T.; Anthony, R.S. Modeling the international technology transfer process in construction projects: Evidence from Thailand. J. Technol. Transf. 2008, 33, 667–687. [Google Scholar] [CrossRef] [Green Version]
  23. Khabiri, N.; Sadegh, R.; Senin, A. Identifying Main Influential Elements in Technology Transfer Process: A Conceptual Model. Procedia Soc. Behav. Sci. 2012, 40, 417–423. [Google Scholar] [CrossRef] [Green Version]
  24. Bar-Zakay, S.N. A technology transfer model. Technol. Forecast. Soc. Chang. 1971, 2, 321–337. [Google Scholar] [CrossRef]
  25. Behrman, J.N.; Wallender, H.W. Transfers of Manufacturing Technology within Multinational Enterprises; Ballinger Publishing Company: Cambridge, MA, USA, 1976. [Google Scholar]
  26. Dahlman, C.J.; Westphal, L.E. The managing of technological mastery in relation to transfer of technology. Ann. Am. Acad. Political Soc. Sci. 1981, 458, 12–26. [Google Scholar] [CrossRef]
  27. Chen, L.; Hsu, P.Y.; Chang, Y.B. A Petri Net Approach to Support Resource Assignment in Project Management. IEEE Trans. Syst. Man Cybern.-Part A Syst. Hum. 2008, 38, 564–574. [Google Scholar] [CrossRef]
  28. Lin, C.-P.; Hung-Lin, D. Applying Petri Nets on Project Management. Univers. J. Mech. Eng. 2014, 2, 89–102. [Google Scholar] [CrossRef]
  29. Devine, M.D.; James, T.E.; Adams, I.T. Government supported industry research centers: Issues for successful technology transfer. J. Technol. Transf. 1987, 12, 27–38. [Google Scholar] [CrossRef]
  30. Ramanathan, K. Competing through total technology management. In Proceedings of the Portland International Conference on Management of Engineering and Technology-PICMET 05, Portland, OR, USA, 31 July–4 August 2005. [Google Scholar]
  31. Radosevich, R. A mixed-strategy and case example of federal technology transfer in the USA. Int. J. Technol. Manag. 1993, 8, 596–611. [Google Scholar]
  32. Radosevich, R.; Smith, G.S. A model for entrepreneurship infrastructure development in the creation of technopolis. In Commercializing High Technology: East and West, Selected Conference Papers; Sedaitis, J.B., Ed.; Rowman & Littlefield Pub.: Stanford, CA, USA, 1997; pp. 95–118. [Google Scholar]
  33. Nishizawa, A. From Triple-Helix Model to Ecosystem Building Model. Int. J. Techno-Entrep. 2011, 2, 304–323. [Google Scholar]
  34. Jolly, V.K. Commercialization New Technologies; Harvard Business School Press: Boston, MA, USA, 1997. [Google Scholar]
  35. Gibson, D.V.; Smilor, R. Key variables in technology transfer: A field-study based empirical analysis. J. Eng. Technol. Manag. 1991, 8, 287–312. [Google Scholar] [CrossRef]
  36. Gibson, D.V.; Molly, C.; Rogalev, N. Transfer of R&D results from public research centers: Lessons learned in the U.S. and applied to Russian/CIS research centers. In Proceedings of the 10th Annual Association Technopark Meetings, Moscow, Russia, 29–30 June 2000. [Google Scholar]
  37. Clark, W. The Gantt Chart: A Working Tool of Management; Ronald Press: New York, NY, USA, 1922; pp. 78–79. [Google Scholar]
  38. Lockyer, K.; Gordon, J. Project Management and Project Network Techniques, 6th ed.; Pearson Education: London, UK, 1996; pp. 156–176. [Google Scholar]
  39. Tsinarakis, G.J. Modeling Task Dependencies in Project Management using Petri nets with arc extensions. In Proceedings of the 26th Mediterranean Conference on Control and Automation—MED 2018, Zadar, Croatia, 19–22 June 2018. [Google Scholar]
  40. Haji, M.; Darabi, H. Petri net based supervisory control reconfiguration of project management systems. IEEE Int. Conf. Autom. Sci. Eng. 2007, 2007, 460–465. [Google Scholar]
  41. Cohen, W.M.; Richard, R.N.; Walsh, J.P. Links and Impacts: The Influence of Public Research on Industrial R&D. Manag. Sci. 2008, 48, 1–23. [Google Scholar]
  42. Nilsson, A.S.; Rickne, A.; Bengtsson, L. Transfer of academic research: Uncovering the grey zone. J. Technol. Transf. 2010, 35, 617–636. [Google Scholar] [CrossRef]
  43. Etzkowitz, H. Tech transfer, incubators probed at Triple Helix III. Res. Technol. Manag. 2000, 43, 4–5. [Google Scholar]
  44. Institute Project Management. A Guide to the Project Management Body of Knowledge (PMBOK Guide). Proj. Manag. J. 2009, 40, 104. [Google Scholar] [CrossRef]
  45. St. Petersburg Investment Portal. Available online: http://spbinvestment.ru/en/projects/avtomobilnyy-zavod-kompanii-hende-motor-kompani (accessed on 1 February 2019).
  46. Temkin, A.; Nepomnyashchy, A. Hyundai Believes in Russia. 2010. Available online: https://pulsenews.co.kr/view.php?year=2019&no=366591 (accessed on 20 August 2019).
  47. Fieldman, R.E. Some Thoughts on C/SCSC and Current State of Project Management Tools. PM Netw. 1993, 10, 6–8. [Google Scholar]
  48. Fleming, Q.W.; Koppelman, J.M. Earned Value Project Management; Project Management Institute: Philadelphia, PA, USA, 2016. [Google Scholar]
  49. Francesco, D.M.; Kate, D. The influence of local community stakeholders in megaprojects: Rethinking their inclusiveness to improve project performance. Int. J. Proj. Manag. 2017, 35, 1537–1556. [Google Scholar]
  50. Institute Project Management. A guide to the project management body of knowledge (PMBOK® Guide). 2001. Available online: http://www.cs.bilkent.edu.tr/~cagatay/cs413/PMBOK.pdf (accessed on 15 November 2019).
  51. Zanjirchi, S.M. Construction project success analysis from stakeholders’ theory perspective. Afr. J. Bus. Manag. 2012, 6, 78–87. [Google Scholar]
  52. Osman-Gani, A.A. International technology transfer for competitive advantage: A conceptual analysis of the role of HRD. Compet. Rev. 1999, 9, 9. [Google Scholar] [CrossRef]
  53. Kaiser, D.; Köhler, T.; Weith, T. Knowledge management in sustainability research projects: Concepts, effective models, and examples in a multi-stakeholder environment. Appl. Environ. Educ. Commun. 2016, 15, 4–17. [Google Scholar] [CrossRef]
  54. López-Morale, V.; Ouzrout, Y.; Manakitsirisuthi, T.; Bouras, A. MKMSIS: A multi-agent knowledge management system for industrial sustainability. Stud. Comput. Intell. 2015, 607, 195–213. [Google Scholar]
  55. Pietrosemoli, L.; Rodríguez Monroy, C. The impact of sustainable construction and knowledge management on sustainability goals. A review of the Venezuelan renewable energy sector. Renew. Sustain. Energy Rev. 2013, 27, 683–691. [Google Scholar] [CrossRef] [Green Version]
  56. Dmitriev, V.; Simmons, V.; Truong, Y.; Palmer, M.; Schneckenberg, D. An exploration of business model development in the commercialization of technology innovations. R&D Manag. 2014, 44, 311. [Google Scholar] [CrossRef]
  57. Allard, G.; Allard, S. Information behavior in the technology transfer process. Proc. Assoc. Inf. Sci. Technol. 2017, 54, 615. [Google Scholar] [CrossRef]
  58. Kuo, P.S.; Lin, Y.S.; Peng, C.H. International Technology Transfer and Welfare. Rev. Dev. Econ. 2016, 20, 214–227. [Google Scholar] [CrossRef]
  59. Reddy, A.M.; Zhao, L. International Technology Transfer: A Review. Res. Policy 1990, 19, 285–307. [Google Scholar] [CrossRef]
  60. Flouris, T.G.; Lock, D. Managing Aviation Projects from Concept to Completion; Ashgate Publishing: London, UK, 2012. [Google Scholar]
  61. Abba, W.F. Beyond Communicating with Earned Value: Managing Integrated Cost, Schedule and Technical Performance; PMI Symposium: New Orleans, LA, USA, 1995; pp. 2–6. [Google Scholar]
  62. Christinsen, D.S. A Review of Cost/Schedule Control Systems Criteria Literature. Int. J. Proj. Manag. 1994, 25, 32–39. [Google Scholar]
  63. Heslop, L.A.; McGregor, E.; Griffith, M. Development of a Technology Readiness Assessment Measure: The Cloverleaf Model of Technology Transfer. J. Technol. Transf. 2001, 26, 369–384. [Google Scholar] [CrossRef]
  64. Heinzl, J.; Kor, A.-L.; Orange, G.; Kaufmann, H.R. Technology transfer model for Austrian higher education institutions. J. Technol. Transf. 2013, 38, 607–640. [Google Scholar] [CrossRef] [Green Version]
  65. Shvetsova, O.A. Electronic Applications for Developing the Competencies of Engineering Personnel in Dynamic Economic Systems. In Proceedings of the 2018 International Conference “Quality Management, Transport and Information Security, Information Technologies” (IT&QM&IS), St. Petersburg, Russia, 24–28 September 2018. [Google Scholar]
  66. Khakbaz, P.P. The Role of Research and Development in Growth of Small and Medium Enterprise in Technological Cluster of Regions. Inf. Manag. Bus. Rev. 2012, 4, 234–241. [Google Scholar]
  67. Mayer, S.; Blaas, W. Technology Transfer: An Opportunity for Small Open Economies. J. Technol. Transf. 2002, 27, 275–289. [Google Scholar] [CrossRef]
  68. Hoffmann, M.G.; Amal, M.A.; Mais, I. Um Modelo Integrado de Transferência de Tecnologia com Vistas à Inovação—A Experiência da Universidade Regional de Blumenau; Asociación Latino-Iberoamericana de Gestión Tecnológica: San José, CA, USA, 2009. [Google Scholar]
  69. Rubiralta, M. Transferencia a las Empresas de la Investigación Universitaria; Academia Europea de Ciencias y Artes: Salzburgo, Austria, 2004. [Google Scholar]
  70. Berg, H.P. Risk Management: Procedures, Methods and Experiences. Reliab. Theory Appl. 2010, 2, 79–95. [Google Scholar]
  71. Selig, G.J. Implementing IT Governance: A Practical Guide to Global Best Practices in IT Management; Van Haren Publishing: ’s-Hertogenbosch, The Netherlands, 2008; pp. 98–134. [Google Scholar]
Figure 1. Proportion of gross domestic expenditure on research and development (GERD) against gross domestic product (GDP). Source: OECD, July 2017, http://www.oecd.org/statistics/ [13].
Processes 07 00917 g001
Figure 2. Structure of research. Source: made y authors.
Processes 07 00917 g002
Figure 3. Description of network graph construction. Source: made by authors.
Processes 07 00917 g003
Figure 4. Gannt Chart (GC) created using Microsoft Project (MSP). Notes: (1) the critical path is in red; (2) the slack is the black lines connected to non-critical activities; (3) since Saturday and Sunday are not work days and are thus excluded from the schedule, some bars on the Gantt Chart are longer if they cut through a weekend. Source: authors.
Processes 07 00917 g004
Figure 5. First step of technology transfer project planning. Source: authors.
Processes 07 00917 g005
Figure 6. Second step of technology transfer project planning. Source: authors.
Processes 07 00917 g006
Figure 7. Scheme for calculating late beginnings and endings outside the critical path. Source: authors.
Processes 07 00917 g007
Figure 8. The final view of the operation network for technology transfer. Source: authors.
Processes 07 00917 g008
Figure 9. Risk-analysis in project planning process. Source: Christinsen, D.S. [62].
Processes 07 00917 g009
Table 1. Qualitative technology-transfer models.
Model TitleYear of DevelopmentDefinitionCases for Application
Bar-Zakay Model [24]1971A comprehensive model is based on the project management approach. There are four stages in the technology transfer process: search, adaptation, implementation, maintenance.There is need for a comprehensive examination; milestones and decision points are required.
Behrman and Wallender Model [25]1976A seven-stage process is proposed for international technology transfer: manufacturing and planning, product design, specification, production start-up, adaptation, improvements, external support.May be more relevant to multinational corporations.
Dahlman and Westphal Model [26]1998A five-step generic model: establishing market-place requirements, identifying technology solutions, classifying technology solutions, establishing resources, finalizing the technology-acquisition decision.Adaptive to a resource-based approach and competitive decisions.
Petri Net Approach [27]2002In the Petri net-based approach, the project manager does fine tuning of the planning and scheduling with the resource constraints embedded in the plan representation. This structure is applicable to the control of more general discrete event dynamic systems as well as the project management problem.In case no admissible control action can be found, the manager turns to the rescheduling/replanning mode to generate a new plan and schedule.
Simulation approach [28]2009Project management simulation is used to analyze real projects. The goal of the simulation is to show the user the different possible outcomes of his decisions, along with the probability that each outcome will occur. The simulation helps in reducing the project risk and in choosing the best project plan.A simulation is run to check the different possible outcomes and their probability as a result of different inputs for the uncertain variables.
Source: authors.
Table 2. Importance of commonly used project management tools.
Project Management ToolsBFCG
Project brainstorming and initial concepts, ideas, structures, aims, etc.*****--
Gathering and identifying all elements, especially causal and hidden factors******-
Scheduling and timescales--*****
Identifying and sequencing parallel and interdependent activities and stages*-****
Financials: costings, budgets, revenues, profits, variances, etc.*******
Monitoring, forecasting, reporting-******
Troubleshooting, problem identification, diagnosis and solutions********
“Snapshot” or “map” overview: non-sequential, non-scheduled*****--
Format for communications, presentations, updates, progress reports, etc.-*****
Matrix key: B = Brainstorming, F = Fishbone/Ishikawa Diagrams, C = Critical Path Analysis flow diagrams, G = Gantt Charts; ***—main tool, **—optional/secondary tool, *—sometimes useful. Resource: made by authors.
Table 3. Technology-transfer project steps.
# of OperationTitle of OperationProblemDuration (Weeks)
1Idea formulation. The definition of technology knowledge transferUncertainty with idea generation process, common goals, motivation and team-building20
2Conversation with partners. Signing of official agreementProblem with common goals, strategy understanding and communication process26
3Technology and standard documents’ preparationDifferent in industry standards in different countries, risks of global environment30
4Investment engagementInvestment risks, uncertainty with return on investment14
5Building partnership with foreign subsidiariesRisk of increasing funding for subsidiary development (establishment)17
6Assessment of subsidiary environmentMarket research risks, relevance of market data21
7Communication strategy creationRisk if communication technology, knowledge protection26
8Development of technology for transferring (computer program)Technology risk, decision-making process24
9Choosing the logistics channel for technology transferringRisk of inappropriate logistic infrastructure in local market16
10Risk assessmentProblem with risk classification and risk-management strategies10
11Forecasting and economic factors evaluationScenario-management tools are difficult to use10
12Intellectual property analysisProblem with Intellectual property protection and operational procedures, bureaucracy13
13Personnel assessmentProblem with core competencies and HRD16
14Personnel trainingProblem with human resources development methods21
15Feedback and correction mechanismProblem with problem markers and appropriate schedule28
Total 292
Source: authors.
Table 4. The main methods for assessing the duration of operations in network diagram (GC method).
Assessment MethodApplication CaseRequirements
Expert method
-
Complexity of assessment;
-
Additional influence factors
-
Expert experience
-
Business experience
-
Recommendations
Peer review
-
Earliest steps of the project;
-
Lack of detailed information
-
The actual length of the previous operation
-
Expert experience and assessment
-
Similarity of content and type of operation
Parameter assessment
-
Required data
-
Availability of standards, scope of work
-
Data about resource quantity
Reserve analysis
-
Risks influencing the operation’s length
-
Experts of the content of operations and possible risks
Source: authors.
Table 5. Element graph of operation network diagram.
Early StartDurationEarly Finish
T i j e s T i j T i j e f
Code and title of operation
Late startReserve of time (float)Late finish
T i j l s R i j T i j l f
Source: made by authors.
Table 6. The table for calculating private reserves and the coefficient of tension.
# OperationK T j k e s T i j e f r i j R i j t c r i t i c a l K i j
12202000-1
1320200---
244646016700.68
2546460---
21046460---
21146460---
36505000-1
3750500---
3850500---
3950500---
4126063314940.46
5126363016940.38
613717655940.81
713767600-1
813747622940.92
914666605940.81
101556923636760.18
111556923636760.18
121576921616760.64
1315929200-1
1415879255760.89
15---00-1
Source: made by authors.
Table 7. Model for calculating network parameters (tabular approach).
# Operationh − i T i j T i j e s T i j e f T i j l s T i j l f R i j j − k r i j
12345678910
1-20020020020
1-------30
2126204636621640
2-------50
2-------100
2-------110
313020502050060
3-------70
3-------80
3-------90
42144660657914123
52174663627916120
6321507155765135
7326507650760130
8324507452762132
9316506655715140
1021046568292361536
1121046568292361536
124; 51363767992161516
136; 7; 816769276920150
14921668771925155
1510; 11; 12; 13; 142892120921200--
Source: authors.

