Article

Thermo-Fluidic Characteristics of Two-Phase Ice Slurry Flows Based on Comparative Numerical Methods

1
School of Mechanical Engineering, Kyungpook National University, 80 Daehakro, Bukgu, Daegu 41566, Korea
2
Department of Chemical Engineering, Norwegian University of Science and Technology, 7491 Trondheim, Norway
*
Author to whom correspondence should be addressed.
Processes 2019, 7(12), 898; https://doi.org/10.3390/pr7120898
Submission received: 1 November 2019 / Revised: 11 November 2019 / Accepted: 22 November 2019 / Published: 2 December 2019
(This article belongs to the Section Chemical Processes and Systems)

Abstract

:
Ice slurry is a potential secondary refrigerant for commercial refrigeration systems because of its remarkable thermal properties. It is necessary to optimize the heat transfer process of ice slurry to reduce the energy consumption of the refrigeration system. Thus, this study investigates the heat transfer performance of single-phase (aqueous solution) and two-phase (ice slurry) refrigerants in a straight horizontal tube. The numerical simulations for ice slurry were performed with ice mass fraction ranging from 5% to 20%. The effects of flow velocity and ice concentration on the heat transfer coefficient were examined. The results showed that heat transfer coefficient of ice slurry is considerably higher than those of single-phase flow, particularly at high flow velocity and ice content, where increase in heat transfer with a factor of two was observed. The present results confirmed that ice slurry heat transfer ability is considerably affected by flow velocity and ice concentration in laminar range. Moreover, the second part of this paper reports on the credibility three distinct two-phase Eulerian–Eulerian models (volume of fluid (VOF), mixture, and Eulerian) for the experimental conditions reported in the literature. All two-phase models accurately predict the thermal field at low ice mass fraction but underestimate that at high ice mass fractions. Regardless of the thermal discrepancies, the Eulerian–Eulerian models provide quite reasonable estimation of pressure drop with reference to experimental data. The numerical predictions from the VOF model are more accordant with the experimental results and the maximum percentage error is limited to ~20% and ~13% for thermal and pressure drop predictions, respectively.

1. Introduction

The importance of secondary refrigerants for industrial systems grew remarkably over the past few decades because of the greenhouse gas emissions associated with primary refrigerants [1,2]. Single-phase refrigerants include aqueous solutions of water with freezing point depressant additives (i.e., glycol, alcohol, and salt). The use of single-phase secondary refrigerant is limited to the systems not needing to be cooler than the freezing point of water. Two-phase secondary refrigerants, such as ice slurry and CO2, are ideal for the low-temperature-based industrial refrigeration systems [3,4,5]. Ice slurry is made of small ice particles suspended in carrier fluid of aqueous solution. The high latent heat and excellent heat transport properties of ice slurry permit effective cooling at comparatively lower flow rates. The application of ice slurry includes industrial or commercial refrigeration and cooling systems because of its ability to reduce pumping power and equipment size [6]. The size of ice slurry particles, concentration, and amount of additive vary for particular applications. The size of ice particles generally differs from 0.1 mm to 1.2 mm in diameter to facilitate storage in tanks. Effective thermo-physical properties are evaluated by directly weighing the corresponding properties of the carrier liquid (varies with the amount of additives and temperature) [7,8]. Ice concentration is used to restrict the Newtonian and non-Newtonian behaviour for ice slurry flow. The flow behaviour of ice slurry could be assumed Newtonian when ice mass fraction is up to 15%–20% [9,10,11].
Estimation of thermal performance of various industrial system such as CO2 secondary refrigeration systems and heat exchangers is necessary to reduce the energy consumption and to optimize the design of these systems [12,13]. Particularly the two phase-flow of ice slurry for commercial applications has attracted considerable attention in the past. However, there is a lack of understanding regarding the hydrothermal characteristics of ice slurry. In spite of the extensive research carried out on the two-phase flow of ice slurry, it is not evident from the literature whether heat transfer increases or decreases with the increase in ice concentration. However, the majority of the authors agree that the utilization of ice promotes heat transfer [14,15].
For instance, the heat transfer coefficient increases in accordance with the increase in ice mass fraction and mass flow rate. Heat transfer increases rapidly at high mass flow rates with a maximum ice mass fraction of 10% in a horizontal tube. However, the contribution of ice mass fraction to heat transfer at high mass flow rate is insignificant [16]. Moreover, Nusselt number increases linearly with Reynold’s number in laminar range for variable tube diameter and ice packing factor [15]. Contrary to this, Knodel et al. [17] reported a significant decrement in the heat transfer with the increase in ice mass fraction up to 4%. Nusselt number remains constant at high ice concentrations [18]. Irrespective of the complexity involved in the experimental two-phase flow systems, the literature lacks an obvious relation between the heat transfer and ice concentration for ice slurry flow.
For pumping requirements, the estimation of pressure drop is essential in order to transport ice slurry in various industrial system. Pressure drop increases linearly with the increase in ice mass fraction and flow velocity, however after a certain threshold of ice mass fraction (up to 10%), it becomes less dependent on flow velocity and increases with the increase in ice concentration [19]. The pressure drop in narrow tubes increases linearly with ice concentration and the rate of increase is more significant in low Reynolds number range [20]. The increase or decrease in pressure drop with the variation in velocity and ice mass fraction depends on the flow regime [21].
Increase in pressure drop with the increase in ice concentration and flow velocity is supported by many studies [22,23]. Opposite to this, [17] Knodal et al. and [24] Lieu et al. reported decrement in pressure drop with the increase in ice concentration for a low-velocity regime. In the context of these contentious conclusions, Wang et al. [25] summarized in their recent review article that knowledge on the hydrothermal characteristics of ice slurry remained ambiguous and further studies are required for better understanding of the hydrothermal performance of two-phase refrigerants.
Computational fluid dynamic (CFD) is a useful technique for predicting the two-phase flow behavior of a complex system under any condition [26,27,28]. Presently in the Ansys Fluent 13 [29] module, two common approaches are available for the computational modeling of multiphase flow. The first is the Eulerian–Eulerian method (volume of fluid (VOF), Eulerian, and mixture model) and the second approach is the Eulerian–Lagrangian technique. The Euler–Euler method considers the different phases as mathematically interpenetrated continua. The approach of phasic volume fraction is proposed in this method, and volume fractions are considered to be continuous function of time and space with sum being equal to one [30]. In the Eulerian–Lagrangian method, the primary phase is assumed as continuum and the Navier–Stokes equation is solved for the primary phase, where the ice particles are traced throughout the domain. The tracking of a huge number of particles make numerical calculations more burdensome moreover, with the limitation of absence of particle–particle interaction [29,31,32].
Several studies were conducted using different CFD-based two-phase models to simulate the ice slurry flow in circular tubes. Significant decrement in heat transfer coefficient at the entrance of straight pipe was reported using the Eulerian–Eulerian multiphase model. A constant trend was observed afterwards; however, after the complete melting of ice, a rapid increase in temperature contributed to heat transfer augmentation [33]. Stamatiou and Kawaji [18] adopted the mixture model to evaluate the particle distribution, velocity, and pressure drop of isothermal ice slurry flow. The mixture model can provide ample information on the fluid flow characteristics of heterogeneous ice slurry flow.
The relative errors of numerical computations are in the range of ~15% with the experimental values. However, numerical predictions from the Eulerian–Eulerian model for heterogeneous ice slurry flow remained close to experimental conditions at a relatively low computational cost [31,34]. For homogeneous flow, the Eulerian–Eulerian model accurately predicted the flow field at high inlet velocities. However, the collision near the wall was pronounced for particles with a large diameter [35]. Wang et al. [32] also used the Eulerian–Eulerian model to evaluate the flow characteristics of ice slurry in various shapes of pipes, such as vertical, horizontal, and 90-degree elbow pipes [36,37].
Nevertheless, these studies did not establish a selection criterion amongst all two-phase models. Thus, a CFD-based study, suggesting an appropriate two-phase model, must be conducted for a better understanding of hydrothermal characteristics of ice slurry flows.
The present study aims to numerically investigate the heat transfer characteristics of single-phase (aqueous solution) and two-phase (ice slurry) refrigerants in a straight horizontal tube. Heat transfer characteristics were evaluated by estimating the heat transfer coefficient. The effects of ice mass fraction (5% to 20%) and flow velocity (0.25 and 0.5 m/s) on heat transfer coefficient were evaluated. Furthermore, this study applied and compared three distinct two-phase Eulerian–Eulerian models (Eulerian, mixture, and volume of fraction) to predict their credibility for ice slurry thermal behavior, and pressure drop assessment of isothermal ice slurry for the experimental conditions specified by [22,38], respectively.

2. Problem Description and Modelling

The present study focuses on the heat transfer performance of single-phase flow of aqueous solution and the two-phase flow of ice slurry in a horizontal tube under constant wall heat flux boundary condition. Single-phase flow of an aqueous solution (10.3% ethanol) and ice slurry flow with ice mass fraction 5–20% at a constant ice particle diameter (ds = 0.1 mm) are considered in a pipe with L = 94 mm and D = 21 mm [38]. Moreover, for pressure drop characteristics of isothermal ice, slurry flows with ice mass fraction 5%–15% at constant ice particle diameter (ds = 0.27 mm) are considered in a pipe with D = 9 mm and L = 1000 mm for the experimental conditions reported by [22]. These studies assume Newtonian behavior of ice slurry flow because the maximum ice fraction considered was 20%. Mathematical modelling and property calculation correlations for ice slurry have been provided in the next section.

2.1. Thermo-Physical Properties

The co-relations for thermo-physical properties of ice slurry can be obtained from the handbook of ice slurry [10].
ρ i s = α s ρ s + ( 1 α s ) ρ l ,
μ i s = μ l ( 1 + 2.5 α s + 10.05 α s 2 + 0.00273 e 16.6 α s ) ,
where α s and α ρ represent the ice volume fraction and density of the solid particles, respectively, and ρ l is the density of carrier liquid. μ i s and μ l denote the viscosity of ice slurry and carrier liquid (10.3% ethanol–water solution), respectively. The thermophysical properties of carrier liquid and ice particles evaluated at phase equilibrium temperature of 268.65 are presented in Table 1.

2.2. Single-Phase Flow Modelling

Heat transfer characteristics of an aqueous solution based on 10.3% ethanol–water solution have been evaluated in the laminar range. The relevant governing equations are described as follows:
. ( ρ l v ) = 0 ,
( ρ l v v ) =   p + . ( μ l v ) + ρ l g ,
.     ( ρ l v H ) = . ( λ l Δ T ) ,
where ρ l ,   μ l , and λ l represent the density, viscosity, and thermal conductivity of the aqueous solution, respectively.

2.3. Two-Phase Flow Modelling

The flow modelling of a solid–liquid mixture commonly uses two approaches. The first approach is a Lagrangian–Eulerian method, which is appropriate for low solid volume fraction. This method analyzes base fluid and solid particles by using Eulerian and Lagrangian models, respectively. However, Eulerian–Eulerian is the suitable approach for high solid volume fractions. The Eulerain–Eulerian approach includes three distinct numerical models, namely mixture, volume of fluid (VOF), and Eulerian model.

2.3.1. VOF Model

A single set of momentum equations is solved in the volume of fraction model and VOF for all the phases is tracked in the entire domain. The physical properties are shared by all phases and determined by taking averaged values depending on their phasic fraction in the entire control volume [29,41]. For the modelling of ice slurry, the primary and secondary phases are solid and liquid, respectively. The relevant governing equations are given below:
1 ρ l ( t ( α l ρ l ) + . ( α l ρ l v l ) ) = 0 ,
1 ρ s ( t ( α s ρ s ) + . ( α s ρ s v s ) ) = 0 ,
where α s represents the ice volume fraction, ρ s represents the density of ice particles, and ρ l denotes the density of the aqueous solution. The momentum equation for VOF model can be written as follows:
t ( ρ v ) + . ( ρ v v ) =   p + [ μ ( v + ( v ) T ) ] + ρ g ,
where ρ is the density and p denotes the pressure shared by both phases. The energy equation shared by both phases is described below:
t ( ρ E ) + . ( v ( ρ E + p ) ) = . ( λ e f f T ) ,
where λ e f f represent the effective thermal conductivity. Energy E is evaluated as the mass averaged variable in the VOF model.
E = α l ρ l E l + α s ρ s E s α l ρ l + α s ρ s ,
The energy equation for ice melting is described as:
t ( ρ E s ) + . ( ρ v E s ) = . ( λ T ) ,
where E s is given by:
E s = ( h + Δ H ) ,
where h denotes sensible heat and Δ H represent the latent heat of ice particles. In the VOF model, density is evaluated by the following expression:
ρ = ( α s ρ s + α l ρ l ) .
All other properties, including thermal conductivity viscosity, are calculated in the same manner.

2.3.2. Mixture Model

The mixture multiphase model is applied in multiphase flows wherein various phases move at different velocities. The relative velocity between solid and liquid phase is described by an algebraic formulation [29,42]. The relevant governing equations can be written as follows:
ρ m t +   . ( ρ m v m ) = m ˙ ,
where the subscript m denotes the mixture phase, ρ represents the density, and v represents local velocity. The momentum equation for mixture model is formulated as follows:
t ( ρ m v m ) + . ( ρ m v m v m )    =   p + [ μ m ( v m + v m T ) ]   . τ m + ρ m g + . ( i = 1 2 α i ρ i v D i v D i ) ,
where subscript i represent the phase i = 1(l)/2(s), which corresponds to the liquid and solid phase, respectively. τ and α indicate the shear stress and ice volume fraction, respectively. The drift velocity is denoted by   v D i . The drift velocity for solid and liquid phase is described as follows:
v D s = v s v m = v ls i = 1 2 α i ρ i ρ m v li ,
v D l = v l v m =   v l s i = 1 2 α i ρ i ρ m v s i ,
where v l s denotes the slip velocity and is calculated by the algebraic slip formulation proposed by [43]:
v l s = v l v s = ( ρ m ρ s ) d s 2 18 μ l f d r a g ( g v m t ) .
The drag function is determined by equation proposed by [44]:
f d r a g   = { 1 + 0.15 R e s           0.018 R e s 0.687         R e s 1000                                                 R e s > 1000                                        
where d s denotes particle diameter, ρ m is the mixture density, and R e s is the particle Reynolds number.
R e s = ρ l | v s v l | μ l
The shear stress for the mixture multiphase model is described below:
τ m = μ m (   . v m + . v m T ) .
In the mixture model, the viscosity is evaluated from the following equation:
μ m = i = 1 2 α i μ i   .
All other properties, mixture density, and thermal conductivity are computed in the same manner. The energy equation is written as follows:
.   ( i = 1 2 α i ρ i v i H i ) = .   ( λ m T ) ,
where v is the local velocity vector, α denotes the volume fraction, and λ m is the mixture thermal conductivity.

2.3.3. Eulerian–Eulerian Model

Various types of coupling amongst the phases are found in the Eulerian–Eulerian approach. The Eulerian–Eulerian model solves continuity, momentum, and energy for primary and secondary phases, whereas pressure is shared by both phases. The volume of fraction is calculated separately for each phase via integration throughout the domain [29]. The governing equations can be written as follows:
t ( α i ρ   i ) +   . ( α   i ρ   i v ) =   m iq ˙ ,
where α denotes ice mass fraction and ρ represents density and v is the local velocity. The subscript i represents the phase (solid or liquid phase when i = l or s). q indicates the opposite phase and m iq ˙ denotes the mass transfer rate among both phases. The relevant momentum equation for liquid phase can be described as follows [45]:
t ( α l ρ l v l ) +   . ( α l ρ l v l v l ) = α l p +   . τ l + α l ρ l g + F s l + ( m ˙ s l v s m ˙ l s v l ) ,
τ l = α l μ l [ v l + ( v l ) T ] 2 α l μ l ( . v l ) I 3 ,
where μ l is the viscosity of liquid phase and I represents the unit vector. The momentum equation for solid phase is described as follows [46]:
t ( α s ρ s v s ) +   . ( α s ρ s v s v s ) =   α s p p s +   . τ s + α s ρ s g + F ls + ( m ˙ ls v l m ˙ ls v s ) .
p denotes the local pressure shared by all phases; g is the acceleration of gravity; and F s l refers to the sum of inertial forces. τ l , denotes the liquid phase stress and m ˙ s l v s m ˙ l s v l is the interphase momentum transfer due to mass transfer. The solid phase shear stress is described as [45]:
τ s = ( p s + ζ s . v s ) I + α s μ s [ v s + ( v s ) T 2 ( . v s ) I 3 ] ,
where ζ s is the bulk viscosity expresses as sum of the kinetic and collisional contributions, and can be formulated as [46]:
ζ s = 4 3 α s ρ s d s g 0 ( 1 + e s s ) ( θ s π ) 1 2 .
θ s represent the granular temperature, e s s denotes particle-particle restitution coefficient, and g 0 is the radial distribution function proposed by [45]:
g 0 = [ 1 ( α s α s , m a x ) 1 3 ] 1 .
α s , m a x represent the maximum solid volume fraction. The drag force for two-phase flow system of ice slurry is described as [45]:
F D , i = K s l   ( v q v i ) .
The K s l , solid liquid momentum exchange coefficient can be formulated as [45]:
K s l =   { 3 C D α s α l ρ l | v l v s | α l 2.65 4 d s    ( α s < 0.2 ) 150 α s 2 μ l α l d s 2 + 1.75 ρ l α s | v l v s | d s    ( α s 0.2 )
C D is the drag force coefficient can be formulated as [44]:
C D = 24 α l R e s [ 1 + 0.15 ( α l R e s ) 0.687 ] ,
where the particle Reynolds number R e s is given by:
R e s = ρ l d s | v s v l | μ l .
The lift force is described as follows:
F L , i = 0.5 α s ρ l ( | v q v i | ) × ( × v l ) .
The energy equation for both the phases is given below:
t ( α i ρ i H i ) + . ( α i ρ i v i H i ) =   . ( λ e f f , i T i ) + τ i   . v h v ( T i T q ) + ( m qi ˙ H q m iq ˙ H i ) ,
where H and λ e f f represent the enthalpy and effective thermal conductivity, respectively. T is the temperature, h v denotes the volumetric interphase heat transfer, and ( m qi ˙ H q m iq ˙ H i ) indicates the energy transfer due to the mass transfer between phases.

3. Numerical Details

The commercial CFD software (275 Technology Drive Canonsburg, PA 15317, USA) Fluent 13 was employed for the numerical calculation of ice slurry flow. The diameter of the pipes were selected at 23 mm and 9 mm based on the experimental conditions of [22,38], respectively. A variable density-based mesh (finer near the walls and entrance) was used to discretize the computational domain of pipes using the ICEM software (275 Technology Drive Canonsburg, PA 15317, USA) available in ANSYS. A mesh independence analysis was performed to confirm the high accuracy of results at low computational cost by using three different levels of mesh refinement and varying these levels with a factor of three; (total number of elements for D = 23 mm: G1 = 67,155, G2 =188,889, G3 = 284,138 and for D = 9 mm: G1 = 109,020, G2 = 301,500 and G3 = 603,980). A minimum difference in calculation was observed; therefore, mesh with a total number of 188,889 and 301,500 elements was adopted in further calculation for 21 mm and 9 mm diameter pipes, respectively (Figure 1a,b). Uniform velocity for both the phases and volume fraction for the solid phase was applied at the pipe inlet. No-slip and zero-gauge pressure boundary conditions were adopted for both phases at the pipe walls and outlet, respectively (Figure 2). In addition, uniform temperature was assigned at the inlet. Uniform wall heat flux was applied to the pipe walls. All differential equations were discretized by a control volume technique, and second-order upwind and SIMPLEC schemes were adopted for convective–diffusive terms and pressure–velocity coupling, respectively. The time step was fixed to 0.001 s. Convergence of numerical solutions was restricted to 10−6.

4. Results and Discussion

4.1. Single-Phase Flow

Separate simulations were performed for aqueous solution of ethanol–water solution with 0% ice mass fraction for a similar boundary condition to that for ice slurry flow to compare the heat transfer characteristics of single-phase flow and ice slurry. Moreover, the simulations for single-phase flow of water was performed at room temperature. The numerical simulations were performed to cover the laminar flow range. The first row of Table 2 summarizes the numerical conditions for the single-phase flow and Figure 3a presents the results. Increases in Nusselt with Reynolds number were observed for both cases, as indicated by Figure 3a. The calculated heat transfer coefficients of the aqueous solution were found to be higher than that of water. The convective heat transfer coefficient significantly depends upon the thermophysical properties of the fluid. The significant higher value of dynamic viscosity for aqueous solution corresponds to higher values of Prandtl number, which subsequently corresponds to significant higher Nusselt number values.
According to the theoretical analysis in [47], Nusselt number for fully developed pipe flows subjected to constants wall heat flux is 4.36. It is apparent from Figure 3a that higher values of average Nusselt number are obtained than theoretically derived. The influence of thermal boundary layer is significant in this case. The developing thermal boundary layer causes higher temperature gradient, which leads to higher values of Nusselt number.
The numerical calculation of average Nusselt number for ethanol–water solution is compared with the experimental results of Grozdek et al. [38] in Figure 3b, and results are plotted for Reynolds number at uniform wall heat flux. The average Nusselt number is calculated by substituting the value of average heat transfer coefficient and thermal conductivity of carrier liquid into the definition of Nusselt number.
N u = h D h λ l ,
where h denotes the average heat transfer coefficient, D h represents hydraulic diameter, and λl is thermal conductivity of carrier liquid. The heat transfer coefficient increases linearly with the inlet velocity which consequently results higher values of Nusselt number. The percentage error of numerical model predictions at Reynolds number 500, 1000, and, 1500 is ~1.3%, ~5.69%, and, ~3.69% from the experimental results, respectively. Relatively higher values of Nusselt number are obtained by the numerical model in comparison to the experimental values; the experimental uncertainties can be accounted for by this overestimation.

4.2. Non- Isothermal Ice Slurry Flow

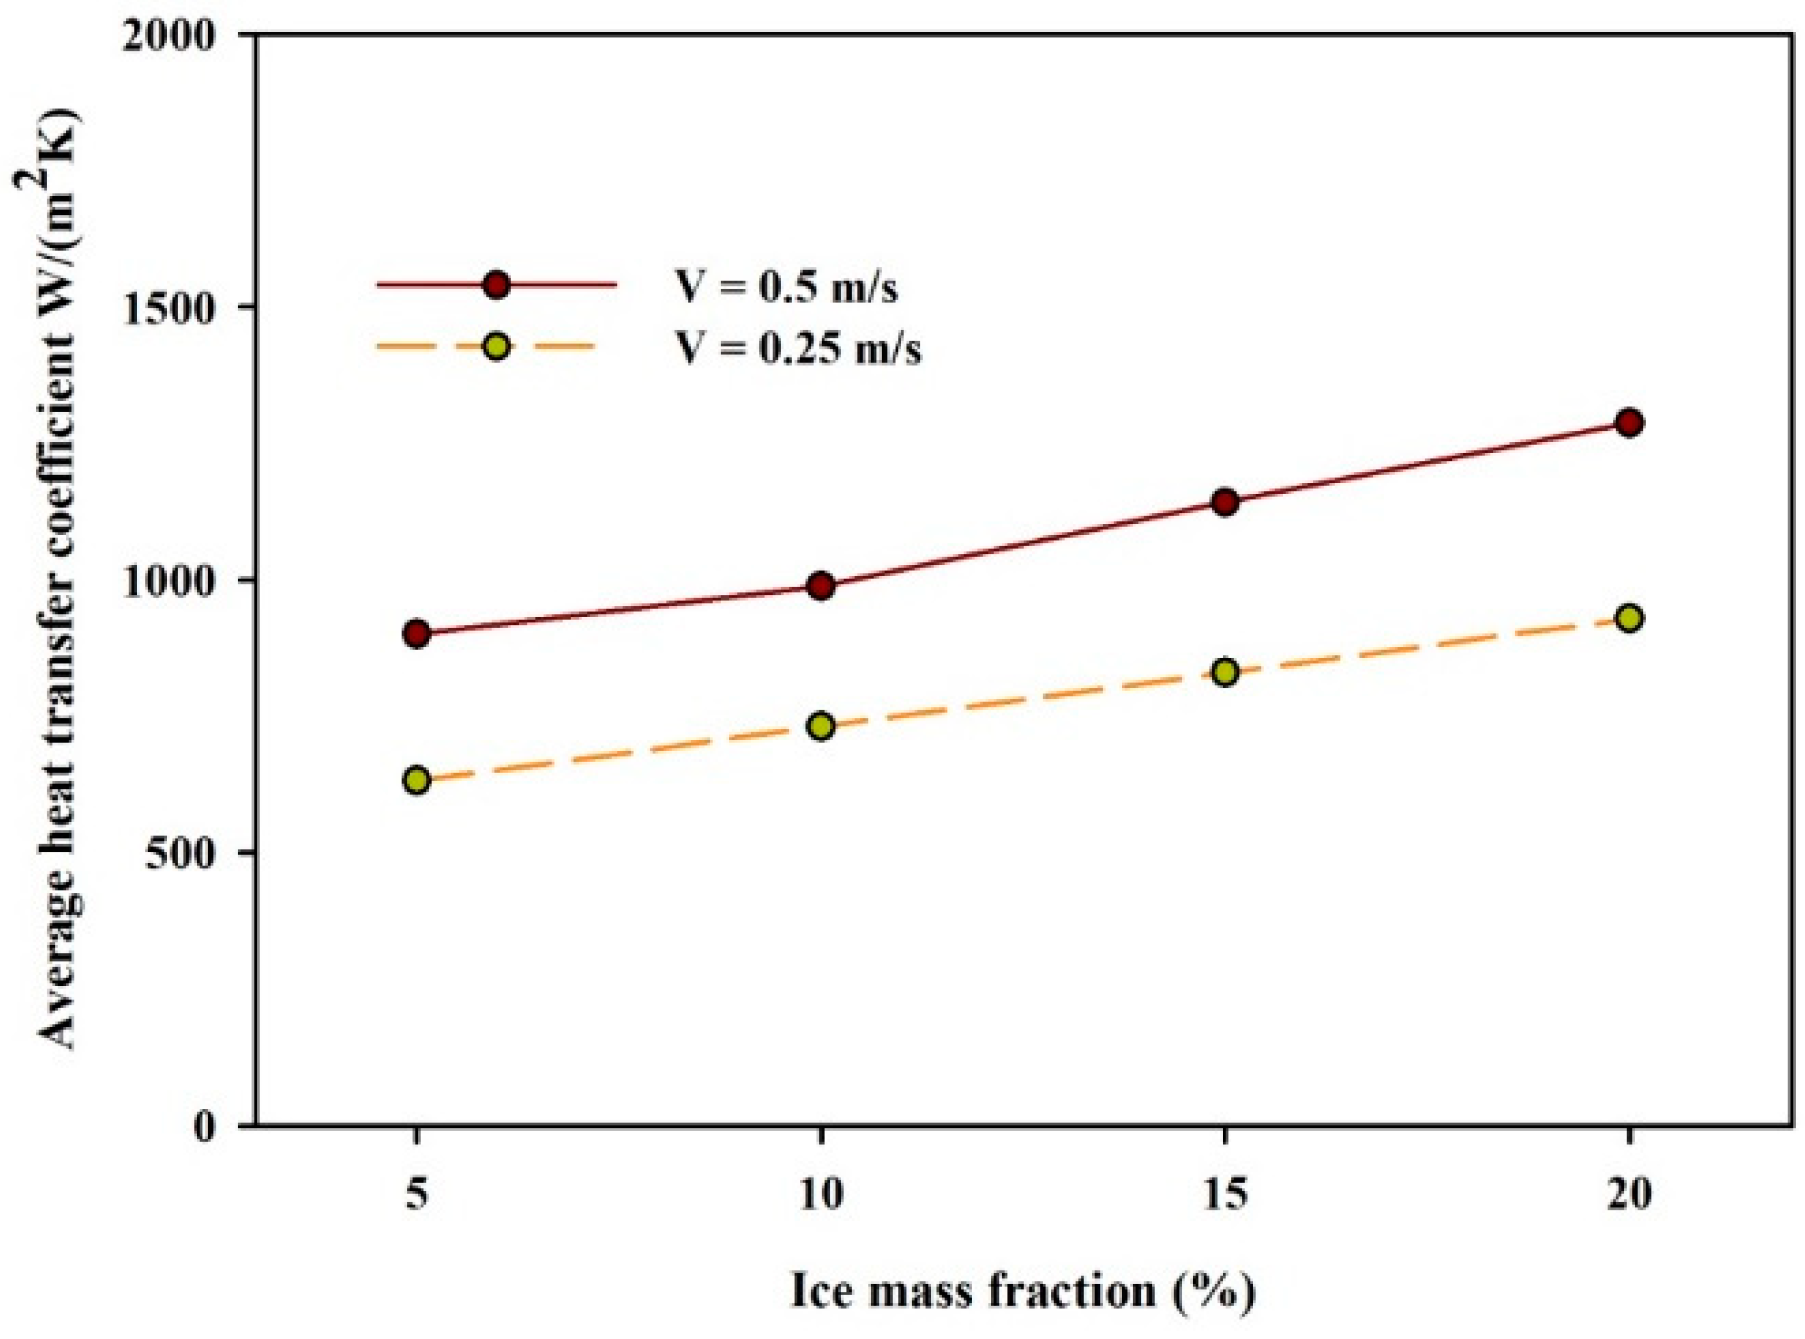
Figure 4 illustrates the average heat transfer coefficient at variable ice mass fraction, velocity, and constant wall heat flux. It is worth noting that at a constant velocity, Reynolds number ( R e = ρ i s U D / μ i s ) decreases as the ice fractions increases because the viscosity and density of ice slurry depend on ice concentration. Predominantly, heat transfer enhancement is confirmed with the increase in ice concentration and flow velocity. The heat transfer coefficient evidently increases with a factor of two for ice slurry flow in comparison with carrier liquid.
For two-phase flow of ice slurry, the heat transfer enhancement is due to the cumulative effect of sensible and latent heat of ice particles. Moreover, an additional effect, namely, microconvection due to the presence of small ice particles, promotes heat transfer. This condition is only significant in the laminar regime of ice slurry flow [48]. Moreover, when the ice slurry flow occurs in a low-velocity region, the heat transfer augmentation is caused by the heterogeneous distribution of the ice particles, where the particles accumulate to the top of the tube and disturbs the thermal boundary layer by coming directly in contact with the pipe wall. The present study deals with the heat transfer of ice slurry during forced convection, without a complete phase change of ice particles due to the lower value of heat flux adopted, which is characterized by considerable higher values of heat transfer coefficient than that of carrier fluid. In the laminar regime, heat transfer in ice slurry is strongly affected by inlet flow velocity and ice concentration [48]. A high ice content and velocity confirm heat transfer enhancement.
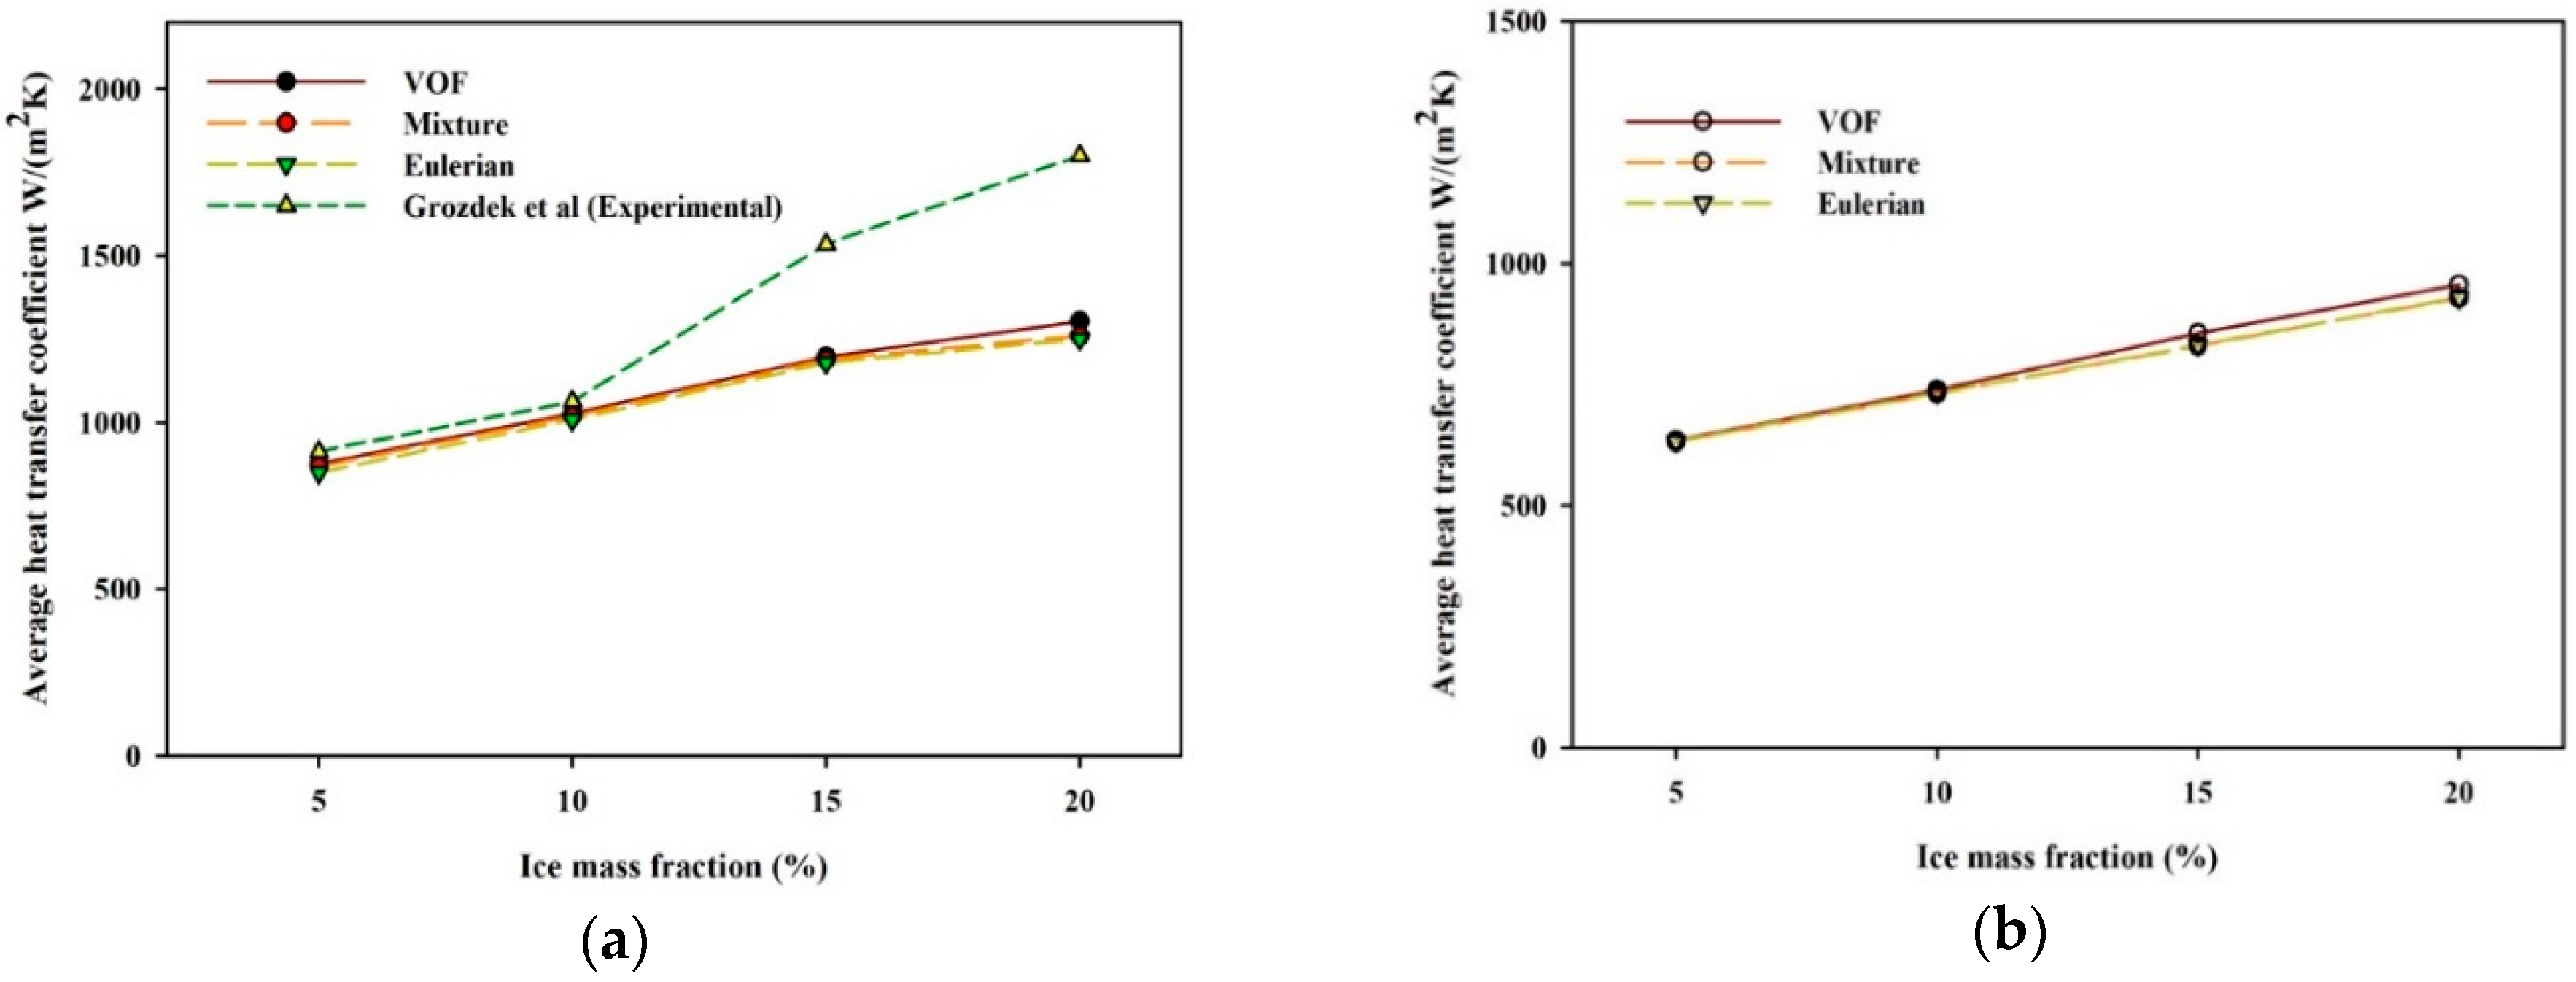
Figure 5a compares the calculated average heat transfer coefficient by three distinct multiphase models with the experimental conditions of Grozdek et al. [38] at constant flow velocity of 0.5 (m/s) and variable ice mass fraction. It is confirmed that at lower values of ice mass fractions around 10%, all three models give the same predictions, which indicates a strong agreement with the experimental data; where the maximum percentage errors of the volume of fraction, mixture, and Eulerian model from experimental values is ~1.5%, ~1.6%, and ~1.65%, respectively. The nonconformity of the Eulerian–Eulerian models becomes significantly higher at higher ice mass fraction. The underprediction of Eulerian–Eulerian models becomes so significant that at an ice mass fraction of 20%, it elevates up to ~22% from ~1.65% (at an ice mass fraction of 5%). The difference between the VOF model and experimental values is 14% at an ice mass fraction of 15%, whereas it rose to ~20% at an ice mass fraction of 20%. This trend of underestimation is also confirmed by the mixture and Eulerian models, where the relative error for the mixture model elevates to ~15% at an ice mass fraction of 15% and for the Eulerian model the relative error increases to ~22% at an ice mass fraction of 20% with the experimental values. The accuracy of Eulerian–Eulerian models gradually declined as the ice mass fraction increased from 15% to 20%, indicating their sensitivity over a high ice mass fraction. The most possible explanation behind the acquired outcomes is that when the ice slurry flows in a low-velocity region, the ice particles accumulate on top of the wall and disturb the thermal boundary layer by coming directly in contact with the tube wall.
Figure 5b depicts the comparison of three models at a constant inlet velocity of 0.25 m/s and different ice mass fractions. The VOF model slightly overpredicts the thermal fields from all other models at high mass fractions. However, all models provide almost identical predictions at low mass fractions. The relative error of VOF model in comparison to mixture and Eulerian–Eulerian models at ice mass fraction of 15% and 20% is in the range of ~1%, whereas mixture and Eulerian–Eulerian models gives the same predictions and relative error is limited to ~0.01%. The overprediction of thermal fields by VOF model can be accredited to the inefficiency of volume averaged equations employed by this model for the calculation of thermal conductivity. On the other hand, in mixture and Eulerian models, all physical properties are calculated by considering each phase separately and both two-phase models yield almost the same results.

4.3. Isothermal Ice Slurry Flow

Figure 6a–c presents a comparison between calculated values of pressure drop by three different multiphase models with the experimental conditions of Grozdek et al. [22] at variable ice mass fractions and flow velocities of ice slurry. The diameter of the pipe and ice particles is assigned to 9 mm and 0.27 mm, respectively. For low inlet velocities, the numerical predictions from all the models are identical, which indicate a reasonable agreement with the experimental results.
Although the numerical models yield reasonable estimation of pressure drop under all flow conditions and relative errors are close to ~15% as depicted in Figure 6a–c, at particular volumetric loading, with the increase in velocity, the accuracy of numerical models gradually declined. Moreover, it is noted in Figure 6a,b, that in the low-velocity region, the experimental values of pressure drop increases faster than the numerical predictions. This can be well explained by the fact that that when ice slurry flows in a low-velocity region, the pressure drop increases due to the increase in ice particles buoyancy, which results an increased friction among the ice particles and the pipe wall [35,49].
Like thermal fields, the VOF models provide a slightly higher values of pressure drop, whereas the predictions of the mixture model are lowest. This behavior is again attributed to the volume averaged equation employed in the calculation of physical properties in the VOF model. The maximum percentage error for the Eulerian–Eulerian model and mixture model is limited to 14% and 15% with the experimental results, respectively. Although the relative difference between Eulerian and mixture multiphase model predictions is very small, lower accuracy of the calculations for mixture multiphase model can be related to the absence of interactions between dispersed phases; whereas the Eulerian–Eulerian model considers collision among the particles and the interphase forces of lift and drag.

5. Conclusions

The heat transfer performance of single-phase (aqueous solution) and two-phase (ice slurry) refrigerants were studied for straight horizontal tube under uniform wall heat flux to cover the laminar range. For ice slurry flow, the numerical simulations were performed by employing three different Eulerian–Eulerian models (VOF, Eulerian, and mixture). The accuracy of respective numerical models was evaluated in terms of pressure prod and heat transfer coefficient with reference to the experimental conditions specified by [22,38], respectively. The subsequent conclusions were obtained:
  • The heat transfer coefficient of two-phase flow dominates over that of the single-phase flow and exhibits a strong dependence on inlet velocity and ice mass fraction.
  • The thermal fields predicted by all numerical models showed a reasonable agreement with the experimental data at low ice mass fractions.
  • In contrast to the other models (mixture and Eulerian), the thermal predictions of volume of the fraction model are most consistent with experimental results, with maximum error of ~20% at an ice mass fraction of 20%.
  • All the Eulerian–Eulerian models seem quite reasonable in predicting pressure drop for isothermal ice slurry flow, and the maximum error from experimental results is limited to ~15%.
  • The multiphase mixture and Eulerian model almost yield the same results (with a maximum relative error of 1%) and seems acceptable in predicting the multiphase characteristics of ice slurry, where both the solid and liquid phases are solved separately. However, in terms of computation cost the Eulerian–Eulerian model is more expensive in comparison to the mixture model due to the large number of equations involved.
The numerical calculation of heat transfer coefficient indicates a low dependence on ice mass content in low-velocity regions in comparison with the experimental results. This finding can be attributed to ice clustering, velocity, and viscosity effects, which, in turn, considerably influence the hydrodynamics and thermal behavior of ice particles. The selection of a multiphase model must consider important factors such as particle volumetric loading and flow regime. Therefore, it is recommended to check the credibility of theses numerical models at different flow conditions to reach a rigorous choice of appropriate multiphase models for a better understanding of hydrothermal characteristics of ice slurry.

Author Contributions

All the authors were involved in the conception and design of the study. All the simulations, analysis, and interpretation of data have been done by S.A. supported by H.A. and C.W.P. The manuscript was written by S.A. and H.A. The work was supervised and supported for improvement by C.W.P. Paper review and edit was done by C.W.P.

Funding

This research is supported by the National Research Foundation of Korea and is funded by the Korean Government (MSIP, Grant No. 2017R1A2B2005515).

Conflicts of Interest

The authors declare no conflicts of interest.

Nomenclature

L pipe length, m H , h sensible enthalpy, J/kg
C concentration (% by weight) vD i drift velocity, m/s
C p Specific heat, J/(kg. K) v ls slip velocity, m/s
d s particle diameter, (m) v local velocity, m/s
D pipe diameter, m VOF volume of fluid model, (-)
U , V inlet velocity, m/s I unit vector
D h hydraulic diameter, mGreek Symbols
C D drag force coefficient, (-) μ dynamic viscosity, Pa.s
CLlift force coefficient, (-) ρ density, kg/ m3
e s s particle-particle restitution coefficient, (-) α volume fraction, (-)
g 0 radial distribution coefficient, (-) λ thermal conductivity, W/(m.K)
K s l momentum exchange coefficient, (-) τ shear stress, Pa
h a v g average heat transfer coefficient, W/(m2.K) θ s granular temperature, K
h s l particle liquid heat transfer, W/(m2.K) ζ bulk viscosity, Pa.s
T temperature, KSubscripts
F force, N l liquid phase; aqueous solution
FLlift force, N s solid phase; ice particles
N u average Nusselt number, (-) is ice slurry
q ˙ heat flux, W/m2 ss interaction among solid particles
R e Reynolds number, (-) eff effective
m ˙ mass transfer rate, kg/(m3.s) m mixture
g gravitational acceleration, m/s2 sl , ls interaction between solid liquid phases
p pressure, Pa i phase index
Δ H latent heat, J/kg in inlet
Δ T temperature difference, K L lift
D drag

References

  1. Sarafraz, M.M.; Pourmehran, O.; Yang, B.; Arjomandi, M.; Ellahi, R. Pool Boiling Heat Transfer Characteristics of Iron Oxide Nano-Suspension under Constant Magnetic Field. Int. J. Therm. Sci. 2020, 147. [Google Scholar] [CrossRef]
  2. Kauffeld, M.; Wang, M.J.; Goldstein, V.; Kasza, K.E. Ice Slurry Applications. Int. J. Refrig. 2010, 33, 1491–1505. [Google Scholar] [CrossRef] [PubMed]
  3. Onokoko, L.; Poirier, M.; Galanis, N.; Poncet, S. Experimental and Numerical Investigation of Isothermal Ice Slurry Flow. Int. J. Therm. Sci. 2018, 126, 82–95. [Google Scholar] [CrossRef]
  4. Akbarzadeh, M.; Rashidi, S.; Karimi, N.; Ellahi, R. Convection of Heat and Thermodynamic Irreversibilities in Two-Phase, Turbulent Nanofluid Flows in Solar Heaters by Corrugated Absorber Plates. Adv. Powder Technol. 2018, 29, 2243–2254. [Google Scholar] [CrossRef]
  5. Yousif, M.A.; Ismael, H.F.; Abbas, T.; Ellahi, R. Numerical Study of Momentum and Heat Transfer of Mhd Carreau Nanofluid over an Exponentially Stretched Plate with Internal Heat Source/Sink and Radiation. Heat Transf. Res. 2019, 50, 649–658. [Google Scholar] [CrossRef]
  6. Mi, S.; Cai, L.; Ma, K.; Liu, Z. Investigation on Flow and Heat Transfer Characteristics of Ice Slurry without Additives in a Plate Heat Exchanger. Int. J. Heat Mass Transf. 2018, 127, 11–20. [Google Scholar] [CrossRef]
  7. Kumano, H.; Asaoka, T.; Sawada, S. Effect of Initial Aqueous Solution Concentration and Heating Conditions on Heat Transfer Characteristics of Ice Slurry. Int. J. Refrig. 2014, 41, 72–81. [Google Scholar] [CrossRef]
  8. Kumano, H.; Yamanada, Y.; Makino, Y.; Asaoka, T. Effect of Initial Aqueous Solution Concentration on Rheological Behavior of Ice Slurry. Int. J. Refrig. 2016, 68, 218–225. [Google Scholar] [CrossRef]
  9. Kamyar, A.; Aminossadati, S.M.; Leonardi, C.R. Thermo-Hydrodynamics of a Helical Coil Heat Exchanger Operated with a Phase-Change Ice Slurry as a Refrigerant. Heat Transf. Eng. 2019, 40, 283–294. [Google Scholar] [CrossRef]
  10. Egolf, P.W.; Kauffeld, M.; Kawaij, M. Handbook on Ice Slurries—Fundamentals and Engineering. Int. Inst. Refrig. Paris 2005, 359, 259–263. [Google Scholar]
  11. Onokoko, C.L.; Galanis, N.; Poncet, S.; Poirier, M. Heat Transfer of Ice Slurry Flows in a Horizontal Pipe: A Numerical Study. Int. J. Therm. Sci. 2019, 142, 54–67. [Google Scholar] [CrossRef]
  12. Mahmood, A.; Md Basir, M.; Ali, U.; Mohd Kasihmuddin, M.; Mansor, M. Numerical Solutions of Heat Transfer for Magnetohydrodynamic Jeffery-Hamel Flow Using Spectral Homotopy Analysis Method. Processes 2019, 7, 626. [Google Scholar] [CrossRef]
  13. Lee, J.J.; Kim, H.J.; Kim, D.K. Experimental Study on Forced Convection Heat Transfer from Plate-Fin Heat Sinks with Partial Heating. Processes 2019, 7, 772. [Google Scholar] [CrossRef]
  14. Lee, D.W.; Yoon, E.S.; Joo, M.C.; Sharma, A. Heat Transfer Characteristics of the Ice Slurry at Melting Process in a Tube Flow. Int. J. Refrig. 2006, 29, 451–455. [Google Scholar] [CrossRef]
  15. Kumano, H.; Hirata, T.; Shouji, R.; Shirakawa, M. Experimental Study on Heat Transfer Characteristics of Ice Slurry. Int. J. Refrig. 2010, 33, 1540–1549. [Google Scholar] [CrossRef]
  16. Lee, D.W.; Sharma, A. Melting of Ice Slurry in a Tube-in-Tube Heat Exchanger. Int. J. Energy Res. 2006, 30, 1013–1021. [Google Scholar] [CrossRef]
  17. Knodel, B.D.; France, D.M.; Choi, U.S.; Wambsganss, M.W. Heat Transfer and Pressure Drop in Ice-Water Slurries. Appl. Therm. Eng. 2000, 20, 671–685. [Google Scholar] [CrossRef]
  18. Stamatiou, E.; Kawaji, M. Thermal and Flow Behavior of Ice Slurries in a Vertical Rectangular Channel-Part II. Forced Convective Melting Heat Transfer. Int. J. Heat Mass Transf. 2005, 48, 3544–3559. [Google Scholar] [CrossRef]
  19. Jensen, E.N.; Christensen, K.G.; Hansen, T.M.; Schneider, P.; Kauffeld, M. Pressure Drop and Heat Transfer with Ice Slurry. Sci. Tech. Du Froid 2001, 1, 572–580. [Google Scholar]
  20. Bordet, A.; Poncet, S.; Poirier, M.; Galanis, N. Flow Visualizations and Pressure Drop Measurements of Isothermal Ice Slurry Pipe Flows. Exp. Therm. Fluid Sci. 2018, 99, 595–604. [Google Scholar] [CrossRef]
  21. Monteiro, A.C.S.; Bansal, P.K. Pressure Drop Characteristics and Rheological Modeling of Ice Slurry Flow in Pipes. Int. J. Refrig. 2010, 33, 1523–1532. [Google Scholar] [CrossRef]
  22. Grozdek, M.; Khodabandeh, R.; Lundqvist, P. Experimental Investigation of Ice Slurry Flow Pressure Drop in Horizontal Tubes. Exp. Therm. Fluid Sci. 2009, 33, 357–370. [Google Scholar] [CrossRef]
  23. Hägg, C. Ice Slurry as Secondary Fluid in Refrigeration Systems. Ph.D. Thesis, KTH Royal Institute of Technology, Stockholm, Sweden, 2005. [Google Scholar]
  24. Liu, Y.H.; Zhang, E.Z.; Zhao, J.M.; Chen, P.L. Experiment Study on Friction Loss Characteristics of Pipes with Ice Slurry. Sci. Tech. Du Froid 1997, 490–494. [Google Scholar]
  25. Wang, J.; Battaglia, F.; Wang, S.; Zhang, T.; Ma, Z. Flow and Heat Transfer Characteristics of Ice Slurry in Typical Components of Cooling Systems: A Review. Int. J. Heat Mass Transf. 2019, 141, 922–939. [Google Scholar] [CrossRef]
  26. He, M.; Li, Z.; Han, X.; Cabassud, M.; Dahhou, B. Development of a Numerical Model for a Compact Intensified Heat-Exchanger/Reactor. Processes 2019, 7, 454. [Google Scholar] [CrossRef]
  27. Wang, C.; Hu, B.; Zhu, Y.; Wang, X.; Luo, C.; Cheng, L. Numerical Study on the Gas-Water Two-Phase Flow in the Self-Priming Process of Self-Priming Centrifugal Pump. Processes 2019, 7, 330. [Google Scholar] [CrossRef]
  28. Li, L.; Sheng, G.; Su, Y. Water-Gas Two-Phase Flow Behavior of Multi-Fractured Horizontal Wells in Shale Gas Reservoirs. Processes 2019, 7, 664. [Google Scholar] [CrossRef]
  29. ANSYS FLUENT Theory Guide; ANSYS Inc.: Canonsburg, PA, USA, 2013; pp. 468–542.
  30. Bhatti, M.M.; Zeeshan, A.; Ellahi, R.; Bég, O.A.; Kadir, A. Effects of Coagulation on the Two-Phase Peristaltic Pumping of Magnetized Prandtl Biofluid through an Endoscopic Annular Geometry Containing a Porous Medium. Chin. J. Phys. 2019, 58, 222–234. [Google Scholar] [CrossRef]
  31. Wang, J.; Zhang, T.; Wang, S. Heterogeneous Ice Slurry Flow and Concentration Distribution in Horizontal Pipes. Int. J. Heat Fluid Flow 2013, 44, 425–434. [Google Scholar] [CrossRef]
  32. Wang, J.; Wang, S.; Zhang, T.; Liang, Y. Numerical Investigation of Ice Slurry Isothermal Flow in Various Pipes. Int. J. Refrig. 2013, 36, 70–80. [Google Scholar] [CrossRef]
  33. Zhang, P.; Shi, X.J. Thermo-Fluidic Characteristics of Ice Slurry in Horizontal Circular Pipes. Int. J. Heat Mass Transf. 2015, 89, 950–963. [Google Scholar] [CrossRef]
  34. Wang, J.; Wang, S.; Zhang, T.; Battaglia, F. Mathematical and Experimental Investigation on Pressure Drop of Heterogeneous Ice Slurry Flow in Horizontal Pipes. Int. J. Heat Mass Transf. 2017, 108, 2381–2392. [Google Scholar] [CrossRef]
  35. Rawat, K.S.; Pratihar, A.K. Numerical Investigation of Ice Slurry Flow in a Horizontal Pipe. IOP Conf. Ser. Mater. Sci. Eng. 2018, 310. [Google Scholar] [CrossRef]
  36. Yadav, S.K.; Ziyad, D.; Kumar, A. Numerical Investigation of Isothermal and Non-Isothermal Ice Slurry Flow in Horizontal Elliptical Pipes. Int. J. Refrig. 2019, 97, 196–210. [Google Scholar] [CrossRef]
  37. Cai, L.; Liu, Z.; Mi, S.; Luo, C.; Ma, K.; Xu, A.; Yang, S. Investigation on Flow Characteristics of Ice Slurry in Horizontal 90° Elbow Pipe by a CFD-PBM Coupled Model. Adv. Powder Technol. 2019, 30, 2299–2310. [Google Scholar] [CrossRef]
  38. Grozdek, M.; Khodabandeh, R.; Lundqvist, P.; Palm, B.; Melinder, Å. Experimental Investigation of Ice Slurry Heat Transfer in Horizontal Tube. Int. J. Refrig. 2009, 32, 1310–1322. [Google Scholar] [CrossRef]
  39. Melinder, Å. Properties and Other Aspects of Aqueous Solutions Used for Single Phase and Ice Slurry Applications. Int. J. Refrig. 2010, 33, 1506–1512. [Google Scholar] [CrossRef]
  40. Melinder, Å. Thermophysical Properties of Aqueous Solutions Used as Secondary Working Fluids. Ph.D. Thesis, The Royal Institute of Technology KTH, Stockholm, Sweden, 2007. [Google Scholar]
  41. Li, C.; Wu, W.; Liu, Y.; Hu, C.; Zhou, J. Analysis of Air–Oil Flow and Heat Transfer inside a Grooved Rotating-Disk System. Processes 2019, 7, 632. [Google Scholar] [CrossRef] [Green Version]
  42. Jiao, W.; Cheng, L.; Xu, J.; Wang, C. Numerical Analysis of Two-Phase Flow in the Cavitation Process of AWaterjet Propulsion Pump System. Processes 2019, 7, 690. [Google Scholar] [CrossRef] [Green Version]
  43. Taivassalo, V.; Kallio, S. On the Mixture Model for Multiphase Flow. VTT Publ. 1996, 288, 3–67. [Google Scholar]
  44. Schiller, L. A Drag Coefficient Correlation. Zeit. Ver. Deutsch. Ing. 1933, 77, 318–320. [Google Scholar]
  45. Gidaspow, D. Multiphase Flow and Fluidization: Continuum and Kinetic Theory Descriptions; Academic Press: Cambridge, MA, USA, 1994. [Google Scholar]
  46. Lun, C.K.K.; Savage, S.B.; Jeffrey, D.J.; Chepurniy, N. Kinetic Theories for Granular Flow: Inelastic Particles in Couette Flow and Slightly Inelastic Particles in a General Flowfield. J. Fluid Mech. 1984, 140, 223–256. [Google Scholar] [CrossRef]
  47. Kakac, S.; Shah, R.K.; Aung, W. Handbook of Single-Phase Convective Heat Transfer; John Wiley and Sons Inc.: New York, NY, USA, 1987. [Google Scholar]
  48. Niezgoda-Zelasko, B. Heat Transfer of Ice Slurry Flows in Tubes. Int. J. Refrig. 2006, 29, 437–450. [Google Scholar] [CrossRef]
  49. Lee, D.W.; Yoon, C.I.; Yoon, E.S.; Joo, M.C. Experimental Study on Flow and Pressure Drop of Ice Slurry for Various Pipes. In Proceedings of the 5th Workshop on Ice-Slurries of the International Institute of Refrigeration, Stockholm, Sweden, 30–31 May 2002. [Google Scholar]
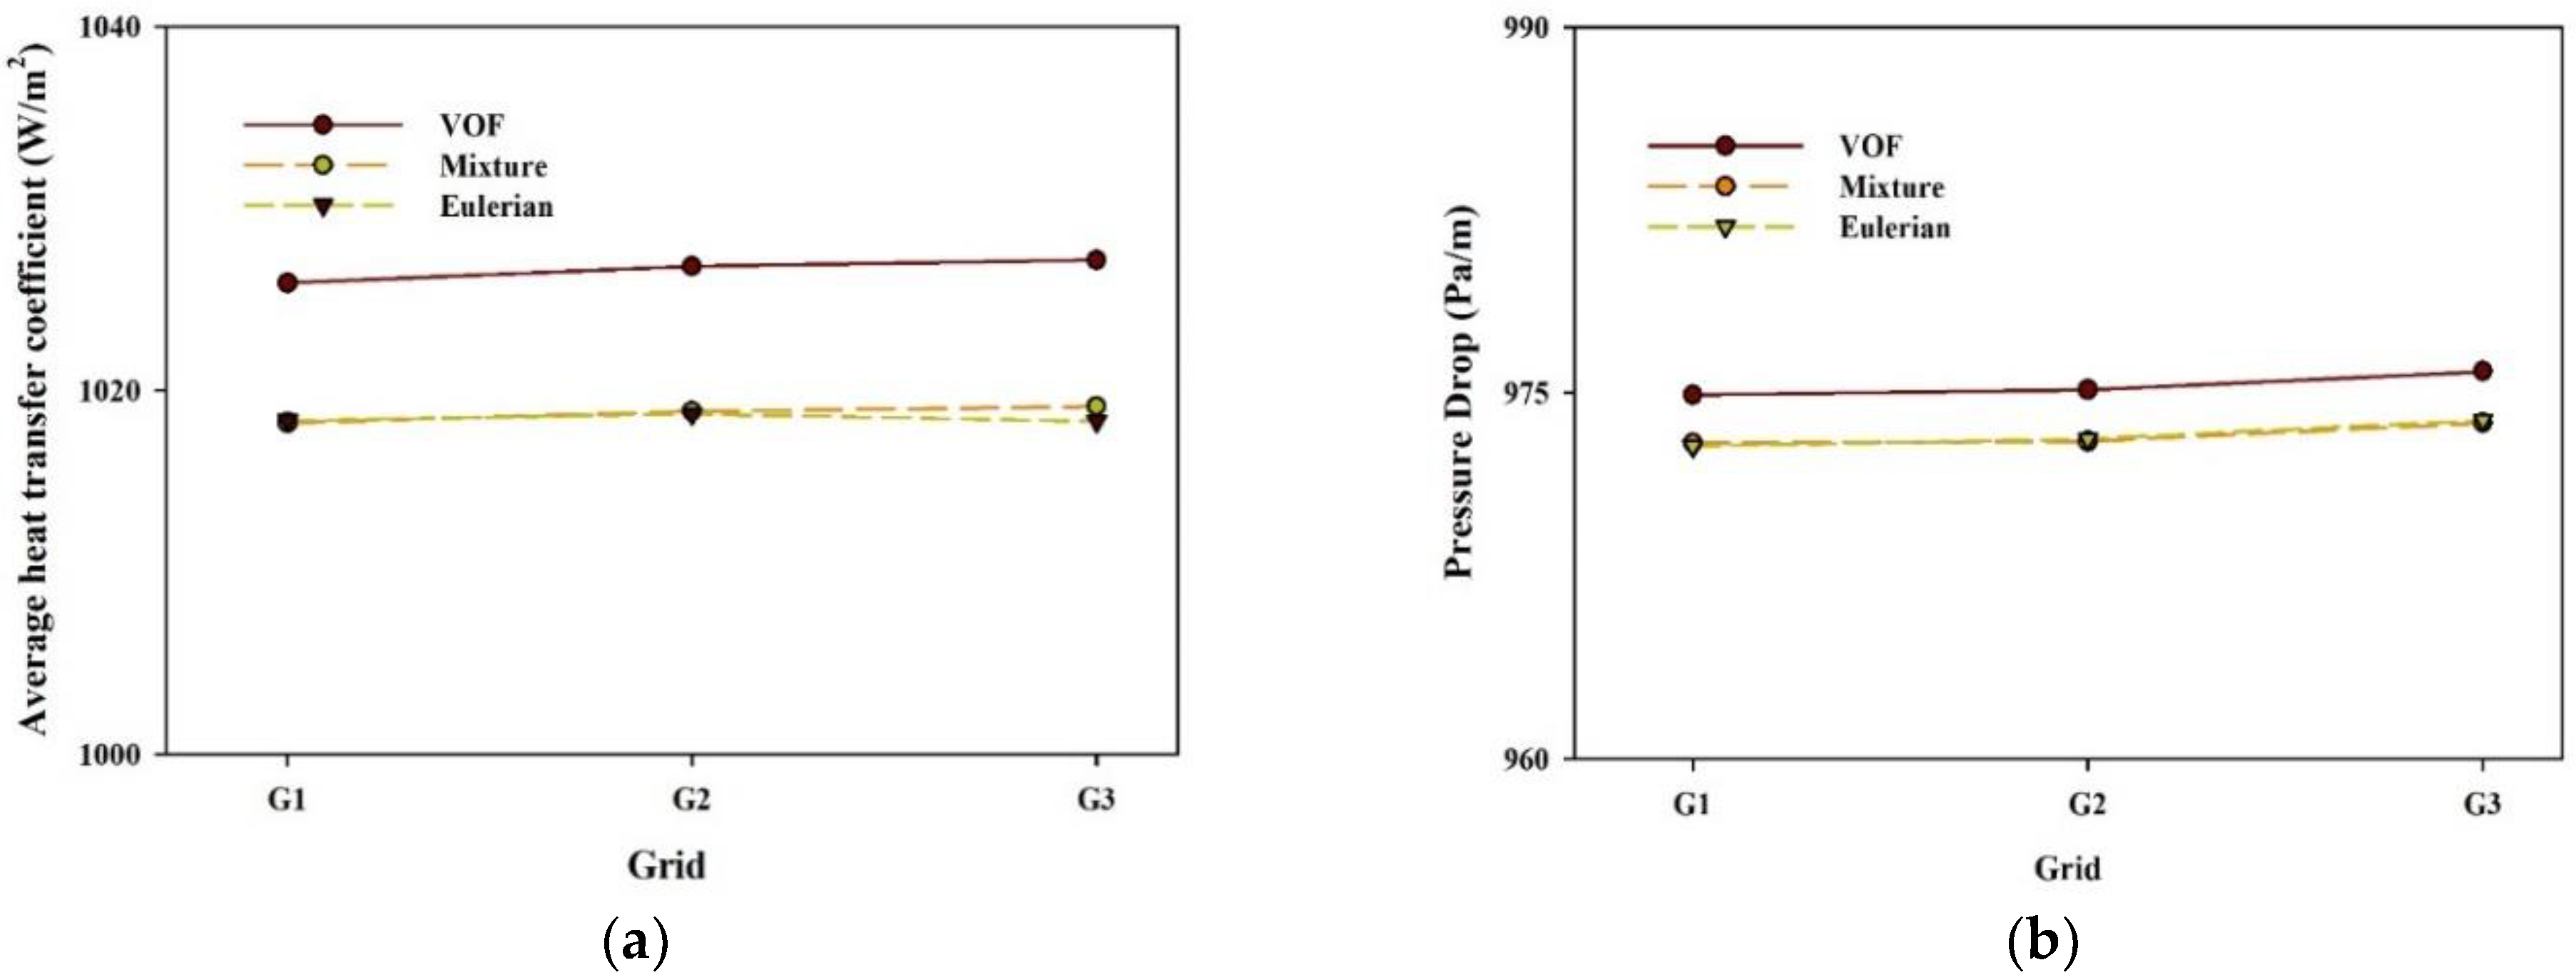
Figure 1. (a) Mesh independence test for average heat transfer coefficient at flow velocity of 0.5 m/s, ice mass fraction 10%, and pipe dimeter 21 mm. (b) Mesh independence test for pressure drop at flow velocity of 0.43 m/s, ice mass fraction 10%, and pipe dimeter 9 mm.
Processes 07 00898 g001
Figure 2. Schematic of the horizontal pipe flow and appropriate boundary conditions.
Processes 07 00898 g002
Figure 3. (a) Average Nusselt number at different Reynolds number for single phase flow of water and ethanol–water solution at a constant wall heat flux of 4000 W/m2. (b) Average Nusselt number at different Reynolds number and constant wall heat flux of 16,000 W/m2.
Processes 07 00898 g003
Figure 4. Variation of average heat transfer coefficient at variable ice mass fraction and flow velocity at constant wall heat flux of 4000 W/m2.
Processes 07 00898 g004
Figure 5. (a) Variation of average heat transfer coefficient with ice mass fraction at a constant inlet velocity of 0.5 m/s and wall heat flux of 4000 W/m2. (b) Variation of average heat transfer coefficient at different ice mass fraction and flow velocity, at constant wall heat flux of 4000 W/m2.
Processes 07 00898 g005
Figure 6. (a) Variation of pressure drop with inlet velocity at constant ice mass fraction of 5%. (b) Variation of pressure drop with inlet velocity at constant ice mass fraction of 10%. (c) Variation of pressure drop with inlet velocity at constant ice mass fraction of 15%.
Processes 07 00898 g006aProcesses 07 00898 g006b
Table 1. Properties of carrier liquid and ice particles [39,40].
PropertiesExpressionValue
Aqueous sol. (10.3%)Density ρ l = 987.44108 2.45747 × e ( T 273.15 / 24.21577 ) 987 kg/m3
Viscosity μ l = 0.70354 + 3.3244 × e ( T 273.15 / 16.63572 ) 5.032 × 10⁻³ Pa.s
Thermal Cond. λ l = 0.5034 + 0.00127 × ( T 273.15 ) 0.5034 W/(m.K)
Specific heat C p l = 4128.07 + 96.81157 × e ( T 273.15 ) / 14.43177 ) 4260 J/(kg.K)
Ice particlesDensity ρ s = 917 0.13 × ( T 273.15 ) 917 kg/m3
Thermal Cond. λ s = 2.21 0.012 × ( T 273.15 ) 2.26 W/(m.K)
Specific heat C p s = 2120 8 × ( T 273.15 ) 2156 J/(kg.K)
Latent heat-332,400J/kg
Table 2. Summary of important parameters used in this study.
FlowCeth (%)CIce (%)q (W/m2)V (m/s)
Single-phase flow10.304000; 16,0000.1; 0.2; 0.3; 0.4
Non-isothermal ice slurry flow 10.35–2040000.25; 0.5
Isothermal ice slurry flow10.35–15-0.1–1.2