Article

Lattice Boltzmann Simulation on Droplet Flow through 3D Metal Foam

Key Laboratory of Pressure Systems and Safety (MOE), School of Mechanical Engineering, East China University of Science and Technology, Shanghai 200237, China
*
Author to whom correspondence should be addressed.
Processes 2019, 7(12), 877; https://doi.org/10.3390/pr7120877
Submission received: 29 October 2019 / Revised: 16 November 2019 / Accepted: 18 November 2019 / Published: 22 November 2019
(This article belongs to the Special Issue Smart Flow Control Processes in Micro Scale)

Abstract

:
The hydrodynamics of droplets passing through metal foam is investigated using the lattice Boltzmann method (LBM). The accurate 3D porous structure for the simulation is generated by X-ray micro-computed tomography. The simulated results are in good agreement with the experimental ones using high-speed video. The simulated results show that for droplets passing metal foam, there is a critical capillary number, Cac (around 0.061), above which the droplet continues to deform until it breaks up. The simulated results show that the capillary number, droplet size, pores diameter, and thickness of metal foam have the significant effect of droplets deforming and breaking up when the droplets pass through the metal foam. To avoid the calescence of two droplets at the inlet zone of the metal foam, the distance between droplets should be larger than three times the diameter of the droplet.

Graphical Abstract

1. Introduction

Metal foam is a class of materials with a porous structure. A typical property of metal foams is high porosity, and therefore a low density. The thermal and mechanical properties of metal foams remain those of their base metals and sufficiently meet the requirements of light weight, low pressure drop, malleability, improved mixing, and heat transfer. Therefore, metal foams have been applied in many industries involved in enhanced fluid mixing and heat transfer. Metal foams are also used as physical support for catalysts or even as catalyst substrate in chemical processes, such as fuel cells and micro-reactors [1,2]. Metal foams have been used to improve the conversion efficiency in micro-reactors because it can enhance the mixing of the liquid flow [3] and emulsify the immiscible two-phase fluid [4]. However, the flow field and droplet behaviors (e.g., breakup and deformation) are still poorly understood in metal foam reactors.
Various experiments [5] and simulations [6,7,8,9,10,11] have been carried out to understand the effects of porous structure on fluid hydrodynamics in immiscible binary fluids. However, most of them in this topic rely on empirical correlations of experimental measurements and traditional computational fluid dynamics (CFD). The multiphase flows in the CFD approach are simulated by solving the macroscopic Navier–Stokes equations. Among the approaches of tracking interfaces, the front-tracking method, the volume of fluid (VOF) method, and the level set method are widely used [8,9,10,11,12,13]. Because the interface must be manually ruptured, the front-tracking methods are not suitable for simulating interface breaking and coalescing [14]. The VOF and level set methods can simulate interface breaking and coalescing; however, to determine the interfacial tension, the force and the flux across the interface is required in the VOF. The level set method uses a signed distance function to represent the interface, which requires a re-initialization procedure to keep the distance property when large topological changes occur around the interface. This process can be time-consuming and not always physically consistent [15]. In addition, the VOF and level set methods will suffer from numerical instability at the interface region when the interfacial tension becomes a dominant factor in complex geometries [16]. For example, it is a challenge to apply the VOF or level set methods to simulate capillary displacement in porous media. Microscopically, the phase segregation and the interfacial dynamics between different phases are due to inter-particle forces or inter-actions [17]. Thus, mesoscopic level models are expected to accurately describe the complex dynamic behavior of multiphase flows [18].
With the advance of computational physics and image technology, the simulation of droplet breakup in metal foams has become feasible. For porous reconstructing, there are two ways of representing the pore scale geometry: an idealized structure and micro X-ray computed tomography (CT). The idealized structure can reconstruct simplified pore geometries by taking into account the structural complexity of the medium [19,20]. A main drawback of the idealized structure is that the pore structure has to be mathematically reasonably simplified to fit the model. This simplification can cause a substantial error in describing the real structure. Micro-CT can accurately regenerate a porous structure. Hundreds of images from various angular views are acquired while the porous object rotates. Then the hundreds of images of virtual cross-section slices are synthesized by a computer to regenerate the porous structure. Montminy et al. [21] reconstructed a 3D metal foam using micro-CT. Carvalho et al. [22] followed their approach to investigate the pressure drop of the single-phase fluid flow passing the porous media.
In recent years, the lattice Boltzmann method (LBM) has emerged as an attractive numerical tool for simulating multiphase flow because of its advantage in dealing with complicated geometry and interfacial dynamics [23,24]. Unlike the methods mentioned before, LBM is based on the solution of macroscopic variables such as velocity and density, and built upon microscopic models and mesoscopic kinetic equations. Compared with traditional numerical methods, LBM is more efficient in dealing with complex boundaries [25,26,27]. LBM has been successfully applied to investigate the multiphase fluid flow in a porous medium.
Several lattice Boltzmann models such as the Shan-Chen (SC) model, the free energy-based model, and the color gradient-based model [28,29,30] have been proposed for simulating multiphase flow. Among these models, the SC multiphase model is the simplest. In this model, hydrophobic interaction between fluid phases and additional interaction between the fluid and solid surfaces are taken into account [31,32,33]. The SC model is capable of simulating the complete range of contact angles and the equilibrium distribution of the phase in a porous medium. Because of these advantages, the SC model has been widely used to study the hydrodynamics of single and multiple phase flows where the interaction between the fluid–fluid and fluid–solid are considered. Li et al. [34] applied the SC model to study the deformation and breakup behavior of liquid droplets past a circular cylinder. Park et al. [35] successfully simulated the motion of liquid droplet flow in a porous medium using the SC model and a reconstructed method. However, the works by Li et al. and Park et al. are limited to two-dimensional simulations. Frank et al. [36] simulated the droplet spreading on a porous surface. Jonas et al. [37] simulated an immiscible binary fluid flow in a porous medium. It should be noted that an ideal porous structure which randomly distributes in the matrix was taken for the simulations by Li et al. and Jonas et al. This ideal porous structure leads to an obvious deviation of simulation results from real results.
In spite of great progress in the simulation of multiphase fluid in porous media using LBM, these porous media are either rocks in geological reservoirs or matrixes of soils. Unlike rock or soil, metal materials have their own properties. The porosity of metal foams is usually larger than rock or soil; therefore, metal foams have a stronger circulation capacity and less capillary action. A few 3D simulations on single phase fluids have been carried out in metal foams using X-ray reconstructed 3D porous structures [38]. However, to the best of our knowledge, no works have been reported on the LBM simulation of droplet breakup and deformation in a metal foam against experimental measurements. Regarding the wide application of metal foams in industries, it is necessary to deepen our understanding of the mechanism of droplet behavior in metal foams.
A primary objective of this paper is to simulate the processes of droplet breakup and deformation in a metal foam generated by X-ray CT using the lattice Boltzmann model with an SC model of multiphase. The Green function (Gw,k) is obtained by comparing the measured contact angles and the simulation results. The simulation results of the hydrodynamics of droplets passing through metal foam were verified by the results recorded using high-speed video. The effects of several non-dimensional parameters on the hydrodynamics of droplets passing through metal foam are discussed. It should be mentioned that no original point in the numerical method applied, but the hydrodynamics of droplets passing through metal foam revealed by the simulation is crucial to the design of metal foam reactors or mixers.

2. Experimental

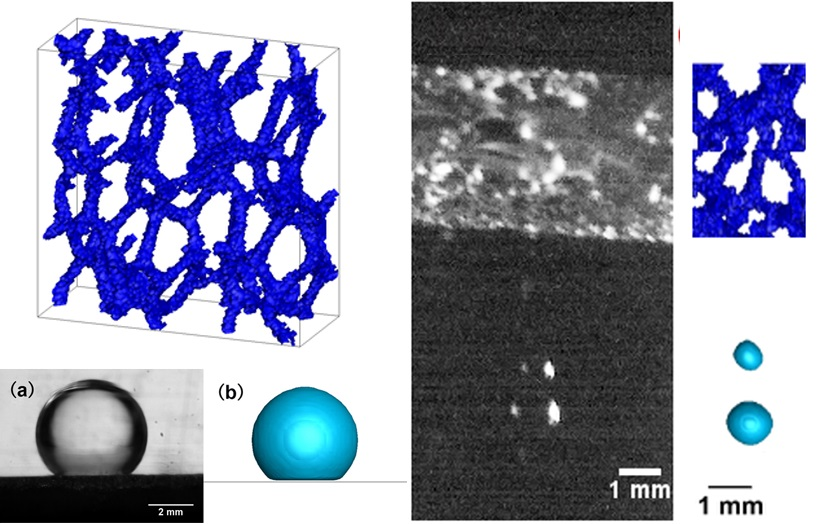
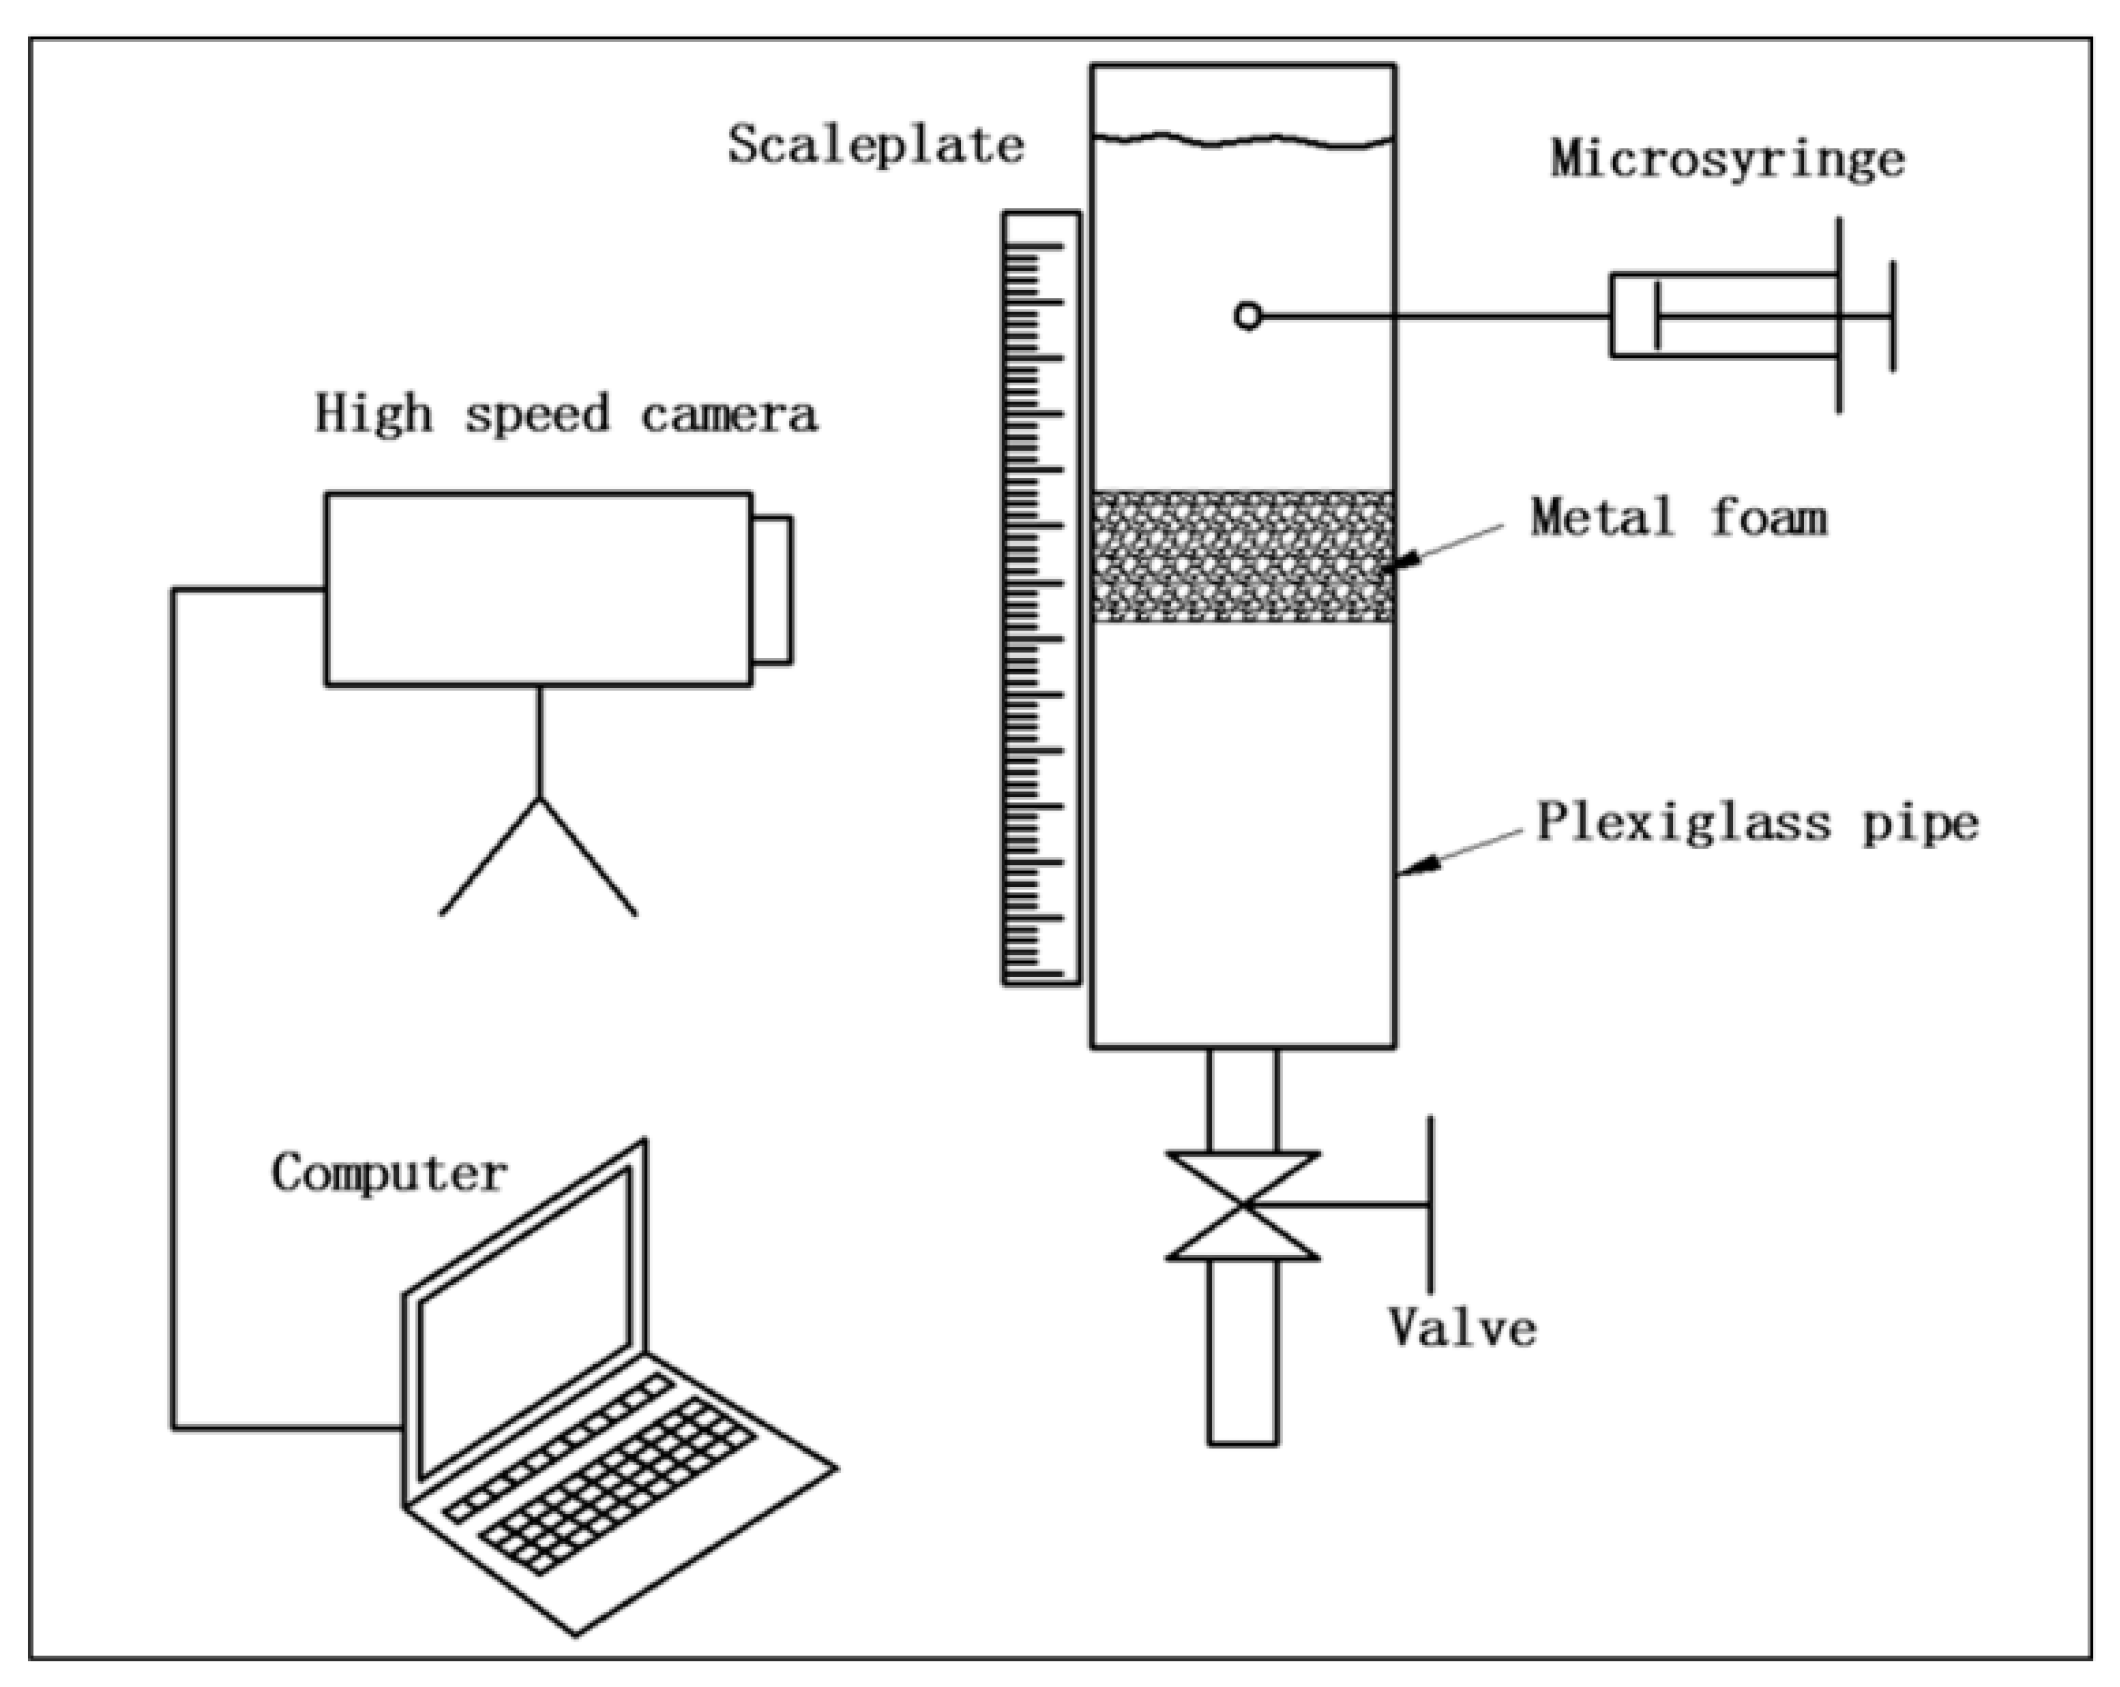
2.1. Experimental Setup

The experimental setup for measurements of the hydrodynamics of a droplet passing through a metal foam is illustrated in Figure 1. The metal foams employed in this study were supplied by SiPing AKS Metal Material Technology Co., Ltd. (Siping, China); The width, length, pore density, and porosity of the metal foams were 10 mm, 25 mm, 60 pores per inch (PPI), and 95% porosity, respectively. The height ranged from 2 to 4 mm. The metal foam was placed into a Plexiglass tube with a rectangular shape. The Plexiglas tube was filled with silicon oil (Haishi Co., Shanghai, China). One water droplet above the metal foam was formed by injecting distilled water into the silicon oil with a micro-syringe (HAMILTON Co., Bonaduz, Switzerland). The water droplet diameter was controlled by adjusting the injected water volume. When the water droplet held a steady suspension in silicon oil, the valve connected with the outlet of the Plexiglass tube was opened, and the droplet went through the metal foam. The droplet deformation and breakup after the droplet left the metal foam were recorded by a high-speed video (Integrated Device Technology, Longmont, CO, USA). A ruler was attached to the Plexiglass tube for the calculation of the droplet velocity based on the droplet movement recorded by the high-speed video. All the experiments were carried out at room temperature.

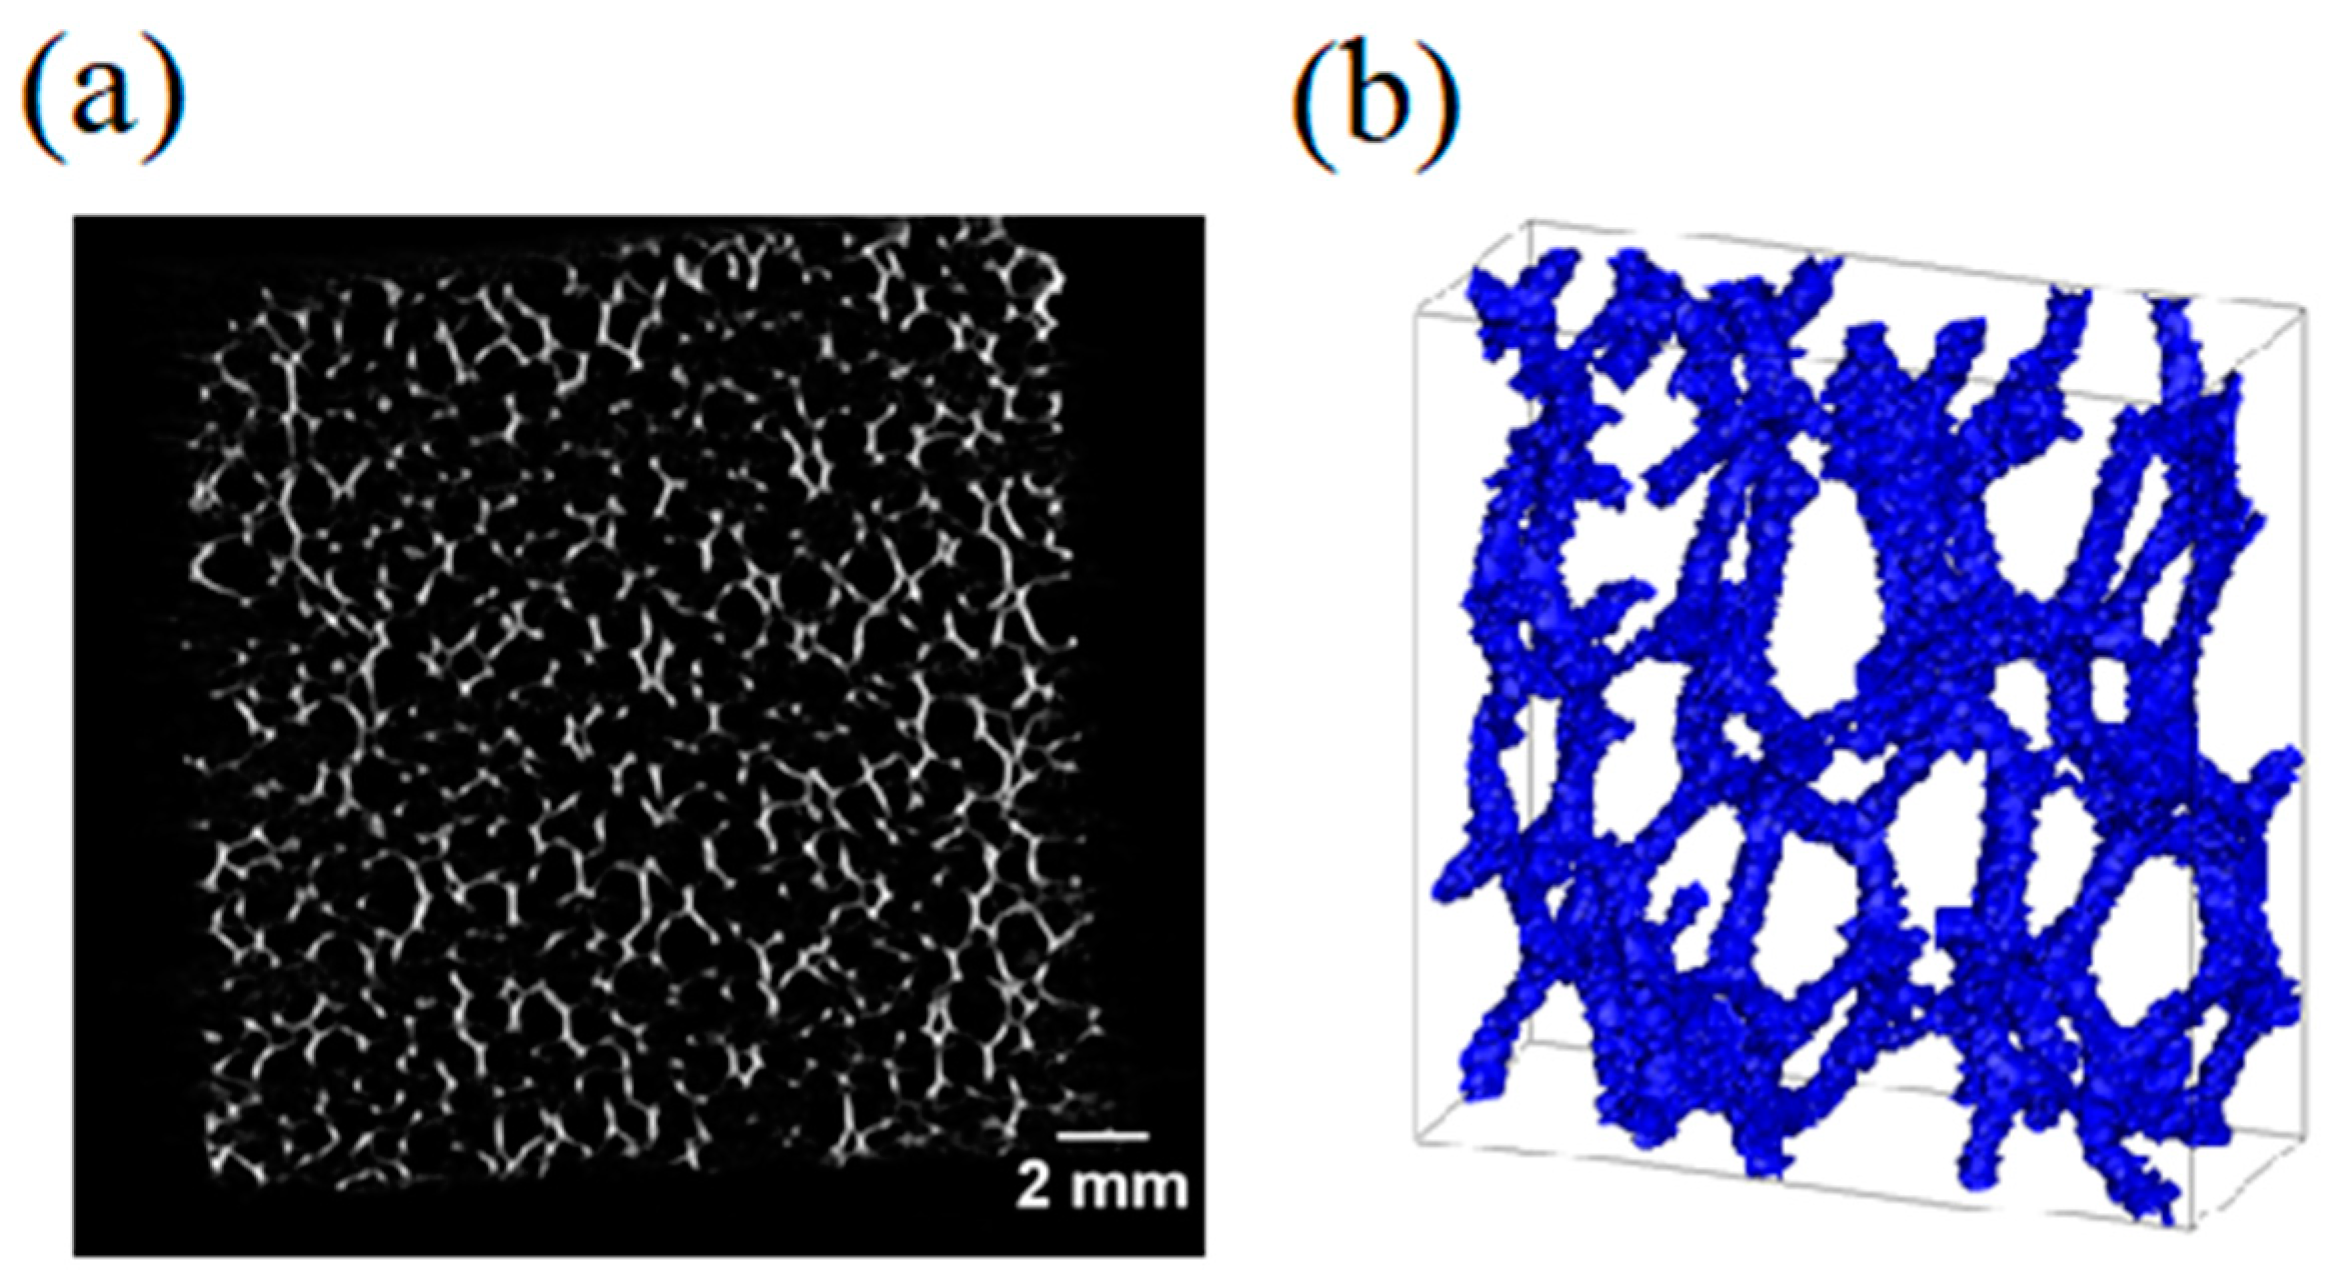
2.2. Metal Foam Micro-Tomography

The morphology of the metallic foam was generated using the Skyscan high-resolution desktop micro-CT system (Micro Photonics Inc., Allentown, PA, USA). The metal foam sample dimensions were 20 × 20 × 2 mm. The metal foam sample was illuminated by a micro-focus X-ray source at 40 kV with a beam current of 250 µA. A planar X-ray detector collected the magnified projection images with a pixel of 36 µm. The 2D cross-section images acquired from various angular views and the morphology of the metal foam were reconstructed. The Matlab Image Processing Toolbox (Matlab R2006a, MathWorks, Natick, MA, USA, 2007) were used to binarized the 2D cross-section images.
A raw section image of the metal foam structure is shown in Figure 2a. A 3D structure of the restructured metal foam sample is illustrated in Figure 2b. Its porosity was computed to be 93.6%, which is very close to that of 95.0% provided by the metal foam supplier.

3. Simulation

3.1. Lattice Boltzmann Equations

The hydrodynamics of droplets passing through porous metal foam was simulated using LBM. The lattice Boltzmann simulation includes two steps. First, the collision between fluid particles is calculated, and the second, the particles are streamed. In the case of two immiscible fluids, the fluid distribution function for each fluid is described as the following:
f i k ( x + e i δ t , t + e i δ t ) f i k ( x , t ) = 1 τ k [ f i k ( x , t ) f i k , e q ( x , t ) ]
where k stands for different particles, x is the discrete lattice location, ei is the discrete velocity direction for the D3Q19 lattice structure, δ t is time step and is chosen as 1, τ k is relaxation parameter and f i k ( x , t ) and f i k , e q ( x , t ) are the number density distribution function and local equilibrium function, respectively. f i k , e q ( x , t ) is calculated for the LBM D3Q19 model as
f i k , e q ( x , t ) = ω i n k [ 1 + e i · u k e q c s 2 + ( e i · u k e q ) 2 4 c s 4 + u k 2 4 c s 4 ]
e i = c ( 0 0 0 1 1 0 0 0 1 0 0 0 0 0 0 1 0 0 0 1 1 1 1 1 1 1 1 0 0 0 1 1 1 1 0 0 0 1 1 1 1 0 0 0 1 1 1 1 0 1 1 )
ω i = { 1 3 , e i = 0   1 18 , e i = c 2 1 36 , e i = 2 c 2
where nk is the number density, and c s k is the sound velocity of the kth component that satisfies the formula c s k = 1 / 3 .
The mass density and velocity of the kth component can be obtained:
ρ k = m k n k = m k i f i k
ρ k u k = m k i e i f i k
where mk is the molecular mass of each component. In the Shan-Chen scheme, the interaction force is incorporated into the model by the equal velocity u k e q in the equilibrium equation. The u k e q is determined by the relation
u k e q = u + τ k F k ρ k
where u is the common velocity, which satisfies the equation
u = ( k u k ρ k τ k ) / ( k ρ k τ k )
The total force acting on each component Fk includes the fluid–fluid interaction Ff, the fluid-solid interaction Fads and the external force Fe
F k = F f + F a d s + F e
The SC model assumes that the interaction between particles is nonlocal. This means that the interaction only considers the nearest-neighbors x = x + e i . The fluid–fluid interaction acting on the kth component at site x is
F f , k = Ψ k ( x ) x k G k k ¯ ( x , x ) Ψ k ¯ ( x ) ( x x )
The effective mass of kth component Ψ k ( x ) is related to the number density
ρ k : Ψ k ( x ) = ρ k 0 [ 1 e x p ( ρ k ρ k 0 ) ]
G k k ¯ ( x , x ) is Green’s function,
G k k ¯ ( x , x ) = { g k k ¯ , | x x | = 1 g k k ¯ / 2 , | x x | = 2 0 , o t h e r w i s e
where g k k ¯ controls the interaction strength between different particles, while its sign determines whether the interaction is attraction (negative) or repulsion (positive), and it is sufficient to only involve the nearest neighbor interactions. The interaction Fads for the kth component at the fluid/solid interface is defined as
F a d s , h = Ψ k ( x ) k G w , k s ( x ) ( x x )
where s ( x ) is the switch parameter which is 1 when ( x ) is in the pore space of the solid lattice, otherwise it is 0. G w , k determines the interaction’s type and magnitude between fluid and solid wall. Different wettability can be obtained by adjusting G w , k . Non-wetting fluid and wetting fluid are obtained when G w , k > 0 and G w , k < 0 , respectively. G w , k is obtained by comparing the measured contact angles and the simulation results.

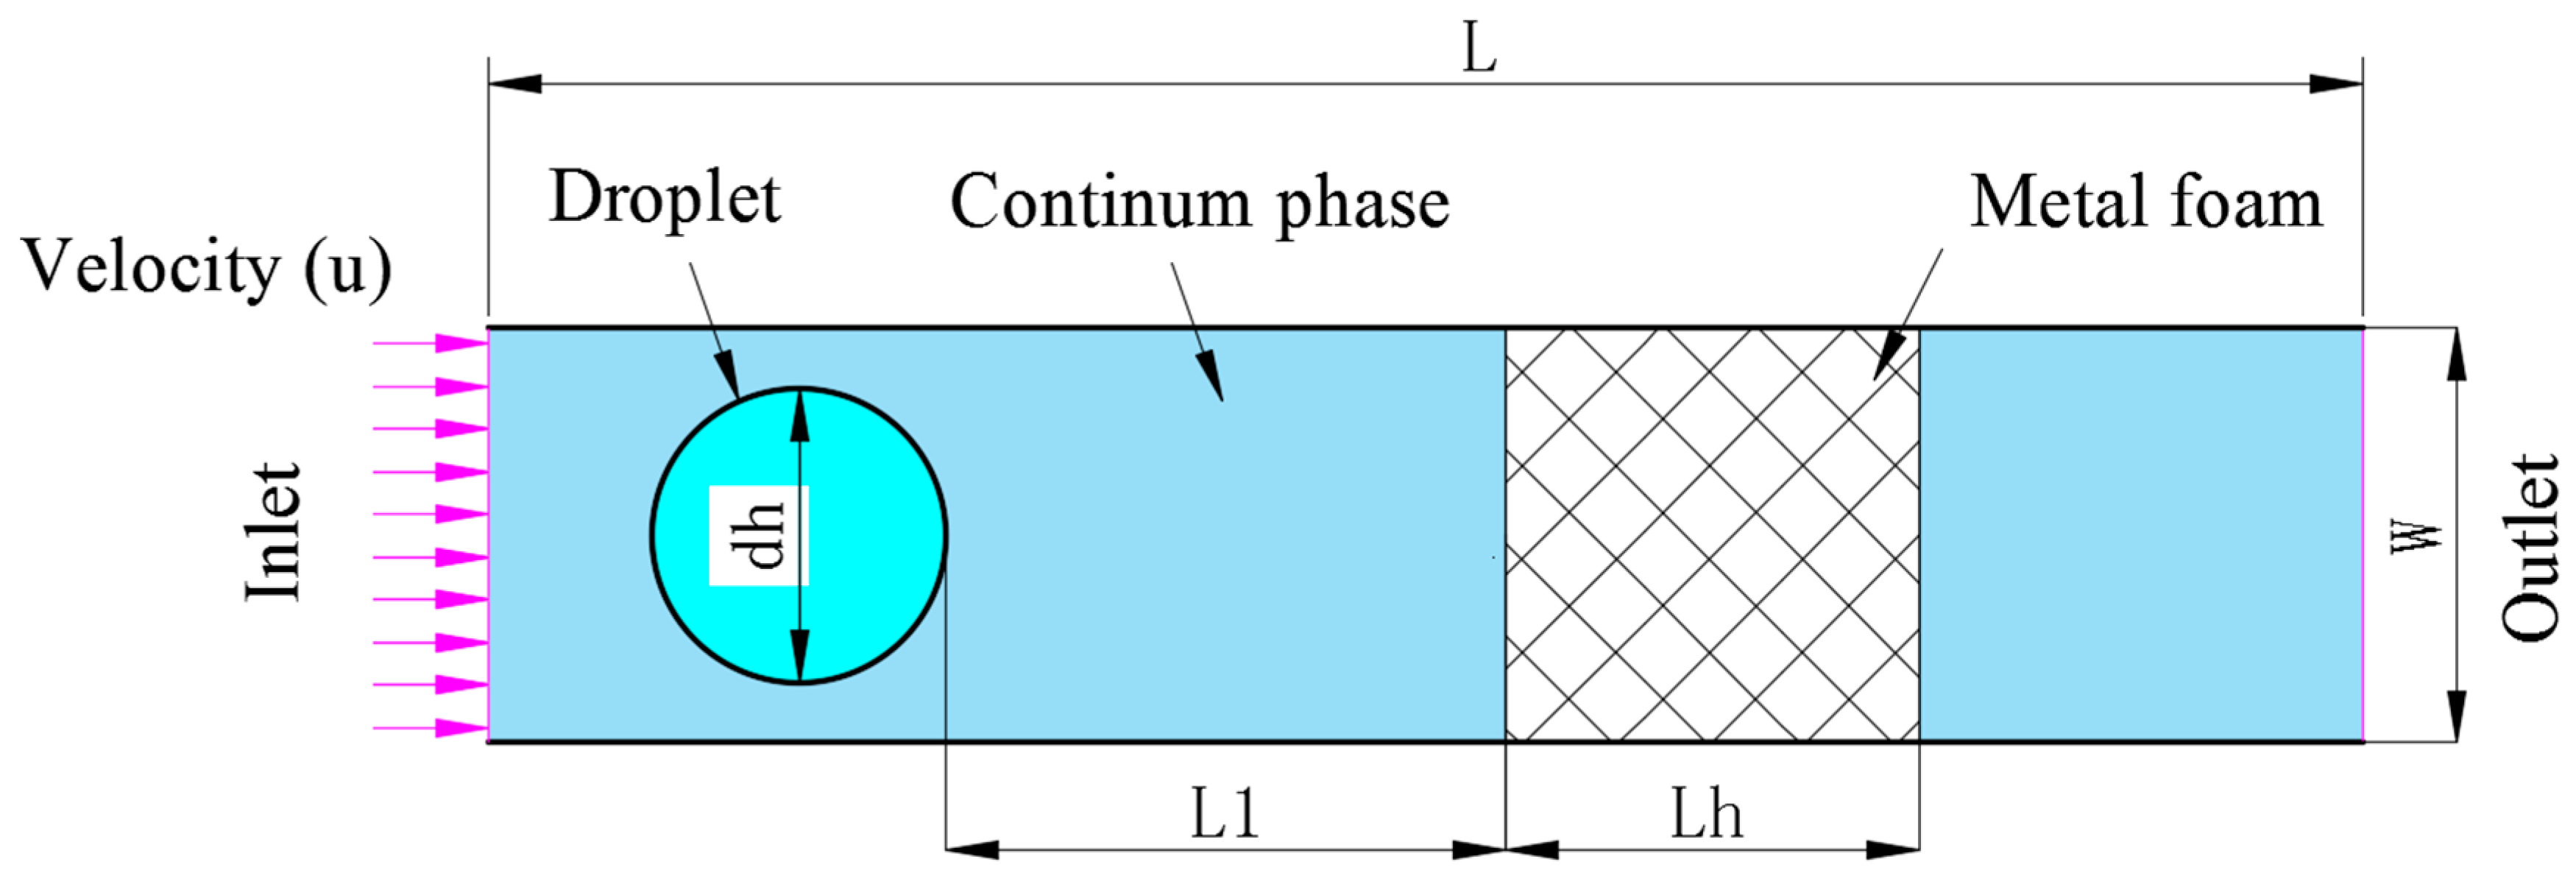
3.2. Computational Domain of Droplet Breakup

The schematic diagram of computational domain and a droplet passing through metal foam is shown in Figure 3, which corresponds to the experimental measurement. A metal foam of 60 PPI was inserted into a rectangular channel of 50 (width) × 50 (height) lattice cells. The physical unit of one lattice is 73 µm. The length of the channel (L) is 500 lattice cells, and the distance between the droplet and metal foam (L1) is 175 lattice cells. The 3D matrix of the metal foam was restructured by stacking the 2D cross-section images obtained by micro-CT. It should be noted that this reconstructed method perfectly matches the quadrilateral grids of the LBM and has a high computational efficiency, although its accuracy is less than the curve surface mesh. The flow is assumed to be steady, incompressible, and laminar. The rectangular channel is filled with silicon oil, and the water droplet is initially placed at the channel inlet. Constant velocity is imposed on the silicon oil at the inlet boundary of the channel to drive the droplet forward. The half-way bounce back rule is utilized for the solid wall [39]. The velocity inlet boundary condition with uniform velocity and the convective boundary condition are applied at the inlet and outlet of the channel, respectively [40]. It is noted that the conventional SC model suffers several limitations such as the numerical instability at a high-density ratio [41]. In this study, a density ratio of 1.0 is taken for the silicon oil and water system. Such a density ratio of 1.0 is present for the multi-phase related to the micro-reactors and microfluidic devices and is easy to simulate using the SC model. This study does not touch the cases with high-density ratios.

4. Discussion

4.1. Dimensionless Parameters

The physical values are scaled using several dimensionless parameters. One parameter is the capillary number (Ca) which describes the relative importance of viscosity and the interfacial tension. Here the Ca number is defined as Equation (14) [21]
C a = u σ
where u, η, and σ are the average inlet velocity of the silicon oil phase, the dynamic viscosity of the silicon oil, and the interfacial tension between the silicon oil and the water.
The second dimensionless parameter Dd (Dd = dh/dp) describes the relative size between the pores of the metal foam and the droplet where dp is the average pore diameter of the metal foam, and dh is the droplet diameter at the channel inlet. The third parameter, Ld, is defined as the ratio of the thickness of the metal foam (Lh) to dp. The fourth parameter Db is defined as Db = D/dh where D is the distance between the two successive droplets when the first one reaches the position of L1 (Figure 3).
In this study, the change of droplet superficial area (ΔS) is defined as
Δ S = S t   S i
where s i   is the droplet’s original superficial area before the droplet gets into the metal foam; s t is the superficial area of the droplet which has entered the metal foam. s t is obtained by averaging the corresponding values of three simulations with different metal foams (the PPI and porosity are the same). In this way, the generality of the simulation is promoted. Theoretically, when ΔS exceeds 1.0, the droplet definitely deforms or breaks up.

4.2. Modeling Coefficients and Validation of LBM Simulation

The LBM with the SC model requires identifying a correct G w , k   before simulating the flow pattern of two immiscible fluids. The water contact angle surrounded by the silicon oil on the surface of a pure nickel material surface was measured using a Drop Shape Analyzer (KRUSS, Hamburg, Germany; see Figure S1a). The relation between the static contact angle and G w , k   is investigated in independent LBM simulations by equilibrating a water droplet surrounded by a flat solid surface. The value of the interaction strength between the silicon oil and water (Go,w) is fixed and Gw,k is altered to examine the wettability of two fluids. As shown in Figure 4b, when Gw,k is ±0.06, the simulated contact angle is 135°, which is in good agreement with the experimental value of 132. Therefore, in the following simulation, Gw,k is chosen as ±0.06. It is known that Gw,k is related to the grid size in the SC model. The physical unit size of one lattice in this study was set as 73 µm, which balanced the simulation accuracy and the calculation time, considering that a high spatial resolution is favorable for improving the simulation accuracy but meanwhile significantly increases the calculation time especially for a 3D simulation. In this study, the accuracy of the grid size value is verified by comparing the simulated and experimental results regarding the contact angle (see Figure S1) and the droplet shape when the droplet leaves the metal foam (see Figure 4).
The experimental results using a Plexiglass tube (Figure 1) were used for the validation of the LBM simulated ones. The droplet deformation and breakup after the droplet left the metal foam were recorded by high-speed video. Correspondingly, the LBM code was used to simulate the hydrodynamics of the droplet. Quantitative comparisons between the simulation and the experiments were performed. When Ca = 0.063, Dd = 1.06, and Ld = 4.88, as shown in Figure 4a, the experimental result showed that the droplet broke into two droplets with the diameters of 0.7 and 1.13 mm, respectively, after it left the foam. The same phenomenon can be observed in the simulation result (see Figure 4b) with the two droplets’ diameters of 0.7 and 1.04 mm, respectively. When Ca = 0.084, Dd = 1.31, and Ld = 2.44, only one droplet with the diameter of 1.35 mm was detected after the droplet passed through the metal foam (see Figure 4c). The corresponding simulation result exhibits the same tendency with the droplet’s diameter of 1.30 mm (see Figure 4d). Based on the validations above, conclusions can be drawn that the LBM model and code are adequate to simulate the hydrodynamics of droplets passing through metal foam.
In the numerical study, we considered the case of equiviscous droplets with medium viscosity, i.e., νw = νs (dynamic viscosity of water and silicon oil), although the experimental setup shows νw/νs = 1/48. It is known that a large viscosity ratio likely results in an instable LBM simulation. To solve the instability, the multi relaxation time (MRT) approach has been reported to be feasible [42]. However, the MRT method requires a large computer resource that is most likely inapplicable for the 3D LBM simulation on the hydrodynamics of one droplet passing a porous structure like metal foam. Here, despite that a viscosity ratio should be the real value for a more reliable comparison, the droplet dynamics are somehow not so significantly different. From the numerical viewpoint, furthermore, the equiviscous case has a great numerical stability. That is, the efficient calculation compensates for any loss of accuracy.

4.3. The Effect of Ca

For the metal foam reactor with immiscible fluids, smaller droplets produced in the reactor exhibits higher activity. For example, in our previous studies on biodiesel synthesis by transesterification with methanol, methyl ester yield is strongly dependent on droplet size [4]. This is because the mass transfer of triglycerides (TG) from the oil phase to the methanol/oil interface limits the rate of methanolysis reaction and controls the kinetics at the beginning of the reaction [43,44]. The overall volumetric TG mass transfer coefficient increase is attributed to an increase in the specific interfacial area by the decrease in droplet size, which leads to an increase in the TG reaction rate. For the metal foam with two immiscible fluids, when the continuous phase drives the droplets to pass through the porous material, the solid walls stretch the droplets, which deform into an elongated shape and break up. The deformation and breakup increase the superficial area of the droplets. When the distance between two droplets is smaller than one critical valve, they coalesce [45], resulting in a decrease in the superficial area.
Figure 5 shows the effect of Ca on droplet dynamics when the droplet passes through a metal foam. For the Ca values of 0.031 and 0.046, as shown in Figure 5b,c, the droplet is stretched when it collides with the walls of the metal foam. Then, the droplet shape restores at the pores of the metal foam. When the droplet leaves the metal foam, an obvious elongation can be observed. It should be noted that no droplet breakup is detectable for the Ca values of 0.031 and 0.046. Several previous studies [46,47,48,49] have indicated, when the viscosity ratio of the droplet to the matrix fluid λ is less than 4, there is a “critical capillary number” Cac, above which the droplet continues to deform and finally breaks in the creeping flow regime. The critical capillary number for droplet breakup in shear flow is the lowest for λ, roughly around 0.647, and its value (Cac ≈ 0.4) is slightly less than the case for λ = 1, where Cac ≈ 0.41 [50]. The droplet hydrodynamics passing through obstructions in confined microchannels were explored by Chung et al. both numerically and experimentally [8]. They found that for the cylinder obstruction, the Cac was around 0.1. In our case, as shown in Figure 5d, for a Ca of 0.061, the droplet breaks up and forms one daughter droplet. The Cac in our case is around 0.061, which is lower than that of 0.1 for the case of one droplet passing through one cylinder obstruction. It was found that the stretching rate in shear flows may be increased by incorporating periodic reorientations in the flow [51]. Wen et al. [4] also reported that droplet size decreases with increasing reorientations by turns in a zigzag micro-channel for the mixing of ethanol and soybean oil. The smaller Cac for the case of metal foam than that for the cylinder obstruction in a micro-channel is mostly likely attributed to the frequent periodic reorientation in the flow. When Ca further increases up to 0.092, three daughter droplets can be observed, as shown in Figure 5f.
As shown in Figure 6, when Ca increases from 0.031 to 0.092, ΔS rises nonlinearly from 1.0 to 1.2 at the channel length L = 18 mm where the droplet has left the metal foam, and its shape evolves to be stable. The rise in ΔS at L = 18 mm is obvious, with the increase in Ca from 0.031 to 0.061. For Ca = 0.031, the ΔS of 1.0 at L = 18 mm suggests that no daughter droplet is formed when the droplet leaves the porous structure. The high Ca value strengths the droplet breakup and restrains the coalescence.

4.4. The Impact of Dd

PPI and porosity determine the cell diameter of metal foam. The cell average diameter of the metal foam with 60 PPI and the porosity of 95% was calculated to be 0.817 mm. The effect of Dd on droplet dynamics when the droplet passes through a metal foam is show in Figure 7. For the Dd values of 0.89 and 1.07, as shown in Figure 7b,c,the droplet passes though the metal foam without splitting into daughter droplets. For Dd = 0.89, no obvious droplet deformation can be observed. This is because the droplet is small enough for it to pass through the metal foam without a strong interaction with the three-dimensional porous structure of the metal foam. For Dd = 1.07, the droplet is stretched into a linear shape. For Dd ≥ 1.25(see Figure 7d–g), a polliwog-shaped droplet is formed, which is the characteristic of the case that an obstacle intrudes into a moving droplet followed by the breakup of droplet. The formation of the tail of the polliwog-shape is attributed to the interfacial area between the droplet and the obstacle. The polliwog-shaped droplets are only present at the outlet of the metal foam for the Dd values of 1.82 and 2.24. In contrast, for 1.25 ≤ Dd ≤ 1.33, the polliwog-shaped droplets are formed inside the metal foam. This difference is because the polliwog-shaped droplet requires enough space to be stretched until it breaks up. For the big droplet of Dd = 1.82 or 2.24, the tail is so long that the required space for stretching the droplet to break up exceeds the pore size of metal foam, resulting in the formation of polliwog-shaped droplets at the metal foam outlet.
To further elucidate the details of droplet breakup evolution in the metal foam, the case of Dd = 1.25 is taken as a representative one (see Figure S2). Droplet splitting in a microfluidic channel by the use of an obstacle was investigated numerically by Lee and Son [9]. The droplet is elongated around a cuboid obstacle and its portion becomes narrow near the front of the obstacle. The elongated portion breaks off at the front corner of the obstacle and then at the rear corner of the obstacle. Chung et al. [8] found that for cylinder obstruction, the thread becomes uniformly thinner around the cylinder, and finally breaks up at the front parts, independent of Ca. They concluded that the thread breakup was attributed to the velocity gradients induced by the geometric effect of the obstructions. Different from the hydrodynamics of droplets passing an obstacle in a micro-channel, for the droplet passing through metal foam, a waist is formed between the head and tail (see Supplementary Figure S2a). The droplet continually lengthens and breaks into two droplets, which are then driven into a spherical shape by surface tension (see Figure S2b,c). That is, the breakup of the droplet occurs at the waist not on the surfaces of the porous obstacles. In this regard, this droplet breakup is to some extent similar to that in a simple shear flow [8].
Figure 8 shows the effect of Dd on ΔS. When Dd increases from 0.89 to 1.33, the ΔS at L = 18 mm rises from 1.0 to 1.2. With a further increase in Dd from 1.33 to 1.82, Dd declines to 1.15 at L = 18 mm. For Dd = 0.89, the ΔS of 1.0 at L = 18 mm suggests that no daughter droplet is formed when the droplet leaves the porous structure.

4.5. The Impact of Ld

The effect of Ld on droplet hydrodynamics is shown in Figure 9. For the case of Ca = 0.061, Dd = 1.25, and Ld = 2.44 (see Figure 9a), the polliwog–shaped droplet is formed at the metal foam outlet and then it breaks up into two droplets. With the increase in Ld from 2.44 to 9.76, the droplet breaks up inside the metal foam and the number of formed droplets is fixed at two. Therefore, no difference in the number of the generated daughter droplets is observed regardless of various Ld. As mentioned in Section 4.4, when Dd ˂ 1.25, the droplet passes though the metal foam without splitting into daughter droplets. For Dd = 1.25, the Dd values of the two broken droplets are both less than 1.25, thus no splitting of the two droplets takes place in the following metal foam part. For the cases of Ca = 0.061, Dd = 1.82, and Ld in the range of 2.44 to 9.76, as shown in Figure 9e–h, the polliwog–shaped droplet is always formed at the metal foam outlet and then it breaks up into two droplets. Ld shows a negligible effect on the number of the generated daughter droplets in this case. In contrast, for a microchannel with obstructions, Chung et al. reported that the number of satellite droplets equals to the number of cylinder obstructions when the penetration of droplet fluid into the cylinder interval occurs [8]. The number of obstructions plays an important role in the number of generated daughter droplets. The difference in the droplet hydrodynamics is mainly because for metal foam, the breakup of the droplet occurs at the waist of the deformed droplet, whereas the breakup takes place on the surfaces of the obstructions in the case of a microchannel with obstructions.

4.6. The Impact of Db

The above discussions are related to the hydrodynamics of a single droplet passing through metal foam. Actually, metal foam is usually used for the mixing of two immiscible liquids where a series of droplets are formed [4]. Therefore, in this section, the hydrodynamics of two successive droplets passing through metal foam is investigated. The effect of Db on droplet hydrodynamics is illustrated in Figure 10. As shown in Figure 10, when Db is below 3.00, the ΔS less than 1 can be found at the inlet of the metal foam. A Db of 3.00 is the critical value to avoid the coalescence of two droplets at the inlet zone of the metal foam in the case of Ca of 0.061, Dd of 1.33, and Ld of 7.32. To further elucidate the details of two successive droplets hydrodynamics at the inlet zone of the metal foam, the case of Db of 2.00 is taken as the representative one. A Db of 2.00 at the inlet of the rectangular channel decreases to 0.35 at the position of 16 mm (1 mm before the inlet of the metal foam). Then, the two droplets merge into a big droplet at the inlet zone of the metal foam (see Figure S3).

5. Conclusions

We developed a LBM of droplet deformation and breakup and performed validation experiments. The simulated results are in good agreement with the experimental ones. We defined the four dimensionless parameters: capillary number (Ca), the relative size between pores of the metal foam and the droplet (Dd), and the metal foam thickness (Ld). The results show that for Ld of 7.32 and Dd of 1.82, the Cac for droplet passing metal foam of 60 PPI is around 0.061. This Cac is lower than that of 0.1 for the case of one droplet passing through one cylinder obstruction because of the frequent periodic reorientation in the flow of the metal foam. For Ld of 7.32 and Ca of 0.061, when Dd = 0.89, no obvious droplet deform can be observed. For Dd = 1.07, the droplet is stretched into a linear shape. When Dd exceeds 1.25, a polliwog-shaped droplet is formed. The breakup of the droplet occurs at the waist of the deformed droplet and not on the surfaces of the porous obstacles. For Ca of 0.061 and Dd of 1.25, Ld in the range of 2.44 to 9.76 shows a negligible effect on the number of the generated daughter droplets. A Db of 3.00 is the critical value to avoid the coalescence of two droplets at the inlet zone of the metal foam in the case of Ca of 0.061, Dd of 1.33, and Ld of 7.32.

Supplementary Materials

The following are available online at https://www.mdpi.com/2227-9717/7/12/877/s1, Figure S1: (a) Image of a water droplet surround by silicon oil on pure nickel surface and (b) a droplet simulated by LBM with Gw,k of ± 0.06, Figure S2: Evolution of one droplet breakup: (a) t = 0.09 s, (b) t = 0.096 s, and (c) t =0.102 s, Figure S3: Hydrodynamics of two successive droplets passing a metal foam with Db of 2.00 (Ld = 7.32, Ca = 0.061, Dd = 1.33): (a) t = 0.12 s, (b) t = 0.144 s, and (c) t = 0.168 s.

Author Contributions

Conceptualization, J.Z. and X.Y.; methodology, J.Z.; software, J.Z.; validation, J.Z. and X.Y.; formal analysis, J.Z. and X.Y.; investigation, J.Z.; resources, J.Z.; data curation, J.Z.; writing—original draft preparation, J.Z. and X.Y.; writing—review and editing, J.Z. and X.Y.; visualization, J.Z.; supervision, S.-T.T.; project administration, X.Y.; funding acquisition, X.Y.

Funding

This research was funded by the China Natural Science Foundation, grant number 21476073 and 21176069; and the Sub Topic of Major Science and Technology Project, grant number 2017ZX06002019-003.

Conflicts of Interest

The authors declare no conflict of interest.

References

  1. Chen, H.; Yu, H.; Tang, Y.; Pan, M.; Feng, P.; Wang, H.; Peng, F.; Yang, J. Assessment and optimization of the mass-transfer limitation in a metal foam methanol microreformer. App. Catal. A 2008, 337, 155–162. [Google Scholar] [CrossRef]
  2. Wenmakers, P.W.A.M.; Schaaf, J.V.D.; Kuster, B.F.M.; Schouten, J.C. “Hairy Foam”: Carbon nanofibers grown on solid carbon foam. A fully accessible, high surface area, graphitic catalyst support. J. Mater. Chem. 2008, 18, 2426–2436. [Google Scholar] [CrossRef]
  3. Stemmet, C.P.; Meeuwse, M.; Schaaf, J.V.D.; Kuster, B.F.M.; Schouten, J.C. Gas-liquid mass transfer and axial dispersion in solid foam packing. Chem. Eng. Sci. 2007, 62, 5444–5450. [Google Scholar] [CrossRef]
  4. Yu, X.; Wen, Z.; Lin, Y.; Tu, S.T.; Wang, Z.; Yan, J. Intensification of biodiesel synthesis using metal foam reactors. Fuel 2010, 89, 3450–3456. [Google Scholar] [CrossRef]
  5. Stemmet, C.P.; Jongmans, J.N.; Schaaf, J.V.D.; Kuster, B.F.M.; Schouten, J.C. Hydrodynamics of gas–liquid counter-current flow in solid foam packings. Chem. Eng. 2005, 60, 6422–6429. [Google Scholar] [CrossRef]
  6. Kim, S.M.; Ghiaasiaan, S.M. Numerical Modeling of Laminar Pulsating Flow in Porous Media. J. Fluids Eng. 2009, 131, 041203. [Google Scholar] [CrossRef]
  7. Koponen, A.; Kataja, M.; Timonen, J.; Kandhai, D. Simulations of Single-Fluid Flow in Porous Media. Int. J. Mod. Phys. C 1998, 9, 1505–1521. [Google Scholar] [CrossRef]
  8. Chung, C.; Ahn, K.H.; Lee, S.J. Numerical study on the dynamics of droplet passing through a cylinder obstruction in confined microchannel flow. J. Non-Newton. Fluid 2009, 162, 38–44. [Google Scholar] [CrossRef]
  9. Lee, J.; Lee, W.; Son, G. Numerical study of droplet breakup and merging in a microfluidic channel. J. Mech. Sci. Technol. 2013, 27, 1693–1699. [Google Scholar] [CrossRef]
  10. Sethian, J.A.; Smereka, P. Level set methods for fluid interfaces. Annu. Rev. Fluid Mech. 2003, 35, 341–372. [Google Scholar] [CrossRef]
  11. Lee, W.; Son, G. Numerical study of obstacle configuration for droplet splitting in a microchannel. Comput. Fluids 2013, 84, 351–358. [Google Scholar] [CrossRef]
  12. Qian, J.Y.; Li, X.J.; Gao, Z.X.; Jin, Z.J. Mixing efficiency and pressure drop analysis of liquid-liquid two phases flow in serpentine microchannels. J. Flow Chem. 2019, 9, 187–197. [Google Scholar] [CrossRef]
  13. Qian, J.Y.; Li, X.J.; Gao, Z.X.; Jin, Z.J. Mixing efficiency analysis on droplet formation process in microchannels by numerical methods. Processes 2019, 7, 33. [Google Scholar] [CrossRef]
  14. Juric, D.; Tryggvason, G. A front-tracking method for dendritic solidification. J. Comput. Phys. 1996, 123, 127–148. [Google Scholar] [CrossRef]
  15. Yang, X.; James, A.J.; Lowengrub, J.; Zheng, X.; Cristini, V. An adaptive coupled level-set/volume-of-fluid interface capturing method for unstructured triangular grids. J. Comput. Phys. 2006, 217, 364–394. [Google Scholar] [CrossRef]
  16. Scardovelli, R.; Zaleski, S. Direct numerical simulation of free-surface and interfacial flow. Annu. Rev. Fluid Mech. 1999, 31, 567–603. [Google Scholar] [CrossRef]
  17. He, X.; Chen, S.; Zhang, R. A lattice boltzmann scheme for incompressible multiphase flow and its application in simulation of rayleigh–taylor instability. J. Comput. Phys. 1999, 152, 642–663. [Google Scholar] [CrossRef]
  18. Qian, J.Y.; Li, X.J.; Wu, Z.; Jin, Z.J.; Sunden, B. A comprehensive review on liquid–liquid two-phase flow in microchannel: Flow pattern and mass transfer. Microfluid. Nanofluid. 2019, 23, 116. [Google Scholar] [CrossRef]
  19. Boomsma, K.; Poulikakos, D.; Ventikos, Y. Simulations of flow through open cell metal foams using an idealized periodic cell structure. Int. J. Heat Fluid Flow 2003, 24, 825–834. [Google Scholar] [CrossRef]
  20. Kopanidis, A.; Theodorakakos, A.; Gavaises, E.; Bouris, D. 3d numerical simulation of flow and conjugate heat transfer through a pore scale model of high porosity open cell metal foam. Int. J. Heat Mass Transf. 2010, 53, 2539–2550. [Google Scholar] [CrossRef]
  21. Montminy, M.D.; Tannenbaum, A.R.; Macosko, C.W. The 3d structure of real polymer foams. J. Colloid Interf. Sci. 2004, 280, 202–211. [Google Scholar] [CrossRef] [PubMed]
  22. Carvalho, T.P.D.; Morvan, H.P.; Hargreaves, D.; Oun, H.; Kennedy, A. Experimental and Tomography-Based CFD Investigations of the Flow in Open Cell Metal Foams with Application to Aero Engine Separators. In Proceedings of the ASME Turbo Expo 2015: Turbine Technical Conference and Exposition, Montreal, QC, Canada, 15–19 June 2015; p. V05CT15A028. [Google Scholar]
  23. Aidun, C.K.; Clausen, J.R. Lattice-Boltzmann method for complex flows. Rev. Fluid Mech. 2010, 42, 439–464. [Google Scholar] [CrossRef]
  24. Zhang, J. Lattice boltzmann method for microfluidics: Models and applications. Microfluid. Nanofluid. 2011, 10, 1–28. [Google Scholar] [CrossRef]
  25. Wu, L.; Tsutahara, M.; Kim, L.S.; Ha, M.Y. Three-dimensional lattice boltzmann simulations of droplet formation in a cross-junction microchannel. Int. J. Multiphase Flow 2008, 34, 852–864. [Google Scholar] [CrossRef]
  26. Liu, H.; Zhang, Y. Phase-field modeling droplet dynamics with soluble surfactants. J. Comput. Phys. 2010, 229, 9166–9187. [Google Scholar] [CrossRef]
  27. Wang, W.; Liu, Z.; Jin, Y.; Cheng, Y. Lbm simulation of droplet formation in micro-channels. Chem. Eng. J. 2011, 173, 828–836. [Google Scholar] [CrossRef]
  28. Rothman, D.H.; Keller, J.M. Immiscible cellular-automaton fluids. J. Stat. Phys. 1988, 52, 1119–1127. [Google Scholar] [CrossRef]
  29. He, X.; Doolen, G.D. Thermodynamic foundations of kinetic theory and lattice boltzmann models for multiphase flows. J. Stat. Phys. 2002, 107, 309–328. [Google Scholar] [CrossRef]
  30. Grunau, D.; Chen, S.; Eggert, K. A lattice boltzmann model for multiphase fluid flows. Phys. Fluids A 1993, 5, 2557–2562. [Google Scholar] [CrossRef]
  31. Shan, X.; Chen, H. Lattice boltzmann model for simulating flows with multiple phases and components. Phys. Rev. E 1993, 47, 1815–1819. [Google Scholar] [CrossRef]
  32. Shan, X.; Chen, H. Simulation of nonideal gases and liquid-gas phase transitions by the lattice boltzmann equation. Phys. Rev. E 1994, 49, 2941–2948. [Google Scholar] [CrossRef] [PubMed] [Green Version]
  33. Hou, S.; Shan, X.; Zou, Q.; Doolen, G.D.; Soll, W.E. Evaluation of two lattice boltzmann models for multiphase flows. J. Comput. Phys. 1997, 138, 695–713. [Google Scholar] [CrossRef]
  34. Li, Q.; Chai, Z.; Shi, B.; Liang, H. Deformation and breakup of a liquid droplet past a solid circular cylinder: A lattice boltzmann study. Phys. Rev. E 2014, 90, 043015. [Google Scholar] [CrossRef] [PubMed]
  35. Park, J.; Li, X. Multi-phase micro-scale flow simulation in the electrodes of a pem fuel cell by lattice boltzmann method. J. Power Sources 2008, 178, 248–257. [Google Scholar] [CrossRef]
  36. Frank, X.; Perré, P.; Li, H.Z. Lattice boltzmann investigation of droplet inertial spreading on various porous surfaces. Phys. Rev. E 2015, 91, 052405. [Google Scholar] [CrossRef] [PubMed]
  37. Tölke, J.; Krafczyk, M.; Schulz, M.; Rank, E. Lattice boltzmann simulations of binary fluid flow through porous media. Philos. Trans. A Math. Phys. Eng. Sci. 2002, 360, 535–545. [Google Scholar] [CrossRef]
  38. Beugre, D.; Calvo, S.; Dethier, G.; Crine, M.; Toye, D.; Marchot, P. Lattice boltzmann 3d flow simulations on a metallic foam. J. Comput. Appl. Math. 2010, 234, 2128–2134. [Google Scholar] [CrossRef] [Green Version]
  39. Cornubert, R.; d’Humiè, D.; Levermore, R. A Knudsen layer theory for lattice gases. Phys. D 1991, 47, 241–259. [Google Scholar] [CrossRef]
  40. Orlanski, I. A simple boundary condition for unbounded hyperbolic flows. J. Comput. Phys. 1976, 21, 251–269. [Google Scholar] [CrossRef]
  41. Chen, L.; Kang, Q.; Mu, Y.; He, Y.L.; Tao, W.Q. A critical review of the pseudopotential multiphase lattice Boltzmann model: Methods and applications. Int. J. Heat Mass Transf. 2014, 76, 210–236. [Google Scholar] [CrossRef]
  42. Liu, H.; Ju, Y.; Wang, N.; Xi, G.; Zhang, Y. Lattice boltzmann modeling of contact angle and its hysteresis in two-phase flow with large viscosity difference. Phys. Rev. E 2015, 92, 033306. [Google Scholar] [CrossRef] [PubMed] [Green Version]
  43. Stamenković, O.S.; Todorović, Z.B.; Lazić, M.L.; Veljković, V.B.; Skala, D.U. Kinetics of sunflower oil methanolysis at low temperatures. Bioresour. Technol. 2008, 99, 1131–1140. [Google Scholar]
  44. Noureddini, H.; Zhu, D. Kinetics of transesterification of soybean oil. J. Am. Oil Chem. Soc. 1997, 74, 1457–1463. [Google Scholar] [CrossRef]
  45. Yan, Y.Y.; Zu, Y.Q. Numerical Modelling Based on Lattice Boltzmann Method of the Behaviour of Bubbles Flow and Coalescence in Microchannels. In Proceedings of the 2008 International Conference on Nanochannels, Microchannels, and Minichannels (ASME 2008), Darmstadt, Germany, 23–25 June 2008; pp. 313–319. [Google Scholar]
  46. Li, J.; Renardy, Y.Y.; Renardy, M. Numerical simulation of breakup of a viscous drop in simple shear flow through a volume-of-fluid method. Phys. Fluids 2000, 12, 269–282. [Google Scholar] [CrossRef] [Green Version]
  47. Grace, H.P. Dispersion phenomena in high viscosity immiscible fluid systems and application of static mixers as dispersion devices in such systems. Chem. Eng. Commun. 1982, 14, 225–277. [Google Scholar] [CrossRef]
  48. Puyvelde, P.V.; Yang, H.; Mewis, J.; Moldenaers, P. Breakup of filaments in blends during simple shear flow. J. Rheol. 2000, 44, 1401–1415. [Google Scholar] [CrossRef] [Green Version]
  49. Cristini, V.; Guido, S.; Alfani, A.; Bławzdziewicz, J.; Loewenberg, M. Drop breakup and fragment size distribution in shear flow. J. Rheol. 2003, 47, 1283–1298. [Google Scholar] [CrossRef]
  50. Rallison, J.M. A numerical study of the deformation and burst of a viscous drop in general shear flows. J. Fluid Mech. 1981, 109, 465–482. [Google Scholar] [CrossRef]
  51. Deroussel, P.; Khakhar, D.V.; Ottino, J.M. Mixing of viscous immiscible liquids. part 1: Computational models for strong–weak and continuous flow systems. Chem. Eng. Sci. 2001, 56, 5511–5529. [Google Scholar] [CrossRef]
Figure 1. Setup for measurements on the hydrodynamics of a droplet passing through a metal foam.
Processes 07 00877 g001
Figure 2. (a) Raw section image of the metal foam structure. (b) 3D reconstruction of a part of the foam sample of 3.6 × 3.6 × 1.4 mm (mesh number 100 × 100 × 40 of the matrix).
Processes 07 00877 g002
Figure 3. Schematic diagram of a droplet passing through metal foam in a computational domain of 500 (length) × 50 (width) × 50 (height) lattice cell and L1 of 175 lattice cell.
Processes 07 00877 g003
Figure 4. Comparison of the lattice Boltzmann method (LBM) simulation and the experimental results. (a) The experimental and (b) the simulation results for Ca = 0.063, Dd = 1.06, and Ld = 4.88. (c) The experimental and (d) the simulation results for Ca = 0.084, Dd = 1.31, and Ld = 2.44.
Processes 07 00877 g004
Figure 5. Hydrodynamics of one droplet passing a metal foam with different Ca values (Ld = 7.32, Dd = 1.82): (a) schematic diagram, (b) Ca = 0.031, (c) Ca = 0.046, (d) Ca = 0.061, (e) Ca = 0.078, and (f) Ca = 0.092.
Processes 07 00877 g005
Figure 6. Change of the superficial area of the droplet passing through metal foam with different Ca values (Ld = 7.32; Dd = 1.82).
Processes 07 00877 g006
Figure 7. Hydrodynamics of one droplet passing a metal foam with different Dd values (Ld = 7.32, Ca = 0.061): (a) schematic diagram, (b) Dd = 0.89, (c) Dd = 1.07, (d) Dd = 1.25, (e) Dd = 1.33, (f) Dd = 1.82, and (g) Dd = 2.24.
Processes 07 00877 g007
Figure 8. Change of the superficial area of the droplet passing through metal foam with different Dd values (Ld = 7.32; Ca = 0.061).
Processes 07 00877 g008
Figure 9. Hydrodynamics of one droplet passing a metal foam with different Ld values (Ca = 0.061): (a) Ld = 2.44, Dd = 1.25; (b) Ld = 4.88, Dd = 1.25; (c) Ld = 7.32, Dd = 1.25; (d) Ld = 9.76, Dd = 1.25; (e) Ld = 2.44, Dd = 1.82; (f) Ld = 4.88, Dd = 1.82; (g) Ld = 7.32, Dd = 1.82; and (h) Ld = 9.76, Dd = 1.82.
Processes 07 00877 g009
Figure 10. Change of the superficial area of two successive droplets when they pass through a metal foam with different Db values (Ld = 7.32, Ca = 0.061, and Dd = 1.33).
Processes 07 00877 g010

