Recovery of Protein from Dairy Milk Waste Product Using Alcohol-Salt Liquid Biphasic Flotation

 ,
, 

Abstract
:1. Introduction
2. Materials and Methods
2.1. Materials
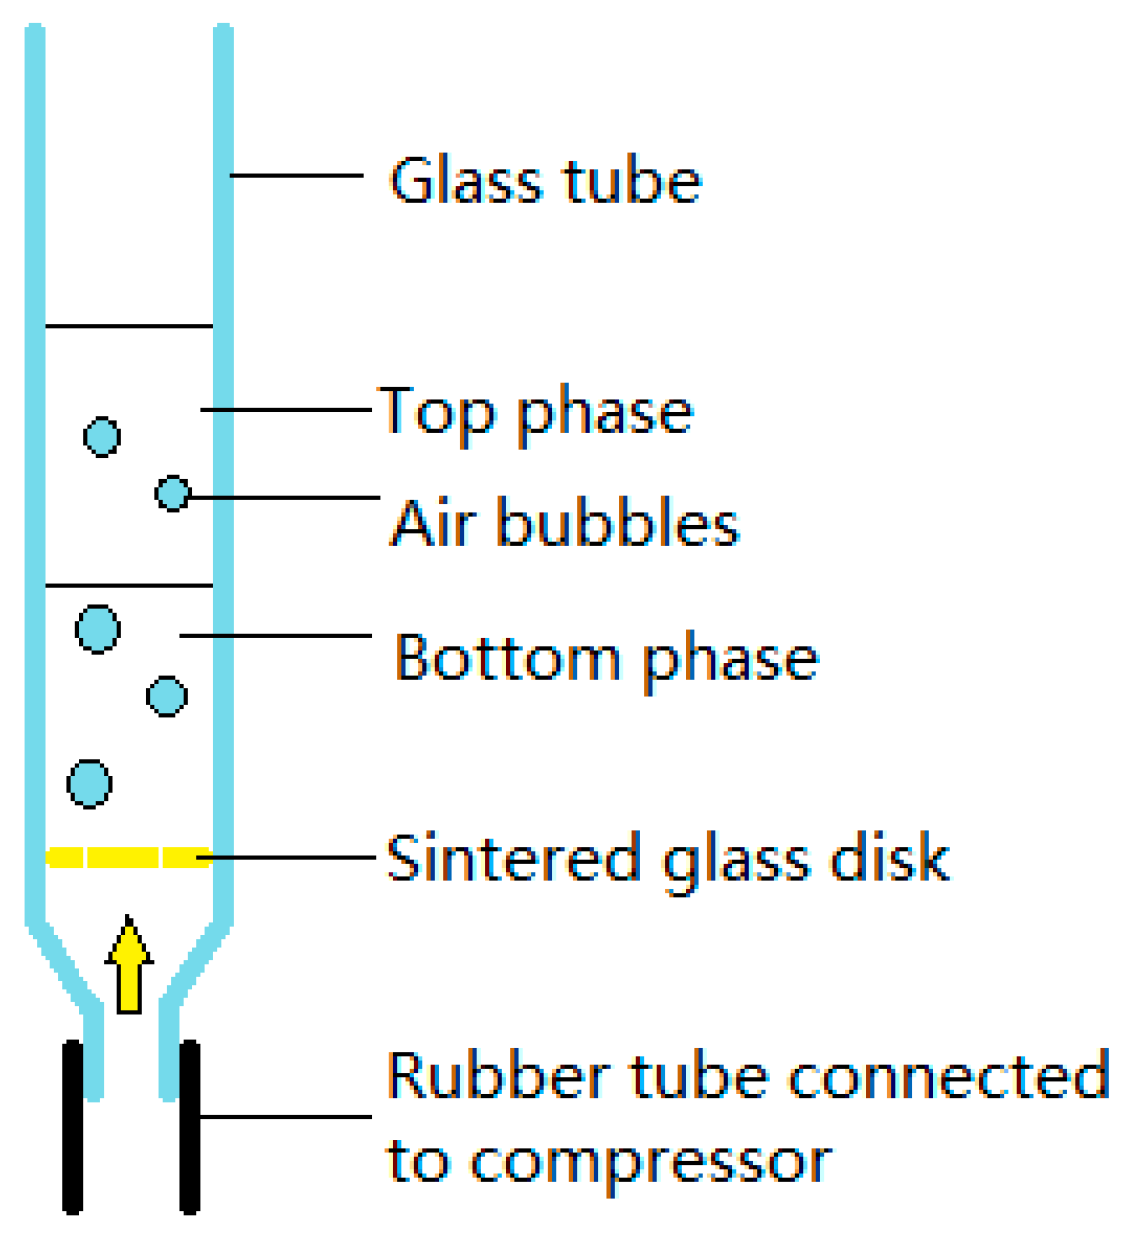
2.2. Apparatus
2.3. Preparation of Milk Samples
2.4. Protein Assay
2.5. Protein Extraction Using LBF
2.6. Optimization of LBF Operating Parameters
2.7. Calculations of Recovery Yield and Separation Efficiency
3. Results and Discussion
3.1. Effects of Different Types of Inorganic Salt in Protein Recovery Using LBF
3.2. Effect of Different Types of Alcohols for Protein Recovery
3.3. Effect of Different Concentration of K2HPO4 Salt on the Recovery of Proteins
3.4. Effect of Different Concentrations of Ethanol on the Recovery of Proteins
3.5. Effect of Various Concentrations of Milk
3.6. Effect of pH on the Recovery of Proteins
3.7. Effect of Flotation Time on the Recovery of Proteins
3.8. Effect of Scaling up LBF for Industrial Application Purposes
4. Conclusions
Author Contributions
Funding
Acknowledgments
Conflicts of Interest
References
- Milk Waste Produced. Available online: http://www.wrap.org.uk/content/wrap-comes-winning-formula-tackle-milk-waste (accessed on 9 July 2019).
- Wasted Milk Is a Drain on Resources. Available online: https://www.ed.ac.uk/news/all-news/140512-climate (accessed on 9 July 2019).
- American Association of Cereal Chemist. Properties of Milk and Its Components; American Association of Cereal Chemists: St. Paul, MN, USA, 1997; Volume 1, pp. 1–10. [Google Scholar]
- Davoodi, S.H.; Shahbazi, R.; Esmaeili, S.; Sohrabvandi, S.; Mortazavian, A.; Jazayeri, S.; Taslimi, A. Health-Related Aspects of Milk Proteins. Iran. J. Pharm. Res. 2016, 15, 573–591. [Google Scholar] [PubMed]
- Reen, C.S.; Wayne, C.K.; Loke, S.P.; Manickam, S.; Chuan, L.T.; Yang, T.A.O. Isolation of protein from Chlorella sorokiniana CY1 using liquid biphasic fl otation assisted with sonication through sugaring-out effect. J. Oceanol. Limnol. 2019, 37, 898–908. [Google Scholar]
- Wayne, C.K.; Reen, S.; Krishnamoorthy, R.; Tao, Y.; Chu, D. Liquid biphasic flotation for the purification of C-phycocyanin from Spirulina platensis microalga. Bioresour. Technol. 2019, 288, 121519. [Google Scholar]
- Bian, H.; Li, J.; Zhang, Q.; Chen, H.; Zhuang, W.; Gao, Y.Q.; Zheng, J. Ion Segregation in Aqueous Solutions. J. Phys. Chem. B 2012, 116, 14426–14432. [Google Scholar] [CrossRef] [PubMed]
- Yuzugullu, Y.; Duman, Y.A. Aqueous Two-Phase (PEG4000/Na2SO4) Extraction and Characterization of an Acid Invertase from Potato Tuber(Solanum tuberosum). Prep. Biochem. Biotechnol. 2015, 45, 696–711. [Google Scholar] [CrossRef] [PubMed]
- Show, P.L.; Ooi, C.W.; Anuar, M.S.; Ariff, A.; Yusof, Y.A.; Chen, S.K.; Annuar, M.S.; Ling, T.C. Recovery of lipase derived from Burkholderia cenocepacia ST8 using sustainable aqueous two-phase flotation composed of recycling hydrophilic organic solvent and inorganic slat. Sep. Purif. Technol. 2013, 110, 112–118. [Google Scholar] [CrossRef]
- Lee, S.Y.; Khoiroh, I.; Ling, T.C.; Show, P.L. Aqueous Two-Phase Flotation for the Recovery of Biomolecules Aqueous Two-Phase Flotation for the Recovery of Biomolecules. Sep. Purif. Rev. 2015, 45, 81–92. [Google Scholar] [CrossRef]
- Albertsson, P. Partition of cell particles and macromolecules in polymer two-phase systems. Adv. Protein Chem. 1970, 24, 309–341. [Google Scholar] [PubMed]
- Ying, S.; Loke, P.; Chuan, T.; Chang, J. Single-step disruption and protein recovery from Chlorella vulgaris using ultradonication and ionic liquid buffer aqueous solutions as extractive solvents. Biochem. Eng. J. 2017, 124, 26–35. [Google Scholar]
- Asenjo, J.A.; Andrews, B.A. Aqueous two-phase systems for protein separation. Phase separation and applications. J. Chromatogr. A 2012, 1238, 1–10. [Google Scholar] [CrossRef] [PubMed]
- Wingfield, P.T. Protein precipitation using ammonium sulfate. Curr. Protoc. Protein Sci. 1998, 13, A.3F.1–A.3F.8. [Google Scholar]
- Lu, Y.; Yu, M.; Tan, Z.; Yan, Y. Phase Equilibria and Salt Effect on the Aqueous Two-Phase System of Polyoxyethylene Cetyl Ether and Sulfate Salt at Three Temperatures. J. Chem. Eng. Data 2016, 61, 2135–2143. [Google Scholar] [CrossRef]
- Sankaran, R.; Show, P.L.; Cheng, Y.S.; Tao, Y.; Ao, X.; Nguyen, T.D.; Van Quyen, D. Integration Process for Protein Extraction from Microalgae Using Liquid Biphasic Electric Flotation (LBEF) System. Mol. Biotechnol. 2018, 60, 749–761. [Google Scholar] [CrossRef] [PubMed]
- Properties of Ethanol. Available online: https://pubchem.ncbi.nlm.nih.gov/compound/Ethanol#section=Density (accessed on 12 July 2019).
- Properties of Ethanol. Available online: https://pubchem.ncbi.nlm.gov/compound/Ethanol#section=Computed-Properties (accessed on 12 July 2019).
- Properties of 1-Propanol. Available online: https://pubchem.ncbi.nlm.nih.gov/compound/1031#section=Density (accessed on 17 July 2019).
- Properties of Isopropyl. Available online: https://pubchem.ncbi.nlm.nih.gov/compound/Isopropyl-alcohol#section=Density (accessed on 17 July 2019).
- Properties of 1-Propanol. Available online: https://pubchem.ncbi.nlm.nih.gov/compound/1031#section=Computed-Properties (accessed on 17 July 2019).
- Properties of 2-Propanol. Available online: https://pubchem.ncbi.nlm.nih.gov/compound/Isopropyl-alcohol#section=Computed-Properties (accessed on 12 July 2019).
- Mao, Y.; Sheng, X.; Pan, X. The effects of NaCl concentration and PH on the stability of hyperthermophilic protein Ssh10b. BMC Biochem. 2007, 8, 1–8. [Google Scholar] [CrossRef] [PubMed]
- Phong, W.N.; Show, P.L.; Teh, W.H.; Teh, T.X.; Lim, H.M.; binti Nazri, N.S.; Tan, C.H.; Chang, J.S.; Ling, T.C. Proteins recovery from wet microalgae using liquid biphasic flotation. Bioresour. Technol. 2017, 244, 1329–1336. [Google Scholar] [CrossRef] [PubMed]
- Ling, P.; Suffian, M.; Annuar, M.; Loke, P.; Chuan, T. Extractive bioconversion of poly-caprolactone by Burkholderia cepacia lipase in an aqueous two-phase system. Biochem. Eng. J. 2015, 101, 9–17. [Google Scholar]
- Ooi, C.W.; Tey, B.T.; Hii, S.L.; Ariff, A.; Wu, H.S.; Lan, J.C.W.; Juang, R.S.; Kamal, S.M.M.; Ling, T.C. Direct purification of Burkholderia Pseudomallei lipase from fermentation broth using aqueous two-phase systems. Biotechnol. Bioprocess. Eng. 2009, 101, 811–818. [Google Scholar] [CrossRef]
- Khoo, K.S.; Chew, K.W.; Ooi, C.W.; Ong, H.C.; Ling, T.C.; Show, P.L. Extraction of natural astaxanthin from Haematococcus pluvialis using liquid biphasic flotation system. Bioresour. Technol. 2019, 290, 121794. [Google Scholar] [CrossRef] [PubMed]


| No. | Condition | Initial Setting | Variables | Unit | Justification |
|---|---|---|---|---|---|
| 1. | Type of salt | - | Ammonium sulphate, Magnesium sulphate, Sodium sulphate, Dipotassium hydrogen phosphate, Disodium hydrogen phosphate | - | The salt that would result in the best yield was chosen from the five salts used |
| 2. | Type of alcohol | 2-Propanol | Ethanol, 1-Propanol, 2-Propanol | - | After the selection of salt was completed, the type of alcohol that would result in the best yield was determined |
| 3. | Concentration of salt | 20 | 150, 200, 250, 300, 350 | g/L | The percentage of salt was set according the Separation and Purification Technology Recovery of lipase derived from Burkholderia cenocepacia ST8 using sustainable aqueous two-phase flotation composed of recycling hydrophilic organic solvent and inorganic salt. |
| 4. | Concentration of alcohol | 100 | 60, 70, 80, 90, 100 | % | A total of 15 mL of top phase solution is added into the system and the concentration of alcohol adjusted by using deionized water. |
| 5. | Concentration of milk | 15 | 5, 10, 15, 20, 25 | % (w/v) | After the few parameters are stable, alteration of milk concentration begins. |
| 6. | pH | 9.15 | 6.5, 7, 7.5, 8, 9.15 | - | Condition of milk has been altered to set the right pH for the whole system. |
| 7. | Operation time | 10 | 5, 7.5, 10, 12.5, 15 | min | Initial setting without alcohol; after 10-min alcohol is added because no two-phase forming. |
© 2019 by the authors. Licensee MDPI, Basel, Switzerland. This article is an open access article distributed under the terms and conditions of the Creative Commons Attribution (CC BY) license (http://creativecommons.org/licenses/by/4.0/).
Share and Cite
Tham, P.E.; Ng, Y.J.; Sankaran, R.; Khoo, K.S.; Chew, K.W.; Yap, Y.J.; Malahubban, M.; Aziz Zakry, F.A.; Show, P.L. Recovery of Protein from Dairy Milk Waste Product Using Alcohol-Salt Liquid Biphasic Flotation. Processes 2019, 7, 875. https://doi.org/10.3390/pr7120875
Tham PE, Ng YJ, Sankaran R, Khoo KS, Chew KW, Yap YJ, Malahubban M, Aziz Zakry FA, Show PL. Recovery of Protein from Dairy Milk Waste Product Using Alcohol-Salt Liquid Biphasic Flotation. Processes. 2019; 7(12):875. https://doi.org/10.3390/pr7120875
Chicago/Turabian StyleTham, Pei En, Yan Jer Ng, Revathy Sankaran, Kuan Shiong Khoo, Kit Wayne Chew, Yee Jiun Yap, Masnindah Malahubban, Fitri Abdul Aziz Zakry, and Pau Loke Show. 2019. "Recovery of Protein from Dairy Milk Waste Product Using Alcohol-Salt Liquid Biphasic Flotation" Processes 7, no. 12: 875. https://doi.org/10.3390/pr7120875
APA StyleTham, P. E., Ng, Y. J., Sankaran, R., Khoo, K. S., Chew, K. W., Yap, Y. J., Malahubban, M., Aziz Zakry, F. A., & Show, P. L. (2019). Recovery of Protein from Dairy Milk Waste Product Using Alcohol-Salt Liquid Biphasic Flotation. Processes, 7(12), 875. https://doi.org/10.3390/pr7120875