Experimental and Numerical Study of Polymer-Retrofitted Masonry Walls under Gas Explosions


Abstract
:1. Introduction
2. Experiments
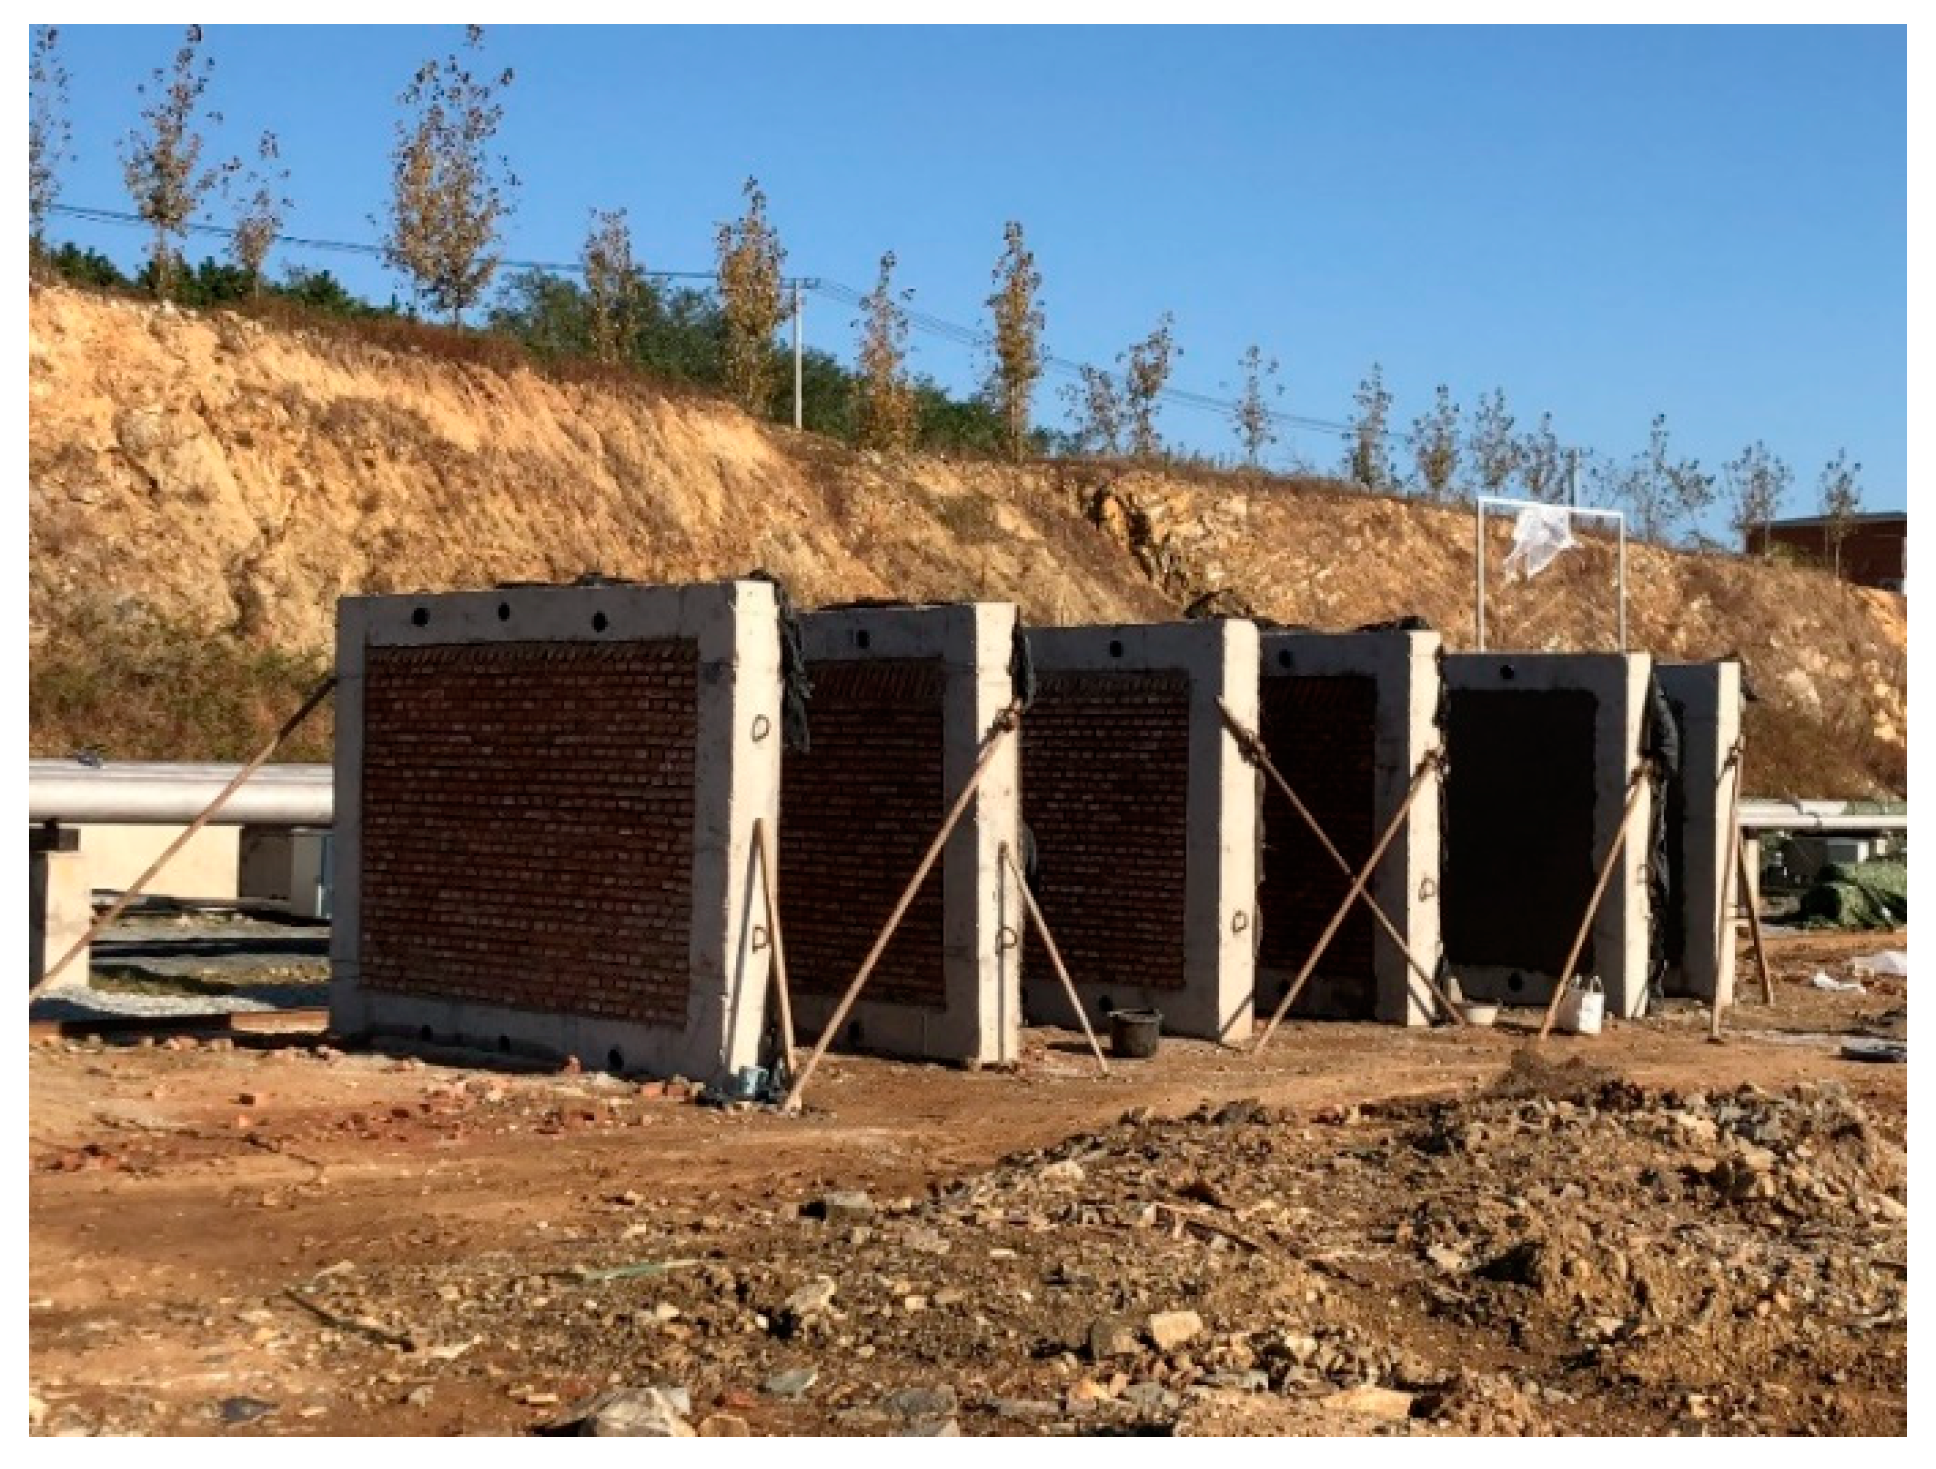
2.1. Wall Specimens
2.2. Gas Distribution Instruments
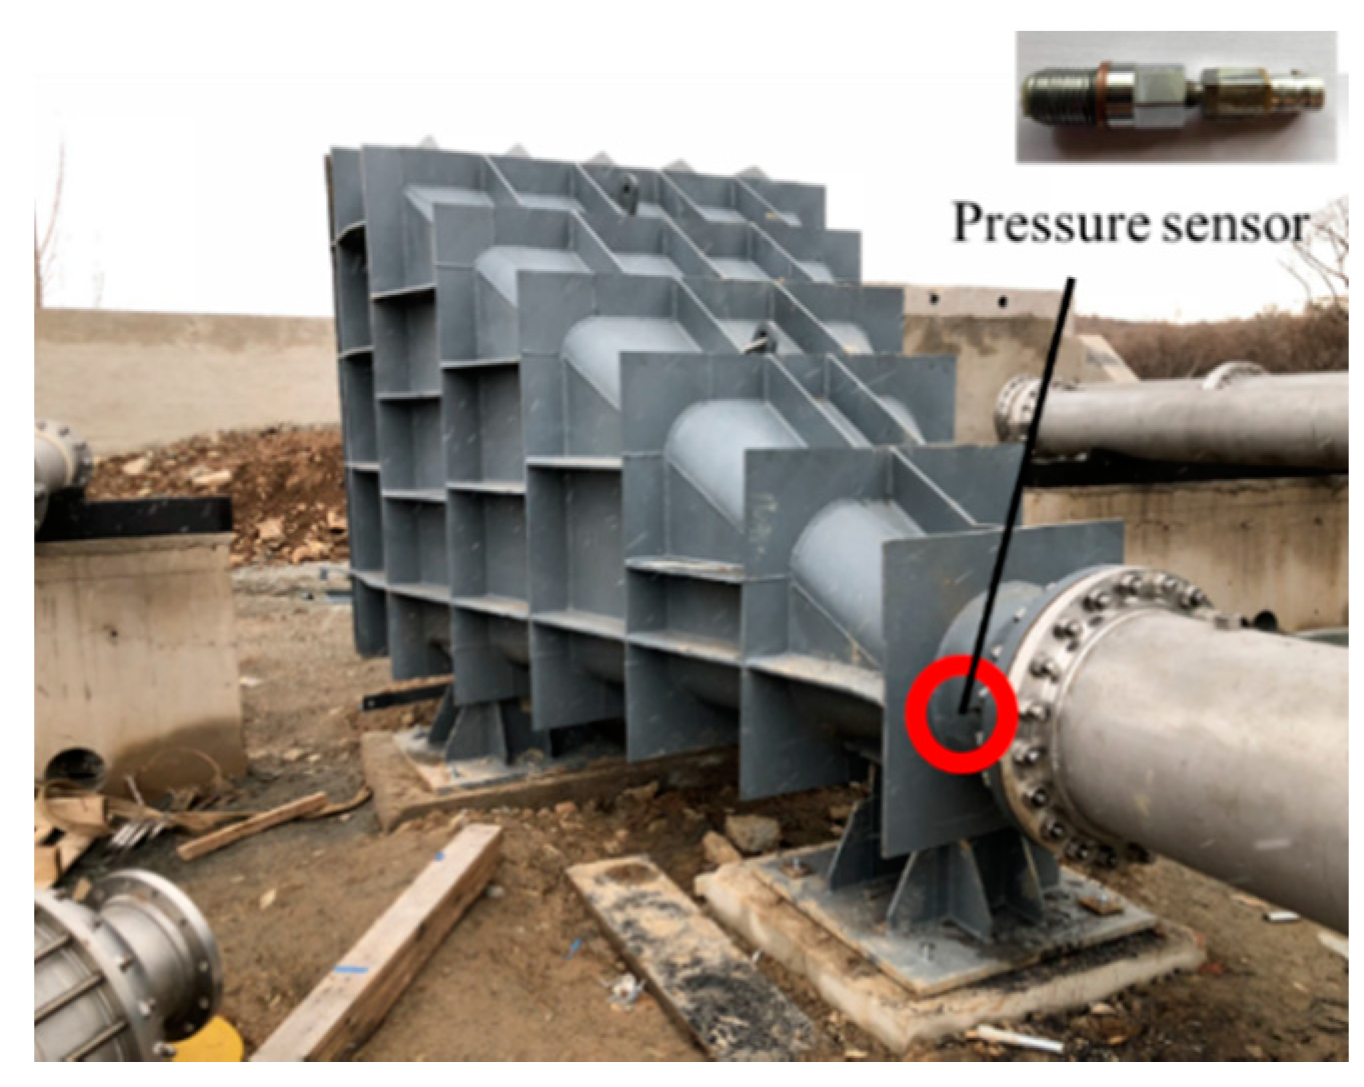
2.3. Device Main Body
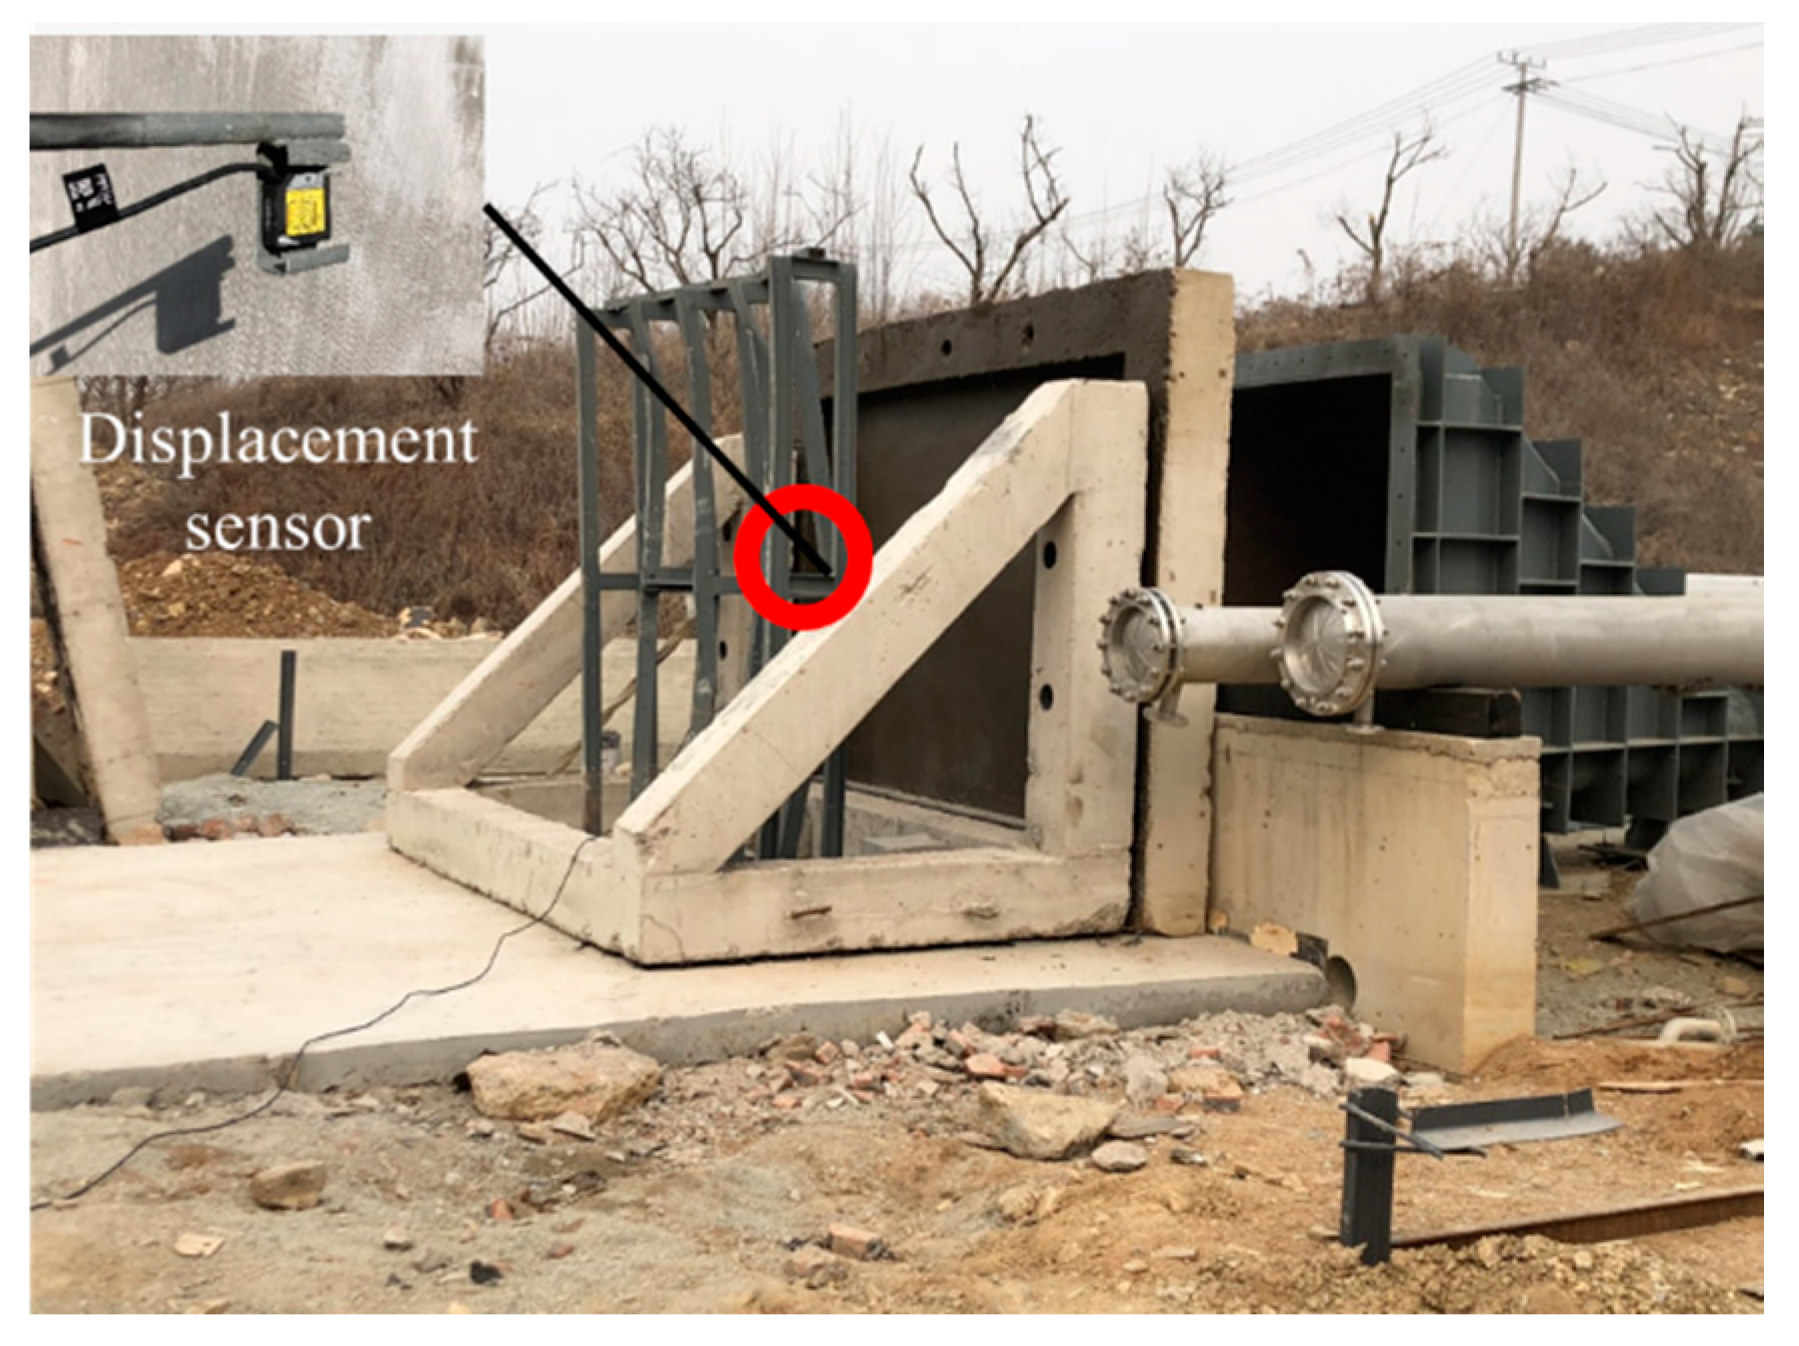
2.4. Data-Recording Instruments
2.5. Test Procedure
3. Testing Results and Discussion
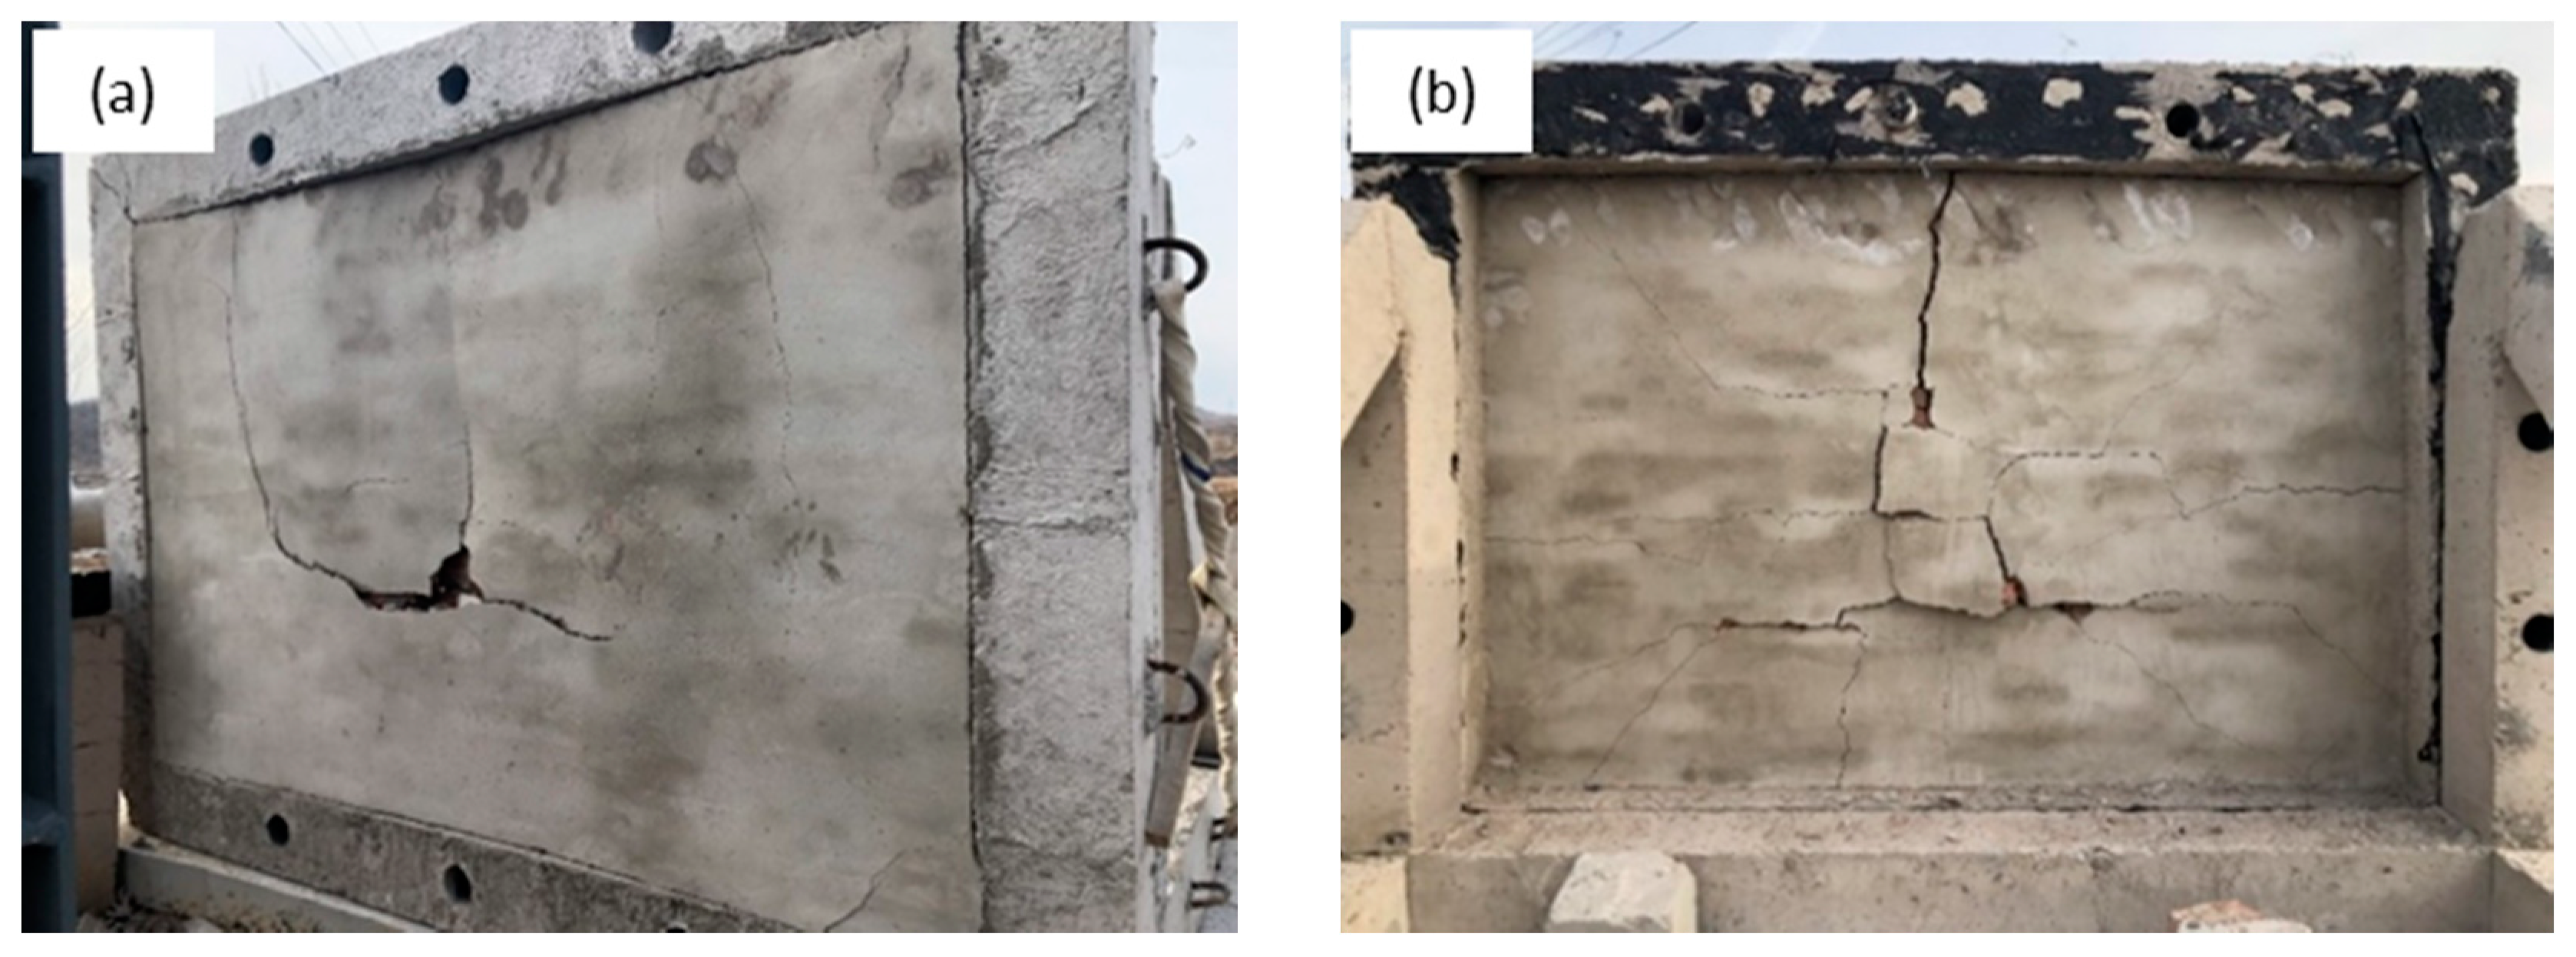
3.1. Unreinforced Wall
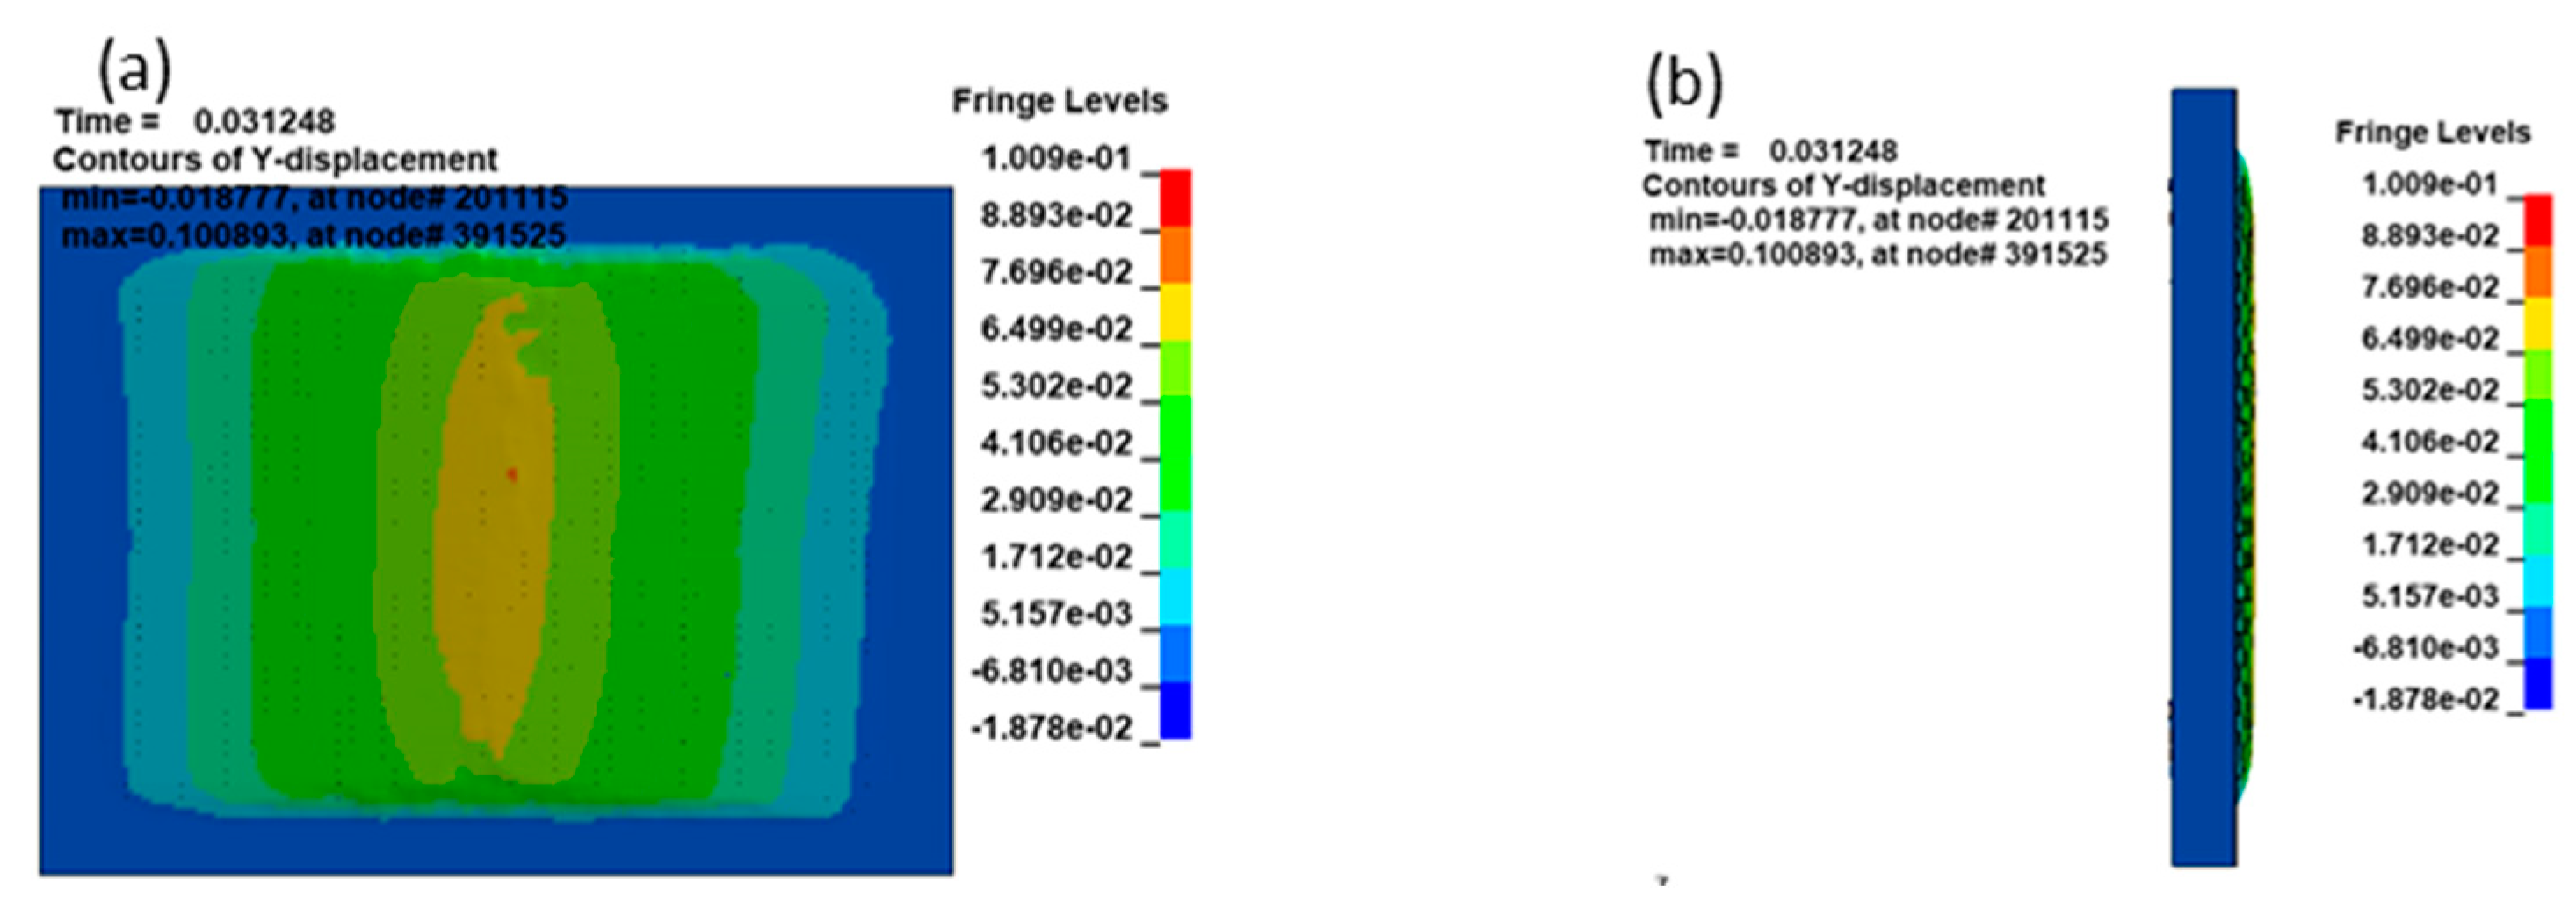
3.2. Polymer-Retrofitted Wall
4. Numerical Model
4.1. Material Parameters
4.2. Geometric Model
4.3. Numerical Model Calibration
5. Numerical Simulations
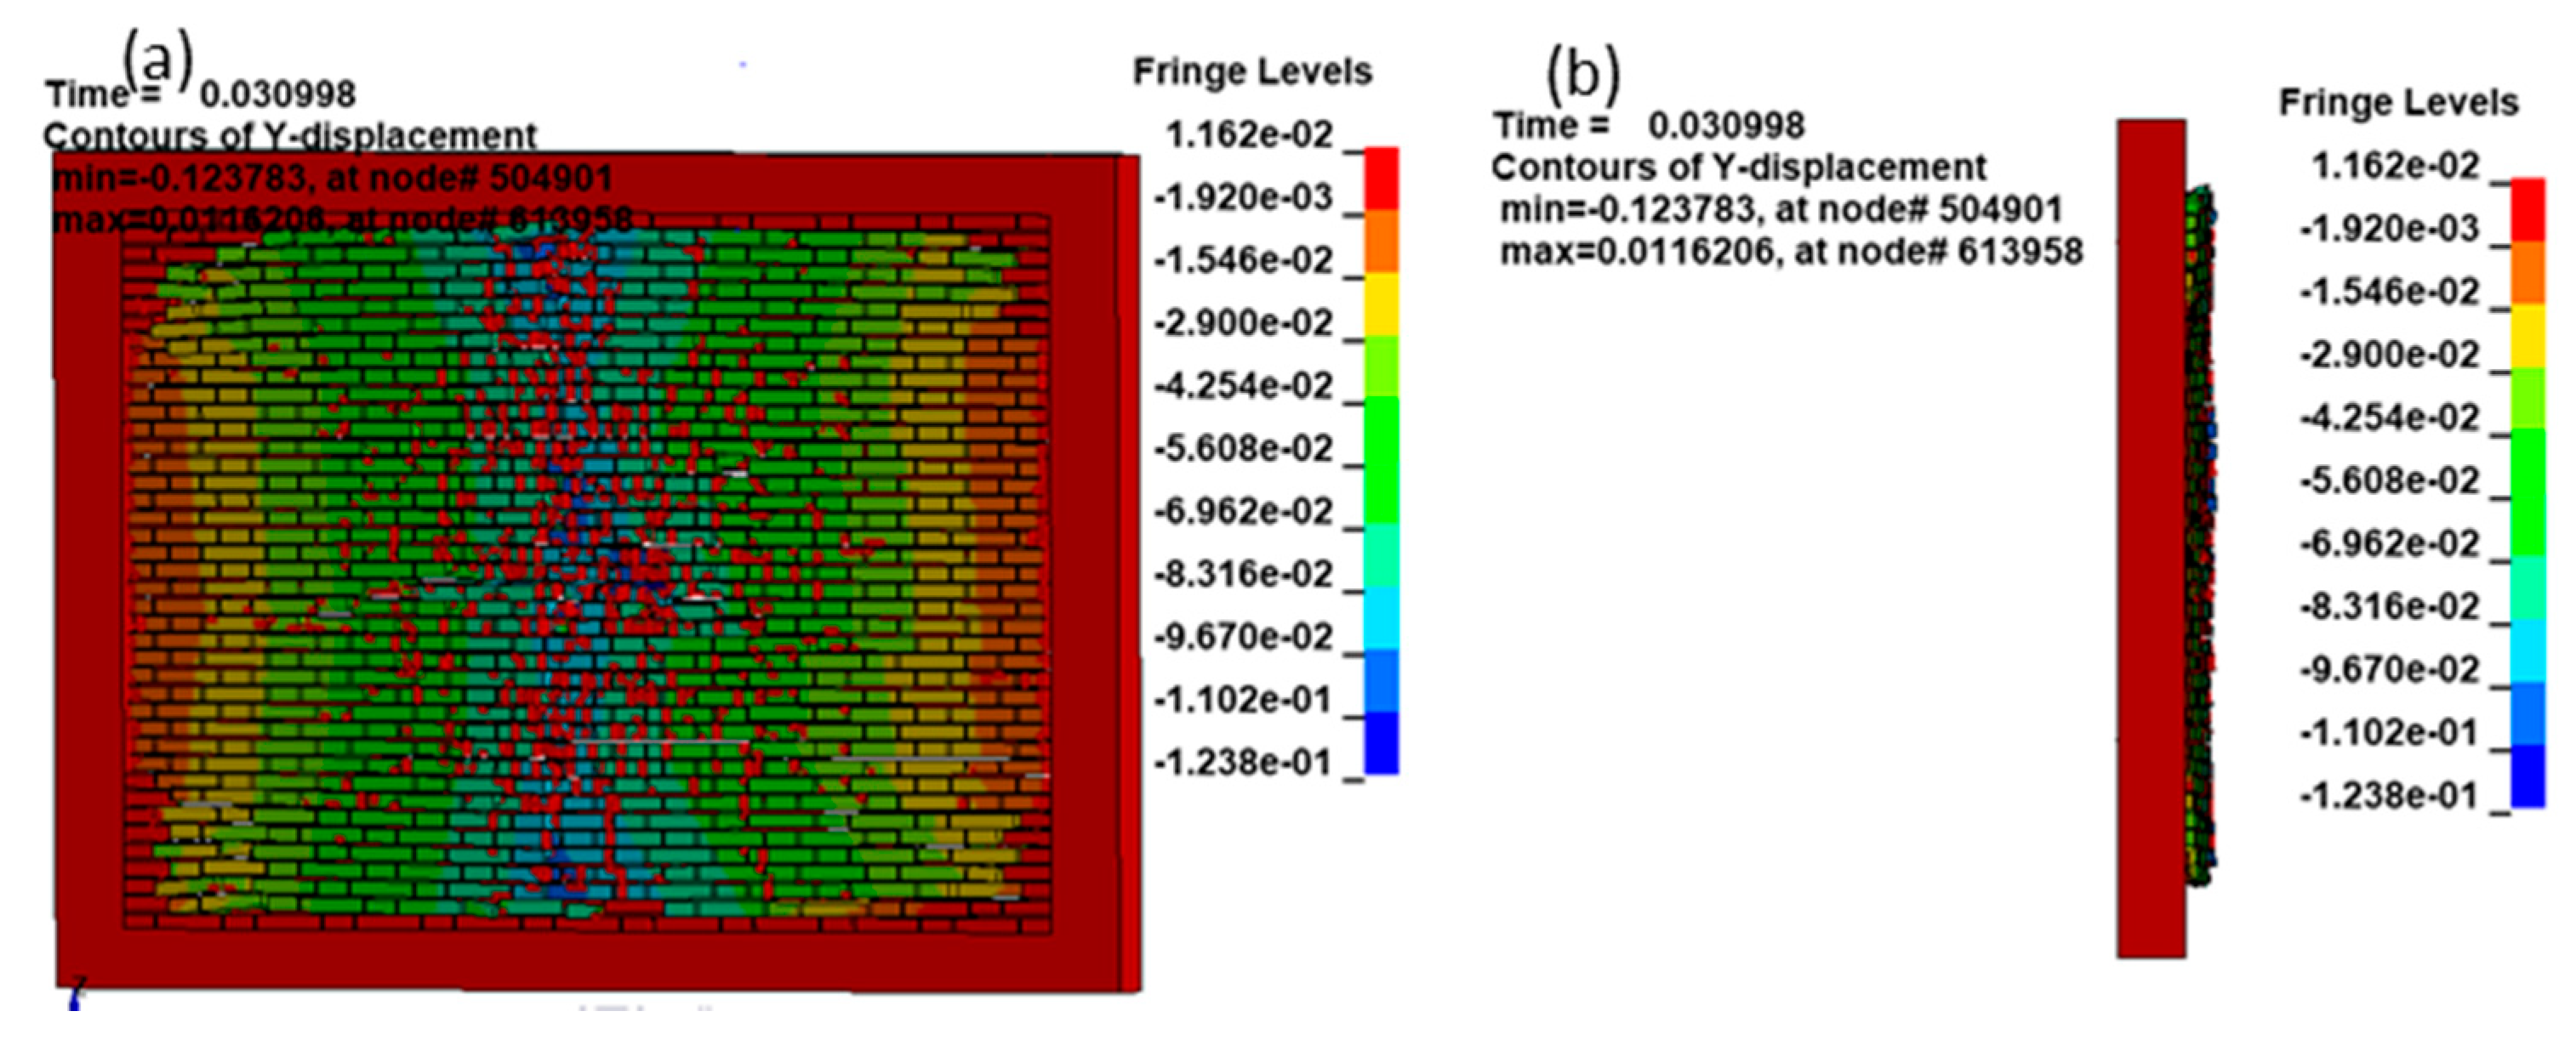
5.1. Unreinforced Wall
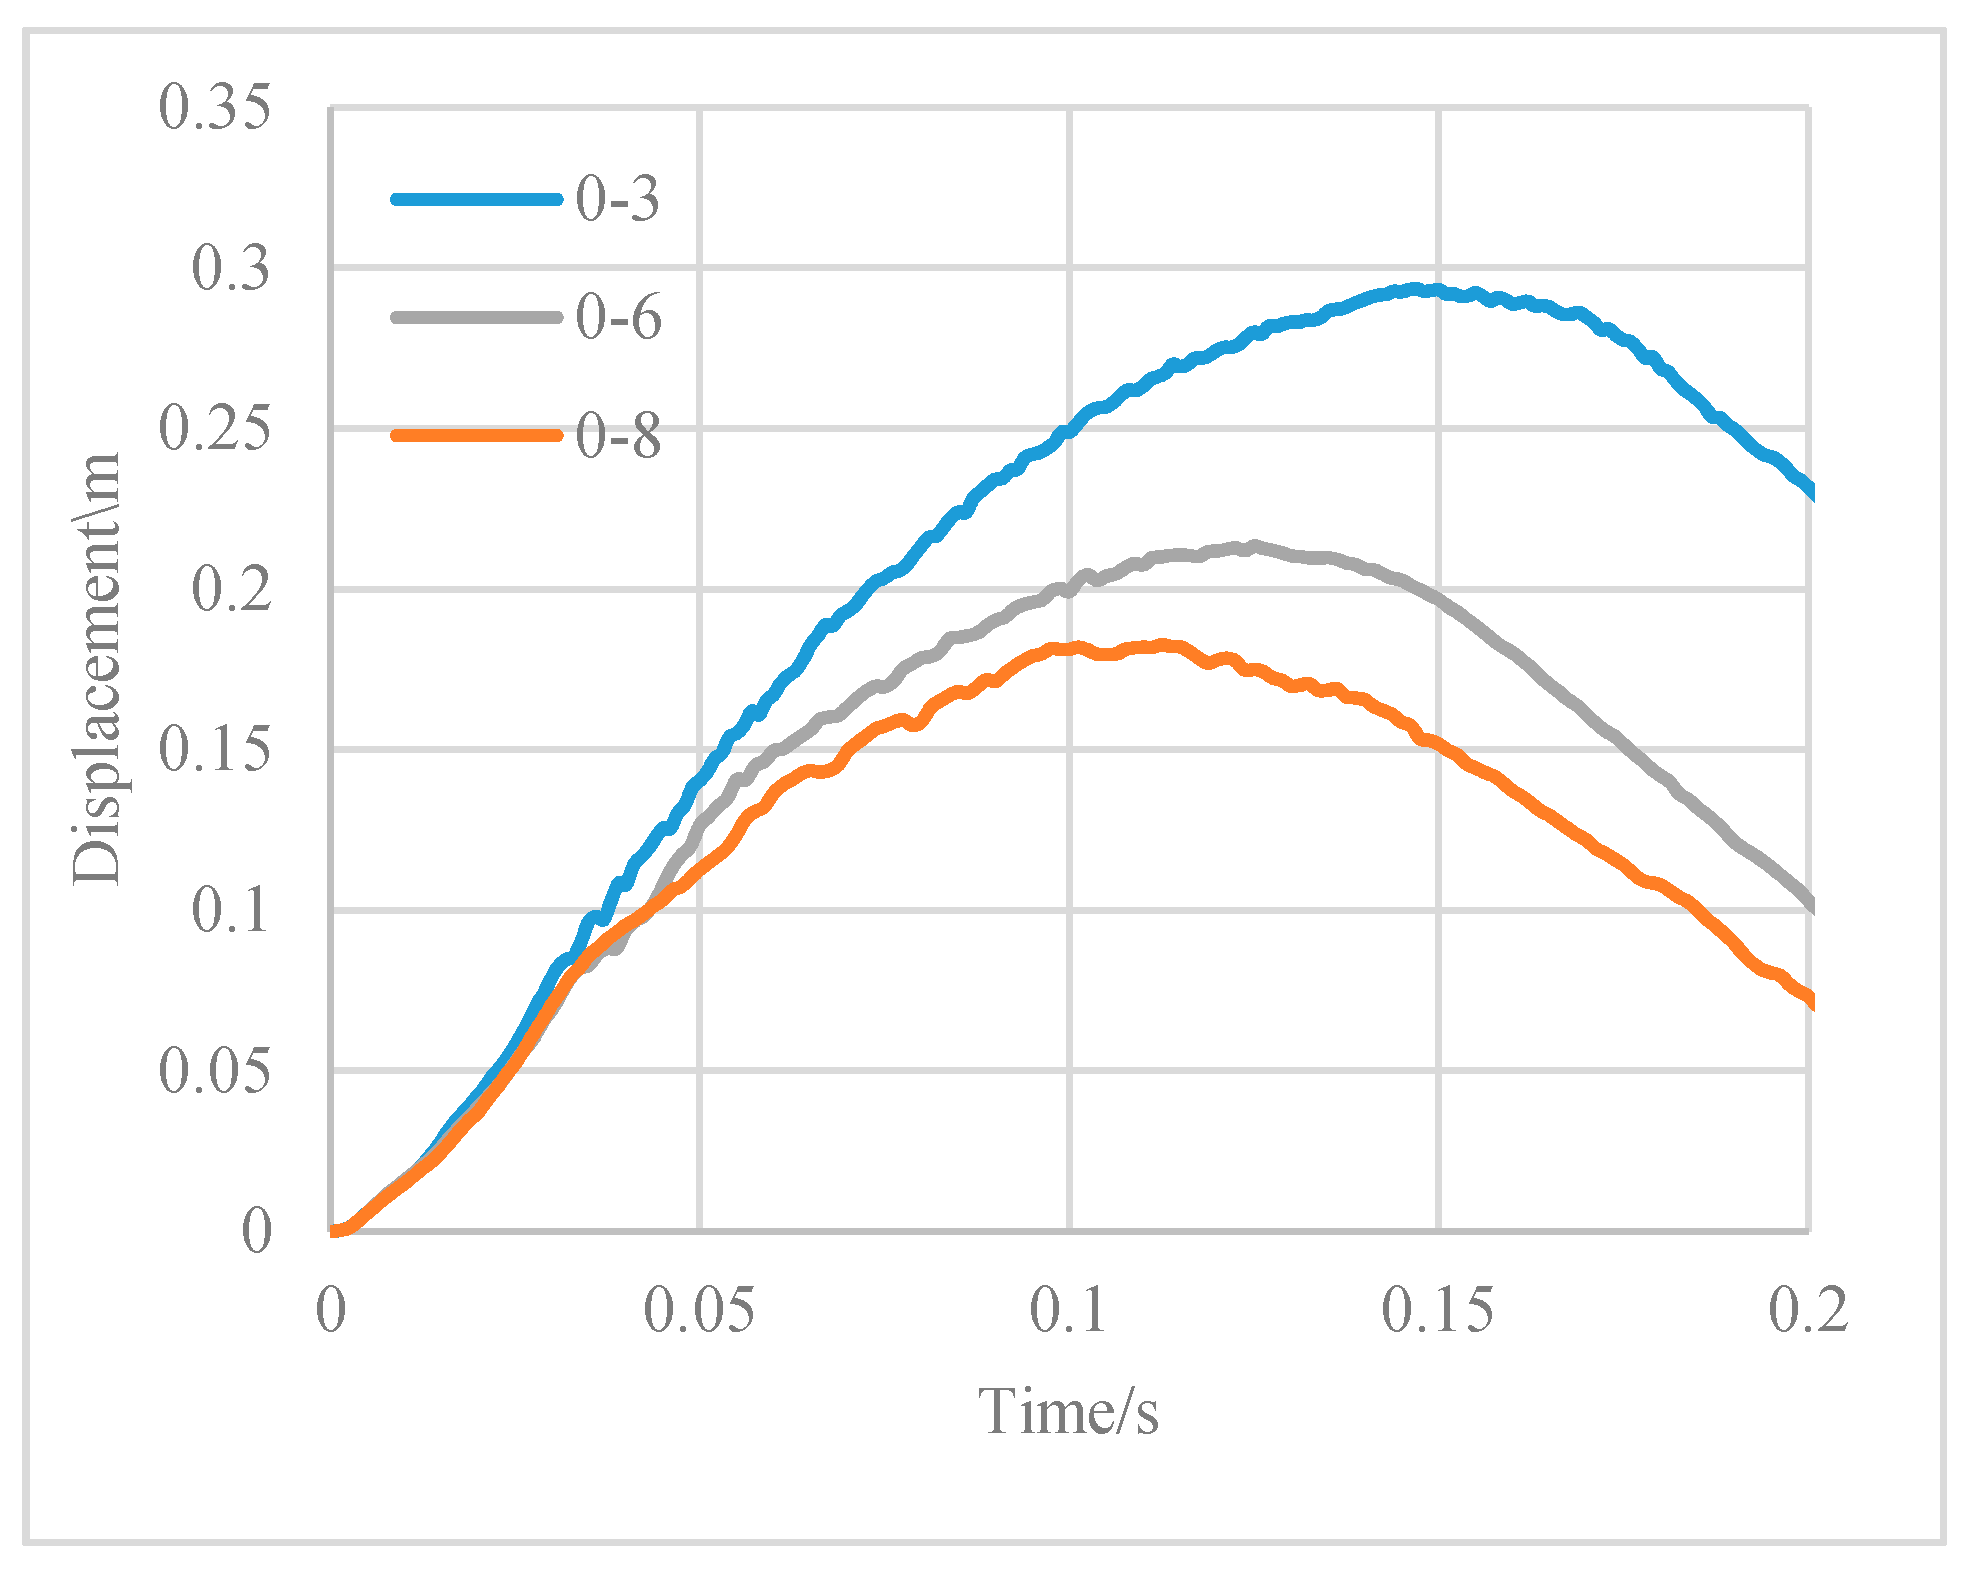
5.2. Coating Thickness
5.3. Spray Pattern
6. Conclusions
- (1)
- The wall damage modes under gas explosions were analyzed, the masonry walls experienced bending damage and then collapsed. The presence of the polyurea coatings could effectively improve the anti-explosion abilities of masonry walls, prevent wall collapses, and retain the flying fragments. Excellent reinforcement effect and no influence on normal production make polyurea coating an alternative method to strengthen existing petrochemical buildings.
- (2)
- The bond between the polymer and masonry wall is critical for the reinforcement effectiveness. Premature debonding results in a failure of the coating to exert the maximum energy absorption effect. Spraying operations should be carried out under suitable temperature and humidity conditions to improve the adhesion of the coating. Furthermore, steel angle can also be used to reinforce the coating around the frame.
- (3)
- When polyurea was sprayed only on the front face of a masonry wall, debris was still launched from the back of the wall. The blast-resistant ability of the front polyurea-coated wall was not significantly enhanced, and it was weaker than the rear and double-side polyurea-coated walls.
- (4)
- Compared with the rear polyurea-coated wall, the blast-resistant ability of the double-side polyurea-coated wall improved significantly. Double-sided reinforcement should be used in building reinforcement to improve the wall explosion resistance. Rear-face reinforcement can be selected when construction conditions are limited. In addition, the explosion resistance of masonry walls can be further improved by optimizing the combination of the spray method and coating thickness
Author Contributions
Funding
Conflicts of Interest
References
- Knox, K.J.; Hammons, M.I.; Lewis, T.T.; Porter, J.R.; Branch, F.P. Polymer Materials for Structural Retrofit, Florida: Force Protection Branch, Air Expeditionary Forces Technology Division; Air Force Research Laboratory, Tyndall AFB: Panama, FL, USA, 2000. [Google Scholar]
- Shi, Y.C.; Xiong, W.; Li, Z.X.; Xu, Q.F. Experimental studies on the local damage and fragments of unreinforced masonry walls under close-in explosions. Int. J. Impact. Eng. 2016, 90, 122–131. [Google Scholar] [CrossRef]
- Keys, R.A.; Clubley, S.K. Establishing a predictive method for blast induced masonry debris distribution using experimental and numerical methods. Eng. Fail. Anal. 2017, 82, 82–91. [Google Scholar] [CrossRef]
- Zapata, B.J.; Weggel, D.C. Collapse Study of an Unreinforced Masonry Bearing Wall Building Subjected to Internal Blast Loading. J. Perform. Constr. Fac. 2008, 22, 92–100. [Google Scholar] [CrossRef]
- Solveig, H.; Kristoffer, B.; Petter, I.; Svein, O.C. Global Response of a Three-Story Building Exposed to Blast Loading. Proceedings 2018, 2, 386–392. [Google Scholar]
- Wu, C.; Oehlers, D.J.; Rebentrost, M.; Leach, J.; Whittaker, A.S. Blast testing of ultra-high performance fibre and FRP-retrofitted concrete slabs. Eng. Struct. 2009, 31, 2060–2069. [Google Scholar] [CrossRef]
- Valluzzi, M.R.; Valdemarca, M.; Modena, C. Behavior of Brick Masonry Vaults Strengthened by FRP Laminates. J. Compos. Constr. 2001, 5, 163–169. [Google Scholar] [CrossRef]
- Alsayed, S.H.; Elsanadedy, H.; Al-Zaheri, Z.M.; Al-Salloum, Y.A.; Abbas, H. Blastresponse of GFRP-strengthened infill masonry walls. Constr. Build. Mater. 2016, 115, 438–451. [Google Scholar] [CrossRef]
- Elsanadedy, H.; Al-Salloum, Y.; Al-Zaheri, Z.; Alsayed, S.; Abbas, H. Behavior anddesign aspects of FRP-strengthened URM walls under out-of-plane loading. J. Compos. Constr. 2016, 20, 04016048. [Google Scholar] [CrossRef]
- Chen, Y.S.; Wang, B.; Zhang, B. Polyurea coating for foamed concrete panel: An efficient way to resist explosion. Def. Technol. 2019. [Google Scholar] [CrossRef]
- Mosallam, A.S. Out-of-plane flexural behavior of unreinforced red brick walls strengthened with FRP composites. Compos. Part. B Eng. 2007, 38, 559–574. [Google Scholar]
- Buchan, P.; Chen, J. Blast resistance of FRP composites and polymer strength-ened concrete and masonry structure sea state-of-the-art review. Compos. Part B Eng. 2007, 38, 509–522. [Google Scholar] [CrossRef]
- Davidson, J.S.; Fisher, J.W.; Hammons, M.I. Failure Mechanisms of Polymer-Reinforced Concrete Masonry Walls Subjected to Blast. J. Struct. Eng. 2005, 131, 1194–1205. [Google Scholar] [CrossRef]
- Davidson, J.S.; Porter, J.R.; Dinan, R.J. Explosive Testing of Polymer Retrofit Masonry Walls. J. Perform. Constr. Fac. 2004, 18, 100–106. [Google Scholar] [CrossRef]
- Wang, J.G.; Ren, H.; Wu, X.; Cai, C.L. Blast Response of Polymer-Retrofitted Masonry Unit Walls. Compos. Part. B Eng. 2017, 128, 174–181. [Google Scholar] [CrossRef]
- Moradi, L.G.; Davidson, J.S.; Dinan, R.J. Response of Bonded Membrane Retrofit Concrete Masonry Walls to Dynamic Pressure. J. Perform. Constr. Fac. 2009, 23, 72–80. [Google Scholar] [CrossRef]
- Li, Z.; Chen, L.; Fang, Q. Experimental and numerical study of unreinforced clay brick masonry walls subjected to vented gas explosions. Int. J. Impact. Eng. 2017, 104, 107–126. [Google Scholar] [CrossRef]
- Guiqiu, L.; Chuxian, S.; Yibiao, L. Analyses of the elastic modulus values of masonry. J. Hunan Univ. Nat. Sci. 2008, 35, 29–32. [Google Scholar]
- Chunyi, X.; Ming, L.; Haiying, Z. Experiment and numerical simulation on axial compressive performance of autoclaved fly ash solid brick masonry columns. Trans. Tianjin Univ. 2011, 17, 454–460. [Google Scholar]
- Weizhong, F.; Hao, Y. Research on the compression strength test of common clay brick by rebound measures. Res. Explor. 2013, 31, 35–37. [Google Scholar]
- Wang, H.; Deng, X.; Wu, H.; Pi, A.; Li, J.; Huang, F. Investigating the dynamic mechanical behaviors of polyurea through experimentation and modeling. Def. Technol. 2019. [Google Scholar] [CrossRef]
- GB50779-2012. Code for Design of Blast Resistant Control Building in Petrochemical Industry; Planning Press: Beijing, China, 2012. [Google Scholar]
- Bounds, W.L. (Ed.) Design of Blast Resistant Buildings in Petrochemical Facilities; ASCE: Reston, VI, USA, 2010. [Google Scholar]


| Researchers | Year | Structures | Strengthening Material | Experimental | Numerical | Theoretical |
|---|---|---|---|---|---|---|
| Zapata and Weggel [4] | 2008 | Brick walls | − | Explosive | SDOF | |
| Shi et al. [2] | 2016 | Clay brick walls | − | Explosive | YES | |
| Keys and Clubley [3] | 2017 | London brick walls | − | Explosive | AEM | |
| Li et al. [17] | 2017 | Clay brick walls | − | Gas explosion | LS-DYNA | |
| Solveig et al. [5] | 2018 | RC walls, Leca block walls | − | Explosive | ConWep and LS-DYNA | |
| Valluzzi et al. [7] | 2001 | Brick masonry vaults | GFRP, CFRP | Static | YES | |
| Davidson et al. [13,14] | 2005 | CMU walls | Sprayed-on polymer | Explosive | DYNA3D | |
| Alsayed et al. [8] | 2016 | CMU walls | GFRP | Explosive | AUTODYN | |
| Elsanadedy et al. [9] | 2016 | CMU walls | GFRP | Static | YES | |
| Wang et al. [15] | 2016 | Clay brick, AAC | Sprayed-on polymer | Explosive | ||
| chen et al. [10] | 2019 | AAC panels | CFRP/sprayed-on polymer | Explosive |
| Density (kg/m3) | Young Modulus (MPa) | Poisson’s Ratio | Tensile Strength (MPa) | Shear Strength (MPa) | Compressive Yield Stress (MPa) | Fracture Toughness (N/m) | Shear Retention Factor | |
|---|---|---|---|---|---|---|---|---|
| Brick | 1800 | 15,400 | 0.15 | 1 | 0.5 | 19.4 | 120 | 0.03 |
| Mortar | 2100 | 4450 | 0.25 | 0.297 | 0.9 | 8.9 | 140 | 0.03 |
| Density (kg/m³) | Elasticity Modulus (MPa) | Poisson’s Ratio | Tensile Strength (MPa) | Tear Resistance (N/m) | Elongation (%) |
|---|---|---|---|---|---|
| 1000 | 100 | 0.4 | 15.4 | 105 | 200 |
© 2019 by the authors. Licensee MDPI, Basel, Switzerland. This article is an open access article distributed under the terms and conditions of the Creative Commons Attribution (CC BY) license (http://creativecommons.org/licenses/by/4.0/).
Share and Cite
Gu, M.; Ling, X.; Wang, H.; Yu, A.; Chen, G. Experimental and Numerical Study of Polymer-Retrofitted Masonry Walls under Gas Explosions. Processes 2019, 7, 863. https://doi.org/10.3390/pr7120863
Gu M, Ling X, Wang H, Yu A, Chen G. Experimental and Numerical Study of Polymer-Retrofitted Masonry Walls under Gas Explosions. Processes. 2019; 7(12):863. https://doi.org/10.3390/pr7120863
Chicago/Turabian StyleGu, Meng, Xiaodong Ling, Hanxiang Wang, Anfeng Yu, and Guoxin Chen. 2019. "Experimental and Numerical Study of Polymer-Retrofitted Masonry Walls under Gas Explosions" Processes 7, no. 12: 863. https://doi.org/10.3390/pr7120863
APA StyleGu, M., Ling, X., Wang, H., Yu, A., & Chen, G. (2019). Experimental and Numerical Study of Polymer-Retrofitted Masonry Walls under Gas Explosions. Processes, 7(12), 863. https://doi.org/10.3390/pr7120863