Article

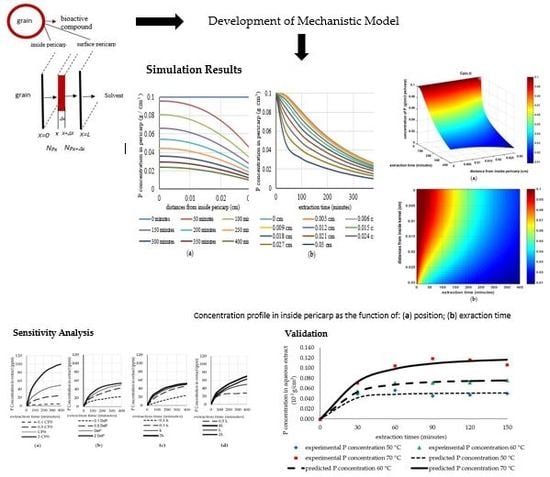
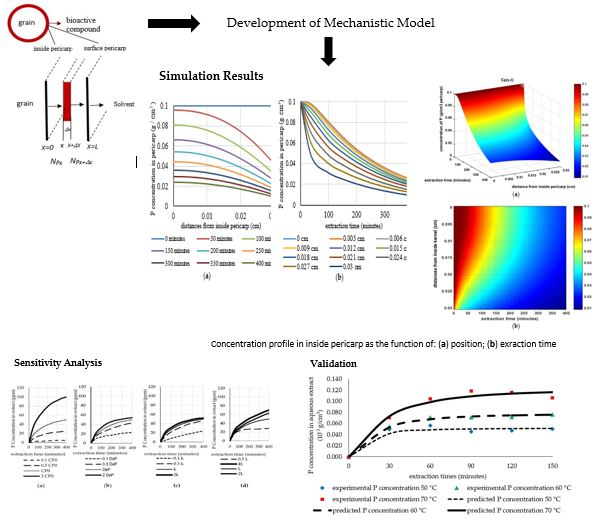
A Mechanistic Model of Mass Transfer in the Extraction of Bioactive Compounds from Intact Sorghum Pericarp

by
Devi Yuni Susanti
1,2,
Wahyudi Budi Sediawan
1,*,
Mohammad Fahrurrozi
1 and
Muslikhin Hidayat
1
1
Department of Chemical Engineering, Faculty of Engineering, Universitas Gadjah Mada, Jl. Grafika No. 2, Yogyakarta 55281, Indonesia
2
Department of Agricultural & Biosystems Engineering, Faculty of Agricultural Technology, Universitas Gadjah Mada, Jl. Flora No. 1, Yogyakarta 55281, Indonesia
*
Author to whom correspondence should be addressed.
Processes 2019, 7(11), 837; https://doi.org/10.3390/pr7110837
Submission received: 14 October 2019 / Revised: 26 October 2019 / Accepted: 28 October 2019 / Published: 9 November 2019
(This article belongs to the Section Process Control and Monitoring)

Abstract

:
The extraction of phytochemical compounds from intact red sorghum grains was developed as an alternative process for producing bioactive material in the pharmaceutical industry. A mechanistic model is needed to better understand the process and enable predictive simulations for designing commercial-scale extraction systems. This paper presents a mathematical model for predicting phytochemical concentrations in the solvent and inside the pericarp of the grain at different positions during the extraction. The model is based on the mass transfer mechanism from inside the pericarp to its solid surface by diffusion, and then from the surface to a solvent during the extraction of bioactive compounds. It was numerically solved while using finite-difference approximation. The parameters considered were effective diffusivity inside the pericarp (Dep), mass transfer coefficient from the pericarp surface to the solvent (kc), and distribution coefficient (H). The model simulates the extraction performance, including the yield and the concentrations of bioactive compound in the extract and inside the pericarp at various positions and times. A sensitivity analysis of the changes in each involved parameter provided sufficient information for increasing the performance of the model. A validation test that compared the results of the simulation with those of established analytical solutions showed that the model has high accuracy. Hence, the model can be applied in quantitative evaluations to improve productivity in the pharmaceutical industry.

Graphical Abstract

1. Introduction

The development of extraction methods to obtain phytochemical compounds from plants as a source of food supplements and medicines remains attractive [1,2,3,4]. Several methods have been applied to improve the extraction process in the pharmaceuticals and food industry [5,6]. This interest is related to the increasing public demand for natural medicines [7].
A range of phytochemical compounds, as secondary metabolites of plants [8], are naturally contained in some plants as well as red sorghum grains. The phytochemical compounds in red sorghum, including polyphenols, phenolic acids, flavonoids, and condensed tannins of proanthocyanidins [9], are concentrated on the external layer of the grain, which is known as pericarp. These compounds have proven to have beneficial health effects, such as antioxidant, anti-proliferative, UV adsorption, and antimicrobial activities [9,10,11]. Proanthocyanidins are recognized to be excellent anticancer and antioxidant agents. The antioxidant activity of proanthocyanidins has been evaluated on the basis of their radical scavenging activity in 2,2-Diphenyl-1-picrylhydrazyl (DPPH) assays, iron (II) chelating ability (ICA), and oxygen radical absorbance capacity (ORAC) [8]. As powerful antioxidant and antibacterial agents, these compounds are very useful as diet supplements, medicines, nutraceuticals, pharmaceuticals [10], pigments, and food additives to preserve food quality from deterioration and rancidity [1,2].
In previous studies [12,13,14], the extraction methods were designed with the aim of developing technology for the food and pharmaceutical industries, i.e., technology for the isolation, identification, quantitative analysis, and evaluation of the antioxidant and antibacterial activity of the compounds of interest. Furthermore, some studies focused on designing new methods of extraction that were safe, cheap, efficient, and effective in producing extracts in a high quantity and of high quality [4,8,15,16,17,18,19]. Several techniques were developed to obtain standard extraction procedures to be applied for the extraction of functional compounds to meet the needs of the pharmaceutical, food, and chemical industries [1,9,20,21,22].
Commonly, the extraction of bioactive compounds from sorghum is carried out while using conventional methods that apply hot water and maceration to sorghum bran [9,19]. Maceration and hot water extraction are basic methods of solid–liquid extraction for separating and isolating active compounds from their original locations in the plant body [1] as well as for transferring them into the solvent, a process that is usually driven by natural convection. These methods use solvents in which the solid material is immersed. The compounds of interest are transferred into the solvent, and the solvent phase is then separated from the solid for further processing to recover the solutes. Chemical, enzymatic, and physical processes have been applied to improve the extraction yield. In solid–liquid extraction, extractable bioactive compounds are transferred to the solvent phase [17]. Subsequently, the extractable compounds that are released into the solution are purified to produce bioactive agents.
Some difficulties with the extraction of phytochemical compounds from sorghum bran can occur during the separation of the pericarp from the grain, and the precipitation of the gelatinized starch can stick to the bran during hot extraction. The gelatinization can also hamper the release of functional compounds from the bran.
In this study, a method for extracting bioactive compounds from intact sorghum was developed for simplifying the process and increasing the extract yield by avoiding the gelatinization of the starch that is present in the bran. The developed method is simpler than those that are commonly used, does not require the hulling process to be used to remove pericarp debris, and it can be easily applied in the industry. In addition, the remaining solid can be further processed into sorghum flour. This method has the potential to be applied in the production of pharmaceutical and food additives. It was evaluated by measuring its efficiency, cost, and energy consumption and the quantity and quality of the extracted compounds [9].
To design an extraction system with reduced energy, material, and time consumption, mathematical models that describe phenomena that occur during solid–liquid extraction processes are indispensable [23,24]. To determine the extraction kinetics, provide evidence for supporting the feasibility of the developed procedure, and ensuring the best product reproducibility, a mathematical model is needed [25,26]. Mathematical and computational models have been developed for the optimization [27] and the evaluation of a process and for the determination of the most effective procedure for and the simulation of phenomena during the extraction of bioactive compounds from a starting material [17].
Currently, there are empirical and mechanistic approaches to developing models [28]. Several kinetics models of extraction have been developed while using empirical approaches, including Peleg’s model, Page’s model, and logarithmic models [4,8,22,23], which use experimental data to determine important variables for designing, optimizing, and controlling the extraction process [2]. Extraction models have also been developed on the basis of the mass transfer concept [24,25] and the equilibrium concept [5,26]. A mechanistic model of extraction can be built from a series of theoretical mass transfer processes during extraction. The process consists of integrating steps, solving several involved parameters, model simulation, sensitivity analysis, and model validation to satisfy the need for technical information that is related to the models and the verification of the simulation [27].
The precise mathematical model that is applied for quantitative description in this study is built on the mass transfer concept in the overall diffusion system. The mechanism of mass transfer of a phytochemical compound during extraction that is released from intact pericarp to the solvent is very useful to the study for supporting the design process of commercial-scale extraction systems. Commonly, solid–liquid extraction consists of solvent penetration into solid–porous media, dissolution of extractable compounds from a solid matrix, and the mass transfer of compounds through media by diffusion and from the interface of the porous media to the bulk of the solvent by convection [17].
Numerical solution has commonly been applied as a method for complex models [1,26]. The important involved parameters in extraction can be estimated through simulation by utilizing the developed mathematical model [2]. Simulation is also very useful for theoretically predicting the performance of an extraction process. Simulation results can guide the design of commercial extraction systems [29]. A better quantitative understanding of the mass transfer mechanism is also needed to support decision-making in process design and evaluation and the operation of new product or commercial extraction systems [30,31].
The form of a mathematical model is strongly affected by the mechanism of the process. Simplifications are often used to reduce a model’s complexity. The degree of simplification will directly affect the accuracy of the model. In this study, a mathematical model for describing the process of extracting a bioactive compound from red sorghum grain is constructed based on the theoretical concept of a mass transfer mechanism. The proposed mechanistic model is designed to predict the concentration of the compounds in liquid extracts and the concentration distribution of the compound in the pericarp at various positions and times in a batch extraction.
The purpose of this paper is to present the development and performance evaluation of the mechanistic model. The performance was evaluated based on the model’s capability to predict the phytochemical concentrations in an aqueous extract and its ability to show reasonable concentration profiles inside the pericarp of red sorghum grain at various times during batch extraction. The evaluation also tested the sensitivity of the model to changes in some of the involved parameters, i.e., the initial concentration, the effective diffusivity, the mass transfer coefficient, and the slab thickness, in determining the product yield. Comparing the simulation results with the analytical solutions for simple cases as well as with experimental data validated the model and the simulation.

2. Methods

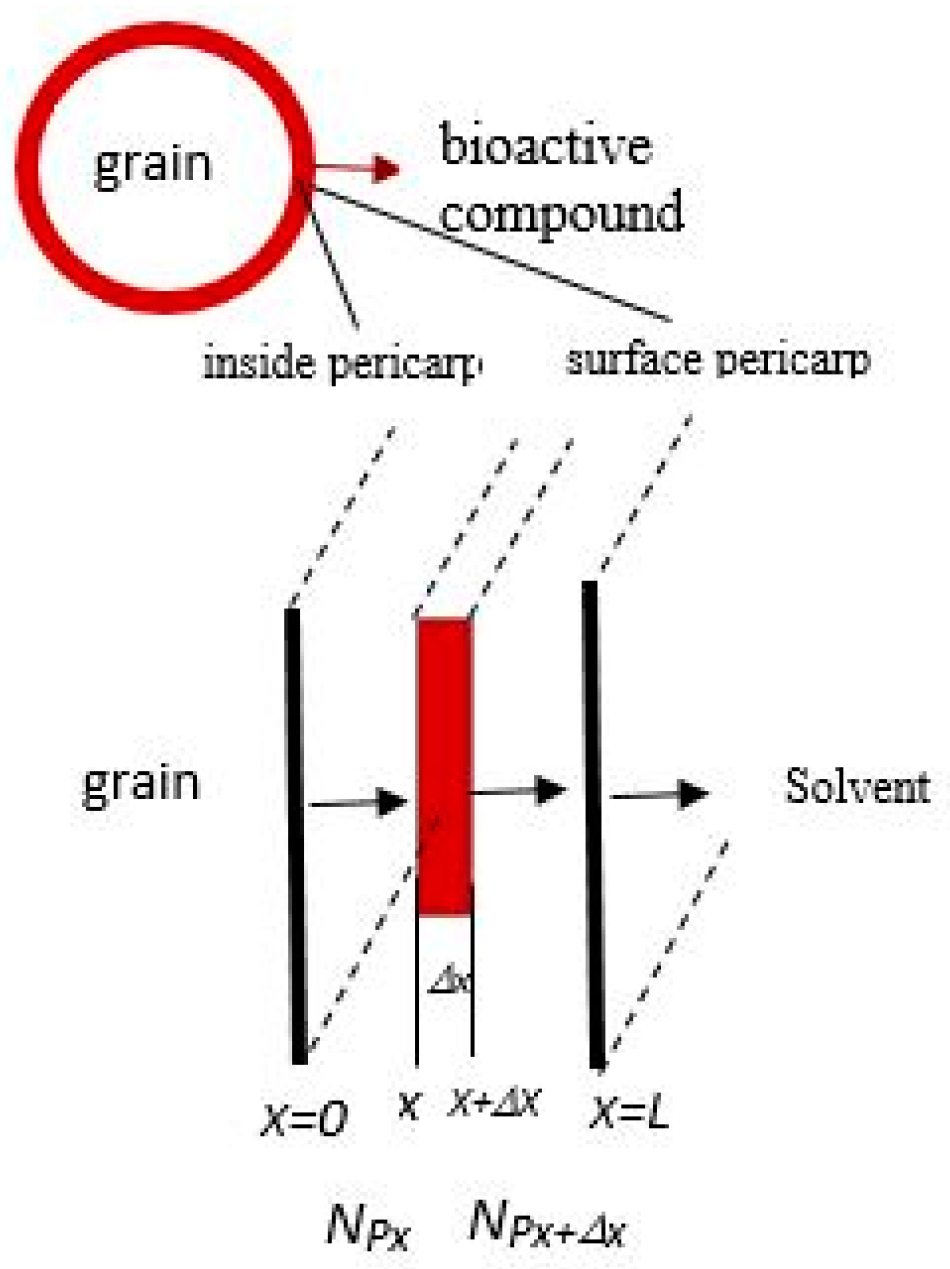
2.1. Model Development

The quantitative model was designed based on the proposed mechanism, in which the solute diffuses from inside the pericarp to the surface of the solid and then from the surface of the solid to the bulk of the solvent. The equation of the diffusion inside the pericarp is set up while using the volume element, as shown in Figure 1. The pericarp layer was assumed to be a slab since the thickness of the pericarp is relatively small when compared to the radius of the intact grain. However, in calculating the interfacial area between the grains and the liquid, the surface area was considered to be a slab that covers the grain, which was assumed to be spherical. This assumption is reasonable, since, in the solution in the partial differential equation of the solute inside the particle, the interfacial area has no effect (it is cancelled out).
The diffusion from inside the pericarp to the surface of the pericarp is described while using Fick’s Law, as shown in Equation (1) [32].
N p = D e P C P x
where NP is the mass flux of the phytochemical compound or P compound (g/min. cm2), CP is the concentration of P compound in a solid (g/cm3), DeP is the effective diffusivity (cm2/min), and x is the position (cm). The mass transfer from the surface of the pericarp to the bulk of the solvent is described while using film theory, as shown in Equation (2).
N P = k c ·   ( C * P f C p f )   and   C * P f = H · C p
where kc is the mass transfer coefficient (cm/min), C p f   is the concentration of P in the solid surface (g/cm3), and C * P f is the concentration of P in the solvent (g/cm3 solvent), which is in equilibrium with the concentration of P in the solid surface.
The method for building the mechanistic model was done by setting-up the materials balance of P and the terms were then substituted by the relevant mass transfer rate equations. The involved parameters are effective diffusivity inside the pericarp (DeP), mass transfer coefficient from the surface of the solid to the bulk of the liquid (kc), and coefficient distribution (H). The system of extraction was conducted in a stirred tank extractor, in which the grains (Nb particles) are immersed in a solvent of volume V. The details of the derivation of the model are presented in this section.
The extraction process begins when the solvent reaches the solute in the solid structure through pores within the solid phase or through absorption into the dense solid matrix [32]. We adopted the following assumptions in order to set up the mathematical model:
  • The phytochemical compounds of sorghum (phenolic compounds, mainly condensed tannin or proanthocyanidins) are located in the pericarp of a sorghum grain [33].
  • The sorghum grain is assumed to have a spherical shape with an average radius of R.
  • The geometry of an intact pericarp is assumed to be a slab of thickness L that covers the spherical sorghum grain, since the pericarp’s thickness is very thin when compared to the size of the pericarp.
  • The mechanism of extraction from the slab consists of the following steps [34,35]:
    • P compound diffuses from the inside part of the pericarp to the surface of the pericarp, and the rate of diffusion is assumed to follow Fick’s diffusion law with an effective diffusivity of Dep.
    • P compound is transferred from the surface of the pericarp to the bulk of the liquid.
  • The pericarp is a homogenous medium; the position of the pericarp is between x = 0 and x = L.
  • The effective diffusivity of P ( D e P ) is assumed to be constant.
  • The solid–liquid equilibrium of P follows the coefficient distribution model with a distribution coefficient value of H (Equation (2)).
  • The solvent’s penetration to the pericarp is relatively fast when compared with the diffusion process, so it does not control the overall process of mass transfer of P [12].
The rate of the overall process can be controlled by the diffusion of P with the effective diffusivity value of DeP by assuming that the rate of solvent penetration and the dissolution of P to the solvent are much faster than diffusion processes [35]. The whole process is transient (unsteady state) (Equation (10)). The mass balance equation is applied to the volume element, as shown in Figure 1. The volume element in the solid is of thickness ∆x and it has the cross-section area S. The mass balance of P in the volume element is as follows.
Rate of mass input—Rate of mass output = Rate of mass accumulation
S · N P | x     S · N P | x + Δ x   = t ( S · Δ x · C P )
N P | x + Δ x N P | x Δ x   = C P t .
When Δx is taken to be infinitely small, Equation (4) becomes Equation (5).
N P x   = C P t
Equation (1) is substituted into Equation (5) to produce Equations (6) and (7).
x ( D e P   C P x ) = C P t
2 C P x 2 = 1 D e P · C P t
The initial condition for Equation (7) is as in Equation (8).
C p ( x , 0 ) = C P 0
The boundary conditions are:
D e P C P t ( 0 , t ) = 0
D e P · C P x ( L , t ) = k c · ( H · C P ( L , t ) C P f ) .
The material balance in the bulk of the liquid of volume V in which Nb grains of red sorghum are immersed is described as in Equation (11) or Equation (12).
Rate of mass input in solvent—Rate of mass output from solvent = Rate of accumulation
k c · ( H · C P ( L , t ) C P f ) · 4 · π ·   R 2 · N b 0 = d d t ( V · C P f )
d C P f d t = 4 · π ·   R 2 · N b k c V · ( H · C P ( L , t ) C P f ) .

2.2. Model Solution and Simulation

The mathematical models were then solved by applying finite difference approximation (FDA), in which the partial differential equation (PDE) is converted to algebraic equations. FDA for Equation (7) results in:
  [ C P ] i , j + 1 = 1 · [ C P ] i 1 , j + ( 1 2 α ) [ C P ] i , j + 1 α · [ C P ] i + 1 , j
where:
α = ( Δ x ) 2 D e P · Δ t .
The FDA for Equation (9) is as follows:
[ C P ] 0 , j + 1 = [ C P ] 1 , j + 1 .
Equation (10) is approximated by:
[ C P ] n , j + 1   =   · ( 1 γ 1 τ + 1 ) · [ C P ] n , j + 1 γ · [ C P ] n 1 , j + 1 τ . H · C P f
where:
1 γ = 2 · Δ t · D e ( Δ x ) 2
1 τ = 2 · k c · Δ t Δ x .
The FDA for the equation for the concentration in the liquid (Equation (12)) is:
[ C P f ] j + 1 = H β · [ C P ] n . j + ( 1 1 β ) · [ C P f ] j
where:
β = V Δ t · 4 · π · R 2 · N b · k c .
The numerical solution was then obtained by a computer programme.

2.3. Validation

The validation of the model was carried out using an experimental data series of condensed tannin (CT) or proanthocyanidin (P) concentration in solvent as a function of extraction time. The extraction was conducted in hot maceration.

2.3.1. Pretreatment of Red Sorghum Grains

Sorghum Bicolor (L.) Moench grains were purchased from a local market in Indonesia. The sorghum grains had a pericarp thickness of 0.01 cm, an average grain radius of 0.19 cm, and an initial P concentration in pericarp of 0.1263 g Pequivalent/cm3 pericarp. The grains were cleaned and dried before extraction. The grains were dried while using a sun drier for 10 h over two successive days.

2.3.2. Extraction Process

The extraction of red sorghum grains was conducted by soaking 178 red grains in 45 mL of free-volume aqueous water in a bottle for 150 min. The extraction conditions were hot maceration at 50, 60, and 70 °C.

2.3.3. Proanthocyanidins Quantification in Aqueous Extract

The concentration of Proanthocyanidin in aqueous extract was determined by an acid butanol assay. Briefly, 0.2 mL of the iron reagent (2% ferric ammonium sulfate in 2 N HCl) and a 1 mL sample of extract were added to 6 mL of the Acid Butanol reagent (950 mL of n-butanol and 50 mL of concentrated HCl). The solution was vortexed and then incubated for 50 min. in boiling water. Absorbance was read at 550 nm while using a UV-VIS spectrophotometer (Genesys 10S, Thermo Fisher Scientific, designed in USA, made in China) located in Univesitas Gadjah Mada, Yogyakarta, Indonesia) [36,37,38].

3. Results and Discussion

The results of this study are presented in the following sequence: (1) simulation results; (2) results of the sensitivity test to explore the effect of parameter values on the simulation results; (3) model validation and analytical results for simple cases; and, (4) results of the model’s validation with respect to the obtained experimental data.

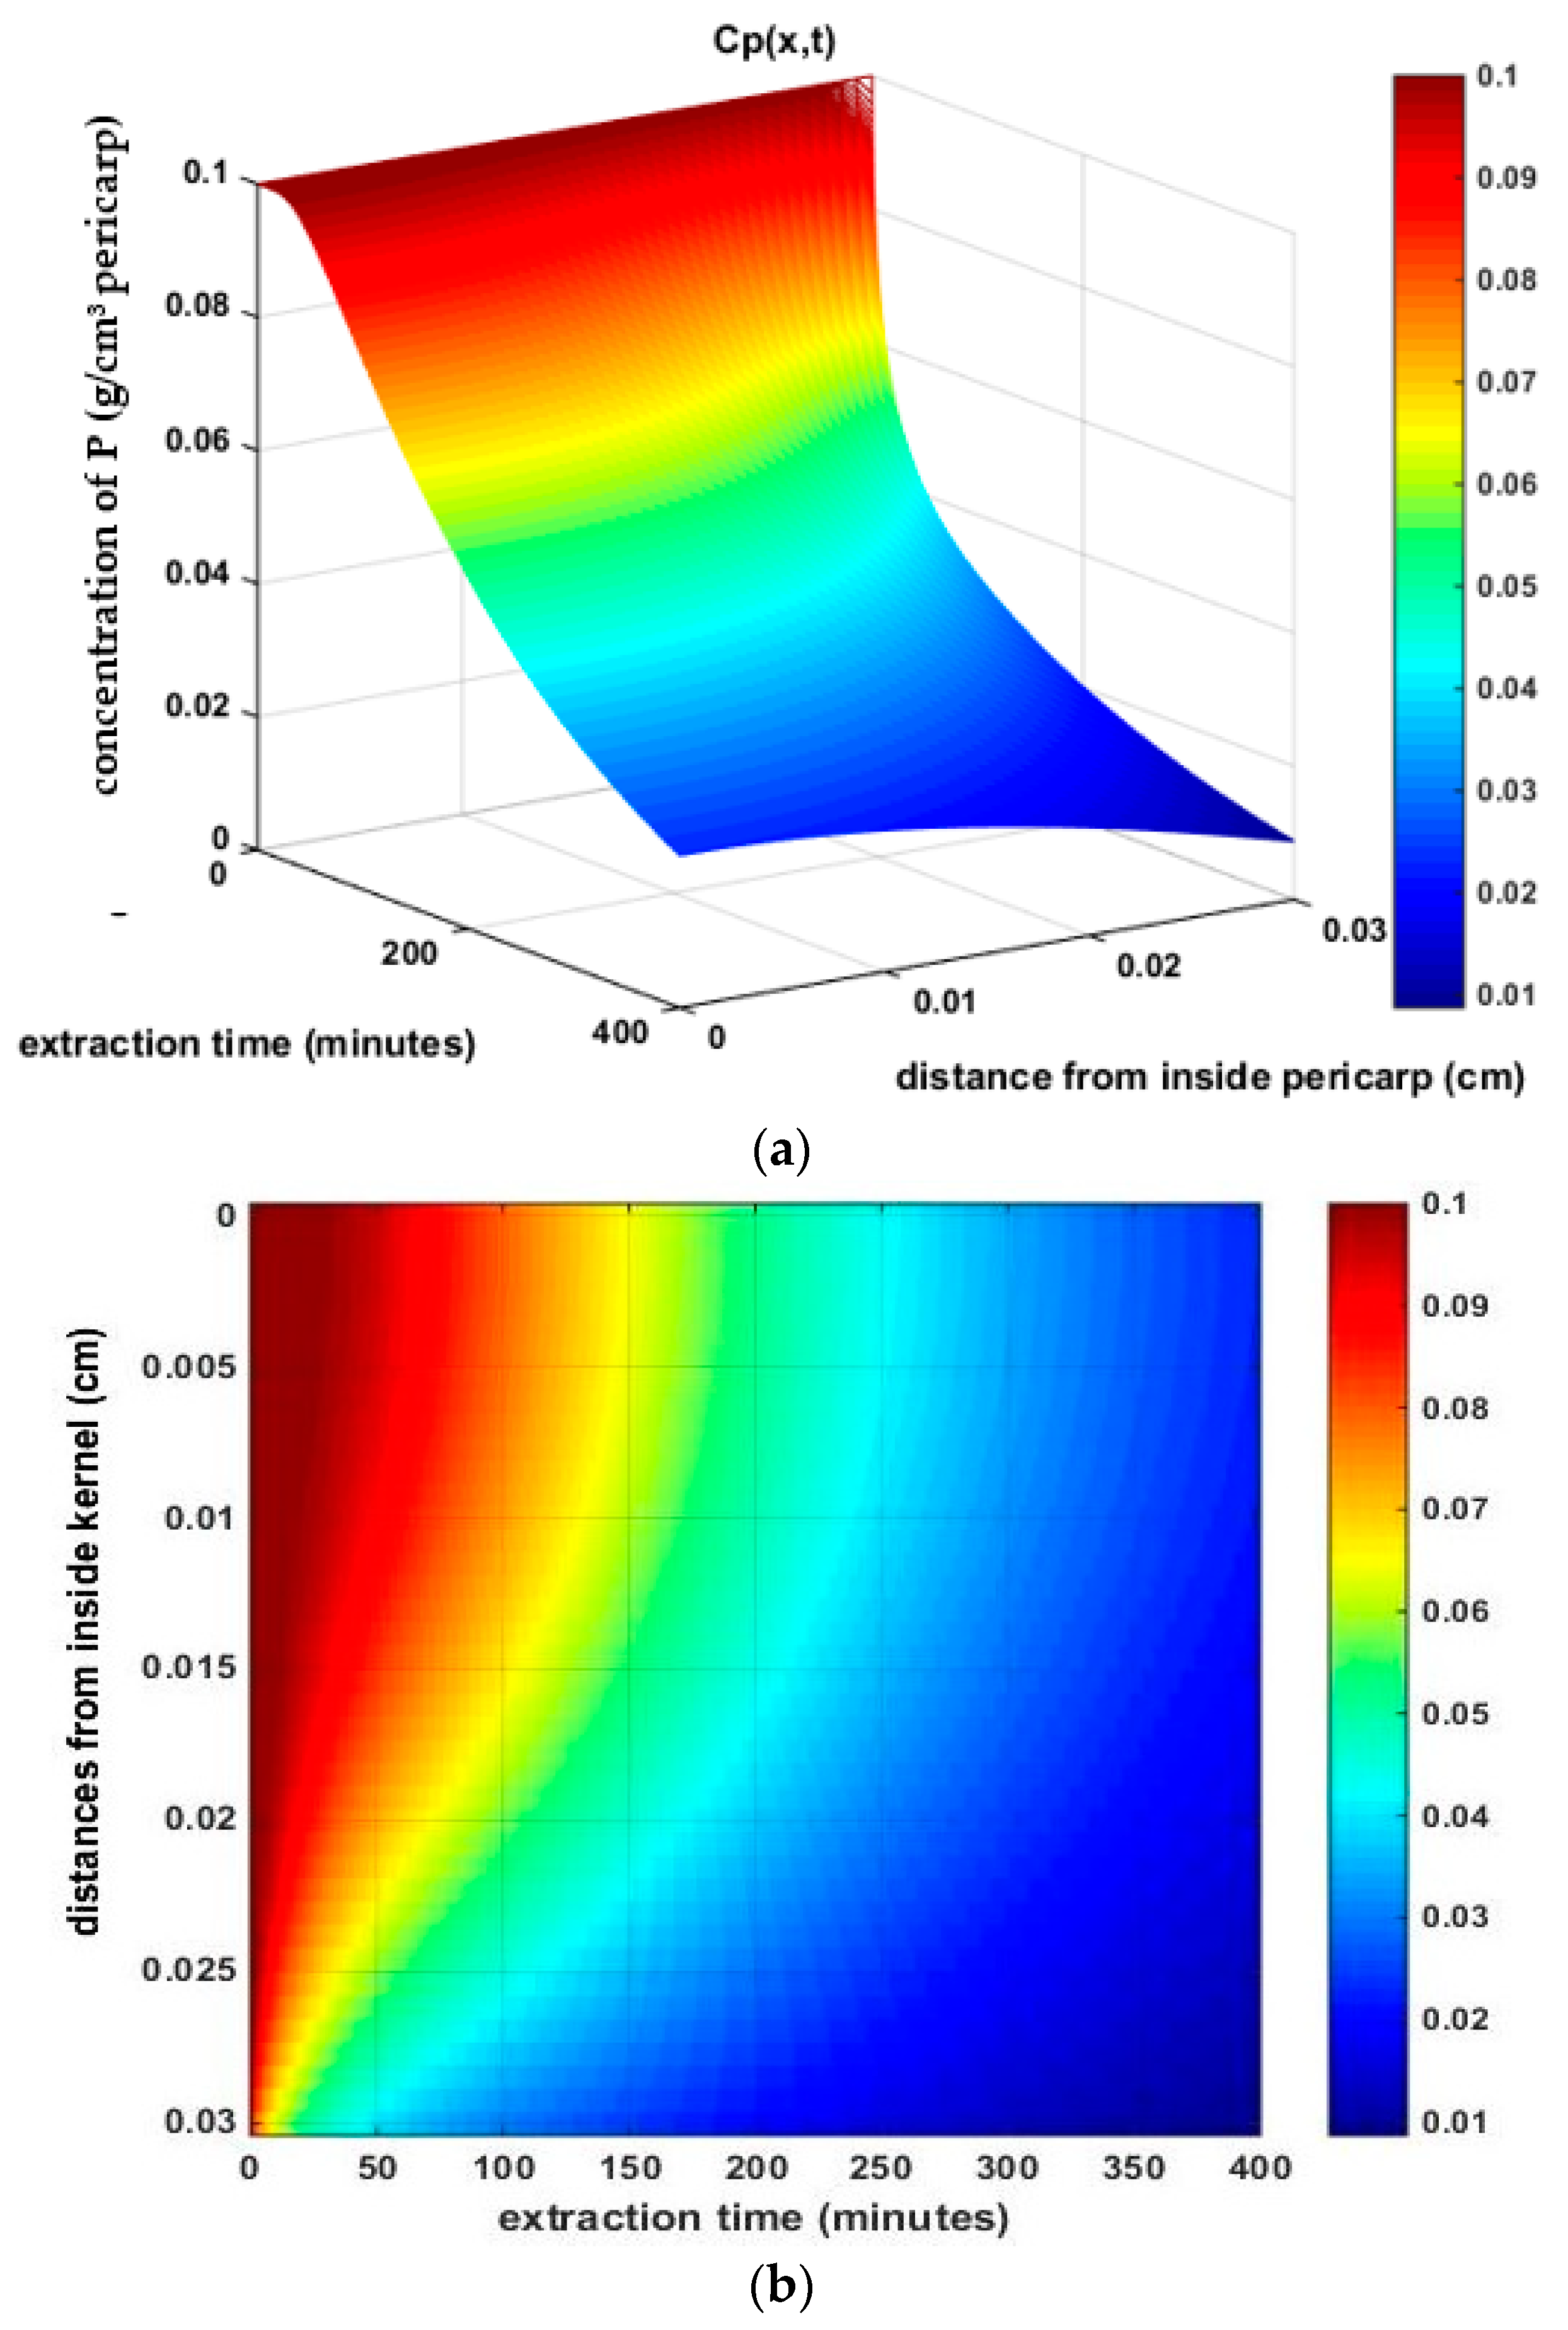
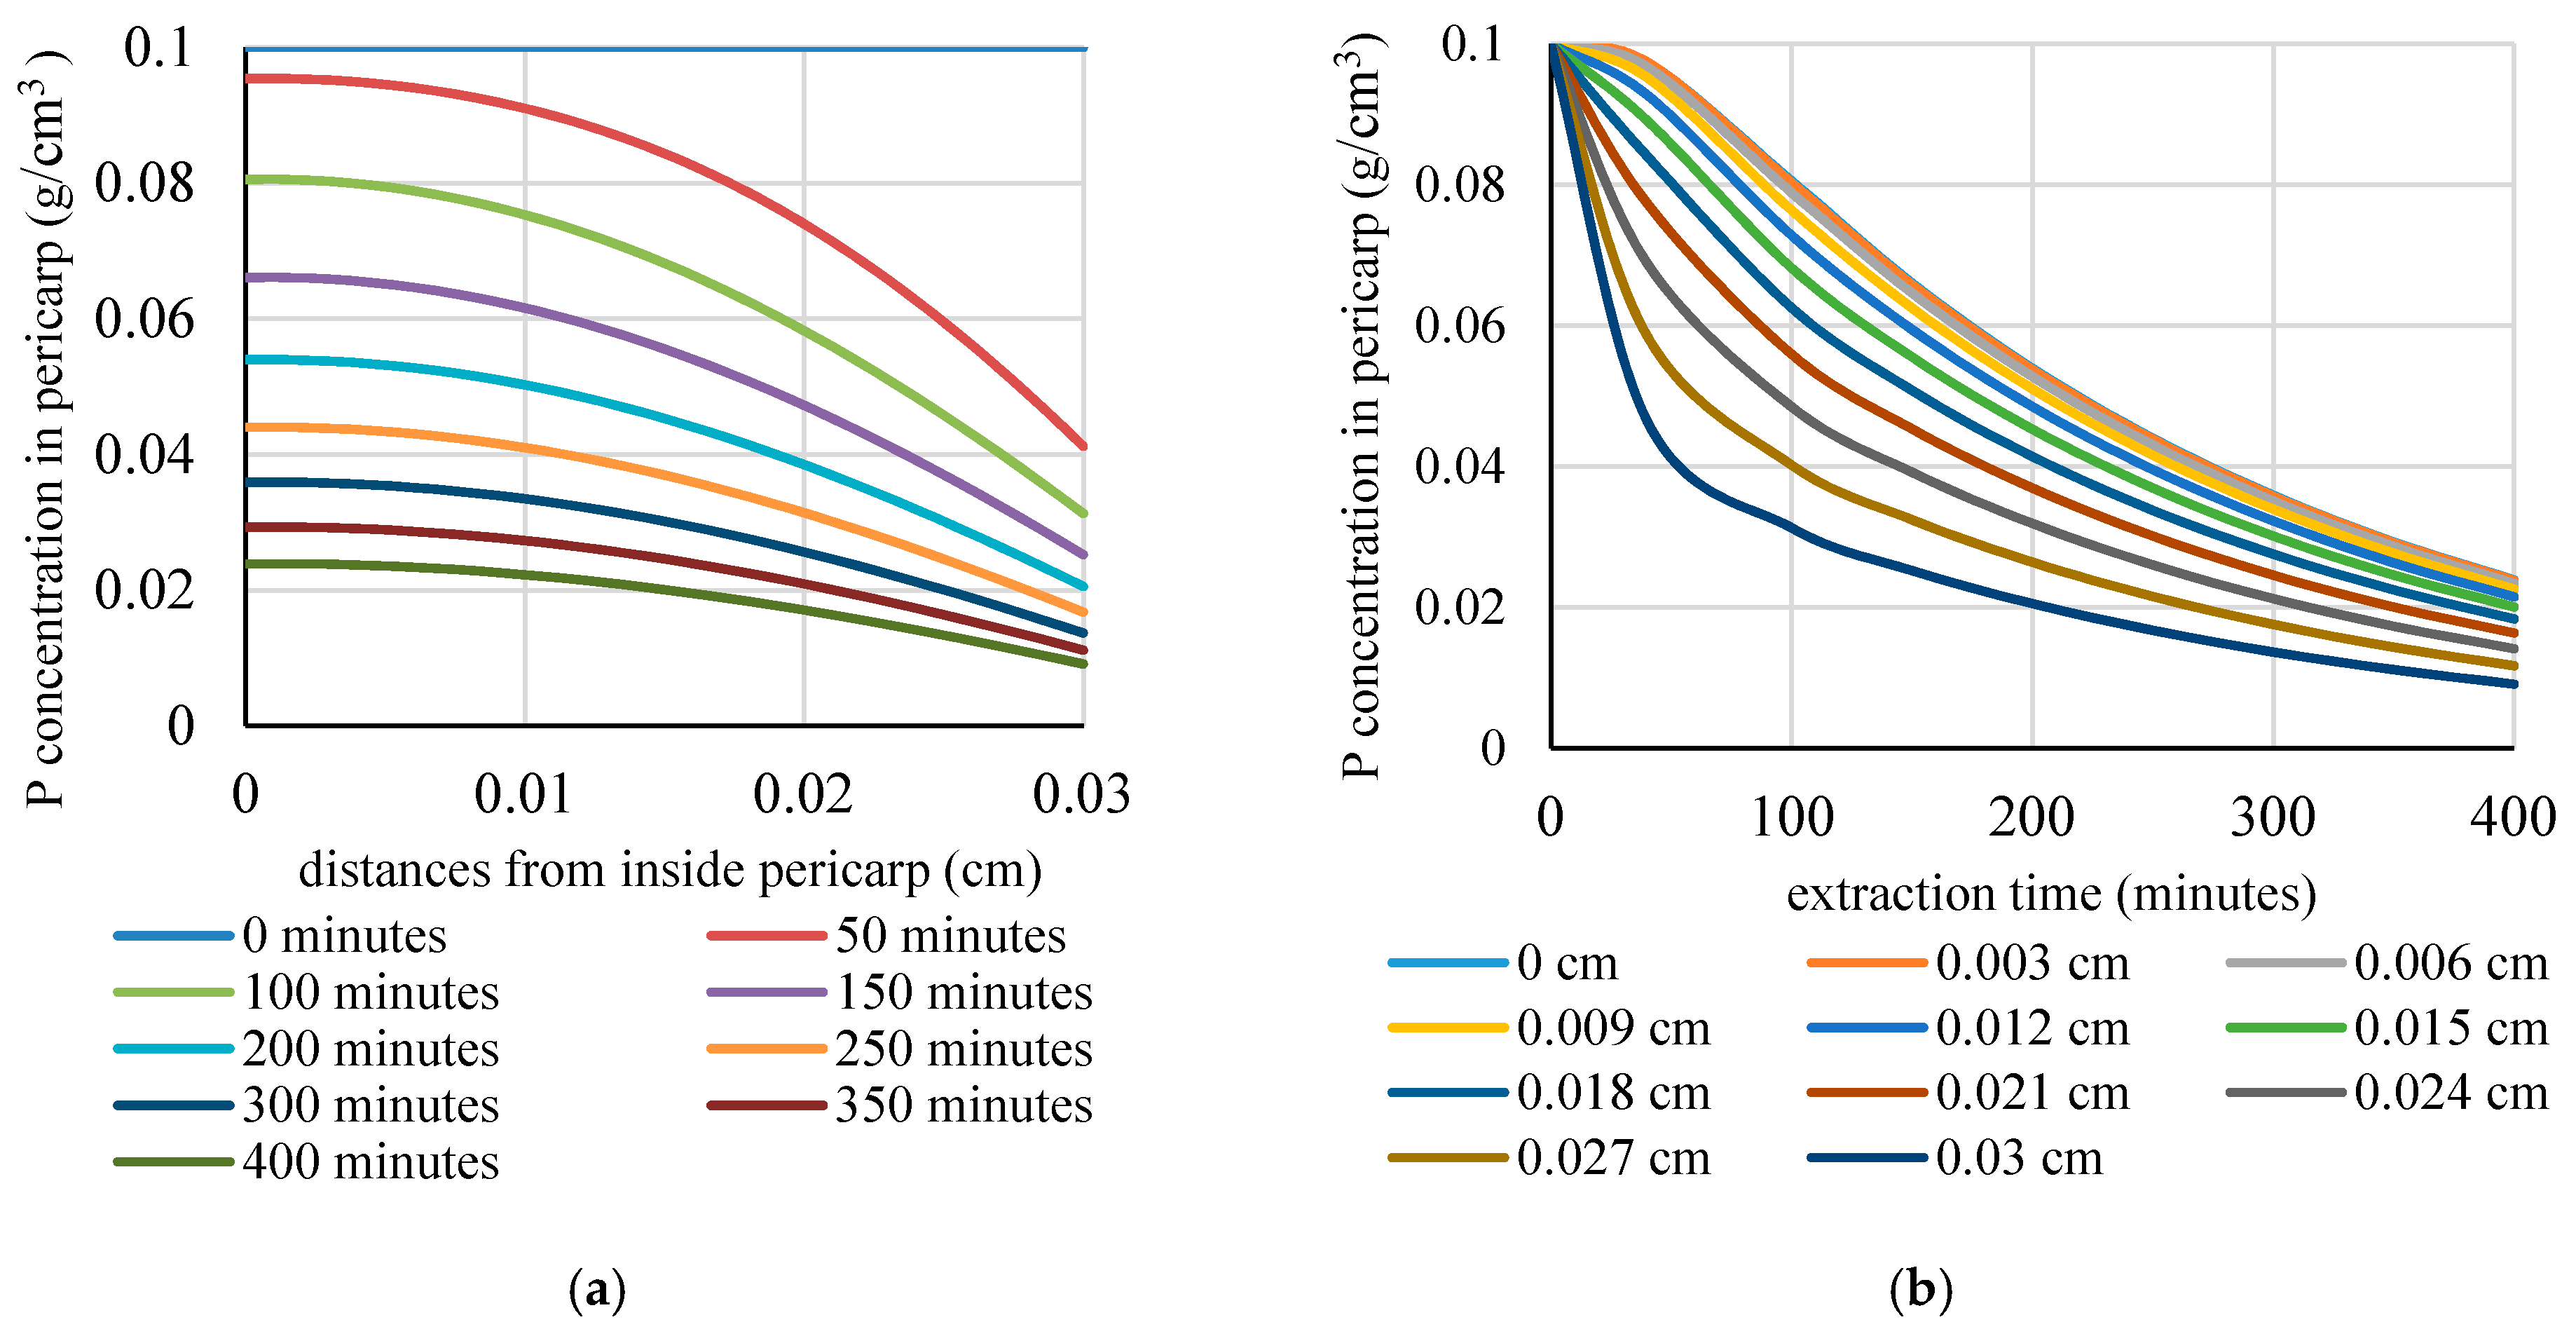
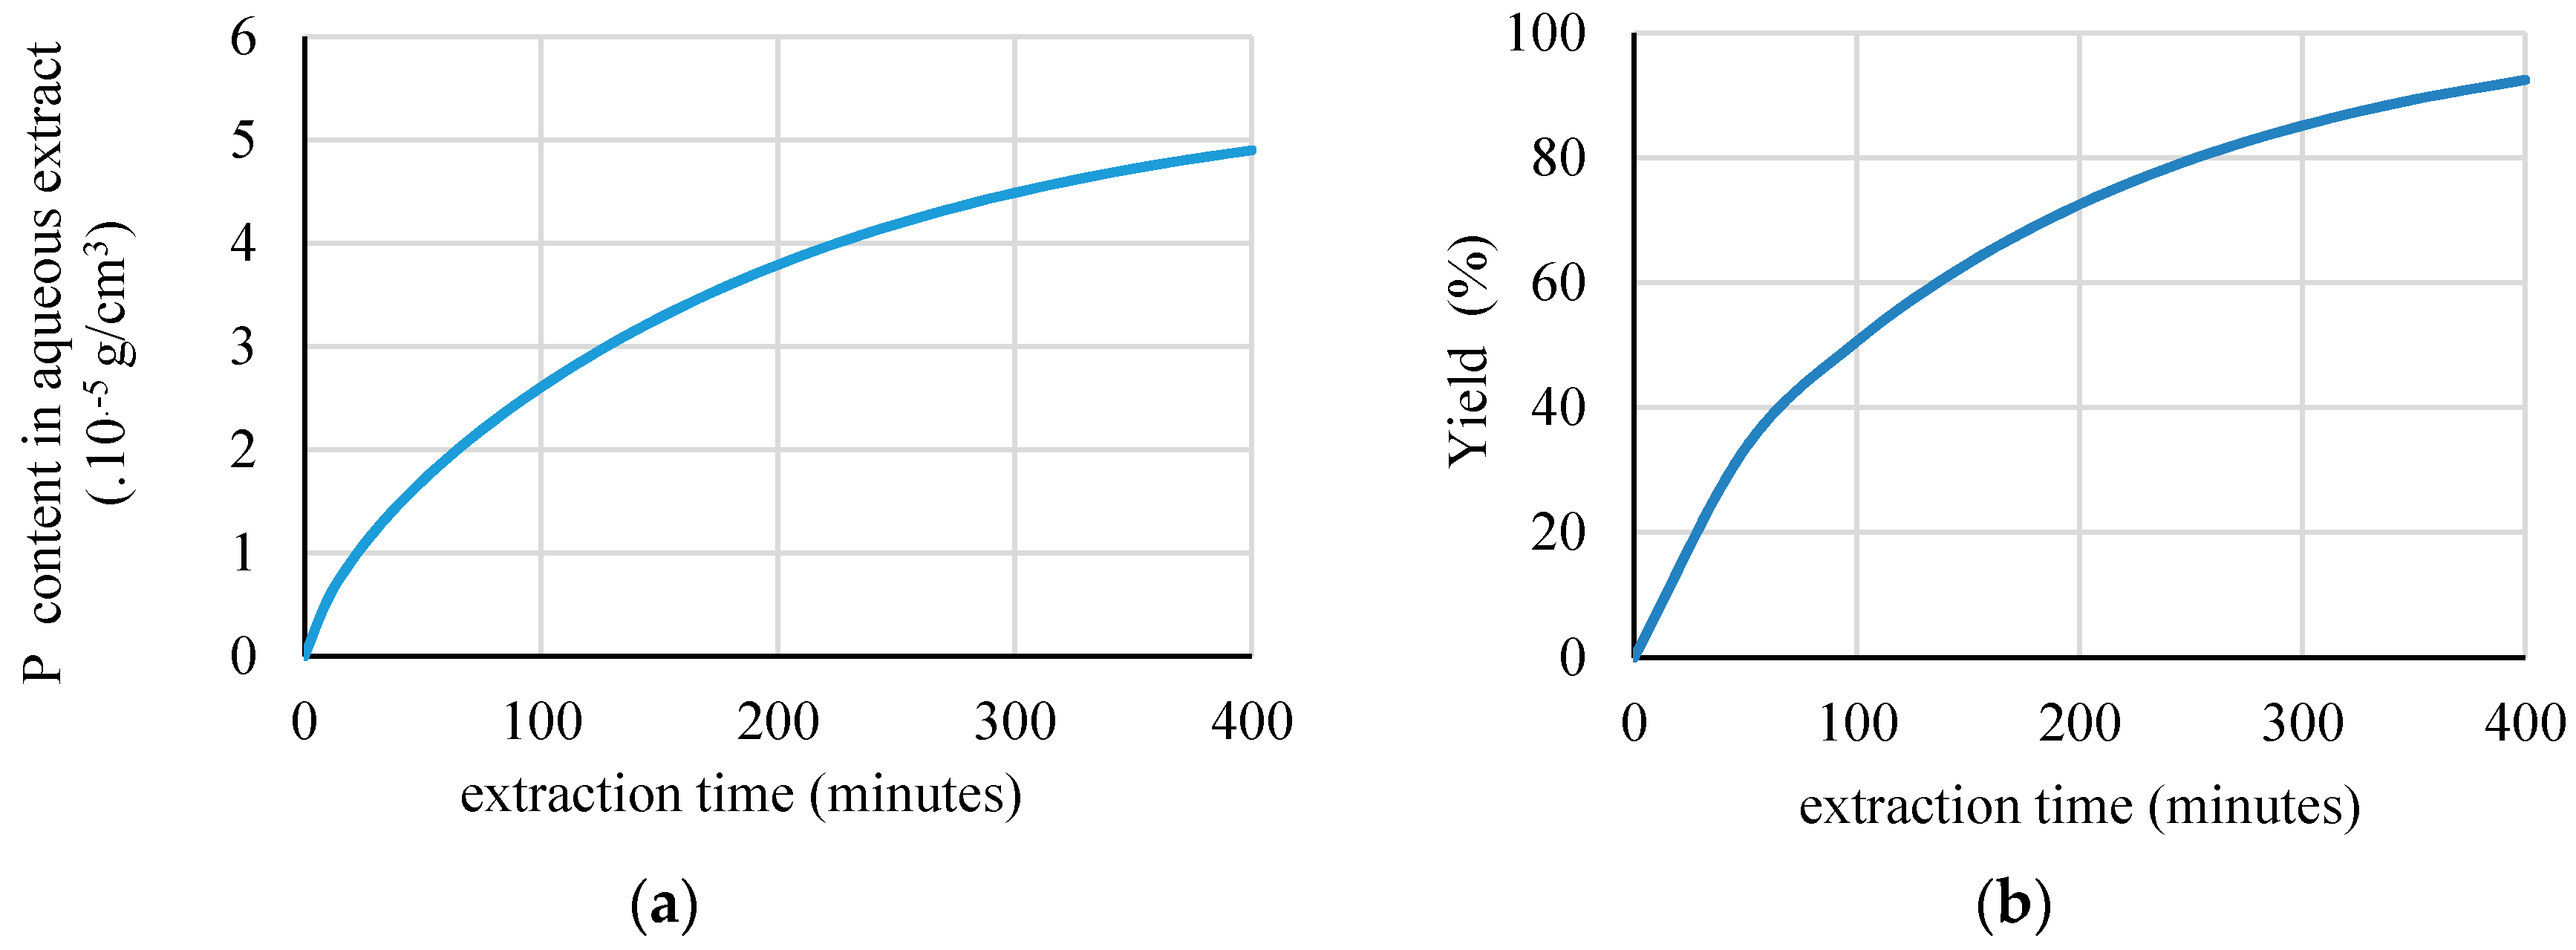
3.1. Simulation Results

The simulations using the proposed model predicted the bioactive compound’s concentration in the aqueous extract and also produced the distribution of its concentration at various positions in the pericarp during the extraction. The trial simulation was performed under the extraction conditions, in which 20 sorghum grains were extracted in 500 mL of aqueous water. The simulated characteristics of the sorghum grains were a radius of 0.3 cm, a pericarp thickness of 0.03 cm, and an initial phytochemical concentration in pericarp of 0.1 g Pequivalent/cm3 pericarp. The values of the other parameters were DeP = 0.0000025 cm2/min. [39], H = 0.5, and kc = 0.0004 cm/min. Table 1 lists the values of the applied parameters. Figure 2, Figure 3 and Figure 4 show the simulation results.
The phytochemical compound that diffused from inside of the pericarp to the surface of the pericarp caused the gradient concentration of P that is shown in Figure 2. In Figure 2, the configuration of the P concentrations (y-axis) that was predicted while using the numerical method in each position from inside the pericarp (x-axis) and at the time of extraction (z-axis) are described by a color gradient. The inside of the pericarp was at x = 0 cm and the pericarp’s surface was at x = 0.03 cm. The diffusion process occurred until a balance was reached between the two phases, at which time the phytochemical had been washed out by the solvent [37].
The mechanistic model was also used to produce a profile of the bioactive concentration as a function of the position inside the pericarp and the extraction time. The profile is shown in Figure 3a,b. At each part of the pericarp, the longer the extraction time, the flatter the gradient will be. All in all, Figure 2 and Figure 3 show that, as the time elapses, the concentration gradient within the pericarp becomes less steep. As a result, the rate of mass transfer from the solid to the bulk of the liquid decreases and, finally, reaches an equilibrium condition, as shown by the more uniform concentration. The simulation results were in good agreement with the findings of such studies as Perez et al. [40] and Veggy et al. [41], which found that the extraction curve consists of fast extraction during the washing stage (the initial stage) and slow extraction during the diffusion stage (the final stage).
The progress of the extraction process can be more clearly observed in Figure 3, in which the predicted concentration is shown as a function of distance from the inside of the pericarp (Figure 3a) and extraction time (Figure 3b). The information on the remaining P concentration in each part of the pericarp at various time points that is obtained from a simulation is useful in determining the extraction’s efficiency as well as the time when the extraction should be stopped.
The simulations also predicted the P concentration in the aqueous extract. Figure 4 shows the results. The predicted values are needed to demonstrate the extraction performance in reaching the target of the functional compound during extraction. They show the cumulative amount of active compound that had been transferred into the solvent. Under these conditions, the product’s concentration in the extract rises relatively fast at the early stage of the extraction process and then gradually slows down. It is expected that the value will become constant as the process approaches equilibrium [42].
As an example, under the conditions that are shown in Table 1, the P concentration increased from 0 to 48.9 ppm during 400 min. of extraction (Figure 4a). Figure 4b also illustrates the predicted yield of the extraction. The yield of extraction reached 92.48%. This information is important to the design of industrial-scale systems.
The simulation results that are presented in Figure 2, Figure 3 and Figure 4 show that the proposed model is capable of predicting the performance of an extraction system in terms of the yield and the P concentration in aqueous extract as well as inside the pericarp.

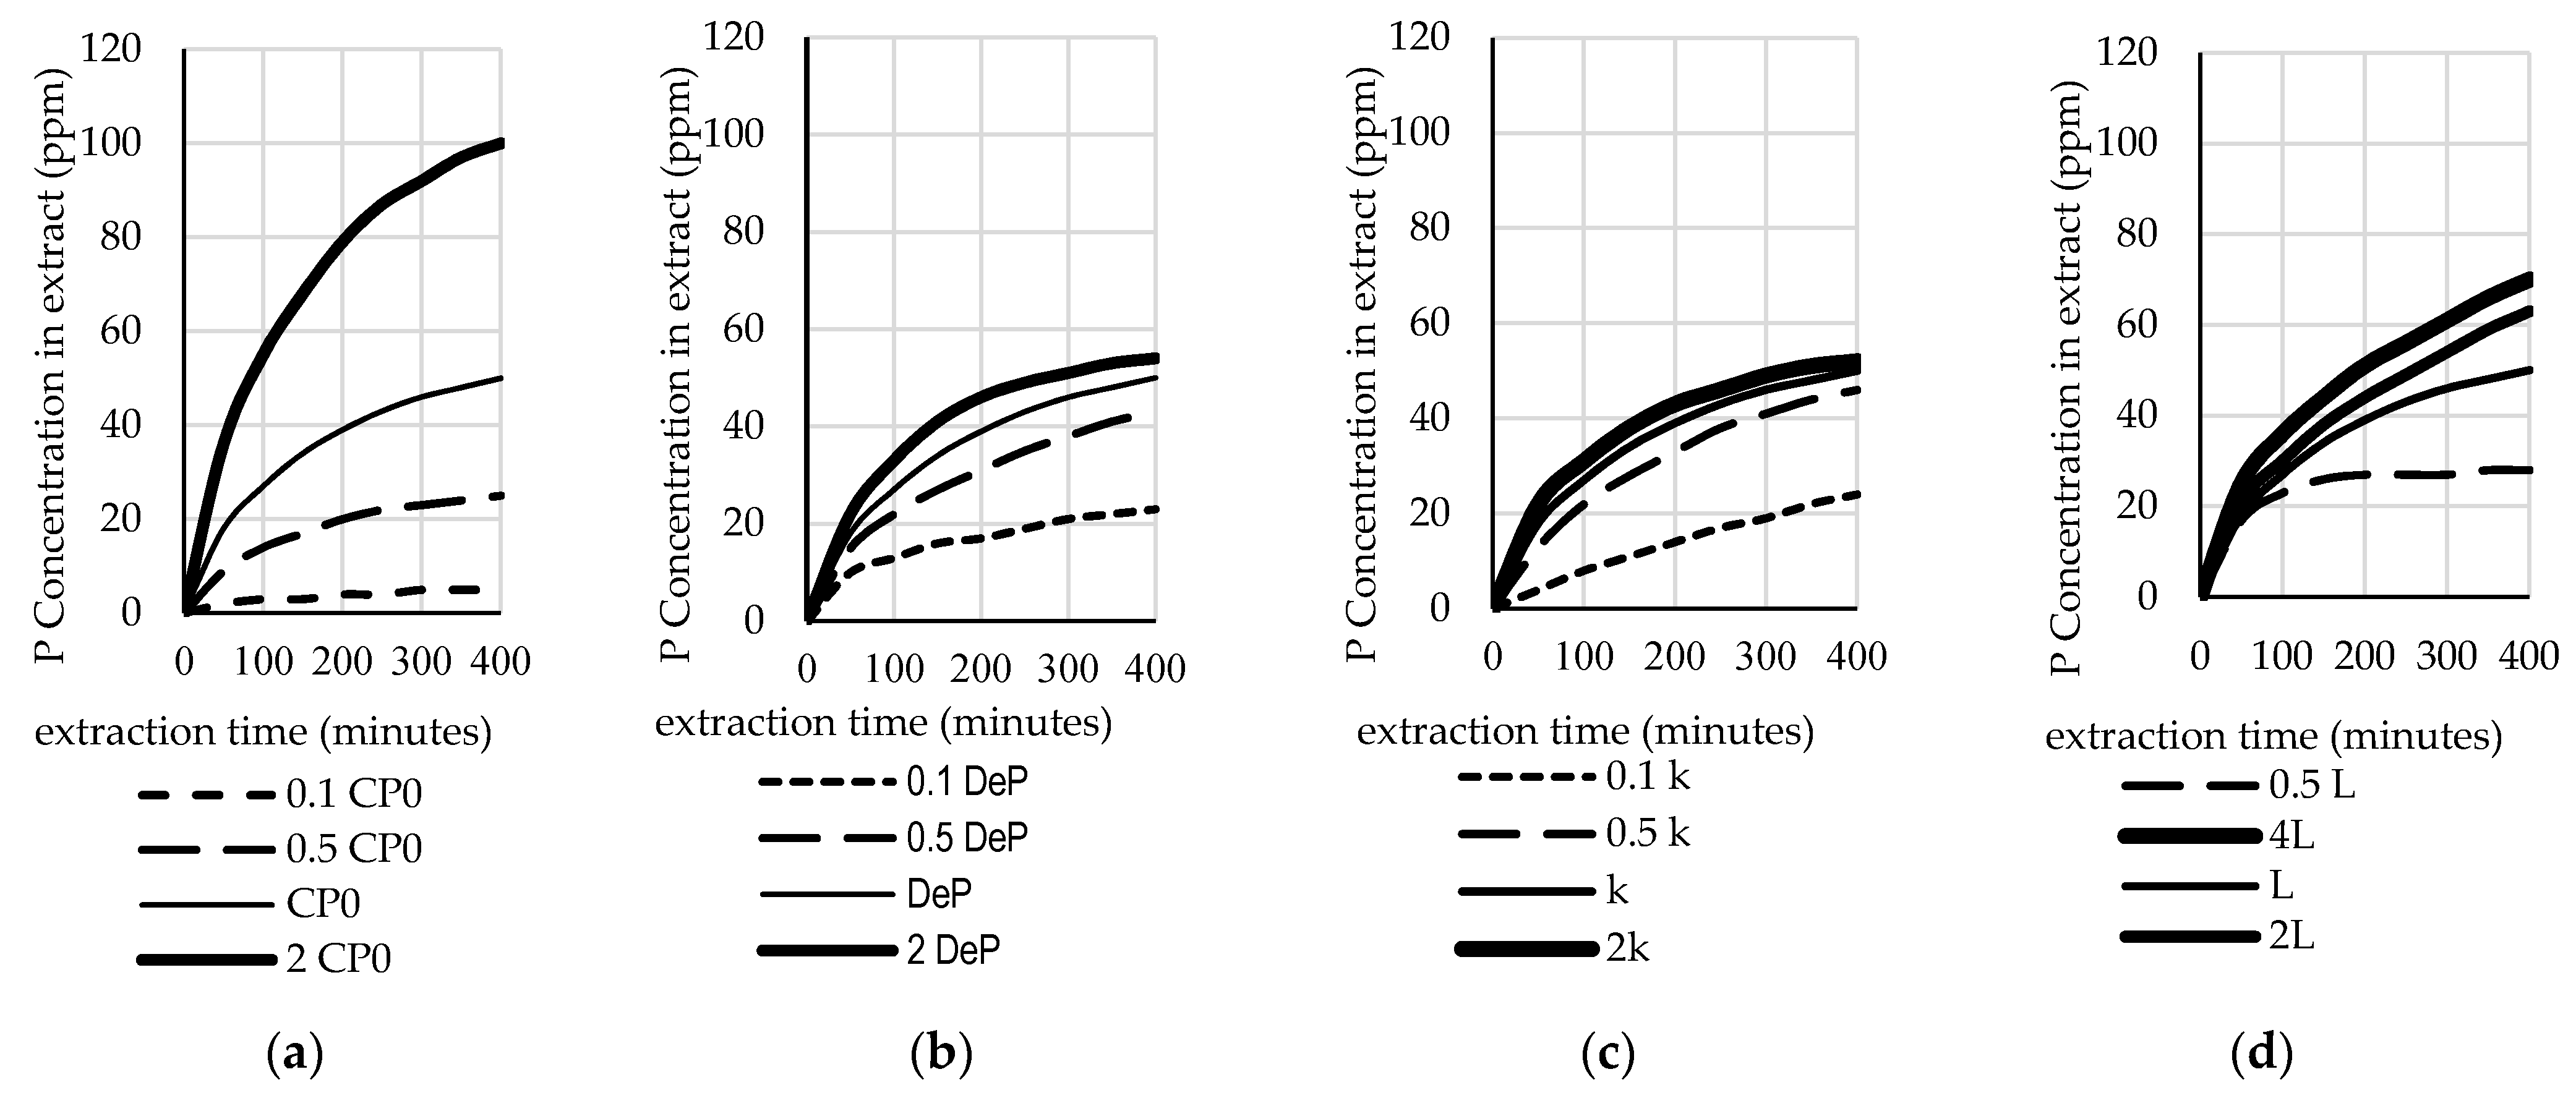
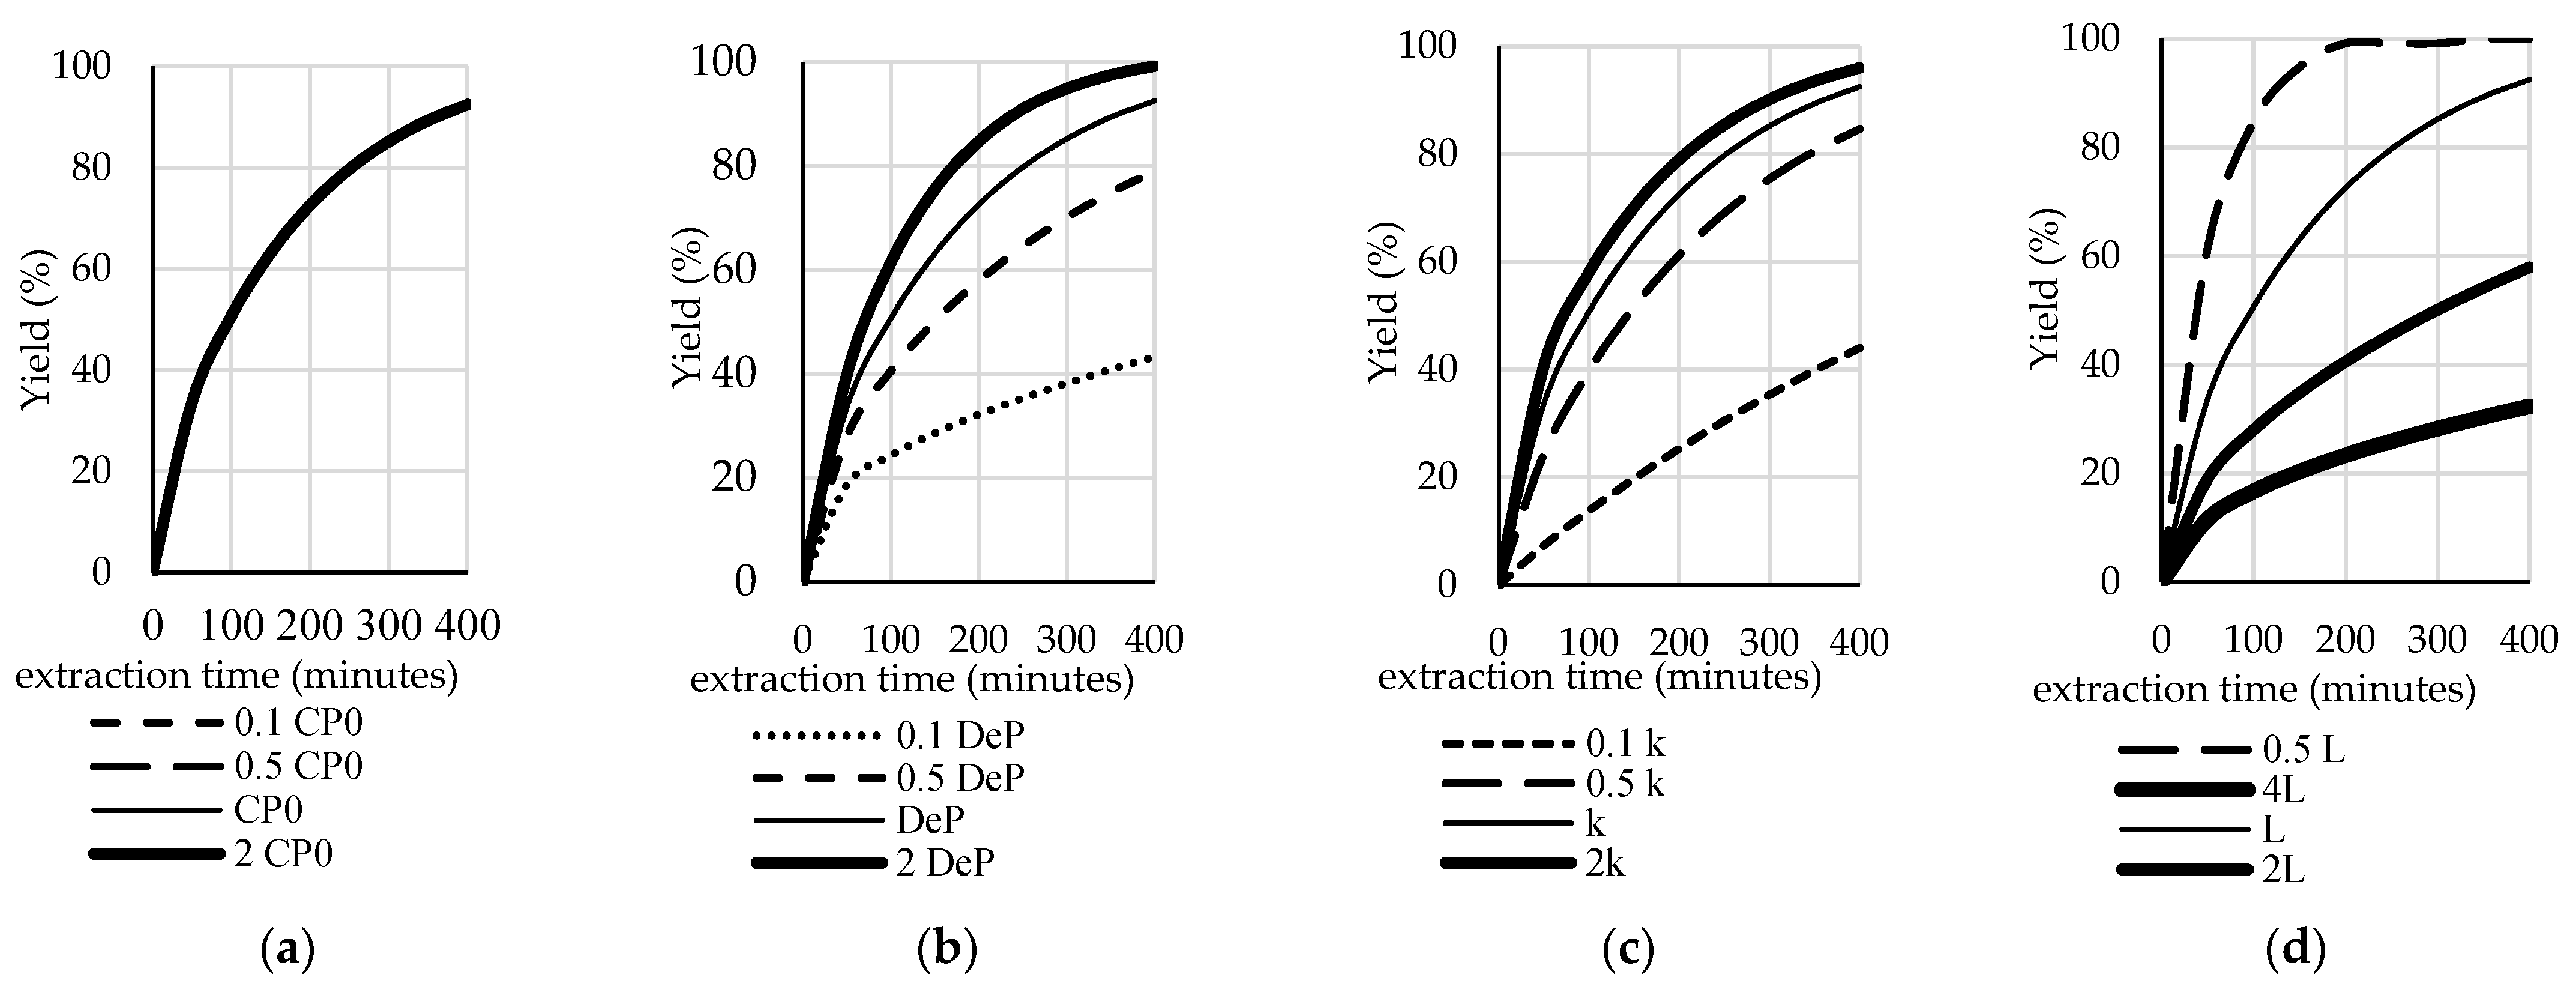
3.2. Analysis of the Sensitivity of the Model to Fluctuations in Parameters

In the research that was conducted by Pinela et al. [15] and Pace et al. [30], the mathematical model was also evaluated in terms of its response to various parameters and variables. In this study, a sensitivity test was conducted by decreasing or increasing the value of each variable by one and comparing the solutions [43]. Figure 5 and Figure 6 show the effects of the changes in some parameter values on the profile of the phytochemical P’s concentration in the extract. The conditions for this sensitivity test were an initial P concentration in the pericarp (Cp0) of 0.1 g Pequivalent/cm3; an effective diffusivity (DeP) of 0.0000025 cm2/min.; a mass transfer coefficient (kc) of 0.0004 cm/minute, and a slab thickness (L) of 0.03 cm.
Figure 5a and Figure 6a show the sensitivity analysis of the model as the response to several values of initial P concentration in the pericarp (0.1 CP0, 0.5 CP0, 1 CP0, and 2 CP0). The results show that the P concentration in the extract was very sensitive to CP0. In contrast, CP0 did not significantly affect the yield. Under real conditions, this value depends on the variety of the plant, the location of the crop, and the age of the harvested grain. Figure 5b,c illustrate the sensitivity of the model in predicting the P concentration in extract as the impact of the effective diffusivity value (DeP) and the mass transfer coefficient (kc), respectively, while Figure 6b,c illustrate the sensitivity of the model in predicting the yield as the impact of the effective diffusivity value (DeP) and the mass transfer coefficient (kc), respectively. It can be seen that, as the DeP value and kc value increase, the P concentration in the extract and the yield increase. Similar impacts were observed for kc. Figure 5d and Figure 6d illustrate the sensitivity of the model to the thickness of the pericarp. The occurrence of these phenomena is conceivable, since, the thinner the slab, the faster the diffusion.
Based on the results of the sensitivity test, it can be concluded that all of the parameters have an effect on the simulation results. This model’s simulation might also be applicable to study the effects of combinations of parameters and variables. Hence, it would be useful in the design of industrial-scale extraction systems. A sensitivity analysis describes how the performance of the extraction process and the concentration in a solvent can be increased, i.e., by choosing a higher-quality grain with a high initial P concentration in the pericarp (CP0) and a high slab thickness (L), by increasing the effective diffusivity value (DeP), for example, via ultrasound, or by increasing the mass transfer coefficient (kc) via agitation.

3.3. Validation of the Model Using Analytical Results

Previous researchers developed differential equations that were based on Fick’s second law and solved the equations while using numerical and analytical methods [41]. The validation of a numerical solution can also be done by comparing the numerical solution and the analytical result [44]. In this paper, the model and the numerical solution were validated by comparing the results with the analytical solution for simple cases (the case of short penetration diffusion and the case of a constant P concentration in the solution). We adopted the analytical solutions from Crank (1975) [45].

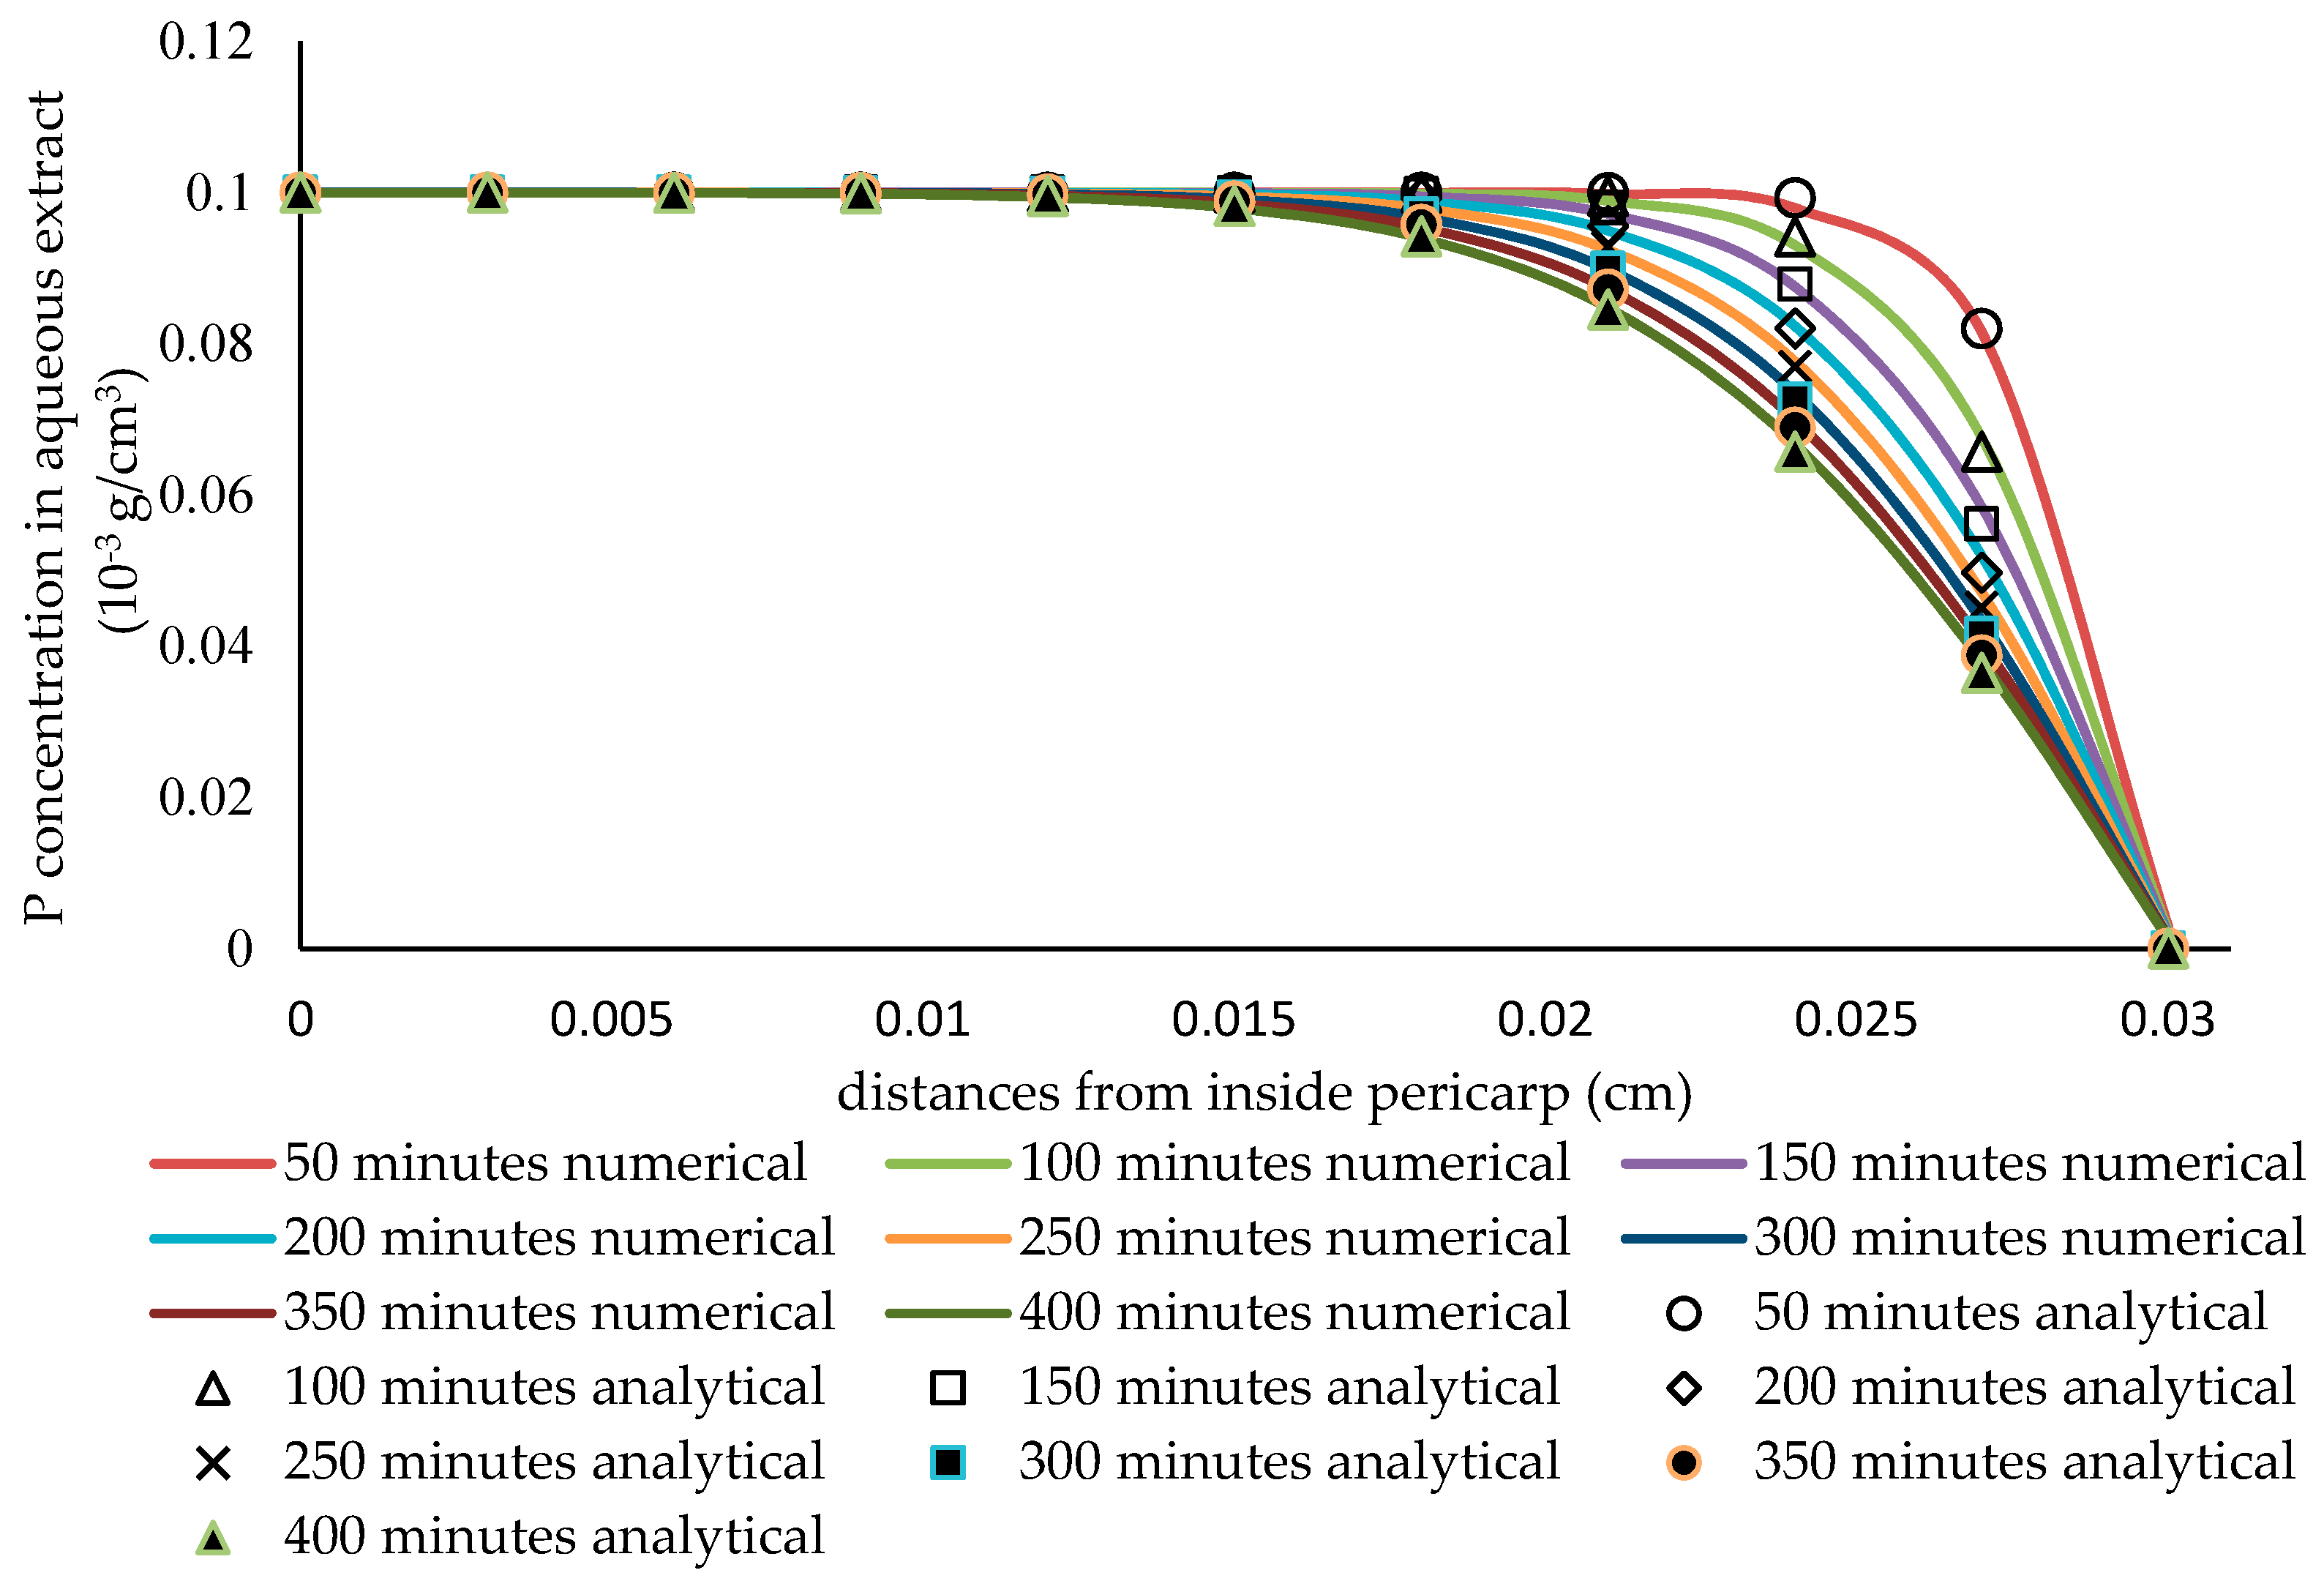
3.3.1. Validation of the Model under the Conditions of a Very Thick Slab and Very Slow Diffusivity

Under these conditions, the diffusion of phytochemical compounds is very slow, so the model of short penetration can be applied. For this phenomenon, the analytical solution of Equation (7) is shown in Equation (21) (Cussler, 2009) [46]. The analytical solution was determined by applying Equation (21), which was derived while using the initial and boundary conditions of:
CP = CP0 for t = 0, all x and CP = 0 for x = L all t.
C P , a n a l y t i c a l = C p 0 · [ e r f ( L x 4 · D e P · t ) ]
where Cp is the concentration of P compound, x is the distance from the inside of the pericarp, and Cpf0 is the concentration at x = 0.
Figure 7 illustrates the comparison of the numerical and the analytical solution for short penetration while using a slab thickness of 0.03 cm, a diffusivity of the phytochemical compound in solid particles of 5·10−8 cm2/min., a mass transfer coefficient of 4·10−4 cm/min., an extraction time of 400 min., and a relatively large liquid volume of 50,000 mL (at an almost constant extract concentration). This shows the consistency of the simulation that was applied in this case.

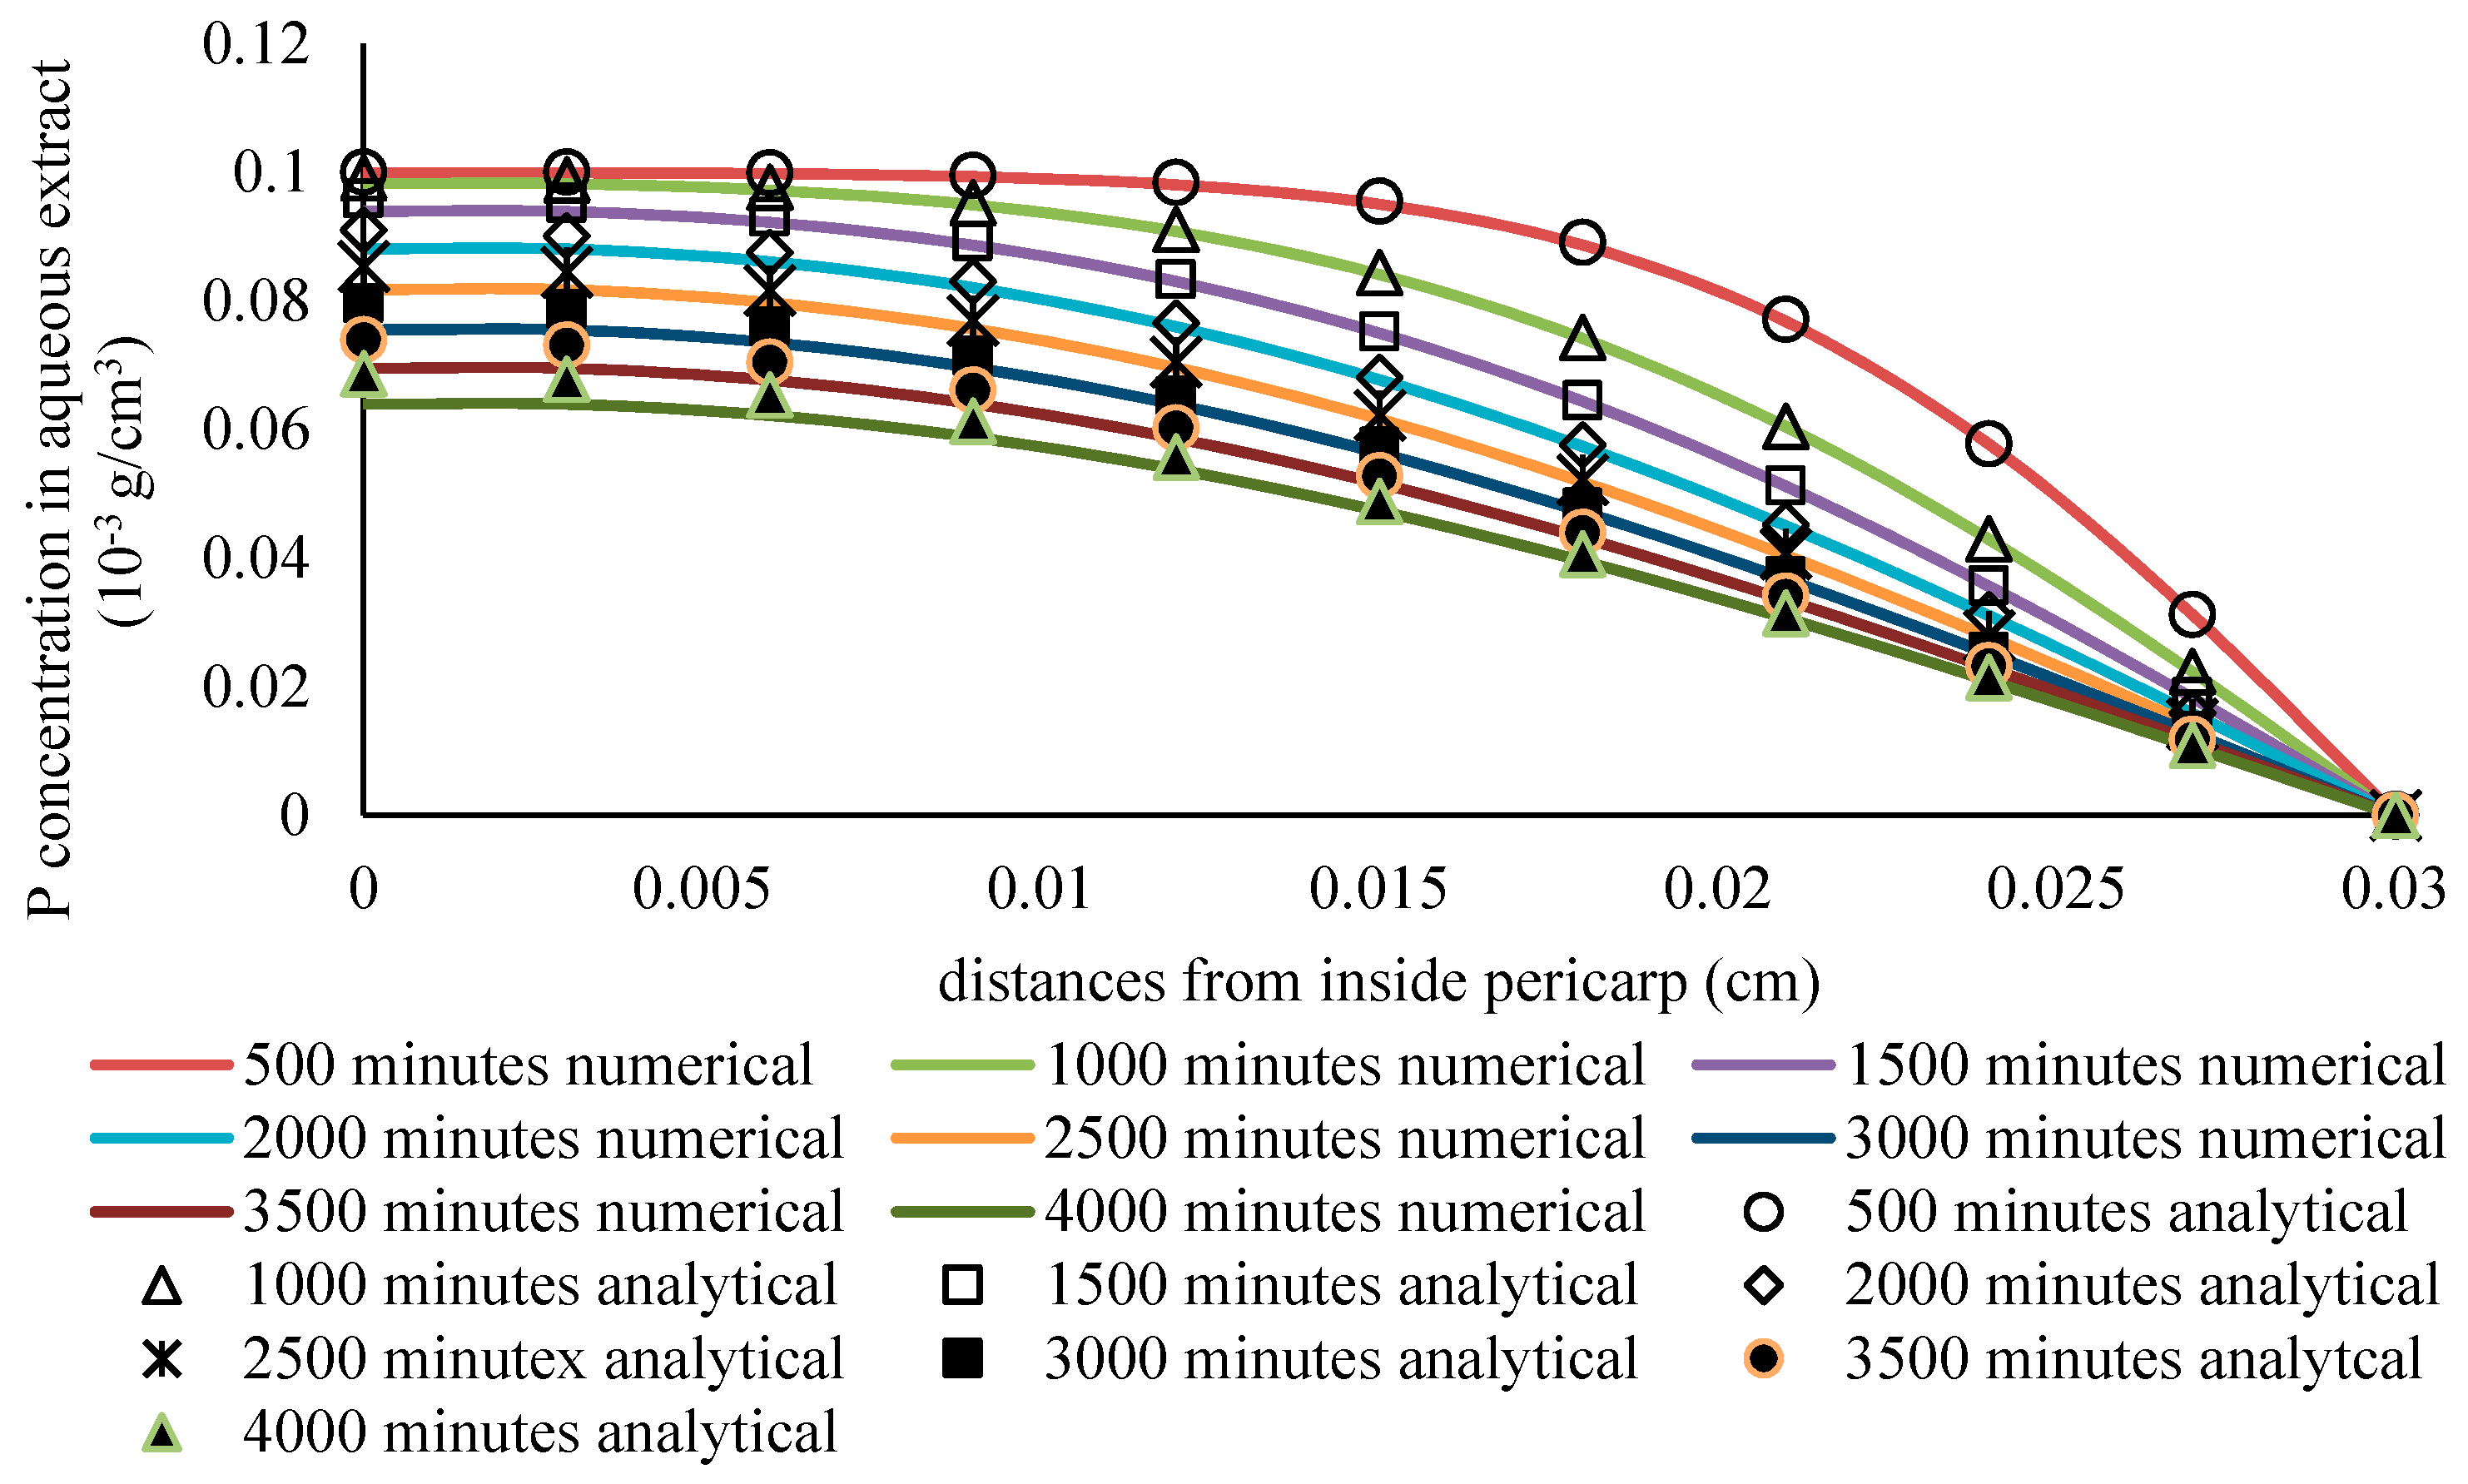
3.3.2. Validation of the Model under the Condition of a Constant Concentration in the Liquid Phase

The second model validation was performed by comparing the numerical and analytical solutions in the case of the P concentration value in the liquid phase being constant (by setting the volume of the solvent to be very large). We adopted the analytical solution in Crank (1975). Equation (22) shows it.
C P , a n a l y t i c a l = C P 0 · 4 π n = 0 ~ ( 1 ) n 2 n + 1 c o s ( ( 2 n + 1 ) π x 2 L ) e x p ( ( 2 n + 1 ) 2 · ( π ) 2 D e P · t 4 · L 2 )
The analytical solution was derived while using the boundary conditions of:
CP = CP0 for t = 0, all x; CP = 0 at   x = L ;   a l l   t ;   C p x = 0 at x = 0, all t and Cp = 0 for t = ∞, all x.
The comparison was performed under the conditions of a slab thickness of 0.03 cm, a diffusivity of the phytochemical compound in solid particles of 2.5·10−6 cm2/min., a mass transfer coefficient of 4·10−4 cm/min., an extraction time of 4000 min., a radius of sphere of 4 cm, and a relatively large liquid volume of 500,000 mL. From Figure 8, it can be observed that the numerical solution matches well with the analytical solutions.
From the results of the validation test that are shown in Figure 7 and Figure 8, the constructed simulations are in agreement with the analytical solutions for simple cases. Accordingly, the model was then applied in further studies. In this case, this model is expected to be suitable for simulating the mass transfer of a phytochemical compound from the pericarp of sorghum grains. The model can be regarded as being sufficiently accurate for this purpose if it is consistent with the analytical solution [47].

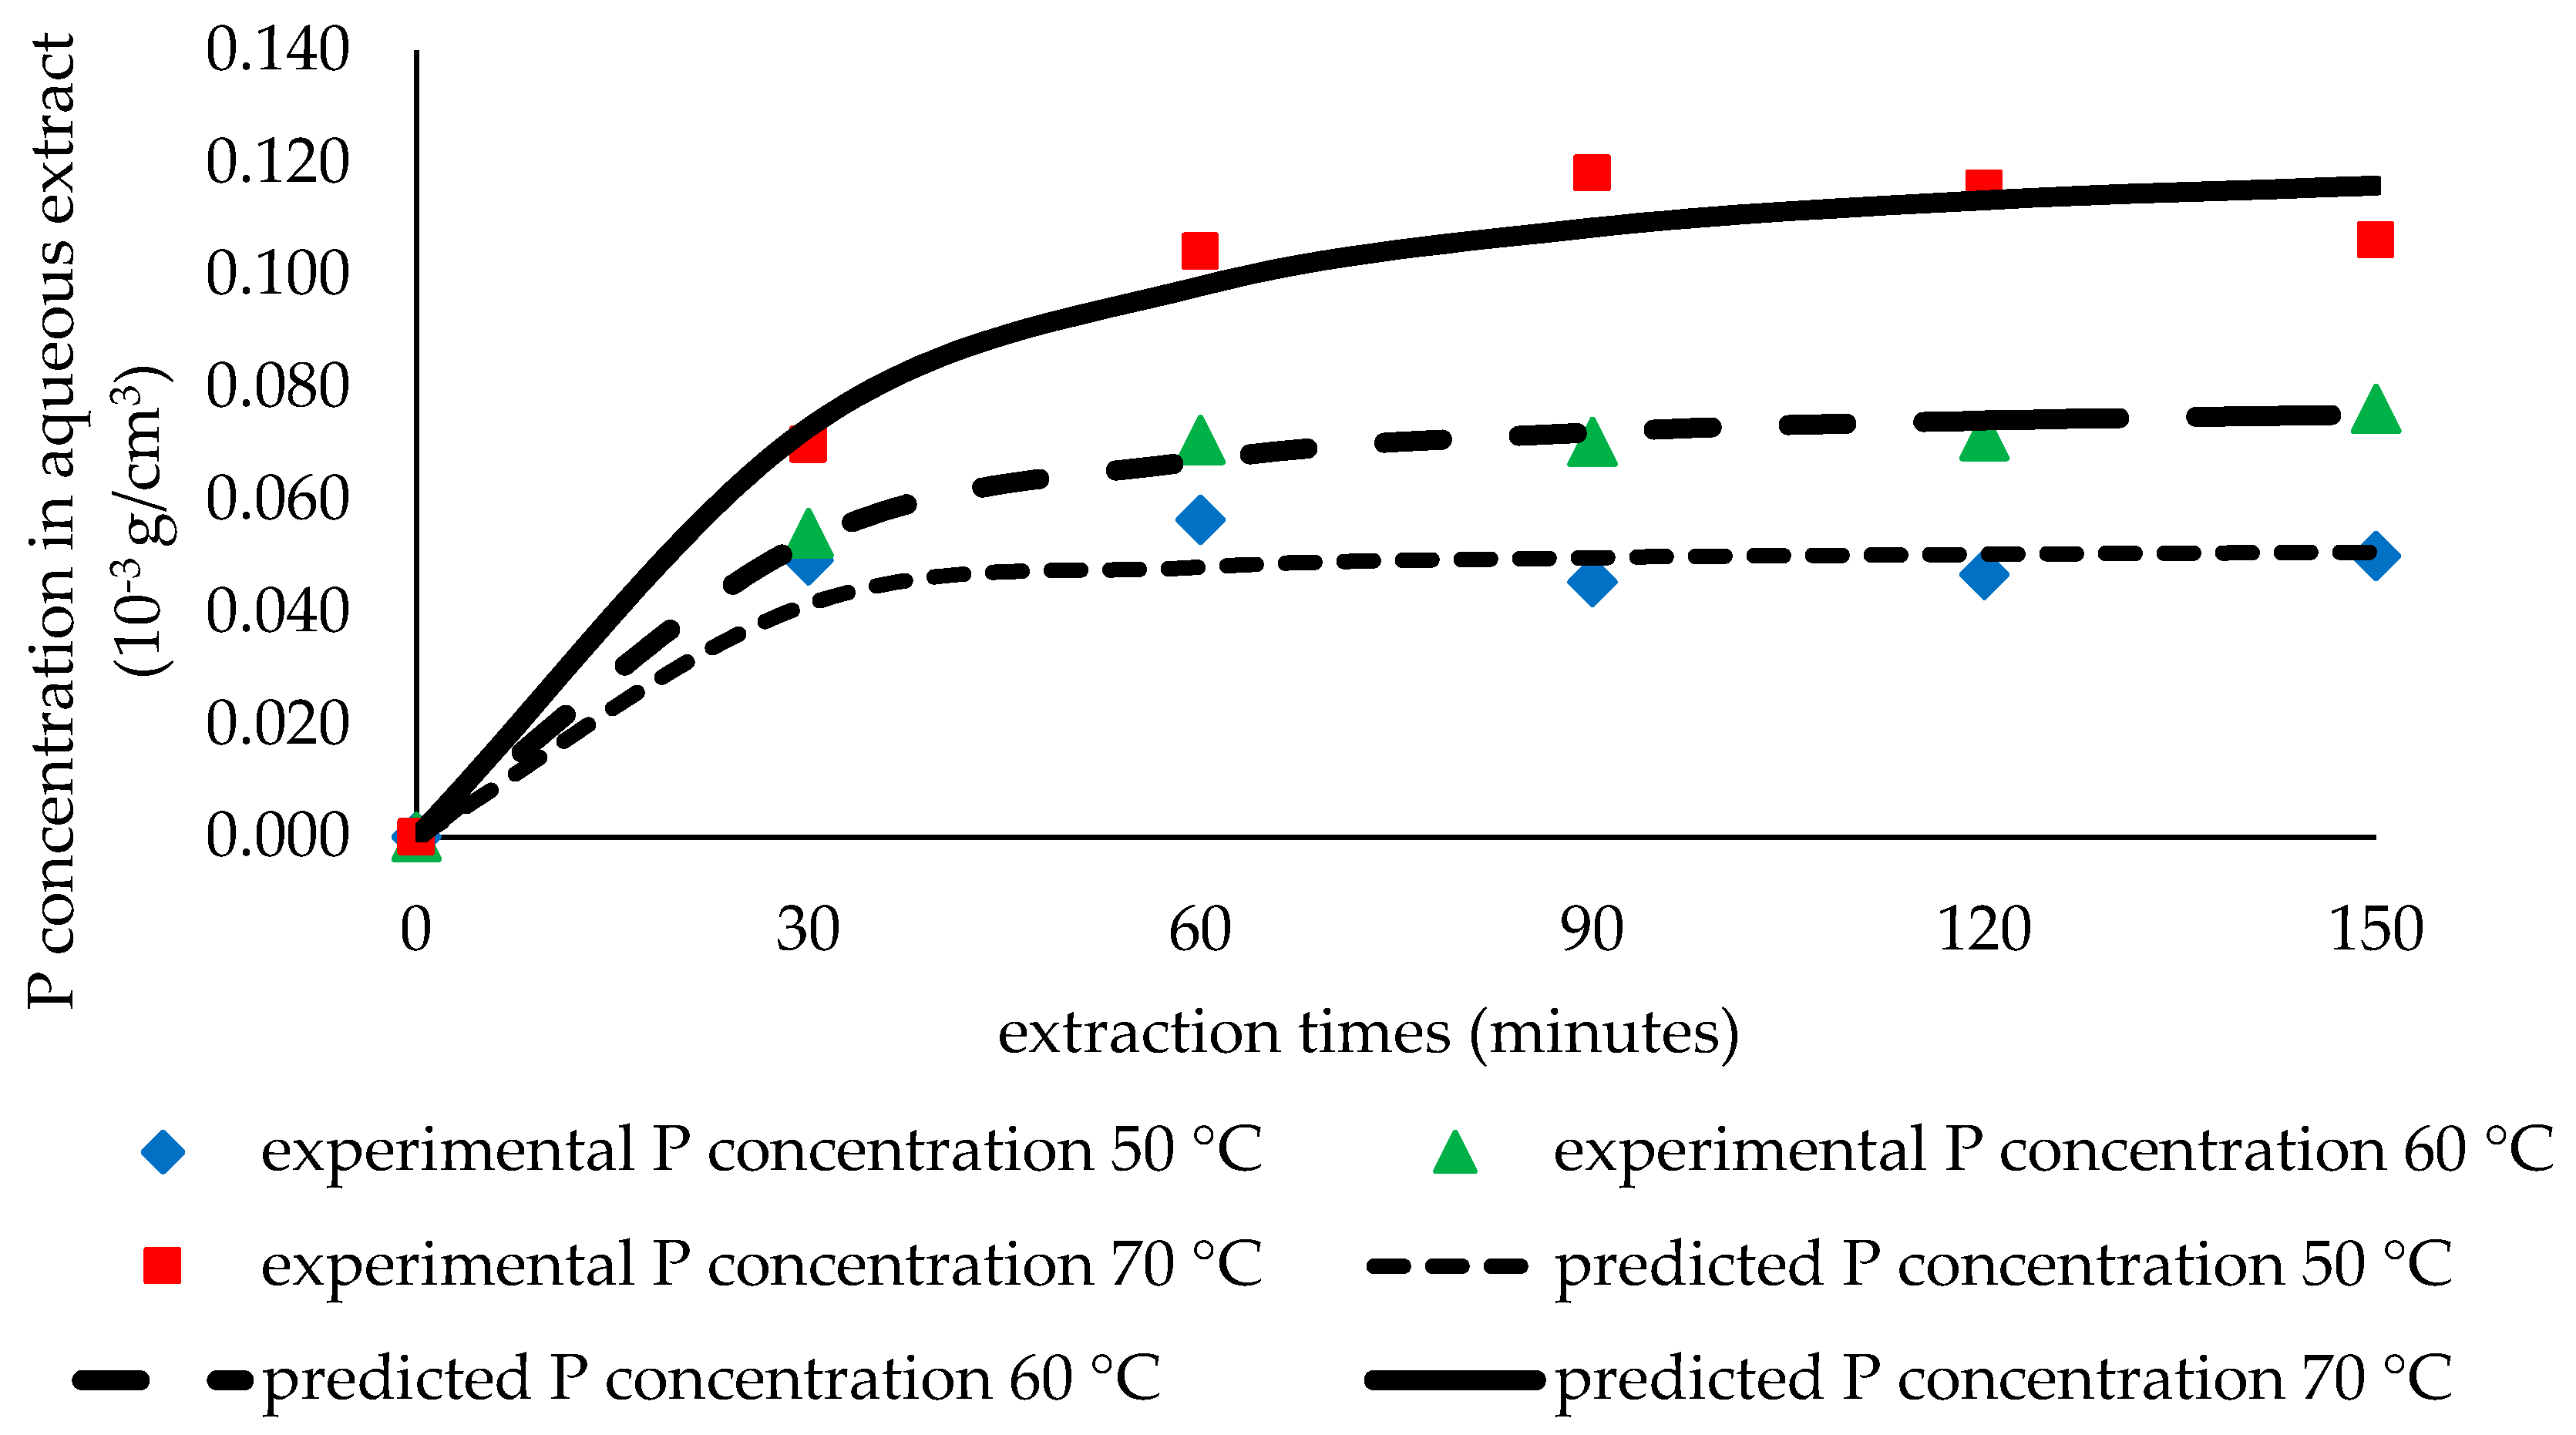
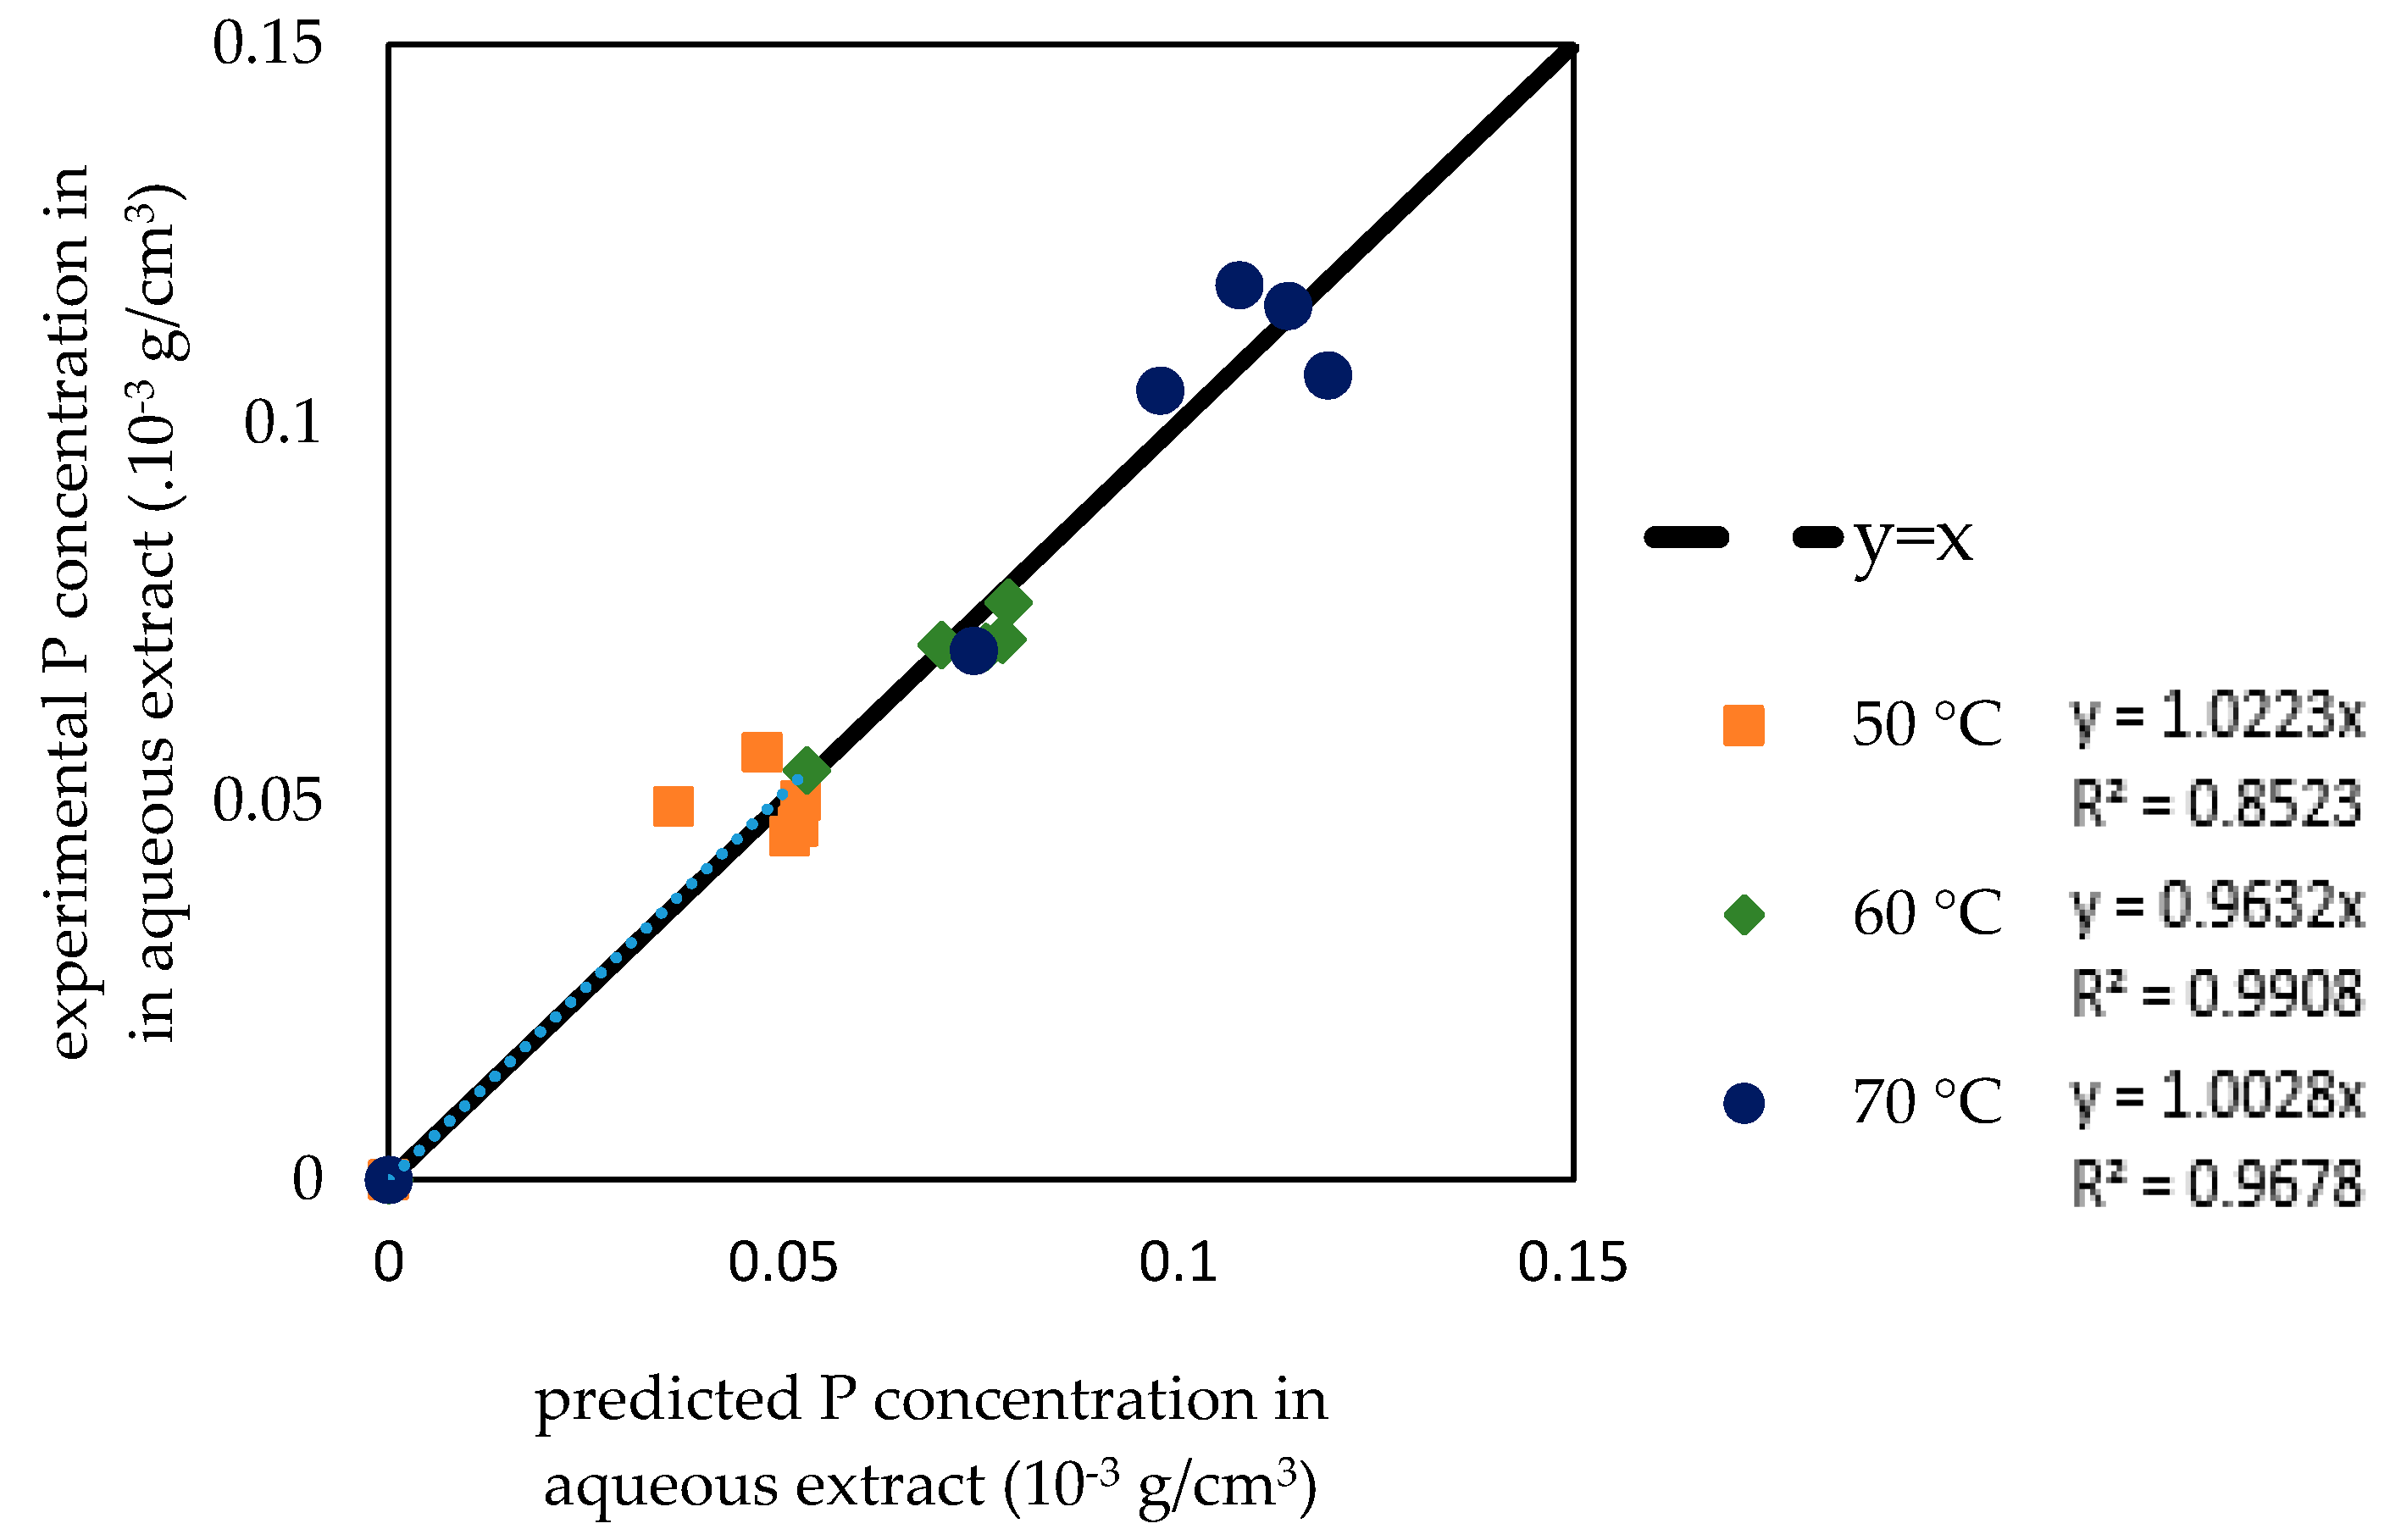
3.4. Validation of the Model Using Experimental Results

In this part, we present the model’s validation while using experimental data. This form of validation can also produce the values of unknown parameters (De, H, and kc). An experimental extraction was performed while using 178 grains of red sorghum with a radius of 0.19 cm, a pericarp thickness of 0.01 cm, an initial concentration of 0.1263 g Pequivalent/cm3 pericarp, and a free solvent volume of 45 mL. A series of P concentration values in aqueous extract measured in 30-min. intervals over 150 min. were used to test the accuracy of the proposed model and to determine the values of the parameters of the simulated model. From the results of the simulation, the values of some of the parameters of the model have been determined and they are shown in Table 2. The parameter’s values were determined by minimizing the sum of the squares of errors (SSE) to the experimental data. The simulation results were compared with the experimental data (Figure 9) to check the accuracy of the proposed model.
Figure 9 shows that the predicted concentration of the bioactive compound in the solvent at each time point during the extraction is close to the experimental concentration. Figure 10 also shows the agreement between the predicted value and the experimental value. This result indicates that the model has accurately predicted the concentration in the extract. The agreement between the predicted value and the experimental value can also be observed by comparing the gradient of the empirical correlation to the gradient of the diagonal (gradient = 1). The obtained gradients are relatively close to 1 (shown also in Figure 10).
The proposed model provides a comprehensive illustration of the extraction mechanism under various conditions based on some resulting values of parameters. The model is able to describe the relationship between an increase in temperature and changes in process parameters, such as De, H, and kc, and it supports the results of previous studies that found that a higher temperature improves extraction performance [24,48,49]. The profile of the extraction process as a function of time and temperature is also precisely illustrated through this model, as shown in Figure 9.
In application, the proposed model is expected to be able to support more comprehensive studies on the quantitative description of systems for the extraction of proanthocyanidins or condensed tannin from intact red sorghum pericarp, as well as for the extraction of other bioactive materials. Hence, it shows promise for applications in process simulation in pharmaceutical and nutraceutical industries. Previous researchers have also conducted quantitative analyses of the process of extracting bioactive compounds from natural materials [50,51,52]. The value of the Fourier number (Fo) based on the thickness of the pericarp was found to be ~ 0.185, which is relatively large. Hence, it can be concluded that the intra-particle gradient is important.
We also performed an evaluation of the stability of the applied numerical calculations. The obtained modulus value ( Δ x 2 D e P . Δ t ) was ~ 6, so we can conclude that the numerical solution is stable. Furthermore, calculations have also been done using different values of Δ x (0.0005 cm, 0.000333 cm, 0.00025 cm, 0.0002 cm, and 0.000167 cm) and Δ t (0.1 min. and 0.05 min.). It was observed that the results are in close agreement, so we can again conclude that the numerical solution is stable.

4. Conclusions

A mathematical model based on a theoretical concept of mass transfer from a pericarp covering a spherical grain has been presented and applied in the extraction of a phytochemical compound from an intact red sorghum pericarp. The partial differential equations that resulted from the material balance based on the proposed mass transfer mechanism were solved while using finite difference approximation. The simulation was shown to be able to provide reasonable profiles of predicted concentration within the pericarp as well as in solution and the yield of the process during the extraction. Comparing the simulation results with the available analytical solutions for ideal conditions validated the proposed model. A comparison showed that the simulation results while using the proposed model and actual experimental data on the extraction of proanthocyanidins from an intact red sorghum pericarp were in good agreement. The mechanistic model shows promise for application in the simulation of some processes in the pharmaceutical and nutraceutical industries. Furthermore, the model is also expected to be applied in the extraction of other compounds with similar properties to the proposed compound to improve the performance of biomaterial extraction in the pharmaceutical industry.

Author Contributions

Conceptualization, W.B.S. and D.Y.S.; methodology, W.B.S., M.F., M.H., and D.Y.S.; software, W.B.S., D.Y.S., M.F., and M.H.; validation, W.B.S., M.F., and M.H.; formal analysis, D.Y.S. and W.B.S.; investigation, D.Y.S.; resources, D.Y.S.; data curation, D.Y.S.; writing—original draft preparation, D.Y.S.; writing—review and editing, W.B.S., M.F., and M.H.; visualization, D.Y.S.; supervision, W.B.S., M.F., and M.H.; project administration, D.Y.S.; funding acquisition, W.B.S.

Funding

This research and the APC were funded by “Direktorat Penelitian Universitas Gadjah Mada” for research funding through the “Rekognisi Tugas Akhir (RTA) 2019” Programme with letter of assignment number: 3326/UN1/DITLIT/DIT-LIT/LT/2019.

Acknowledgments

The authors would like to thank “Direktorat Jenderal Penguatan Riset dan Pengembangan, Kementerian Riset, Teknologi dan Pendidikan Tinggi” and “Direktorat Penelitian Universitas Gadjah Mada” for the research funding through the “Rekognisi Tugas Akhir (RTA) 2019” Programme.

Conflicts of Interest

The authors declare no conflicts of interest. The funders had no role in the design of the study; in the collection, analysis, or interpretation of data; in the writing of the manuscript; or in the decision to publish the results.

References

  1. Homayoonfal, M.; Mousavi, S.M.; Kiani, H.; Askari, G.; Khani, M.; Rezazad Bari, M.; Alizadeh, M. The use of an innovative inverse numerical modeling method for the evaluation and parameter estimation of barberry anthocyanins ultrasound assisted extraction. Chem. Eng. Process. Process. Intensif. 2018, 133, 1–11. [Google Scholar] [CrossRef]
  2. Ali, A.; Lim, X.Y.; Chong, C.H.; Mah, S.H.; Chua, B.L. Ultrasound-assisted extraction of natural antioxidants from betel leaves (Piper betle): Extraction kinetics and modeling. Sep. Sci. Technol. 2018, 53, 2192–2205. [Google Scholar] [CrossRef]
  3. Boggia, R.; Turrini, F.; Villa, C.; Lacapra, C.; Zunin, P.; Parodi, B. Green extraction from pomegranate marcs for the production of functional foods and cosmetics. Pharmaceuticals 2016, 9, 63. [Google Scholar] [CrossRef] [PubMed]
  4. Tzima, K.; Kallithraka, S.; Kotseridis, Y.; Makris, D.P. Kinetic modelling for flavonoid recovery from red grape (Vitis vinifera) pomace with aqueous lactic acid. Processes 2014, 2, 901–911. [Google Scholar] [CrossRef]
  5. Bachtler, S.; Bart, H.J. Polyphenols from red vine leaves using alternative processing techniques. Processes 2018, 6, 262. [Google Scholar] [CrossRef]
  6. Dranca, F.; Oroian, M. Ultrasound-Assisted Extraction of Pectin from Malus domestica “Fălticeni” Apple Pomace. Processes 2019, 7, 488. [Google Scholar] [CrossRef]
  7. Donno, D.; Mellano, M.G.; Cerutti, A.K.; Beccaro, G.L. Biomolecules and natural medicine preparations: Analysis of new sources of bioactive compounds from Ribes and Rubus spp. buds. Pharmaceuticals 2016, 9, 7. [Google Scholar] [CrossRef] [PubMed]
  8. Makris, D.P. Kinetics of ultrasound-assisted flavonoid extraction from agri-food solid wastes using water/glycerol mixtures. Resources 2016, 5, 7. [Google Scholar] [CrossRef]
  9. Havelt, T.; Brettschneider, S.; Do, X.T.; Korte, I.; Kreyenschmidt, J.; Schmitz, M. Sustainable Extraction and Characterisation of Bioactive Compounds from Horse Chestnut Seed Coats for the Development of Bio-Based Additives. Resources 2019, 8, 114. [Google Scholar] [CrossRef]
  10. Bridson, J.H.; Al-Hakkak, F.; Steward, D.; Al-Hakkak, J. Preparation and morphological, rheological, and structural characterisation of proanthocyanidin coated starch granules. Ind. Crops Prod. 2019, 130, 285–291. [Google Scholar] [CrossRef]
  11. Luo, X.; Cui, J.; Zhang, H.; Duan, Y.; Zhang, D.; Cai, M.; Chen, G. Ultrasound assisted extraction of polyphenolic compounds from red sorghum (Sorghum bicolor L.) bran and their biological activities and polyphenolic compositions. Ind. Crops Prod. 2018, 112, 296–304. [Google Scholar] [CrossRef]
  12. Kurniawati, P.T.; Soetjipto, H.; Limantara, L. Antioxidant and Antibacterial Activities of Bixin Pigment from Annatto (Bixa orellana L.) Seeds. Indones. J. Chem. 2010, 7, 88–92. [Google Scholar] [CrossRef]
  13. Adnadjevic, B.; Koturevic, B.; Jovanovic, J. Comparative kinetic analysis of isothermal extraction of caffeine from guarana seed under conventional and microwave heating. Chem. Eng. Res. Des. 2017, 118, 61–70. [Google Scholar] [CrossRef]
  14. Species, F.; Doan, L.P.; Nguyen, T.T.; Pham, M.Q.; Tran, Q.T. Extraction Process, Identification of Fatty Acids, Tocopherols, Sterols and Phenolic Constituents, and Antioxidant Evaluation of Seed Oils from Five Fabaceae Species. Processes 2019, 7, 456. [Google Scholar] [CrossRef]
  15. Pinela, J.; Prieto, M.A.; Barros, L.; Carvalho, A.M.; Oliveira, M.B.P.P.; Saraiva, J.A.; Ferreira, I.C.F.R. Cold extraction of phenolic compounds from watercress by high hydrostatic pressure: Process modelling and optimization. Sep. Purif. Technol. 2018, 192, 501–512. [Google Scholar] [CrossRef] [Green Version]
  16. Peng, X.; Duan, M.H.; Yao, X.H.; Zhang, Y.H.; Zhao, C.J.; Zu, Y.G.; Fu, Y.J. Green extraction of five target phenolic acids from Lonicerae japonicae Flos with deep eutectic solvent. Sep. Purif. Technol. 2016, 157, 249–257. [Google Scholar] [CrossRef]
  17. Pinela, J.; Prieto, M.A.; Carvalho, A.M.; Barreiro, M.F.; Oliveira, M.B.P.P.; Barros, L.; Ferreira, I.C.F.R. Microwave-assisted extraction of phenolic acids and flavonoids and production of antioxidant ingredients from tomato: A nutraceutical-oriented optimization study. Sep. Purif. Technol. 2016, 164, 114–124. [Google Scholar] [CrossRef] [Green Version]
  18. Yan, L.G.; Xi, J. Micro-mechanism analysis of ultrahigh pressure extraction from green tea leaves by numerical simulation. Sep. Purif. Technol. 2017, 180, 51–57. [Google Scholar] [CrossRef]
  19. Jokić, S.; Šafranko, S.; Jakovljević, M.; Cikoš, A.-M.; Kajić, N.; Kolarević, F.; Babić, J.; Molnar, M. Sustainable Green Procedure for Extraction of Hesperidin from Selected Croatian Mandarin Peels. Processes 2019, 7, 469. [Google Scholar] [CrossRef]
  20. Mustapa, A.N.; Martin, A.; Gallego, J.R.; Mato, R.B.; Cocero, M.J. Microwave-assisted extraction of polyphenols from Clinacanthus nutans Lindau medicinal plant: Energy perspective and kinetics modeling. Chem. Eng. Process. Process. Intensif. 2015, 97, 66–74. [Google Scholar] [CrossRef]
  21. Azmir, J.; Zaidul, I.S.M.; Rahman, M.M.; Sharif, K.M.; Mohamed, A.; Sahena, F.; Jahurul, M.H.A.; Ghafoor, K.; Norulaini, N.A.N.; Omar, A.K.M. Techniques for extraction of bioactive compounds from plant materials: A review. J. Food Eng. 2013, 117, 426–436. [Google Scholar] [CrossRef]
  22. Creencia, E.C.; Nillama, J.A.P.; Librando, I.L. Microwave-assisted extraction and physicochemical evaluation of oil from Hevea brasiliensis seeds. Resources 2018, 7, 28. [Google Scholar] [CrossRef]
  23. Belˇ, A.; Valinger, D.; Tuˇ, A.J.; Benkovi, M. Kinetics and thermodynamics of the solid-liquid extraction process of total polyphenols, antioxidants and extraction yield from Asteraceae plants. Ind. Crop. Prod. J. 2016, 91, 205–214. [Google Scholar]
  24. Dias, A.L.B.; Arroio Sergio, C.S.; Santos, P.; Barbero, G.F.; Rezende, C.A.; Martínez, J. Ultrasound-assisted extraction of bioactive compounds from dedo de moça pepper (Capsicum baccatum L.): Effects on the vegetable matrix and mathematical modeling. J. Food Eng. 2017, 198, 36–44. [Google Scholar] [CrossRef]
  25. Kuhn, M.; Lang, S.; Bezold, F.; Minceva, M.; Briesen, H. Time-resolved extraction of caffeine and trigonelline from finely-ground espresso coffee with varying particle sizes and tamping pressures. J. Food Eng. 2017, 206, 37–47. [Google Scholar] [CrossRef]
  26. Sant’Anna, V.; Brandelli, A.; Marczak, L.D.F.; Tessaro, I.C. Kinetic modeling of total polyphenol extraction from grape marc and characterization of the extracts. Sep. Purif. Technol. 2012, 100, 82–87. [Google Scholar] [CrossRef]
  27. Krysiak-Baltyn, K.; Martin, G.J.O.; Gras, S.L. Computational modelling of large scale phage production using a two-stage batch process. Pharmaceuticals 2018, 11, 31. [Google Scholar] [CrossRef] [PubMed]
  28. Santos, K.S.; Barbosa, A.M.; Freitas, V.; Muniz, A.V.C.S.; Mendonça, M.C.; Calhelha, R.C.; Ferreira, I.C.F.R.; Franceschi, E.; Padilha, F.F.; Oliveira, M.B.P.P.; et al. Antiproliferative activity of neem leaf extracts obtained by a sequential pressurized liquid extraction. Pharmaceuticals 2018, 11, 76. [Google Scholar] [CrossRef] [PubMed]
  29. Wang, W.; Xu, W.; Dai, G.; Zhang, P.; Tang, K. Process optimization of reactive extraction of clorprenaline enantiomers by experiment and simulation. Chem. Eng. Process. Process. Intensif. 2018, 134, 141–152. [Google Scholar] [CrossRef]
  30. Pace, D.K. Modeling and simulation verification and validation challenges. Johns Hopkins APL Tech. Dig. (Appl. Phys. Lab.) 2004, 25, 163–172. [Google Scholar]
  31. Schmidt, A.; Strube, J. Distinct and quantitative validation method for predictive process modeling with examples of liquid-liquid extraction processes of complex feed mixtures. Processes 2019, 7, 298. [Google Scholar] [CrossRef]
  32. Chan, C.H.; Yusoff, R.; Ngoh, G.C. Modeling and kinetics study of conventional and assisted batch solvent extraction. Chem. Eng. Res. Des. 2014, 92, 1169–1186. [Google Scholar] [CrossRef]
  33. Cheng, S.; Sun, Y.; Halgreen, L. The Relationship perikarp and tannin content. Asian J. Crop. Sci. 2009, 1, 1–5. [Google Scholar]
  34. Tao, Y.; Zhang, Z.; Sun, D.W. Kinetic modeling of ultrasound-assisted extraction of phenolic compounds from grape marc: Influence of acoustic energy density and temperature. Ultrason. Sonochem. 2014, 21, 1461–1469. [Google Scholar] [CrossRef] [PubMed]
  35. Rodríguez-Jimenes, G.C.; Vargas-Garcia, A.; Espinoza-Pérez, D.J.; Salgado-Cervantes, M.A.; Robles-Olvera, V.J.; García-Alvarado, M.A. Mass Transfer During Vanilla Pods Solid Liquid Extraction: Effect of Extraction Method. Food Bioprocess. Technol. 2013, 6, 2640–2650. [Google Scholar] [CrossRef]
  36. Gessner, M.O.; Steiner, D. Acid Butanol Assay for Proanthocyanidin (Condensed Tannins). In Methods to Study Litter Decomposition; Springer: Dordrecht, The Netherlands, 2005; pp. 107–113. [Google Scholar]
  37. Shay, P.E.; Trofymow, J.A.; Constabel, C.P. An improved butanol-HCl assay for quantification of water-soluble, acetone: Methanol-soluble, and insoluble proanthocyanidins (condensed tannins). Plant Methods 2017, 13, 63. [Google Scholar] [CrossRef] [PubMed]
  38. de Souza, V.B.; Thomazini, M.; Echalar Barrientos, M.A.; Nalin, C.M.; Ferro-Furtado, R.; Genovese, M.I.; Favaro-Trindade, C.S. Functional properties and encapsulation of a proanthocyanidin-rich cinnamon extract (Cinnamomum zeylanicum) by complex coacervation using gelatin and different polysaccharides. Food Hydrocoll. 2018, 77, 297–306. [Google Scholar] [CrossRef]
  39. Kashiri, M.; Kashaninejad, M.; Aghajani, N. Modeling water absorption of sorghum during soaking. Lat. Am. Appl. Res. 2010, 40, 383–388. [Google Scholar]
  40. Perez, E.E.; Carelli, A.A.; Crapiste, G.H. Temperature-dependent diffusion coefficient of oil from different sunflower seeds during extraction with hexane. J. Food Eng. 2011, 105, 180–185. [Google Scholar] [CrossRef]
  41. Santos, D.T.; Cavalcanti, R.N.; Rostagno, M.A.; Queiroga, C.L.; Eberlin, M.N.; Meireles, M.A.A. Extraction of Polyphenols and Anthocyanins from the Jambul (Syzygium cumini) Fruit Peels. Food Public Health 2013, 3, 119–129. [Google Scholar] [CrossRef]
  42. Hasanzadeh, R.; Souraki, B.A. Experimental and Theoretical Investigation of Mass Transfer during Leaching of Starch and Protein from Potato. Chem. Eng. Commun. 2016, 203, 1105–1115. [Google Scholar] [CrossRef] [Green Version]
  43. Yang, W. A Modified Radial Basis Function Method for Predicting Debris Flow Mean Velocity. J. Eng. Technol. Sci. 2017, 49, 561. [Google Scholar] [CrossRef]
  44. Tan, W.N. A Low-Dimensional Model for the Maximal Amplification Factor of Bichromatic Wave Groups. J. Eng. Technol. Sci. 2003, 35, 139–153. [Google Scholar] [Green Version]
  45. Crank, J. The Mathematics of Diffusion, 2nd ed.; Clarendon Press: London, UK, 1975. [Google Scholar]
  46. Cussler, E.L. Diffusion Mass Transfer in Fluid Systems, 3rd ed.; Cambridge University Press: Cambridge, UK, 2009; ISBN 9780521871211. [Google Scholar]
  47. Tsioptsias, N.; Tako, A.; Robinson, S. Model Validation and Testing in Simulation: A Literature Review. In Proceedings of the 5th Student Conference on Operational Research, Nottingham, UK, 8–10 April 2016; Volume 6, pp. 1–11. [Google Scholar]
  48. Mokrani, A.; Madani, K. Effect of Solvent, Time and Temperature on the Extraction of Phenolic Compounds and Antioxidant Capacity of Peach (Prunus persica L.) Fruit; Elsevier B.V.: Amsterdam, The Netherlands, 2016; Volume 162, ISBN 2135415065. [Google Scholar]
  49. Pérez-Armada, L.; Rivas, S.; González, B.; Moure, A. Extraction of phenolic compounds from hazelnut shells by green processes. J. Food Eng. 2019, 255, 1–8. [Google Scholar] [CrossRef]
  50. Bröhan, M.; Jerkovic, V.; Wilmotte, R.; Collin, S. Catechins and derived procyanidins in red and white sorghum: Their contributions to antioxidant activity. J. Inst. Brew. 2011, 117, 600–607. [Google Scholar] [CrossRef]
  51. Khoddami, A.; Truong, H.H.; Liu, S.Y.; Roberts, T.H.; Selle, P.H. Concentrations of specific phenolic compounds in six red sorghums influence nutrient utilisation in broiler chickens. Anim. Feed Sci. Technol. 2015, 210, 190–199. [Google Scholar] [CrossRef]
  52. Syukri, Y.; Martien, R.; Lukitaningsih, E.; Nugroho, A.E. Quantification of andrographolide isolated from andrographis paniculata nees obtained from traditional market in yogyakarta using validated HPLC. Indones. J. Chem. 2016, 16, 190–197. [Google Scholar] [CrossRef]
Figure 1. Schematic of bioactive compound mass transfer from pericarp to solvent.
Processes 07 00837 g001
Figure 2. The profile of the phytochemical concentration inside the pericarp as a function of: (a) position; and (b) extraction time.
Processes 07 00837 g002
Figure 3. The profile of the phytochemical concentration inside the pericarp as a function of: (a) position; and (b) extraction time.
Processes 07 00837 g003
Figure 4. The profile of: (a) P concentration in aqueous extract; and, (b) the yield of extraction as a function of extraction time.
Processes 07 00837 g004
Figure 5. The effect of the: (a) initial P concentration in the pericarp; (b) effective diffusivity; (c) mass transfer coefficient; and, (d) slab thickness on the P concentration in the extract.
Processes 07 00837 g005
Figure 6. The effect of the: (a) initial P concentration in the pericarp; (b) effective diffusivity; (c) mass transfer coefficient; and, (d) slab thickness on the yield of the extraction.
Processes 07 00837 g006
Figure 7. The comparison of the analytical solution and the numerical solution under the conditions of a very thick slab and very slow diffusivity.
Processes 07 00837 g007
Figure 8. The comparison of the analytical solution and the numerical solution under the conditions of a constant phytochemical concentration in the solvent and very slow diffusion.
Processes 07 00837 g008
Figure 9. The comparison of the predicted and experimental P concentration in solvent.
Processes 07 00837 g009
Figure 10. The correlation of the predicted and experimental P concentration in aqueous extract.
Processes 07 00837 g010
Table 1. The values of the parameters applied in the model’s simulation.
ParameterValueUnit
DeP0.0000025cm2/min
R0.3cm
L0.03cm
H0.5-
V500mL
π3.14159-
Nb20grain
dx0.003cm
kc0.0004cm/min
CP00.1g Pequivalent/cm3 pericarp
CPf00g Pequivalent/cm3 solvent
Table 2. The parameter values of the model based on experimental data from the extraction process.
Temperature (°C)DeP × 107 (cm2/min)H × 104kc × 102 (cm/min)SSE × 1010
500.9264.183.81.65
601.116.332.530.264
70167 1122.4

