The Rotating Components Performance Diagnosis of Gas Turbine Based on the Hybrid Filter


Abstract
:1. Introduction
2. Materials and Methods
2.1. Fault Diagnosis Algorithm of Gas Turbine Based on Hybrid Filter
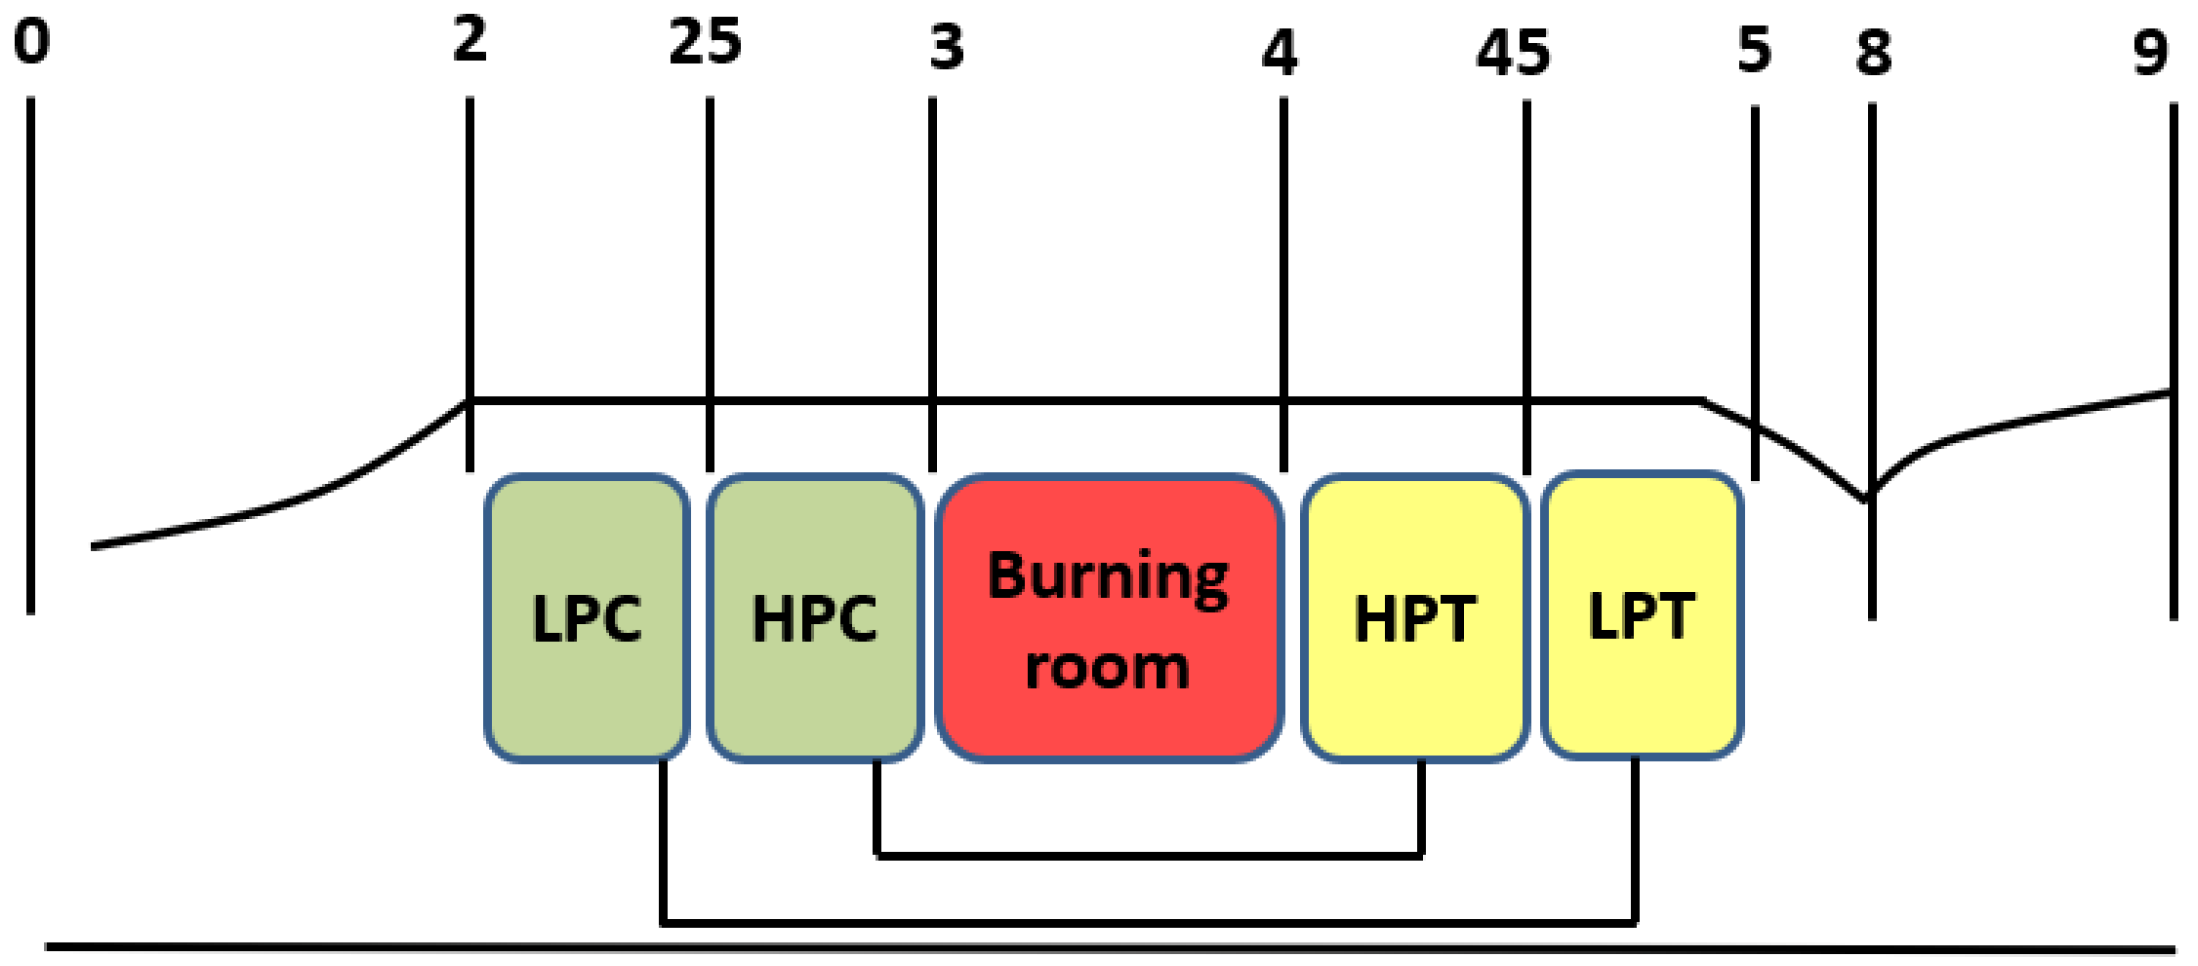
| Total temperature at the outlet of LPC | Total temperature at the outlet of HPC |
| Total temperature at the outlet of LPT | Total temperature at the outlet of HPT |
| Total pressure at the outlet of LPC | Total pressure at the outlet of HPC |
| Total pressure at the outlet of LPT | Total pressure at the outlet of HPT |
| Low Pressure Compressor (LPC) | High Pressure Compressor (HPC) |
| Low Pressure Turbine (LPT) | High Pressure Turbine (HPT) |
2.2. Problem in the UKF
2.3. Resolution
- (1)
- Construct a variance vector which consist of the diagonal elements of . Furthermore, obtain the residual vector which consist of diagonal elements of .
- (2)
- Similarity calculation between and .
2.4. Health Parameters Estimation
- (3)
- Particles resampling:
- (4)
- Optimize the health parameters:
- 1
- Generate the measured parameters from a software named Gasturb13 (Gasturb 13 is a simulation software for gas turbine performance calculation with high accuracy). Add noise w to these measured parameters. , N is the normal probability density function.
- 2
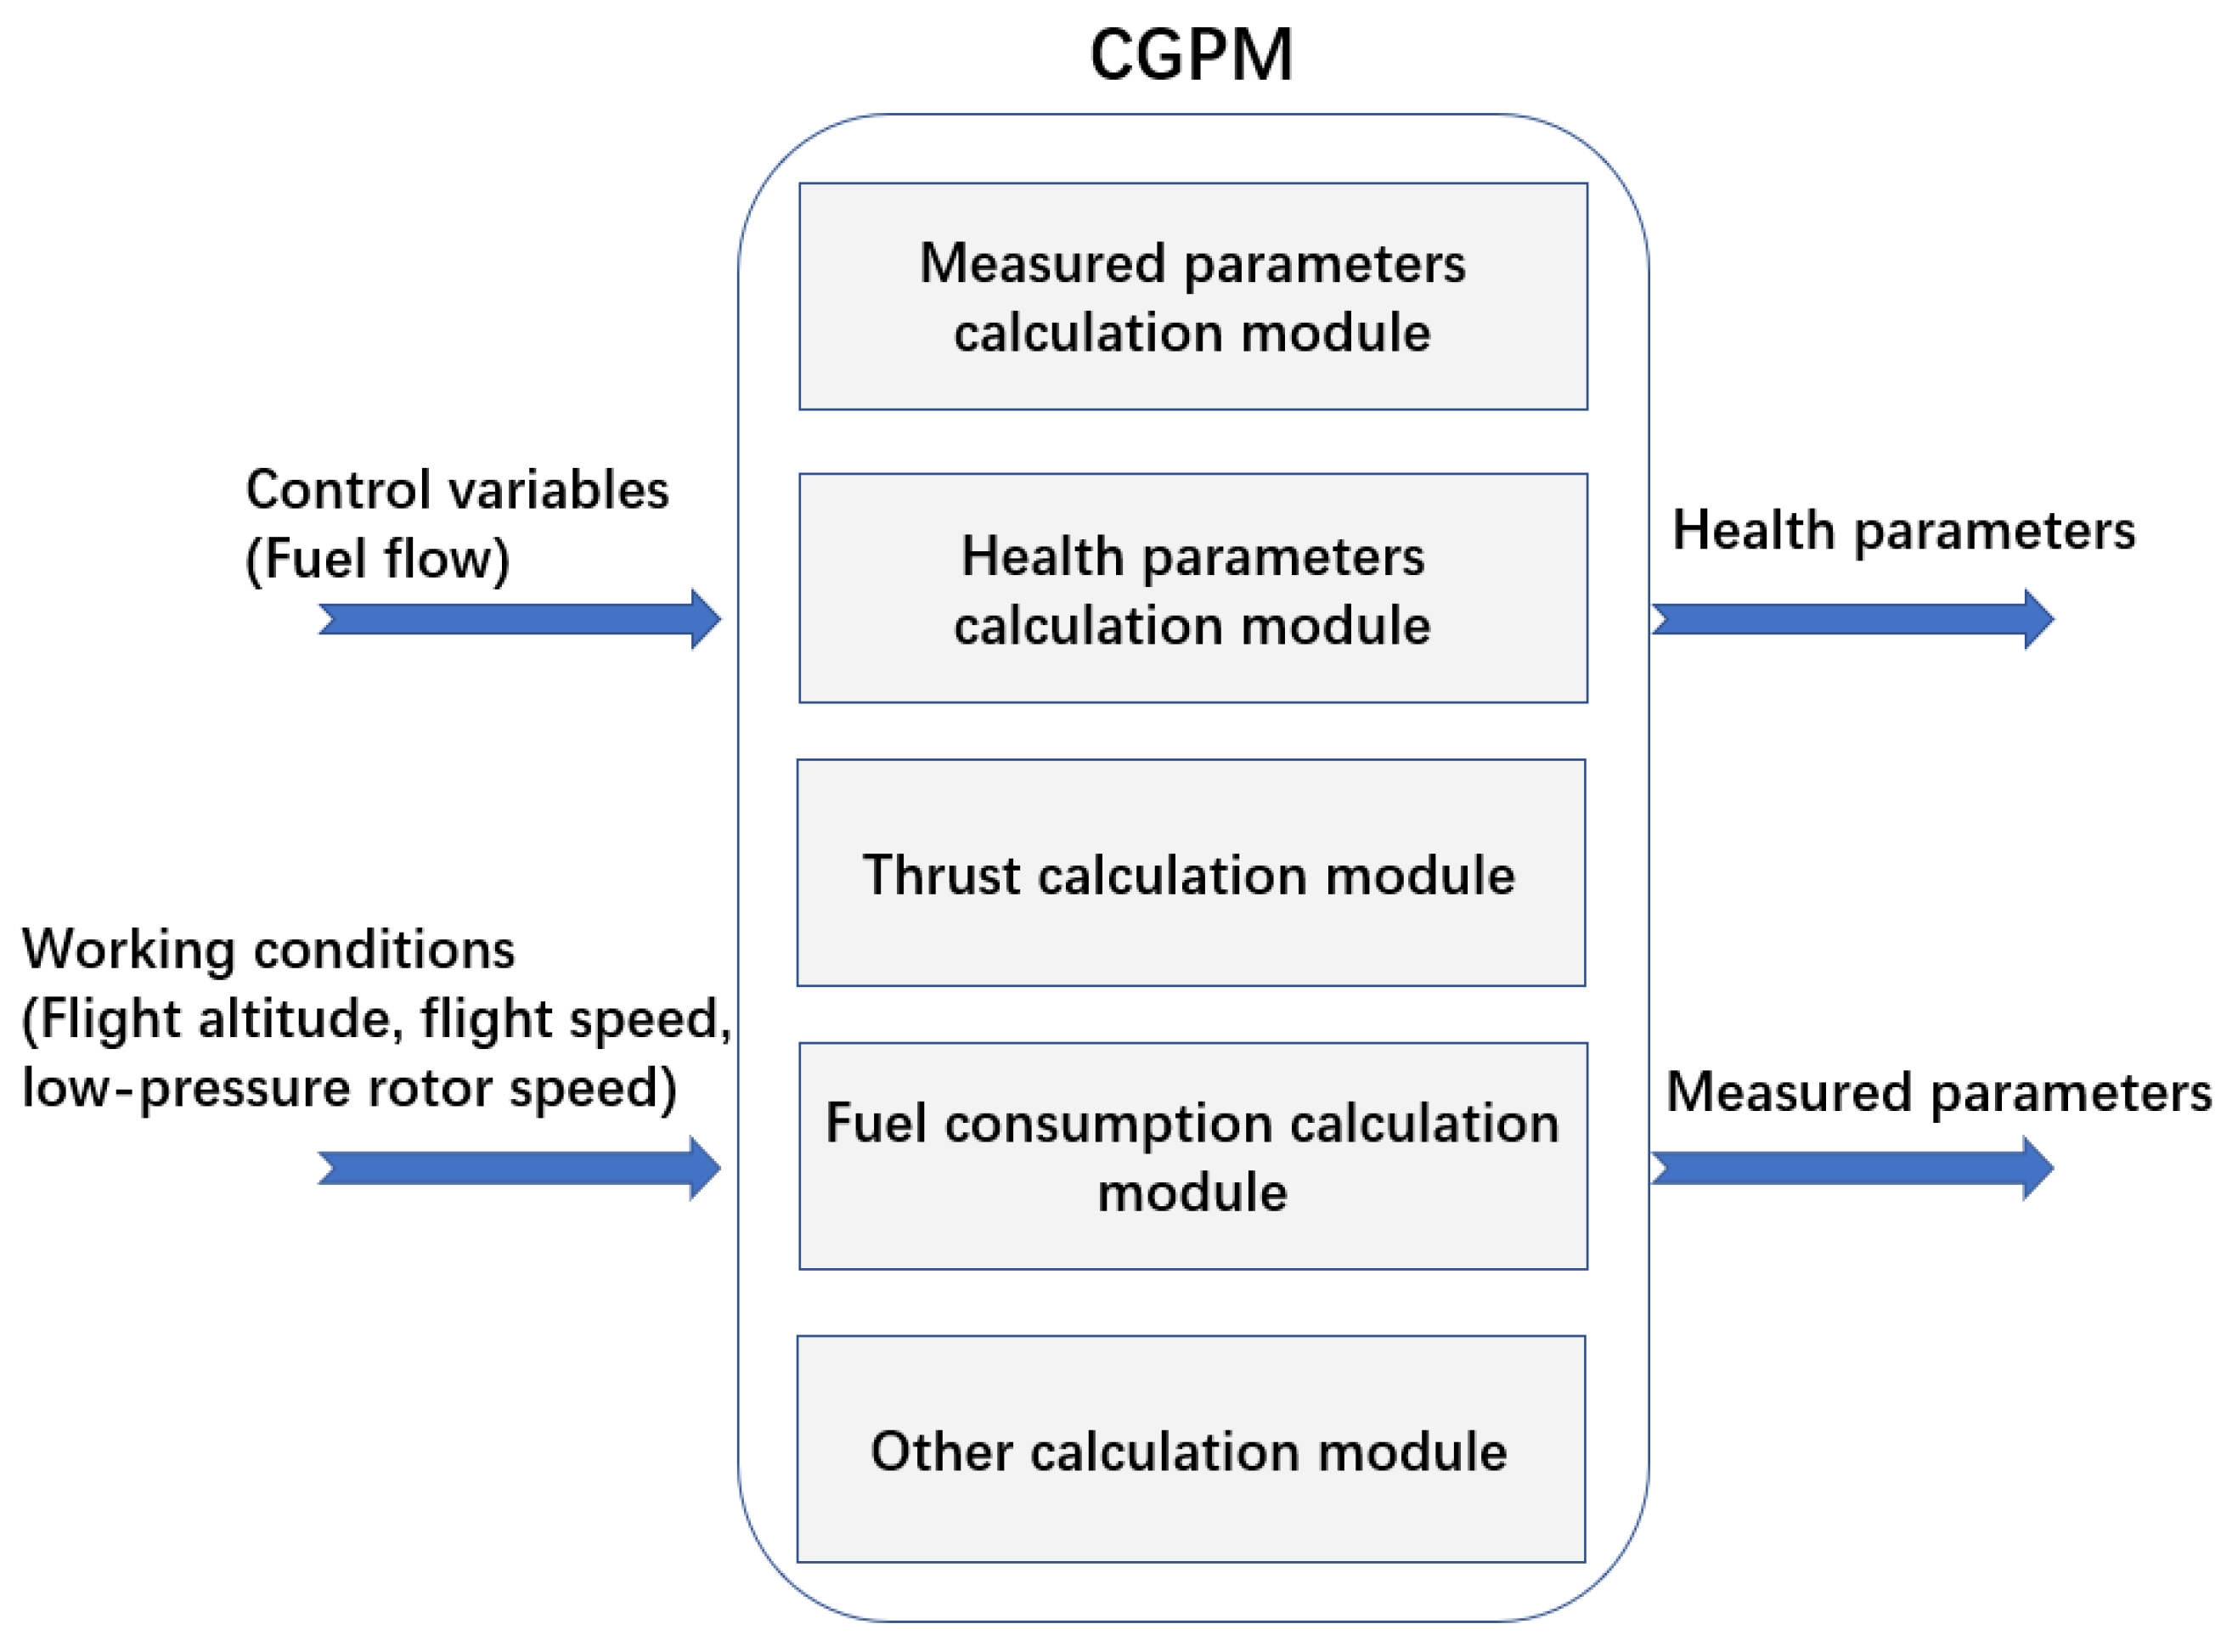
- Establish the Component-level Gas Path Model of turbojet. This model is the detailed expression of the Equations (1) and (2).
- 3
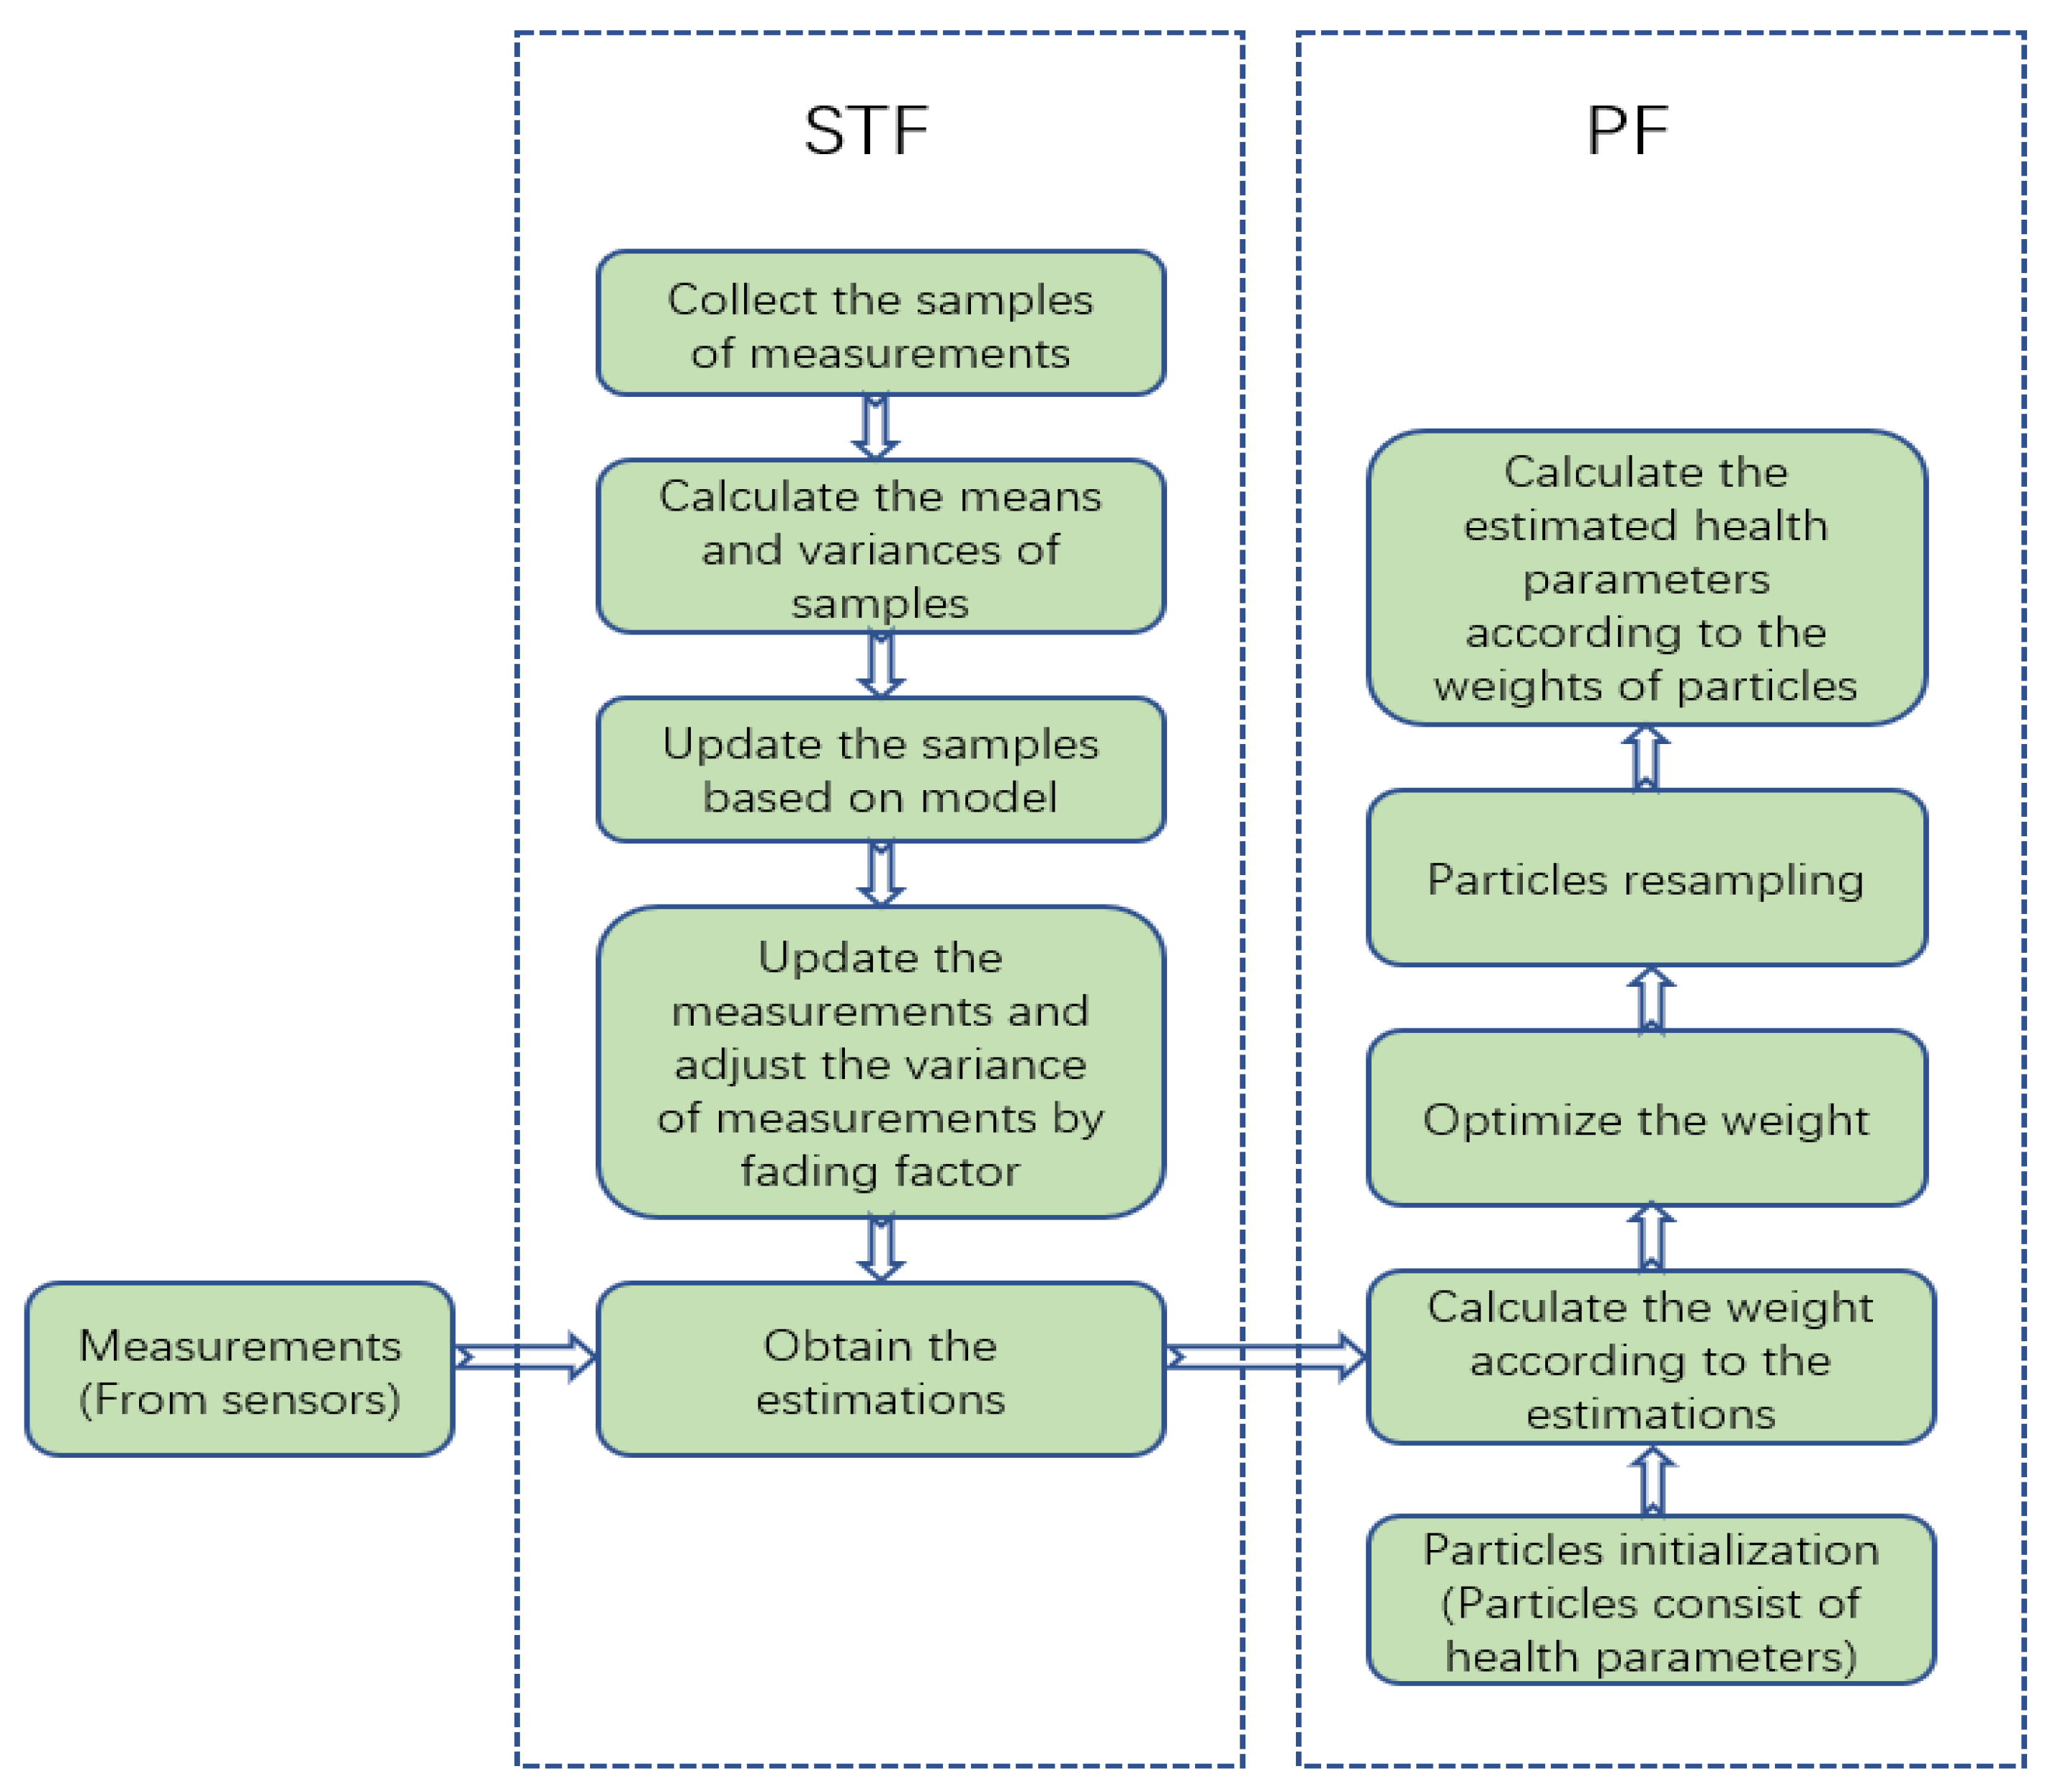
- Build the module of strong tracking filter according the method introduced in Section 2.3. The measured parameters including noise are input into the module and output to the particle filter after being processed by the strong tracking filter.
- 4
- Build the module of particle filer with weight optimization according to the method introduced in Section 2.4. This module is used to estimate the health parameters.
- 5
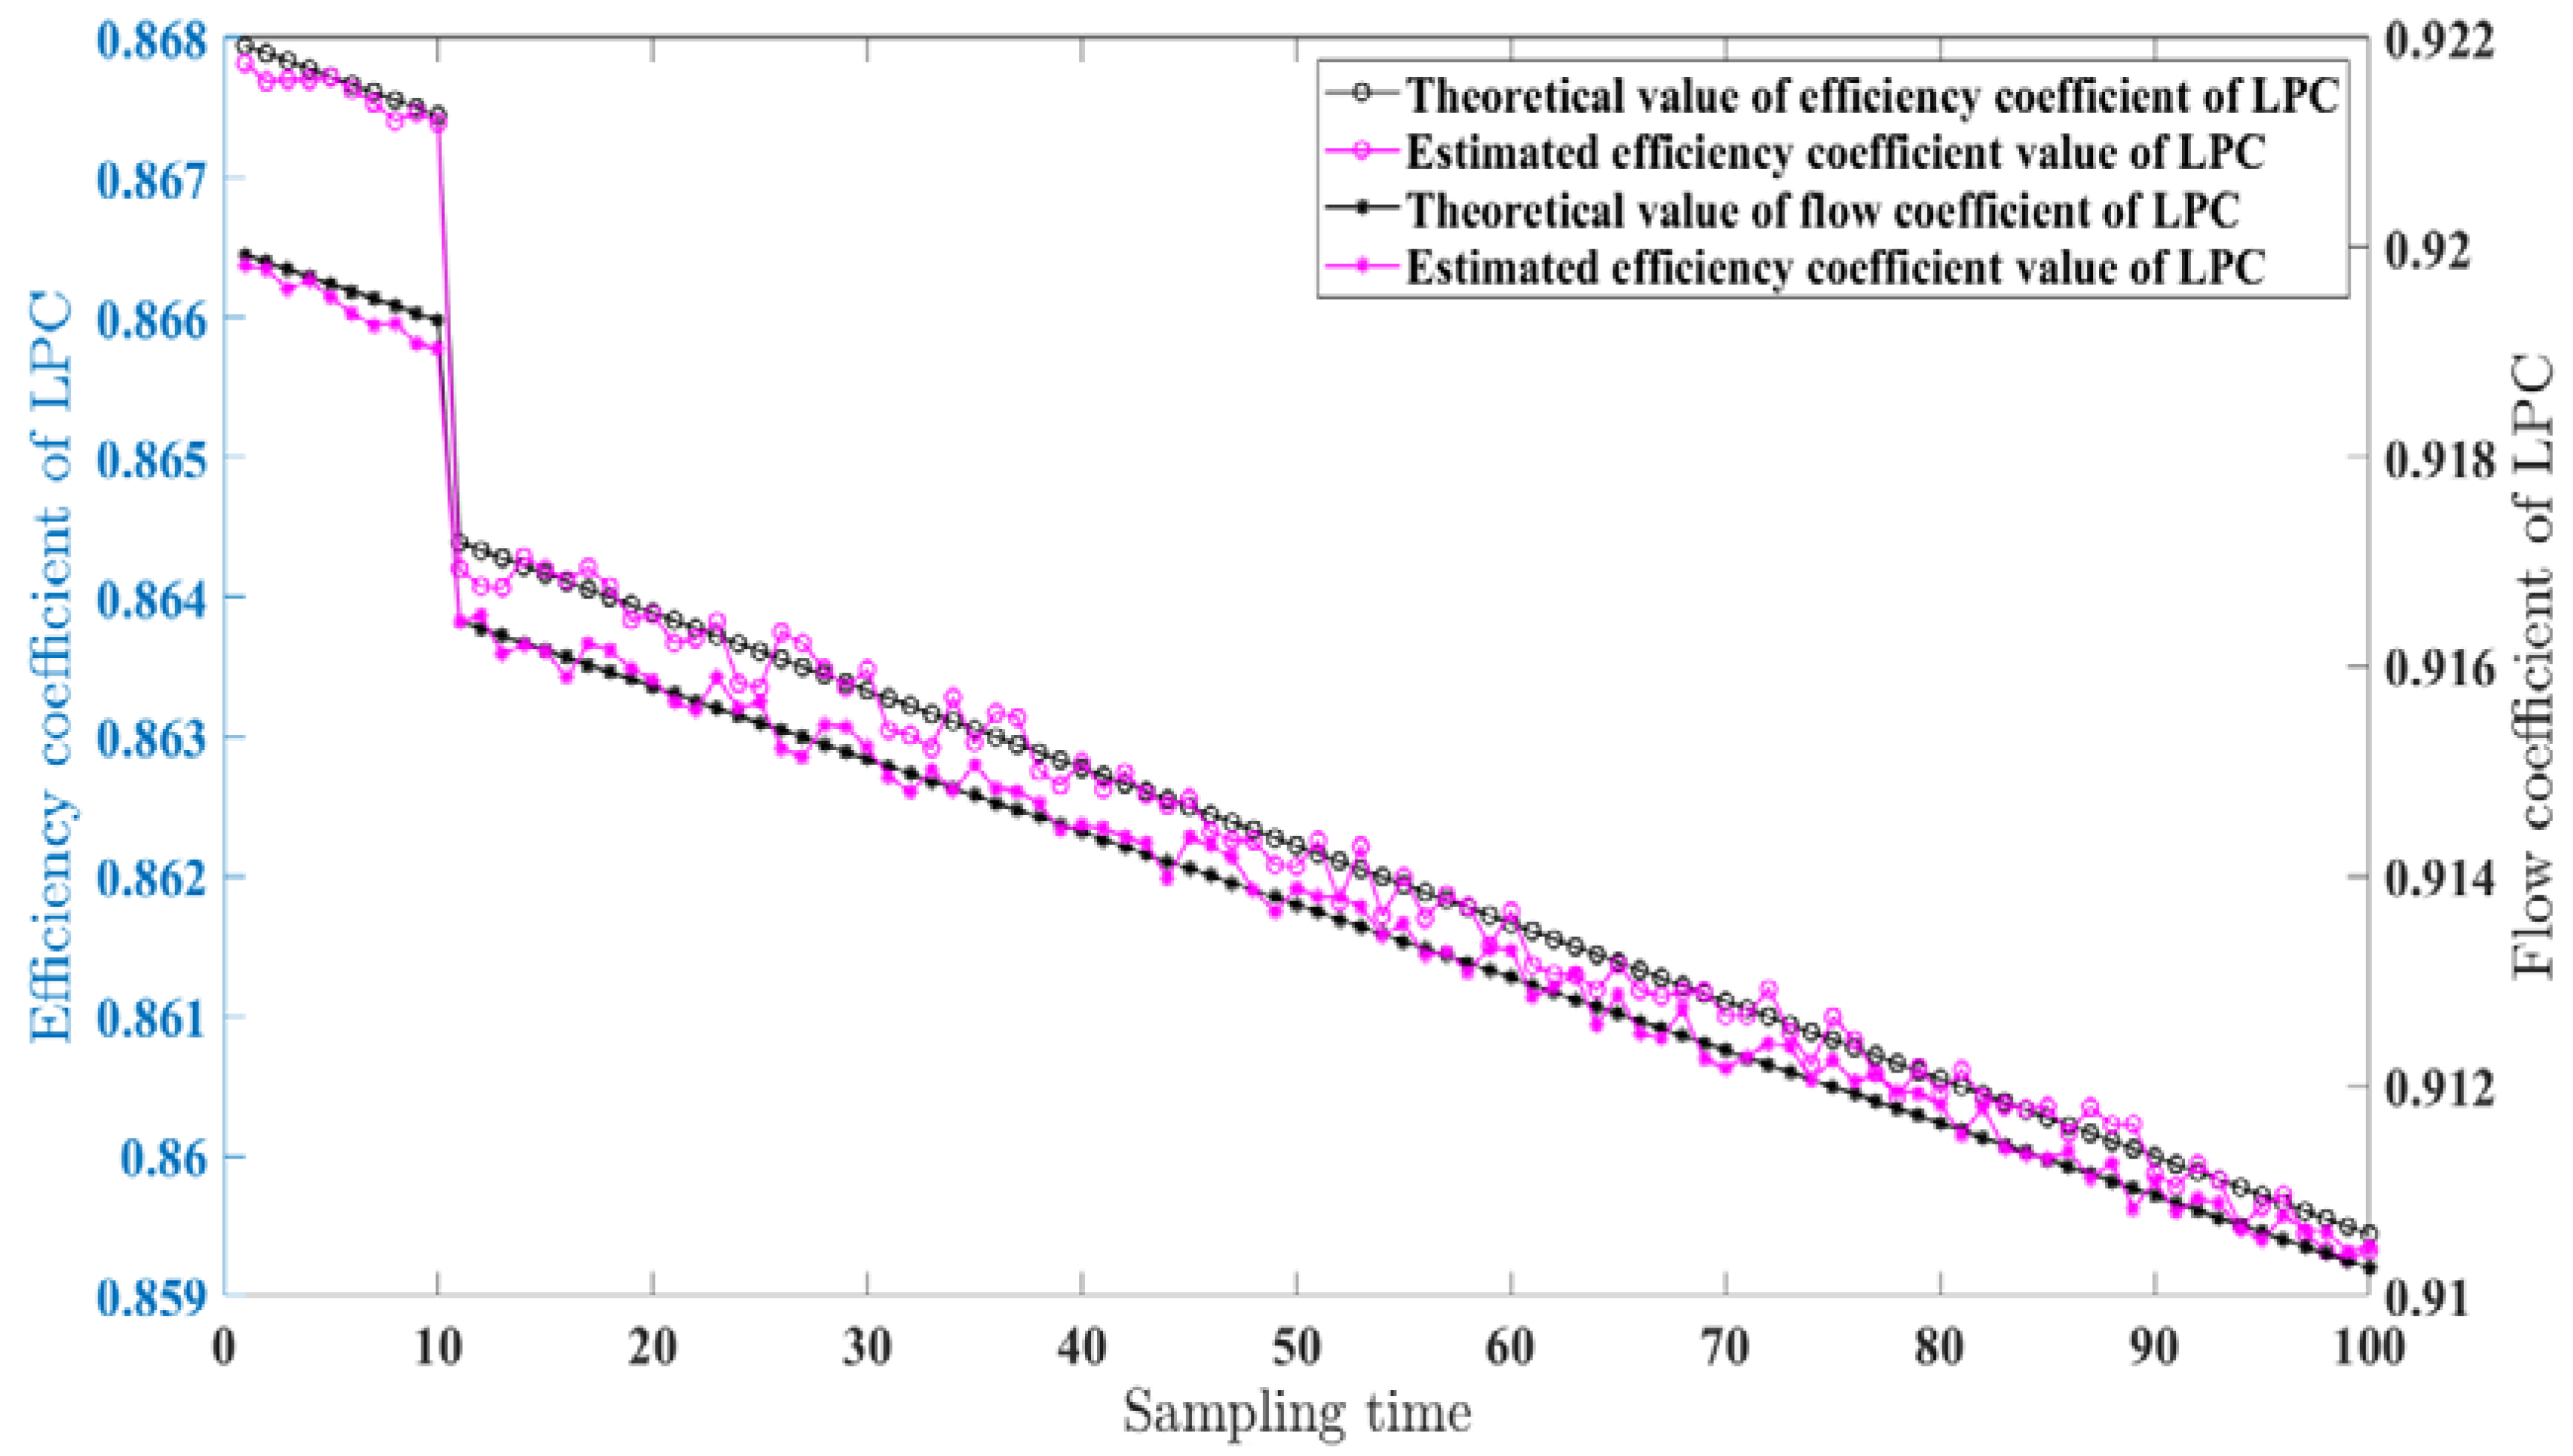
- Input the measured parameters to the particle filter and estimate the health parameters. The way to simulate the failure are listed as follows:
| Efficiency of LPC: ELPC = 0.868 | Pressure ratio of LPC: |
| Efficiency of HPC: EHPC = 0.878 | Pressure ratio of HPC: |
| Efficiency of high-pressure rotator: EHPR = 0.98 | Efficiency of low-pressure rotator: ELPR = 0.98 |
| Efficiency of burning room: EBR = 0.98 | Air intake coefficient of cabin: EAI = 0.01 |
| Cooling coefficient of HPT: CHPT = 0.03 | Efficiency of HPT: EHPT = 0.89 |
| Cooling coefficient of LPT: CLPT = 0.01 | Efficiency of LPT: ELPT = 0.91 |
| Design rotating speed of Low Pressure Rotator: SLPR = 104r/m | |
| Design rotating speed of High Pressure Rotator: SHPR = 1.6 × 10⁴r/m | |
| Total temperature at the outlet of burning room: Tt4 = 1600 K | |
| Heat value of fuel: FHV = 4.29 × 10⁴ | |
3. Conclusions
- 1
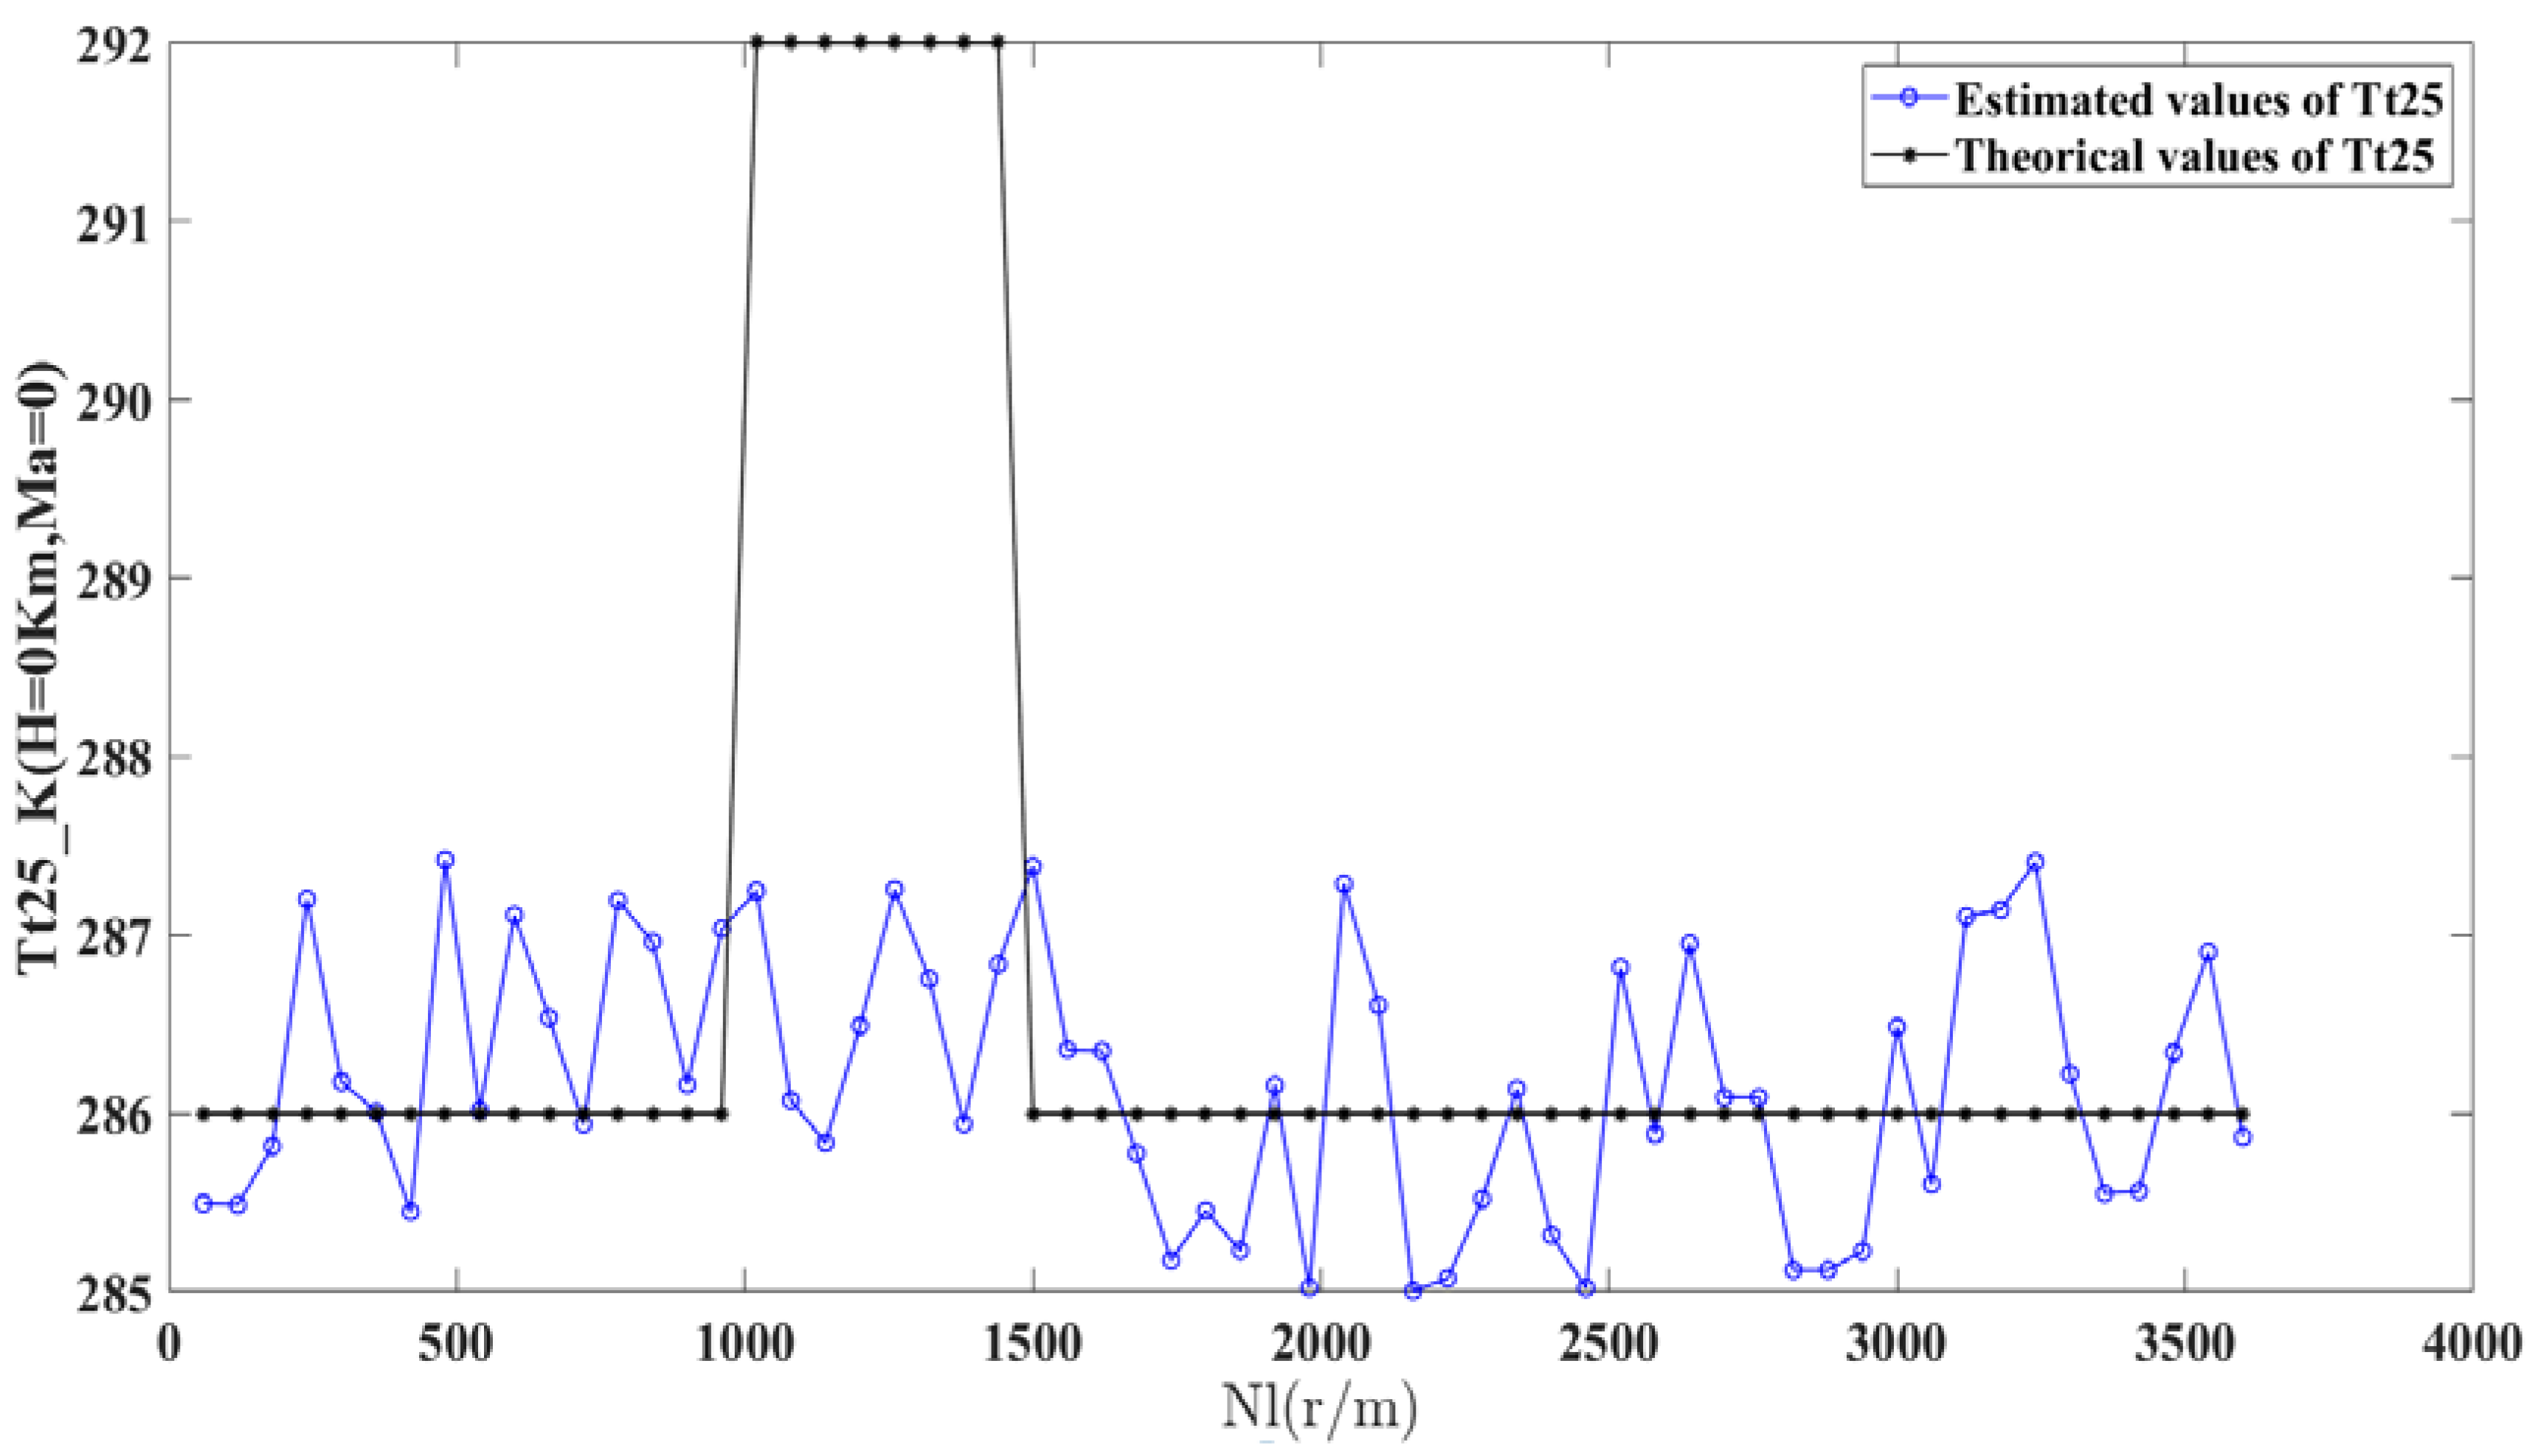
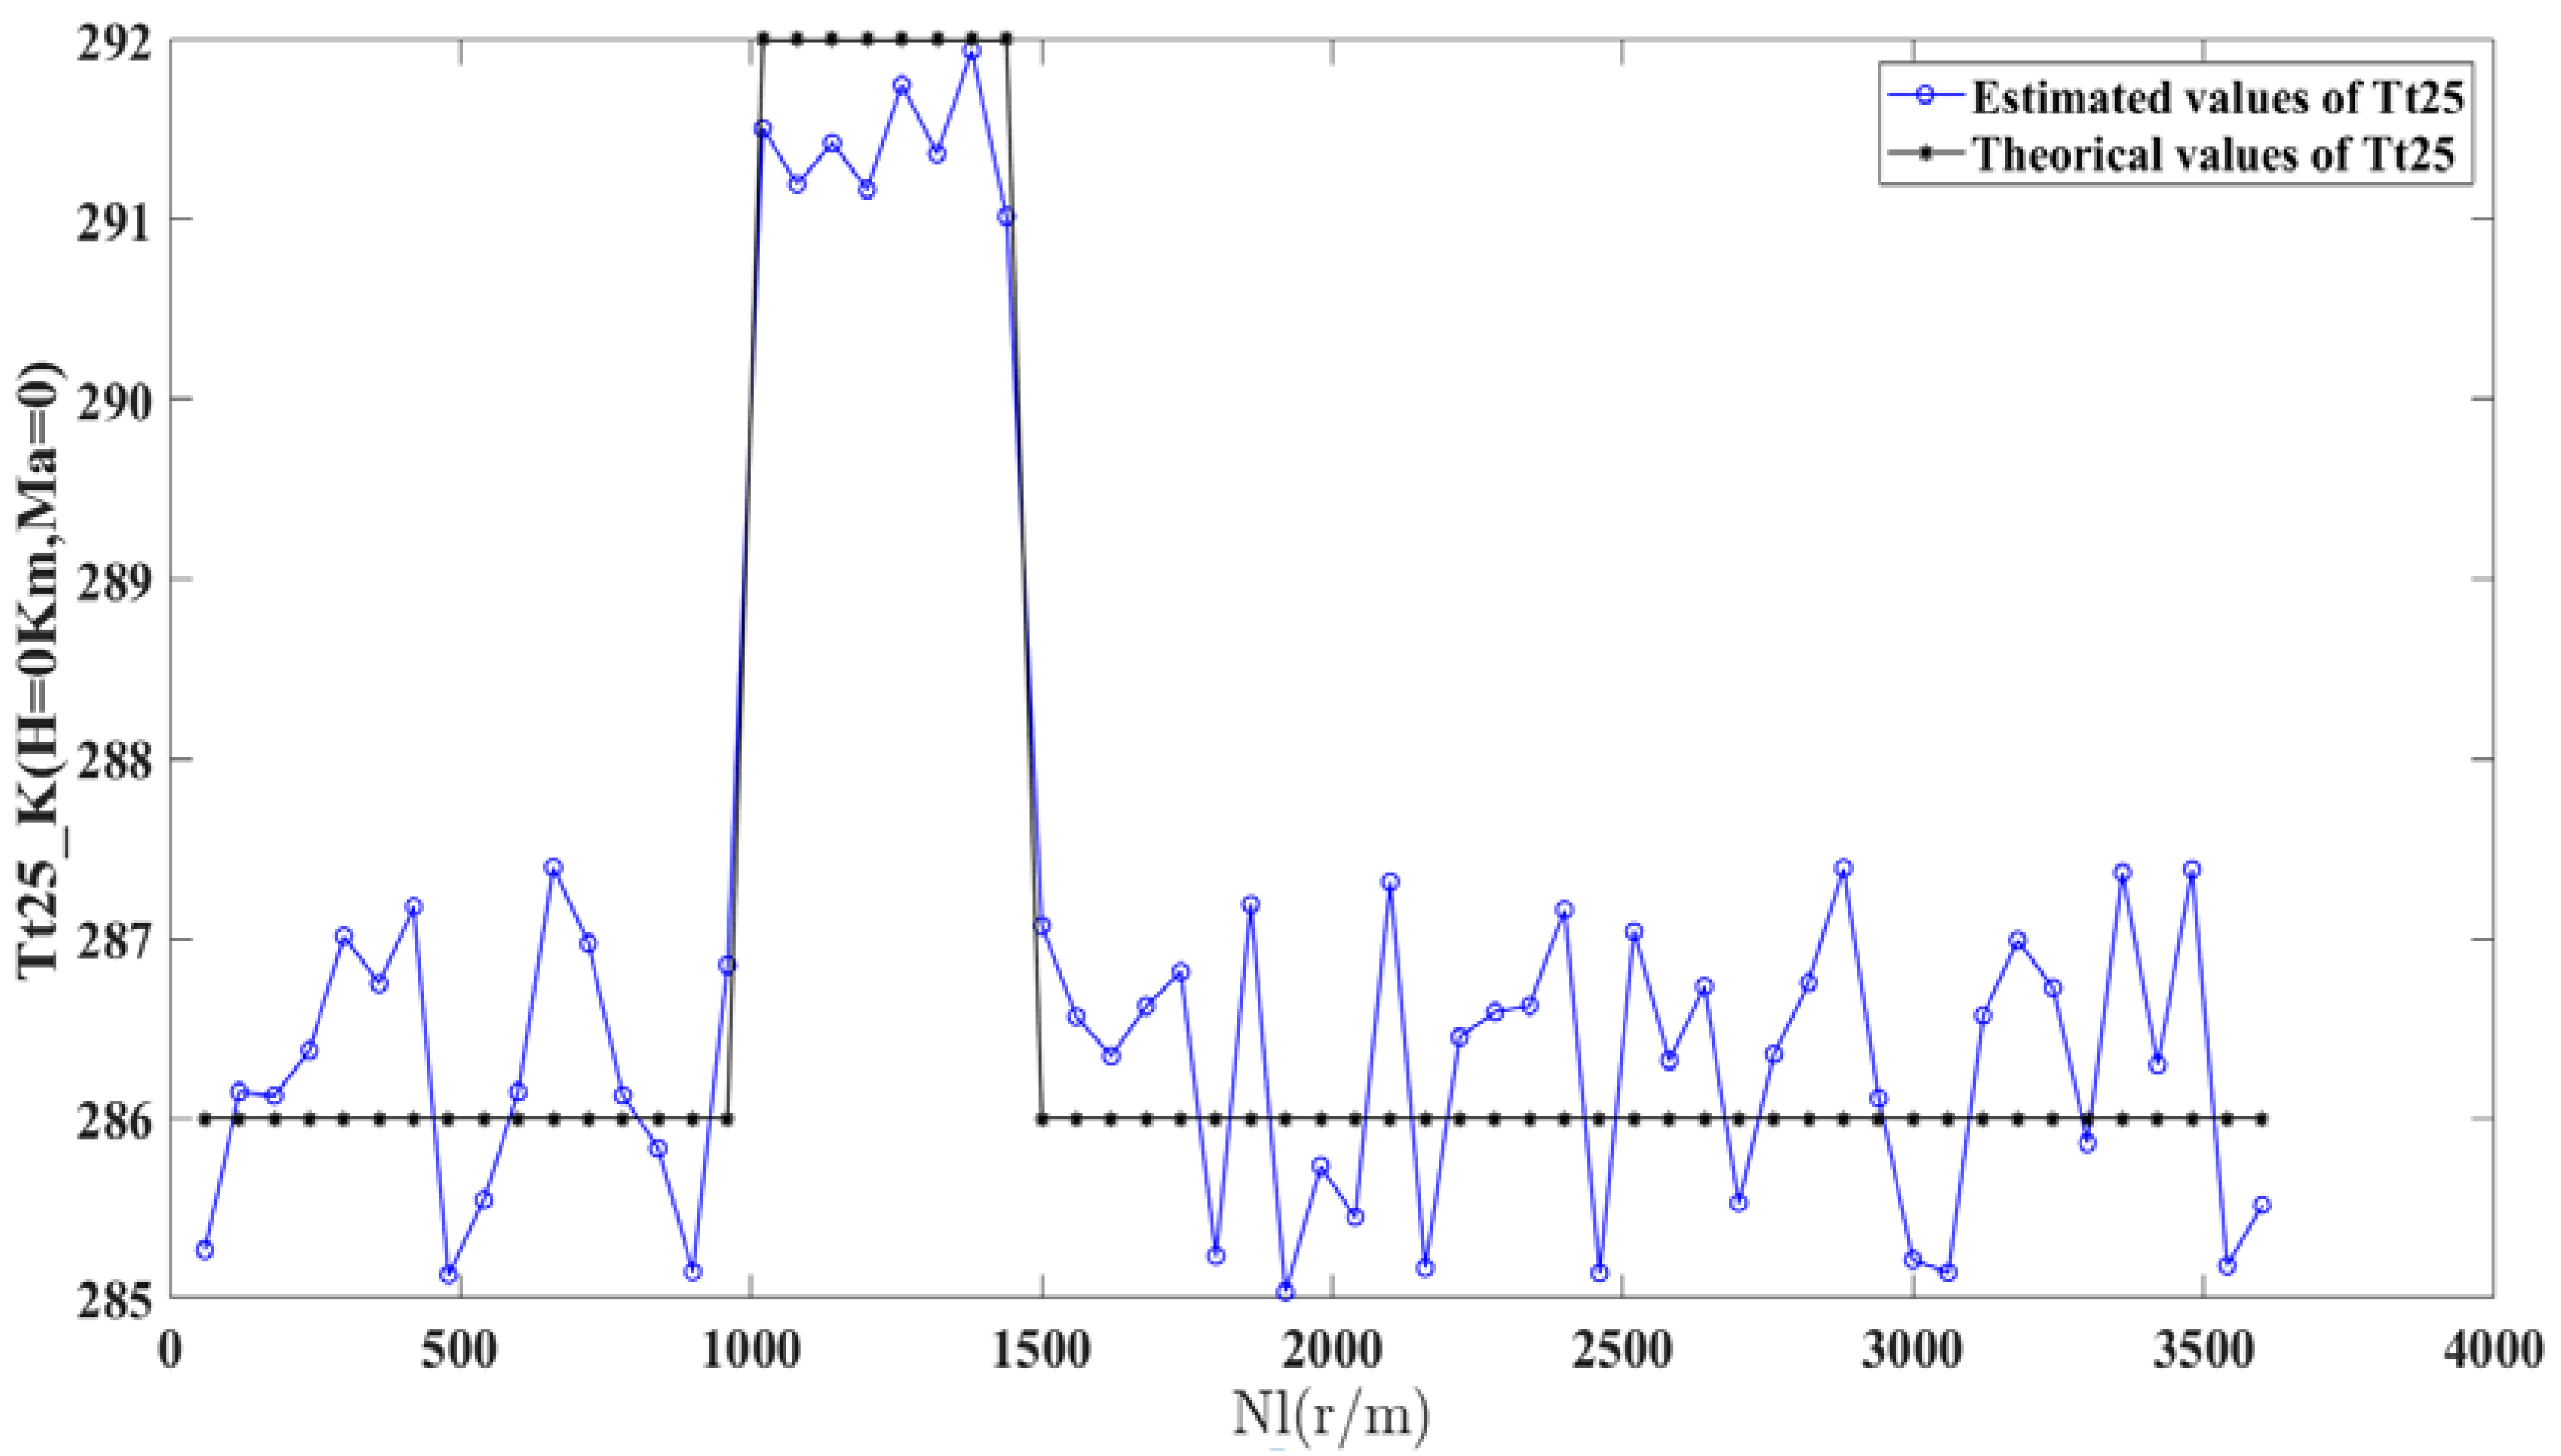
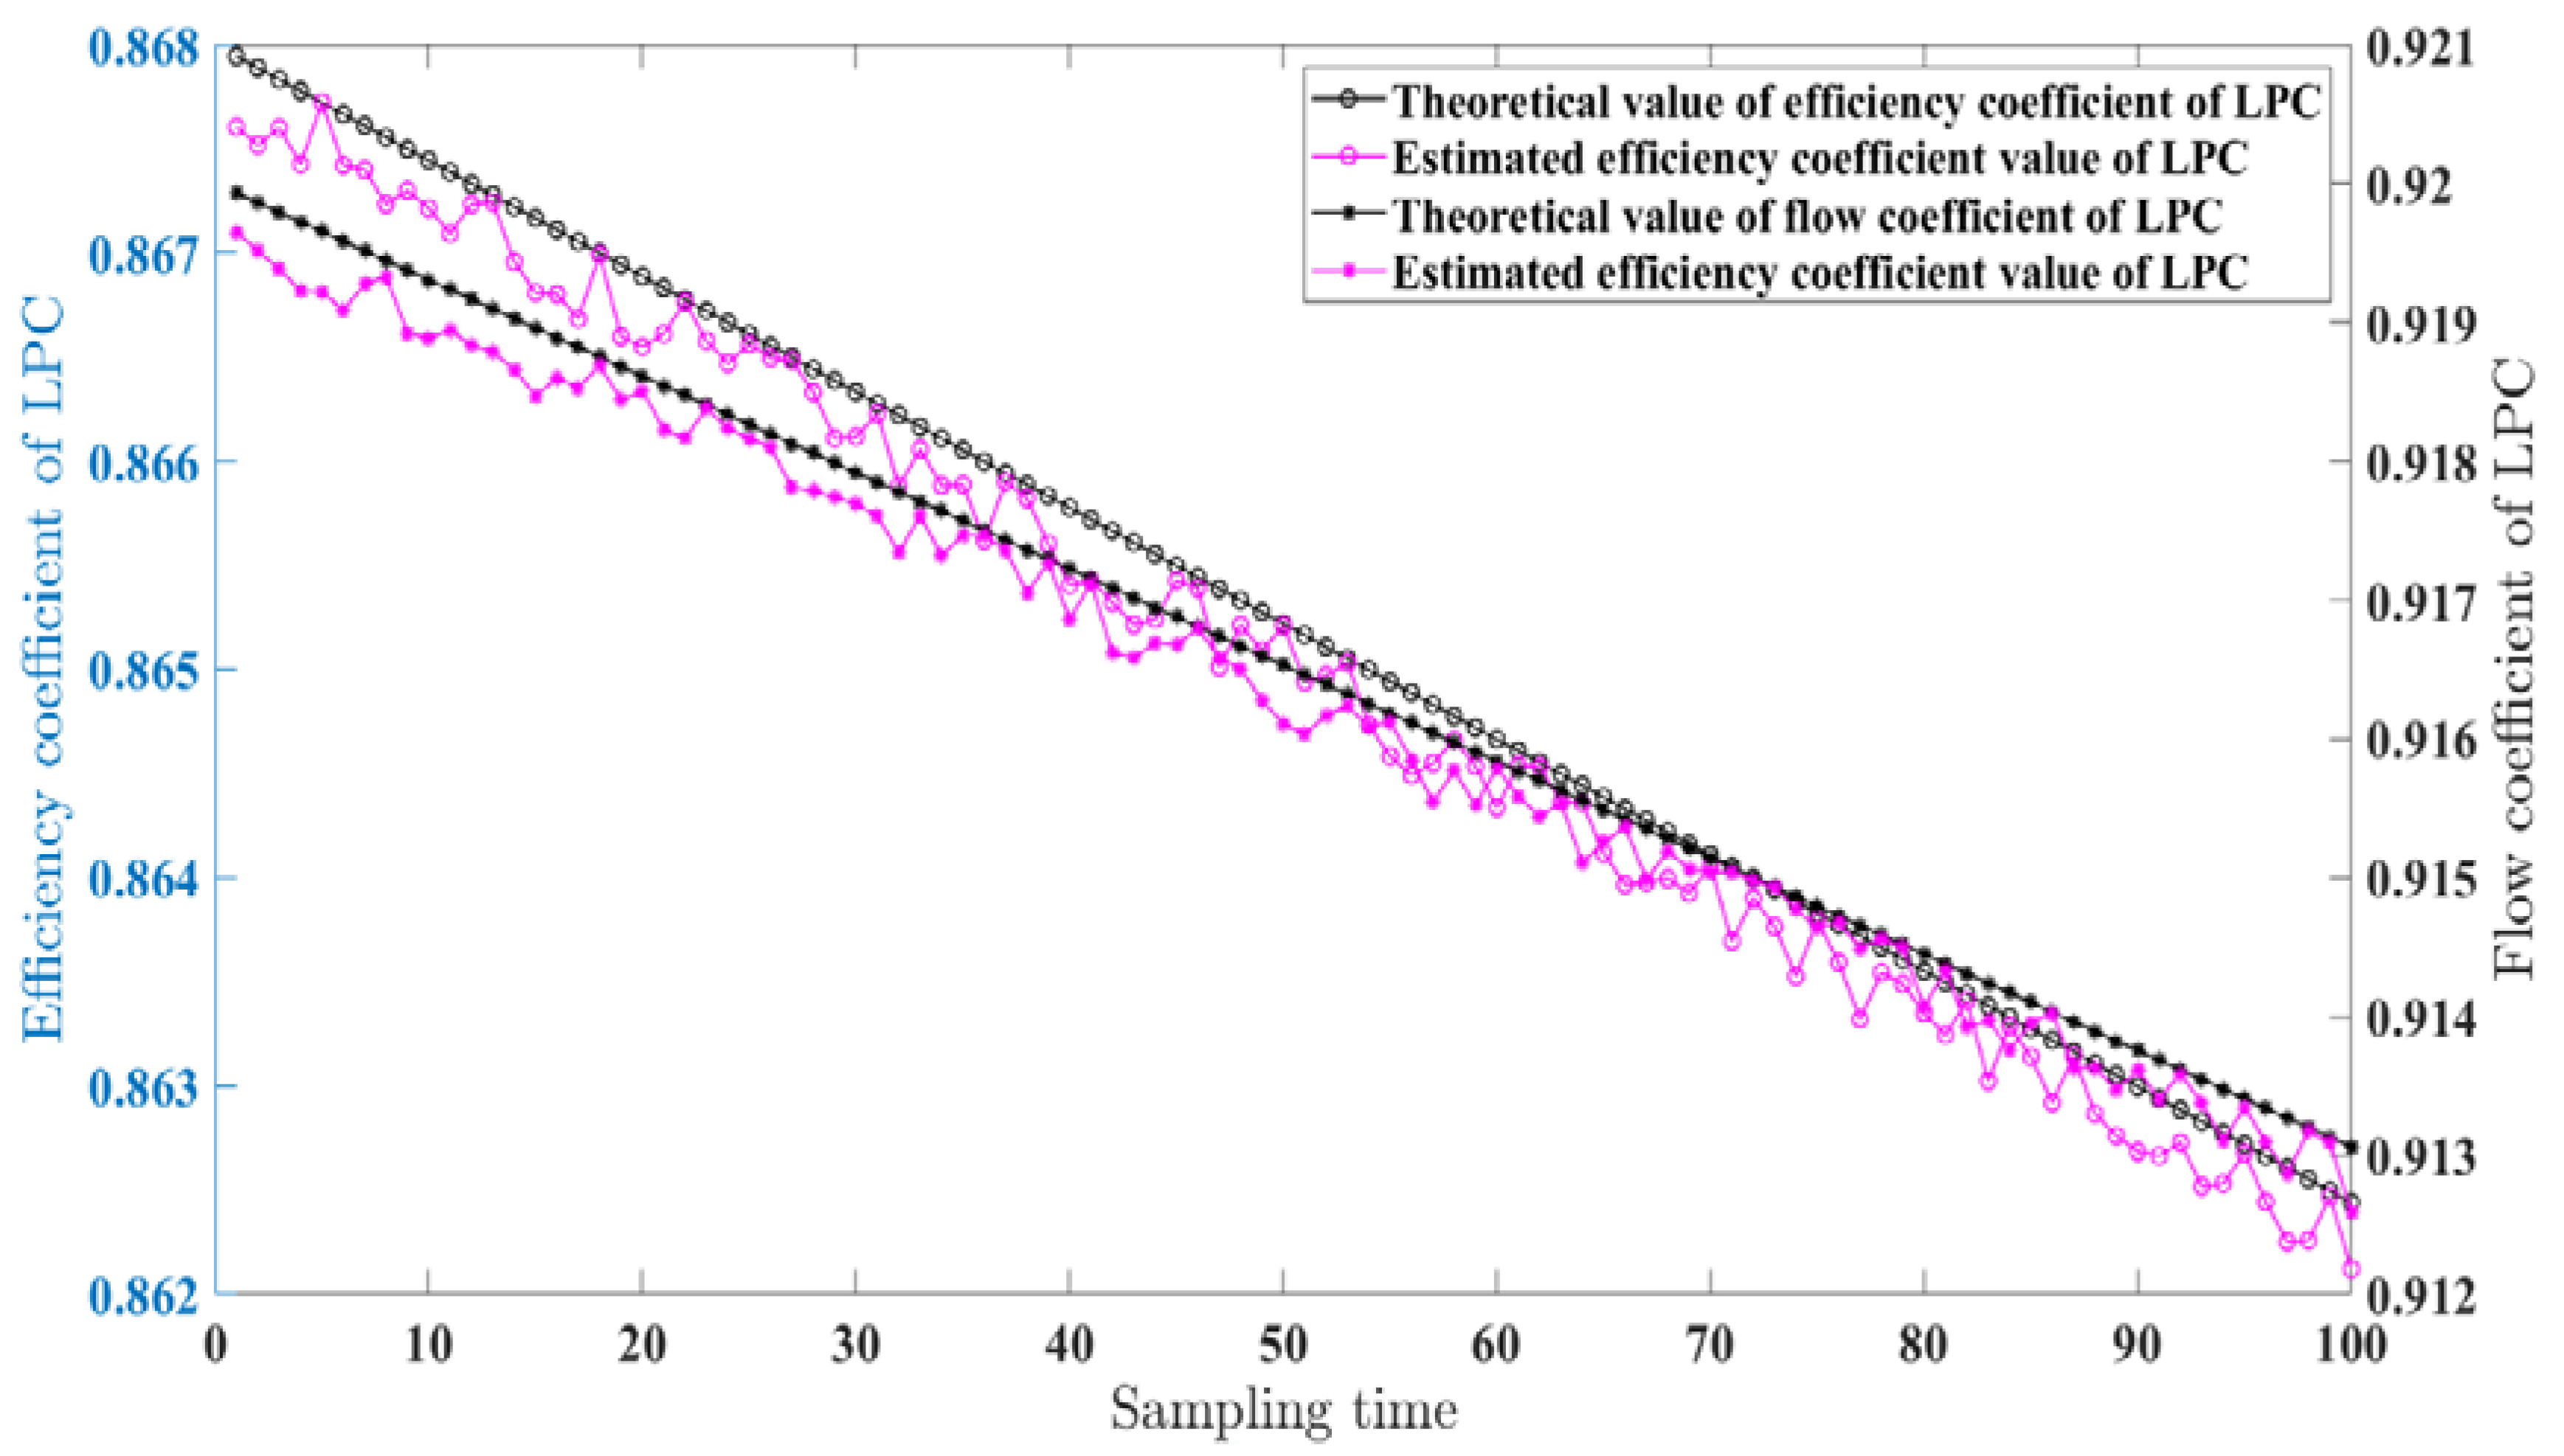
- The strong tracking filter is used to eliminate the noise contained in measurements and the accuracy of measured parameters is enhanced when the turbojet performance changes slowly. Besides, the estimation accuracy remains high when the working state of turbojet changes abruptly by adjust the variance ratio of measurements.
- 2
- An optimization method for strong tracking filter is proposed. By calculating the similarity between covariance vectors at different sampling times of measured parameters, the value of scale factor can be obtained. This calculation method replaces the traditional way of relying on experience.
- 3
- In particle filter, to ensure the diversity of particles, paper proposes a weight optimization method to adjust the weights of different particles. The regulation equation is derived according to the regulator R and the mean of all weights. By above method, the high accuracy of probability density function can be ensured.
Author Contributions
Funding
Conflicts of Interest
References
- Chen., Y. Gas Path Fault Diagnosis for Turbojet Engine Based on Nonlinear Model. Ph.D. Thesis, Nanjing University of Aeronautics and Astronautics, Nanjing, China, 2014. [Google Scholar]
- Nada, T. Performance Characterization of Different Configuration of Gas Turbine Engines. Propuls. Power Res. 2014, 3, 121–132. [Google Scholar] [CrossRef]
- Ogaji, S.O.T.; Sampath, S.; Singh, R.; Probert, S.D. Parameter Selection for Diagnosing a Gas-Turbine’s Performance-Deterioration. Appl. Energy 2002, 73, 25–46. [Google Scholar] [CrossRef]
- Chowdhary, G.; Jategaonkar, R. Aerodynamic Parameter Estimation from Flight Data Applying Extended and Unscented Kalman Filter. In Proceedings of the AIAA Atmospheric Flight Mechanics Conference and Exhibit, Keystone, CO, USA, 21–24 August 2006. [Google Scholar]
- Miller, I.; Gencer, G.; Francis, M. A General Model for Estimating Emissions from Integrated Power Generation and Energy Storage Case Study: Integration of Solar Photovoltaic Power and Wind Power with Batteries. Processes 2018, 6, 267. [Google Scholar] [CrossRef]
- Li, J.; Wang, K.L.; Lian, M.L.; Li, Z.; Du, T.Z. Process Simulation of the Separation of Aqueous Acetonitrile Solution by Pressure Swing Distillation. Processes 2019, 7, 409. [Google Scholar] [CrossRef]
- Simpson, T.W.; Mauery, T.M.; Korte, J.; Mistree, F. Kriging models for global approximation in simulation-based multidisciplinary design optimization. AIAA J. 2005, 43, 853–863. [Google Scholar]
- Sanchez, S.; Escobet, T.; Puig, V.; Odgaard, P.F. Fault Diagnosis of an Advanced Wind Turbine Benchmark Using Interval-Based ARRs and Observers. IEEE Trans. Ind. Electron. 2015, 62, 3783–3792. [Google Scholar] [CrossRef]
- Gao, Z.; Cecati, C.; Ding, S.X. A survey of fault diagnosis and fault-tolerant techniques—Part I: Fault diagnosis with model-based and signal-based approaches. IEEE Trans. Ind. Electron. 2015, 62, 3757–3767. [Google Scholar] [CrossRef]
- Gao, Z.; Cecati, C.; Ding, S.X. A Survey of Fault Diagnosis and Fault-Tolerant Techniques—Part II: Fault diagnosis with knowledge-based and hybrid/active approaches. IEEE Trans. Ind. Electron. 2015, 62, 3768–3774. [Google Scholar] [CrossRef]
- Borguet, S.; Leonard, O. Coupling Principal Component Analysis and Kalman Filtering Algorithms for On-Line Aircraft Engine Diagnostics. Control Eng. Pract. 2009, 17, 494–502. [Google Scholar] [CrossRef]
- Lu, F.; Ju, H.F.; Huang, J.Q. An improved extended Kalman filter with inequality constraints for aero engine health monitoring. Aerosp. Sci. Technol. 2016, 58, 36–47. [Google Scholar] [CrossRef]
- Vanini, Z.S.; Khorasani, K.; Meskin, N. Fault Detection and isolation of a dual spool gas turbine using dynamic neural networks and multiple model approach. Inf. Sci. 2014, 259, 234–251. [Google Scholar] [CrossRef]
- Chen, L.B.; Song, L.Q.; Chen, G. Study on Fusion Diagnosis Techniques of Wear Faults in Synthesized Monitoring of Aero-Engine. J. Aerosp. Power 2009, 24, 169–175. [Google Scholar]
- Huang, Q.; Zhang, G.G.; Zhang, T.; Wang, J. A Kind of Approach for Aero Engine Gas Path Fault Diagnosis. In Proceedings of the IEEE International Conference on Prognostics and Health Management (ICPHM), Dallas, TX, USA, 1 June 2017. [Google Scholar]
- Verma, R.; Roy, N.; Ganguli, R. Gas turbine diagnostics using a soft computing approach. Appl. Math. Comput. 2006, 172, 1342–1363. [Google Scholar] [CrossRef]
- Bachir, A.; Hafaifa, A.; Guemana, M.; Hadroug, N. Application of Principal Component Analysis Approach in Gas Turbine Defect Diagnosis. In Proceedings of the International Conference on Applied Smart Systems, Medea, Algeria, 1 November 2018. [Google Scholar]
- Yang, L.; Ding, S.T.; Wang, Z.Y.; Li, G. Efficient Probabilistic Risk Assessment for Aeroengine Turbine Disks Using Probability Density Evolution. AIAA J. 2017, 55, 2755–2761. [Google Scholar] [CrossRef]
- Zeng, L.; Long, W.; Li, Y.Y. A Novel Method for Gas Turbine Condition Monitoring Based on KPCA and Analysis of Statistics Tand SPE. Processes 2019, 7, 124. [Google Scholar] [CrossRef]
- Wang, L.; Liu, Z.W.; Miao, Q.; Zhang, X. Time-Frequency analysis based on ensemble local mean decomposition and fast kurtogram for rotating machinery fault diagnosis. Mech. Syst. Signal Process. 2018, 103, 60–75. [Google Scholar] [CrossRef]
- Zhang, Y.; Randall, R.B. Rolling element bearing fault diagnosis based on the combination of genetic algorithm and fast kurtogram. Mech. Syst. Signal Process. 2009, 23, 1509–1517. [Google Scholar] [CrossRef]
- Pham, H.T.; Yang, B.S. Estimation and forecasting of machine health condition using ARMA/GARCH model. Mech. Syst. Signal Process. 2010, 24, 546–558. [Google Scholar] [CrossRef]
- Hu, Y.; Yang, Y.Y.; Zhang, S.Y.; Sun, Z.S.; Zhu, J.T. Turbofan Engine Gas Path Performance Monitoring based on Improved Spherical Simplex Square Root Unscented Kalman Filter. J. Aerosp. Power 2014, 29, 441–449. [Google Scholar]
- Hu, Y.; Zhang, S.Y.; Yang, Y.C.; Zhu, J.T.; Yang, Z.W. Fault Diagnosis of Gas Path Components of Turbofan Engine based on Spherical Square Root Unscented Kalman Filter Algorithm. J. Aerosp. Power 2014, 29, 689–694. [Google Scholar]
- Zhang, P. Aeroengine Fault Diagnosis Based on Kalman Filter. Ph.D. Thesis, Nanjing University of Aeronautics and Astronautics, Nanjing, China, 2014. [Google Scholar]
- Kurzke, J.; Riegler, C.; Bauer, M. Some Aspects of Modeling Compressor Behavior in Gas Turbine Performance Simulation. ASME J. Turbo Mach. 2001, 123, 373–378. [Google Scholar]
- Li, R.X.; Prasad, V.; Huang, B. Gaussian Mixture Model-Based Ensemble Kalman Filtering for State and Parameter Estimation for a PMMA Process. Processes 2016, 4, 9. [Google Scholar] [CrossRef]
- Simon, D.; Simon, D.L. Constraint Kalman Filtering Via Density Function Truncation for Turbofan Engine Health Estimation. Int. J. Syst. Sci. 2010, 41, 159–171. [Google Scholar] [CrossRef]
- Simon, D. Kalman Filtering with State Constraints: A Survey of Linear and Non-linear Algorithms. IET Control Theory Appl. 2010, 4, 1303–1318. [Google Scholar] [CrossRef]
- Soken, H.E.; Hajiyev, C. Pico Satellite Attitude Estimation via Robust Unscented Kalman Filter in the Presence of Measurement Faults. ISA Trans. 2010, 49, 249–256. [Google Scholar] [CrossRef] [PubMed]
- Dyke, M.C.; Schwartz, J.L.; Hall, C.D. Unscented Kalman Filtering for Spacecraft Attitude State and Parameter Estimation. In Proceeding of the AAD/AIAA Space Flight Mechanics Conference, Maui, HI, USA, 8–12 February 2004. [Google Scholar]
- Liu, H.F.; Yao, Y.; Lu, D.; Ma, J. Study for Outliers based on Kalman Filtering. Electr. Mach. Control 2003, 7, 40–42. [Google Scholar]
- Cheng, F.Z.; Qu, L.Y.; Qiao, W.; Hao, L.W. Enhanced Particle Filtering for Bearing Remaining Useful Life Prediction of Wind Turbine Drivetrain Gearboxes. IEEE Trans. Ind. Electron. 2019, 66, 4738–4748. [Google Scholar] [CrossRef]
- Wang, X.X.; Pan, Q.; Huang, H.; Gao, A. Overview of Deterministic Sampling Filtering Algorithm for Nonlinear System. Control Decis. 2012, 27, 801–810. [Google Scholar]
- Zeng, L.; Long, W.; Li, Y.Y. Performance Degradation Diagnosis of Gas Turbine Based on Improved FUKF. J. Southwest Jiaotong Univ. 2018, 53, 873–878. [Google Scholar]


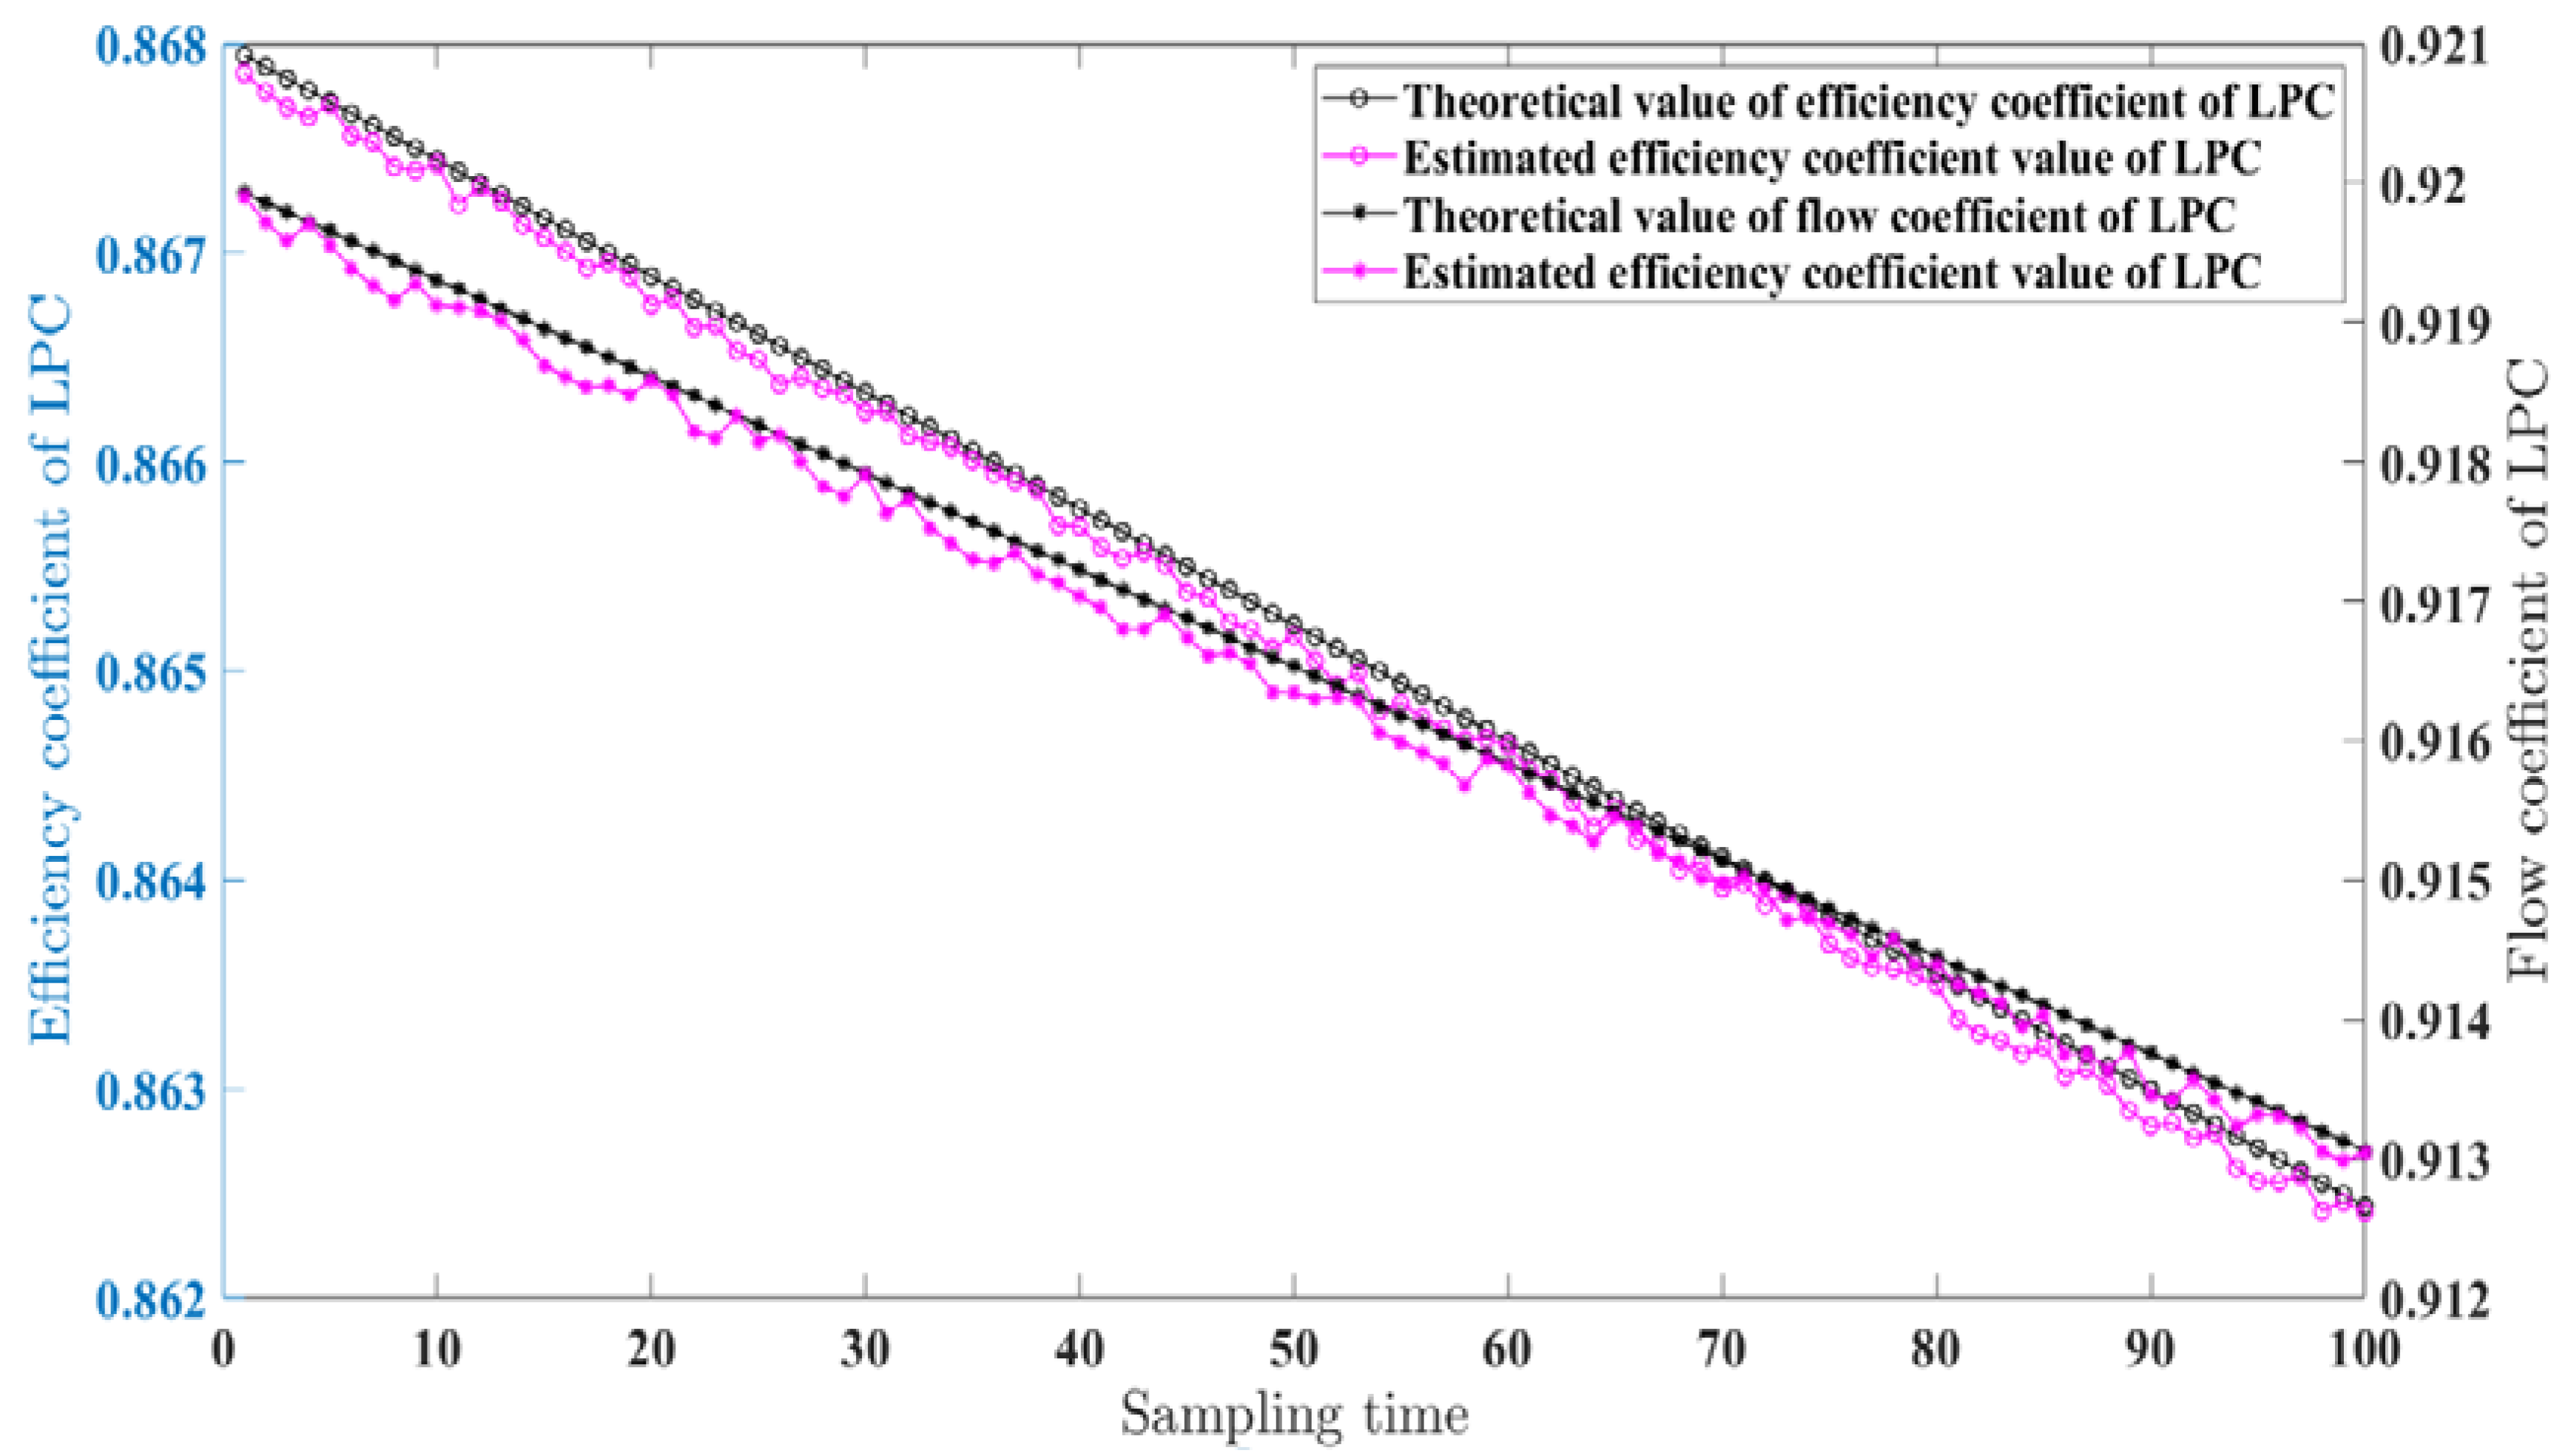
| Estimated Parameters | Maximum Error | Mean Value of Error | Variance |
|---|---|---|---|
| Efficiency coefficient | 0.162% | 0.118% | 5.2 × 10⁻⁶ |
| Flow coefficient | 0.158% | 0.112% | 6.4 × 10⁻⁶ |
| Estimated Parameters | Maximum Error | Mean Value of Error | Variance |
|---|---|---|---|
| Efficiency coefficient | 0.094% | 0.076% | 2.59 × 10⁻⁶ |
| Flow coefficient | 0.089% | 0.073% | 4.05 × 10⁻⁶ |
© 2019 by the authors. Licensee MDPI, Basel, Switzerland. This article is an open access article distributed under the terms and conditions of the Creative Commons Attribution (CC BY) license (http://creativecommons.org/licenses/by/4.0/).
Share and Cite
Zeng, L.; Dong, S.; Long, W. The Rotating Components Performance Diagnosis of Gas Turbine Based on the Hybrid Filter. Processes 2019, 7, 819. https://doi.org/10.3390/pr7110819
Zeng L, Dong S, Long W. The Rotating Components Performance Diagnosis of Gas Turbine Based on the Hybrid Filter. Processes. 2019; 7(11):819. https://doi.org/10.3390/pr7110819
Chicago/Turabian StyleZeng, Li, Shaojiang Dong, and Wei Long. 2019. "The Rotating Components Performance Diagnosis of Gas Turbine Based on the Hybrid Filter" Processes 7, no. 11: 819. https://doi.org/10.3390/pr7110819
APA StyleZeng, L., Dong, S., & Long, W. (2019). The Rotating Components Performance Diagnosis of Gas Turbine Based on the Hybrid Filter. Processes, 7(11), 819. https://doi.org/10.3390/pr7110819