Abstract
Gas turbine converts chemical energy into mechanical energy and provide energy for aircraft, ships, etc. The performance diagnosis of rotating components of gas turbine are essential in terms of the high failure rate of these parts. A problem that the sudden changing of operation state of turbines may lead to the misdiagnosis due to the defect of gas turbine’s model. This paper constructs the strong tracking filter based on the unscented Kalman filter to achieve accurate estimation of gas turbine’s measured parameters when the state changes suddenly. In the strong tracking filter, a parameter optimization method based on the residual similarity of measured parameters is proposed. Next, adopt the measured parameters filtered by the strong tracking filter to construct the health parameters estimation algorithm based on the particle filter. The particle weight is optimized by the mean adjustment method. Performance diagnosis is realized by checking the changes of health parameters output by particle filter. The results show that the proposed method improves the accuracy of performance diagnosis obviously.
1. Introduction
Performance diagnosis is essential to realize the health management of gas turbine, and is absolutely necessary to the concept of on-condition maintenance which is an advanced maintenance idea of gas turbine. There are many ways to achieve the performance diagnosis, the method based on wear particle morphology analysis in lubricating oil, the method based on vibration signal analysis, and the method based on electrostatic signal analysis at the outlet of nozzle [1,2,3,4,5,6,7,8,9,10]. Borguet Sebastien and Leonard Olivier combine two diagnostic tools to improve the diagnosis accuracy of gas turbine. One tool is the principal component analysis (PCA) which is used to isolate the components fault, and another one is the Kalman filter in order to realize on-line evaluation of health condition of gas turbine [11]. Lu Feng, Ju Hongfei, and Huang Jinquan propose a nonlinear state estimation algorithm based on the extended Kalman filter. The transformation matrix is used to calculate estimation errors and construct the underdetermined extended Kalman filter [12]. Vanini Sadough put forward multiple dynamic neural networks to learn the different conditions of gas turbine. For each network, residuals between the outputs of network and the measured values are calculated. Furthermore, the thresholds of residuals are obtained, and performance diagnosis can be achieved by comparing the size of residuals and their thresholds [13]. Chen Libo and Song Lanqi propose a hybrid technique which composed of spectrometric oil analysis and auto debris classifier to enhance the diagnosis accuracy of wear fault. The Dempster-Shafer evidence theory is adopted to detect the fault [14]. Huang Qiang, Zhang Guigang, and Zhang Ting optimized the parameters of support vector machine by the genetic algorithm and simulated annealing method. A performance diagnosis approach of aero engine gas path is proposed by the advanced support vector machine [15]. Verma Rajeev, Roy Niranjan, and Ganguli Ranjan developed a fuzzy system based on a linear model to detect the failure of gas turbine [16]. Bachir, A and Hafaifa, A introduce a way to monitor the working condition of gas turbine based on the vibration signal analysis with respect to the principle of principal component analysis [17]. Yang Liu, Ding Shuiting, and Wang Ziyao propose a risk assessment method to evaluate the health status of aeroengine based on probability density evolution, and validate the effectiveness of this method by compare it with the Monte Carlo simulation method [18]. Zeng Li, Long Wei, and Li Yanyan suggest an approach based on the kernel principal component analysis to detect the fault and locate the failure by analyze the influence of fault to gas path components [19]. All the methods mentioned above must obtain the measured values of sensors and it is a consensus that the measurements contain many noise signals. However, these methods do not treat the noise signals before construct the fault detection algorithm, and it is probably lead to misdiagnosis. Furthermore, a defect exists in those methods which based on the physical model of gas turbine is that the modeling errors may lead to the performance diagnosis distortion.
To remove the noise in the measured parameters of airborne sensors and realize the performance diagnosis exactly, Wang Lei, Liu Zhiwen, and Miao Qiang proposed use ensemble local mean decomposition and fast kurtogram decompose the raw signal into the production functions to characterize the fault information. Then the optimal band-pass filter to filter the selected production functions and the impulse signal are obtained. By analyzing the fault characteristic frequencies, fault identification can be realized [20]. Zhang Yongxiang and Randall R.B proposed fast kurtogram and genetic algorithm to diagnose the failure of rolling element bearing. The initial parameters can be given by fast kurtogram and the optimized parameters with minimal constraint can be obtained [21]. Pham Hongthom and Yang Bo-suk adopt the linear ARMA model and nonlinear GARCH model to describe the fault of machine. The hybrid model can predict the future state of machine with high accuracy and give obvious explanation of the state [22].
In this paper, a novelty hybrid filter which composed of strong tracking filter based on unscented Kalman filter and particle filter with weight optimized is proposed to diagnose the performance variance of gas turbine. Firstly, construct a strong tracking filter based on the unscented Kalman filter by constraining the measurement residuals of current and last sampling time to be orthogonal. The calculation process of the scale factor is optimized by the residual similarity of measured parameters. The strong tracking filter is used to filter the noise signals contained in measurements. Next, the particle filter is used to estimate the health parameters of gas turbine. The health parameters consist of the efficiency coefficients and flow coefficients of rotating components. The outputs of strong tracking filter are the input parameters of particle filter. The problem that the distortion of estimated values of health parameter is resolved and the drawback of weight degradation of particle is overcome.
2. Materials and Methods
2.1. Fault Diagnosis Algorithm of Gas Turbine Based on Hybrid Filter
Compare with other component of gas turbine, the performance degradation rate of gas path components is higher. In order to reflect the health status of gas path components accurately, the health parameters include the efficiency coefficients and flow coefficients of turbines can be used to indicate the performance changes of gas turbine [23,24,25]. Performance diagnosis can be realized by estimating the values of health parameters. The strong tracking filter is constructed to eliminate the noise contained in measured parameters based on unscented Kalman filter. The particle filter is used to estimate the values of health parameters of gas turbine. To solve the problems of weight degradation and degradation of diversity exist in the particle filter, a weight optimization method is proposed. The principle of hybrid filter is shown in Figure 1.
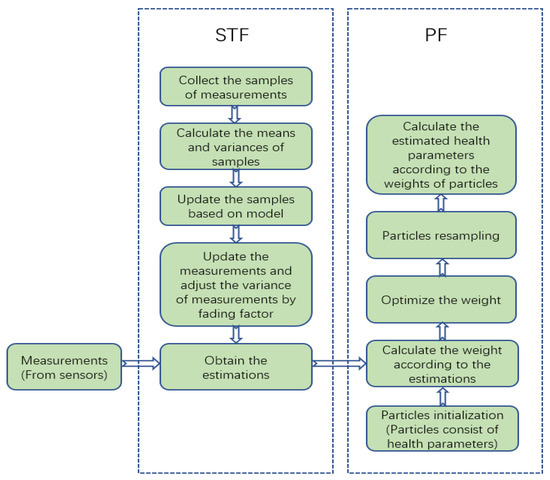
Figure 1.
Principle of hybrid filter.
The two-spool turbojet is adopted as the research object. The low-pressure compressor, high-pressure compressor, low-pressure turbine, high-pressure turbine are the principal components of two-spool turbojet. The low-pressure compressor and the low-pressure turbine are connected by the low-pressure rotor. The high-pressure compressor and the high-pressure turbine are connected by the high-pressure rotor. Air enters the engine from Section 0 and compressed by the compressors. Next, compressed air mixed with fuel in the burning room and combusts. The high temperature gas at the exit of the burning room expands and drives the turbines to rotate. Some gas is ejected from the nozzle to generate thrust. Due to the turbines and compressors are connected by rigid rotors, turbines transmit torque to compressors to drive compressors to rotate, and pressurize the air. The structure of the two-spool turbojet is shown in Figure 2.
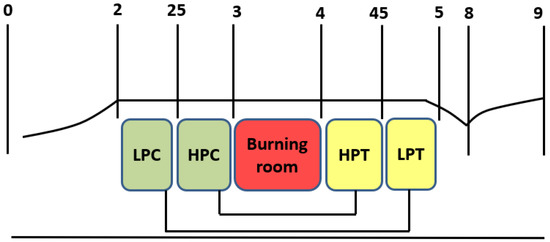
Figure 2.
Principal components of two-spool turbo jet.
Measurements include the following contents:
| Total temperature at the outlet of LPC | Total temperature at the outlet of HPC |
| Total temperature at the outlet of LPT | Total temperature at the outlet of HPT |
| Total pressure at the outlet of LPC | Total pressure at the outlet of HPC |
| Total pressure at the outlet of LPT | Total pressure at the outlet of HPT |
There are:
| Low Pressure Compressor (LPC) | High Pressure Compressor (HPC) |
| Low Pressure Turbine (LPT) | High Pressure Turbine (HPT) |
2.2. Problem in the UKF
In order to ensure the good accuracy of the output parameters of unscented Kalman filter, a model that can reflect the real working state of the monitored target must be established. In the condition monitoring of two-spool turbojet based on the unscented Kalman filter, the Component-level Gas Path Model (CGPM) is usually used to predict the values of health parameters [26,27,28,29,30,31,32]. The health parameters are the indicators of the health status of turbojet and can be used to illustrate the flowing ability and working efficiency. The CGPM is essentially a series of physical equations based on the principle of aerothermodynamics. By the operation of CGPM, the health parameters (flow coefficients and efficiency coefficient of gas path components) and the measured parameters (total temperature and total pressure of gas path components) can be calculated. The structure of CGPM is shown in Figure 3.
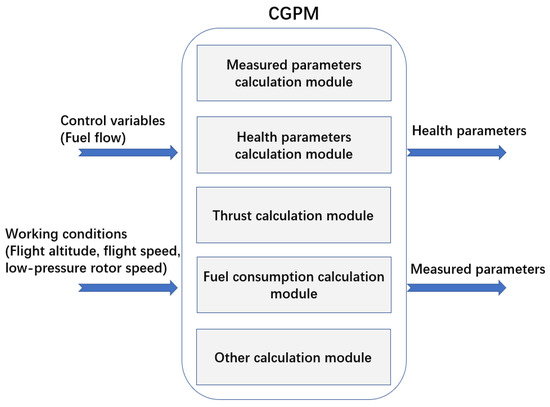
Figure 3.
Structure of Component-level Gas Path Model.
The Component-level Gas Path Model of two-spool turbojet can be described as follows [1]:
In Formulas (1) and (2), represents the kth sampling time. is the state parameters vector. Furthermore, all of these parameters are the estimated objects. is the control variable. There are:
and are the efficiencies and flow coefficients of different components, respectively, include the low-pressure compressor, high pressure compressor, low pressure turbine, and high pressure turbine. is the flow of fuel. and are the state transmission noise and measurement transmission noise. represents the process of predicting the health parameters based on the Component-level Gas Path Model. is the vector of health parameter. The value of is determined by and . Thus, the calculation of can be realized by the health parameters calculation module, as shown in Figure 3. The content of is similar with that of . represents the process of predicting the measured parameters based on the Component-level Gas Path Model. is the vector of measured parameters at the k + 1th sampling time. By the operation of measured parameters calculation module, function can be.
The working state transformation of turbojet is a continuous process, the Component-level Gas Path Model can not accurately reflect all the working state. If the working state of turbojet changes suddenly, the output measured parameters of CGPM deviate greatly from those of the turbojet due to the defect of CGPM. Consequently, the estimations of UKF may be distorted. This circumstance can be illustrated by Figure 4.
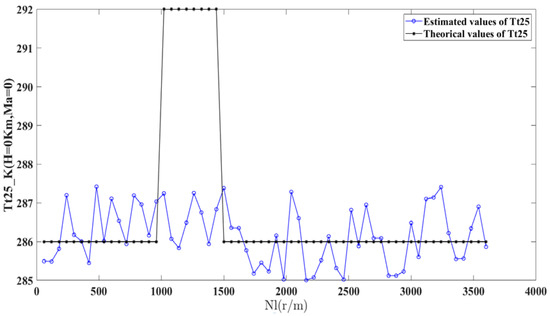
Figure 4.
Estimations of Tt25 by UKF.
In Figure 4, the values of are estimated by the unscented Kalman filter based on the Component-level Gas Path Model. The working state of the turbojet changed abruptly after working for an hour, and the measured parameters include changed widely in short time. However, due to the defect of Component-level Gas Path Model, the estimations of unscented Kalman filter are not consistent with the true values of measurements, as shown in Figure 4.
2.3. Resolution
To overcome above drawback, a strong tracking filter based on the UKF is proposed. The strong tracking filter (STF) satisfies following condition [33,34,35]:
and are the residuals of measurements and outputs of model at the and sampling times. and are the measurements and outputs of model, respectively. Equation (3) means that the residuals of measurements and outputs of model is orthogonal if the UKF is working normally. When the working state of the engine changes abruptly, the residuals are not orthogonal anymore. Paper design STF to adjust the variance ratio of measurements at different times to force the residuals keep orthogonal so that the accuracy of estimated parameters remains high. The steps of STF are as follows:
Samples collection and weight calculation.
are the estimated objects (state variable) which consist of , , , , , ,, and . denotes the mean vector of the estimated objects. is the weight of estimated object. is the parameter to reduce prediction error. is the number of estimated objects and there is . is the covariance matrix of the estimated objects.
State variable calculation based on model.
State variable is calculated by Equation (4). is the value of fuel flow. and are the estimated variables (state variable) at the and sampling time. is the mean vector of estimated variables and is the covariance matrix. and are the estimated values and the mean value of measurements respectively. is the covariance matrix of and . and are the variances of and respectively. is the measurement vector obtained by sensors. is the Kalman gain. and are the state transmission noise and measurement transmission noise. .
The need to pay attention is that is fading factor vector. There is . denotes the fading factor. By regulating the proportion of fading factors, the residual of measurements at the current and last sampling time can be kept orthogonal. The emphasis of STF is to calculate the value of . For , set each fading factor as:
is the common parameter and is the ratio parameter. The ratio value of fading factors can be determined by experience, there is:
Obviously, can be calculated if is obtained. Equation (3) can be transformed as:
is the residual covariance matrix of measurements. The condition to satisfies Equation (16) is that:
There is:
is the noise statistical matrix of measurements. Compute the trace of Equation (18), and the expression of can be obtained.
named scale factor is used to adjust the ratio of residual covariance matrix at the sampling time. The greater the value of , the greater the proportion of . Otherwise, the greater the proportion of . Usually, the value of is determined by experience, and there is a drawback that unreasonable value of may lead to the distortion of . Paper proposes a method to obtain . The steps are as follows:
- (1)
- Construct a variance vector which consist of the diagonal elements of . Furthermore, obtain the residual vector which consist of diagonal elements of .
- (2)
- Similarity calculation between and .
is the cosine value between and , and . Considering the Equation (20), coefficients of and are and respectively. Obviously, the sum of and is 1.
Set the angle between and as , there is:
Replace the original coefficients of and with and . Equation (20) can be transformed as:
According to the working principle of gas turbine and taking into account that the proportion of current (the sampling time) information should be greater than that of previous sampling time. Equation (22) ensures that the coefficient of is greater than that of . Estimate by above method.
Compare with Figure 4 and Figure 5 accurately reflects the sudden change of measurements. It shows the validity of STF proposed by paper, which compensates the model error and enhances the estimation accuracy.
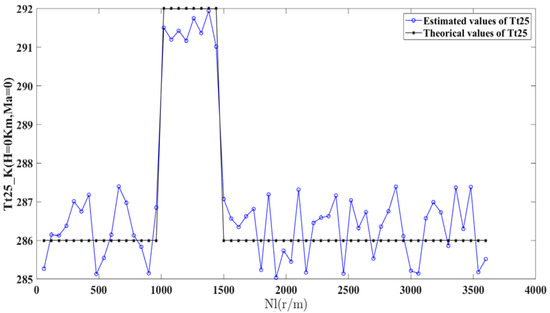
Figure 5.
Estimations of Tt25 by the strong tracking filter (STF).
2.4. Health Parameters Estimation
Paper adopt particle filter to estimate the health parameters. The measurements filtered by the STF are used to determine the posterior probability. Weight degradation that may lead to the accuracy decrease of estimations is a commonly problem exists in the process of particle filter Particle resampling is a traditional way to solve this problem. By increasing the number of larger-weight particles and make all particles have the same weight, the weight degradation has been effectively solved. But the above-mentioned method will lead to another problem, that is, the loss of particle diversity. In order to coordinate these two issues, paper proposes a weight optimization method in the PF. The core idea of this method is to adjust the posterior probability density function of health parameters. By properly increasing the weight of small weight particles and reducing the weight of large weight particles, the diversity of particles can be kept, and the high accuracy of probability density function can be ensured. The steps of health parameters estimation algorithm based on weight optimization PF are as follows [33,34]:
(1) k = 0, particles initialization.
k denotes the sampling time. Set the number of particles is 100. Each particle represents the value of health parameter. Generate particles according to the importance probability density function . consists of health parameters which include the efficiency coefficients of LPC, HPC, HPT, LPT, and the flow coefficients of LPC, HPC, HPT, and LPT. is the uniform distribution function.
(2) k = 1,2, 3, …. weight update.
Predict the health parameters based on the prior probability distribution function:
Above calculation can be realized based on the component-level model of engine. Weight update:
y consists of different measurements filtered by STF. There are total temperatures at the outlet of LPC, HPC, HPT, LPT, and total pressures at the outlet of LPC, HPC, HPT, and LPT.
Weight optimization. Calculate the mean of weights, there is:
Adjust the weight of each particle:
R is regulator and . The function of R is to regulate the weight of particles. Normalize the weights:
- (3)
- Particles resampling:
- (4)
- Optimize the health parameters:
In order to verify the validity of proposed method, a simulation to detect the failure occurrence of two-spool turbojet is conducted. By suddenly changing the value of health parameters, failure occurrence can be simulated [1,13]. According to the research of previous chapters, by estimate the values of health parameters, failure detect can be realized [13]. The steps to conduct the simulation are as follows:
- 1
- Generate the measured parameters from a software named Gasturb13 (Gasturb 13 is a simulation software for gas turbine performance calculation with high accuracy). Add noise w to these measured parameters. , N is the normal probability density function.
- 2
- Establish the Component-level Gas Path Model of turbojet. This model is the detailed expression of the Equations (1) and (2).
- 3
- Build the module of strong tracking filter according the method introduced in Section 2.3. The measured parameters including noise are input into the module and output to the particle filter after being processed by the strong tracking filter.
- 4
- Build the module of particle filer with weight optimization according to the method introduced in Section 2.4. This module is used to estimate the health parameters.
- 5
- Input the measured parameters to the particle filter and estimate the health parameters. The way to simulate the failure are listed as follows:
FLPC and are the latest values of low-pressure compressor’s flow coefficient and efficiency coefficient after the failure is simulated. Fini and are the initial values of low-pressure compressor’s flow coefficients and efficiency coefficient before failure are simulated. . named the failure factor is variation volume of Fini. denotes the degradation value of flow coefficients during every sampling time if failure happen. The meaning of and are similar to that of and . T and Tfailure represent current sampling time and failure occurrence time. The design working parameters of engine are as follows:
| Efficiency of LPC: ELPC = 0.868 | Pressure ratio of LPC: |
| Efficiency of HPC: EHPC = 0.878 | Pressure ratio of HPC: |
| Efficiency of high-pressure rotator: EHPR = 0.98 | Efficiency of low-pressure rotator: ELPR = 0.98 |
| Efficiency of burning room: EBR = 0.98 | Air intake coefficient of cabin: EAI = 0.01 |
| Cooling coefficient of HPT: CHPT = 0.03 | Efficiency of HPT: EHPT = 0.89 |
| Cooling coefficient of LPT: CLPT = 0.01 | Efficiency of LPT: ELPT = 0.91 |
| Design rotating speed of Low Pressure Rotator: SLPR = 104r/m | |
| Design rotating speed of High Pressure Rotator: SHPR = 1.6 × 10⁴r/m | |
| Total temperature at the outlet of burning room: Tt4 = 1600 K | |
| Heat value of fuel: FHV = 4.29 × 10⁴ | |
Due to limitation of space, the estimation of low-pressure compressor’s flow coefficient and efficiency coefficient are listed only. The estimation processes of other health parameters of high-pressure compressor, high-pressure turbine, low-pressure turbine are similar with that of low-pressure pressure. Assure that 100 measured parameters are collected. When the engine performance degrades slowly, the efficiency coefficient decreases by 0.6% compared with the initial value, and the flow coefficient decrease by 0.7%. To simulate the failure, at the 11th sampling time, set the flow coefficient and efficiency coefficient decreased by 0.3%.
Figure 6 shows the Estimated health parameters of low-pressure compressor based on the traditional unscented Kalman filter and particle filter. Set there are 100 sampling times. The initial theoretical values of the efficiency coefficient and the flow coefficient are 0.868 and 0.92, respectively. During each sampling time, the variation of efficiency coefficient and flow coefficient are 5.2 × 10⁻⁶ and 6.4 × 10⁻⁶, as shown in Table 1. There are:
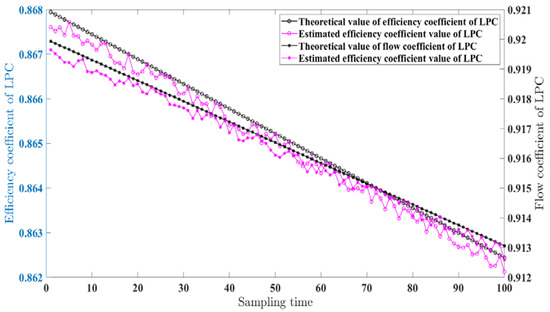
Figure 6.
Estimated health parameters of low-pressure compressor by the traditional unscented Kalman filter and particle filter.

Table 1.
Error analysis under the condition of slow degradation of performance based on traditional method.
and are the values of efficiency coefficient and flow coefficient after the performance degrades slowly. It can be seen that the estimations are close to the theoretical values of health parameters basically. However, the estimations curve fluctuates greatly, and the accuracy degree of estimations is not high.
Figure 7 shows the estimated values of LPC’s flow coefficient and efficiency coefficients when the working state of two-spool turbojet is steady based on the proposed hybrid filter. Under this working condition, the variations range of health parameters (flow coefficient and efficiency coefficient of LPC) are small and slow degradation of performance is happened due to the poor working circumstance of turbojet. The purple curve consists of the estimated values and black curve consists of the theoretical values. Obviously, the method proposed in this paper can accurately characterize the change trend of health parameters. Furthermore, the accuracy of the estimations is also consistent with the theoretical values of health parameters. The estimations variance of efficiency coefficient and flow coefficient are 2.59 × 10⁻⁶ and 4.05 × 10⁻⁶ respectively, as shown in Table 2.
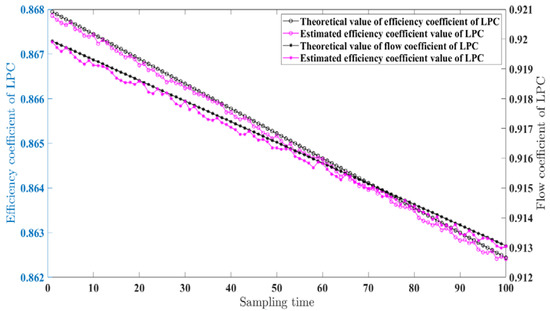
Figure 7.
Estimated health parameters of low-pressure compressor (LPC) by the proposed hybrid filter.
Table 2.
Error analysis under the condition of slow degradation of performance based on proposed method.
Figure 8 shows the estimated values of low-pressure compressor’s flow coefficient and efficiency coefficients based on the method proposed by this paper when the working state of two-spool turbojet breaks down. At the 11th sampling time, set the efficiency coefficient and flow coefficient have a sudden change of 0.3%. There are:
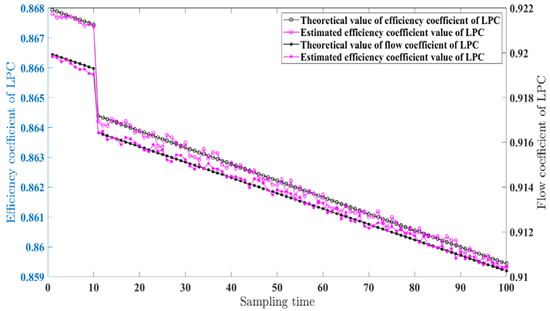
Figure 8.
Estimated health parameters of low-pressure compressor in sudden change of working state.
Paper simulate the failure by changing the health parameters at the tenth sampling time. Due to the occurrence of failure, the measured parameters have a sudden change. By the application of strong tracking filter, the measured parameter can be estimated with high accuracy. According to the introduction of Section 2.1, the output of strong tracking filter is input to the particle filter. Due to the high accuracy tracking ability of the STF to the state mutation and the weight optimization of particle filter, the health parameters are estimated with high accuracy by the particle filter, as shown in Figure 8. The value of efficiency coefficient reduced from 0.8675 to 0.8649, and the value of flow coefficient reduced from 0.9196 to 0.9168. From Figure 8, the mutations in health parameters are accurately reflected on the curve and the occurrence of failure can be detected.
3. Conclusions
In this paper, a developed method based on the unscented Kalman filter and particle filter is proposed. To eliminate the noises contained in measurements which obtained by sensors, UKF is adopted to dispose these noises. Furthermore, in order to enhance the estimation accuracy of measurements when the working state of turbojet changes suddenly, a strong tracking filter is constructed by adjust the variance ratio of measurements at different sampling times based on the UKF. The output (The measurements filtered by STF) of STF is used to determine the weight of each particle. According to the simulations conducted by paper, there are three conclusions can be made.
- 1
- The strong tracking filter is used to eliminate the noise contained in measurements and the accuracy of measured parameters is enhanced when the turbojet performance changes slowly. Besides, the estimation accuracy remains high when the working state of turbojet changes abruptly by adjust the variance ratio of measurements.
- 2
- An optimization method for strong tracking filter is proposed. By calculating the similarity between covariance vectors at different sampling times of measured parameters, the value of scale factor can be obtained. This calculation method replaces the traditional way of relying on experience.
- 3
- In particle filter, to ensure the diversity of particles, paper proposes a weight optimization method to adjust the weights of different particles. The regulation equation is derived according to the regulator R and the mean of all weights. By above method, the high accuracy of probability density function can be ensured.
Author Contributions
Conceptualization, L.Z.; Formal analysis, L.Z.; Methodology, L.Z.; Writing-original draft, L.Z.; Writing-review & editing, L.Z.; Funding acquisition, S.D.; Supervision, W.L.
Funding
This research was funded by the National Natural Science Foundation of China, grant number 51775072. Natural Science Foundation Project of CQ, grant number cstc2017jcyjAX0279.
Conflicts of Interest
The authors declare no conflict of interest.
References
- Chen., Y. Gas Path Fault Diagnosis for Turbojet Engine Based on Nonlinear Model. Ph.D. Thesis, Nanjing University of Aeronautics and Astronautics, Nanjing, China, 2014. [Google Scholar]
- Nada, T. Performance Characterization of Different Configuration of Gas Turbine Engines. Propuls. Power Res. 2014, 3, 121–132. [Google Scholar] [CrossRef]
- Ogaji, S.O.T.; Sampath, S.; Singh, R.; Probert, S.D. Parameter Selection for Diagnosing a Gas-Turbine’s Performance-Deterioration. Appl. Energy 2002, 73, 25–46. [Google Scholar] [CrossRef]
- Chowdhary, G.; Jategaonkar, R. Aerodynamic Parameter Estimation from Flight Data Applying Extended and Unscented Kalman Filter. In Proceedings of the AIAA Atmospheric Flight Mechanics Conference and Exhibit, Keystone, CO, USA, 21–24 August 2006. [Google Scholar]
- Miller, I.; Gencer, G.; Francis, M. A General Model for Estimating Emissions from Integrated Power Generation and Energy Storage Case Study: Integration of Solar Photovoltaic Power and Wind Power with Batteries. Processes 2018, 6, 267. [Google Scholar] [CrossRef]
- Li, J.; Wang, K.L.; Lian, M.L.; Li, Z.; Du, T.Z. Process Simulation of the Separation of Aqueous Acetonitrile Solution by Pressure Swing Distillation. Processes 2019, 7, 409. [Google Scholar] [CrossRef]
- Simpson, T.W.; Mauery, T.M.; Korte, J.; Mistree, F. Kriging models for global approximation in simulation-based multidisciplinary design optimization. AIAA J. 2005, 43, 853–863. [Google Scholar]
- Sanchez, S.; Escobet, T.; Puig, V.; Odgaard, P.F. Fault Diagnosis of an Advanced Wind Turbine Benchmark Using Interval-Based ARRs and Observers. IEEE Trans. Ind. Electron. 2015, 62, 3783–3792. [Google Scholar] [CrossRef]
- Gao, Z.; Cecati, C.; Ding, S.X. A survey of fault diagnosis and fault-tolerant techniques—Part I: Fault diagnosis with model-based and signal-based approaches. IEEE Trans. Ind. Electron. 2015, 62, 3757–3767. [Google Scholar] [CrossRef]
- Gao, Z.; Cecati, C.; Ding, S.X. A Survey of Fault Diagnosis and Fault-Tolerant Techniques—Part II: Fault diagnosis with knowledge-based and hybrid/active approaches. IEEE Trans. Ind. Electron. 2015, 62, 3768–3774. [Google Scholar] [CrossRef]
- Borguet, S.; Leonard, O. Coupling Principal Component Analysis and Kalman Filtering Algorithms for On-Line Aircraft Engine Diagnostics. Control Eng. Pract. 2009, 17, 494–502. [Google Scholar] [CrossRef]
- Lu, F.; Ju, H.F.; Huang, J.Q. An improved extended Kalman filter with inequality constraints for aero engine health monitoring. Aerosp. Sci. Technol. 2016, 58, 36–47. [Google Scholar] [CrossRef]
- Vanini, Z.S.; Khorasani, K.; Meskin, N. Fault Detection and isolation of a dual spool gas turbine using dynamic neural networks and multiple model approach. Inf. Sci. 2014, 259, 234–251. [Google Scholar] [CrossRef]
- Chen, L.B.; Song, L.Q.; Chen, G. Study on Fusion Diagnosis Techniques of Wear Faults in Synthesized Monitoring of Aero-Engine. J. Aerosp. Power 2009, 24, 169–175. [Google Scholar]
- Huang, Q.; Zhang, G.G.; Zhang, T.; Wang, J. A Kind of Approach for Aero Engine Gas Path Fault Diagnosis. In Proceedings of the IEEE International Conference on Prognostics and Health Management (ICPHM), Dallas, TX, USA, 1 June 2017. [Google Scholar]
- Verma, R.; Roy, N.; Ganguli, R. Gas turbine diagnostics using a soft computing approach. Appl. Math. Comput. 2006, 172, 1342–1363. [Google Scholar] [CrossRef]
- Bachir, A.; Hafaifa, A.; Guemana, M.; Hadroug, N. Application of Principal Component Analysis Approach in Gas Turbine Defect Diagnosis. In Proceedings of the International Conference on Applied Smart Systems, Medea, Algeria, 1 November 2018. [Google Scholar]
- Yang, L.; Ding, S.T.; Wang, Z.Y.; Li, G. Efficient Probabilistic Risk Assessment for Aeroengine Turbine Disks Using Probability Density Evolution. AIAA J. 2017, 55, 2755–2761. [Google Scholar] [CrossRef]
- Zeng, L.; Long, W.; Li, Y.Y. A Novel Method for Gas Turbine Condition Monitoring Based on KPCA and Analysis of Statistics Tand SPE. Processes 2019, 7, 124. [Google Scholar] [CrossRef]
- Wang, L.; Liu, Z.W.; Miao, Q.; Zhang, X. Time-Frequency analysis based on ensemble local mean decomposition and fast kurtogram for rotating machinery fault diagnosis. Mech. Syst. Signal Process. 2018, 103, 60–75. [Google Scholar] [CrossRef]
- Zhang, Y.; Randall, R.B. Rolling element bearing fault diagnosis based on the combination of genetic algorithm and fast kurtogram. Mech. Syst. Signal Process. 2009, 23, 1509–1517. [Google Scholar] [CrossRef]
- Pham, H.T.; Yang, B.S. Estimation and forecasting of machine health condition using ARMA/GARCH model. Mech. Syst. Signal Process. 2010, 24, 546–558. [Google Scholar] [CrossRef]
- Hu, Y.; Yang, Y.Y.; Zhang, S.Y.; Sun, Z.S.; Zhu, J.T. Turbofan Engine Gas Path Performance Monitoring based on Improved Spherical Simplex Square Root Unscented Kalman Filter. J. Aerosp. Power 2014, 29, 441–449. [Google Scholar]
- Hu, Y.; Zhang, S.Y.; Yang, Y.C.; Zhu, J.T.; Yang, Z.W. Fault Diagnosis of Gas Path Components of Turbofan Engine based on Spherical Square Root Unscented Kalman Filter Algorithm. J. Aerosp. Power 2014, 29, 689–694. [Google Scholar]
- Zhang, P. Aeroengine Fault Diagnosis Based on Kalman Filter. Ph.D. Thesis, Nanjing University of Aeronautics and Astronautics, Nanjing, China, 2014. [Google Scholar]
- Kurzke, J.; Riegler, C.; Bauer, M. Some Aspects of Modeling Compressor Behavior in Gas Turbine Performance Simulation. ASME J. Turbo Mach. 2001, 123, 373–378. [Google Scholar]
- Li, R.X.; Prasad, V.; Huang, B. Gaussian Mixture Model-Based Ensemble Kalman Filtering for State and Parameter Estimation for a PMMA Process. Processes 2016, 4, 9. [Google Scholar] [CrossRef]
- Simon, D.; Simon, D.L. Constraint Kalman Filtering Via Density Function Truncation for Turbofan Engine Health Estimation. Int. J. Syst. Sci. 2010, 41, 159–171. [Google Scholar] [CrossRef]
- Simon, D. Kalman Filtering with State Constraints: A Survey of Linear and Non-linear Algorithms. IET Control Theory Appl. 2010, 4, 1303–1318. [Google Scholar] [CrossRef]
- Soken, H.E.; Hajiyev, C. Pico Satellite Attitude Estimation via Robust Unscented Kalman Filter in the Presence of Measurement Faults. ISA Trans. 2010, 49, 249–256. [Google Scholar] [CrossRef] [PubMed]
- Dyke, M.C.; Schwartz, J.L.; Hall, C.D. Unscented Kalman Filtering for Spacecraft Attitude State and Parameter Estimation. In Proceeding of the AAD/AIAA Space Flight Mechanics Conference, Maui, HI, USA, 8–12 February 2004. [Google Scholar]
- Liu, H.F.; Yao, Y.; Lu, D.; Ma, J. Study for Outliers based on Kalman Filtering. Electr. Mach. Control 2003, 7, 40–42. [Google Scholar]
- Cheng, F.Z.; Qu, L.Y.; Qiao, W.; Hao, L.W. Enhanced Particle Filtering for Bearing Remaining Useful Life Prediction of Wind Turbine Drivetrain Gearboxes. IEEE Trans. Ind. Electron. 2019, 66, 4738–4748. [Google Scholar] [CrossRef]
- Wang, X.X.; Pan, Q.; Huang, H.; Gao, A. Overview of Deterministic Sampling Filtering Algorithm for Nonlinear System. Control Decis. 2012, 27, 801–810. [Google Scholar]
- Zeng, L.; Long, W.; Li, Y.Y. Performance Degradation Diagnosis of Gas Turbine Based on Improved FUKF. J. Southwest Jiaotong Univ. 2018, 53, 873–878. [Google Scholar]
© 2019 by the authors. Licensee MDPI, Basel, Switzerland. This article is an open access article distributed under the terms and conditions of the Creative Commons Attribution (CC BY) license (http://creativecommons.org/licenses/by/4.0/).