Article

Effect of Ammonia Activation and Chemical Vapor Deposition on the Physicochemical Structure of Activated Carbons for CO2 Adsorption

1
College of Engineering and Technology, Jilin Agricultural University, Changchun 130118, China
2
College of Animal Science and Technology, Jilin Agricultural University, Changchun 130118, China
*
Author to whom correspondence should be addressed.
Processes 2019, 7(11), 801; https://doi.org/10.3390/pr7110801
Submission received: 5 October 2019 / Revised: 28 October 2019 / Accepted: 31 October 2019 / Published: 3 November 2019
(This article belongs to the Section Chemical Processes and Systems)

Abstract

:
Focusing on the bottlenecks of traditional physical activation method for the preparation of activated carbons (ACs), we established a simple and scalable method to control the physicochemical structure of ACs and study their CO2 adsorption performance. The preparation is achieved by ammonia activation at different volume fractions of ammonia in the mixture (10%, 25%, 50%, 75%, and 100%) to introduce the nitrogen-containing functional groups and form the original pores and subsequent chemical vapor deposition (CVD) at different deposition times (30, 60, 90, and 120 min) to further adjust the pore structure. The nitrogen content of ACs-0.1/0.25/0.5/0.75/1 increases gradually from 2.11% to 8.84% with the increase of ammonia ratio in the mixture from 10% to 75% and then decreases to 3.02% in the process of pure ammonia activation (100%), during which the relative content of pyridinium nitrogen (N-6), pyrrolidine (N-5), and graphite nitrogen (N-Q) increase sequentially but nitrogen oxygen structure (N-O) increase continuously. In addition, ACs-0.5 and ACs-0.75, with a relatively high nitrogen content (6.37% and 8.84%) and SBET value (1048.65 m2/g and 814.36 m2/g), are selected as typical samples for subsequent CVD. In the stage of CVD, ACs-0.5-60 and ACs-0.75-90, with high SBET (1897.25 and 1971.57 m2/g) value and an appropriate pore-size distribution between 0.5 and 0.8 nm, can be obtained with the extension of deposition time from 60 to 90 min. The results of CO2 adsorption test indicate that an adsorption capacity of ACs-0.75-90, at 800 mmHg, is the largest (6.87 mmol/g) out of all the tested samples. In addition, the comparison of CO2 adsorption performance of tested samples with different nitrogen content and pore structure indicates that the effect of nitrogen content seems to be more pronounced in this work.

1. Introduction

With the development of human society, massive emissions of CO2 from fossil fuel combustion cause serious pollution on the environment and pose a threat to human health [1]. A post-combustion capture (PCC) technology including chemical and physical absorption methods can capture effectively CO2 from flue gas [2], but a chemical absorption method using organic amine (such as alkanolamine and ethanolamine) now faces the dilemma of equipment corrosion, high capital cost, and solvent consumption [3]; thus, a physical absorption method using carbon-based porous materials, such as activated carbons (ACs), has been extensively explored, to remove CO2 from flue gas, due to its advantages of being low in cost, highly efficient, and environmentally sustainable [4]. In addition, the coal as raw materials, instead of traditional biomasses and some wastes, can meet the industrial requirements.
At present, the preparation of coal-based ACs with a desirable physicochemical structure is the key factor to realizing high efficiency of CO2 adsorption. First, an excellent CO2 capture is related to the micropores quantity of ACs. According to the theory of micropore filling [5], the gas molecules within the micropore presented an adsorbed state at lower pressure. When pore size was small, the adsorption potential energy within the pores was enhanced by the superposition of van der Waals force on the pore wall, resulting in the increase of CO2 adsorption. Yi et al. [6] studied CO2 adsorption performance of carbon materials with three kinds of pore structures (hierarchical pore, ultra-micropore, and ordered mesoporous) at low pressure. Correlation analysis indicated that the adsorption properties of materials depended entirely on the number of micropores. Zhao et al. [7] proved that the diffusion rate of CO2 molecules in the ultra-micropore with a pore diameter of about 0.5 nm was the highest by simulation and calculation method. Wickramaratne [8] and Presser et al. [9] found that the super-micropore with a pore diameter of between 0.5 and 0.8 nm had a significant effect on increasing CO2 adsorption. The contents of nitrogen-containing functional groups also have an important impact on CO2 adsorption of ACs. Hohm et al. [10] believed that the interaction between CO2 molecules with strong quadrupole moments and polar nitrogen-containing functional groups promoted CO2 adsorption of ACs. Khoerunnisa [11] and Gong et al. [12] found that the electronegativity of nitrogen atoms was stronger than that of carbon atoms; thus, the charge density surrounding carbon atoms was increased by the incorporation of nitrogen atoms, which strengthened CO2 adsorption capacity. Wu et al. [13] prepared nitrogen-doped mesoporous carbon in situ by introducing diazonitrile amine. The nitrogen content of mesoporous carbon was as high as 13.1 wt.%, and N mainly existed in the form of pyrrole and Ph-NH2; this nitrogen-doped mesoporous carbon presented excellent CO2 adsorption (3.2 mmol/g) and selectivity at room temperature and atmospheric pressure. Wilke et al. [14] found that N-doped carbon materials with a graded sponge shape introducing SiO2 nanoparticles into melamine resin presented high CO2 selectivity in CO2/CH4 mixture. Finally, in terms of the preparation of AC, traditional physical activation using H2O, O2, and CO2, or their mixtures, displays the characteristics of simplicity, environmental friendliness, and economy. Some researchers found that ammonia as an activation agent at a high temperature could realize simultaneously the incorporation of nitrogen atoms and pores development. Zhai et al. [15] used cellulose as raw material to prepared porous carbon materials with a nitrogen content of 10.43%, under ammonia activation conditions. Jin et al. [16] used resorcinol formaldehyde (RF) xerogel as raw material to prepare the different nitrogen-doped porous carbon materials under NH3 and NH3/N2 mixtures at a high temperature. Kim et al. [17] have prepared the nitrogen-doped mesoporous carbon with 8% nitrogen content in ammonia/nitrogen (volume ratio 1:1) mixture at 80 °C. However, the pore development follows a branched model during physical activation [18,19,20,21]; more concretely, the micropore is formed on the surface of particles in the initial stage of activation, and then the successive diffusion of the activated agent from the surface to the core helps the formation of a new micropore; meanwhile, the formation of mesopores and macropores originates from the enlargement of the former micropore. This development process inevitably leads to a low specific surface area (SBET), even in various activation conditions (such as activation temperature, activation time, activated gas species, and so forth). After physical activation, the pore size of carbon materials can be adjusted further by chemical vapor deposition (CVD), using organic carbon source (such as benzene, toluene, methane, acetylene, ethylene, or ethanol) [22,23,24]. Cansado et al. [25] used the benzene as carbon source to adjust the micropore size of asphalt-based activated carbon fibers by CVD method. The obtained carbon molecular sieves (CMS) with 93% microporosity had a good screening ability for CO2/CH4. Kang et al. [26] found that benzene vapor as a carbon source was the most favorable to adjust pore size at 700~800 °C. However, the application of benzene as an organic carbon source is limited because of its high toxicity, volatility, and relatively high price [27]. Therefore, methane, as a clean gas, with the advantages of nontoxicity, low cost, and abundant sources, has gradually attracted people’s attention. Villar-Rodil et al. [28] found that the preparation of CMS by using methane as a carbon source could accurately adjust the pore size to promote CO2 adsorption and separation.
In this paper, the effects of ammonia activation and subsequent CVD on the physicochemical structure of ACs in the whole preparation process were investigated. First, coal was activated under different volume ratios of ammonia and nitrogen, at 900 °C, to introduce the nitrogen-containing functional groups and form the original pores. After that, the further adjustment of pore size could be performed by CVD, using methane as a carbon source, at 900 °C, for different times. In addition, the results of physicochemical structure of all samples were measured by a D/max-rb X-ray diffractometer (XRD), Raman spectroscopy, nitrogen adsorption, X-ray photoelectron spectroscopy (XPS), high-resolution transmission electron microscope (HRTEM), and scanning electron microscope (SEM). Finally, in order to verify the application potentials of ACs samples with ideal physicochemical structure, a CO2 adsorption test was carried out by gas adsorption instrument.

2. Materials and Methods

2.1. Sample Pretreatment

Jixi bituminous coal with the particle sizes of 200–350 µm was obtained from the northeast of China. In order to eliminate the interference of minerals in raw material, Jixi bituminous coal was treated sequentially, using 30 wt.% HF and 5 mol·L-1 HCl, according to the literature method [29]. The acid-treated samples were washed with deionized water and dried in an oven, at 85 °C, for 12 h, and were marked as JX. The proximate analyses and ultimate analyses of JX are given in Table 1. As seen from Table 1, low ash content (0.12%) of JX indicated that minerals were removed by acid treatment.

2.2. Samples Preparation

Fifteen grams of JX was heated to 900 °C, at constant rate of 10 °C/min, and held for 60 min, at 900 °C, under different ratios of ammonia and nitrogen flow of 600 mL/min. The obtained samples were marked as ACs-X; X was the volume fraction of ammonia in the mixture including 0.1, 0.25, 0.5, 0.75, and 1. Then, the mixture atmosphere was converted to methane at 600 mL/min and held for 30, 60, 90, and 120 min, respectively. Finally, these samples were cooled down to room temperature and marked as ACs-X-Y; Y presented different reaction times under methane atmosphere.

2.3. Measurement of Physicochemical Structure of Samples

The surface topography and the microstructure of samples were obtained by a scanning electron microscope (SEM, Quanta 200, FEI, Hillsboro, OR, USA) at 200 kV and a high-resolution transmission electron microscope (HRTEM, Tecnai G2 F30, FEI, Hillsboro, OR, USA) at 300 kV. The crystal information of the sample was received by a D/max-rb X-ray diffractometer (XRD, D8 ADVANCE, Brooke, Karlsruhe, Germany), at a fixed scanning speed of 3°/min, from 5° to 85°. The elemental composition, chemical state, and relative concentration on the surface of the samples were obtained by X-ray photoelectron spectroscopy (XPS, K-Alpha, Thermo Fisher Scientific, Waltham, MA, USA), with Al Kα X-ray at 14 kV and 6 mA [30]. The pore parameters of the samples were received by a micromeritics adsorption apparatus (BELSORP-miniII, MicrotracBEL, Osaka, Japan), at 77 K and a relative pressure (P/P0) range from 10−7 to 1 [31]. The vacuum degassing pretreatment of tested samples was carried out at 473 K, for 12 h. Moreover, the specific surface area (SBET) of the samples was calculated by using a BET model, in relative pressure range of 0.05–0.2 [32]; the total pore volume (Vtot) caused by the adsorption value of liquid nitrogen at relative pressure of 0.98 was obtained using the t-plot method [33]; the micropore volume (Vmic) of sample was calculated using the Horvath–Kawazoe (HK) method [34]; the density functional theory (NLDFT) was used to obtain the pore-size distribution of micropore and mesopore, and the relative pressure range was 10−7~0.9 [35].

2.4. CO2 Adsorption Test of Typical Samples

CO2 adsorption performance of typical samples was tested by an adsorption apparatus (BELSORP-miniII, MicrotracBEL, Osaka, Japan). Before the test, vacuum degassing was carried out at 523 K, for 12 h. CO2 adsorption isotherms of all samples were obtained in the pressure range of 0–800 mmHg, at 273 K, in an ice-water bath, using CO2 as adsorbed gases.

3. Results and Discussion

3.1. Surface Morphology and Microstructure Analysis of Samples at Different Ammonia Activation Conditions

Figure 1a–e shows several SEM images of ACs-X samples at different ammonia activation conditions. The smooth surface and compact texture of ACs-0.1 can be found in Figure 1a, indicating that carbon particles cannot be effectively etched under 10% ammonia gas in mixture. In this process, the formation of more metaplast by the combination of transferable hydrogen and aliphatic hydrocarbons has reshaped the particle surface [36]. With the increasing proportion of ammonia gas in mixture from 0.25 to 1, the carbon particles can be etched from surface to core, gradually, under the intense activation reactions between ammonia and carbon structure. In this process, pores’ development follows a branched model, which inevitably leads to some severe carbon losses on the surface of particles; thus, the rough surface and the formation of some mesopores and macropores on the particle surface of ACs-0.25/0.5/0.75/1 can be found in Figure 1b–e.
Figure 1f–j shows several HRTEM images of ACs-X samples at different ammonia activation conditions. There is a large amount of long crystallite with interlaced arrangement near some quantities of amorphous carbon, as shown in Figure 1f, indicating the formation of ordered microstructure of ACs-0.1 under 10% ammonia gas in the mixture. With the increasing proportion of ammonia gas in the mixture from 25% to 75%, the presence of shorter and thinner crystallite layers with arbitrary arrays of ACs-0.25/0.5/0.75 in the process of gradually stronger activation are found in Figure 1g–i, and some pores might be formed between microcrystalline layers with arbitrary orientation. A large number of multilayers with consistent orientation and little amorphous carbon of ACs-1can be found in Figure 1j, indicating ordered conversion of microstructure in the process of the pure ammonia activation.

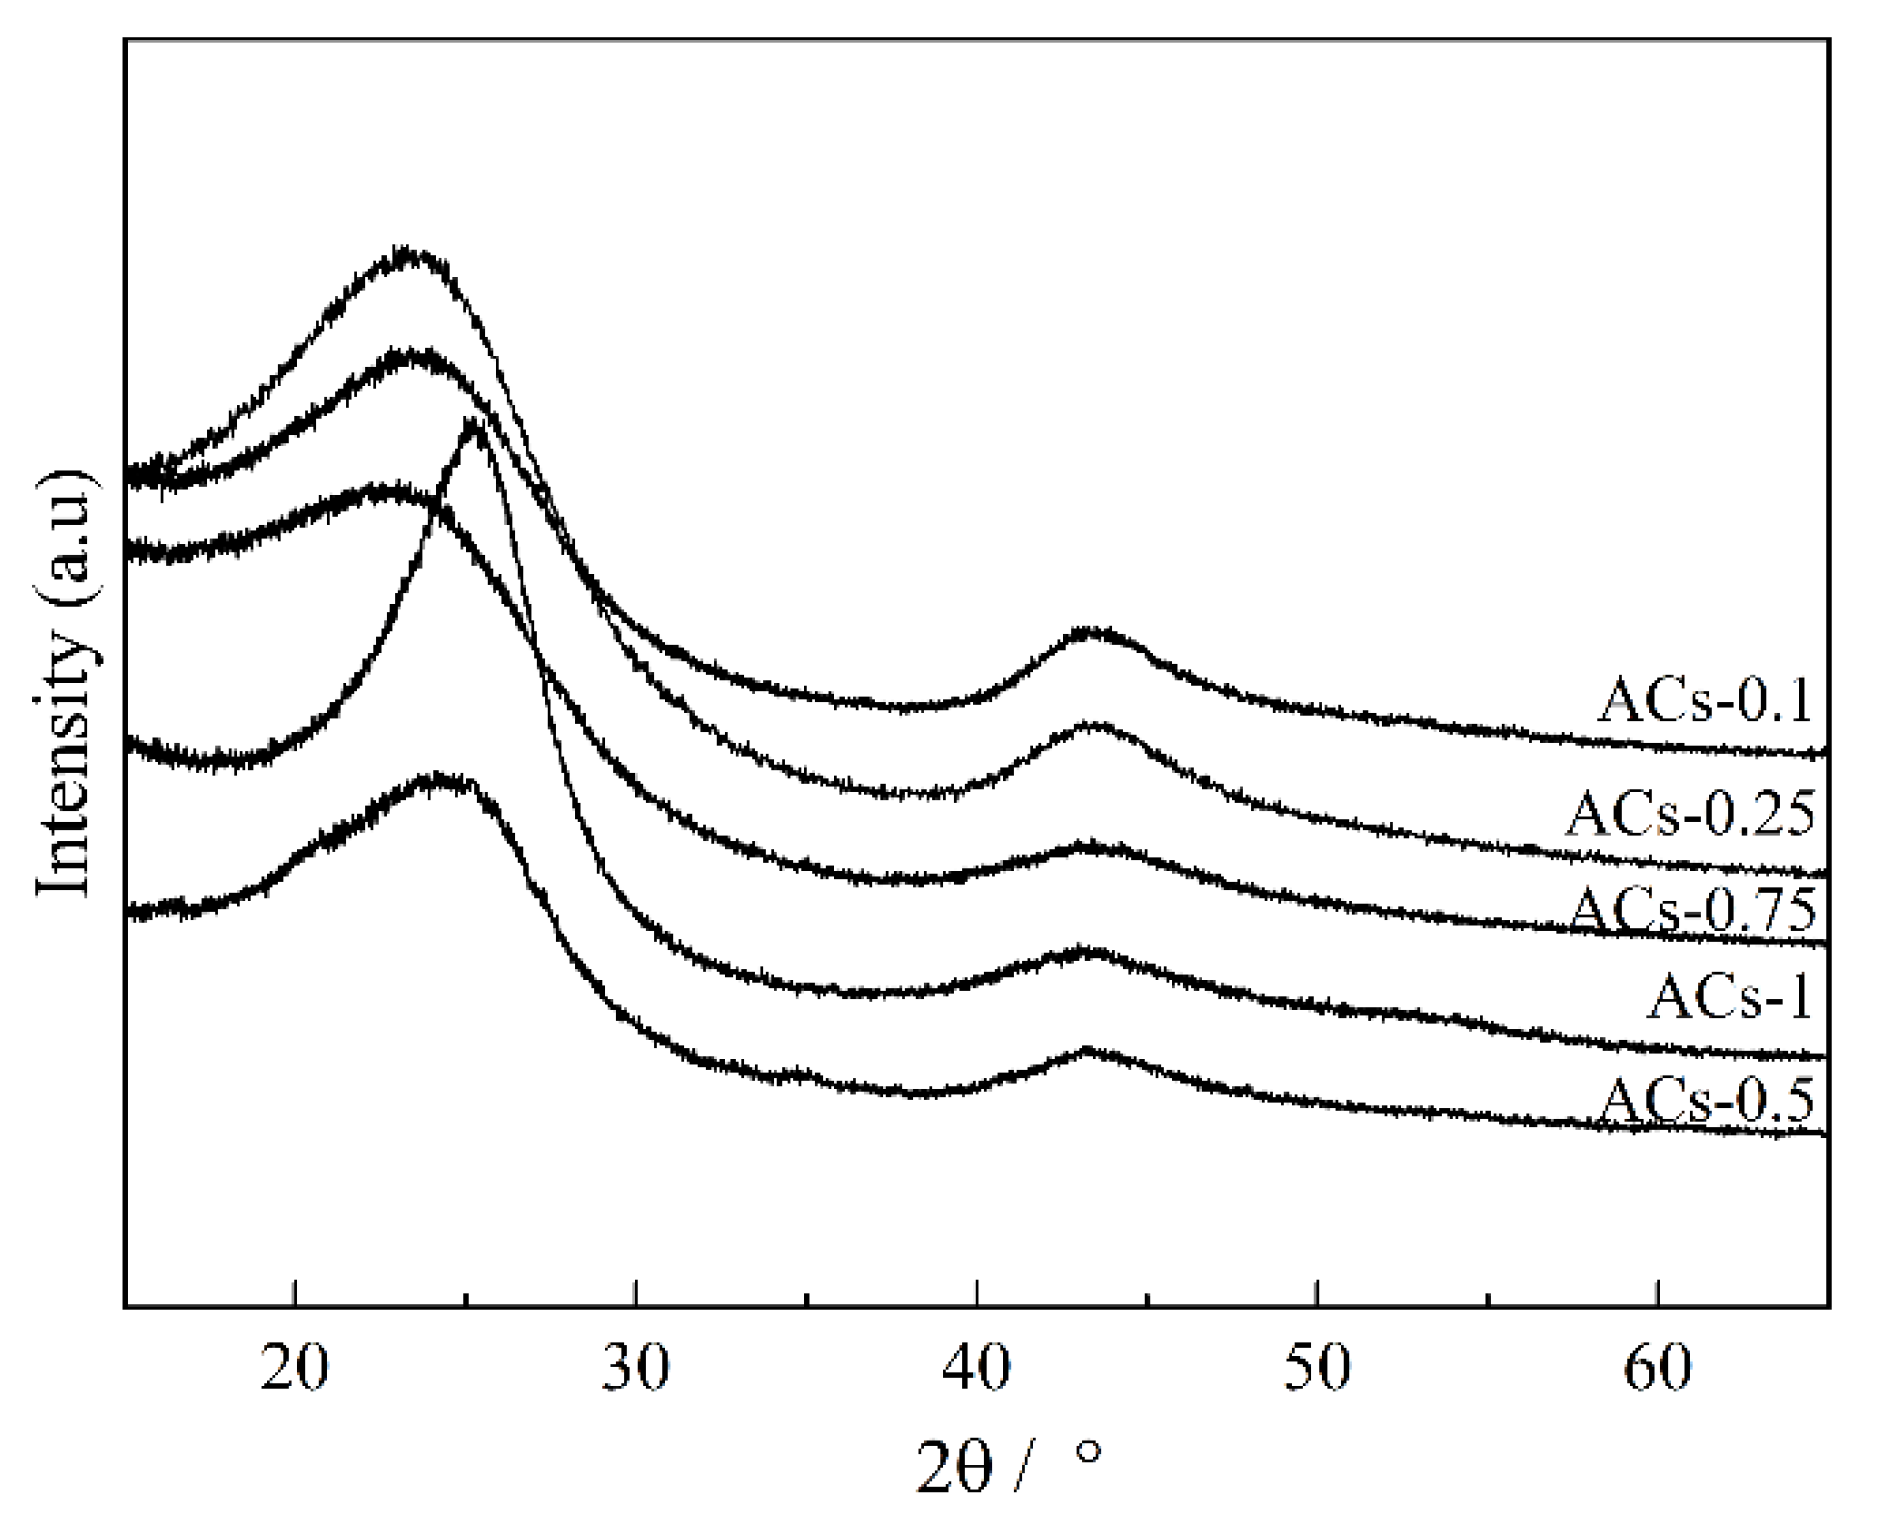
3.2. Crystal Structure Analysis of Samples at Different Ammonia Activation Conditions

The XRD profiles of ACs-X samples are given in Figure 2. There are two obvious broad diffraction peaks at 2θ = 16°–32° and 36°–52° in all samples. The details of two diffraction peaks (such as positions and half-peak width) can be obtained using the peak fitting treatment. Some crystal parameters, including the interlayer distance (d002), stacking height (Lc), the size (La), and number (N) of aromatic layers, are calculated by the following formulas [37]:
d 002 = λ 2 sin θ
L c = 0.89 λ β cos θ
L a = 1.84 λ β cos θ
N = L c d 002
In the above formulas, λ is the wavelength of X-ray, and λ = 1.54 Å; θ is peaks’ positions (°); and β is half-peak width. The results of crystal parameters of ACs-X samples are given in Table 2.
There is a sustained decrease in La, Lc, and N values and an increase in d002 value for ACs-0.1/0.25/0.5/0.75, indicating the disordered conversion of crystallite structure. This result might be related to the imbalance and longitudinal distortion of aromatic layers with the increasing proportion of ammonia gas in the mixture, from 10% to 75%. In this process, the nitrogen atom might be fixed on the edge of an aromatic layer in the form of a variety of functional groups, which can also hinder the dehydrogenation and condensation of aromatic rings. When the ammonia ratio in the mixture is 100%, then La, Lc, and N values of ACs-1 increase significantly, and its d002 value decreases rapidly, presenting the ordered conversion of crystallite structure. This result might be related to the longitudinal condensation and the dehydrogenation of aromatic layers caused by the rapid consumption of the side chains, bridge bonds, and defective structures on the edge of aromatic layers, in the process of pure ammonia condition. However, the fixation of nitrogen atoms may not be achieved with the consumption of more defective structure. Based on the above, the changes of XRD parameters under different proportions of ammonia in mixture, there is an optimum ammonia ratio in the mixture that can effectively improve the crystal structure of ACs-X samples.

3.3. Carbon Structure Analysis of Samples at Different Ammonia Activation Conditions

The Raman spectra of ACs-X samples are shown in Figure 3. There are two obvious broad diffraction peaks at 1230–1450 cm−1 (D peak) and 1450–1580 cm−1 (G peak) in all samples. Serious widening of D and G peak of Raman spectra indicates the existence of many sp2 and sp2–sp3 hybridized structure in incomplete graphitized materials [38,39]. It is necessary to resolve overlapped peaks by using fitting treatment at 1300 cm−1 (D1 peak), 1520 cm−1 (D3 peak), 1200 cm−1 (D4 peak), and 1550 cm−1 (G peak). Figure 4 shows the fitting curve of ACs-0.5. The D1 peak represents defective sp2 bonding carbon atoms; the D3 peak represents the amorphous sp2 bonding carbon atoms; the D4 peak represents the sp2–sp3 bonding carbon atoms; the G peak represents the crystalline sp2 bonding carbon atoms. Furthermore, the relative quantity of different hybridized structure is as follow in turn: (1) AD1/AG represents the relative quantity of the big aromatic rings, including C–C between aromatic rings and aromatics with no less than six rings with a defective structure; (2) AD3/AG represents the relative quantity of the small aromatic rings, including aromatics with three to five rings and semicircle breathing of aromatic rings; (3) AD4/AG represents the relative quantity of the cross-linking structure, including Caromatic–Calkyl, aromatic (aliphatic) ethers, and C–C on hydroaromatic rings [29]. The results of different hybrid carbon in the form of area ratios of ACs-X samples are shown in Table 3.
There is an obvious increase in the value of AD1/AG and a slow decrease in the value of AD3/AG and AD4/AG for ACs-0.1/0.25/0.5/0.75. With the increase of ammonia ratio in mixtures, from 10% to 75%, the ordered microcrystalline formed by crystalline sp2 bonding carbon has decomposed into the big aromatic rings, including some cross-linking bonds and more broken fragments, including small aromatic rings; this results in the slow consumption rate of active sites. In addition, the increase of the big aromatic rings with the defective structure may help to bond and fix some nitrogen atoms within carbon matrix, which promotes the quantities of nitrogen-containing structures (such as functional groups and heterocycles). In this process, the increase of contact probability between oxygen in raw material and ammonia molecules in mixture gas may promote the content of N–O in all samples. However, the values of AD1/AG, AD3/AG and AD4/AG of ACs-1 obviously decrease during pure ammonia activation. The rapid consumption of small aromatic rings (AD3/AG) and the breakdown of the cross-linking structure (AD4/AG) can reactivate the inner of big aromatic rings to form the more crystalline sp2 bonding carbon atoms, which promotes the stability of carbon network but reduces the number of active sites [40]. Based on the above results and analysis, an optimum ammonia ratio in mixture can effectively improve the carbon structure of ACs-X samples.

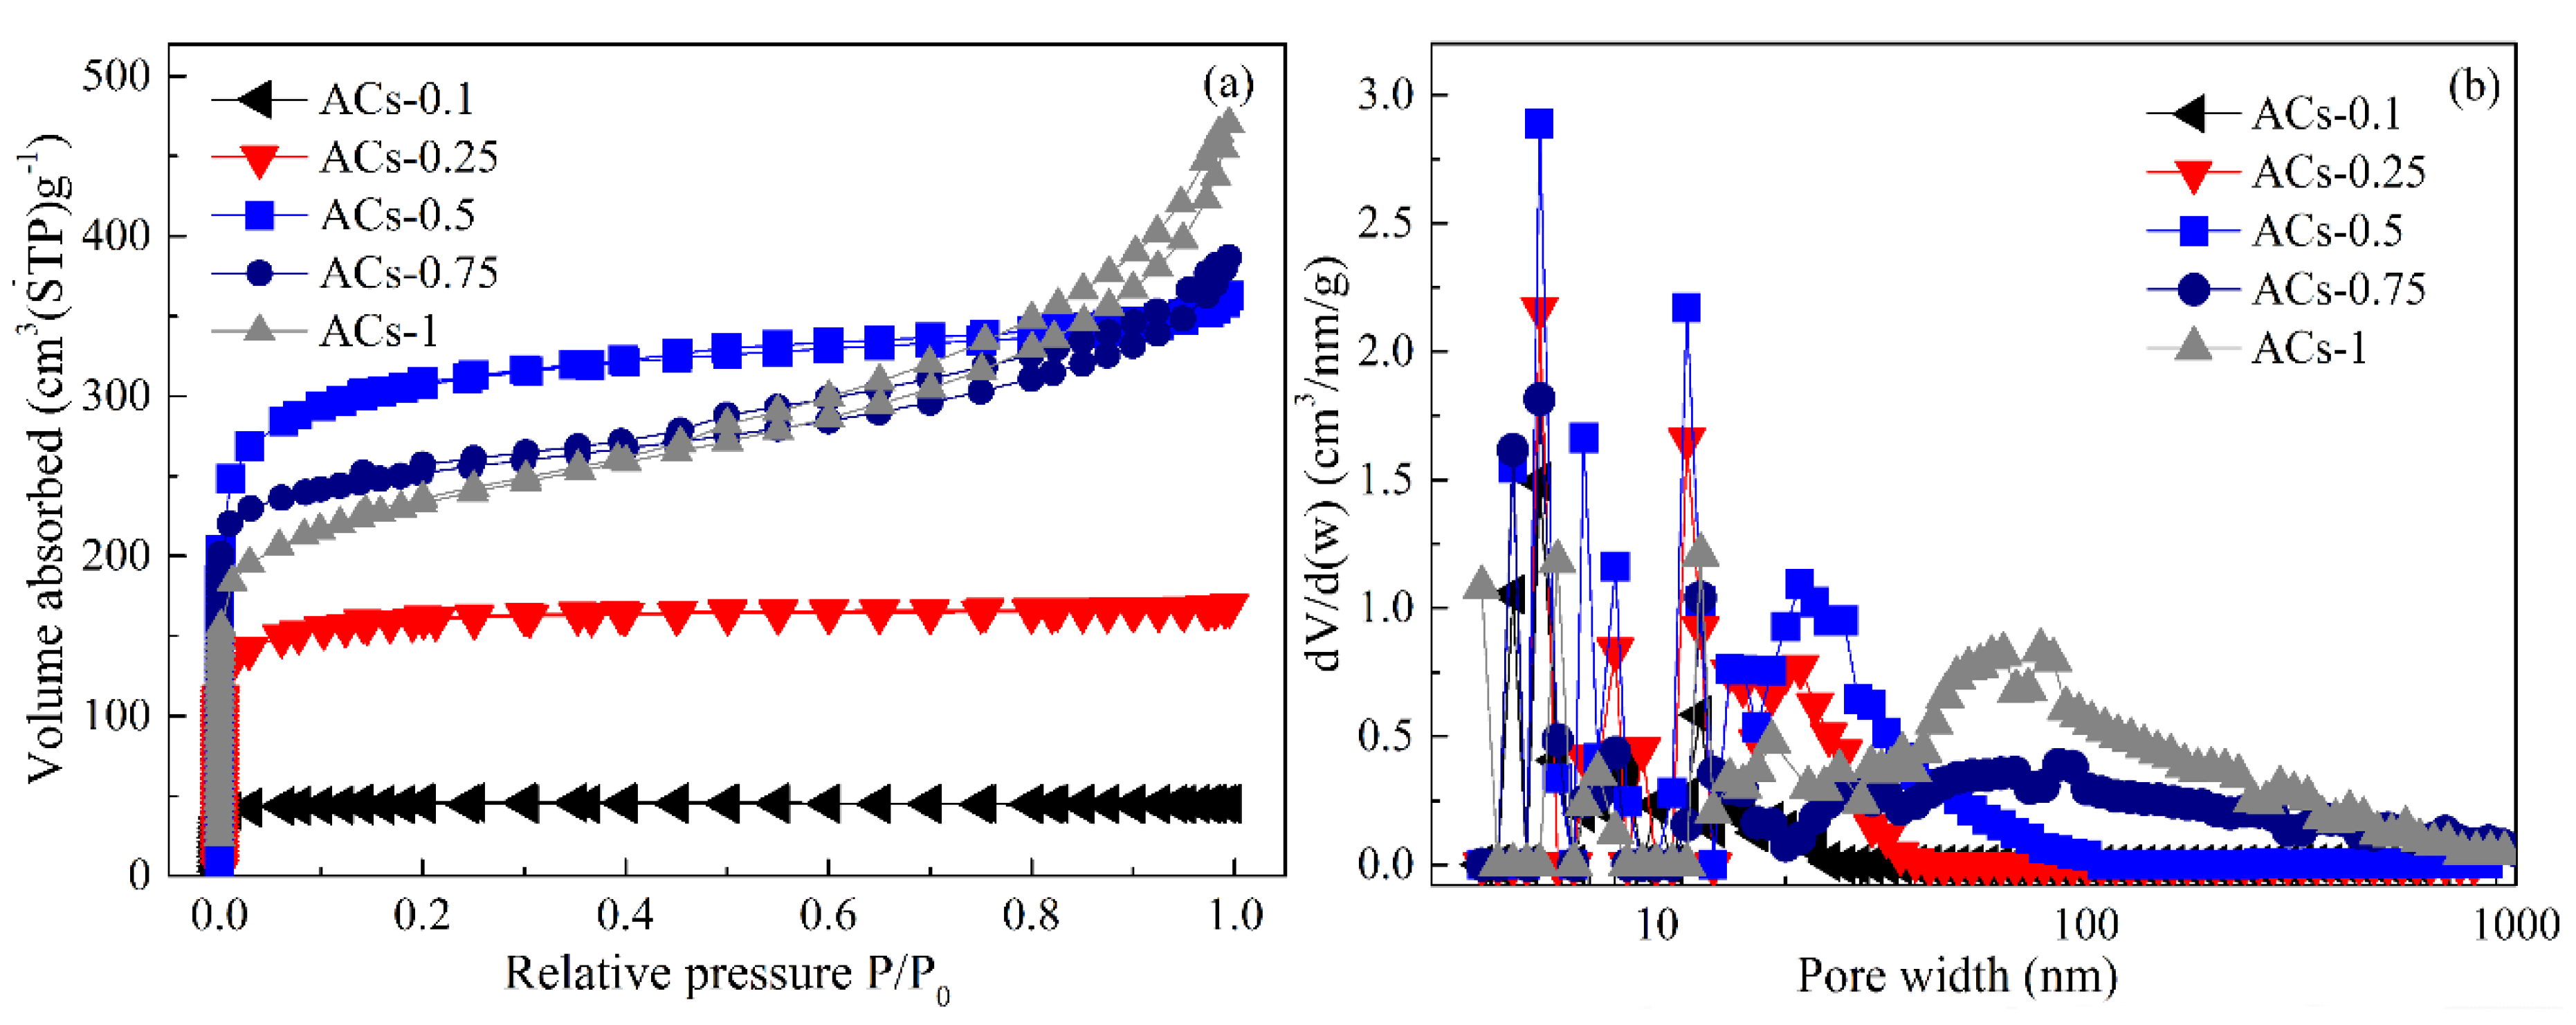
3.4. Pore Structure Analysis of Samples at Different Ammonia Activation Conditions

N2 adsorption isotherm and pore-size distribution of ACs-X samples are given in Figure 5, and the corresponding pore parameters are shown in Table 4.
First, N2 adsorption isotherm of ACs-0.1 is attributed to a type I, according to the IUPAC classification, and its N2 adsorption capacity is very small, showing a small amount of micropore. In addition, the SBET value of 60.11 m2∙g−1, Vt value of 0.051 m3∙g−1, Vmic value of 0.045 m3∙g−1, and non-Vmic value of 11.76% of ACs-0.1 with a narrow size distribution of less than 1 nm are shown in Table 4. The weak activation caused by 10% ammonia gas in the mixture can’t effectively remove the metaplast materials, resulting in the formation of few pores. Then, with the increase of ammonia ratio in the mixture from 10% to 25%, N2 adsorption isotherm of ACs-0.25 is attributed to a type I, and its N2 adsorption capacity increases, indicating the formation of some micropores. The SBET value of 317.65 m2∙g−1, Vt value of 0.178 m3∙g−1, Vmic value of 0.131 m3∙g−1, and non-Vmic value of 26.40% of ACs-0.25 can be found in Table 4. With the increase of ammonia ratio in the mixture from 50% to 100%, N2 adsorption isotherms of ACs-0.5/0.75/1 exhibit a typical characteristic of type IV with the increase of the relative pressure from 0 to 1; these isotherms began to branch and present a hysteresis loop, indicating the formation of hierarchical pores. More concretely, N2 adsorption capacity of ACs-0.5, at low pressure, increases rapidly, and it presents a flat adsorption isotherm and a small hysteresis loop; meanwhile, an obvious increase in Vt value from 0.178 to 0.471 m3∙g−1, Vmic value of 0.131 to 0.318 m3∙g−1, and SBET value from 317.65 to 1048.65 m2∙g−1, as well as a slow increase in Non-Vmic (%) value from 26.40% to 32.48%, are also shown in Table 4. These results indicate the rapid development of micropores, rather than that of mesopores and macropores. When the ammonia ratio in mixtures increases from 75% to 100%, N2 adsorption isotherms of ACs-0.75/1 present an inclined angle and an obvious hysteresis loop with the increase of relative pressure from 0 to 1, and N2 adsorption capacity of isotherms of ACs-0.75/1 at low pressure decrease more gradually than that of ACs-0.5. Meanwhile, there is an obvious decrease in SBET value from 814.36 to 442.14 m2∙g−1 and Vmic value from 0.271 to 0.198 m3∙g−1 and a rapid increase in the non-Vmic value from 47.48% to 66.32% for ACs-0.75/1, indicating a sustained formation of mesopores and macropores and a gradual widening pore distribution. This result is related to the expansion of micropores caused by overactivation at high proportion ammonia in mixtures. Therefore, an appropriate ratio of ammonia to nitrogen in the mixture can ensure the rapid development of micropores and a slow formation of mesopores and macropores, resulting in a relatively high SBET value and developed micropores.

3.5. Surface Chemical Structure Analysis of Samples at Different Ammonia-Activation Conditions

Figure 6 shows the broad scanning energy spectrum of ACs-X samples determined by XPS in the range of 10–1200 eV binding energy. Three obvious peaks (C1s, N1s and O1s) of ACs-X samples indicate the dominant position of C, N, and O in the element composition. The nitrogen content of ACs-0.1/0.25/0.5/0.75 increases gradually from 2.11% to 8.84%; this result is related to the rapid combination of surface unsaturated carbon atoms, with N atoms in the form of nitrogen-containing functional groups with the increase of ammonia ratio in the mixture from 10% to 75%. When the ammonia ratio in mixtures increases to 100%, the nitrogen content of ACs-1 decreases to 3.02%. This result is related to low probability of nitrogen atoms embedded in the carbon structure, caused by the excessive burnout of the carbon structure under pure ammonia activation. In addition, the oxygen elements in coal-based materials are usually released gradually, at high temperatures, in the form of small molecules, such as CO and CO2, but there is a slow increase in O content for ACs-X samples; this is because an increase of NH3 ratio in mixtures can promote the contact probability between O atom and ammonia molecules, which is conducive to fix more oxygen atoms.
In order to obtain the types and contents of nitrogen functional groups on the surface of ACs-X samples quantitatively, N1s peaks are fitted and analyzed according to different binding energies at 398.5 eV (pyridine nitrogen, N-6), 400.1 eV (pyrrolidine, N-5), 401.3 eV (graphite nitrogen, N-Q), and 404.5 eV (nitrogen oxygen structure, N–O), respectively. The results of relative contents of nitrogen-containing functional groups of ACs-X samples are given in Table 5. In the process of ammonia activation, pyridinium nitrogen (N-6), pyrrolidine (N-5), and graphite nitrogen (N-Q) are the three main forms of nitrogen atom doping. With an increase of ammonia ratio in the mixture from 10% to 50%, NH3 gradually reacts with the defective sites at the edge of aromatic lamellae to form a relatively stable nitrogen-containing five-membered rings, resulting in a steady increase in the relative content of pyridinium nitrogen (N-6). With an increase of the ammonia ratio in the mixture from 50% to 75%, the formation of more small aromatic rings caused by depolymerization of large aromatic rings under strong activation conditions facilitates the nitrogen incorporation, resulting in an obvious increase in the relative content of pyrrolidine (N-5) and graphite nitrogen (N–Q). With the increase of ammonia ratio in mixture from 75% to 100%, the ordered condensation of aromatic rings can destroy the five-membered heterocycles, thus resulting in an obvious decrease in the relative content of pyridinium nitrogen (N-6) and a rapid increase in the relative content of graphite nitrogen (N–Q). In addition, there is a sustained increase in the relative content of N–O structure with increase of ammonia ratio in the mixture, from 10% to 100%, which is related to the oxidation of pyridine nitrogen (N-6) and the bonding of oxygen atoms in the materials and the nitrogen atoms in ammonia in the form of an N–O structure.

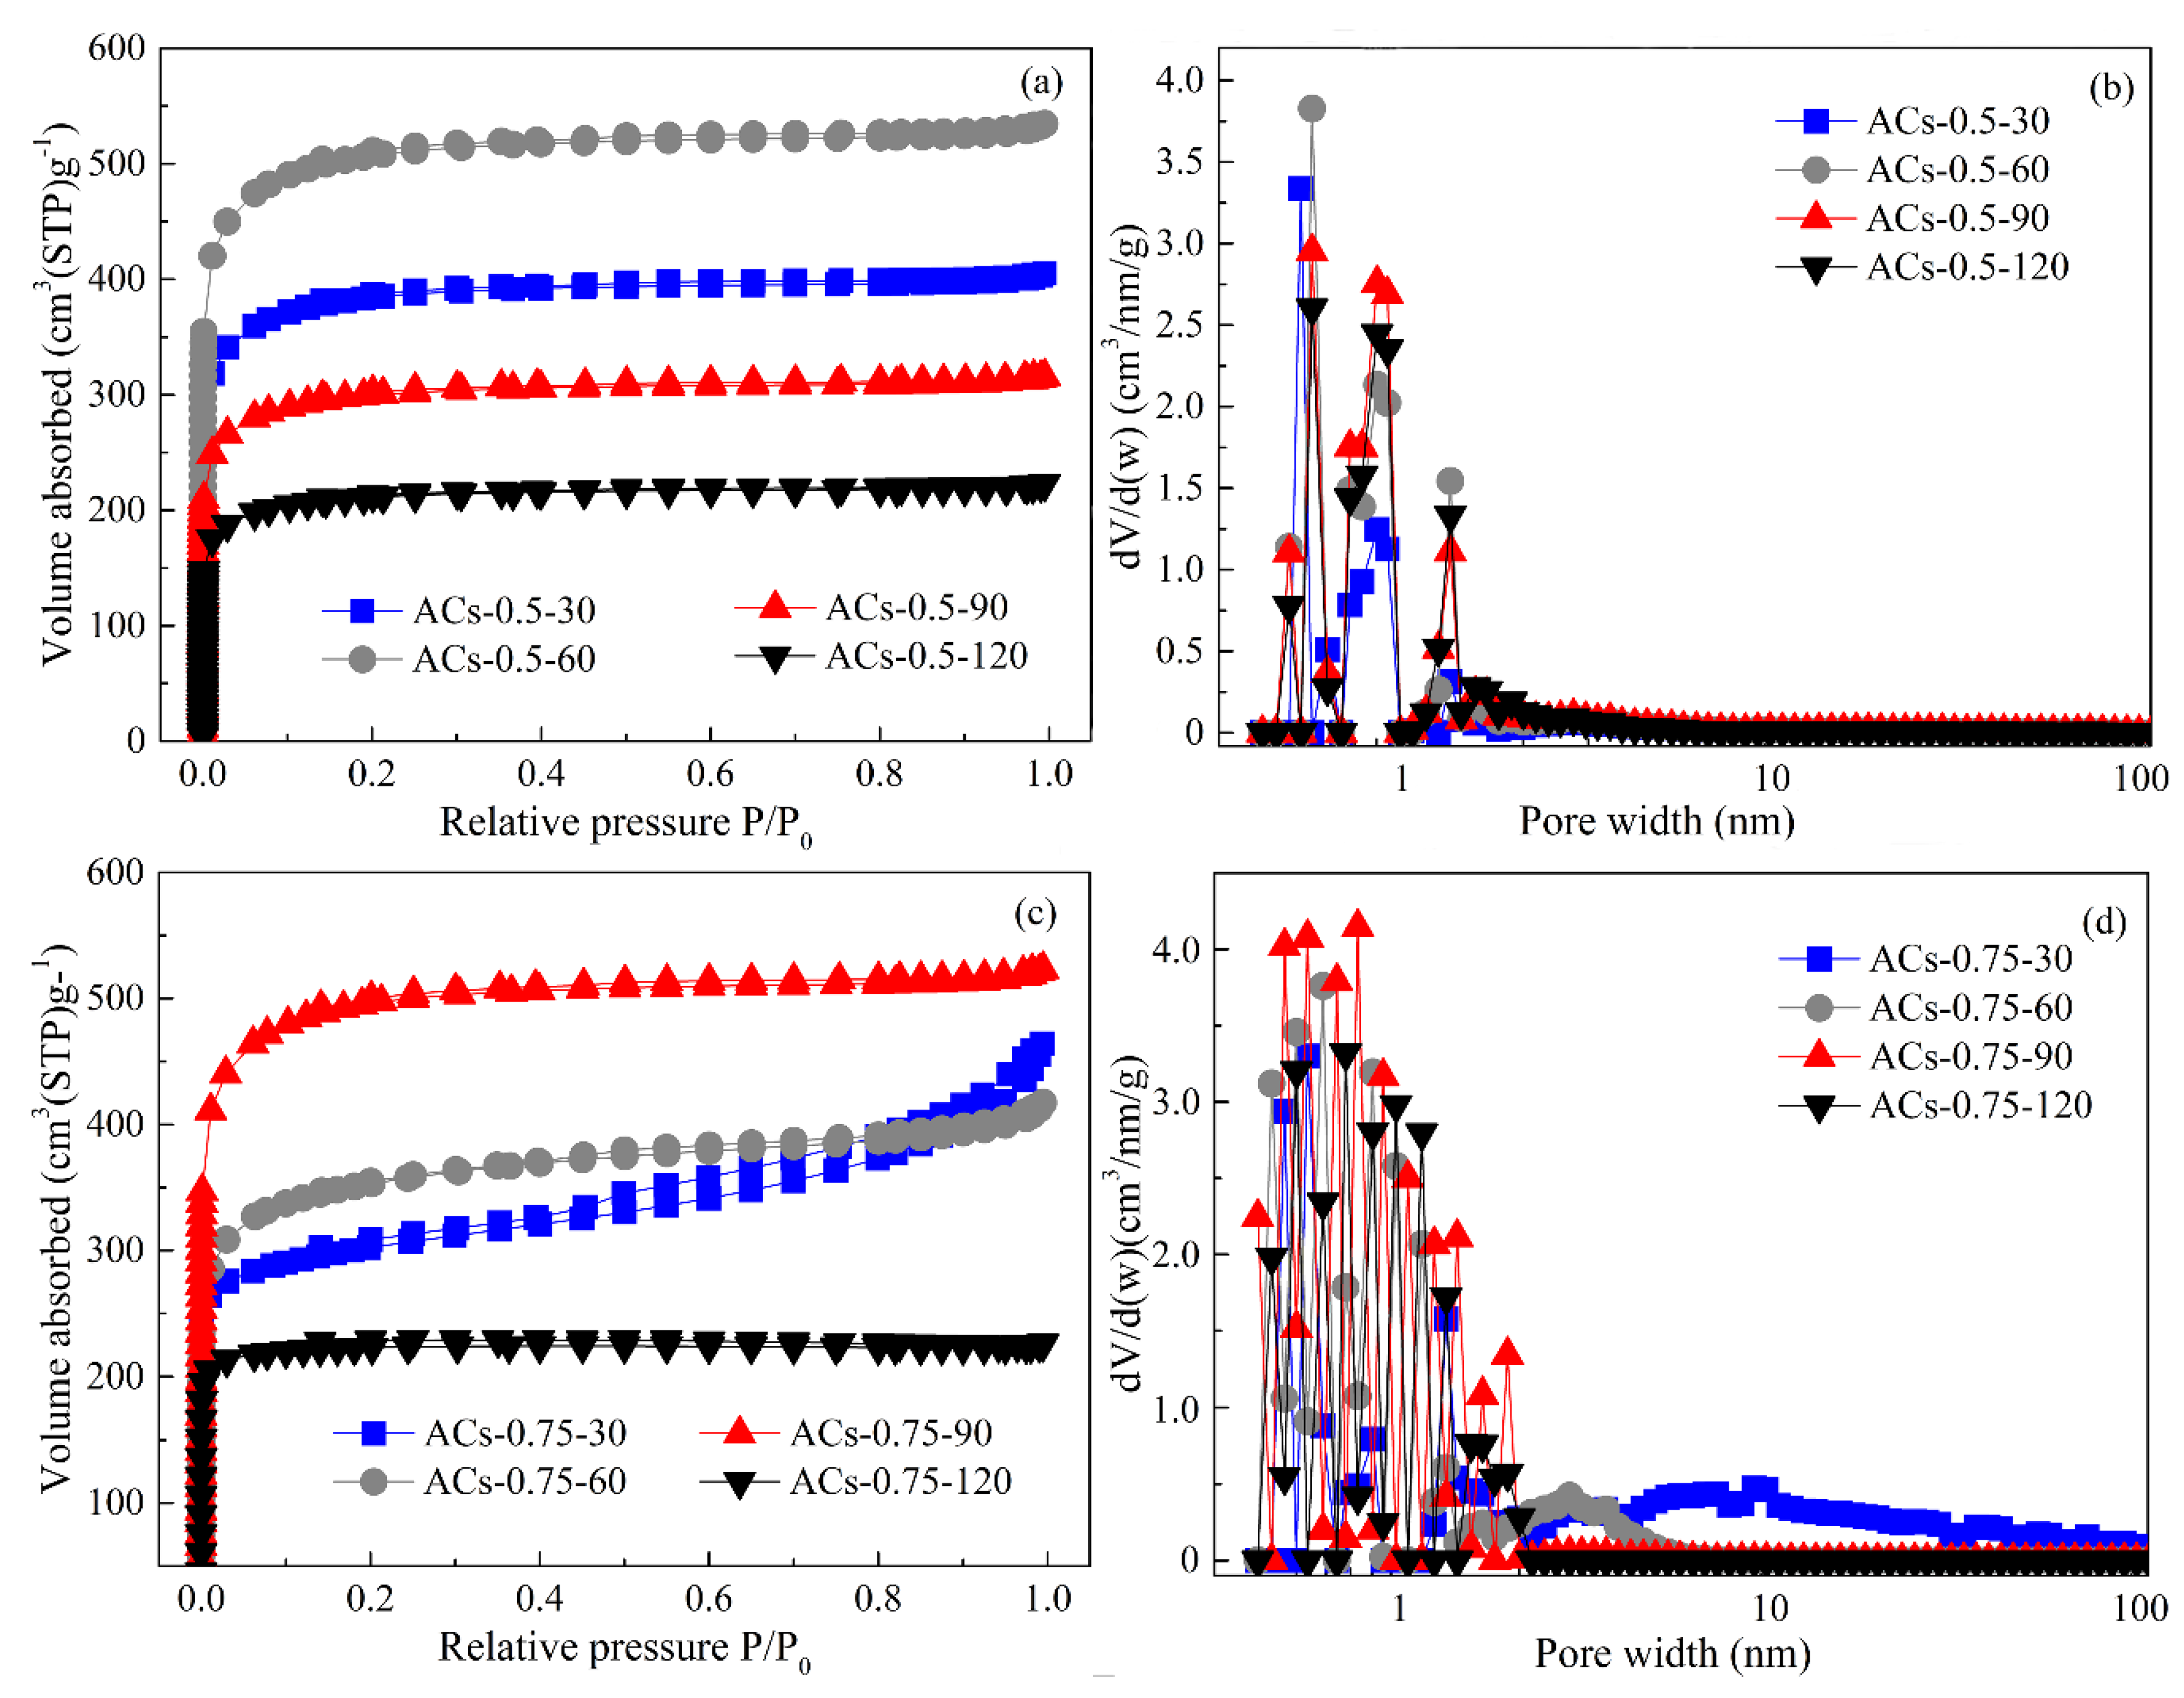
3.6. Pore Structure Analysis of Typical Samples at Different Deposition Times

According to the results of physicochemical structure of all samples, AC-0.5 has the highest SBET value in all samples and a relatively high nitrogen content, and AC-0.75 has the highest nitrogen content in all samples and a relatively desirable pore structure; thus, AC-0.5 and AC-0.75 are selected as typical samples for subsequent CVD treatment. The N2 adsorption isotherms and pore-size distribution of AC-0.5 and ACs-0.75 at different deposition times (30, 60, 90, and 120 min) are given in Figure 7, and the corresponding pore parameters are shown in Table 6.
From Figure 7a, the N2 adsorption isotherms of ACs-0.5-30/60/90/120 all exhibit a type I, indicating microporous characteristics. With the extension of deposition time from 30 to 60 min, the adsorption capacities of ACs-0.5-30/60 at low pressure gradually increase, indicating the appearance of more micropores. However, the adsorption capacities of ACs-0.5-90/120 at low pressure gradually decrease with the extension of deposition time from 90 to 120 min, indicating the disappearance of some micropores. From Figure 7b, the pore size distribution of ACs-0.5-30/60/90/120 gradually shifts to a small pore size with the increase of deposition time from 30 to 120. In addition, Vt and non-Vmic values of ACs-0.5-30/60/90/120 gradually decrease, but Vmic and SBET values first increase with the extension of deposition time from 30 to 60 min, and then decrease rapidly with the extension of deposition time from 60 to 120 min, as shown in Table 6. These results indicate that an appropriate deposition time is favorable to the formation of micropores with a narrow pore-size distribution, but the long deposition time can’t improve the development of micropores continually. From Figure 7c, N2 adsorption isotherms of ACs-0.75-30 and ACs-0.75-60 still exhibit a type IV with the increase of the relative pressure from 0 to 1, indicating the existence of hierarchical pore. Further, N2 adsorption capacity of ACs-0.75-60 at low pressure is higher than that of ACs-0.75-30; in addition, a small hysteresis loop and flat adsorption isotherm of ACs-0.75-60 can be found in Figure 7c. With the extension of deposition time from 90 to 120 min, N2 adsorption isotherms of ACs-0.75-90 and ACs-0.75-120 all exhibit a type I with the increase of the relative pressure from 0 to 1, indicating the appearance of microporous characteristics; meanwhile, ACs-0.75-90 has a higher adsorption capacity than ACs-0.75-120, indicating the formation of its more micropores. From Figure 7d, there is no obvious change in pore-size distribution for ACs-0.75-30; the pore size distribution of ACs-0.75-60/90/120 gradually shifts to a small pore size with the increase of deposition time from 60 to 120, indicating the transition from macro/mesopores to micropores in the process of CVD. In addition, Vt and non-Vmic values of ACs-0.75-30/60/90/120 gradually decrease, but the Vmic and SBET value first increase with the extension of deposition time from 30 to 90 min, and then decreases rapidly with the extension of deposition time from 90 to 120 min, as shown in Table 6.
Therefore, the methane molecules can enter the micropore, so the crack and deposition of the methane molecules occur first in the inner of micropores under a short deposition time, resulting in a slight increase in SBET and Vmic values and decrease in Vt and non-Vmic values. With the extension of deposition time, the carbon deposits on the inner wall of the micropores increase gradually, and methane can only crack and deposit in the surface of micropores, which makes the micropores’ opening continue to shrink and form the “ink bottle” type of microporous and ultraporous structure, resulting in a rapid increase in SBET and Vmic values and a sustained decrease in Vt and non-Vmic values. However, an over-deposition over a long time can cause the blockage of micropores, resulting in an obvious decrease in all pore parameters.

3.7. Study of CO2 Adsorption

In order to further explore the effect of physicochemical structure of ACs on CO2 adsorption, a CO2 adsorption test of ACs-0.5-30, ACs-0.5-60, ACs-0.75-60, and ACs-0.75-90 is performed in the pressure range of 0–800 mmHg, at 273 K, in an ice-water bath, and the corresponding results are shown in Figure 8.
First, CO2 adsorption curves and capacities of two groups samples with similar pore structure and different nitrogen content (the first group includes ACs-0.5-30 and ACs-0.75-60, and the second group includes ACs-0.5-60 and ACs-0.75-90) are compared. For the first group of samples, the difference of adsorption curves of ACs-0.5-30 and ACs-0.75-60 is very obvious, and CO2 adsorption capacity of ACs-0.75-60 is always higher than that of ACs-0.5-30 in the pressure range of 0–800 mmHg. When the pressure is 800 mmHg, CO2 adsorption capacity of ACs-0.75-60 has reached 5.25 mmol/g, but ACs-0.5-30 only achieves 2.6 mmol/g. In addition, the trend of adsorption curves of the second group is similar with that of the first group in the pressure range of 0–800 mmHg. When the pressure is 800 mmHg, CO2 adsorption capacity of ACs-0.75-90 is as high as 6.87 mmol/g, and ACs-0.5-60 also achieves 4.13 mmol/g. Under similar pore structure, the adsorption performance of ACs-0.75-60 and ACs-0.75-90 with high nitrogen content (6.37% and 8.84%) is obviously better than that of ACs-0.5-30 and ACs-0.5-60 in the pressure range of 0–800 mmHg. These results indicate that the presence of nitrogen atoms enhances the interaction between CO2 and porous materials, thus promoting CO2 adsorption performance. Then, CO2 adsorption curves and capacities of two groups samples with similar nitrogen content and different pore structure (the first group includes ACs-0.5-30 and ACs-0.5-60, and the second group includes ACs-0.75-60 and ACs-0.75-90) also are compared. The adsorption performance of ACs-0.5-60 and ACs-0.75-90 with high SBET value (1897.25 and 1971.57 m2/g) is obviously better than that of ACs-0.5-30 and ACs-0.75-60 in the pressure range of 0–800 mmHg, indicating that the existence of more micropores with an appropriate pore-size distribution between 0.5 and 0.8 nm can significantly promote CO2 adsorption under similar nitrogen content. Therefore, nitrogen content and pore structure of porous materials all have an important impact on promoting its CO2 adsorption performance, but the effect of nitrogen content seems to be more pronounced in this work.

4. Conclusions

In summary, we have demonstrated a novel method to greatly improve the physicochemical structure of coal-based activated carbons (ACs) by using ammonia activation and chemical vapor deposition (CVD) for CO2 removal from flue gas in coal-fired power plants. The preparation is achieved by ammonia activation at different ammonia ratios in mixtures (10%, 25%, 50%, 75%, and 100%) and subsequent CVD at different deposition times (30, 60, 90, and 120 min), during which insertion of nitrogen atoms in the carbon structure and controllable adjustment of pores can be realized. In the phase of ammonia activation, ACs-0.5 and ACs-0.75 with a relatively high nitrogen content (6.37% and 8.84%) and SBET value (1048.65 m2/g and 814.36 m2/g) can be prepared, respectively, under an optimum ammonia ratio in mixture (50% and 75%). In the stage of CVD, ACs-0.75-90 with pore-size distribution between 0.5 and 0.8 nm presents the highest SBET value (1971.57 m2/g) in all samples. The result of CO2 adsorption test of four typical samples shows that ACs-0.75-90 with ideal physicochemical structure has a maximum adsorption capacity of 6.87 mmol/g. This work provides a simple method for developing high-performance coal-based activated carbons with a controllable physicochemical structure and holds potential for industrial scale-up and applications.

Author Contributions

D.L. and S.L. conceived and designed the experiments; J.L., J.D., and W.F. carried out the experiments; D.L. wrote the paper; D.L. and B.J. reviewed the paper.

Funding

This research was funded by the National Natural Science Foundation of China, grant number 51806080; the Scientific Research Fund Project of Jilin Agricultural University, grant number 201801; and the Jilin Province Education Department Science and Technology Program during the Thirteenth Five-year Plan Period, grant number JJKH20190940KJ.

Conflicts of Interest

The authors declare no conflicts of interest.

References

  1. D’Alessandro, D.M.; Smit, B.; Long, J.R. Carbon dioxide capture: Prospects for new materials. Angew. Chem. 2010, 49, 6058–6082. [Google Scholar] [CrossRef]
  2. Chen, B.L.; Wen, H.M.; Liao, C.J.; Li, L.B.; Alothman, Z.A.; Krishna, R.; Wu, H.; Zhou, W.; Hu, J. A metal−organic framework with suitable pore size and dual functionalities for highly efficient post-combustion CO2 capture. J. Mater. Chem. A 2019, 7, 3128–3134. [Google Scholar] [CrossRef]
  3. Li, H.; Wang, K.C.; Hu, Z.G.; Chen, Y.P.; Verdegaal, W.M.; Zhao, D.; Zhou, H.C. Harnessing solvent effects to integrate alkylamine into metal–organic frameworks for exceptionally high CO2 uptake. J. Mater. Chem. A 2019, 7, 7867–7874. [Google Scholar] [CrossRef]
  4. Drage, T.C.; Blackman, J.M.; Pevida, C.; Snape, C.E. Evaluation of activated carbon adsorbents for CO2 capture in gasification. Energy Fuels 2009, 23, 2790–2796. [Google Scholar] [CrossRef]
  5. Liu, Z.; Yang, Y.; Du, Z.Y.; Xing, W.; Komarneni, S.; Zhang, Z.D.; Gao, X.H.; Yan, Z.F. Furfuralcohol co-polymerized urea formaldehyde resin-derived N-doped microporous carbon for CO2 capture. Nanoscale Res. Lett. 2015, 10, 1–11. [Google Scholar] [CrossRef] [PubMed]
  6. Yi, H.H.; Li, Y.D.; Tang, X.L.; Li, F.R.; Li, K.; Yuan, Q.; Sun, X. Effect of the adsorbent pore structure on the separation of carbon dioxide and methane gas mixtures. J. Chem. Eng. Data 2015, 60, 1388–1395. [Google Scholar] [CrossRef]
  7. Zhao, Y.L.; Feng, Y.H.; Zhang, X.X. Molecular simulation of CO2/CH4 self-and transport diffusion coefficients in coal. Fuel 2016, 165, 19–27. [Google Scholar] [CrossRef]
  8. Wickramaratne, N.P. Importance of small micropores in CO2 capture by phenolic resin-based activated carbon spheres. J. Mater. Chem. A 2012, 1, 112–116. [Google Scholar] [CrossRef]
  9. Presser, V.; Mcdonough, J.; Yeon, S.H.; Gogotsi, Y. Effect of pore size on carbon dioxide sorption by carbide derived carbon. Energy Environ. Sci. 2011, 4, 3059–3066. [Google Scholar] [CrossRef]
  10. Hohm, U. Polarizabilities of atoms and molecules, new insights into an old subject. Vacuum 2000, 58, 117–134. [Google Scholar] [CrossRef]
  11. Khoerunnisa, F.; Minami, D.; Fujimori, T.; Hong, S.Y.; Choi, Y.C.; Sakamoto, H.; Endo, M.; Kaneko, K. Enhanced CO2 adsorptivity of SWCNT by polycyclic aromatic hydrocarbon intercalation. Adsorption 2014, 20, 301–309. [Google Scholar] [CrossRef]
  12. Gong, K.P.; Du, F.; Xia, Z.H.; Durstock, M.; Dai, L.M. Nitrogen-doped carbon nanotube arrays with high electrocatalytic activity for oxygen reduction. Science 2009, 323, 760–764. [Google Scholar] [CrossRef] [PubMed]
  13. Wu, Z.X.; Webley, P.A.; Zhao, D.Y. Post-enrichment of nitrogen in soft-templated ordered mesoporous carbon materials for highly efficient phenol removal and CO2 capture. J. Mater. Chem. 2012, 22, 11379–11389. [Google Scholar] [CrossRef]
  14. Wilke, A.; Weber, J. Hierarchical nanoporous melamine resin sponges with tunable porosity-porosity analysis and CO2 sorption properties. J. Mater. Chem. 2011, 21, 5226–5229. [Google Scholar] [CrossRef]
  15. Zhai, Y.B.; Xu, B.B.; Zhu, Y.; Qing, R.P.; Peng, C.; Wang, T.F.; Li, C.T.; Zeng, G.M. Nitrogen-doped porous carbon from Camellia oleifera, shells with enhanced electrochemical performance. Mater. Sci. Eng. 2016, 61, 449–456. [Google Scholar] [CrossRef]
  16. Jin, H.; Zhang, H.M.; Zhong, H.X.; Zhang, J.L. Nitrogen-doped carbon xerogel: A novelcarbon-based electrocatalyst for oxygen reduction reaction in proton exchange membrane (PEM) fuel cells. Energy Environ. Sci. 2011, 4, 3389–3394. [Google Scholar] [CrossRef]
  17. Kim, N.D.; Kim, W.; Joo, J.B.; Oh, S.; Kim, P.; Kim, Y.; Yi, J. Electrochemical capacitor performance of N-doped mesoporous carbons prepared by ammoxidation. J. Power Sources 2008, 180, 671–675. [Google Scholar] [CrossRef]
  18. Shiratori, N.; Lee, K.J.; Miyawaki, J.; Hong, S.H.; Mochida, I.; An, B.; Yokogawa, K.; Jang, J.; Yoon, S.H. Pore structure analysis of activated carbon fiber by microdomain-based model. Langmuir 2009, 25, 7631–7637. [Google Scholar] [CrossRef]
  19. Liu, D.D.; Gao, J.H.; Wu, S.H.; Qin, Y.K. Effect of char structures caused by varying the amount of FeCl3 the pore development during activation. RSC Adv. 2016, 6, 87478–87485. [Google Scholar] [CrossRef]
  20. Srinivas, G.; Yue, L.; Neal, S.; Taner, Y.; Zheng, X.G. Design of hyperporous graphene networks and their application in solid-amine based carbon capture systems. J. Mater. Chem. A 2017, 5, 17833–17840. [Google Scholar] [CrossRef] [Green Version]
  21. Hu, B.; Wang, K.; Wu, L.H.; Yu, S.H.; Antonietti, M.; Titirici, M.M. Engineering carbon materials from the hydrothermal carbonization process of biomass. Adv. Mater. 2010, 22, 813–828. [Google Scholar] [CrossRef] [PubMed]
  22. Lee, F.Y.M.; Tran, N.H.; Russell, J.J.; Lamb, R.N. Cathodoluminescence of Zinc Sulfide Films Grown by Single Source Chemical Vapor Deposition. J. Phys. Chem. B 2019, 108, 8355–8358. [Google Scholar] [CrossRef]
  23. Mohammadi, M.; Najafpour, G.D.; Mohamed, A.R. Production of carbon molecular sieves from palm shell through carbon deposition from methane. Chem. Ind. Chem. Eng. Q. 2011, 17, 525–533. [Google Scholar] [CrossRef]
  24. Zhang, T.; Walawender, W.P.; Fan, L. Preparation of carbon molecular sieves by carbon deposition from methane. Bioresour. Technol. 2005, 96, 1929–1935. [Google Scholar] [CrossRef]
  25. Cansado, I.P.P.; Mouräo, P.A.M.; Ribeiro Carrott, M.M.L.; Carrott, P. Activated carbons prepared from natural and synthetic raw materials with potential applications in gas separations. Adv. Mater. Res. 2010, 107, 1–7. [Google Scholar] [CrossRef]
  26. Kang, H.U.; Kim, W.; Kim, S.H. Pore size control through benzene vapor deposition on activated carbon. Chem. Eng. J. 2008, 144, 167–174. [Google Scholar] [CrossRef]
  27. Smith, M.T.; Yager, J.W.; Steinmetz, K.L.; Eastmond, D.A. Peroxidase-dependent metabolism of benzene’s phenolic metabolites and its potential role in benzene toxicity and carcinogenicity. Environ. Health Perspect. 1989, 82, 23–29. [Google Scholar] [CrossRef]
  28. Villar-Rodil, S.; Navarrete, R.; Denoyel, R.; Albiniak, A.; Paredes, J.I.; Martínez-Alonso, A.; Tascón, J.M.D. Carbon molecular sieve cloths prepared by chemical capour deposition of methane for separation of gas mixtures. Microporous Mesoporous Mater. 2005, 77, 109–118. [Google Scholar] [CrossRef]
  29. Sathe, C.; Pang, Y.; Li, C.Z. Effects of heating rate and ion-exchangeable cations on the pyrolysis yields from a Victorian brown coal. Energy Fuels 1999, 13, 748–755. [Google Scholar] [CrossRef]
  30. Pietrzak, R. XPS study and physico-chemical properties of nitrogen-enriched microporous activated carbon from high volatile bituminous coal. Fuel 2009, 88, 1871–1877. [Google Scholar] [CrossRef]
  31. Gong, X.Z.; Guo, Z.C.; Wang, Z. Variation of char structure during anthracite pyrolysis catalyzed by Fe2O3 and its influence on char combustion reactivity. Energy Fuels 2009, 23, 4547–4552. [Google Scholar] [CrossRef]
  32. Belhachemi, M.; Rios, R.V.R.A.; Addoun, F.; Silvestre-Albero, J.; Sepulveda-Escribano, A.; Rodrìguez-Reinoso, F. Preparation of activated carbon from date pits: Effect of the activation agent and liquid phase oxidation. J. Anal. Appl. Pyrolysis 2009, 86, 168–172. [Google Scholar] [CrossRef]
  33. Yang, K.B.; Peng, J.H.; Xia, H.Y.; Zhang, L.B.; Srinivasakannan, C.; Guo, S.H. Textural characteristics of activated carbon by single step CO2 activation from coconut shells. J. Taiwan Inst. Chem. Eng. 2010, 41, 367–372. [Google Scholar] [CrossRef]
  34. Heras, F.; Alonso-Morales, N.; Jimenez-Cordero, D.; Gilarranz, M.A.; Rodriguez, J.J. Granular mesoporous activated carbons from waste tires by cyclic oxygen chemisorption-desorption. Ind. Eng. Chem. Res. 2012, 51, 2609–2614. [Google Scholar] [CrossRef]
  35. Zhu, Y.W.; Gao, J.H.; Li, Y.; Sun, F. Preparation of activated carbons for SO2 adsorption by CO2 and steam activation. J. Taiwan Inst. Chem. Eng. 2012, 43, 112–119. [Google Scholar] [CrossRef]
  36. He, X.F.; Jin, L.J.; Wang, D.; Zhao, Y.P.; Zhu, S.W.; Hu, H.Q. Integrated process of coal pyrolysis with CO2 reforming of methane by dielectric barrier discharge plasma. Energy Fuels 2011, 25, 4036–4042. [Google Scholar] [CrossRef]
  37. Li, W.; Zhu, Y.M. Structural characteristics of coal vitrinite during pyrolysis. Energy Fuels 2014, 28, 3645–3654. [Google Scholar] [CrossRef]
  38. Li, T.; Zhang, L.; Li, D. Effects of gasification atmosphere and temperature on char structural evolution during the gasification of collie sub-bituminous coal. Fuel 2014, 117, 1190–1195. [Google Scholar] [CrossRef]
  39. Sasezky, A.; Muckenhuber, H.; Grothe, H. Raman microspectroscopy of soot and related carbonaceous materials: Spectral analysis and structural information. Carbon 2005, 43, 1731–1742. [Google Scholar] [CrossRef]
  40. Li, Y.; Yang, H.P.; Hu, J.H.; Wang, X.H.; Chen, H.P. Effect of catalysts on the reactivity and structure evolution of char in petroleum coke steam gasification. Fuel 2014, 117, 1174–1180. [Google Scholar] [CrossRef]
Figure 1. SEM and HRTEM images of ACs-X samples at different treatment conditions. (a) SEM and (f) HRTEM of ACs-0.1; (b) SEM and (g) HRTEM of ACs-0.25; (c) SEM and (h) HRTEM of ACs-0.5; (d) SEM and (i) HRTEM of ACs-0.75; (e) SEM and (j) HRTEM of ACs-1.
Processes 07 00801 g001
Figure 2. XRD profiles of ACs-X samples.
Processes 07 00801 g002
Figure 3. Raman spectra of ACs-X samples.
Processes 07 00801 g003
Figure 4. Fitting curve of ACs-0.5.
Processes 07 00801 g004
Figure 5. N2 adsorption isotherm (a) and pore-size distribution (b) of ACs-X samples.
Processes 07 00801 g005
Figure 6. Survey XPS spectra of AC-X samples.
Processes 07 00801 g006
Figure 7. N2 adsorption isotherm (a,c) and pore-size distribution (b,d) of ACs-0.5 and ACs-0.75 at different deposition time.
Processes 07 00801 g007
Figure 8. CO2 adsorption isotherm of typical samples.
Processes 07 00801 g008
Table 1. Proximate analyses and ultimate analyses of JX (wt.%).
VadFCadAadMadCdafHdafOdaf *NdafSdaf
39.6656.600.123.6274.8119.494.011.310.38
* By difference; ad (air-dried basis): the coal in dry air was used as a benchmark; daf (dry ash free basis): the remaining component after the removal of water and ash in coal was used as a benchmark. V: volatile; FC: fixed carbon; A: ash; M: moisture; C: carbon element; H: hydrogen element; O: oxygen element; N: nitrogen element; S: sulfur element.
Table 2. XRD data of ACs-X samples.
SamplesLa (Å)Lc (Å)d002 (Å)N= Lc/d002
ACs-0.124.5713.153.613.70
ACs-0.2524.2413.023.743.48
ACs-0.523.8712.753.953.23
ACs-0.7523.0112.044.282.81
ACs-125.1513.443.573.76
Table 3. Hybrid carbon in the form of area ratios of ACs-X samples.
SamplesAD1/AGAD3/AGAD4/AG
ACs-0.13.2161.8320.508
ACs-0.253.2711.7620.488
ACs-0.53.3941.6620.471
ACs-0.753.6091.5340.459
ACs-11.8911.0220.103
Table 4. Pore structure parameters of all samples.
SamplesSBET (m2/g) aVt (m3/g) bVmic (m3/g) cNon-Vmic (%) d
ACs-0.160.110.0510.04511.76
ACs-0.25317.650.1780.13126.40
ACs-0.51048.650.4710.31832.48
ACs-0.75814.360.5160.27147.48
ACs-1442.140.5880.19866.32
a Specific surface area determined by the BET method for P/P0 from 0.05 to 0.24. b Total pore volume calculated at P/P0 ¼ 0.98. c Volume of micropores (<2 nm) calculated by the t-plot method. d Vt minus Vmic (>2 nm).
Table 5. Relative contents of nitrogen-containing functional groups of AC-X samples.
SamplesN-6 (%)N-5 (%)N-Q (%)N-O (%)
ACs-0.133.730.331.94.1
ACs-0.2545.924.123.86.2
ACs-0.560.915.114.79.3
ACs-0.7515.435.937.611.1
ACs-17.618.961.212.3
Table 6. Pore structure parameters of ACs-0.5 and ACs-0.75 at different deposition times.
SamplesSBET (m2/g) aVt (m3/g) bVmic (m3/g) cNon-Vmic (%) d
ACs-0.5-301178.630.4550.33825.71
ACs-0.5-601897.250.4210.36712.826
ACs-0.5-90787.980.3040.26811.84
ACs-0.5-120514.870.1470.1339.52
ACs-0.75-30907.140.5090.29841.45
ACs-0.75-601244.780.4790.32631.94
ACs-0.75-901971.570.4410.38013.83
ACs-0.75-120547.480.1540.13611.69
a Specific surface area determined by the BET method for P/P0 from 0.05 to 0.24. b Total pore volume calculated at P/P0 ¼ 0.98. c Volume of micropores (<2 nm) calculated by the t-plot method. d Vt minus Vmic (>2 nm).

