Article

Oil Recovery from Palm Kernel Meal Using Subcritical Water Extraction in a Stirred Tank Reactor

by
Johnnys Bustillo Maury
1,*,
Andrés Aldana Rico
1,*,
Cindy García Pinto
1,
Ingrid Hernández Medina
2,
Juan Urueta Urueta
3,
Jerry W. King
4 and
Antonio Bula Silvera
1
1
Departamento de Ingeniería Mecánica, Universidad del Norte, Km 5 vía Puerto Colombia, Barranquilla C.P. 080001, Colombia
2
Departamento de Ingeniería Industrial, Universidad del Norte, Km 5 vía Puerto Colombia, Barranquilla C.P. 080001, Colombia
3
Departamento de Innovación, Aceites S.A., Santa Marta C.P. 470001, Colombia
4
Critical Fluid Symposia, Fayetteville, AR 72071, USA
*
Authors to whom correspondence should be addressed.
Processes 2019, 7(11), 797; https://doi.org/10.3390/pr7110797
Submission received: 13 August 2019 / Revised: 15 October 2019 / Accepted: 16 October 2019 / Published: 2 November 2019
(This article belongs to the Special Issue Green Separation and Extraction Processes)

Abstract

:
Palm kernel meal (PKM) is one of the main byproducts of the oil palm industry. PKM can be obtained as the result of solvent or mechanical extraction of palm kernel oil; in both cases, meal has a remaining oil content that could be recovered. In this work, PKM coming from a mechanical pressing extraction system with an initial oil content between 7 to 8% (wt.) was treated with subcritical water in a batch stirred reactor. To find the proper operational conditions, a three-step experimental process was performed. Extraction temperature, reaction time, particle size and alkaline catalyst usage were selected as process factors. After subcritical extraction, the system was cooled down and depressurized; then oil phase was separated by centrifugation. After extraction, meal was oven-dried at 80 °C. A maximum recovery of 0.034 kg-oil/kg-meal was obtained at 423 K, 720 s and particles smaller than 0.001 m. The experimental procedure showed consistent extraction yields of 40% without modifying the quality of the obtained oil.

1. Introduction

In recent years, interest in improving sustainability of agricultural material processing has been increasing. In addition, environmental phenomena have become significantly unstable, directly impacting agricultural business competitiveness. Palm kernel oil processing hasn’t been sheltered from that reality, so trying to improve oil recovery has become a necessity for this sector. Palm kernel meal (PKM) is a by-product in the palm kernel oil (PKO) production process. PKM is used as a basis for the manufacture of animal feed [1]. Palm kernel oil represents between 46% and 53% of the weight of the kernel [2]. Its chemical composition is different from crude palm oil and it is semi-solid at room temperature [3].
Worldwide, Colombia it is ranked as the fifth-largest palm kernel meal producer; its 148,000 MT in 2016 placed Colombia as the first American maker of this feedstock. The commercial value of this material it is rated at approximately 46.7USD/ton, which is lower than other competitors, such as rice bran or soybean meal. However, pressed palm kernel meal still has an oil content between 7 to 8% wt, this vegetable oil has a market value around 617.15USD/ton.
One option that could become a valid sustainable alternative is subcritical water processing [4]. Subcritical water refers to a region where fluid temperature varies between 373 K and 547 K in a liquid state. At those conditions some properties, like polar moment shift, make water more similar to conventional organic solvents, making it suitable for lipid extraction and hydrolysis [5], creating a sustainable method to decrease hazardous organic solvent consumption. The thermodynamic properties of water are based on the strength and structure of their hydrogen bonds [6]; which are governed by the relations between water atoms [7]. Therefore, a minimum change in one of the bonds affects the entire volume of water. Particularly at the subcritical region, changes in the resistance of these bonds are reflected in the dielectric constant and heat of vaporization change [6]. At lower temperature, the hydrogen bonds are stronger implying a high dielectric constant. The opposite occurs at high temperatures, since the dielectric constant is decreased [8,9], leading to an increase in the solubility of a normally hydrophobic compound [6].
Oil recovery from previously pressed fibers using subcritical water, using different catalysts, has been investigated in pervious studies [10,11]. Also, the complementary use with different solvents was evaluated in [12]. Studies on palm empty fruit bunch liquefaction using alkaline catalysts have also been conducted [13,14]. Subcritical water has also been used for phenolic compound extraction from several oil palm byproducts [15], carotenoids [16], and carbohydrates, such as sugars [17] and cellulose [18] from palm fibers and leaves. This study presents the findings from tests of an experimental batch extraction process of oil from palm kernel meal using subcritical water under different experimental conditions.

2. Materials and Methods

2.1. Raw Material

Mechanically pressed palm kernel meal was collected from PALMACEITE S.A. (Aracataca, Magdalena, Colombia) in 5 kg plastic bags that were stored at approximately 23 °C to prevent lipidic photo-oxidation. Potassium hydroxide (85% of purity) was provided by Riedel de Haen (Wunstorfer Str. 40, 30926 Seelze, Germany). High performance liquid chromatograph (HPLC) grade hexane was supplied by EMD Millipore corporation (Billerica, MA, USA). Ultra high purity argon gas was used as inert gas for reactor headspace during the extractions and Ultra high purity helium, hydrogen, air and nitrogen, all supplied by The Linde Group (Klosterhofstrasse 1, Munich, Germany) were used as carrier and detection gases during the chromatographic analysis. Distilled water from the experimental laboratory was used during the experiments.

2.2. Meal Preparation

Palm kernel meal was separated in 5 fractions using number 8, 20, 40 and 60 standard American Society for Testing and Materials (ASTM) sieves and a shaker all provided from Pinzuar Ltd.a. (Carrera 108 No. 18-31, Bogota, Colombia). The sieving process produced 2.38 × 10⁻³ m, 0.84 × 10⁻³ m, 0.42 × 10⁻³ m, 0.25 × 10⁻³ m and a fine size particle fractions that were labeled and stored separately for further processing.

2.3. Subcritical Water Extraction

Subcritical water extraction was performed in a 2.5 × 10⁻⁴ m3 stirred tank batch reactor Model 3230 (Figure 1) supplied by AMAR Equipments Pvt. Ltd. (6, Parmar Industrial Estate, Kale Marg, Bail Bazaar, Kurla (West) Mumbai–400 070, India). Palm kernel meal, catalyst, and water mixture were added. Argon gas was introduced to replace the air on the reactor headspace and establish a 6 × 10⁵ Pa base pressure. Reaction temperature and agitation were established using a NEURO100 PPI Controller (Process Precision Instruments, 101 Diamond Industrial Estate, Navghar, Vasai Road (E), Dist. Palghar—101210, Maharashtra, India) and a frequency inverter (Schneider Electric Co., 43-45, bd Franklin Roosevelt 92500 Rueil Malmaison, France) respectively. Pressure was elevated from base level to operational condition by temperature action, and was monitored also using a NEURO100 PPI Controller. After the determined reaction time passed, temperature was decreased using the water cooling system of the vessel. After the system was cooled, vessel was depressurized, and the mixture was poured in 15 × 10−6 m3 centrifuge tubes. Later, the tubes with the samples were centrifuged at 1262× g for 1200 s in a Thermo Scientific CL-22 bench centrifuge (168 Third Avenue, Waltham, MA, USA 02451). After centrifugation, oil layer was extracted by pipetting and separated for further analysis.

2.4. Soxhlet Extraction

Between 0.005 and 0.01 kg of palm kernel meal were mixed with 150 × 10−6 m3 of hexane for standard Soxhlet extraction at 343 K for 6h in order to determine total oil content of the material.

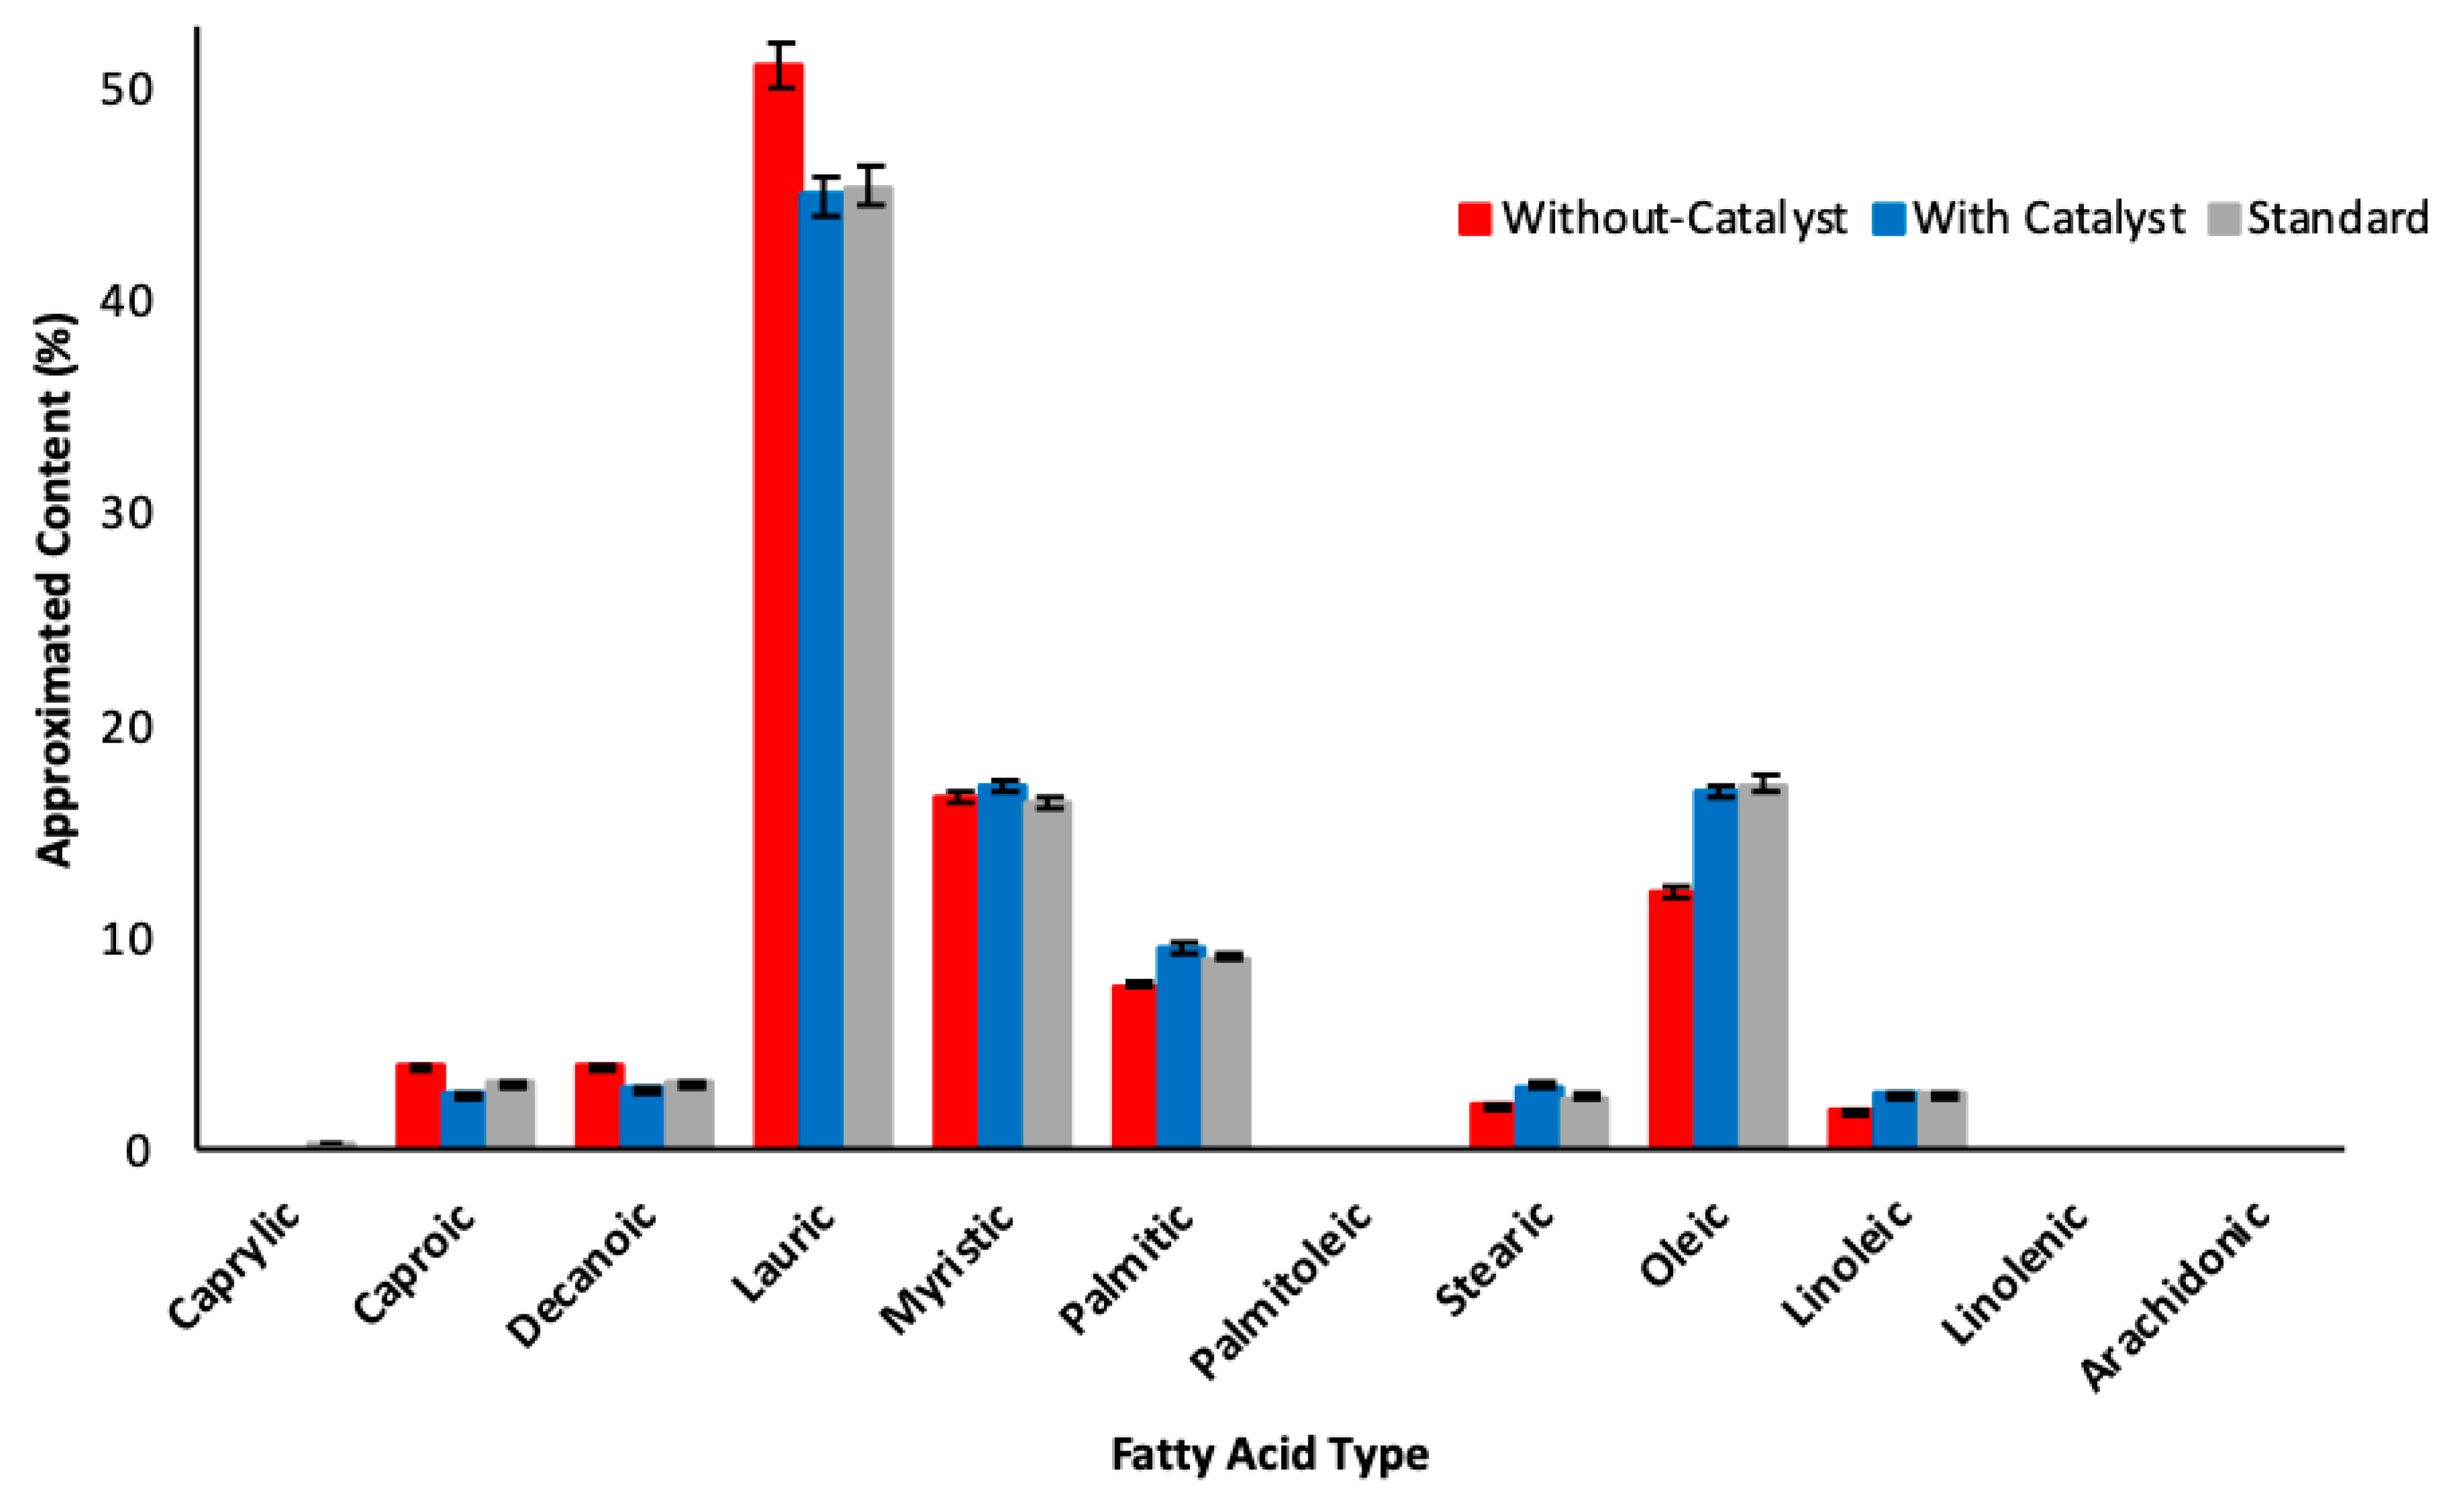
2.5. Gas Chromatography

Gas Chromatography with Thermal Conductivity Detector (GC-TCD) was performed with a Hewlett-Packard 5890 series II, a TCD detector (135 mL/min He), using a DB-23 Agilent Tech capillary column with a 0.25 mm internal diameter, 60 m length and 0.25 μm film thickness. The Fatty acids composition was performed by oil conversion to fatty acids methyl esters, according to Cocks and Van Rede [19]. About 50mg of oil and mixed with 950 µm of n-hexane, then was added 50 µm of CH3NaO, and the mixture was stirred in a vortex mixer and let it rest for 60 min after 1 uL collected supernatant was injected in the GC for 40 min and 30 °C. The Standards used (fatty acids oleic, myristic, lauric, linoleic, linolenic, palmitic, palmitoleic, arachidic, caprylic, caproic, capric and stearic) were an analytic grade (Sigma-Aldrich Inc., St. Louis, MO, USA). Nitrogen was used as the analyte carrier gas.

2.6. Extraction Yield Determination

Extracted lipid fractions were separated from the aqueous and solid phases by centrifugation at 5000 min−1 for 1500 s. Then, the separated oil was extracted by pipetting. The extracted oil was weighed and the yield was determined by Equation (1).
Y i e l d = m e m S
where me is the obtained oil mass by subcritical water extraction in g., and ms is the obtained oil mass by Soxhlet extraction in g.

2.7. Experimental Execution

The experiment was designed in stages with independent objectives. Initially, an exploration process was performed to determine the probable experimentation region. For this purpose, 16 × 10−3 kg of 600 µm meal were loaded to the reactor with 100 × 10−6 m3 of water. The particle size, meal mass and water load amounts were maintained on every run. In the exploration stage, temperature was varied in 10 K steps from 393 to 493 K; reaction time was varied between 300, 600, 1800, 2700 and 5100 s and rotation speed was varied between 400, 600 and 800 min−1. Also, at this stage, alkaline catalyst action was evaluated by adding 9 × 10⁻³ kg of KOH (9%wt) for the catalyzed runs. For the second stage, a 24 screening design was applied to determine the significance level of the experimental region factors; in this case, reaction temperature was varied between 418 and 428 K, reaction time from 480 to 720 s, meal mass load from 12 × 10−3 to 20 × 10−3 kg, and particle size varied between 600 µm (Mesh 18) and 212 µm (Mesh 70). Finally, on the third stage a central composite design was applied, and with the results a regression model was built and a statistical optimization process using Statgraphics Centurion XVI (Statgraphics Technologies, Inc., Virgina, USA) was executed. The regression model obtained was built according to the structure shown in Equation (2).
Y = β 0 + i = 1 i = 3 β i x i + j = 2 j = 3 i = 1 i = 2 β i j x i x j + i = 1 i = 3 β i i x i 2 + ε
where Y is the regression model response, xi, xj correspond to the process factors, β0 is the intercept term, βi correspond to the linear terms coefficients, βij are the interactions terms coefficients, βii are the quadratics terms coefficients, and ε is the modeling error term. Model adequacy was tested using lack of fit and Durbin-Watson tests. Also, residual structure was analyzed and standard (R2) and adjusted (R2adj) determination coefficients were evaluated to determine the model degree.

3. Results and Discussion

3.1. Experimental Region Exploration

Phase I exploration resulted in a qualitative evaluation of lipid phases obtained with different treatments, with and without catalyst, looking to determine on which temperature region extraction seemed to appear. It was found that at a temperature below 413.15 K a lipid phase was not appreciable, and at a temperature above 433.15 K a burnt lipid phase was appreciable.
An increase in the rotation speed improved the mass transfer solvent-solute, due to the film thickness decrease around the particles. However, this parameter was not significant through the range studied. Therefore, this parameter was set in 600 min−1 during the experiments to avoid agglomeration and sedimentation of particles, which would cause mass transfer decrease.
Reaction time was set at 600 s and experiments were done with and without catalyst; initial yields obtained were 35% without catalyst and 15% with KOH as catalyst, also KOH-treated samples had a significant change in smell which could imply quality failures on reclaimed products. Figure 2 show obtained lipid phases.
Obtained lipid profiles for the initial extracts by gas chromatography analysis are shown in Figure 3.
In Figure 3 it can be seen that the lipid phase obtained without basic catalyst was richer in lauric acid, which is desirable for applications in the cosmetic industry.

3.2. Screening Experimentaion

Due to the fatty acid profiles obtained, screening was done without catalyst, a factorial design (2k) was performed for this purpose with process temperature, reaction time, meal mass and particle size as experimental factors, Table 1 shows experimentation order and results.
Particle size was managed as a qualitative factor where A and B mean above and through mesh 18. System pressure varied between 7.2 × 10⁵ Pa to 14.6 × 10⁵ Pa depending on the temperature operational point of every run.

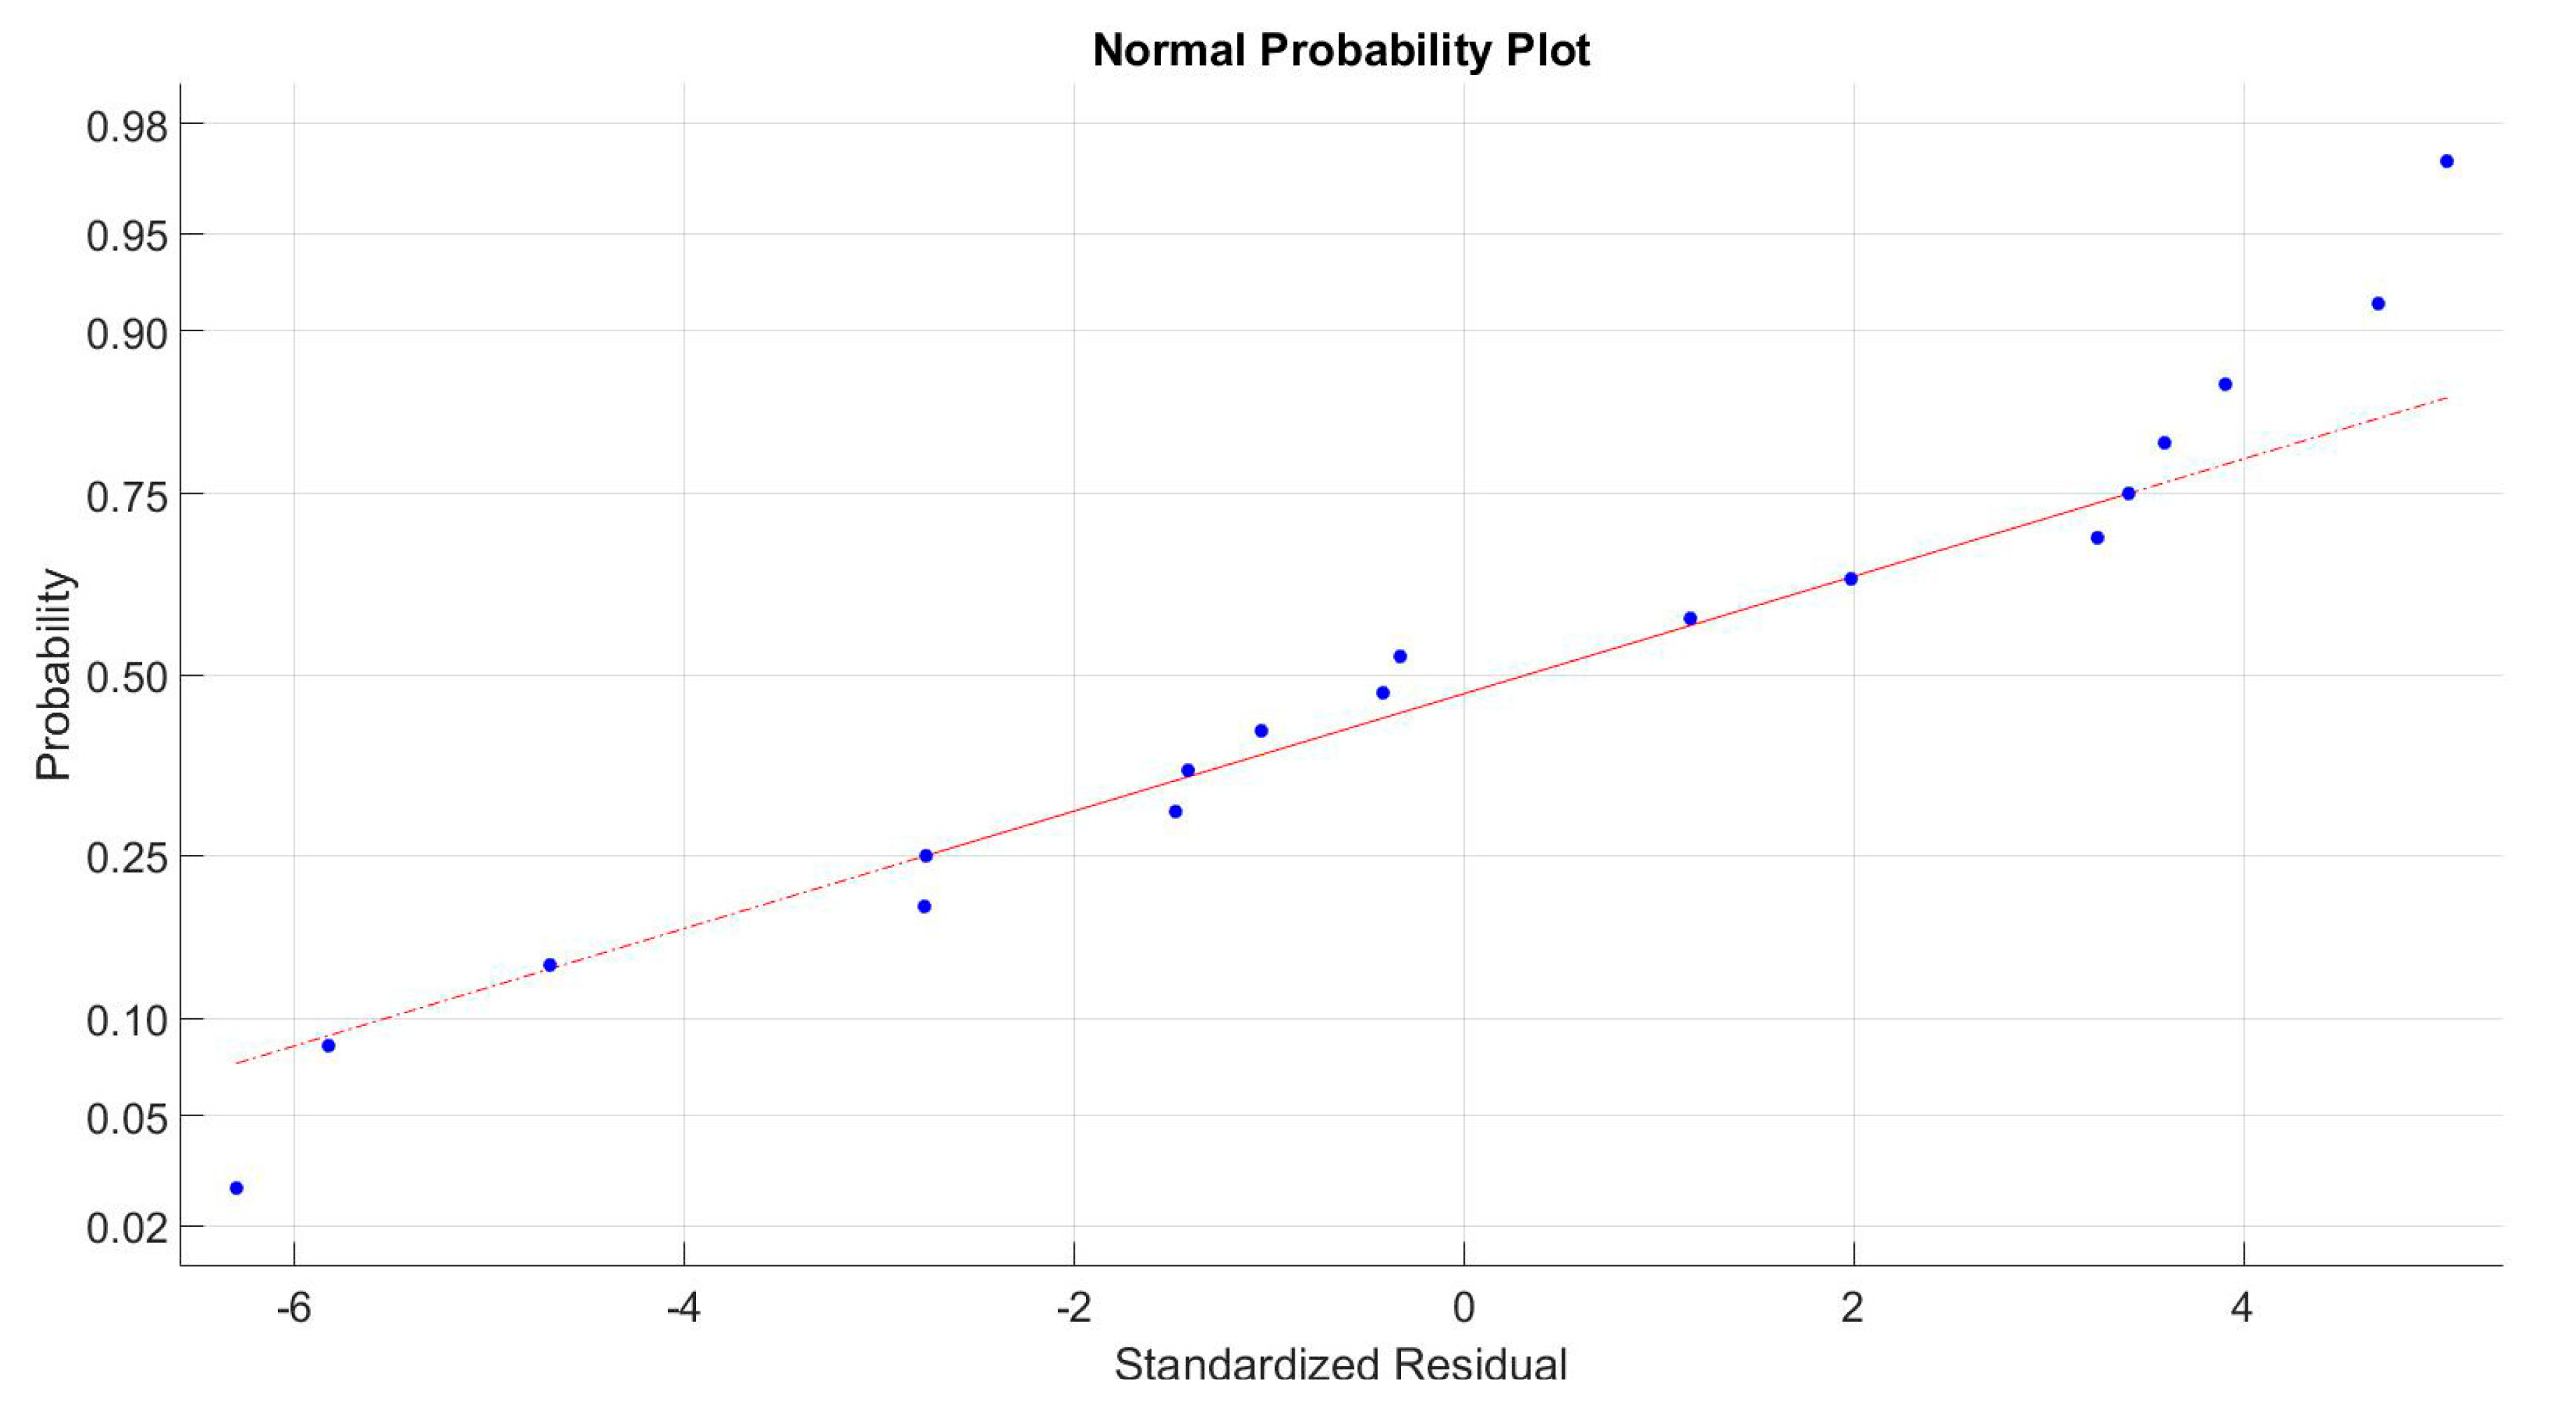
3.3. Statistical Analysis

Analysis of variance (ANOVA) was used to determine factor and interaction effect significance on the extraction yield; Table 2 shows analysis results for individual factors.
From Table 2 it can be inferred that particle size has a higher significant impact on the extraction yield compared to the other process factors. In addition, process temperature showed the least impact over the response variable mainly due to the small range of variation applied. However, the range size was selected according to the exploring experimentation, where it was shown that above 443.15 K, the lipid phase obtained had physical changes that affected the final product quality. The experimental data was also evaluated looking for autocorrelation signs, the Durbin-Watson statistic calculated was 1.96 with a p-value of 0.60, which confirmed the absence of correlation between the data. Likewise, homoscedasticity was checked, comparing residual values dispersion ranges obtained at the different factor levels. Due, to its poor significance level, process temperature was discarded from complete analysis; Table 3 illustrates new ANOVA without temperature and including the interaction between the remaining experimental factors.
Table 3 confirms significant influence of particle size over the extraction yield, but also shows that BC and BC interactions have a higher impact on the yield compared even with the single factor effect. Therefore, they were included on detailed experimentation.

3.4. Response Surface Experimentation

A 23 rotatable central composite design with reaction time, meal mass and particle size as codified experimental factors with 4 center points was done to determine extraction yield optimum levels. In this case particle size wasn’t taken as a qualitative factor, instead several milling diameters were used. Table 4 shows the experiment runs and their results.
Table 5 shows that particle size has a marked inverse relation with extraction yield. Meanwhile reaction time and meal mass behavior as individual factors has a more random result.

3.5. Response Surface Statistical Analysis

After performing an initial analysis of variance, reaction time showed no significant effect on the extraction yield in this experiment; Therefore, it was excluded from the final analysis. Table 5 and Table 6 shows the initial ANOVA and ANOVA with only the remaining factors and interactions, respectively.
Table 5 shows that p-value for factor C was higher than 0.05. Nevertheless, this source was not excluded from ANOVA because the interaction AC was significant (p-value = 0.0335). Because of this, C factor cannot be excluded from the statistical analysis. During the statistical analysis, non-significant factors were removed, obtaining the results as shown in Table 6.
The AC interaction effect is very close to the significance level, therefore it was kept in the model. Also, the AC interaction is significant in the initial ANOVA. The diagnostics were all positive showing that all assumptions were accomplished with the following results. The observed lack of fit was non-significant. To check experiment validity, residual behavior was analyzed, Figure 4 shows a normal probability plot of the residuals obtained for the response surface experiment.
Figure 4 does not present evidence of any abnormal behavior from the residuals obtained, this could validate the normality assumption in the response surface experiment. The homoscedasticity check was validated comparing residual value dispersion ranges obtained at the different factor levels.
As an autocorrelation check, the Durbin-Watson statistic was calculated; obtained d-statistic was 1.51035 with a p-value of 0.1822 which confirmed the absence of correlation between residuals.

3.6. Regression Model

With the data from the response surface experiment, a regression model was obtained, due to the significant interaction, a quadratic structure was used. The R2 adj value of the model is 89.613%. Equation (3) shows obtained expression.
Y i e l d = 9.32972 10.0766 S + 1.26938 M + 3.56488 S 2 2.775 S M
where S is the particle size in mm, and M is the meal mass in g.
With the obtained expression, a response surface was built where the optimal yield region was identified. Figure 5 shows the top view of the surface.
In Figure 5 it can be seen that the maximum yield region is located at 0.212 mm particle size and 22.7 g palm kernel meal mass, at a temperature of 423.15 K and reaction time 640.2 s. A computational optimization process using STATGRAPHICS Centurion XVI was applied to obtain the recommended operation point. According to the optimization exercise, the optimum obtained extraction yield will be 40.69%.

4. Conclusions

This work shows that it is feasible to perform effective oil extraction from palm kernel meal at moderate temperature and pressure conditions. The optimal region was found to be near 150 °C and 7 bars, which is significantly lower than results in other studies, where the process took place above 200 °C and 20 bars. That has a positive impact both in energy usage and preventing fatty acid degradation.
Subcritical water extraction can become a viable option to efficiently recover oil from palm kernel meal without compromising meal quality, a maximum recovery of 0.034 kgoil/kgmeal was obtained at 423 K in a 720-s batch, using particles with a size of 0.212 × 10⁻³ m. In addition, using KOH as a catalyst led to no improvement in extraction yield, but had an effect on fatty acid profile.
A lower fatty acid content reduced the risk of palm kernel meal rancidity, which allows increased storage time. Also, the lipid phase without catalyst was 6% richer in lauric acid than present palm kernel oil, and the residual palm kernel meal still had a remaining average oil content of 3.5%, which is desirable for the cosmetic and animal feed industries.
Sub-critical water extraction presents no problems with a residual content of toxic solvents in the finished product, and the solvent removal after extraction is no longer necessary, leading to energy savings.
In this work, the cost of the process is not estimated, but operations such as grinding can be expensive, especially with lignocellulosic materials, which can turn this into a negative factor for the process.

Author Contributions

Conceptualization, J.B.M., A.A.R., J.U.U. and A.B.S.; Formal analysis, J.B.M., A.A.R., C.G.P., I.H.M., J.U.U., J.W.K. and A.B.S.; Funding acquisition, J.B.M., A.A.R., J.U.U. and A.B.S.; Investigation, J.B.M., A.A.R., C.G.P., I.H.M., J.U.U. and A.B.S.; Methodology, J.B.M., A.A.R., C.G.P., I.H.M. and A.B.S.; Project administration, A.B.S.; Resources, J.U.U. and A.B.S.; Supervision, J.B.M., A.A.R., J.U.U., J.W.K. and A.B.S.; Validation, J.W.K.; Writing—original draft, J.B.M., A.A.R., C.G.P. and I.H.M.; Writing—review & editing, J.B.M., A.A.R., J.U.U., J.W.K. and A.B.S.

Funding

This research was funded by PALMACEITE S.A., grant number UN-OJ-2017-36459 and The APC was funded by Universidad del Norte, Barranquilla-Colombia.

Acknowledgments

Authors would like to thank PALMACEITE SA for funding this research.

Conflicts of Interest

The authors declare no conflict of interest.

References

  1. Hutagalung, R.; Mahyuddin, M.; Vijchulata, J. Nutrient availability and utilization of feedstuffs for farm animals. In Feed Information and Animal Production; Commonwealth Agricultural Bureaux: Farnham Royal, UK, 1983; pp. 497–506. [Google Scholar]
  2. AGROPALMA. Available online: http://agropalmahn.com/wp-content/uploads/2013/12/Aceite-de-Palmiste-PKO.pdf (accessed on 1 July 2019).
  3. JaaffarAhmad, M.; Pantzaris, T. Properties and Utilization of Palm Kernel Oil. Palmas 2002, 35, 11–23. [Google Scholar]
  4. Gámiz-Gracia, L.; Luque de Castro, M.D. Continuous subcritical water extraction of medicinal plant essential oil: Comparison with conventional techniques. Talanta 2000, 51, 1179–1185. [Google Scholar] [CrossRef]
  5. Holliday, R.L.; King, J.W.; List, G.R. Hydrolysis of Vegetable Oils in Sub- and Supercritical Water. Ind. Eng. Chem. Res. 1997, 36, 932–935. [Google Scholar] [CrossRef]
  6. Carr, A.G.; Mammucari, R.; Foster, N.R. A review of subcritical water as a solvent and its utilization for the processing of hydrophobic organic compounds. Chem. Eng. J. 2011, 172, 1–17. [Google Scholar] [CrossRef]
  7. Nezbeda, I.; Pavlíček, J. Application of primitive models of association: A simple theoretical equation of state of water. Fluid Phase Equilibria 1996, 116, 530–536. [Google Scholar] [CrossRef]
  8. Caffarena, E.R.; Grigera, J.R. On the hydrogen bond structure of water at different densities. Phys. A Stat. Mech. Appl. 2004, 342, 34–39. [Google Scholar] [CrossRef]
  9. Nakahara, M.; Matubayasi, N.; Wakai, C.; Tsujino, Y. Structure and dynamics of water: From ambient to supercritical. J. Mol. Liq. 2001, 90, 75–83. [Google Scholar] [CrossRef]
  10. Mazaheri, H.; Lee, K.T.; Bhatia, S.; Mohamed, A.R. Subcritical water liquefaction of oil palm fruit press fiber for the production of bio-oil: Effect of catalysts. Bioresour. Technol. 2010, 101, 745–751. [Google Scholar] [CrossRef] [PubMed]
  11. Mazaheri, H.; Lee, K.T.; Bhatia, S.; Mohamed, A.R. Subcritical water liquefaction of oil palm fruit press fiber in the presence of sodium hydroxide: An optimization study using response surface methodology. Bioresour. Technol. 2010, 101, 9335–9341. [Google Scholar] [CrossRef] [PubMed]
  12. Mazaheri, H.; Lee, K.T.; Bhatia, S.; Mohamed, A.R. Sub/supercritical liquefaction of oil palm fruit press fiber for the production of bio-oil: Effect of solvents. Bioresour. Technol. 2010, 101, 7641–7647. [Google Scholar] [CrossRef] [PubMed]
  13. Akhtar, J.; Kuang, S.K.; Amin, N.S. Liquefaction of empty palm fruit bunch (EPFB) in alkaline hot compressed water. Renew. Energy 2010, 35, 1220–1227. [Google Scholar] [CrossRef]
  14. Chan, Y.H.; Yusup, S.; Quitain, A.T.; Uemura, Y.; Sasaki, M. Bio-oil production from oil palm biomass via subcritical and supercritical hydrothermal liquefaction. J. Supercrit. Fluids 2014, 95, 407–412. [Google Scholar] [CrossRef]
  15. Kawamura, F.; Saary, N.S.; Hashim, R.; Sulaiman, O.; Hashida, K.; Otsuka, Y.; Nakamura, M.; Ohara, S. Subcritical Water Extraction of Low-molecular-weight Phenolic Compounds from Oil Palm Biomass. Jpn. Agric. Res. Q. 2014, 48, 355–362. [Google Scholar] [CrossRef] [Green Version]
  16. Cardenas-Toro, F.P.; Forster-Carneiro, T.; Rostagno, M.A.; Petenate, A.J.; Maugeri Filho, F.; Meireles, M.A.A. Integrated supercritical fluid extraction and subcritical water hydrolysis for the recovery of bioactive compounds from pressed palm fiber. J. Supercrit. Fluids 2014, 93, 42–48. [Google Scholar] [CrossRef]
  17. Norsyabilah, R.; Hanim, S.S.; Norsuhaila, M.H.; Noraishah, A.K.; Kartina, S. Subcritical Water Extraction of Monosaccharides from Oil Palm Fronds Hemicelluloses. Malays. J. Anal. Sci. 2013, 17, 272–275. [Google Scholar]
  18. Hanim, S.S.; Norsyabilah, R.; Suhaila, M.H.N.; Noraishah, A.; Kartina, A.K.S. Effects of temperature, time and pressure on the hemicelluloses yield extracted using subcritical water extraction. Procedia Eng. 2012, 42, 562–565. [Google Scholar] [CrossRef]
  19. Cocks, L.V.; van Rede, C. Laboratory Handbook for Oil and Fat Analysis; Acdemic Press Inc. Ltd.: New York, NY, USA, 1966. [Google Scholar]
Figure 1. Stirred tank batch reactor.
Processes 07 00797 g001
Figure 2. Extracted lipid phases.
Processes 07 00797 g002
Figure 3. Fatty acid profiles for samples without catalyst, with catalyst and standard (Error bars represent 1.96%).
Processes 07 00797 g003
Figure 4. Normal probability plot of obtained residuals.
Processes 07 00797 g004
Figure 5. Obtained response surface for extraction yield.
Processes 07 00797 g005
Table 1. Screening experimentation results.
RunTemperature (K)Time (s)Meal Mass (×10−3 kg)Particle SizeYield (%wt)
1428.1572012A0
2418.1572020A0
3428.1548012B8.22
4428.1548020A1.85
5418.1548020B16.19
6418.1572012B10.87
7428.1572020B24.55
8418.1548012A5.44
9428.1548020B7.4
10418.1572012A3.82
11418.1572020B24.56
12418.1548020A2.47
13428.1548012A2.80
14428.1572020A8.51
15418.1548012B13.03
16428.1572012B13.08
A: 2.36mm > particle diameter > 1mm. B: particle diameter < 1mm.
Table 2. Screening experiment analysis of variance (ANOVA) results.
SourceSum of SquaresDegrees of FreedomMean SquareF-Ratiop-Value
Temperature6.2116.210.260.6205
Time48.96148.962.050.1804
Meal Mass49.95149.952.090.1764
Size540.681540.6822.600.0006
Total Error263.221123.930.260.6205
Total909.0215
Table 3. ANOVA results for the screening experiment excluding reaction temperature from the sources of variation.
SourceSum of SquaresDegrees of FreedomMean SquareF-Ratiop-Value
B = Reaction Time48.96148.963.120.0978
C = Meal Mass49.95149.953.180.0948
D = Particle Size540.681540.6834.420.0000
BC61.74161.743.930.0661
CD50.59150.593.220.0929
Total Error157.11015.71
Total909.0215
Table 4. Results for the screening experiment excluding reaction temperature from the sources of variation.
RunParticle Size (mm)Time (min)Meal Mass (g)Obtained Yield (%wt)
1−1−1121.99
2−1−1−118.60
31−1−18.08
41111.41
501.6817907.16
6−11−118.20
700013.52
800−1.681797.95
900013.18
101−112.83
1111−12.62
120003.63
130008.51
14−1.681790037.97
15−11130.59
160−1.6817907.17
171.68179000.43
18001.6817912.74
Table 5. Initial ANOVA for the response surface experiment.
SourceSum of SquaresDegrees of FreedomMean SquareF-Ratiop-Value
A = Particle Size1386.6811386.68127.110.0000
B = Time0.1210.120.010.9172
C = Meal Mass22.00122.002.170.1789
AA154.691154.6915.250.0045
AB28.27128.272.790.1335
AC61.61161.616.070.0390
BB7.2717.270.720.4219
BC21.39121.392.110.1845
CC1.7011.700.170.6932
Total Error81.13810.14
Total1764.8617
Table 6. ANOVA for the response surface experiment.
SourceSum of SquaresDegrees of FreedomMean SquareF-Ratiop-Value
A = Particle Size 1386.6811386.6898.590.0000
C = Meal Mass22.00122.001.560.2425
AA173.321173.3212.320.0066
AC61.61161.614.380.0659
Lack-of-fit15.2343.810.270.8896
Total Error126.59914.06
Total1785.4317

