Article

A Fault Feature Extraction Method for the Fluid Pressure Signal of Hydraulic Pumps Based on Autogram

1
College of Mechanical Engineering, North China University of Science and Technology, Tangshan 063210, China
2
National Research Center of Pumps, Jiangsu University, Zhenjiang 212013, China
*
Authors to whom correspondence should be addressed.
Processes 2019, 7(10), 695; https://doi.org/10.3390/pr7100695
Submission received: 23 July 2019 / Revised: 9 September 2019 / Accepted: 11 September 2019 / Published: 3 October 2019
(This article belongs to the Special Issue Smart Flow Control Processes in Micro Scale)

Abstract

:
Center spring wear faults in hydraulic pumps can cause fluid pressure fluctuations at the outlet, and the fault feature information on fluctuations is often contaminated by different types of fluid flow interferences. Aiming to resolve the above problems, a fluid pressure signal method for hydraulic pumps based on Autogram was applied to extract the fault feature information. Firstly, maximal overlap discrete wavelet packet transform (MODWPT) was adopted to decompose the contaminated fault pressure signal of center spring wear. Secondly, based on the squared envelope of each node, three kinds of kurtosis of unbiased autocorrelation (AC) were computed in order to describe the fault feature information comprehensively. These are known as standard Autogram, upper Autogram and lower Autogram. Then a node corresponding to the biggest kurtosis value was selected as a data source for further spectrum analysis. Lastly, the data source was processed by threshold values, and then the fault could be diagnosed based on the fluid pressure signal.

1. Introduction

Fluid plays an important role in the power transmission of the hydraulic system or component [1,2]. Because of hydraulic impact and mechanical faults, fluid flow pressure is very complex and nonstationary in hydraulic systems or components. Meanwhile, there are many background noises due to high and low pressure conversion, fluid pressure impact, cavitation phenomenon, fluid pulsation, and so on. The above aforementioned noises can cause problems in the fault feature extraction of the hydraulic systems or components based on the fluid pressure signal. Much running condition feature information is contained in the fluid pressure signal. Therefore, pressure fluctuation can reflect the running condition of the hydraulic system or component [3,4,5,6,7,8]. Fault diagnosis for the hydraulic systems or components based on the fluid pressure signal has been studied by many scholars at home and abroad [9,10,11,12,13,14,15,16]. Zhang put forward a method of flow measurement based on the new sensor, where the flow rate could be measured in hydraulic system by applying the mathematical model, and then flow detection of a 7 piston-pump was realized based on the sensor signal [9]. Goharrizi utilized the Hilbert- Huang transform to decompose the pressure signal of hydraulic actuators, and the first intrinsic mode function was used as a data source, and then the root mean square extracted from it could be adopted to detect internal leakage and its severity effectively. This was done without requiring prior knowledge about the model of the actuator or leakage [10]. Vásquez proposed an active model-based algorithm of fault detection and isolation. With the help of frequency-domain estimators, continuous-time models in a user-defined frequency band were identified. Then, a method for fault detection and isolation was adopted to diagnose early faults in hydraulic actuators based on the fluid pressure signal [11]. Aiming to resolve the serious influences of pressure fluctuation and other noises in the pressure signal, Tang applied a method of wavelet theory to decompose the signal, obtaining the wavelet energy of fault feature information can be got. Then, the inner leakage fault of the hydraulic cylinder could be diagnosed [12]. In order to diagnose the faults in reciprocating pumps, a fluid pressure signal in pump cylinder was analyzed. Frequency energy was extracted for the feature vectors, and then the improved neural network was used to diagnose the pump fault successfully [13]. Guo proposed a pre-filter combined with threshold self-learning wavelet algorithm. The denoising threshold could be self-learnt in the steady flow state, and its noise suppression effect was better than that of the traditional wavelet algorithms based on fluid pressure signals of hydraulic pipeline [14]. You proposed a fusion method using the hybrid particle swarm optimization algorithm and wavelet packet energy entropy. Neural network weights and threshold were optimized by the algorithm, and wavelet packet energy entropy was used for the eigenvector, and then the fault of hydraulic system could be diagnosed effectively [15]. In contrast to the traditional way of detecting the ship fault in the time domain, Li presented a novel method in the frequency domain. The method decomposed the hydraulic pressure signal using the wavelet-transform technique, and reconstructed it at the low-frequency region; thus, the ship fault could be diagnosed effectively [16].
The hydraulic pump is an important power component, and it has been applied in the fields of robotics [17], engineering machinery [18], underwater machinery [19,20], and wind power machinery [21]. These fields often involve working conditions with high temperature, high pressure, high speed, high humidity, and heavy load, leading to a high failure rate and significant casualties and economic losses [22,23,24,25,26,27,28,29,30,31,32,33].
In 2018, the Italian scholars Ali Moshrefzadeh and Alessandro Fasana proposed a new method named Autogram based on unbiased autocorrelation (AC) [34]. It was applied on rolling element bearings. Fault feature information of the inner race, outer race and rolling element could be thus extracted effectively. The Autogram method possesses some advantages. Firstly, heavy Gaussian and non-Gaussian background noise have a very bad influence on fault feature extraction, and the procedure of unbiased AC has overcome this disadvantage. Secondly, because of down-sampling operation, the length of the time history halves at each level of decomposition, which can limit the ability to investigate the traditional wavelet transform coefficients. Furthermore, the transform may be interfered with selection of a signal starting point. To resolve these problems, maximal overlap (undecimated) discrete wavelet packet transform (MODWPT) can be used to remove the down-sampling step in discrete traditional wavelet packet transform (DWPT) [35]. Thirdly, there is no need to obtain the prior morphological feature knowledge of a signal. Because Autogram was proposed in 2018, few scholars have studied the method at a global scale.
In this paper, we firstly introduce Autogram into the fault feature extraction for the fluid pressure signal of a hydraulic pump successfully. Based on three kinds of kurtosis and threshold values, we find that only standard Autogram can select the optimal frequency band, and rich feature information of center spring wear fault can be extracted effectively without processing of the threshold value. Application of Autogram is extended to hydraulic pump from rolling element bearings, and the acquired results can provide a theoretical basis for the fault feature extraction of the hydraulic pump. It can also provide an important basis for the further study of multiple and single faults diagnosis of the hydraulic pump and other rotating machinery.
The organization of this paper is as follows: In Section 2, the algorithm of Autogram is introduced; In Section 3, the flowchart of Autogram is described. In Section 4, some examples of simulation experiment validation are presented. In Section 5, the experimental results are demonstrated by applying the Autogram to the fault signal of center spring wear of hydraulic pump. In Section 6, the conclusions of this investigation are summarized.

2. Algorithm of Autogram

In order to be readable, the nomenclature is given as follows:
Nomenclature
MODWPTmaximal overlap (undecimated) discrete wavelet packet transform
DWPTdiscrete traditional wavelet packet transform
ACunbiased Autocorrelation
FKfast kurtogram
kurtosiskurtosis is obtained based on Equation (2)
kurtosisukurtosis is obtained based on Equation (3)
kurtosislkurtosis is obtained based on Equation (4)
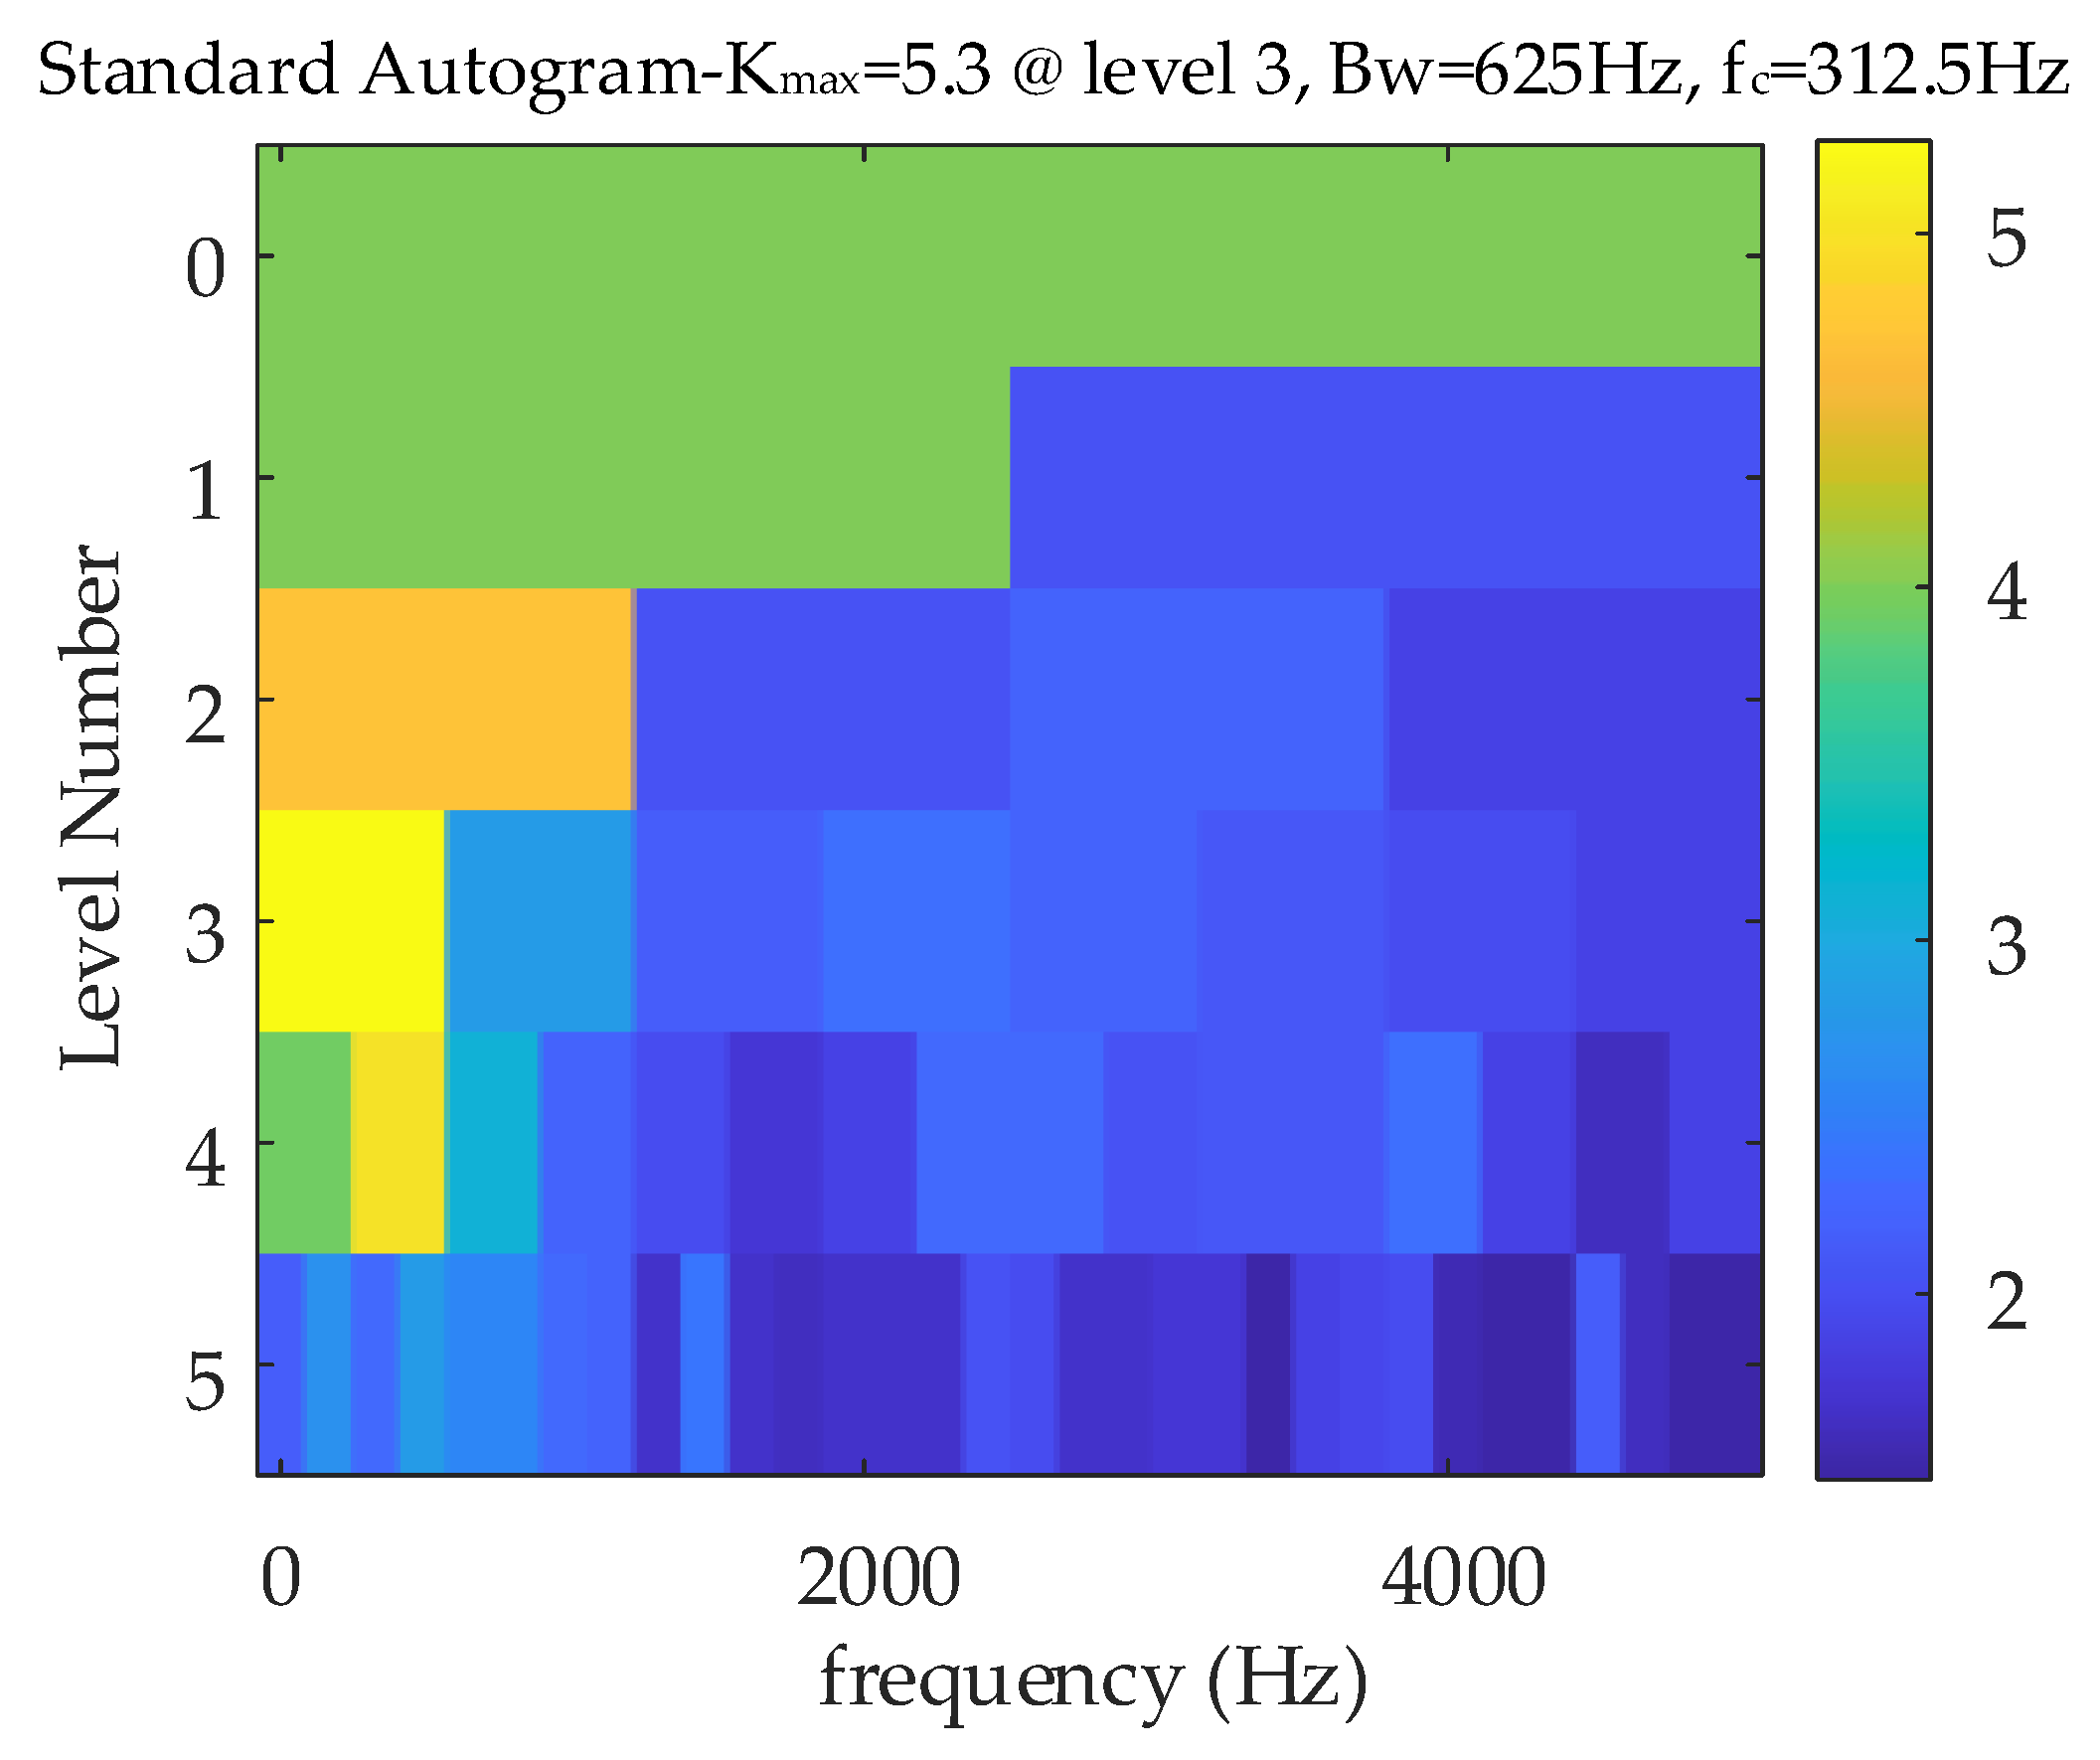
standard Autogramcolormap presentations of the result based on the kurtosis is denoted standard Autogram
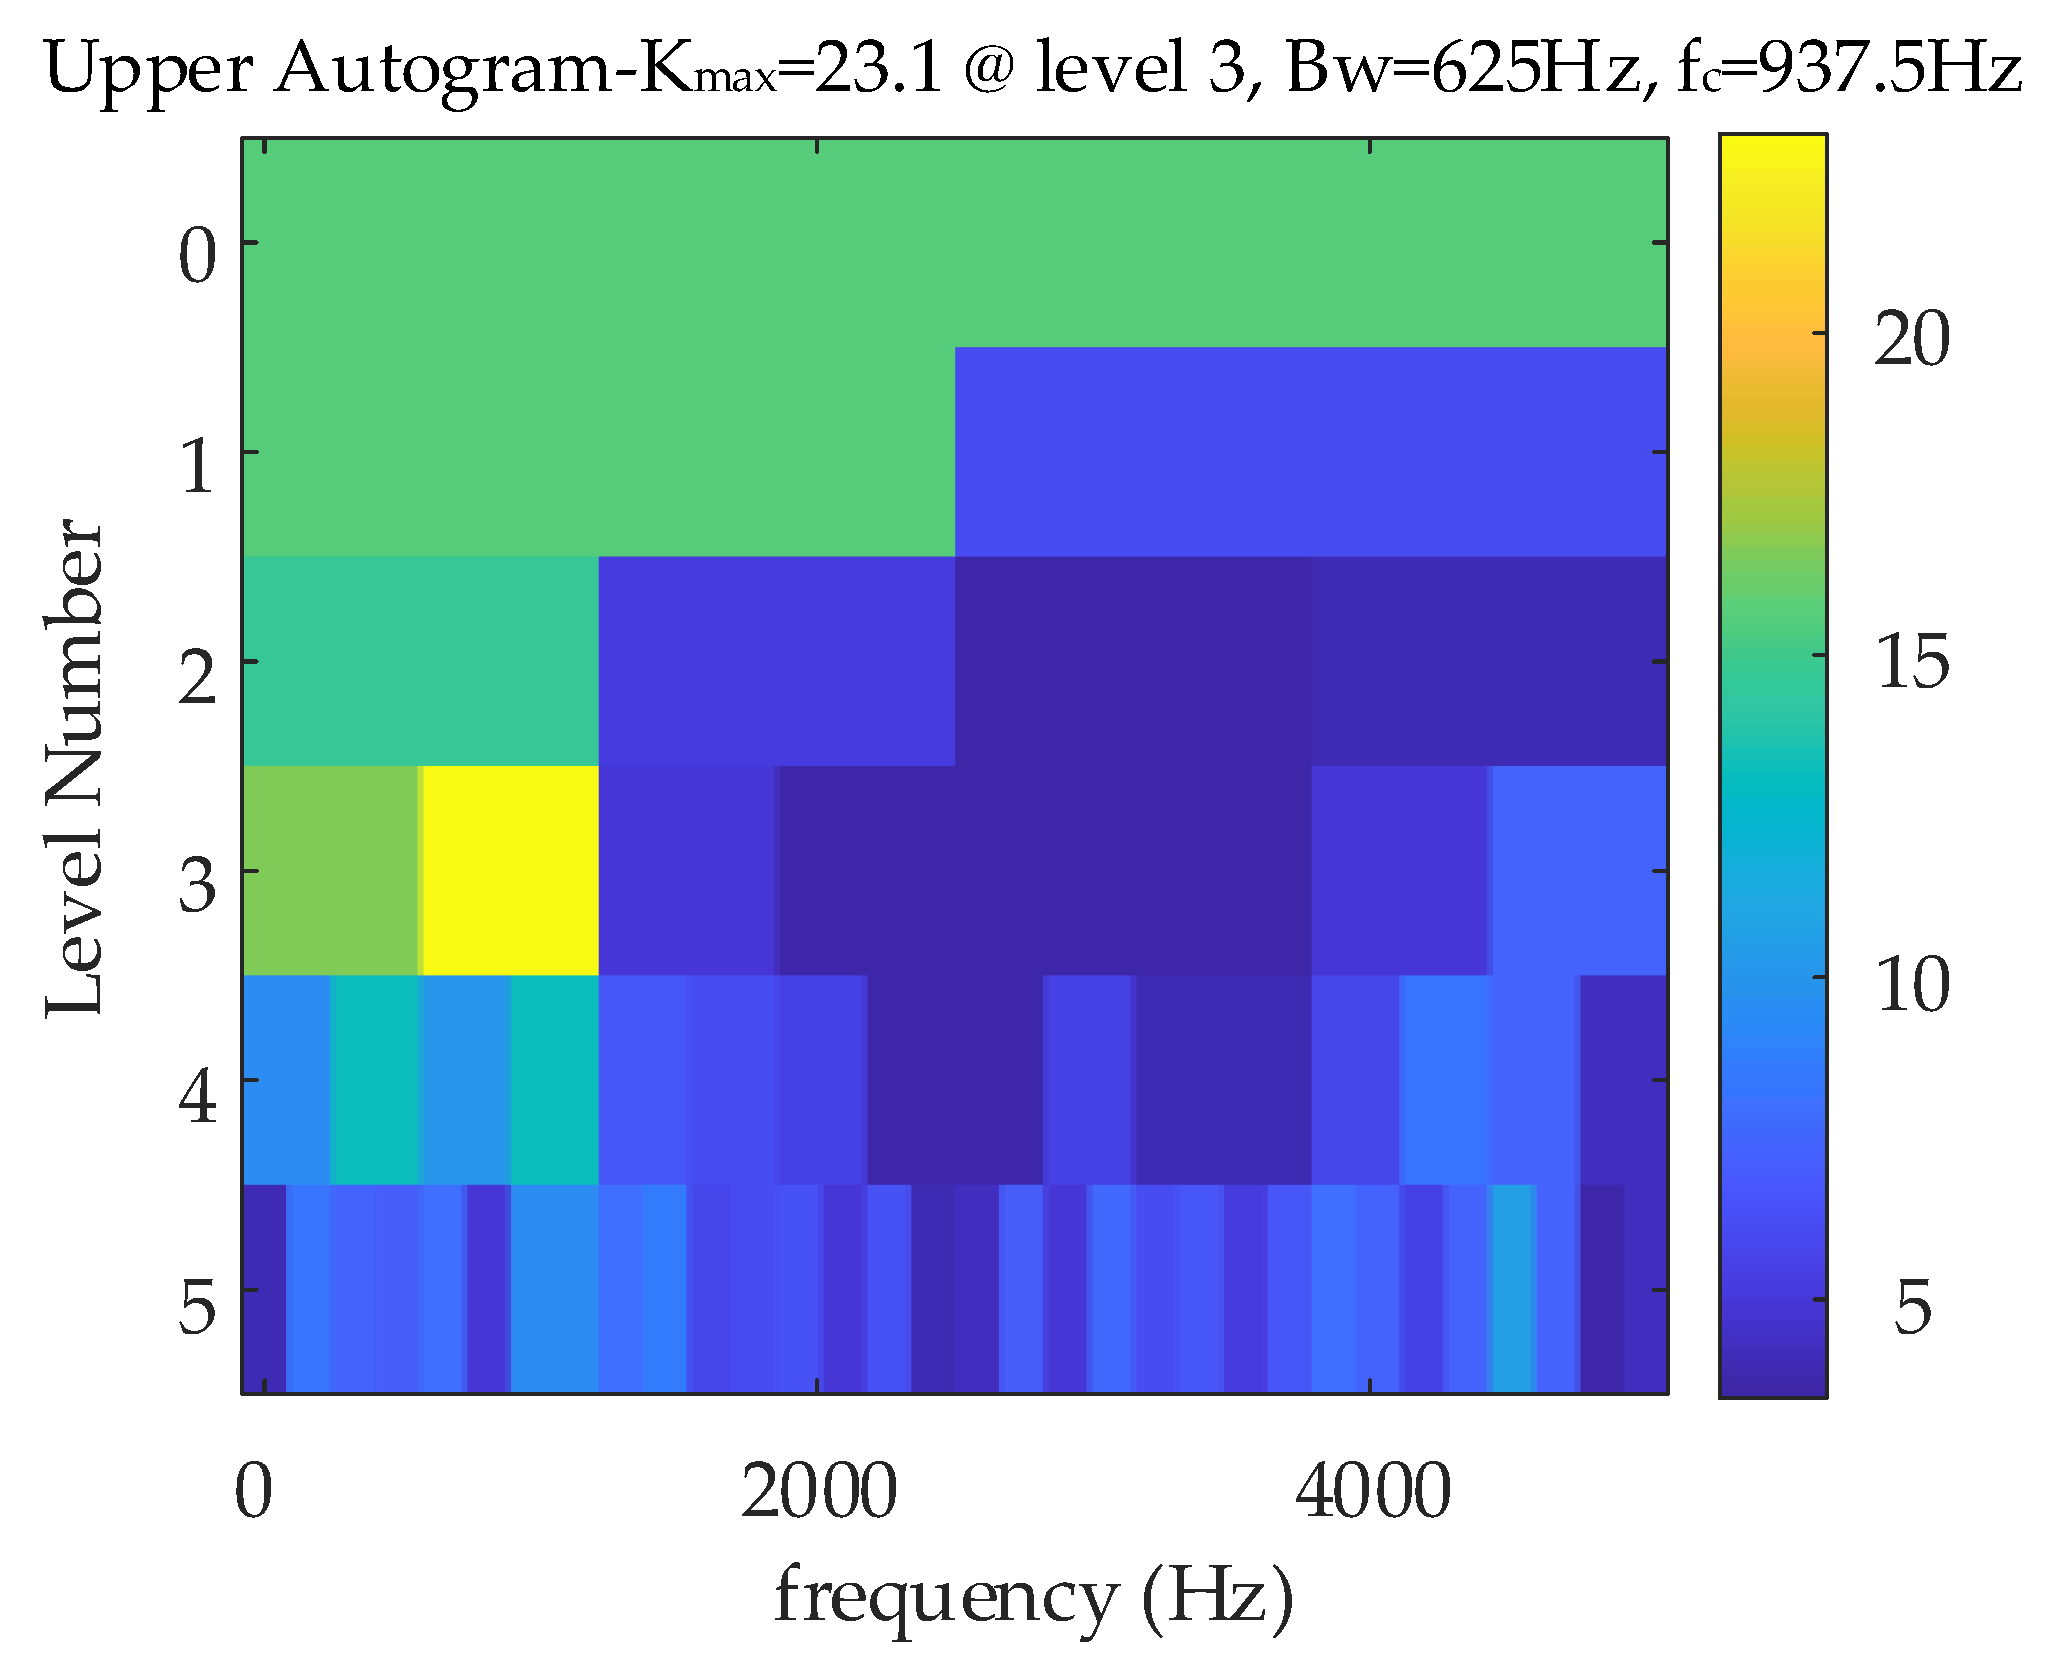
upper Autogramcolormap presentations of the result based on the kurtosisu is denoted upper Autogram
lower Autogramcolormap presentations of the result based on the kurtosisl is denoted lower Autogram
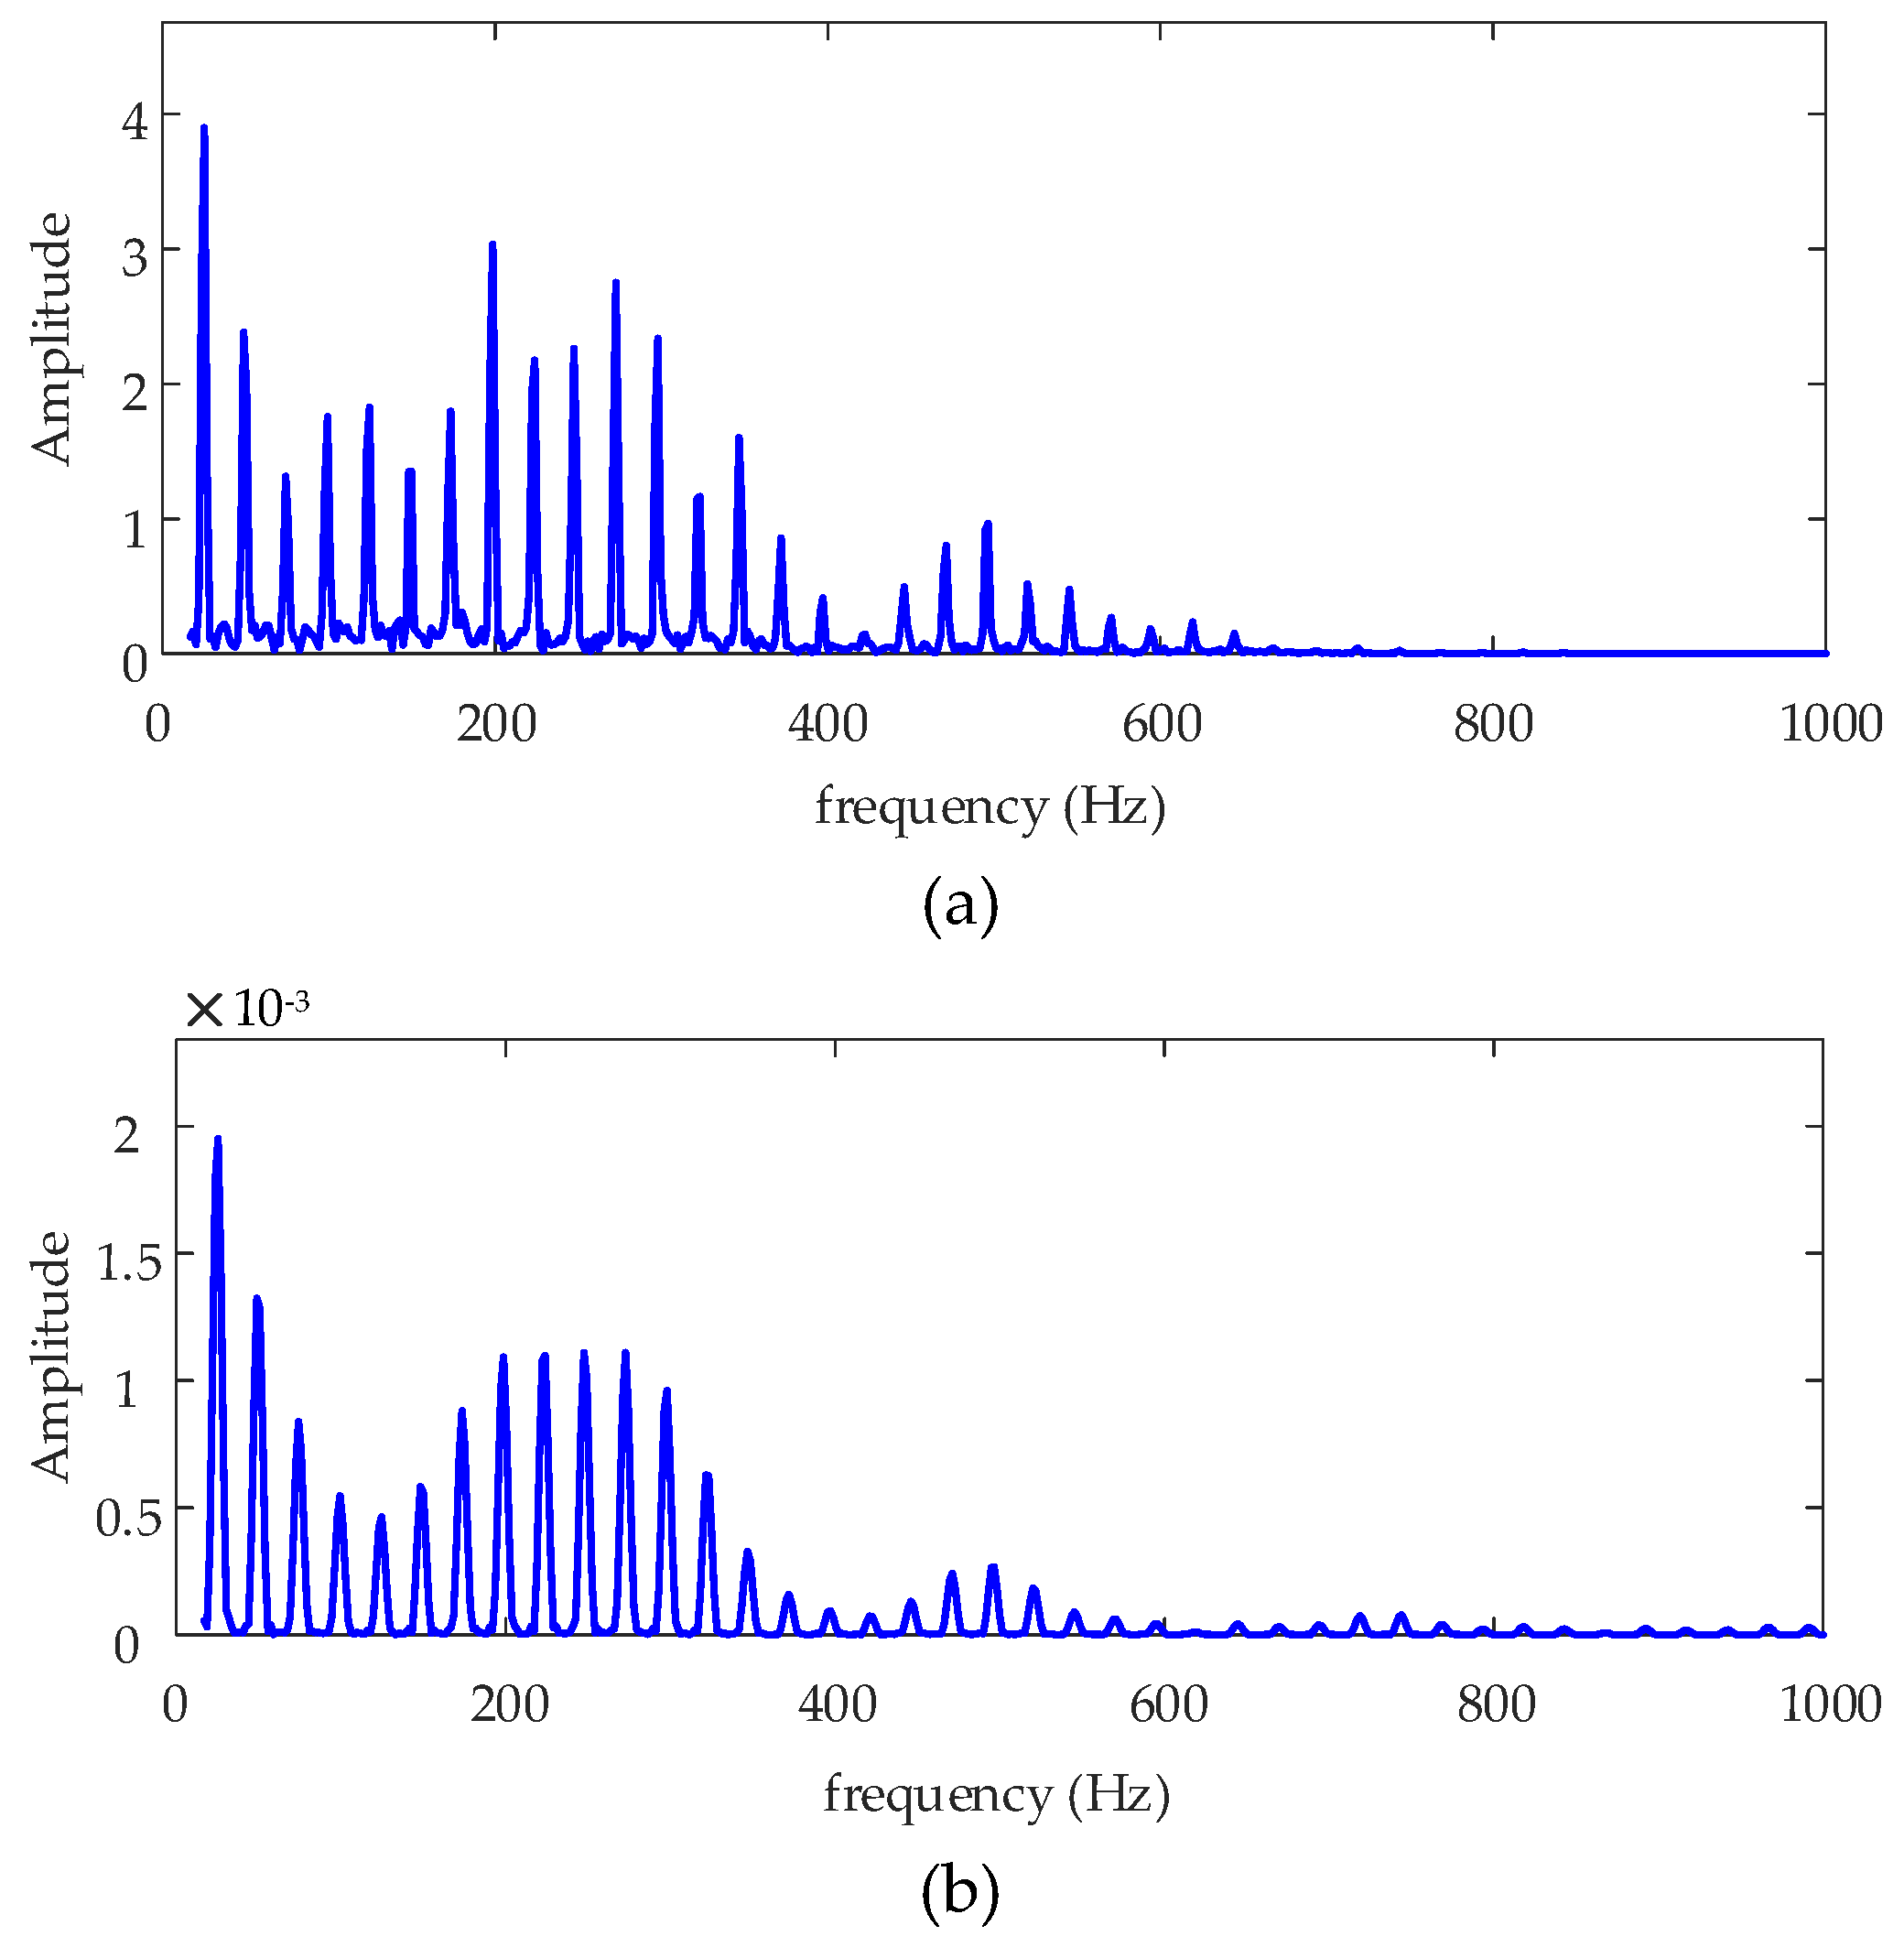
no threshold spectrumspectrum based on a signal without threshold processing
upper threshold spectrumspectrum based on upper parts of a signal which are larger than threshold value
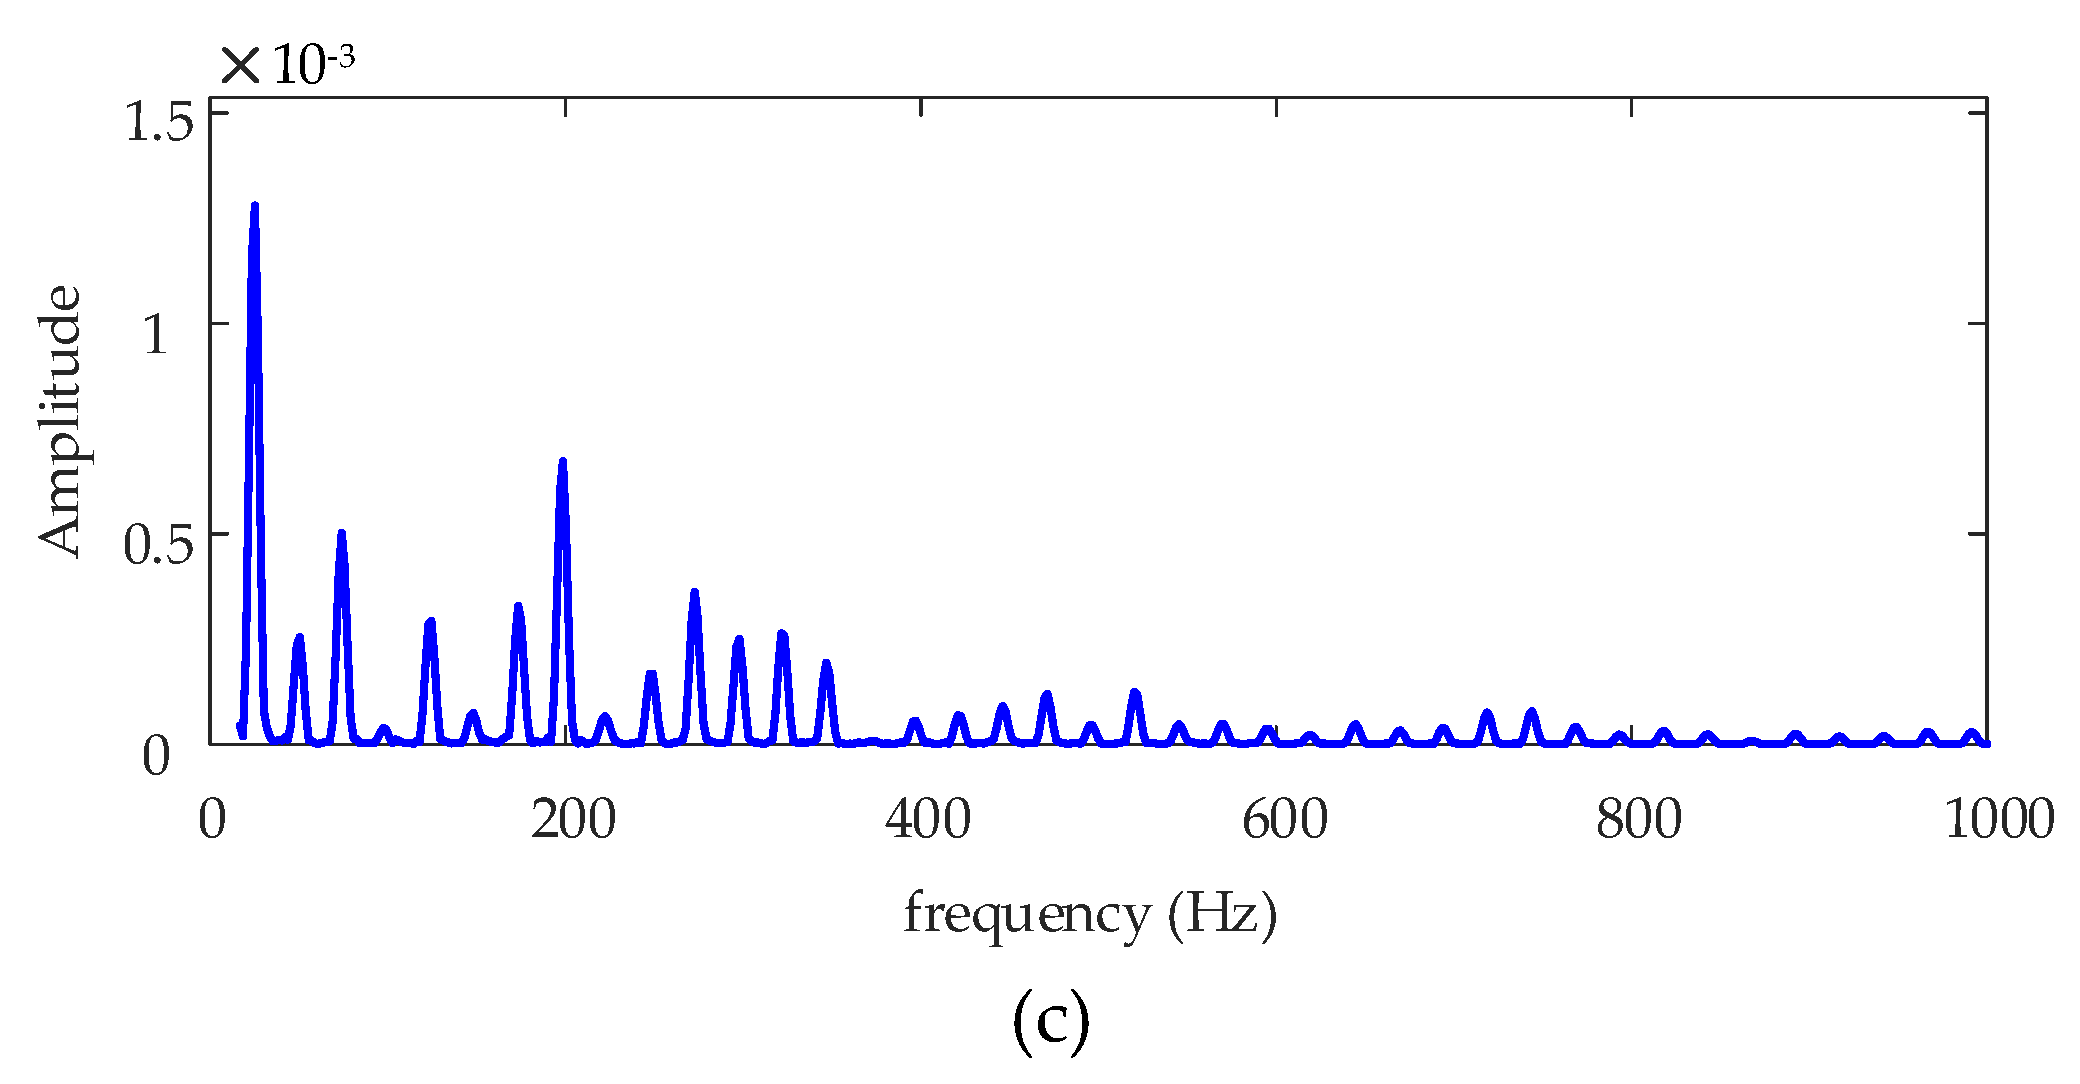
 x ¯ T ( i )
lower threshold spectrumspectrum based on lower parts of a signal which are smaller than threshold value x ¯ T ( i )
SNRsignal-to-noise ratio
Rxx(τ)unbiased AC analysis of the (periodic) instantaneous autocovariance
xsquared envelope of the signal filtered by MODWPT
τdelay factor
fssampling frequency
nnode length
x ¯ T ( i ) threshold value
klength of the windowed signal to be averaged
x′(t)simulated signal
x1(t)impulsive signal with periodic exponential attenuation
x2(t)Gauss white noise with standard deviation of 0.5
The fast kurtogram (FK) is adopted to select the signal with the most impulsive frequency band; and it has been a significant method for fault diagnosis of rotating machinery for many years [36]. However, in some harsh backgrounds with low signal-to-noise ratio (SNR), strong non-Gaussian noise, or randomly distributed impulses, its extraction ability is much reduced.
With the aim of resolving the above problems, Italian scholars proposed a method named Autogram to enhance the feature extraction ability in heavy Gaussian and non-Gaussian background noise in 2018. It is an effective tool for processing the impulsive fault signal, and no prior knowledge of the signal is needed [34].
The algorithm is described as follows:
(1) Decomposition of maximal overlap (undecimated) discrete wavelet packet transform (MODWPT)
According to a dyadic tree structure, a fault signal is divided in frequency bands by means of the wavelet transform. The MODWPT removes the down-sampling step of the discrete wavelet packet transform (DWPT), and then it is used as a filter; the signals are consequently produced at each level of decomposition. The signals in each decomposition level correspond to a frequency band and central frequency, known as the node.
(2) Calculating unbiased AC of the squared envelope for each node
Unbiased AC analysis of the (periodic) instantaneous autocovariance of the signal Rxx(ti, 0) is calculated and shown in Equation (1).
R ^ x x ( τ ) = 1 n q i = 1 n q x ( t i ) x ( t i + τ )
where x is squared envelope of the signal filtered by MODWPT at Step 1, τ = q/fs is the delay factor, fs is sampling frequency, and q = 0,…,n−1.
The advantage of AC is that it filters out the uncorrelated components within the fault feature information, i.e. noise and random impulsive contents. Furthermore, fault feature information can be made more obvious. It is even more effective, because it is done for each node separately rather than on the complete original signal, so that SNR for each demodulated band signal is increased.
It can be seen form Equation (1) that the point number of node will decrease with an increment of τ, and therefore AC will have an estimation error, thus the first half of the AC is used in the paper. With the help of the MODWPT, AC can make the diagnostic process more accurate.
(3) Kurtosis of the AC
This step is to select the node, and let the node be data source for further fault feature extraction. The proposed method is different from FK, because the kurtosis of Autogram is computed based on the AC of the node of each level. Subsequently, the kurtosis values of all nodes, similar to FK, are presented in a colormap for which the color scale is proportional to the kurtosis value, and the vertical and horizontal axis represent the level of the MODWPT decomposition and frequency, respectively.
Kurtosis aims to quantify the impulsivity of the AC of each node. Three kinds of equations are illustrated in Equations (2)–(4):
Kutrosis ( x ) = i = 1 n / 2 [ R ^ x x ( i ) min ( R ^ x x ( τ ) ) ] 4 [ i = 1 n / 2 [ R ^ x x ( i ) min ( R ^ x x ( τ ) ) ] 2 ] 2
Kutrosi s u ( x ) = i = 1 n / 2 | R ^ x x ( i ) x ¯ T ( i ) | + 4 [ i = 1 n / 2 | R ^ x x ( i ) x ¯ T ( i ) | + 2 ] 2
Kutrosi s l ( x ) = i = 1 n / 2 | R ^ x x ( i ) x ¯ T ( i ) | 4 [ i = 1 n / 2 | R ^ x x ( i ) x ¯ T ( i ) | 2 ] 2
where n is node length, operator of | | + or | | illustrate that only positive or negative value is adopted respectively, and the other values are set to 0. x ¯ T ( i ) is the threshold value, and it can be obtained based on the moving mean value of AC.
x ¯ T ( i ) = 1 k j = i i + k 1 R ^ x x ( i )
where k is length of the windowed signal to be averaged.
Colormap presentations, based on the Equations (2)–(4), are denominated standard Autogram, upper Autogram, and lower Autogram, respectively.
Ultimately, the node associated with the largest kurtosis value is considered for further investigation.
(4) Spectrum analysis based on the threshold value
Based on the data source obtained in Step (3), the Fourier transform of the squared envelope based on the no threshold value (original node), the smaller than threshold value, and the larger than threshold value can be obtained. Thus, their spectrums are known as the no threshold spectrum, the lower threshold spectrum, and upper threshold spectrum, respectively.

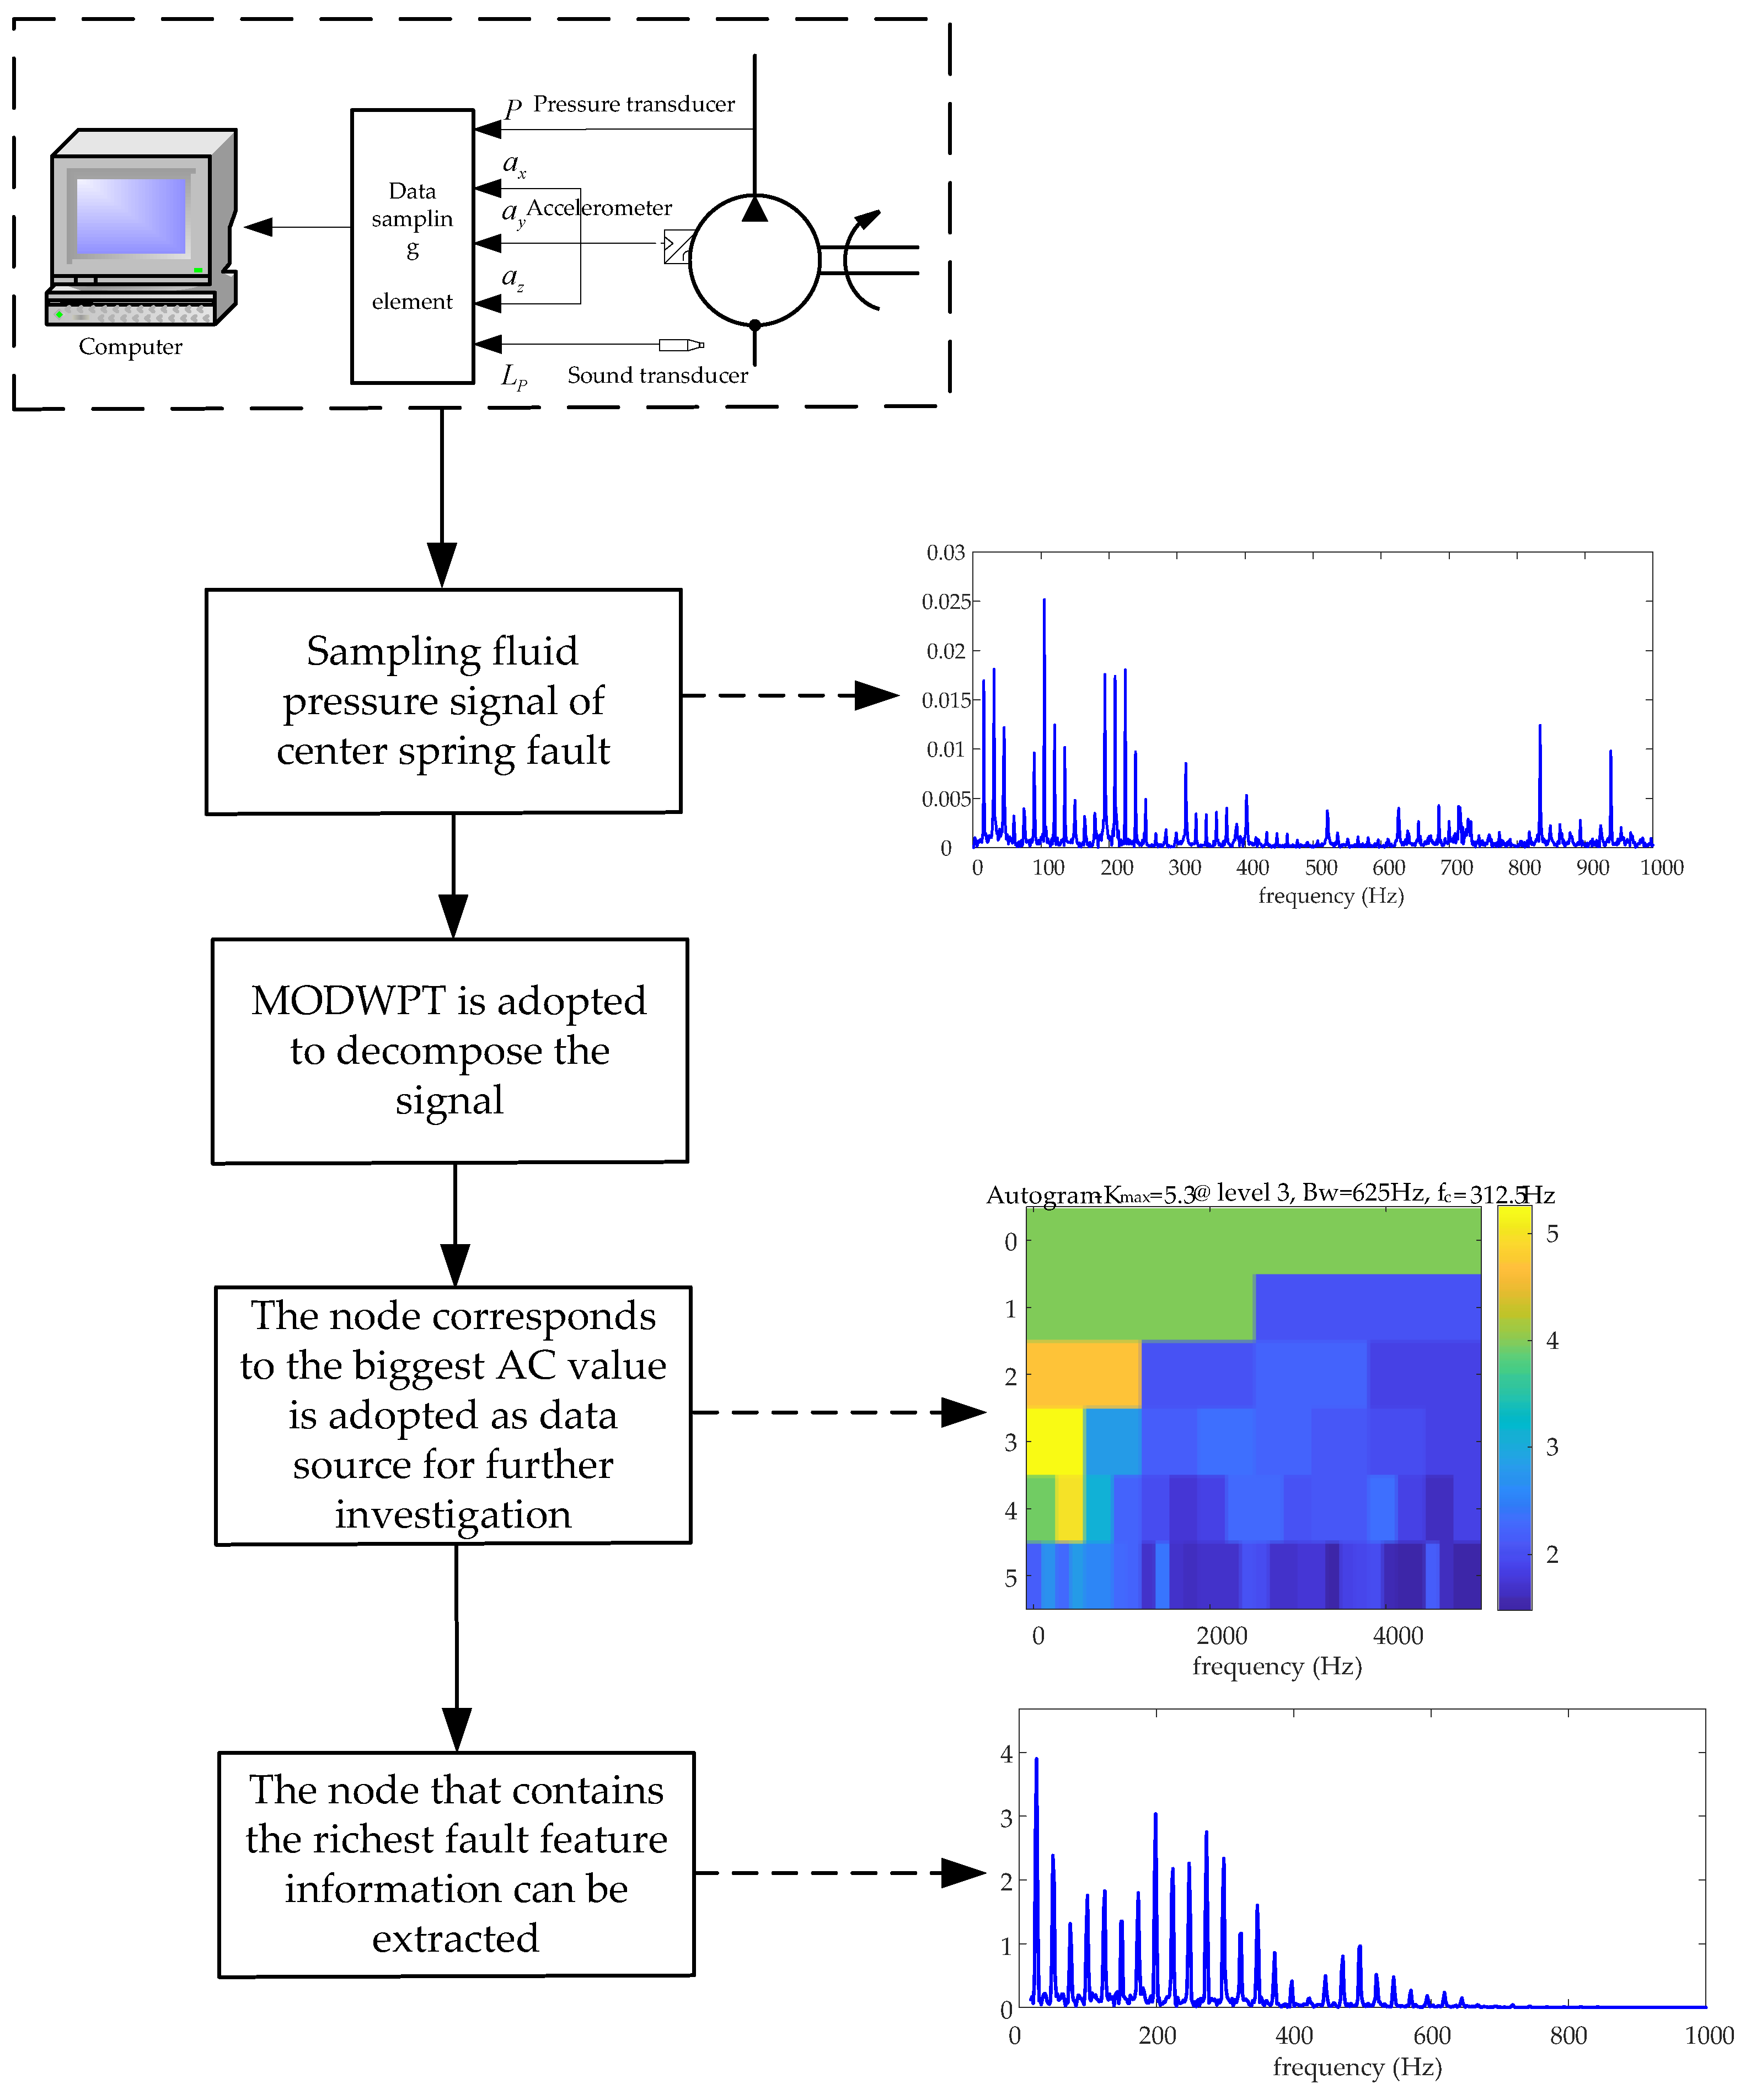
3. Flowchart of the proposed method

Fluid pressure signal of center spring wear fault is sampled. The MODWPT is adopted to decompose the signal, and some nodes at each level of decomposition can be obtained. The AC of each node is computed, and the node that corresponding to the biggest AC value is selected as the data source for further investigation. Then, the spectrum of data source can be acquired, and the fault feature information can be extracted. The flowchart of the Autogram is shown in Figure 1.

4. Numerical experiment

4.1. Simulated signal

If a center spring wear fault has occurred, this will cause serious hydraulic shock in the hydraulic pump, which can be reflected as impulsive feature in morphology of the fault signal. Thus, x1(t) (an impulsive signal with periodic exponential attenuation) is used to simulate the fault signal. There are also some background noises in the fault pump; thus, x2(t) of Gauss white noise with standard deviation of 0.5 is adopted to simulate the background noises.
The purpose of the simulation experiment is used to validate the effectiveness of Autogram to extract x1(t) of the simulated impulsive fault in theory.
The simulated signal is expressed in Equation(6):
x′(t) = x1(t) + x2(t)
where x1(t) is used to simulate an impulsive fault, and it is an exponential attenuation signal with periodic frequency of 30 Hz. It is 3e-400tsin(300πt) in a period. x2(t) is Gauss white noise with a standard deviation of 0.5, and it is used to simulate a background noise. The sampling frequency is 2048 Hz.
The simulated signal in frequency domain is shown in Figure 2.

4.2. Analysis of the simulated signal based on standard Autogram

Standard Autogram is adopted to extract the simulated fault feature information, and the colormap presentation obtained based on the Equation (2) is displayed in Figure 3.
The maximum value kurtosis 6.6 is assigned to the node (1, 1), with a center frequency of 256 Hz and a bandwidth of 512 Hz. Thus, the node (1, 1) is used as data source for future investigation, and the no threshold spectrum, upper threshold spectrum, and lower threshold spectrum are shown in Figure 4.
Among the three figures in Figure 4, simulated fault feature information at fault feature frequency 30 Hz and all of its harmonics are only extracted only in Figure 4a. The amplitude values based on no threshold processing in Figure 4a are the largest, and all of them are larger than those in the simulated signal spectrum in Figure 2. It can be seen that standard Autogram extracts the information effectively, and the extraction ability of Autogram based on no threshold processing is the strongest.

4.3. Analysis of thesimulated signal based on Upper Autogram

The upper Autogram is applied to extract the simulated fault feature information and the colormap presentation can be obtained based on Equation (3), as shown in Figure 5.
The maximum value kurtosisu is 5.3, and it is assigned to the node (3, 4), with center frequency of 448 Hz and a bandwidth of 128 Hz. Thus, the node (3, 4) is used as data source for further investigation, and the no threshold spectrum, upper threshold spectrum, and lower threshold spectrums are illustrated in Figure 6.
It is very clear that there is no simulated fault feature information at fault feature frequency of 30 Hz with its harmonics in Figure 6, and there are many background noises. Thus, the feature information cannot be effectively extracted by upper Autogram based on lower threshold processing.

4.4. Analysis of the simulated signal based on Lower Autogram

The simulated fault feature information is extracted by lower Autogram, and the colormap presentation based on the Equation (4) is shown in Figure 7.
The maximum value kurtosisl is 2.3 and corresponds to node (2, 1), the node has a center frequency of 128 Hz and a bandwidth of 256 Hz. Node (2, 1) is adopted as a data source for further investigation, and the no threshold spectrum, upper threshold spectrum, and lower threshold spectrums are demonstrated in Figure 8.
It can be seen in Figure 8 that the simulated fault feature information at fault feature frequency 30 Hz with some harmonics can be extracted. The amplitude values obtained based on no threshold processing in Figure 8a are the larger than in Figure 8b,c, and the amplitude values in Figure 8 are all larger than those in Figure 2. Thus, lower Autogram is effective in extracting the information, and its extraction ability based on no threshold processing is the strongest.
Compared with standard Autogram based on no threshold processing in Figure 4, the fault feature information with many harmonics cannot be extracted by lower Autogram, and their amplitude values are small.
From the results of standard Autogram (Figure 4), upper Autogram (Figure 6), and lower Autogram (Figure 8), it can be concluded that standard Autogram has the strongest extraction ability, with background noises more greatly reduced.

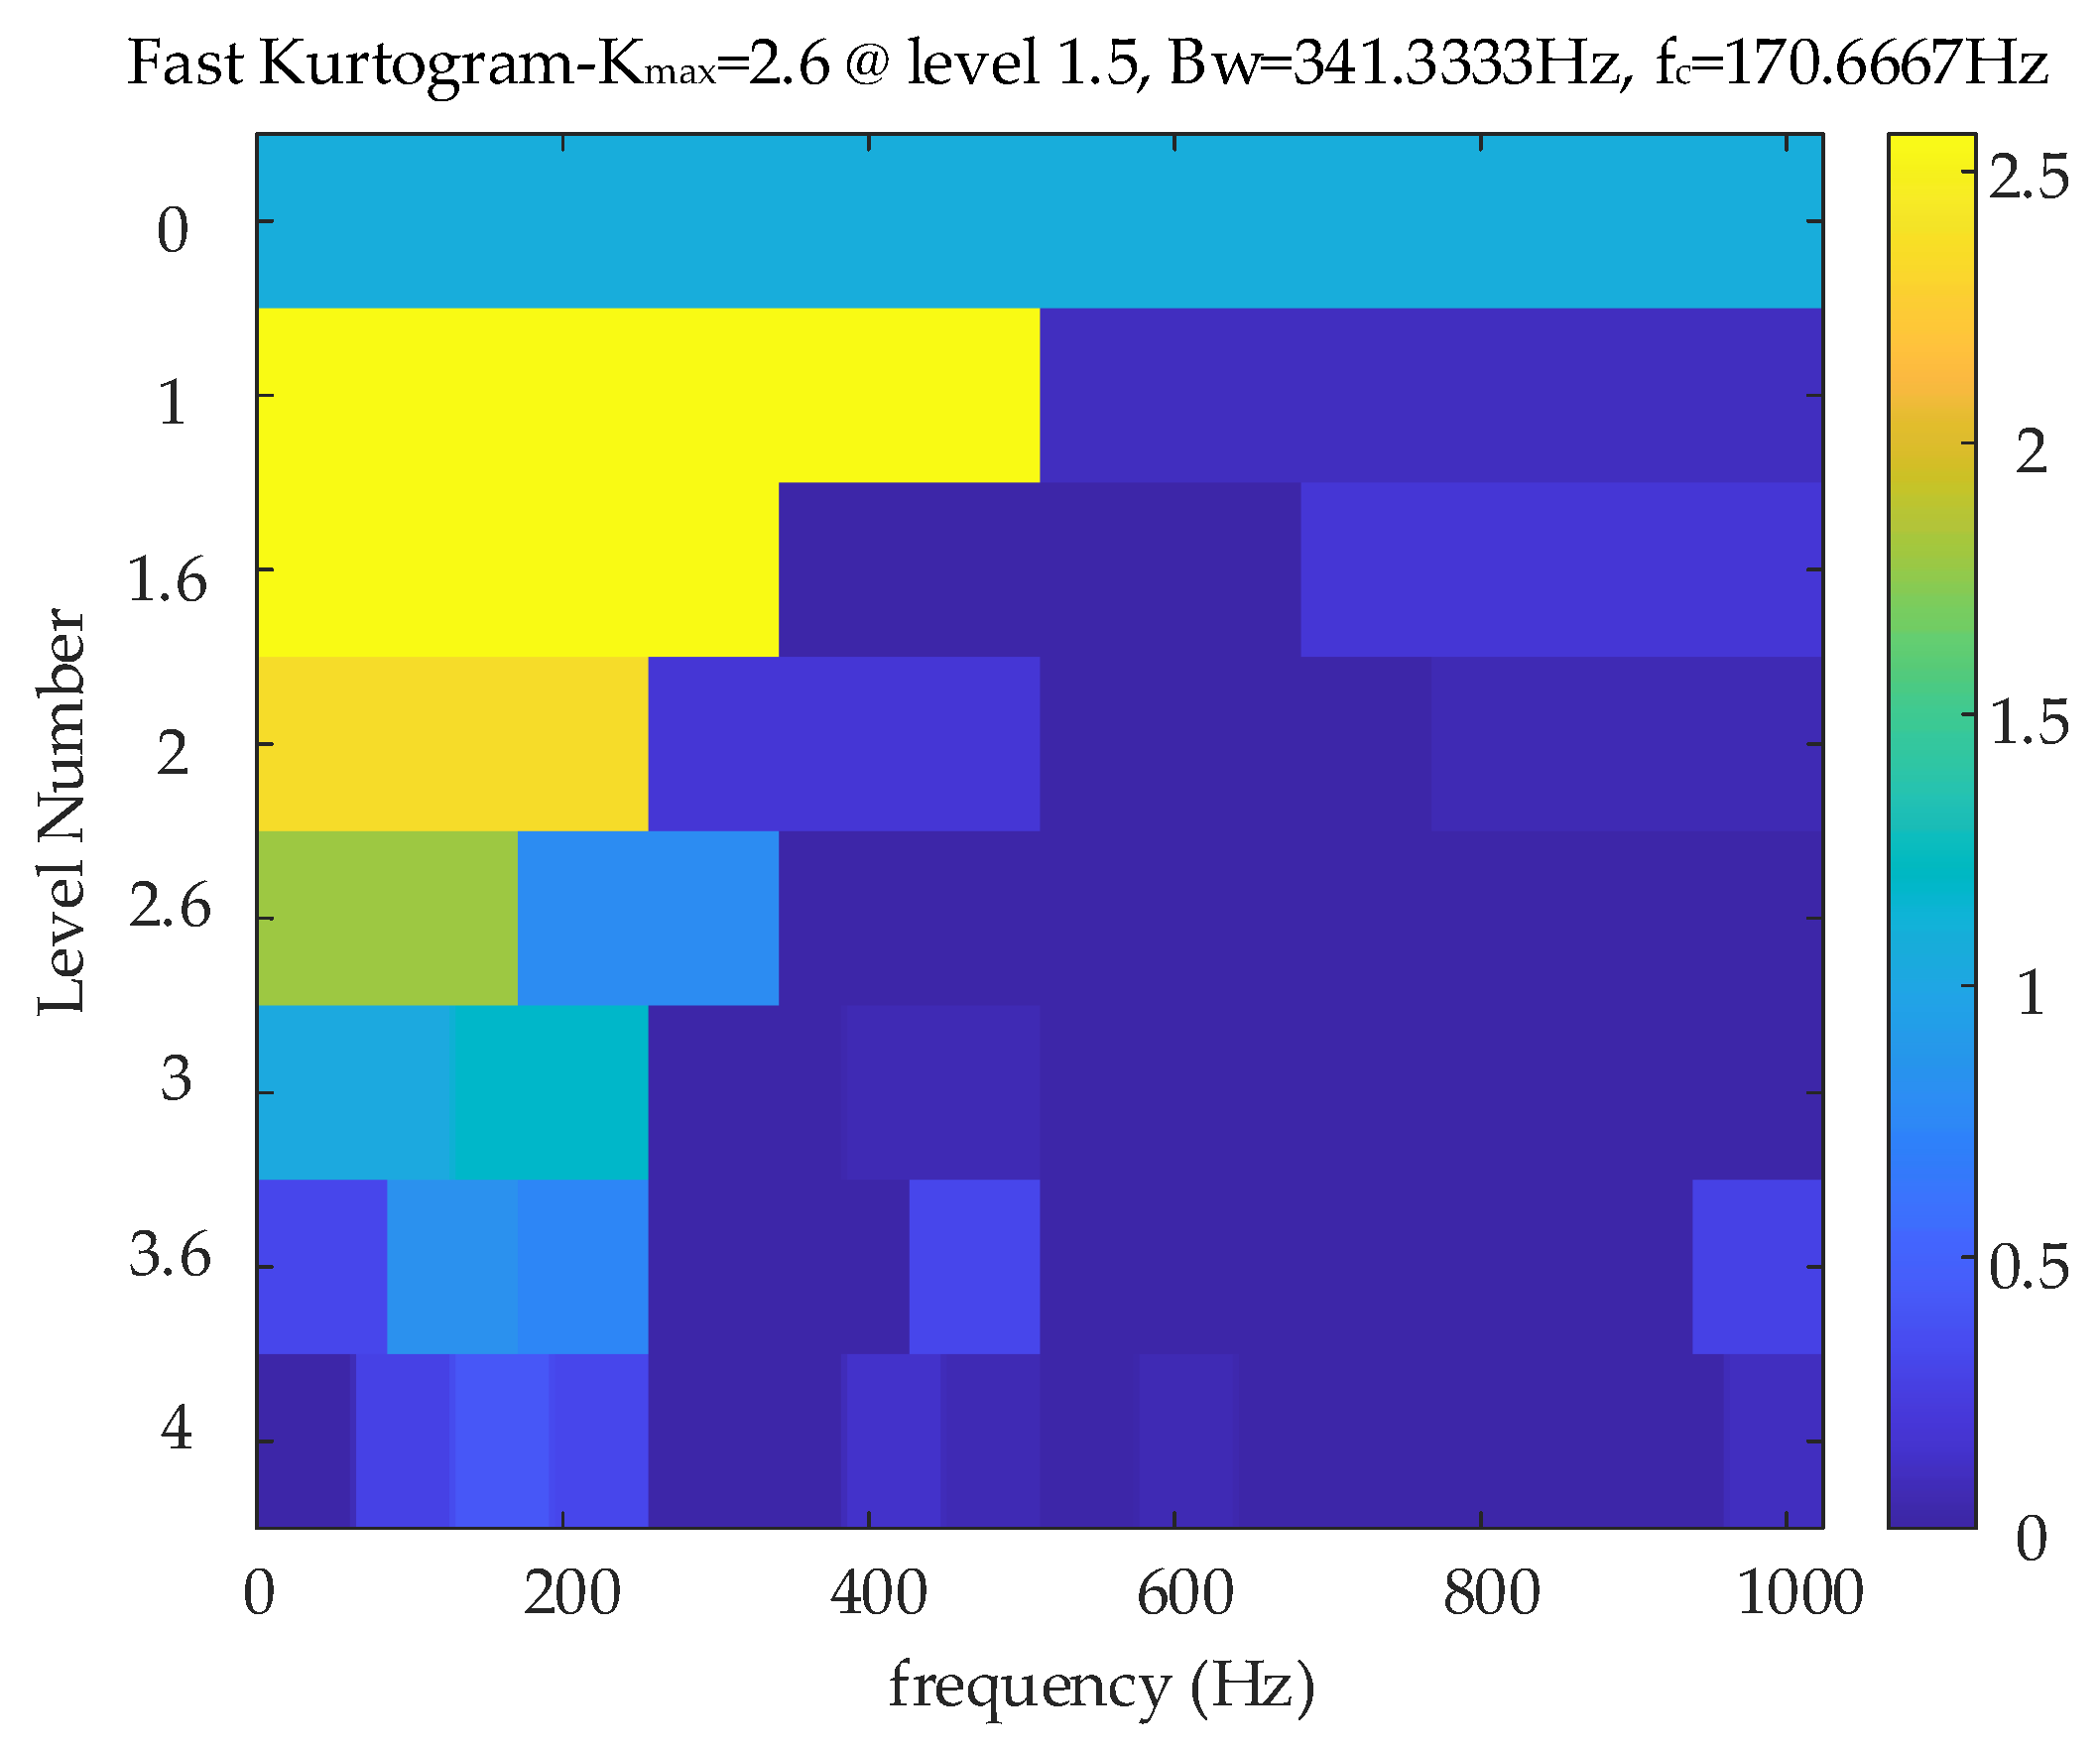
4.5. Analysis of center spring wear fault signal based on FK

In order to demonstrate the effectiveness and advantages of the proposed method, the signal is also analyzed by FK, and the colormap presentation is displayed in Figure 9.
The maximum value of kurtosis based on FK is 2.6, corresponding to a sub-signal at level 1.6; the sub-signal has a center frequency of 170.6667 Hz and a bandwidth of 341.3333 Hz. The sub-signal is used as a data source for further investigation, and its spectrums are shown Figure 10.
Based on above, we know that standard Autogram has the strongest extraction ability among the three methods. Compared with standard Autogram, while FK can extract 30 Hz and its harmonics, the amplitude values are too small.
It can be concluded from above that the standard Autogram based on no threshold processing has the strongest extraction ability. It can extract simulated fault feature information, and it performs best among all methods of Autogram and FK.

5. Application to hydraulic pump fault signal

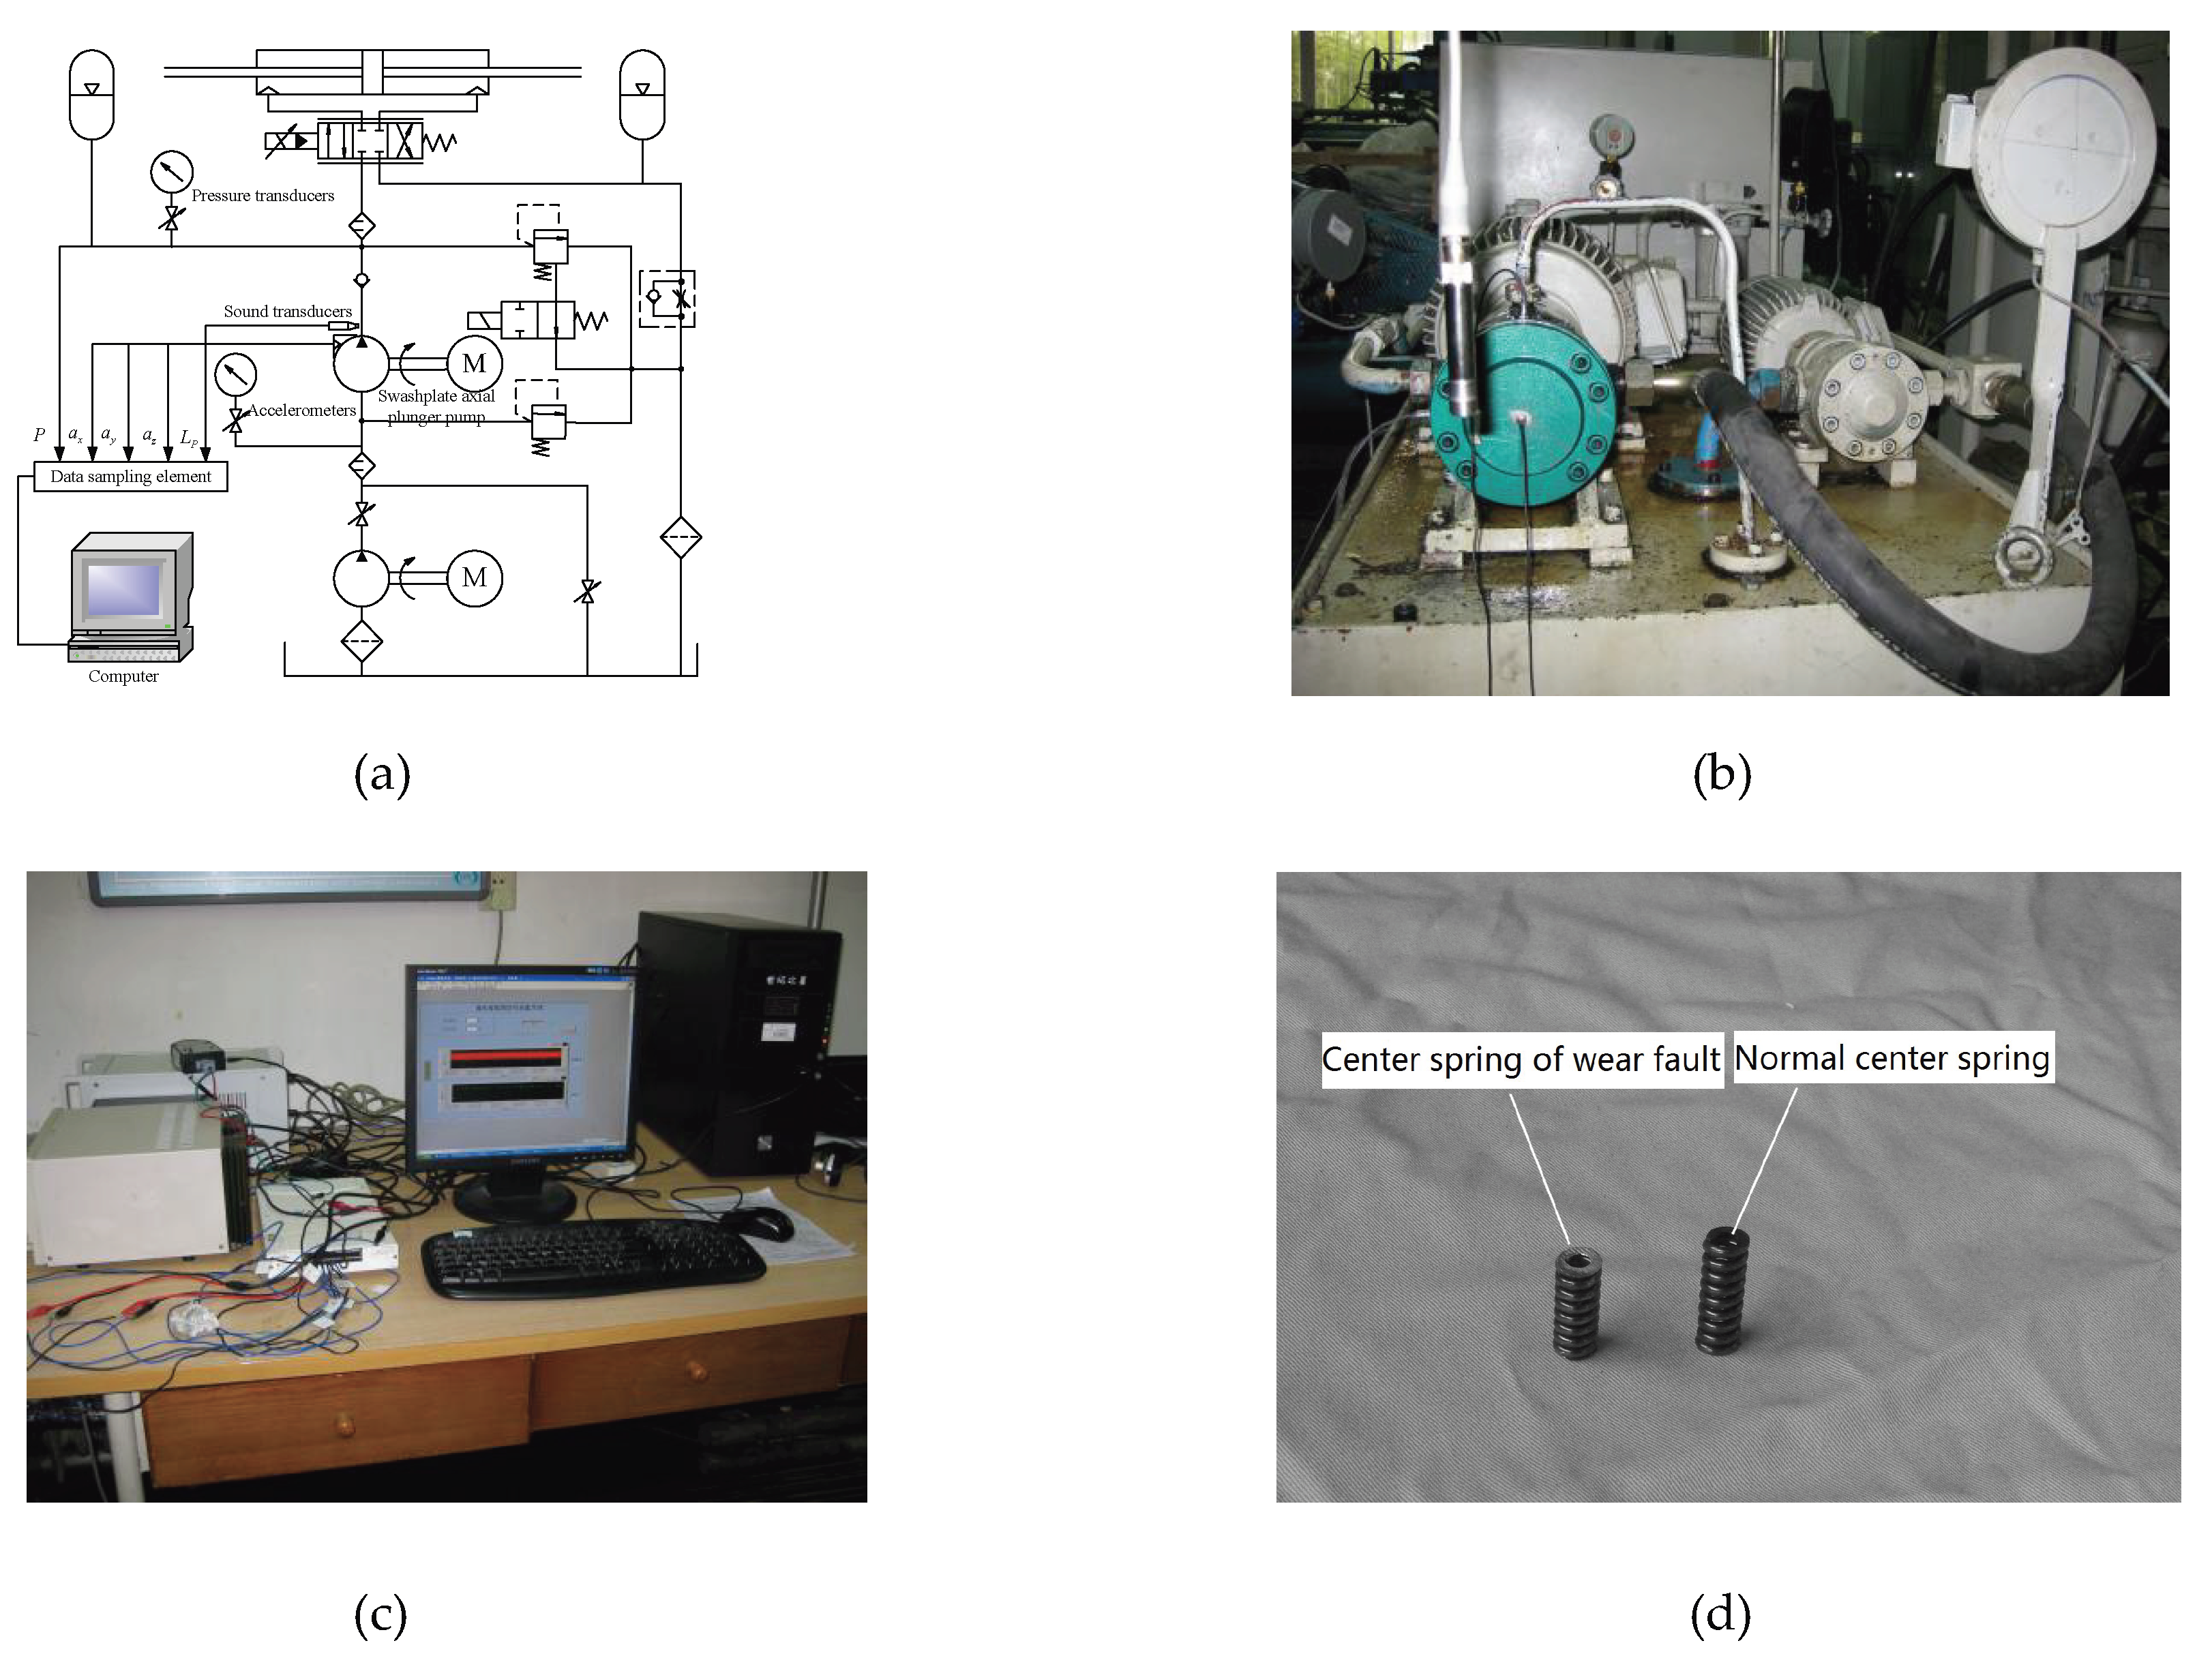
5.1. Experimental scheme

In order to validate the effectiveness of the Autogram, an experiment was executed on a swashplate axial plunger pump with a center spring wear fault. The rotational speed of the pump was set as at 1470 r/min. The pressure transducer was set at the pump outlet, and the fluid pressure of the outlet was set as 10 MPa. The fluid pressure signal of the outlet was sampled at 10 kHz. The center spring wear fault feature frequency was 24.5 Hz [37].
The swashplate axial plunger pump experiment systems are shown in Figure 11.

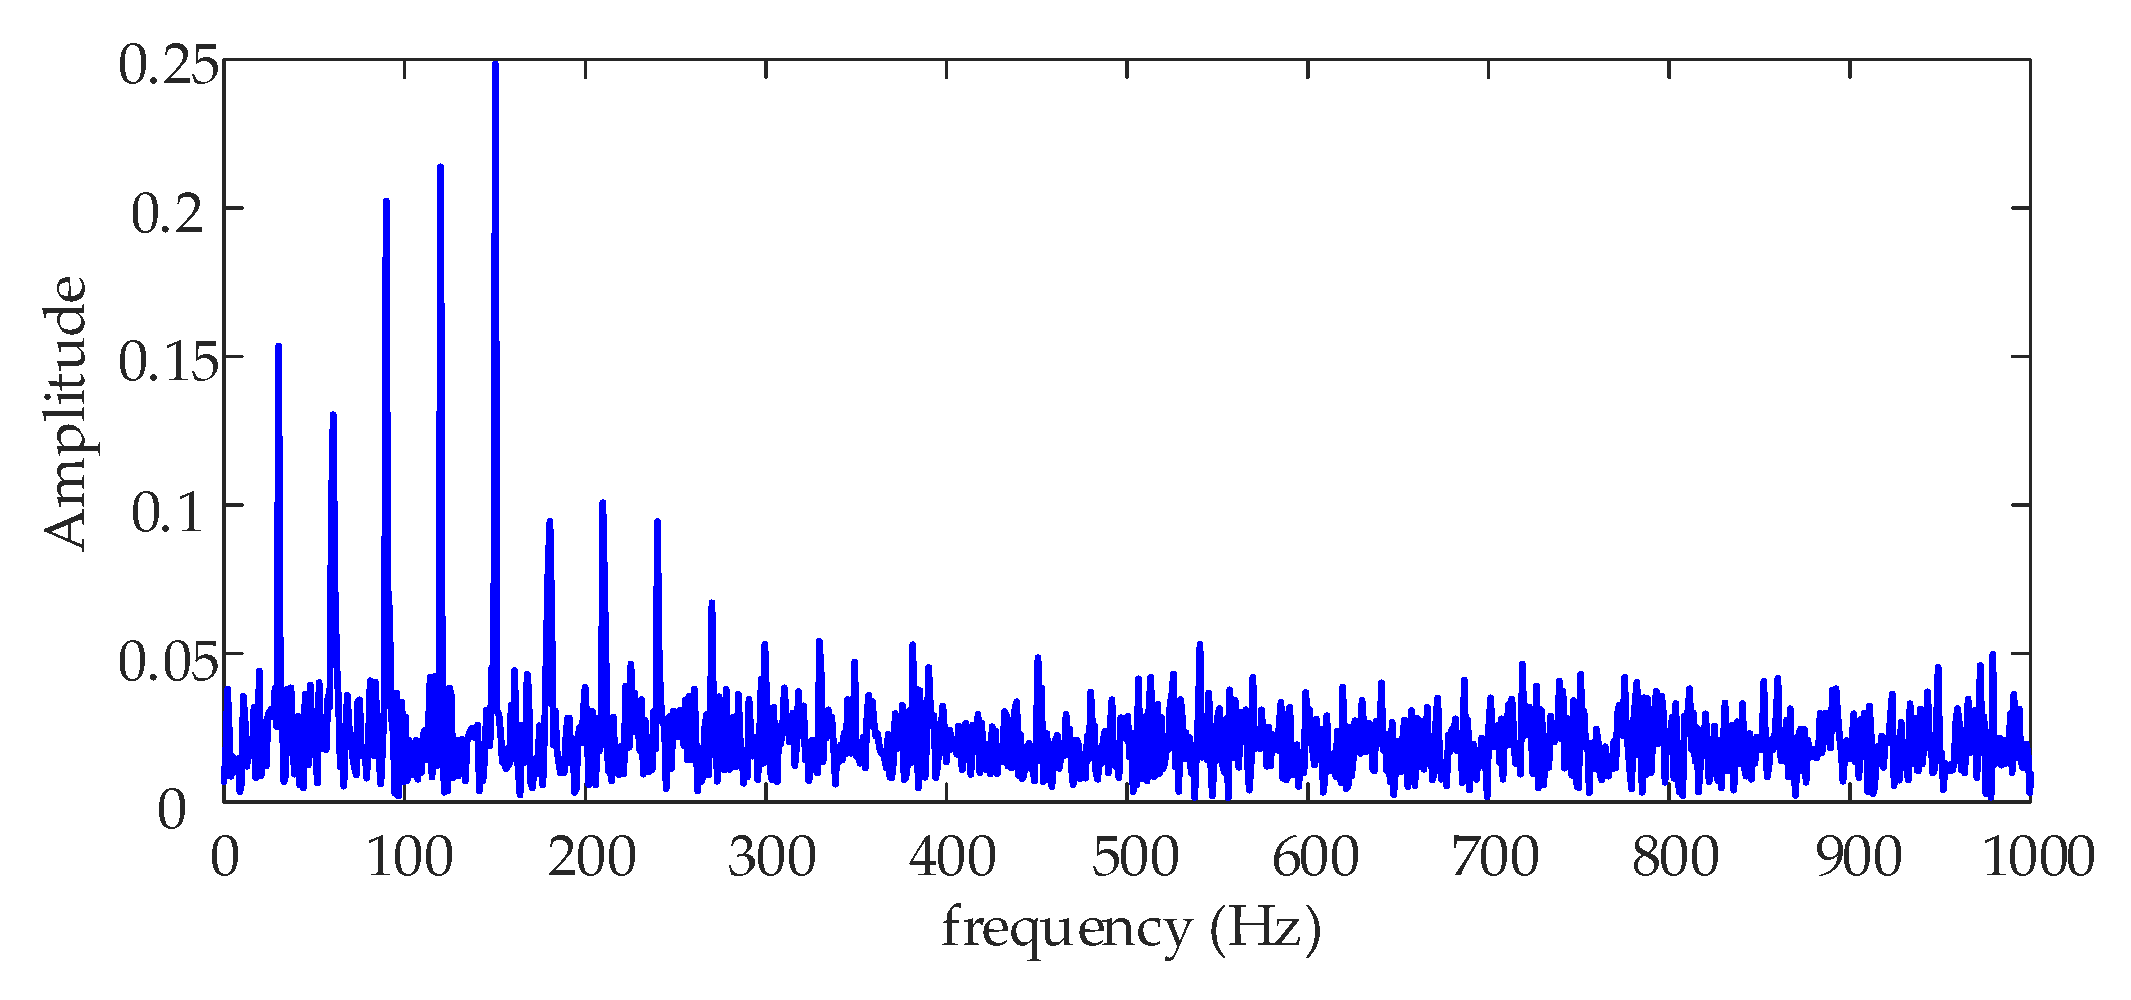
5.2. Center spring wear fault signal of fluid pressure

The center spring wear fault signal of fluid pressure in the frequency domain is shown in Figure 12.
It can be seen from Figure 12 that the fault feature information on center spring wear at fault feature frequency 24.5 with some harmonics is not obvious, and the amplitude values are very small. Thus, the fault feature information is contaminated by a lot of background noise.

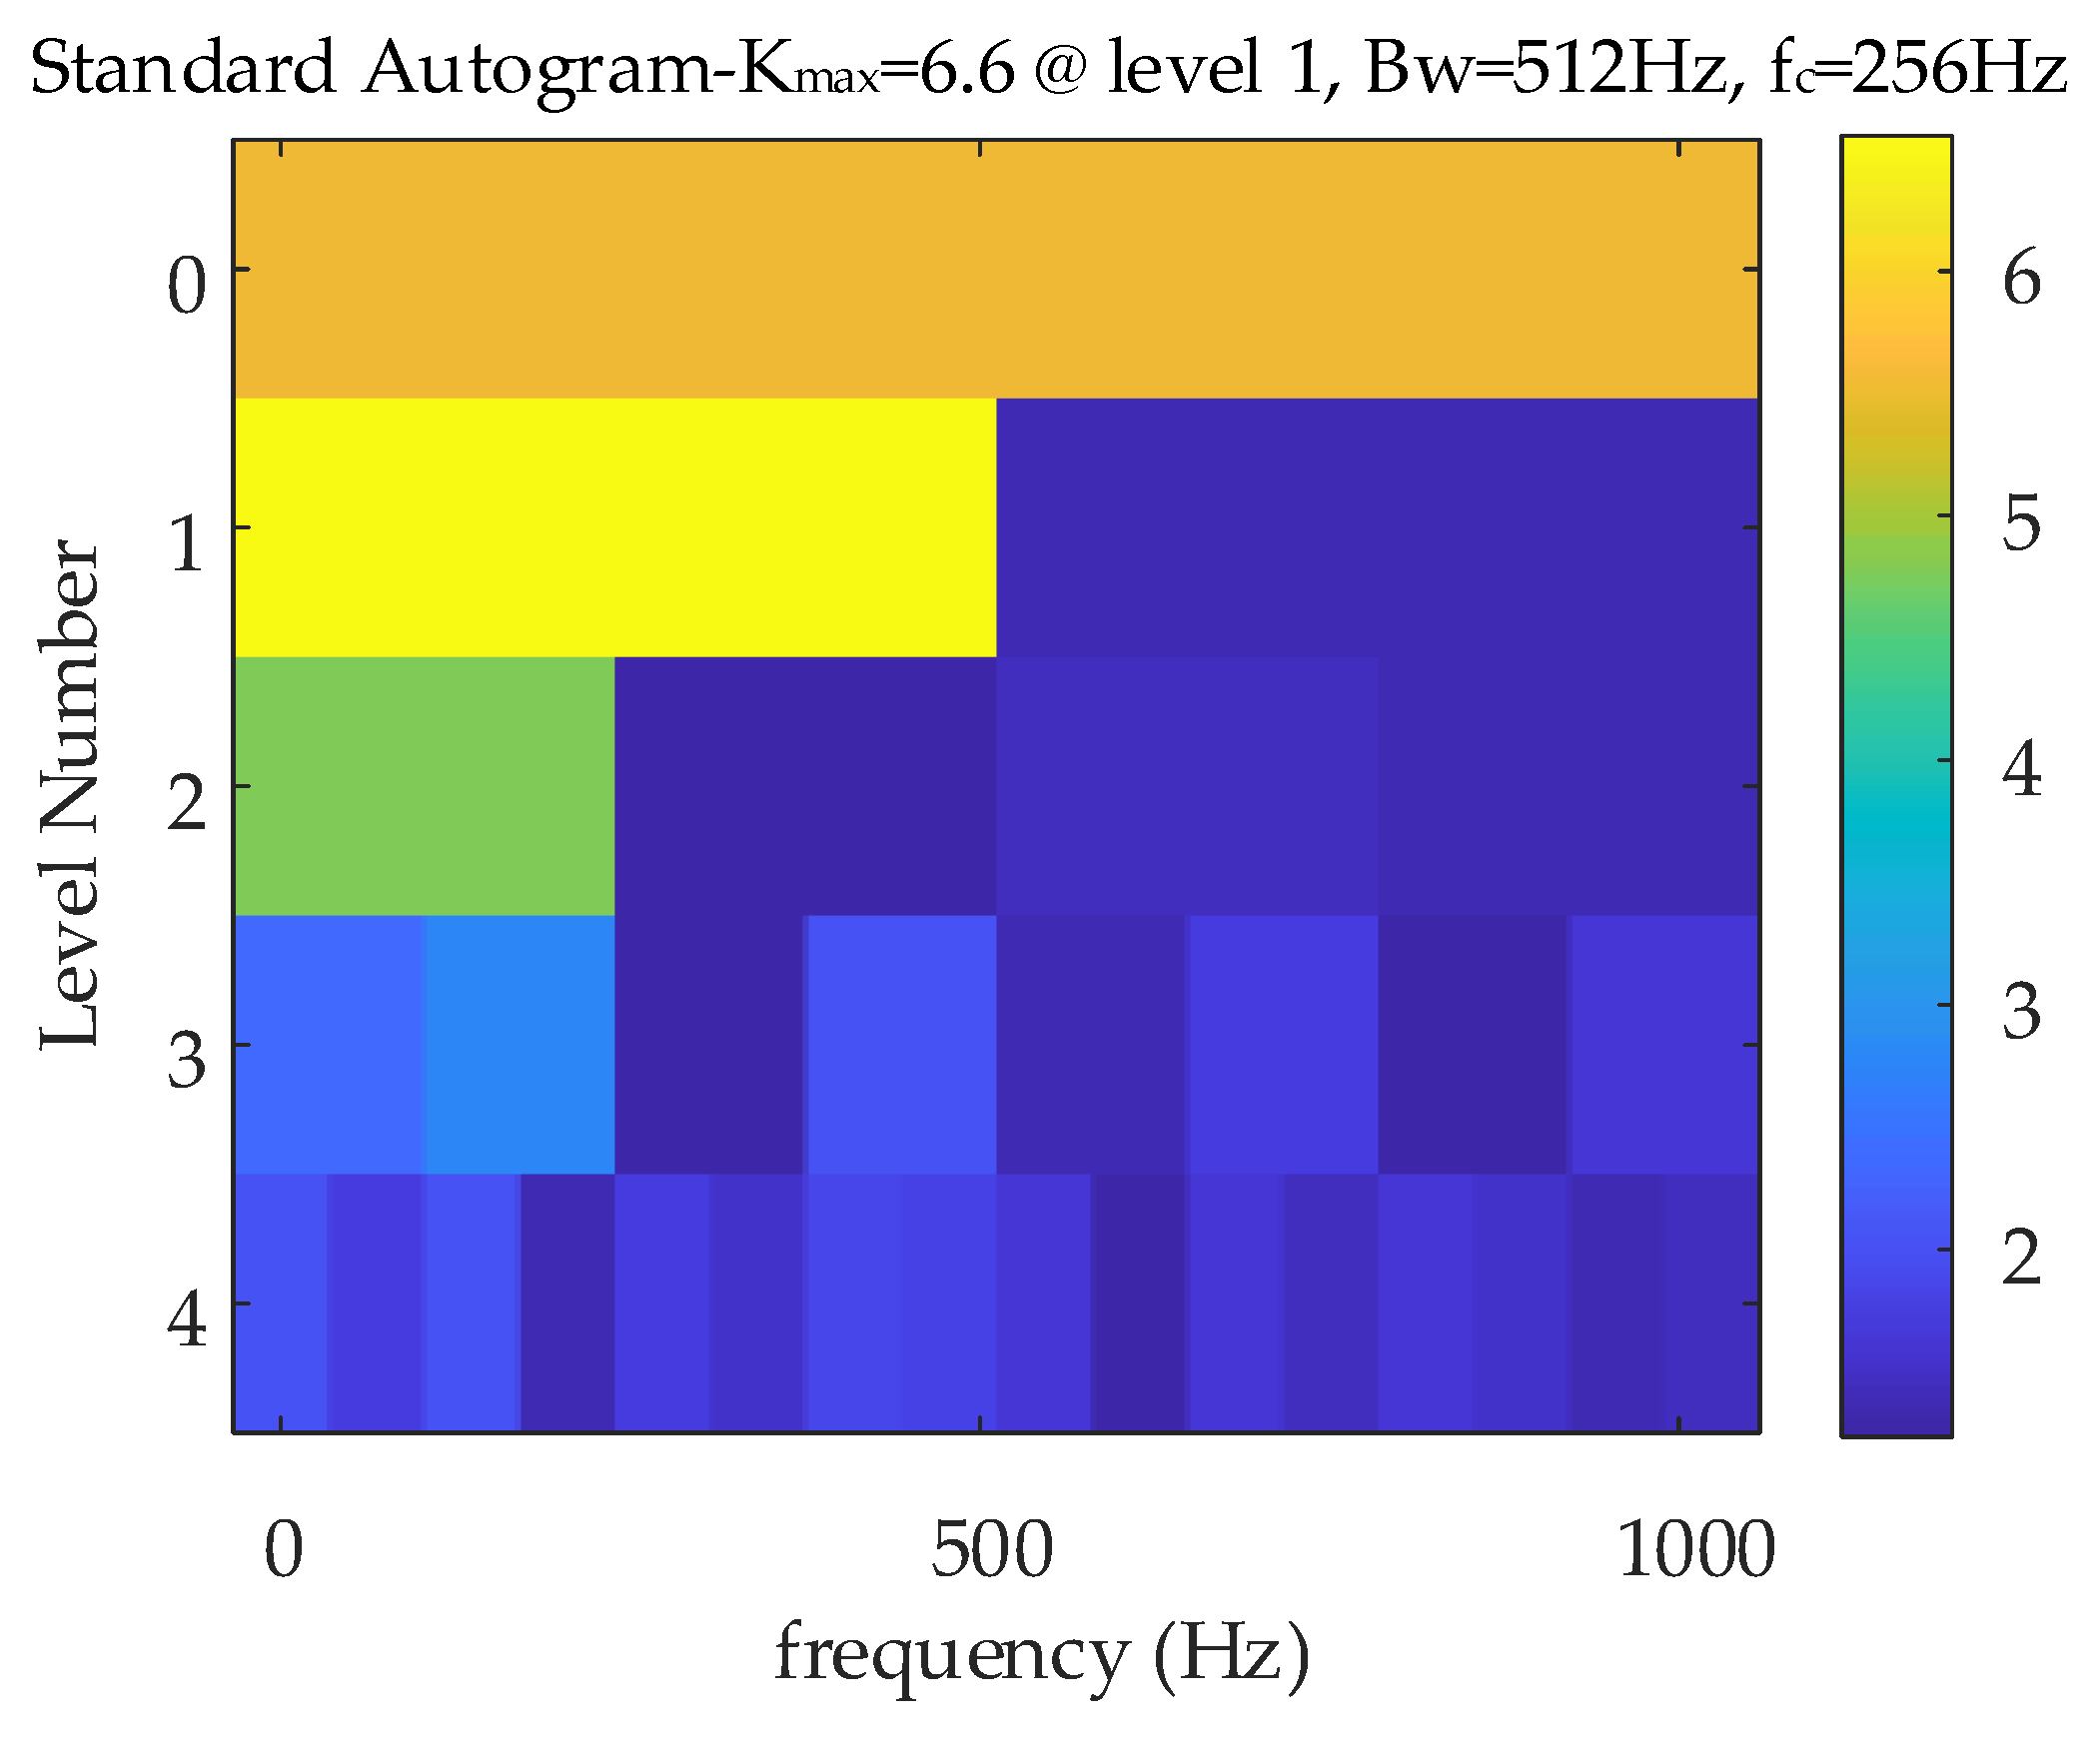
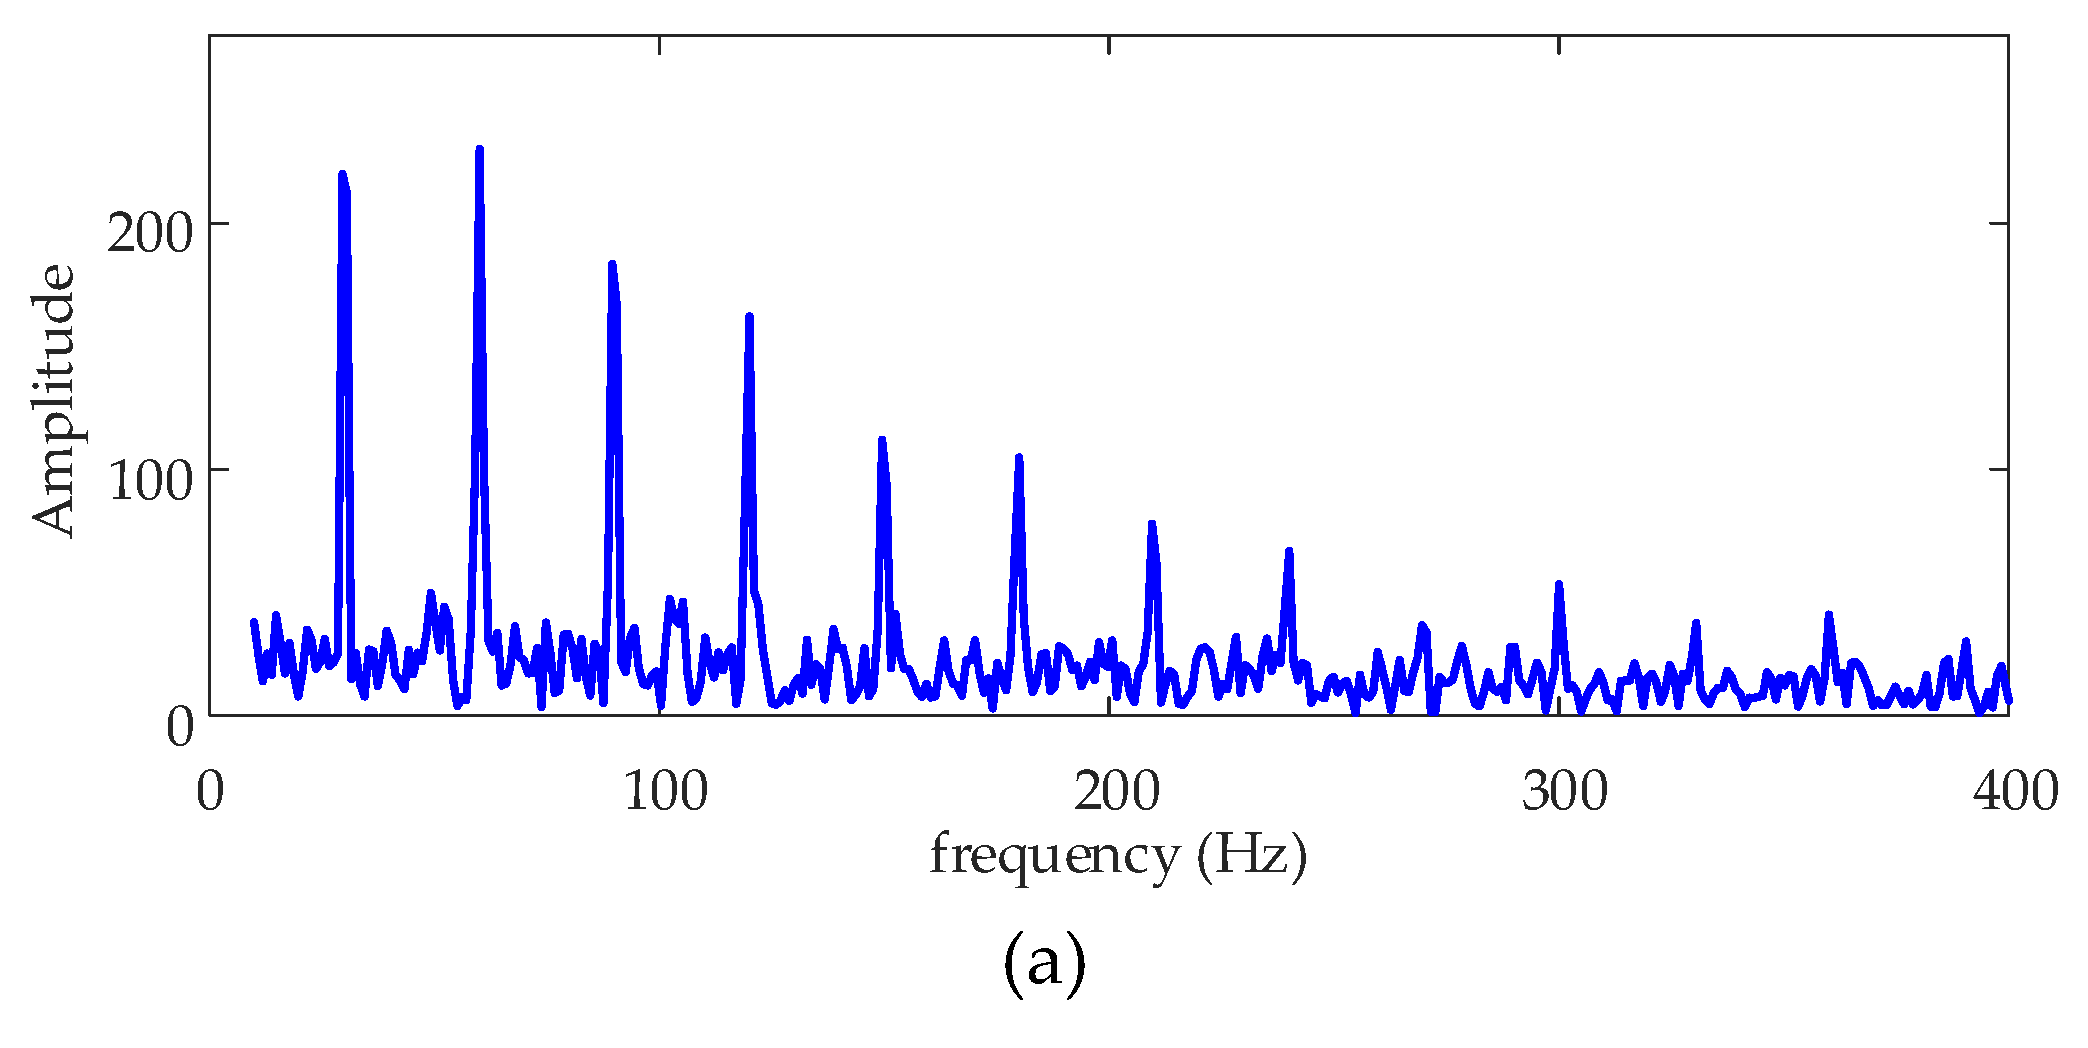
5.3. Analysis of center spring wear fault signal of fluid pressure based on the standard Autogram

The fault feature information on center spring wear is extracted by standard Autogram, and the colormap presentation based on the Equation (2) is shown in Figure 13.
The maximum kurtosis of 5.3 is assigned to the node (3, 1), with center frequency of 312.5 Hz and a bandwidth of 625 Hz. Thus, node (3, 1) is adopted as a data source for further investigation, and the no threshold spectrum, upper threshold spectrum, and lower threshold spectrum are displayed in Figure 14.
Figure 14 shows the fault feature information on center spring wear at fault feature frequency 24.5 Hz with most of its harmonics extracted. The amplitude values obtained based on no threshold processing in Figure 14a are much larger than those in Figure 14b,c, and they are larger than those of original center spring wear signal spectrum in Figure 12. It can be seen that Autogram is effective for extracting the information, and standard Autogram based on no threshold processing has the strongest extraction ability.

5.4. Analysis of center spring wear fault signal of fluid pressure based on Upper Autogram.

Upper Autogram is applied to extract the fault feature information, and the colormap presentation based on Equation (3) is shown in Figure 15.
In Figure 15, the maximum kurtosisu is 23.1, and it corresponds to the node (3, 2), with a center frequency of 937.5 Hz and a bandwidth of 625 Hz. Node (3, 2) is used as data source for further investigation, and the no threshold spectrum, upper threshold spectrum, and lower threshold spectrum are shown in Figure 16.
Figure 16c illustrates that the fault feature information at fault feature frequency 24.5 Hz and its harmonics are extracted. However, in Figure 16a,b, most harmonics are not extracted effectively, and there are many background noises. Thus, upper Autogram based on lower threshold processing has the strongest extraction ability.
Compared with standard Autogram based on no threshold processing in Figure 14a and original center spring wear signal in Figure 12, standard Autogram based on lower threshold processing is not so effective and has the weakest extraction ability.

5.5. Analysis of center spring wear fault signalof fluid pressurebased on Lower Autogram.

Extraction of the fault feature information is executed by lower Autogram, and the colormap presentation can be obtained based on Equation (4). It is illustrated in Figure 17.
In Figure 17, the maximum kurtosisl is 1.6, and it corresponds to node (3, 4), with a center frequency of 2187.5 Hz and a bandwidth of 625 Hz. Node (3, 4) is used as data source, and its no threshold spectrum, upper threshold spectrum, and lower threshold spectrum are demonstrated in Figure 18.
The fault feature information at fault feature frequency 24.5 Hz and most of its harmonics are not extracted in the three figures in Figure 18, and their amplitude values are smaller compared with those of original center spring wear signal in Figure 12. Thus, lower Autogram based on three kinds of threshold processing has very weak extraction ability.
Comparing with the standard Autogram result in Figure 14 and the upper Autogram result in Figure 16, lower Autogram has the weakest extraction ability, and it is influenced by background noises. Thus, standard Autogram has the strongest extraction ability and can extract the most fault feature information from the background noises.

5.6. Analysis of center spring wear fault signalof fluid pressure based on FK

In order to illustrate the validation and advantages of the Autogram, the signal is also analyzed by FK. Colormap presentation obtained based on FK is illustrated in Figure 19.
In Figure 19, the maximum kurtosis value is 1.6, and it corresponds to the node (1, 1), with a center frequency of 1230 Hz and a bandwidth of 2500 Hz. Thus, the node is used as a data source for further investigation. Its spectrum is shown in Figure 20.
Figure 20 signifies that the fault feature information at fault feature frequency 24.5 Hz and most of harmonics are extracted. However, compared with standard Autogram based on no threshold processing in Figure 14a and the original center spring wear in Figure 12, the amplitude values are very small (Figure 20).
The conclusion can be drawn from above that standard Autogram based on no threshold processing can extract the fault feature information on center spring wear successfully, and it performs better than FK in fault feature extraction ability.

6. Conclusions

Pressure fluctuation of hydraulic pump can be caused by the center spring wear fault, and the fault feature information of fluctuation is heavily influenced by fluid flow contamination. Aiming to resolve this problem, Autogram is applied to extract the fault feature information from the fluid pressure signal. The research results indicate that standard Autogram can extract more fault feature information on center spring wear than upper Autogram and lower Autogram, especially standard Autogram based on no threshold processing. Autogram also performs better than FK in extracting the fault feature information.

Author Contributions

Conceptualization, Z.Z.; Methodology, Z.Z.; Investigation, Z.Z. and X.L.; Writing-Original Draft Preparation, Z.Z.; Writing-Review and Editing, Y.Z. and Z.Z.

Funding

This research was funded by the Startup Foundation for the Doctors of North China University of Science and Technology (0088/28412499), the National Natural Science Foundation of China (51805214), and the China Postdoctoral Science Foundation (2019M651722).

Conflicts of Interest

The authors declare no conflict of interest.

References

  1. Qian, J.Y.; Chen, M.R.; Liu, X.; Jin, Z. A numerical investigation of the flow of nanofluids through a micro Tesla valve. J. Zhejiang. Univ. Sci. A 2019, 20, 50–60. [Google Scholar] [CrossRef]
  2. Qian, J.Y.; Gao, Z.X.; Liu, B.Z.; Jin, Z.J. Parametric study on fluid dynamics of pilot-control angle globe valve. ASME J. Fluids Eng. 2018, 140, 111103. [Google Scholar] [CrossRef]
  3. Zhang, J.; Xia, S.; Ye, S.; Xu, B.; Song, W.; Zhu, S.; Tang, H.; Xiang, J. Experimental investigation on the noise reduction of an axial piston pump using free-layer damping material treatment. Appl. Acoust. 2018, 139, 1–7. [Google Scholar] [CrossRef]
  4. Ye, S.G.; Zhang, J.H.; Xu, B.; Zhu, S.Q.; Xiang, J.W.; Hesheng, T. Theoretical investigation of the contributions of the excitation forces to the vibration of an axial piston pump. Mech. Syst. Signal. Pr. 2019, 129, 201–217. [Google Scholar] [CrossRef]
  5. Wang, C.; Chen, X.X.; Qiu, N.; Zhu, Y.; Shi, W.D. Numerical and experimental study on the pressure fluctuation, vibration, and noise of multistage pump with radial diffuser. J. Braz. Soc. Mech. Sci. 2018, 40. [Google Scholar] [CrossRef]
  6. Chen, T.; Chen, L.; Xu, X.; Cai, Y.F.; Jiang, H.B.; Sun, X.Q. Passive fault-tolerant path following control of autonomous distributed drive electric vehicle considering steering system fault. Mech. Syst. Signal Proc. 2019, 123, 298–315. [Google Scholar] [CrossRef]
  7. Mao, Y.X.; Liu, G.H.; Zhao, W.X.; Ji, J.H. Vibration prediction in fault-tolerant flux-switching permanent-magnet machine under healthy and faulty conditions. IET Electr. Power. Appl. 2017, 11, 19–28. [Google Scholar] [CrossRef]
  8. Zhu, Y.; Tang, S.; Quan, L.; Jiang, W.; Zhou, L. Extraction method for signal effective component based on extreme-point symmetric mode decomposition and Kullback-Leibler divergence. J. Braz. Soc. Mech. Sci. 2019, 41, 100. [Google Scholar] [CrossRef]
  9. Zhang, H.; Zhang, Y.; Liu, D.; Ji, Y.; Jiang, J.; Sun, Y. Research on MEMS sensor in hydraulic system flow detection. Proc. SPIE 2011, 7997. [Google Scholar] [CrossRef]
  10. Goharrizi, A.Y.; Sepehri, N. Internal leakage detection in hydraulic actuators using empirical mode decomposition and hilbert spectrum. IEEE Trans. Instrum. Meas. 2012, 61, 368–378. [Google Scholar] [CrossRef]
  11. Vásquez, S.; Kinnaert, M.; Pintelon, R. Active fault diagnosis on a hydraulic pitch system based on frequency-domain identification. IEEE Trans. Control Syst. Technol. 2017, 27, 1–16. [Google Scholar] [CrossRef]
  12. Tang, H.B.; Wu, Y.X.; Ma, C.X. Inner leakage fault diagnosis of hydraulic cylinder using wavelet energy. Adv. Mater. Res. 2011, 139–141, 2517–2521. [Google Scholar] [CrossRef]
  13. Xu, J.J.; Yang, S.Y.; Yuan, J. Fault diagnosis of wavelet packet neural network on pump valves of reciprocating pumps based on pressure signal. J. Dalian Marit. Univ. 2007, 33, 22–25. [Google Scholar]
  14. Guo, X.L.; Yang, K.L.; Guo, Y.X. Hydraulic pressure signal denoising using threshold self-learning wavelet algorithm. J. Hydrodyn. 2008, 20, 433–439. [Google Scholar] [CrossRef]
  15. You, Z.P.; Ye, X.P.; Zhang, W.H. Hydraulic system fault diagnosis method based on HPSO and WP-EE. Appl. Mech. Mater. 2014, 577, 438–442. [Google Scholar] [CrossRef]
  16. Li, S.; Zhang, C.H.; Shi, M. Neural network prediction model for ship hydraulic pressure signal under wind wave background. J. Shanghai Jiaotong Univ. 2015, 20, 224–227. [Google Scholar] [CrossRef]
  17. Desbiens, A.B.; Bigué, J.P.L.; Véronneau, C.; Masson, P.; Iagnemma, K.; Plante, J.S. On the potential of hydrogen-powered hydraulic pumps for soft robotics. Soft Robot. 2017, 4, 367–378. [Google Scholar] [CrossRef] [PubMed]
  18. Lee, M.C.; Chung, S.H.; Cho, J.H.; Chung, S.T.; Kwon, Y.S.; Kim, J.H.; Joun, M.S. Three-dimensional finite element analysis of powder compaction process for forming cylinder block of hydraulic pump. Powder Metall. 2013, 51, 89–94. [Google Scholar] [CrossRef]
  19. Yin, F.; Nie, S.L.; Ji, H.; Huang, Y.Q. Non-probabilistic reliability analysis and design optimization for valve-port plate pair of seawater hydraulic pump for underwater apparatus. Ocean. Eng. 2018, 163, 337–347. [Google Scholar] [CrossRef]
  20. Wu, D.; Liu, Y.; Li, D.; Zhao, X.; Li, C. Effect of materials on the noise of a water hydraulic pump used in submersible. Ocean. Eng. 2017, 131, 107–113. [Google Scholar] [CrossRef]
  21. Xie, F.; Rui, X.; Gang, S.; Cuntang, W. Flow characteristics of accelerating pump in hydraulic-type wind power generation system under different wind speeds. Int. J. Adv. Manuf. Technol. 2017, 92, 189–196. [Google Scholar]
  22. Wang, Y.; Li, H.G.; Ye, P. Fault feature extraction of hydraulic pump based on CNC de-noising and HHT. J. Fail. Anal. Prev. 2015, 15, 139–151. [Google Scholar] [CrossRef]
  23. Li, H.; Sun, J.; Ma, H.; Tian, Z.; Li, Y. A novel method based upon modified composite spectrum and relative entropy for degradation feature extraction of hydraulic pump. Mech. Syst. Signal. Process. 2019, 114, 399–412. [Google Scholar] [CrossRef]
  24. Leandro, W.; Richard, M.C.; Lais, M.L.; Luiz, F.F.I.; Elvys, I.M.C.; Luan, d.C.C. Didactic system of supervision and data acquisition to evaluate the performance of hydraulic pumps. IEEE Lat. Am. Trans. 2018, 16, 1113–1120. [Google Scholar]
  25. Zhang, Z.C.; Chen, H.X.; Ma, Z.; Wei, Q.; He, J.-W.; Liu, H.; Liu, C. Application of the hybrid RANS/LES method on the hydraulic dynamic performance of centrifugal pumps. J. Hydrodyn. 2019, 31, 637–640. [Google Scholar] [CrossRef]
  26. Sun, J.; Li, H.R.; Xu, B.H. Prognostic for hydraulic pump based upon DCT-composite spectrum and the modified echo state network. Springerplus 2016, 5, 1293. [Google Scholar] [CrossRef] [PubMed] [Green Version]
  27. Sun, J.; Li, H.R.; Wang, W.G.; Xu, B.-H. Degradation feature extraction of hydraulic pump based on morphological undecimated decomposition fusion and DCT high order singular entropy. J. Vib. Shock. 2015, 34. [Google Scholar] [CrossRef]
  28. Tian, Y.; Lu, C.; Wang, Z.L. Approach for hydraulic pump fault diagnosis based on WPT-SVD and SVM. Appl. Mech. Mater. 2015, 764–765, 191–197. [Google Scholar] [CrossRef]
  29. Lu, C.; Wang, S.P.; Wang, X.J. A multi-source information fusion fault diagnosis for aviation hydraulic pump based on the new evidence similarity distance. Aerosp. Sci. Technol. 2017, 71, 392–401. [Google Scholar] [CrossRef]
  30. Zhang, T.X.; He, D. A reliability-based robust design method for the sealing of slipper-swash plate friction pair in hydraulic piston pump. IEEE Trans. Rel. 2018, 67, 1–11. [Google Scholar] [CrossRef]
  31. Sun, H.; Yuan, S.Q.; Luo, Y. Cyclic Spectral Analysis of Vibration Signals for Centrifugal Pump Fault Characterization. IEEE Sens. J. 2018, 18, 2925–2933. [Google Scholar] [CrossRef]
  32. Zhu, Y.; Qian, P.; Tang, S.; Jiang, W.; Li, W.; Zhao, J. Amplitude-frequency characteristics analysis for vertical vibration of hydraulic AGC system under nonlinear action. AIP Adv. 2019, 9, 035019. [Google Scholar] [CrossRef] [Green Version]
  33. Zhou, H.W.; Liu, G.H.; Zhao, W.X.; Yu, X.D.; Gao, M.H. Dynamic Performance Improvement of Five-Phase Permanent-Magnet Motor with Short-Circuit Fault. IEEE Trans. Ind. Electron. 2018, 65, 145–155. [Google Scholar] [CrossRef]
  34. Moshrefzadeh, A.; Fasana, A. The Autogram: An effective approach for selecting the optimal demodulation band in rolling element bearings diagnosis. Mech. Syst. Signal. Process. 2018, 105, 294–318. [Google Scholar] [CrossRef]
  35. Walden, A.T. Wavelet analysis of discrete time series. Eur. Cong. Math. 2001, 202, 627–641. [Google Scholar]
  36. Jerome, A. Fast computation of the kurtogram for the detection of transient faults. Mech. Syst. Signal. Process. 2007, 21, 108–124. [Google Scholar]
  37. Jiang, W.; Zheng, Z.; Zhu, Y.; Li, Y. Demodulation for hydraulic pump fault signals based on local mean decomposition and improved adaptive multiscale morphology analysis. Mech. Syst. Signal. Process. 2015, 58–59, 179–205. [Google Scholar] [CrossRef]
Figure 1. The flowchart of the proposed method.
Processes 07 00695 g001
Figure 2. Spectrum of the simulated signal.
Processes 07 00695 g002
Figure 3. Colormap presentation of the simulated signal based on standard Autogram.
Processes 07 00695 g003
Figure 4. Spectrums of the simulated signal data source node (1, 1) based on standard Autogram. (a) No threshold spectrum; (b) Upper threshold spectrum; (c) Lower threshold spectrum.
Processes 07 00695 g004aProcesses 07 00695 g004b
Figure 5. Colormap presentation of the simulated signal based on upper Autogram.
Processes 07 00695 g005
Figure 6. Spectrums of the simulated signal data source node (1, 1) based on upper Autogram. (a) No threshold spectrum; (b) Upper threshold spectrum; (c) Lower threshold spectrum.
Processes 07 00695 g006
Figure 7. Colormap presentation of the simulated signal based on Lower Autogram.
Processes 07 00695 g007
Figure 8. Spectrums of the simulated signal data source node (2, 1) based on lower Autogram. (a) No threshold spectrum; (b) Upper threshold spectrum; (c) Lower threshold spectrum.
Processes 07 00695 g008
Figure 9. Spectrums of the simulated signal based on FK.
Processes 07 00695 g009
Figure 10. Spectrums of the simulated signal data source sub-signal based on FK.
Processes 07 00695 g010
Figure 11. Swashplate axial plunger pump experiment systems. (a) Schematic diagram; (b) Swashplate axial plunger pump; (c) Data acquisition equipment; (d) Invalidation spring and the normal spring.
Processes 07 00695 g011
Figure 12. Spectrum of the center spring wear fault signal.
Processes 07 00695 g012
Figure 13. Colormap presentation of the center spring wear fault signal based on standard Autogram.
Processes 07 00695 g013
Figure 14. Spectrums of the center spring wear fault data source node (3, 1) based on standard Autogram. (a) No threshold spectrum; (b) Upper threshold spectrum; (c) Lower threshold spectrum.
Processes 07 00695 g014aProcesses 07 00695 g014b
Figure 15. Colormap presentation of the center spring wear fault signal based on Upper Autogram.
Processes 07 00695 g015
Figure 16. Spectrums of the center spring wear fault data source node (3, 2) based on upper Autogram. (a) No threshold spectrum; (b) Upper threshold spectrum; (c) Lower threshold spectrum.
Processes 07 00695 g016
Figure 17. Colormap presentation of the center spring wear fault signal based on lower Autogram.
Processes 07 00695 g017
Figure 18. Spectrums of the center spring wear fault data source node (3, 4) based on lower Autogram. (a) No threshold spectrum; (b) Upper threshold spectrum; (c) Lower threshold spectrum.
Processes 07 00695 g018
Figure 19. Colormap presentation of the center spring wear fault signal based on FK.
Processes 07 00695 g019
Figure 20. Spectrums of the center spring wear fault data source node (1, 1) based on FK.
Processes 07 00695 g020

