Simulation and Experimental Study of a Single Fixed-Bed Model of Nitrogen Gas Generator Working by Pressure Swing Adsorption

 ,
,
Abstract
:1. Introduction
2. The Model and Theoretical Basis
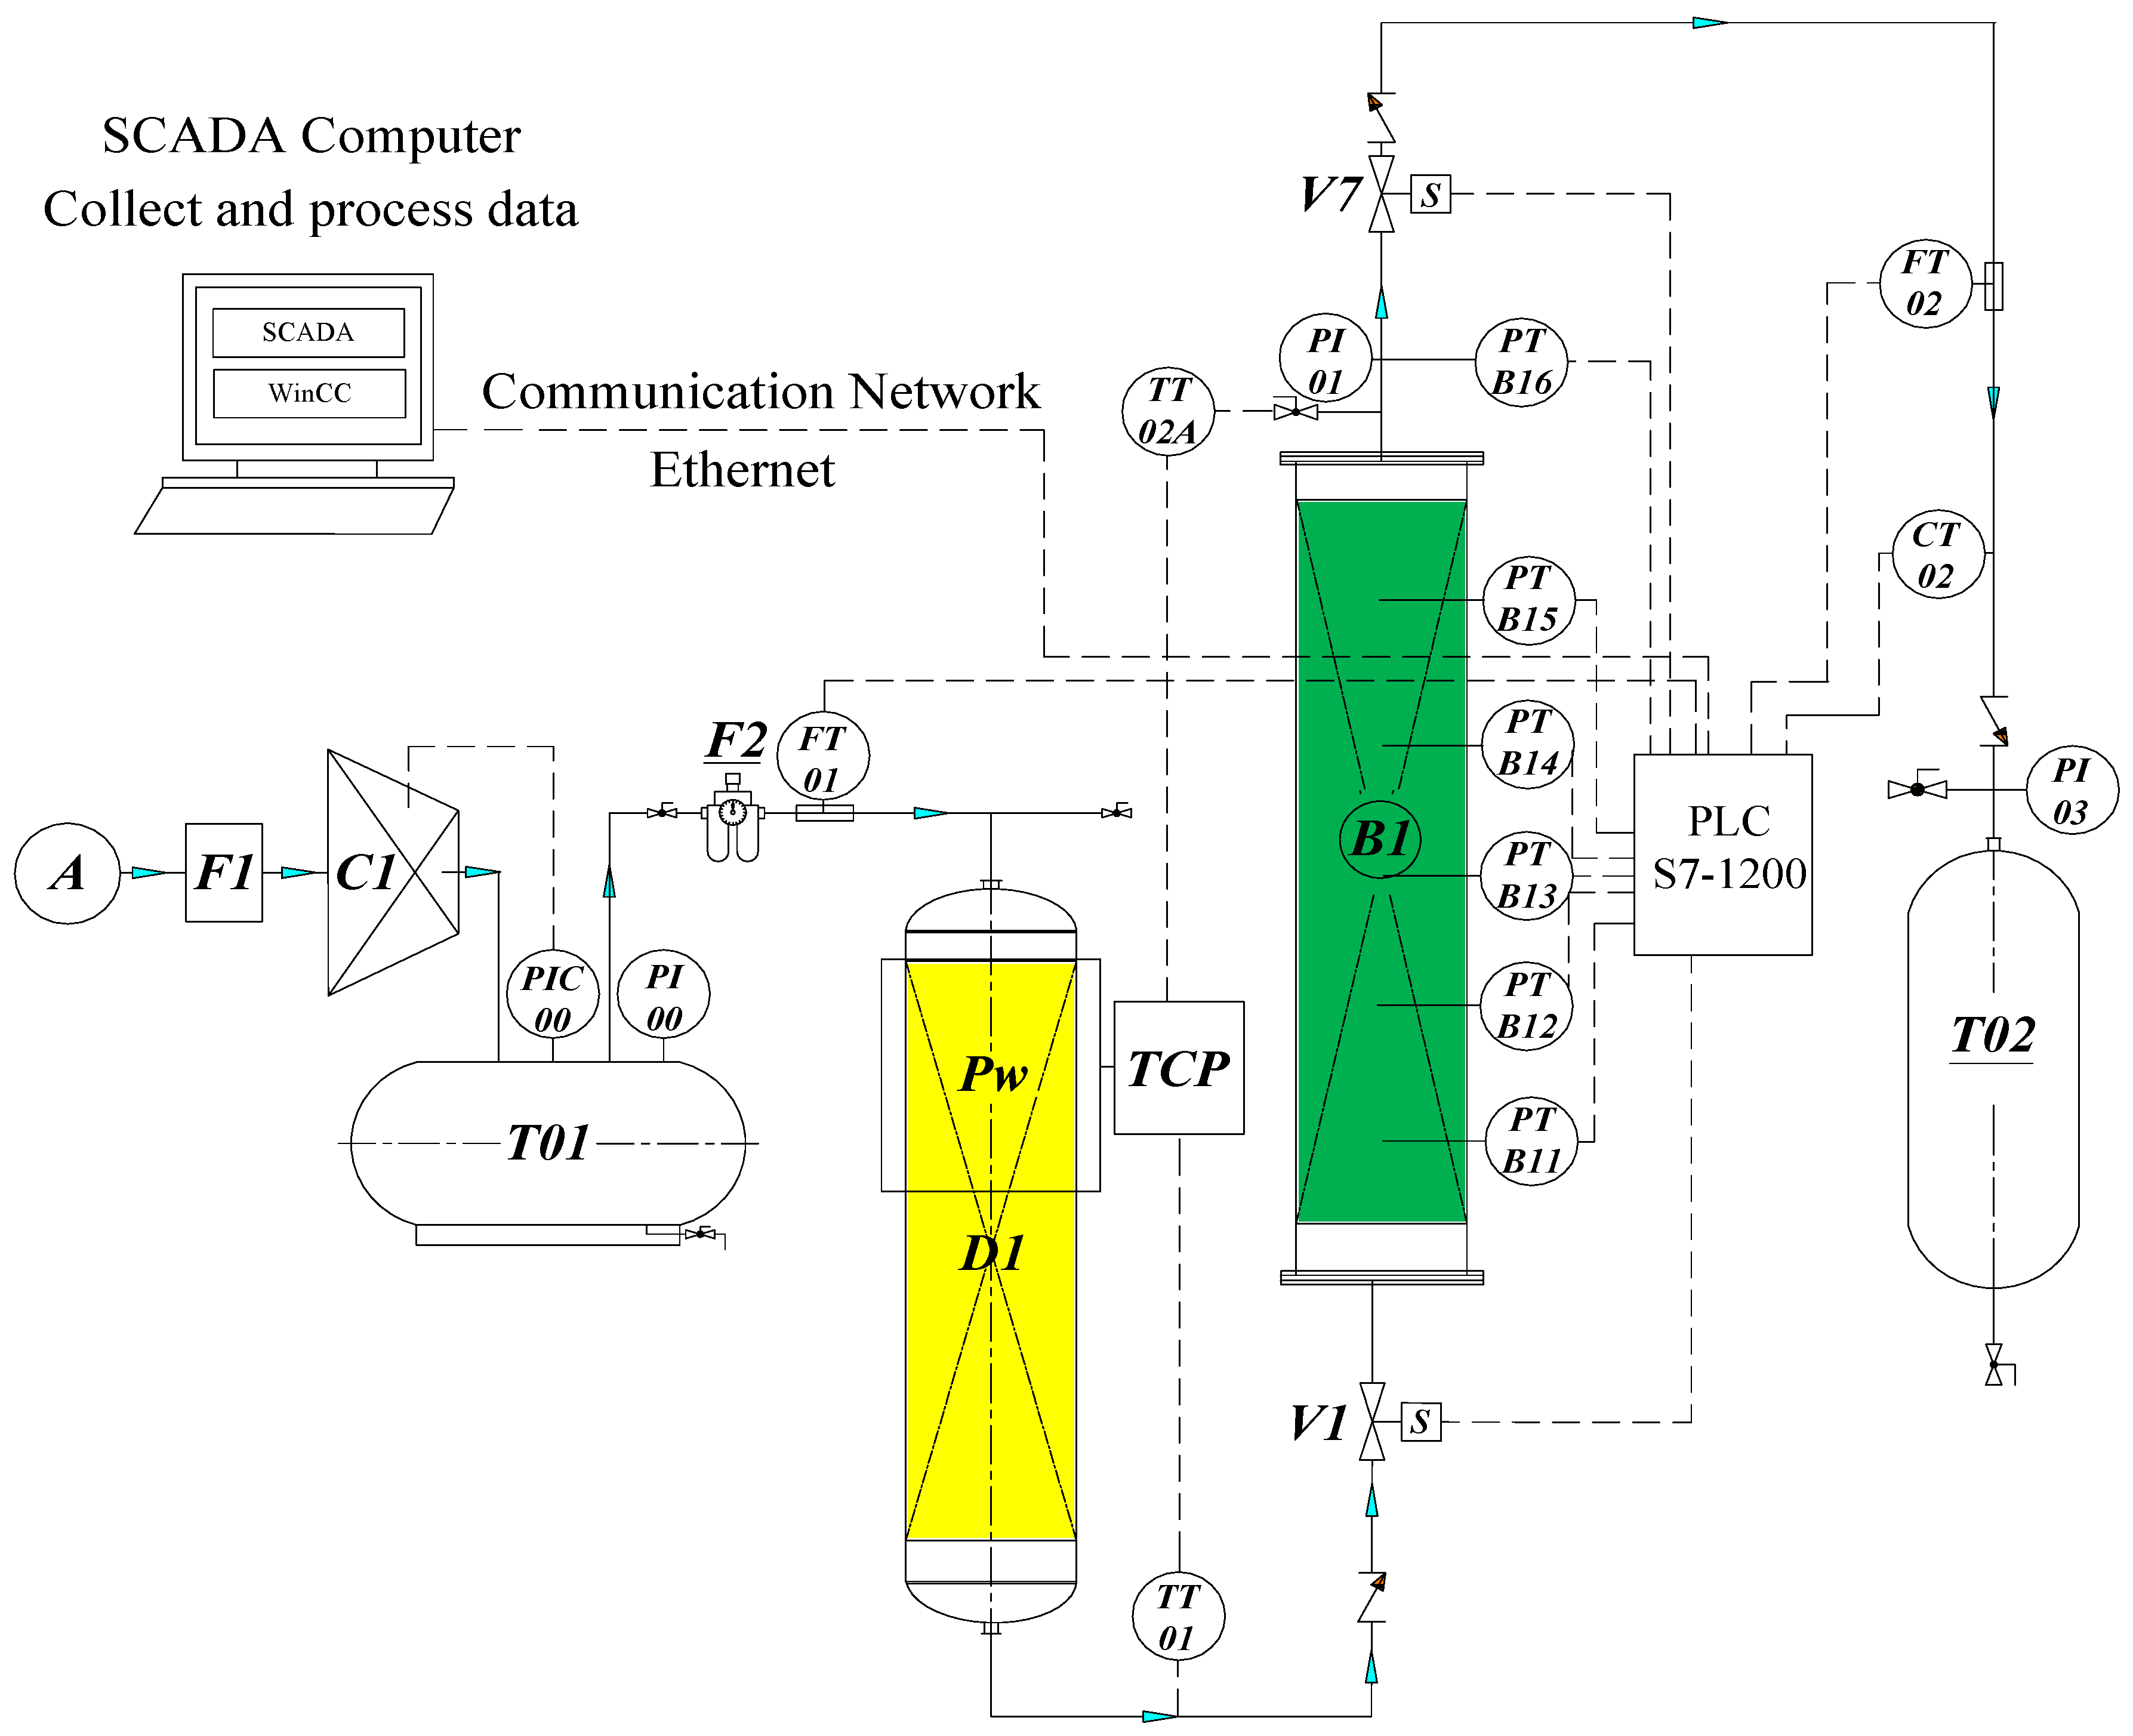
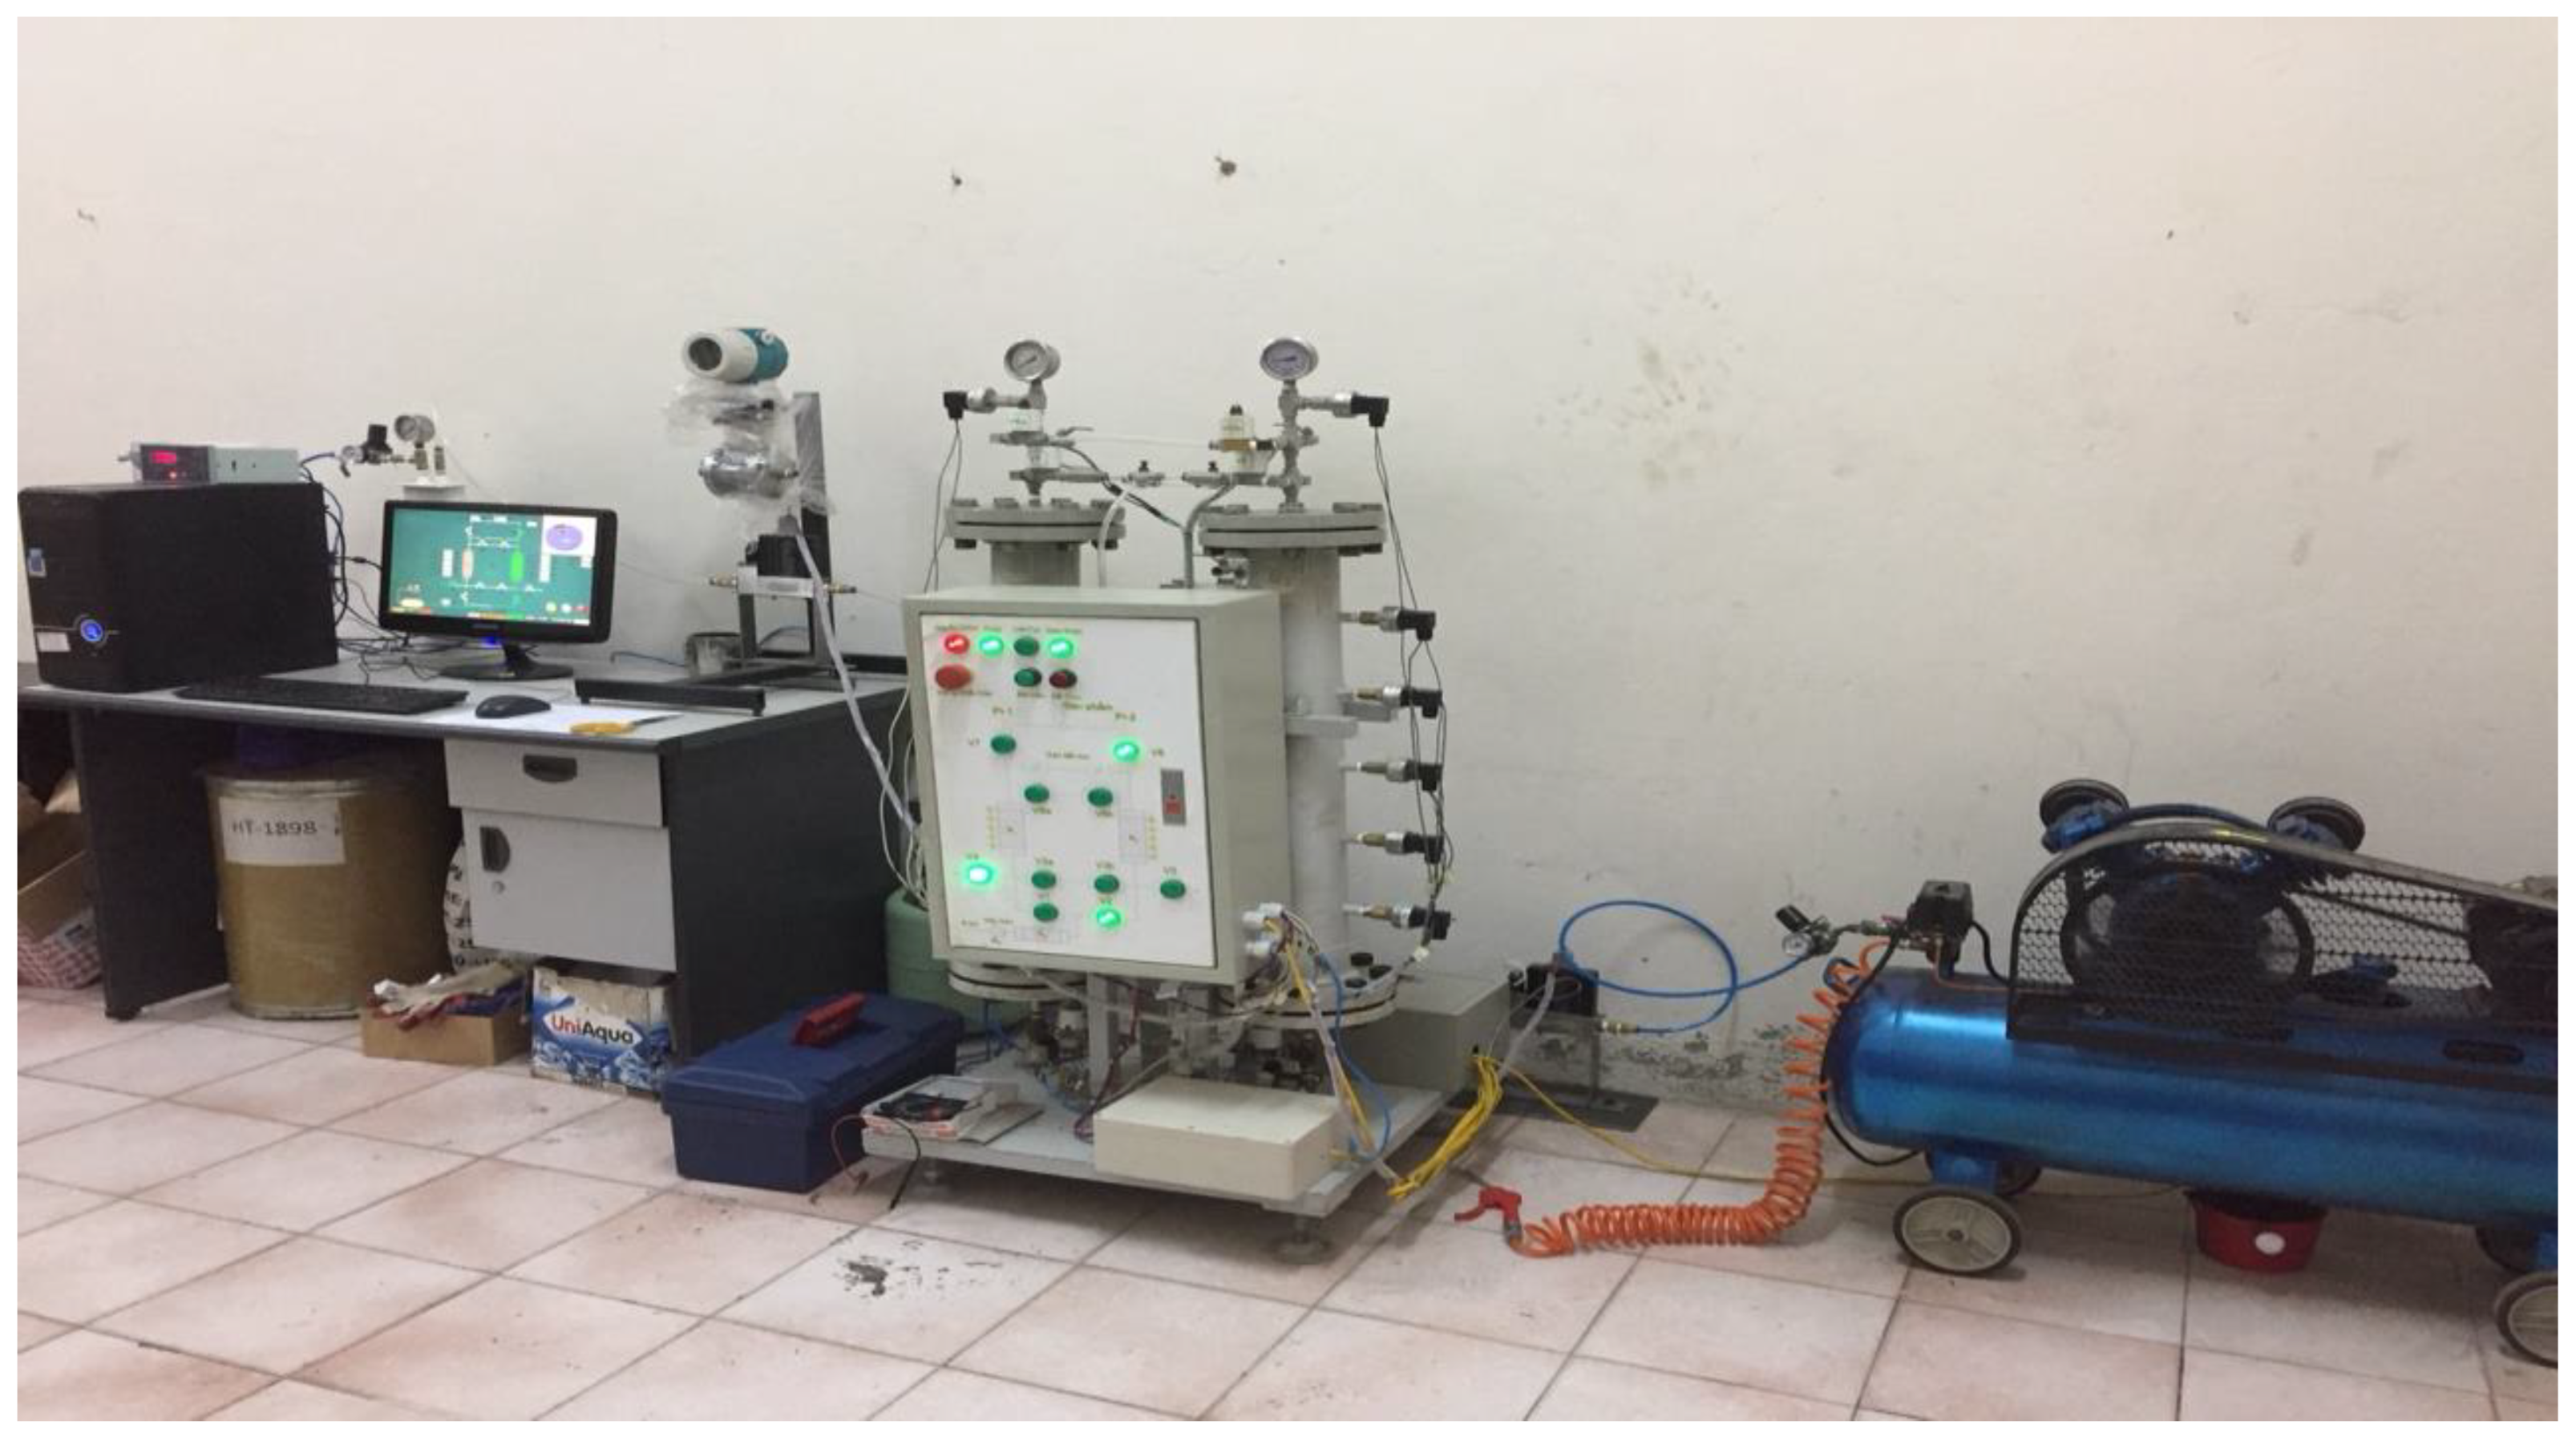
2.1. The Model
- -
- F1-primary filter; C1—piston compressor; T01—compressed air tank; D1—column of silica gel to remove water steam; F2—secondary filter;
- -
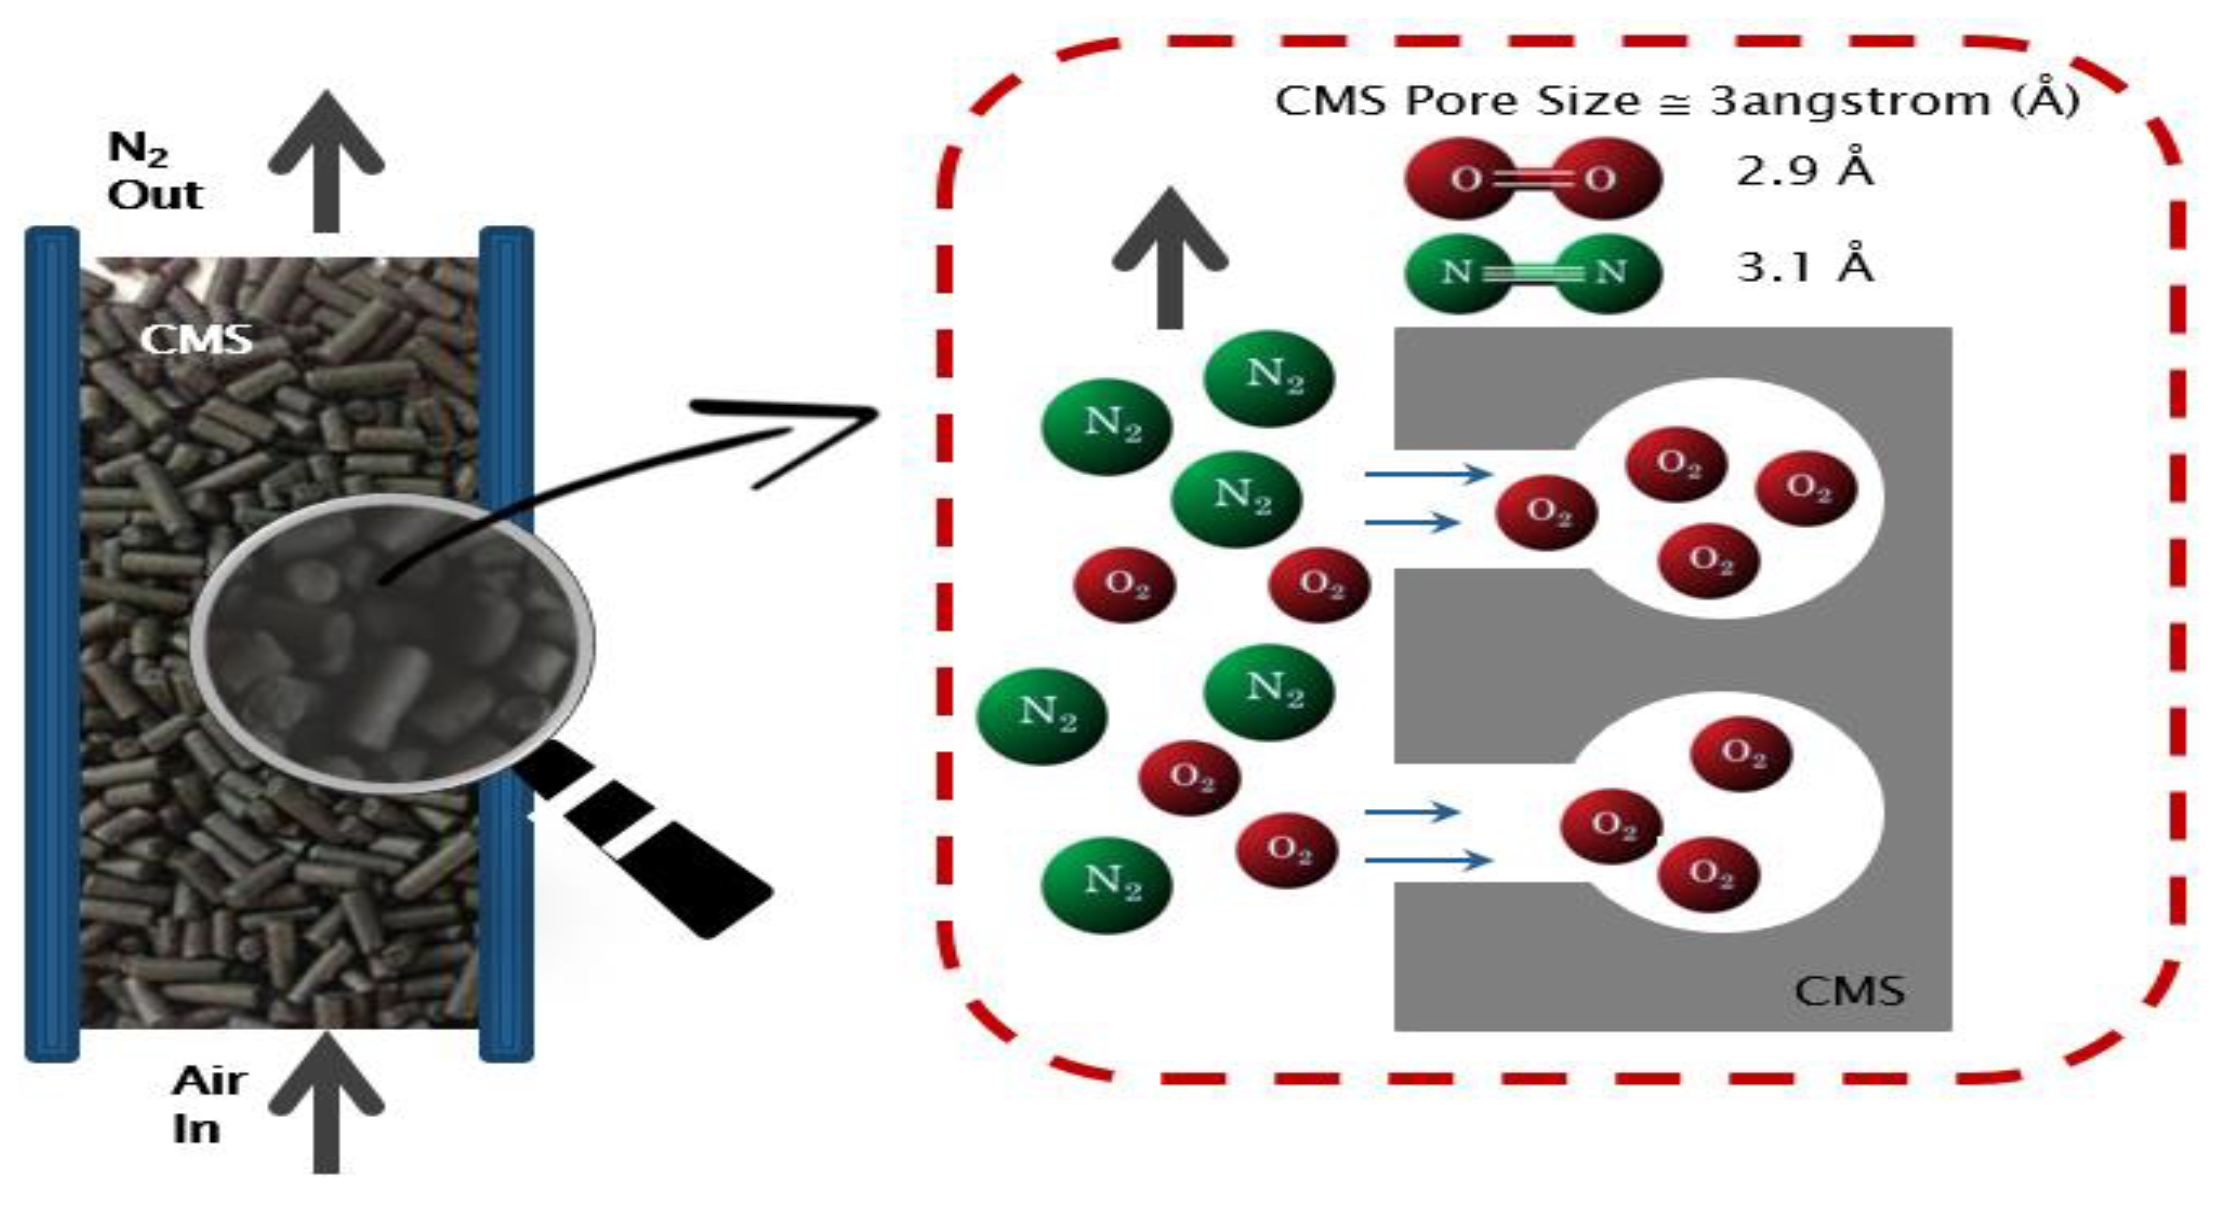
- B1-adsorption column (D × H = 102 × 950 mm) contains 3.5 kg CMS-240; T02-N2 gas product tank;
- -
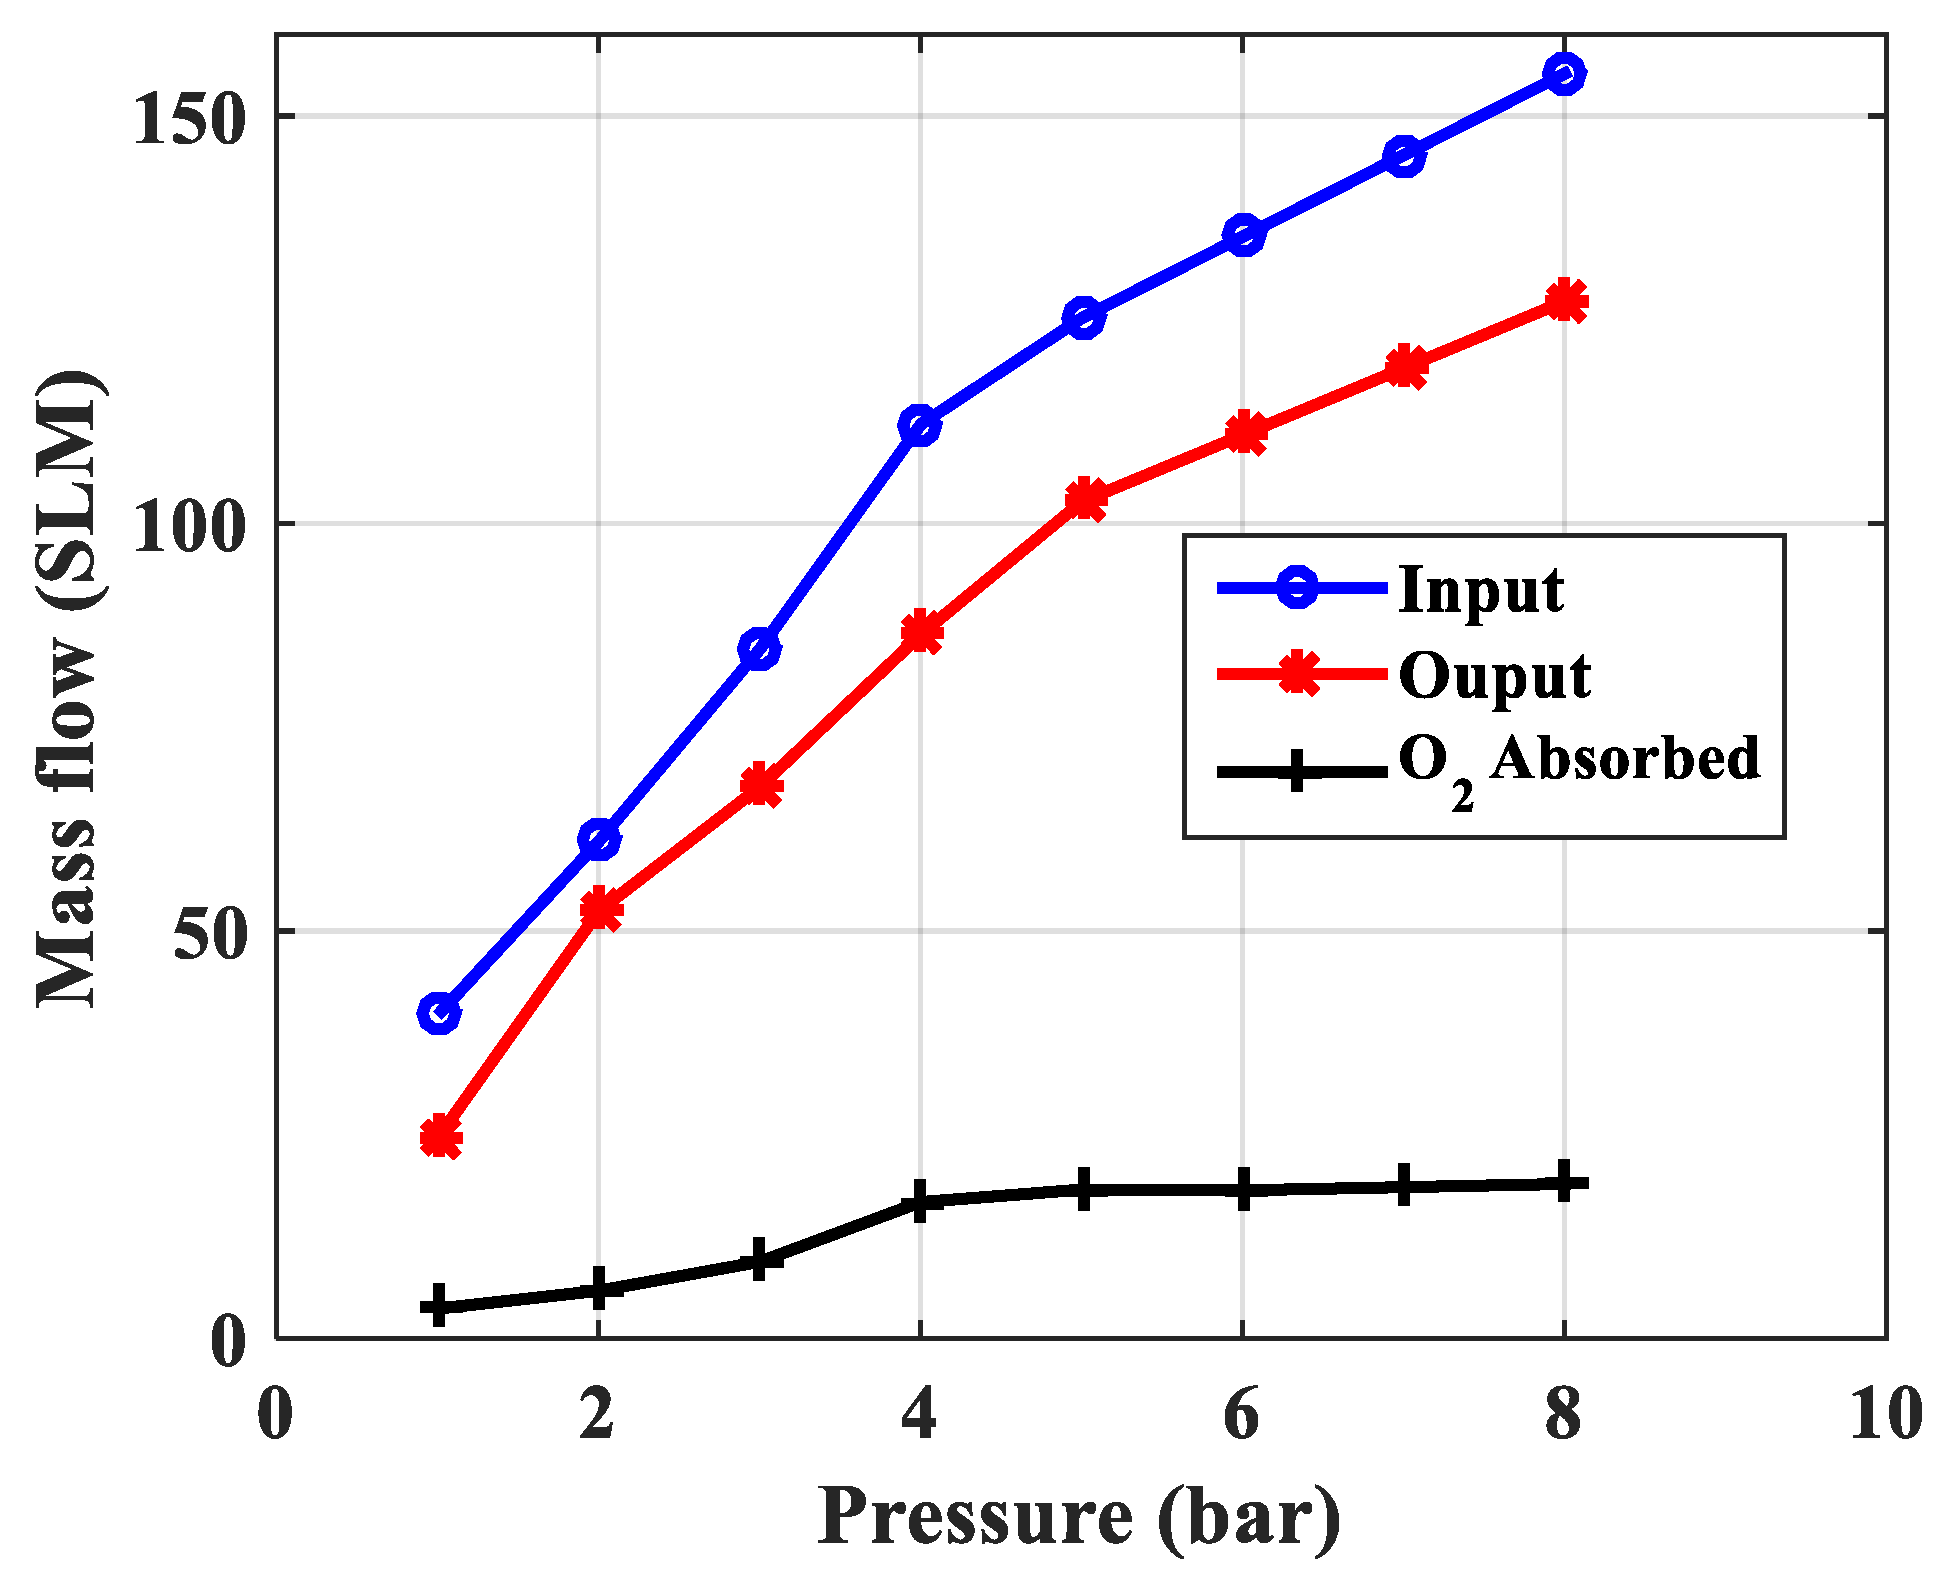
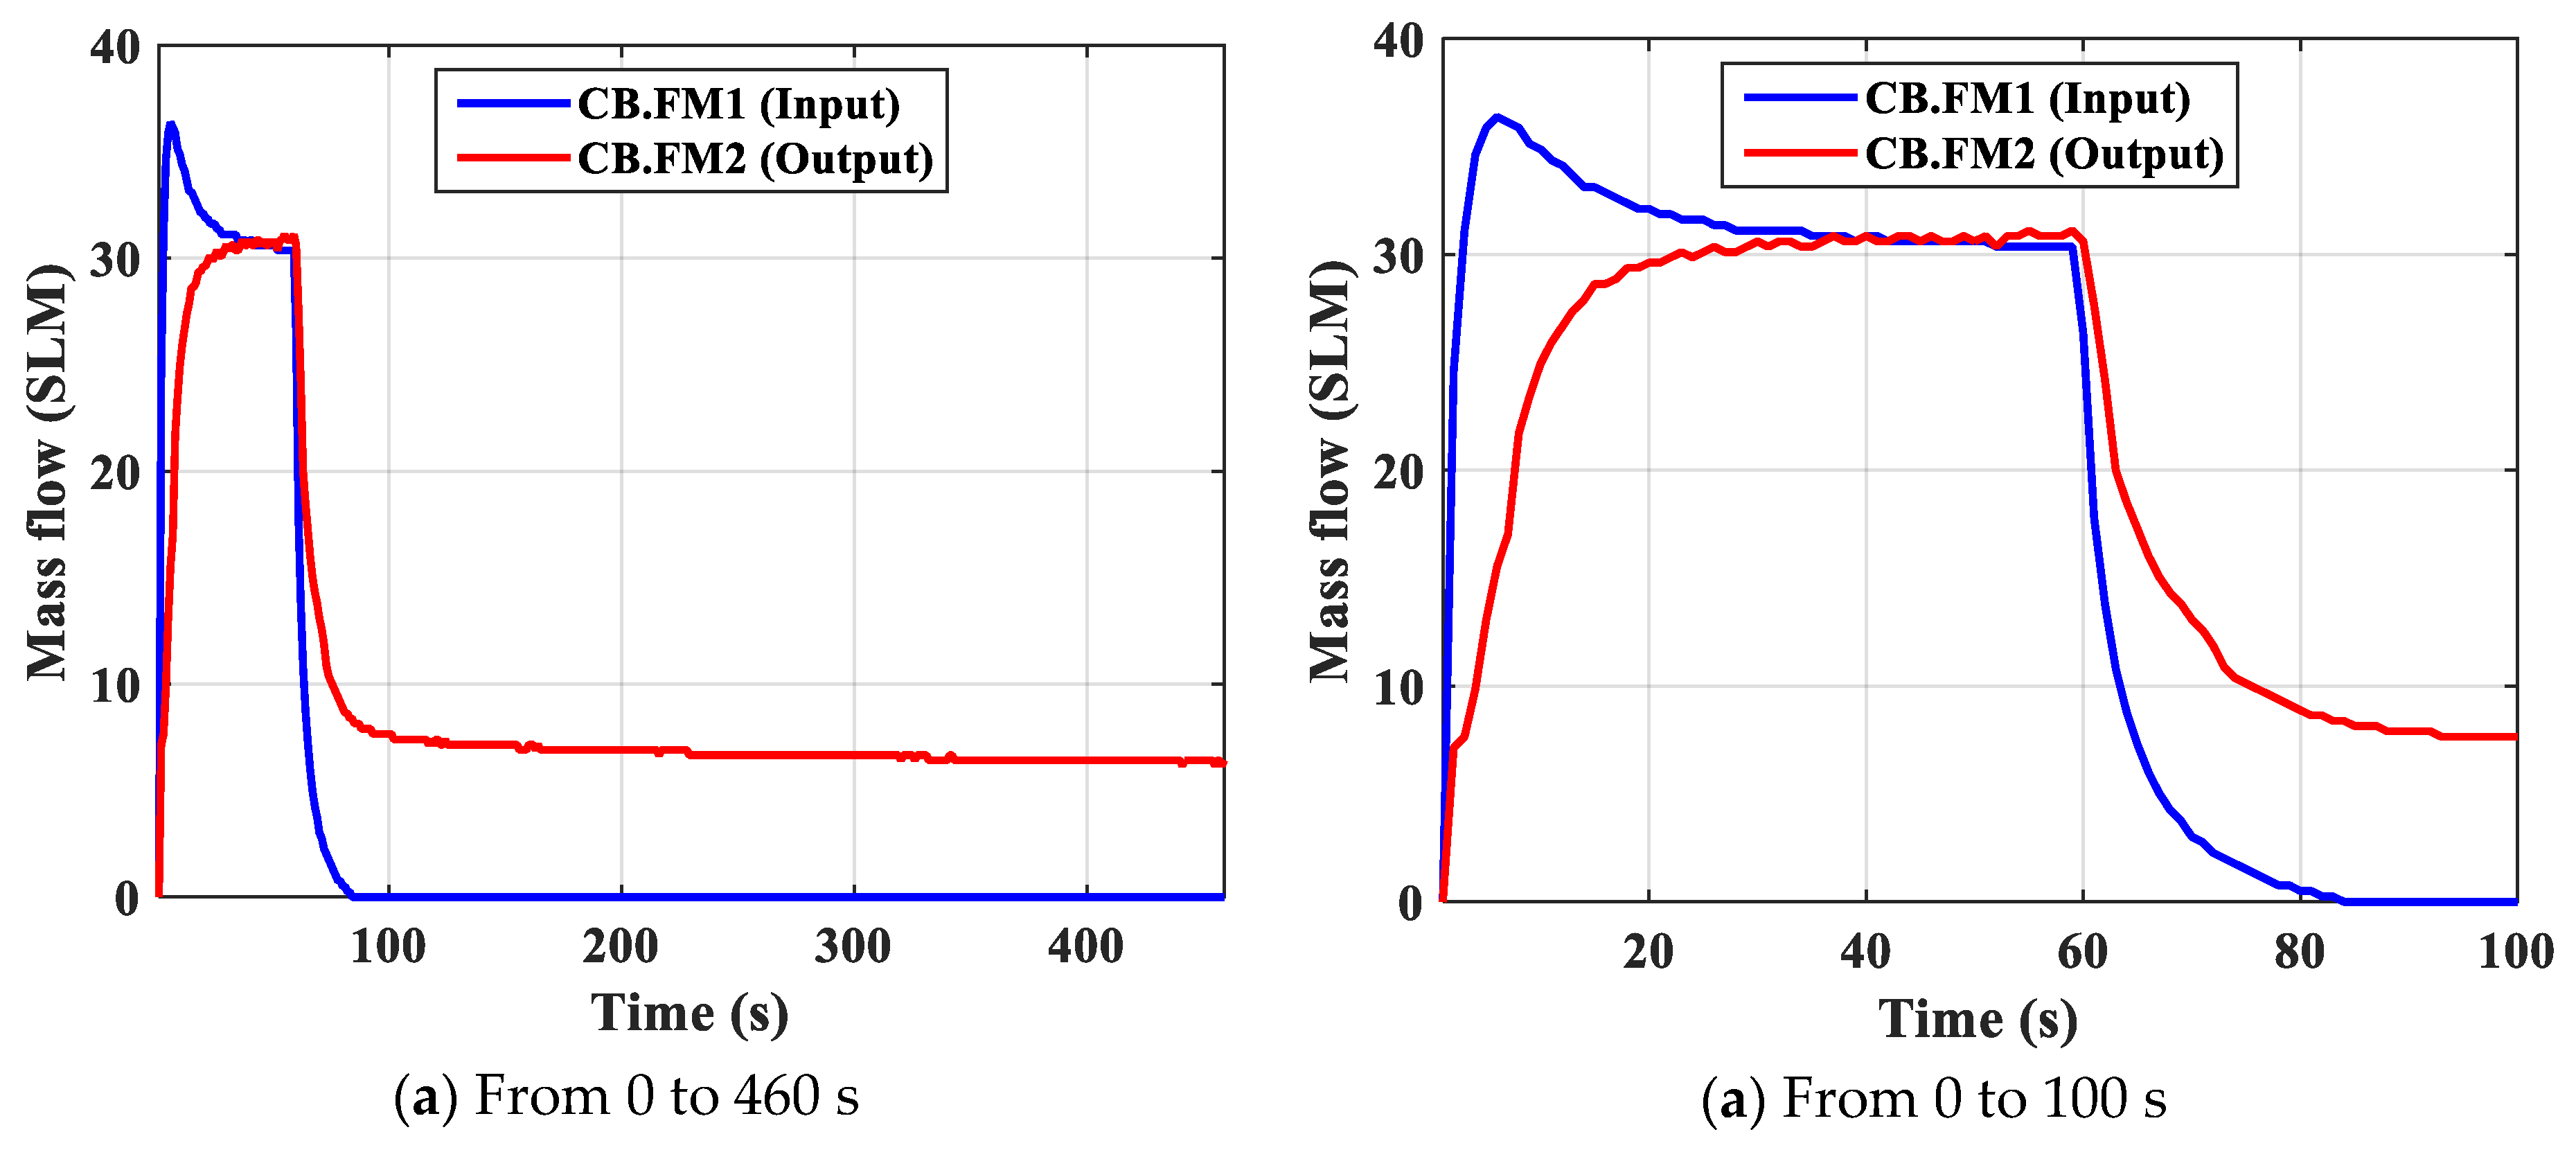
- FM01—mass flow sensor to measure gas feed; FM02—mass flow sensor to measure N2 gas product with the purpose of measuring the change of flow over time and determine the amount of adsorption is an important parameter showing the adsorption capacity of the material.
- -
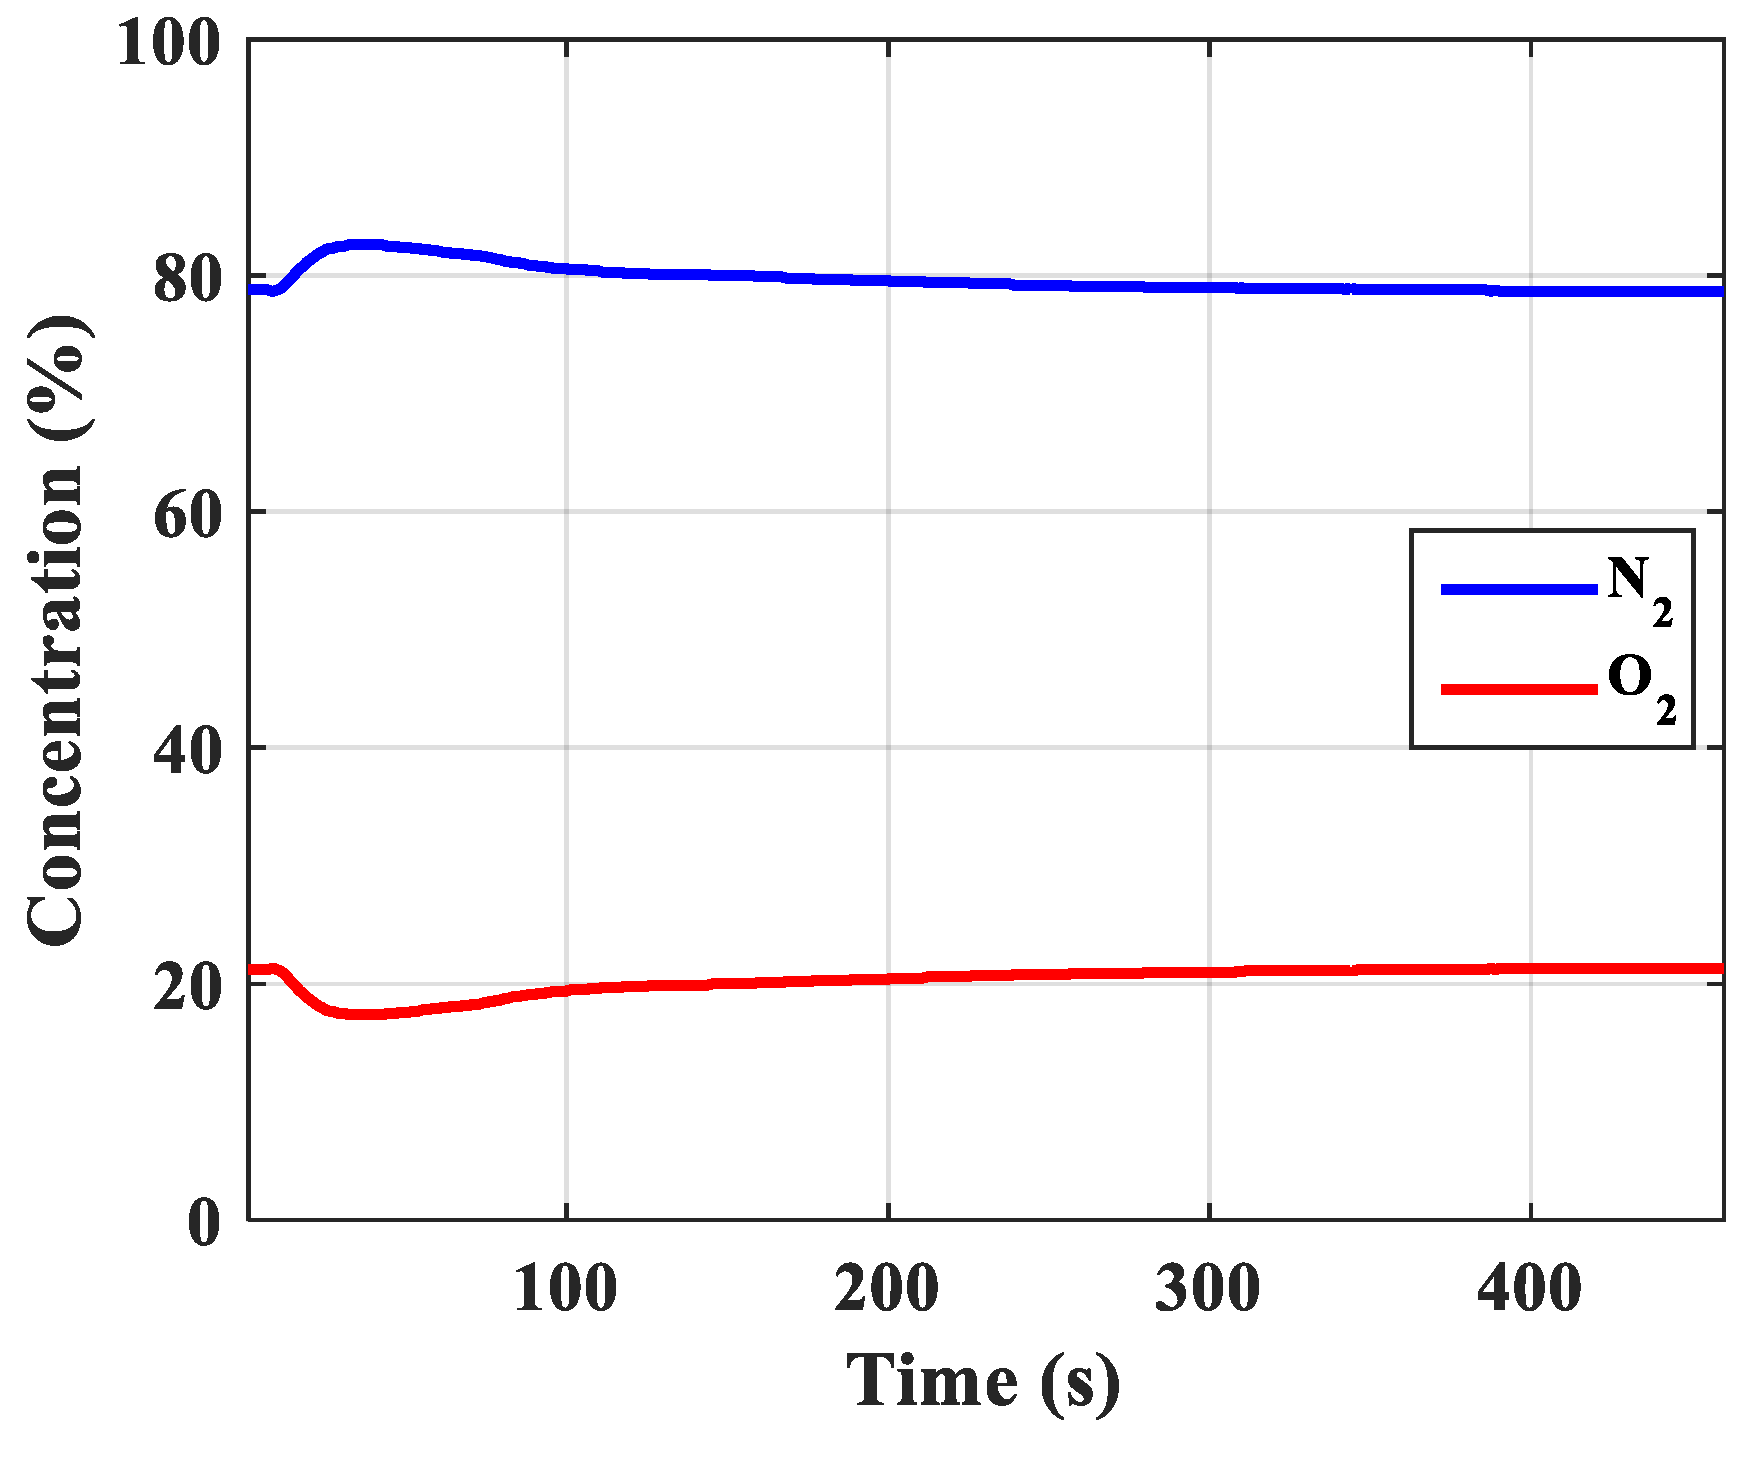
- CT02—nitrogen gas concentration sensor to measure nitrogen gas concentration output with the purpose of measuring the change in gas concentration N2 at the output of the column over time and pressurization time, adsorption time, discharge pressure time, and desorption time.
- -
- TT01, TT02—temperature sensors to measure the input/output temperature of a single fixed bed model to determine the temperature difference through the column.
- -
- PT-01/06: six pressure sensors installed according to the bed height (10 cm/1 sensor), and the purpose is to measure the pressure change according to the height of the bed and over time. These sensors are deeply inserted into the center of the bed to measure the different pressure between absorbent layers (fitting at the edge of the column will be no difference in pressure).
- -
- The V1 and V7 control valves (on/off; normal close), according to the settings and measurement parameters, are transmitted to S7-1200 PLC computer and recorded on the computer with control monitoring by SCADA interface programmed by WinCC V14.
2.2. The Theoretical Basis
- +
- Survey 1 column with different pressures to achieve the highest concentration of N2 gas with hypothetical pressure, adsorption and desorption time to determine the real-time parameters and best working conditions of the column.
- +
- Determining the optimal working mode of the column.
3. Calculation and Simulation Results
4. Experiment Results and Discussions
- +
- Temperature: the temperature is considered constant
- +
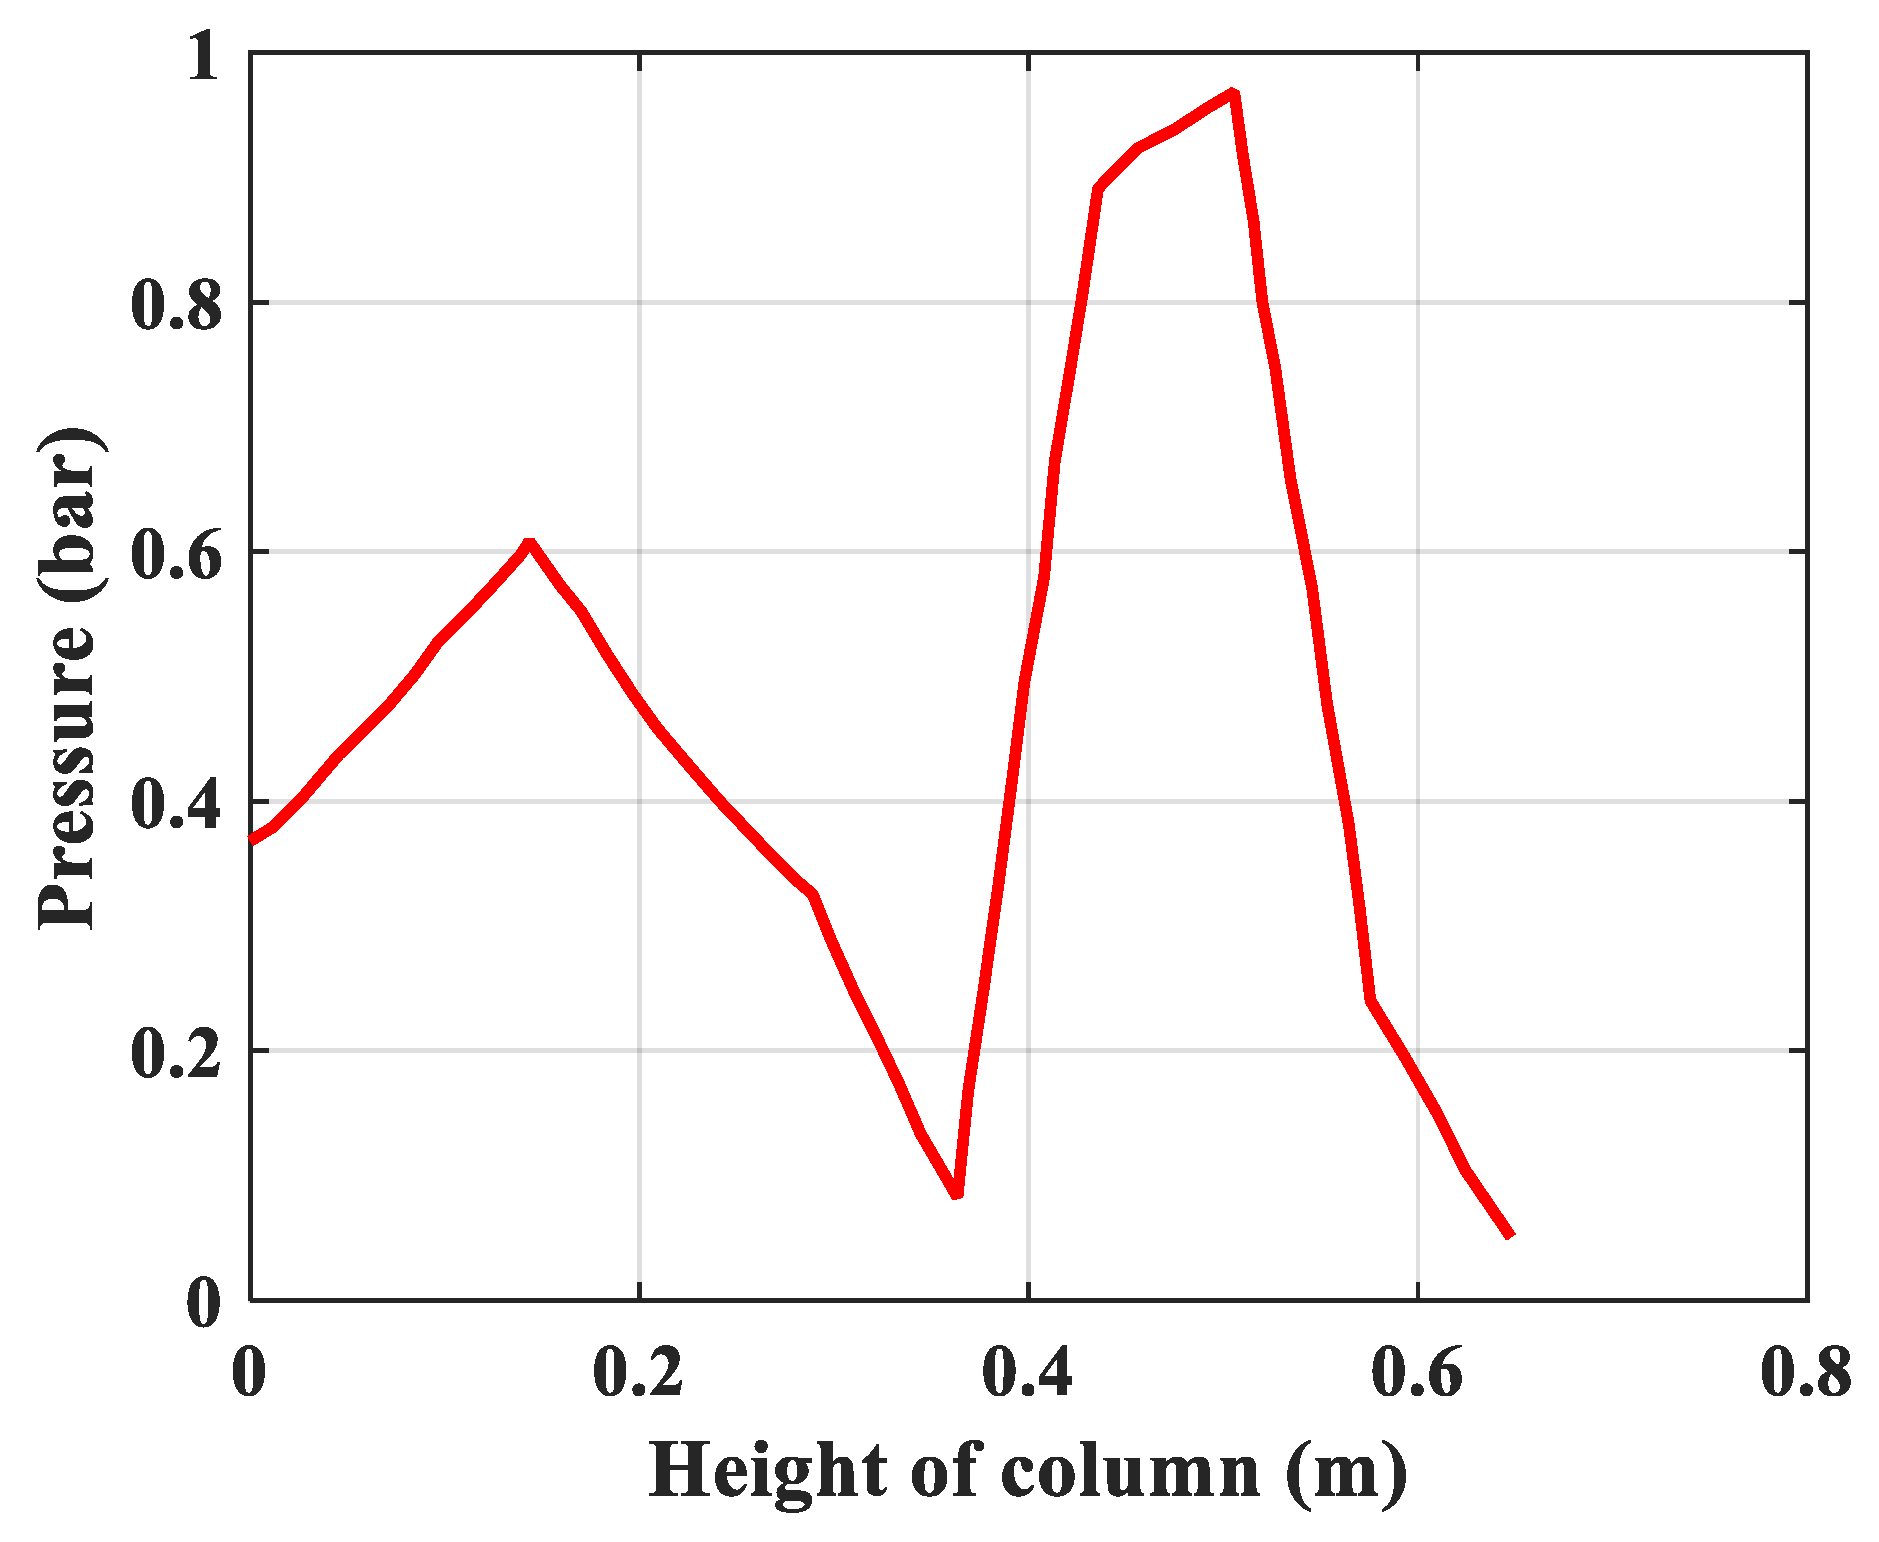
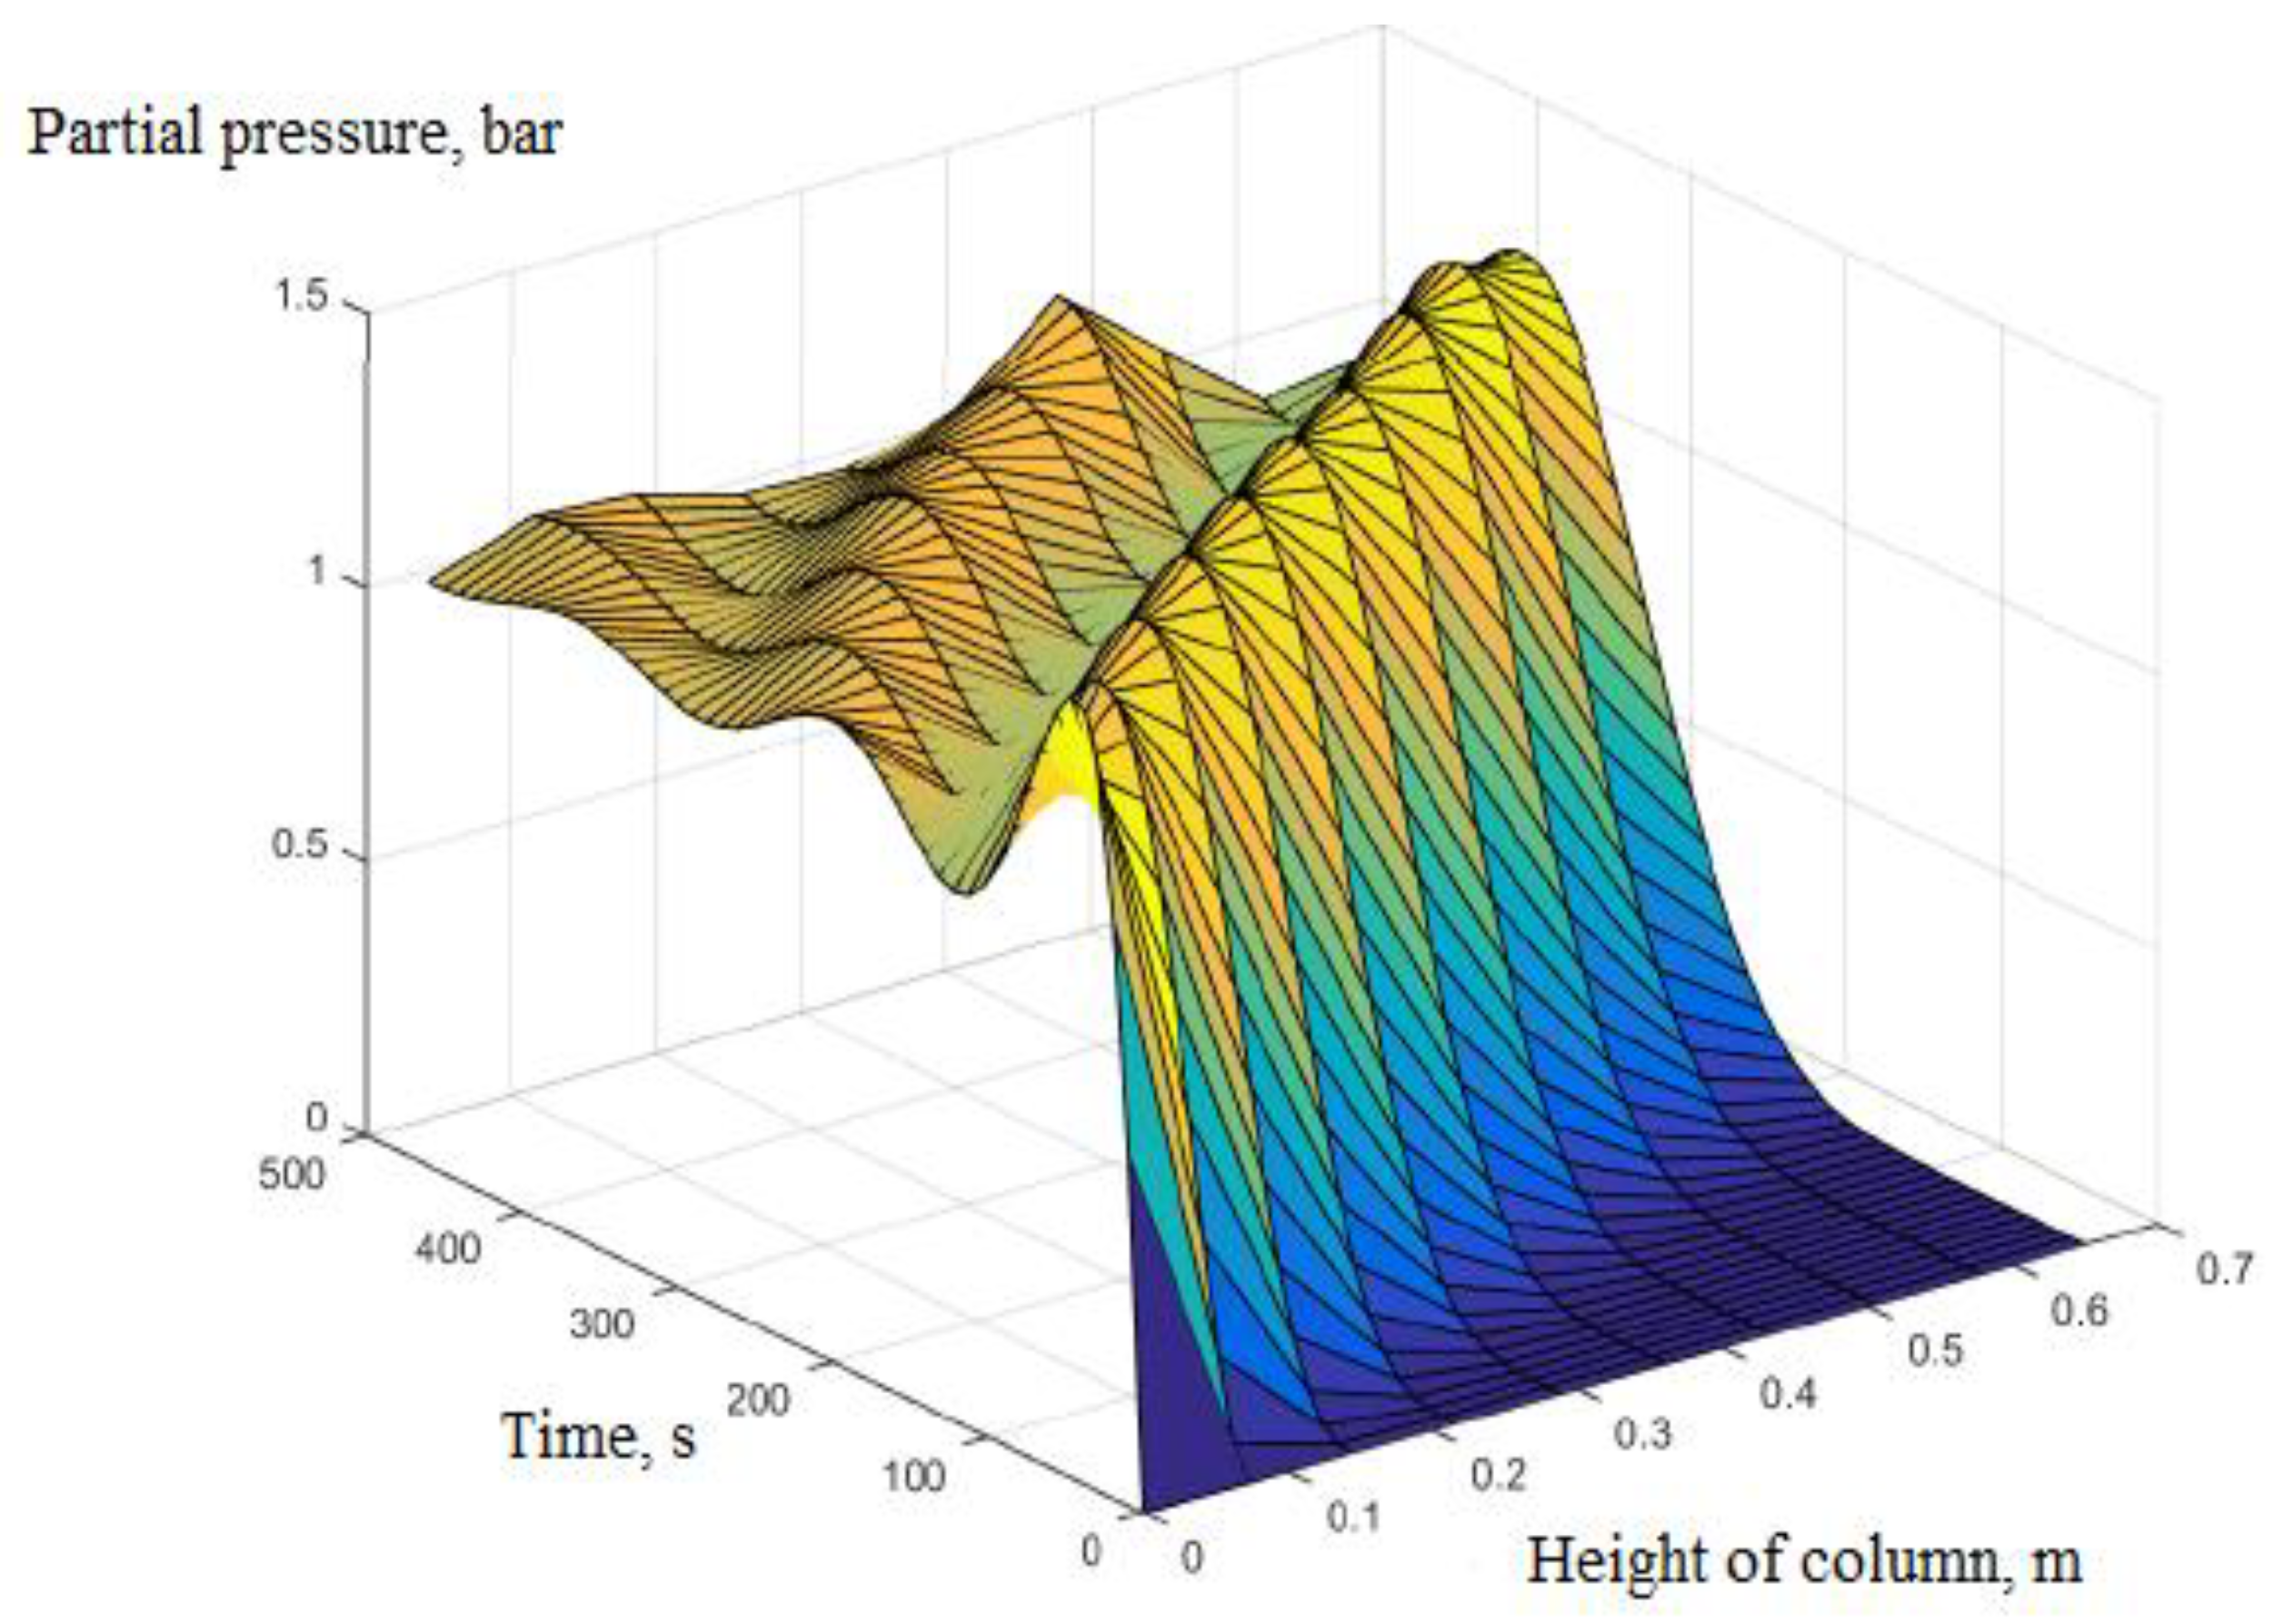
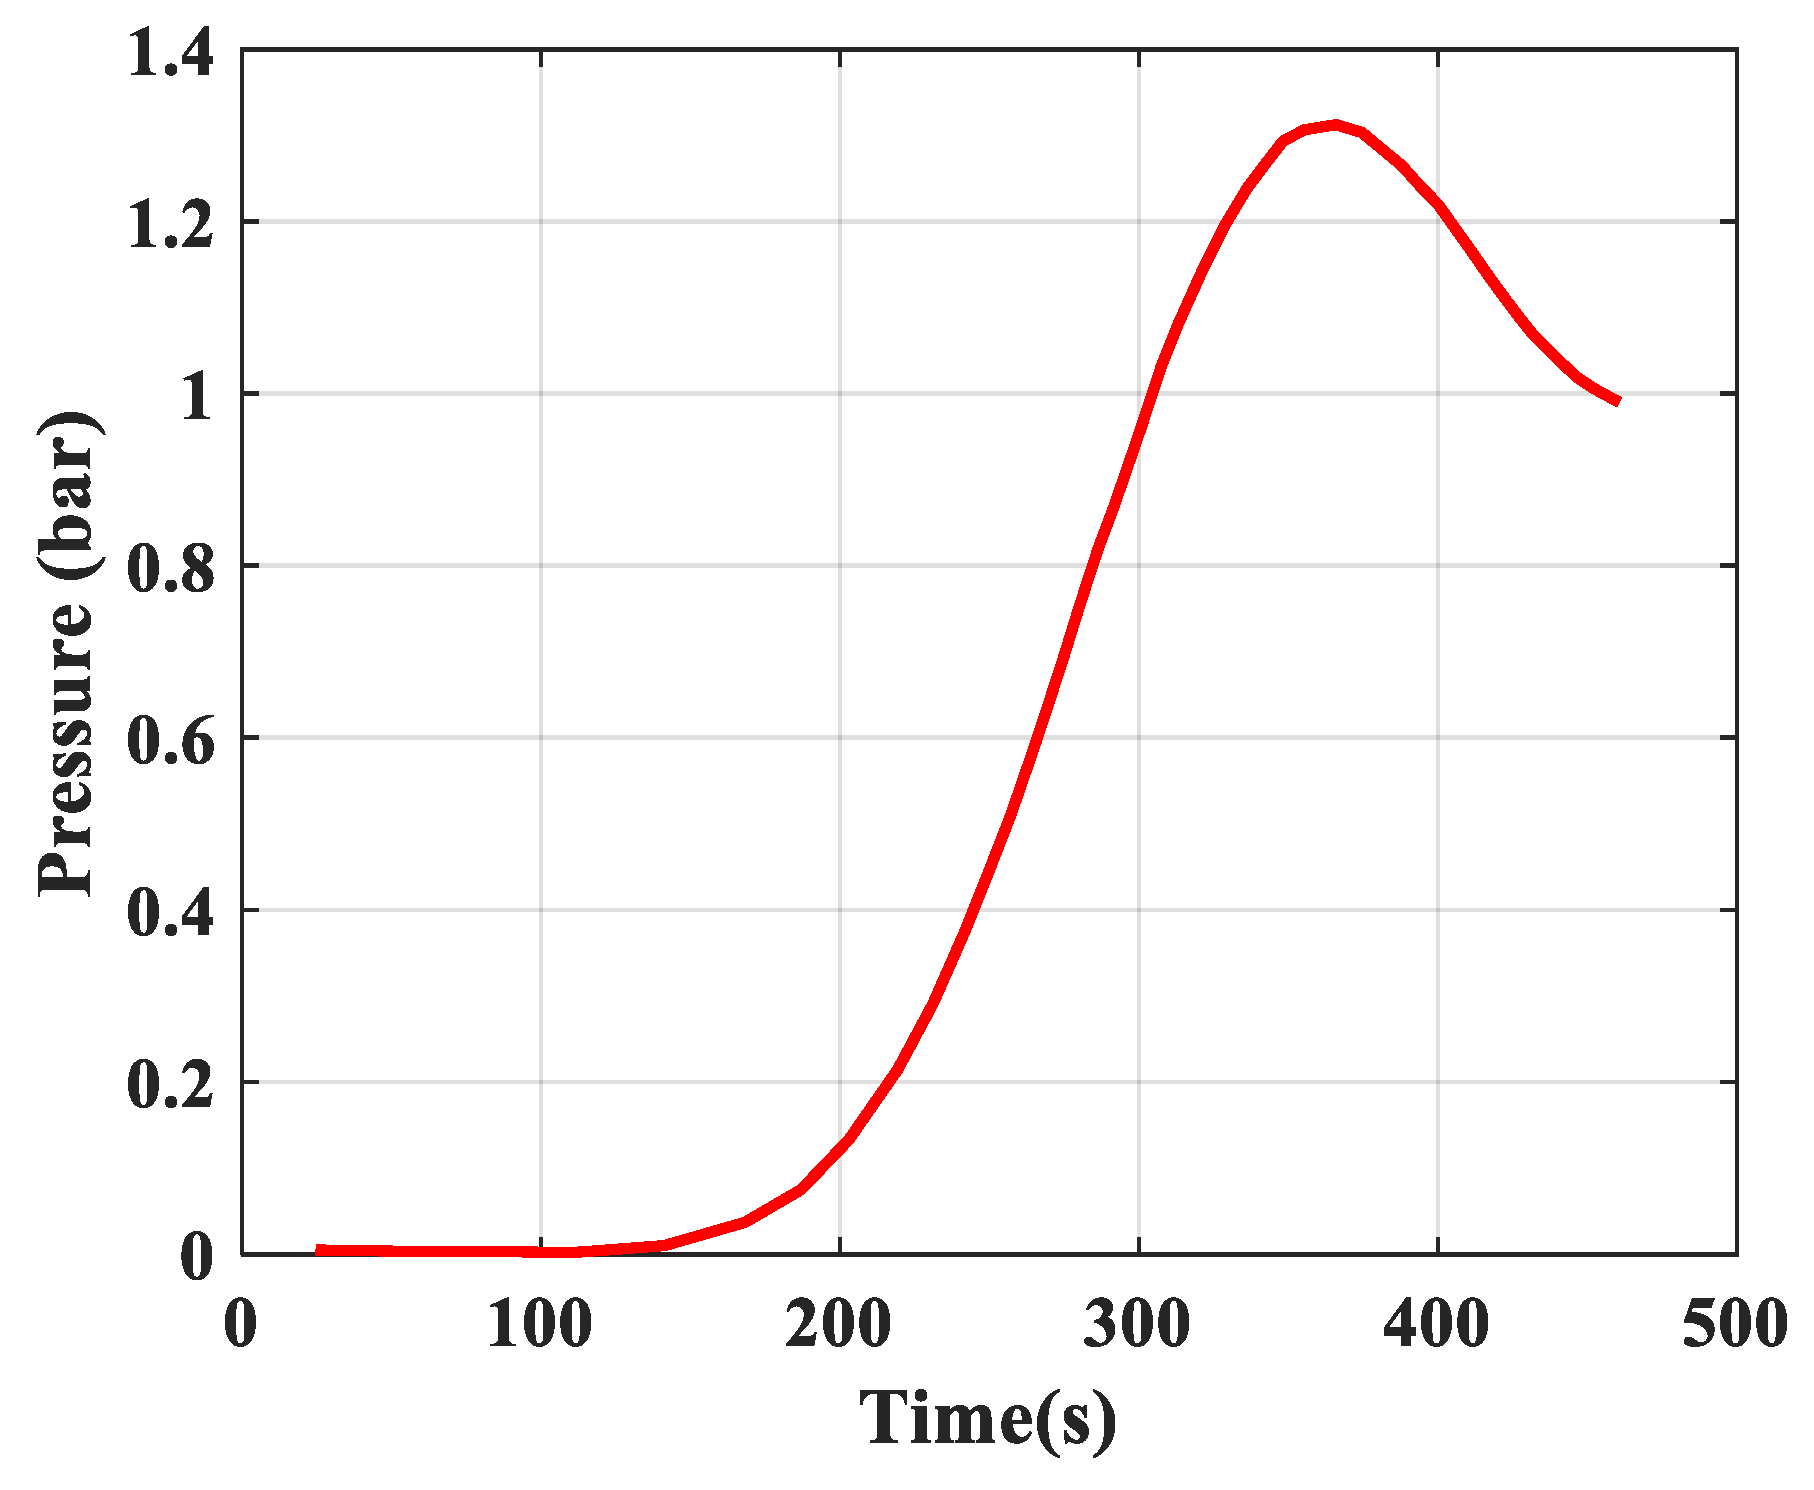
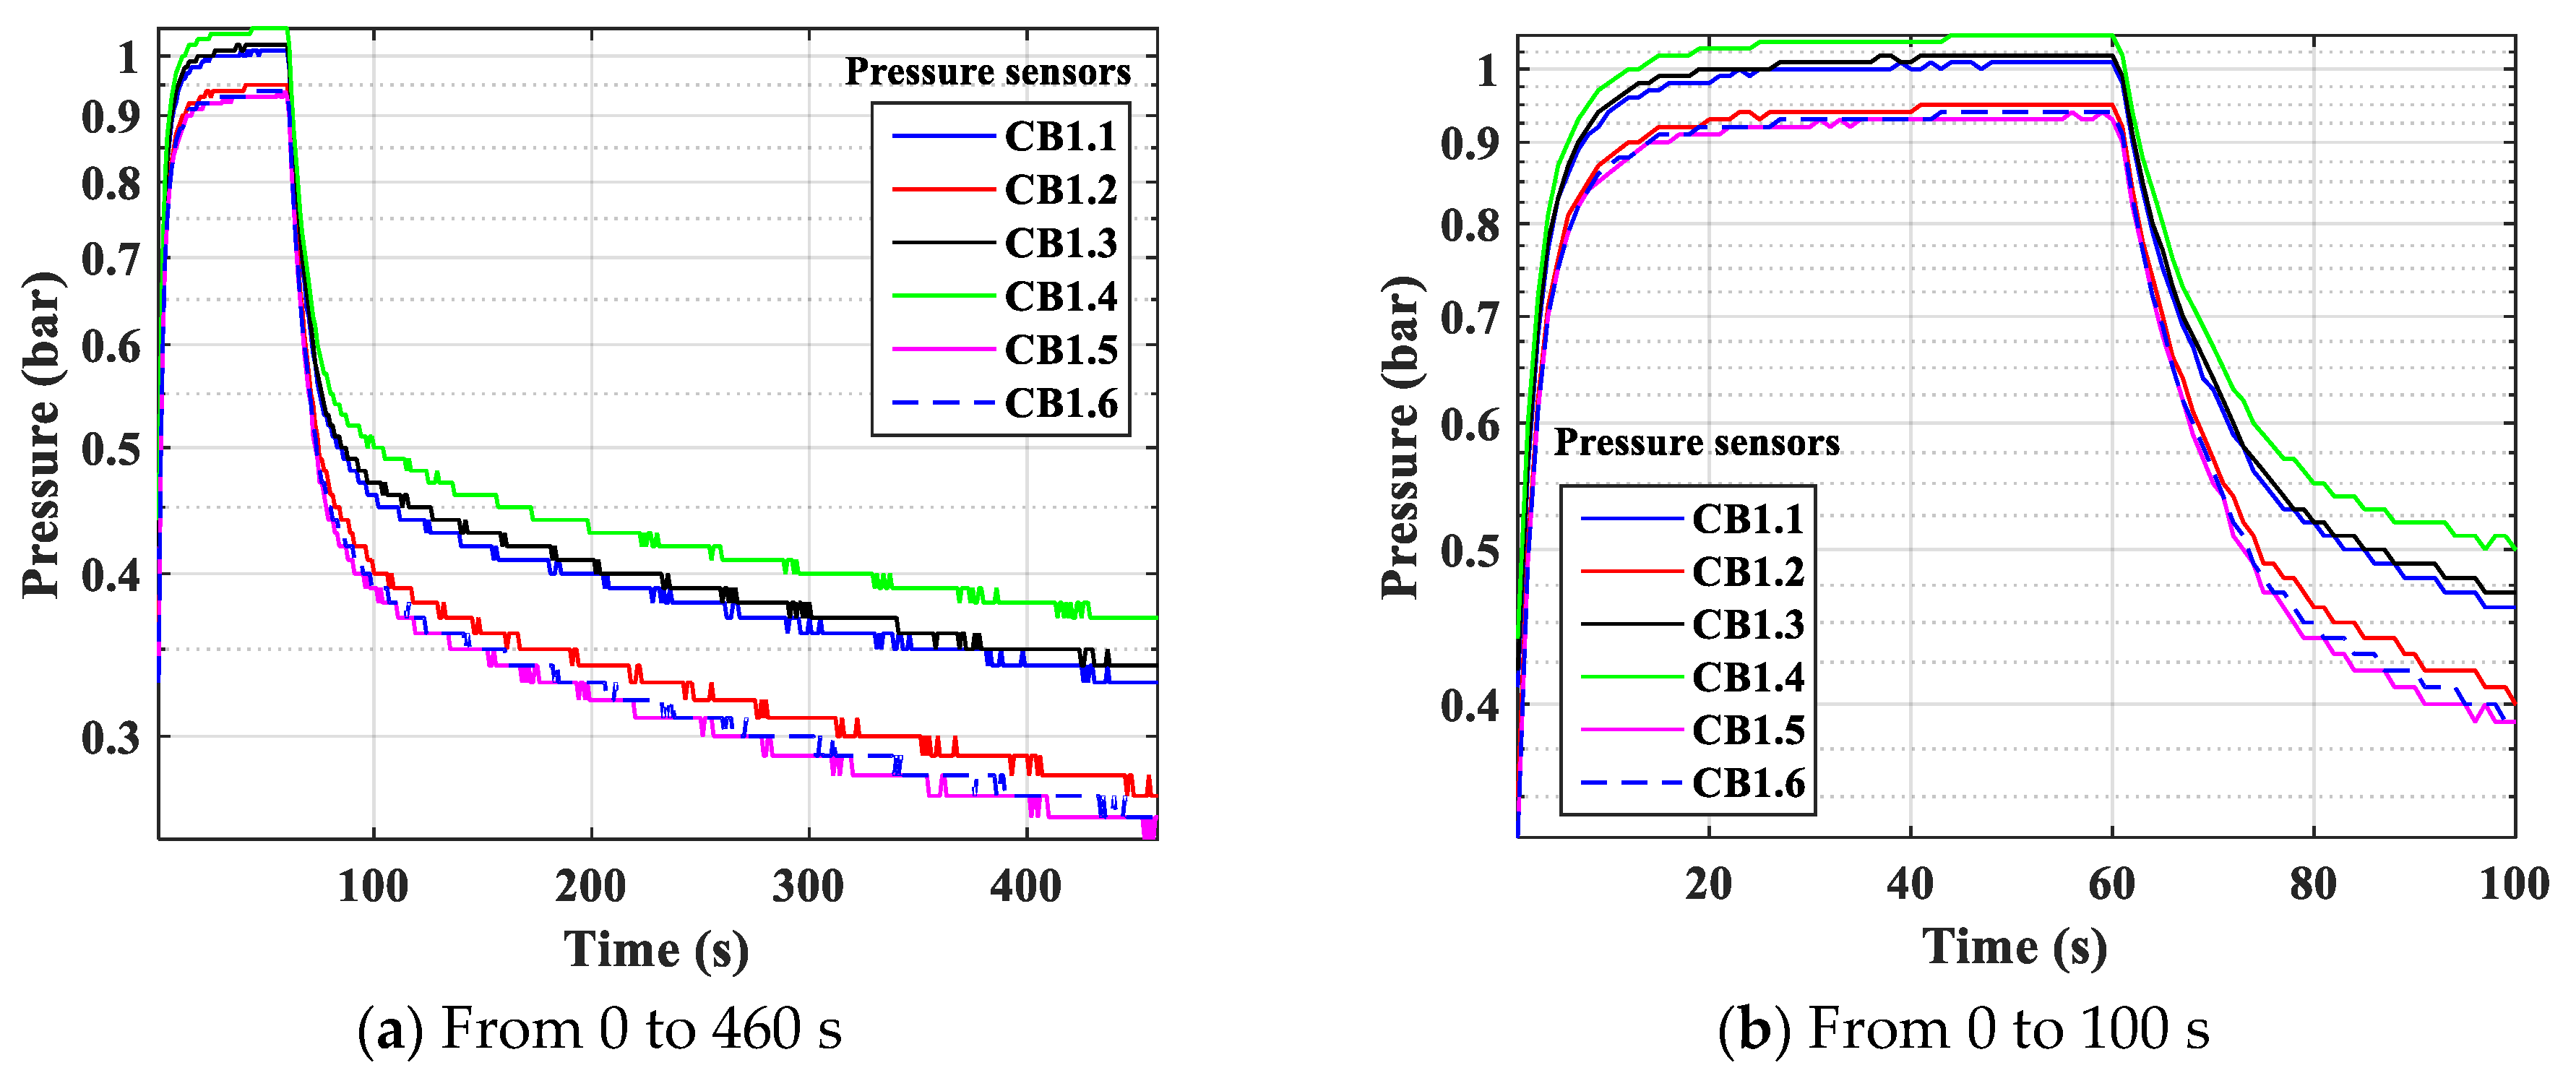
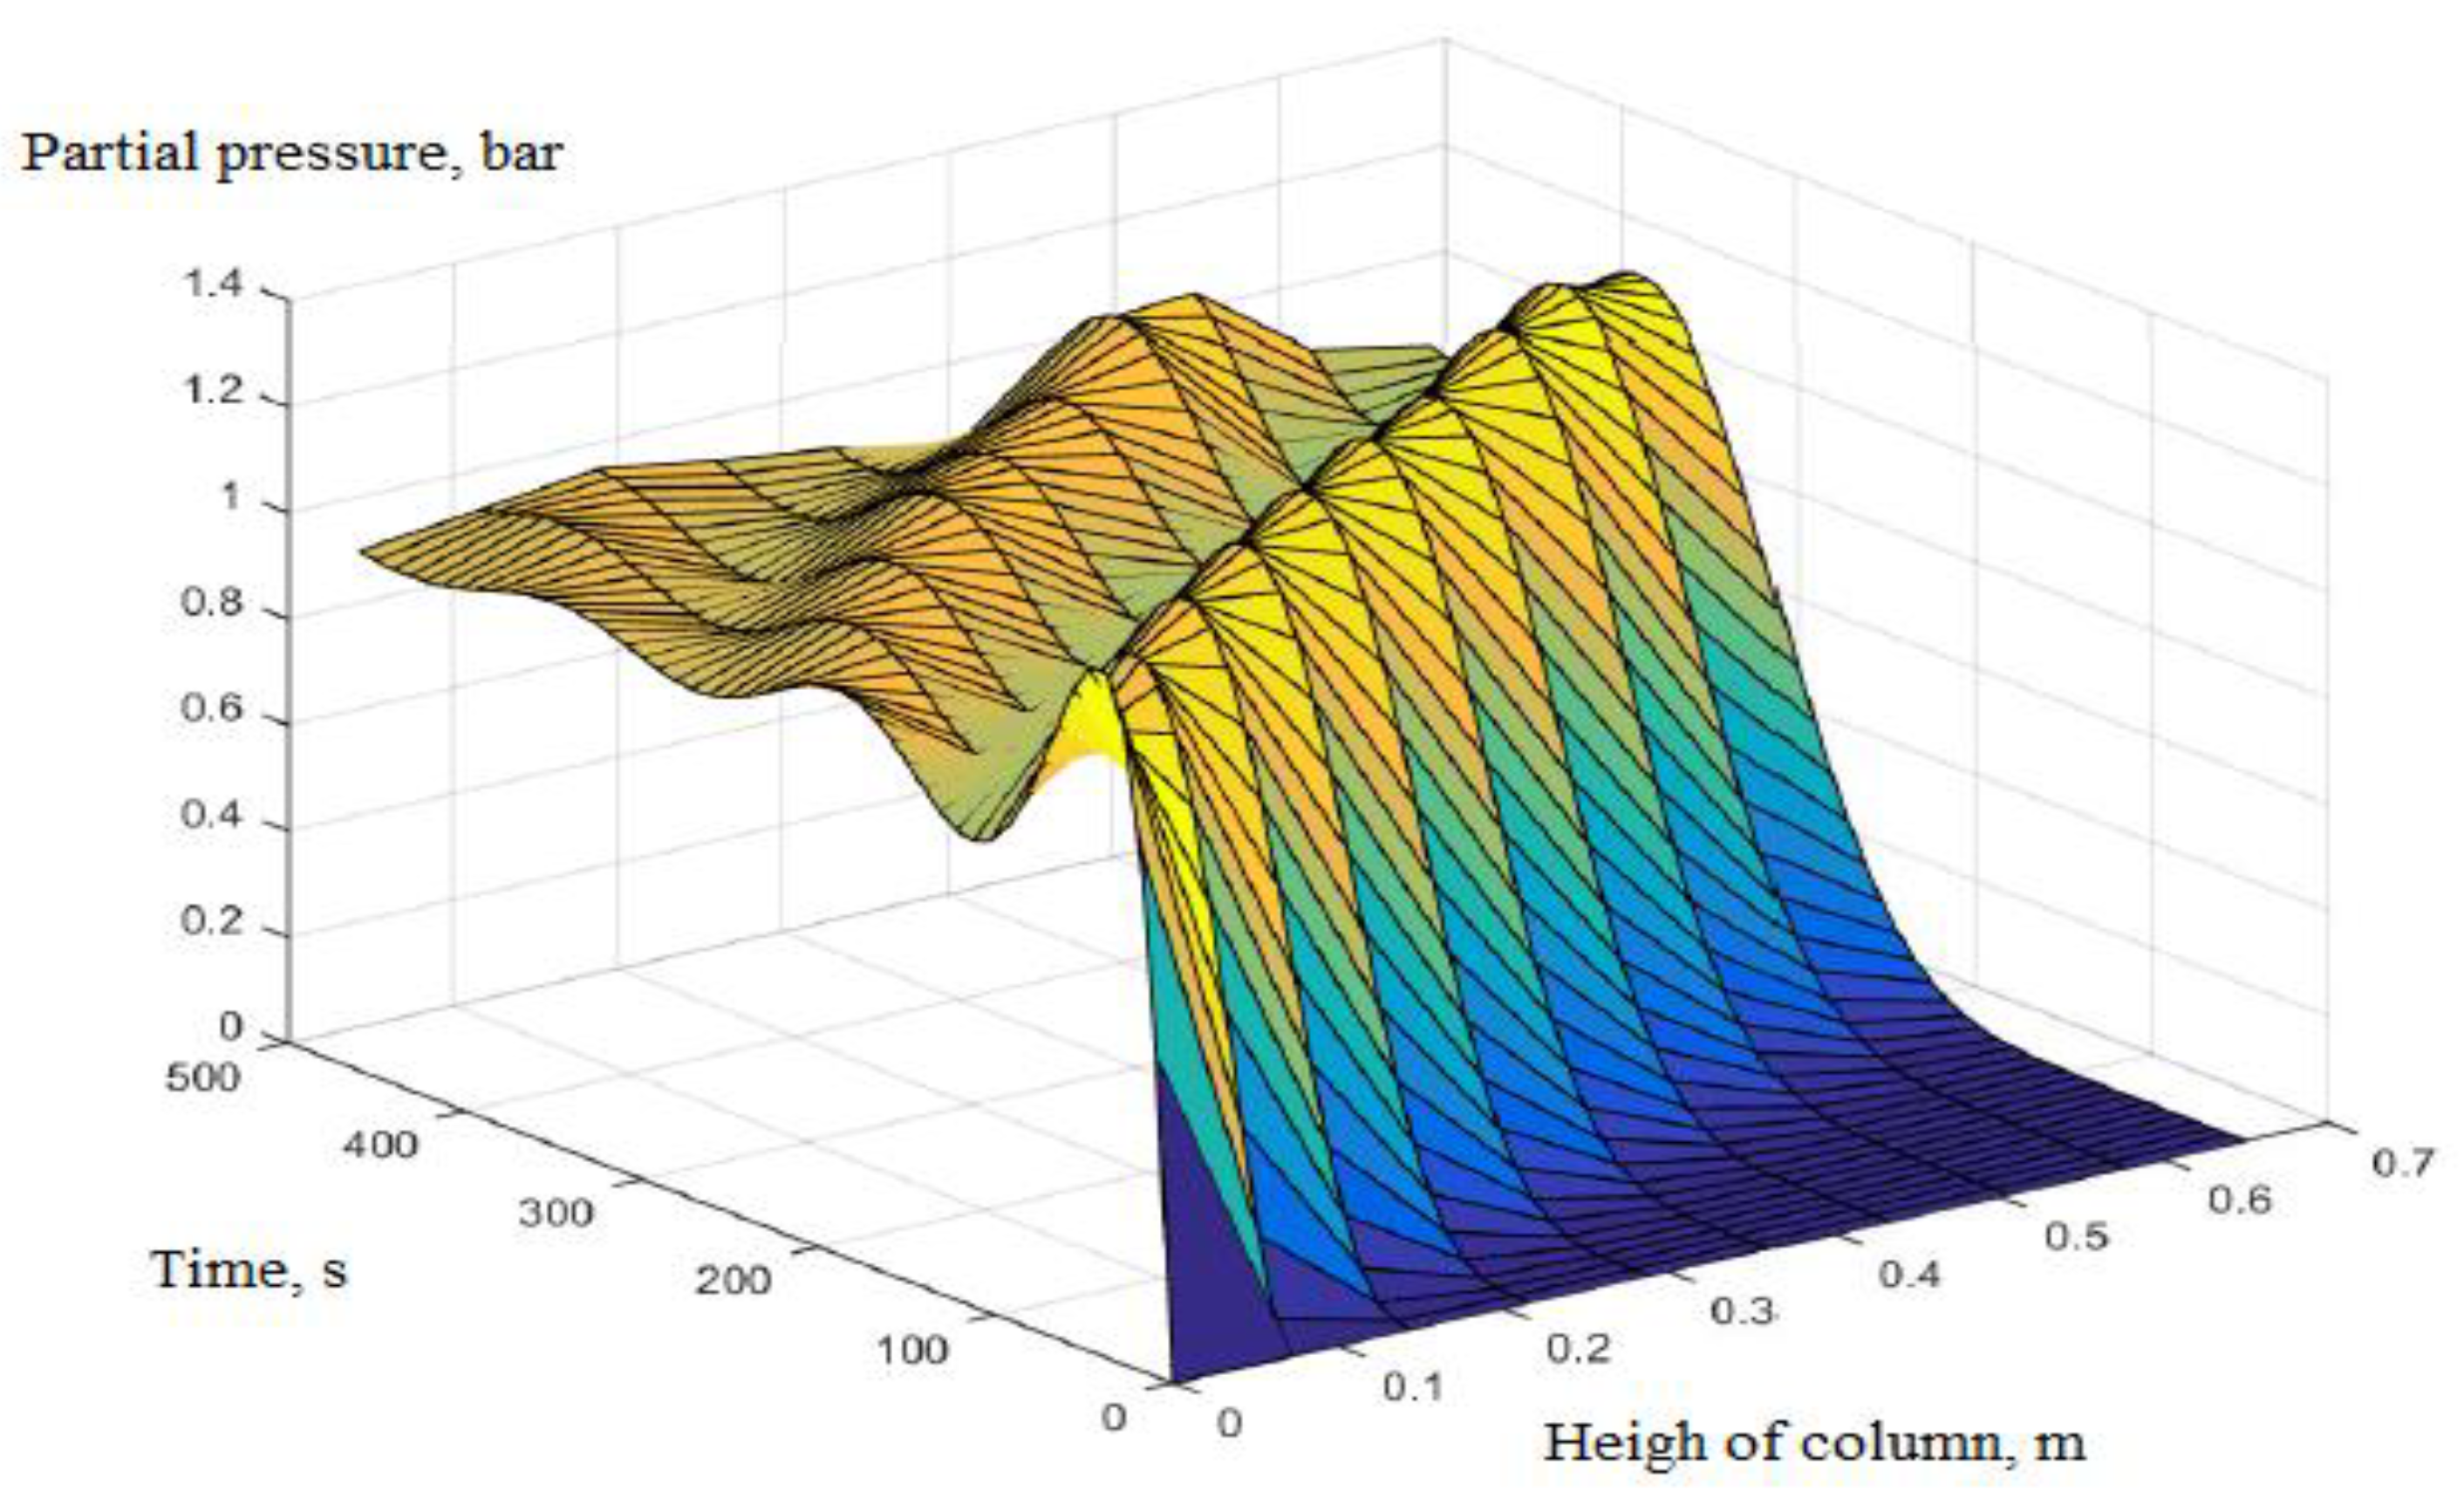
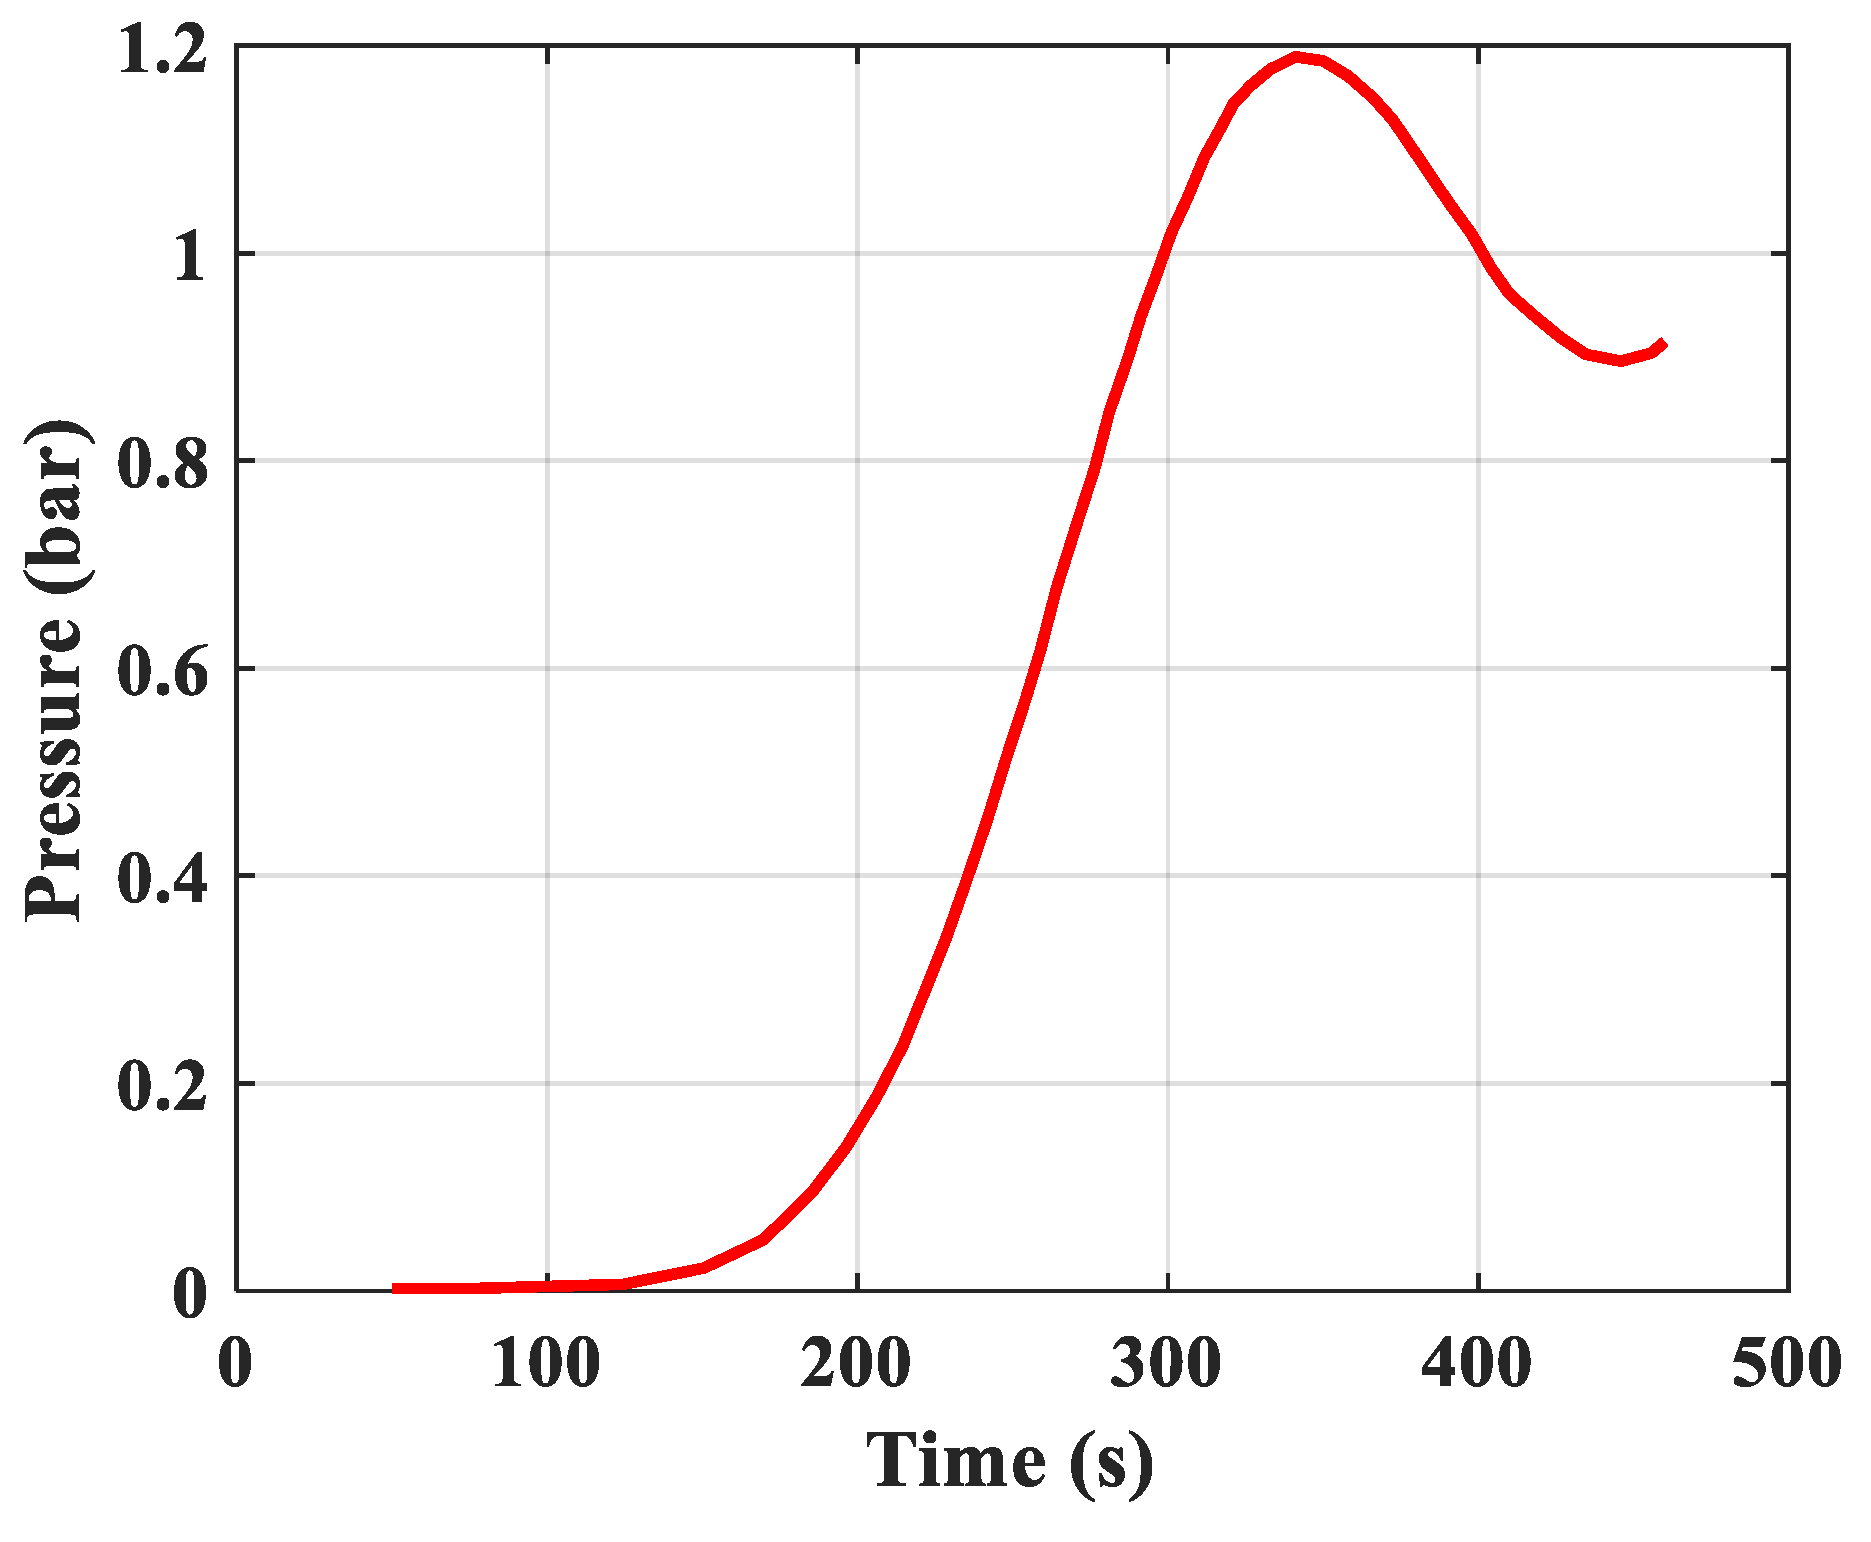
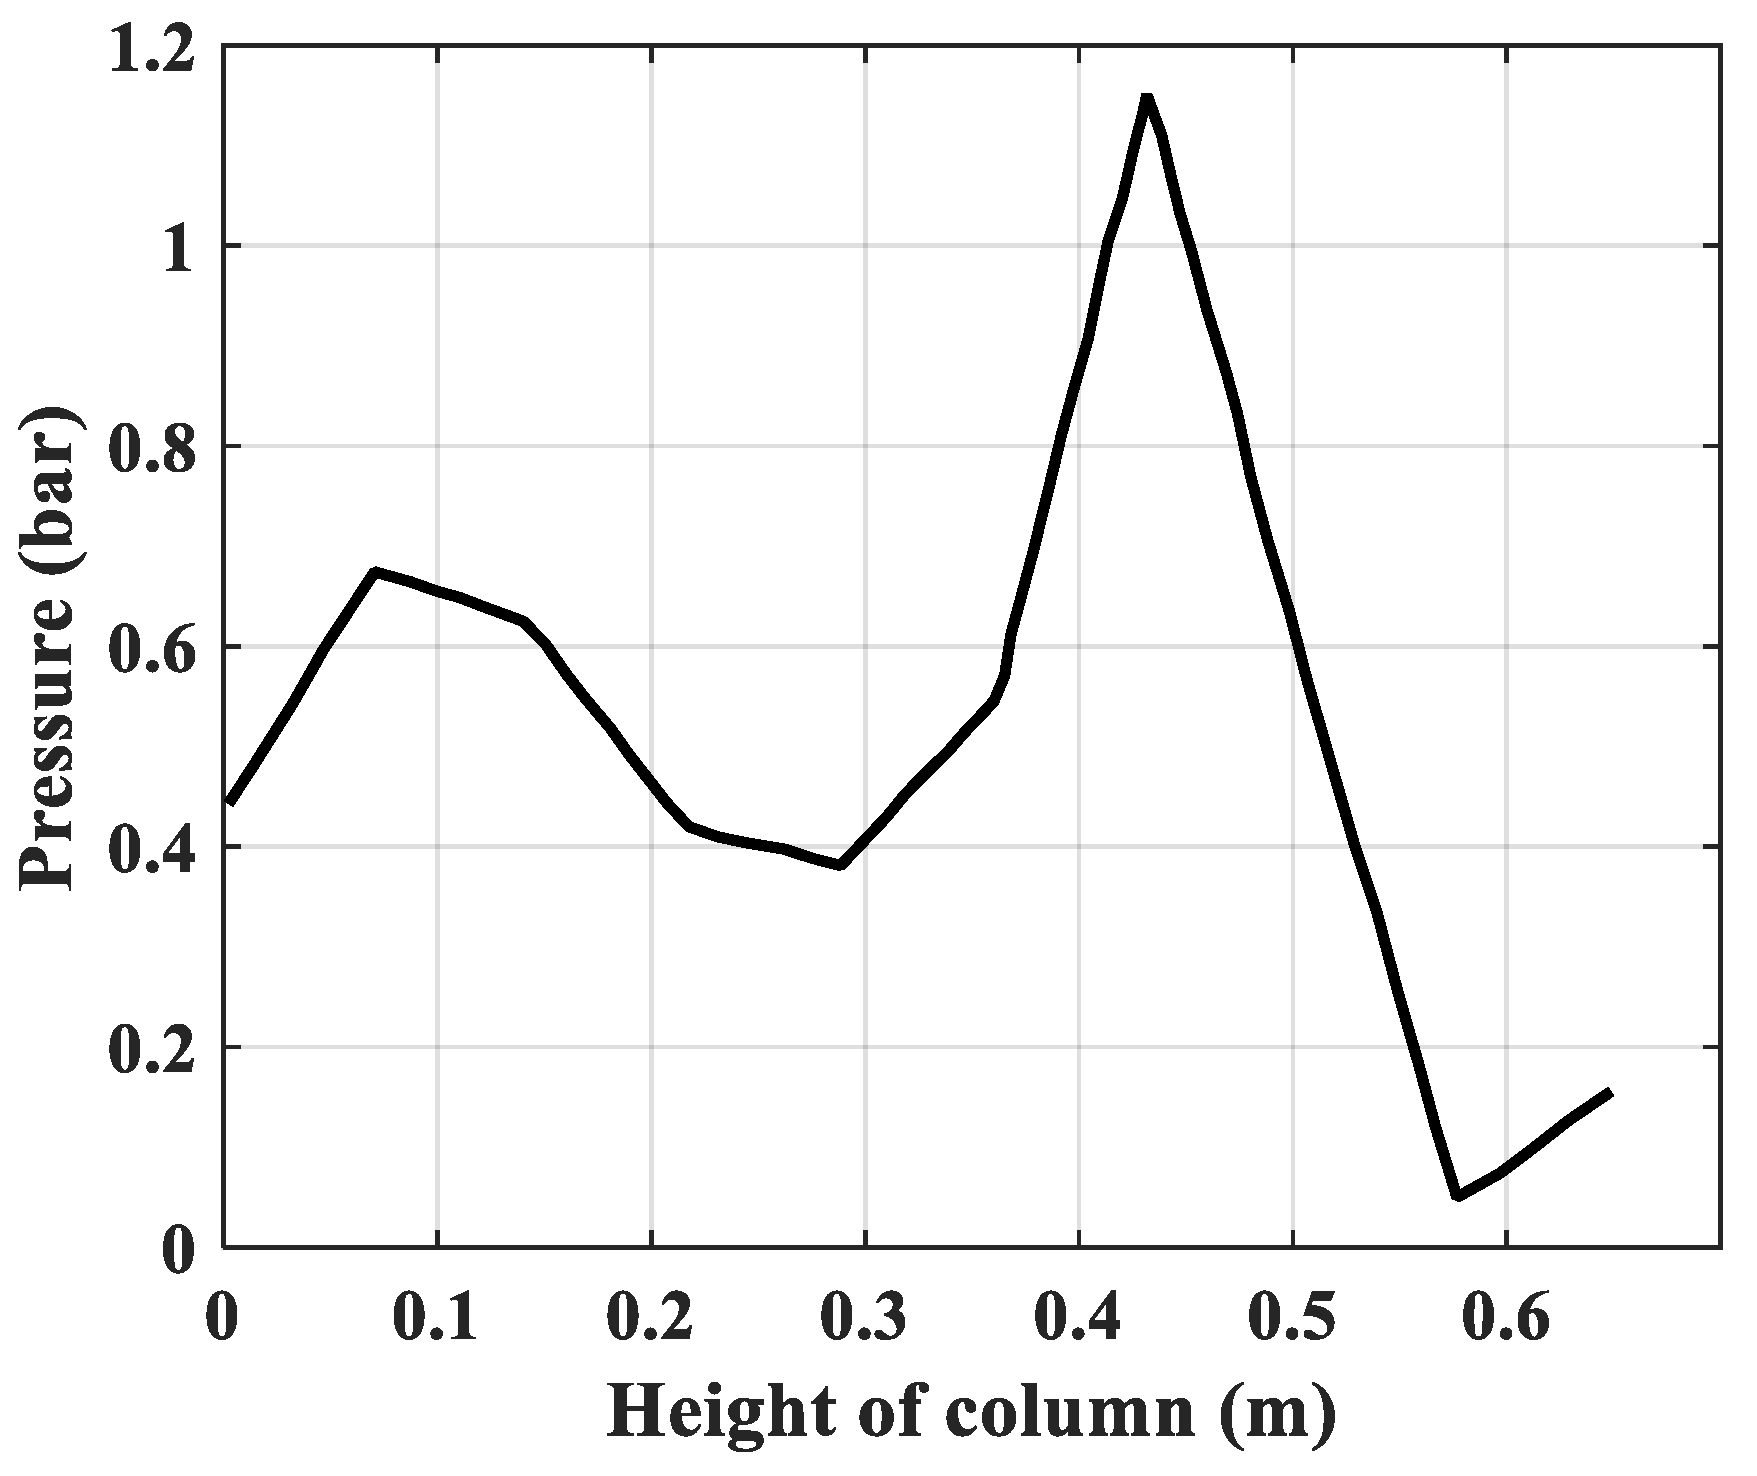
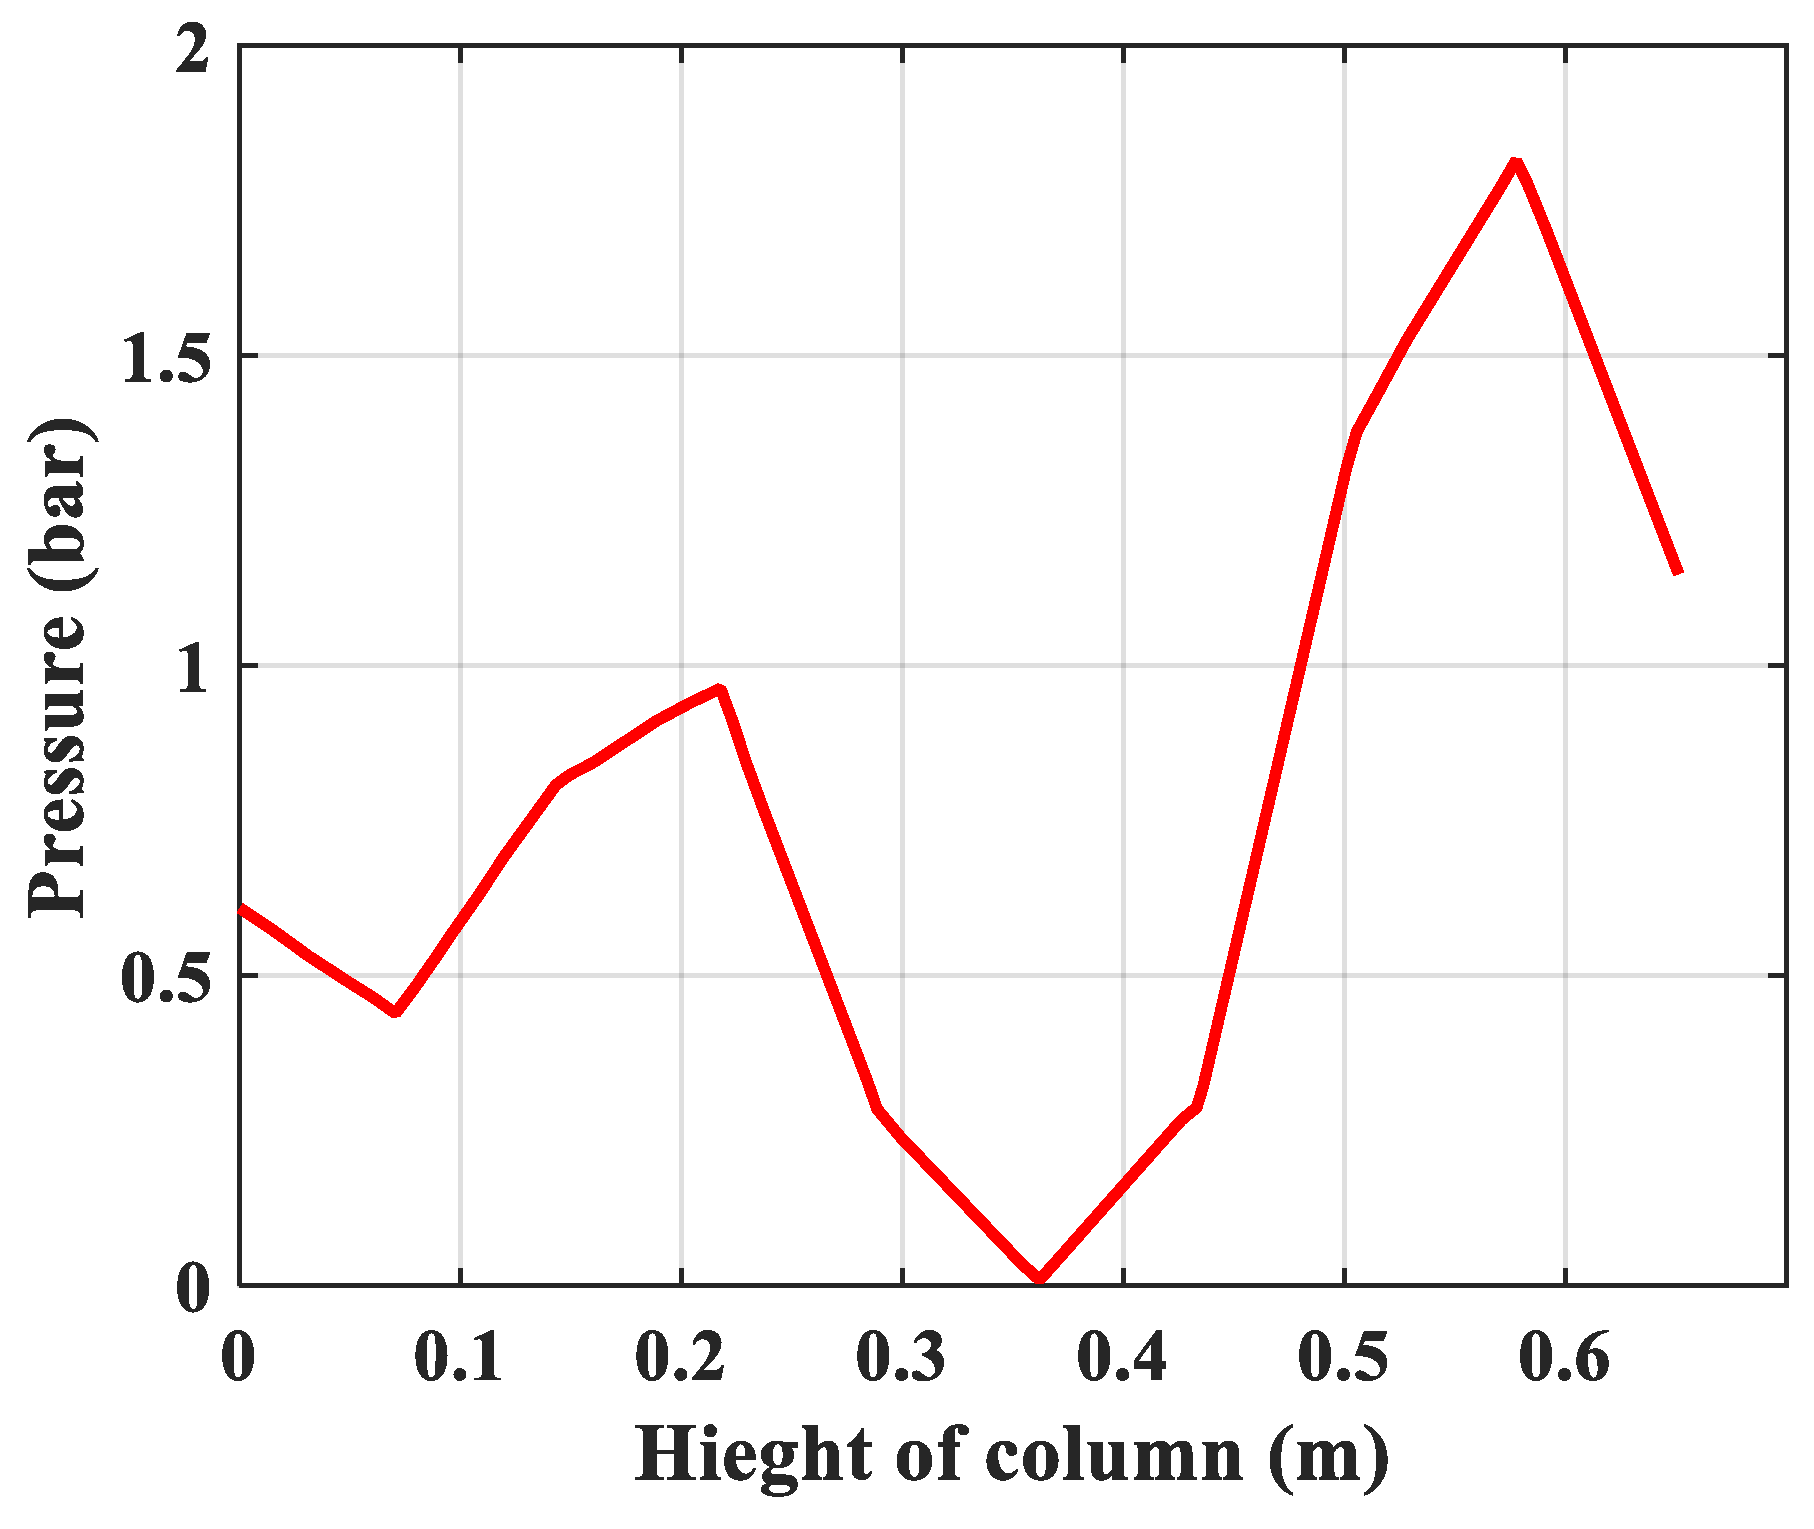
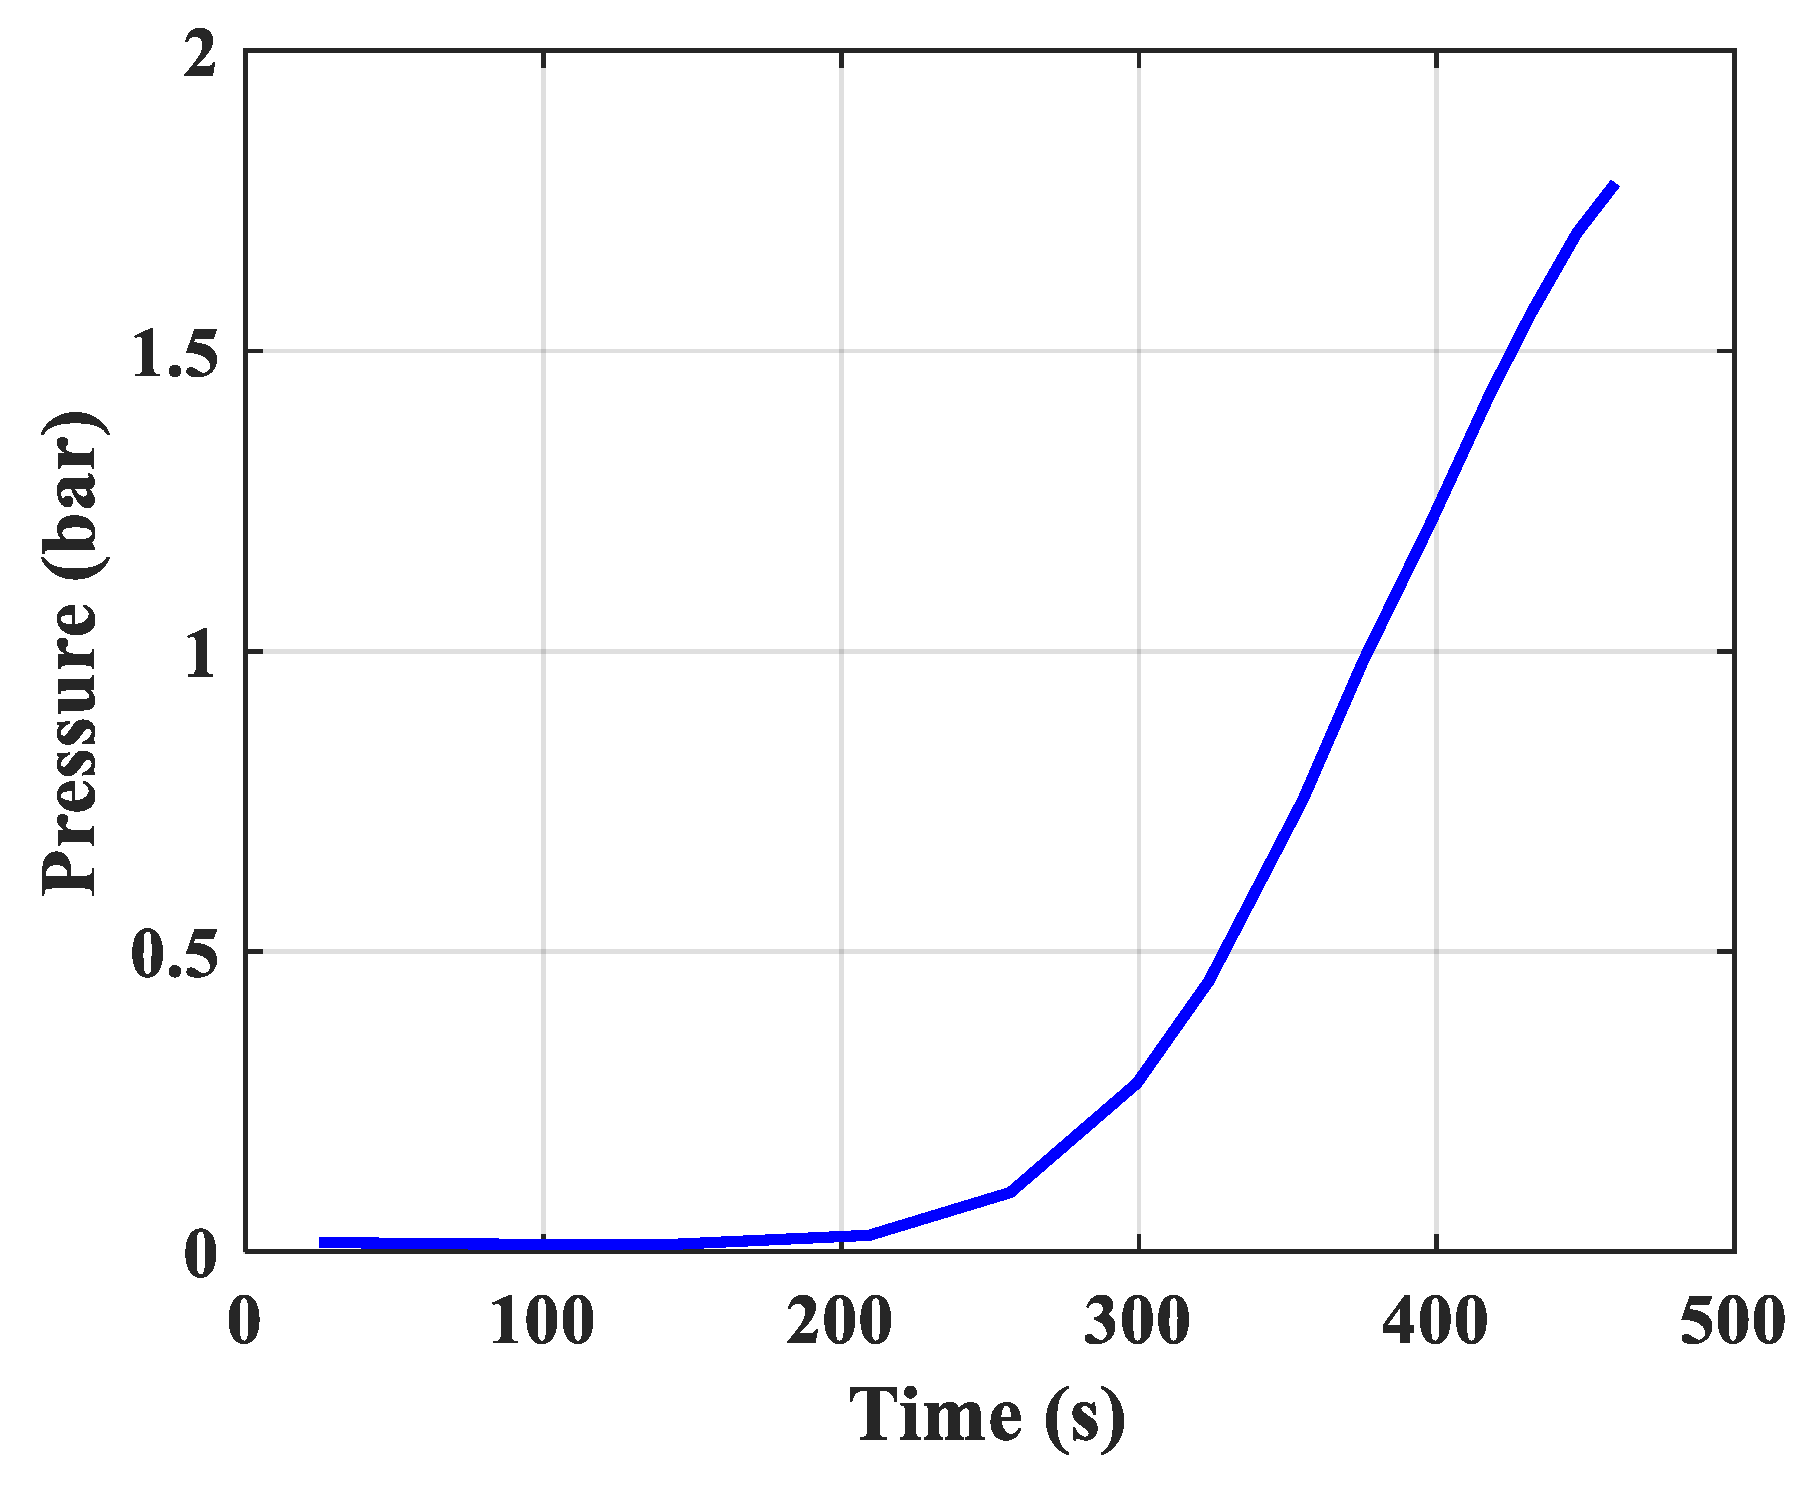
- Pressure: The pressure changes over time and according to the height of the column. The experimental results of the pressure changes over time and the pressure distribution of the column height (with 6 sensors CB-1.1 to CB-1.6) are clearly seen in Figure 13 when surveying one column according to setup mode in Table 3 at 1 bar pressure. At the higher pressures, the lower resolution makes it more difficult to see.
5. Conclusions
Author Contributions
Funding
Conflicts of Interest
Abbreviations
| Symbol | Unit | Meaning |
| DL | [cm2·s−1] | Vertical dispersion coefficient (adsorption column) |
| ki | [1·s−1] | Mass transfer factor of the component i |
| Ki | [-] | Equilibrium constant of the component i |
| Z | [m] | Distance along the column (from the beginning of the column to the end of the column) |
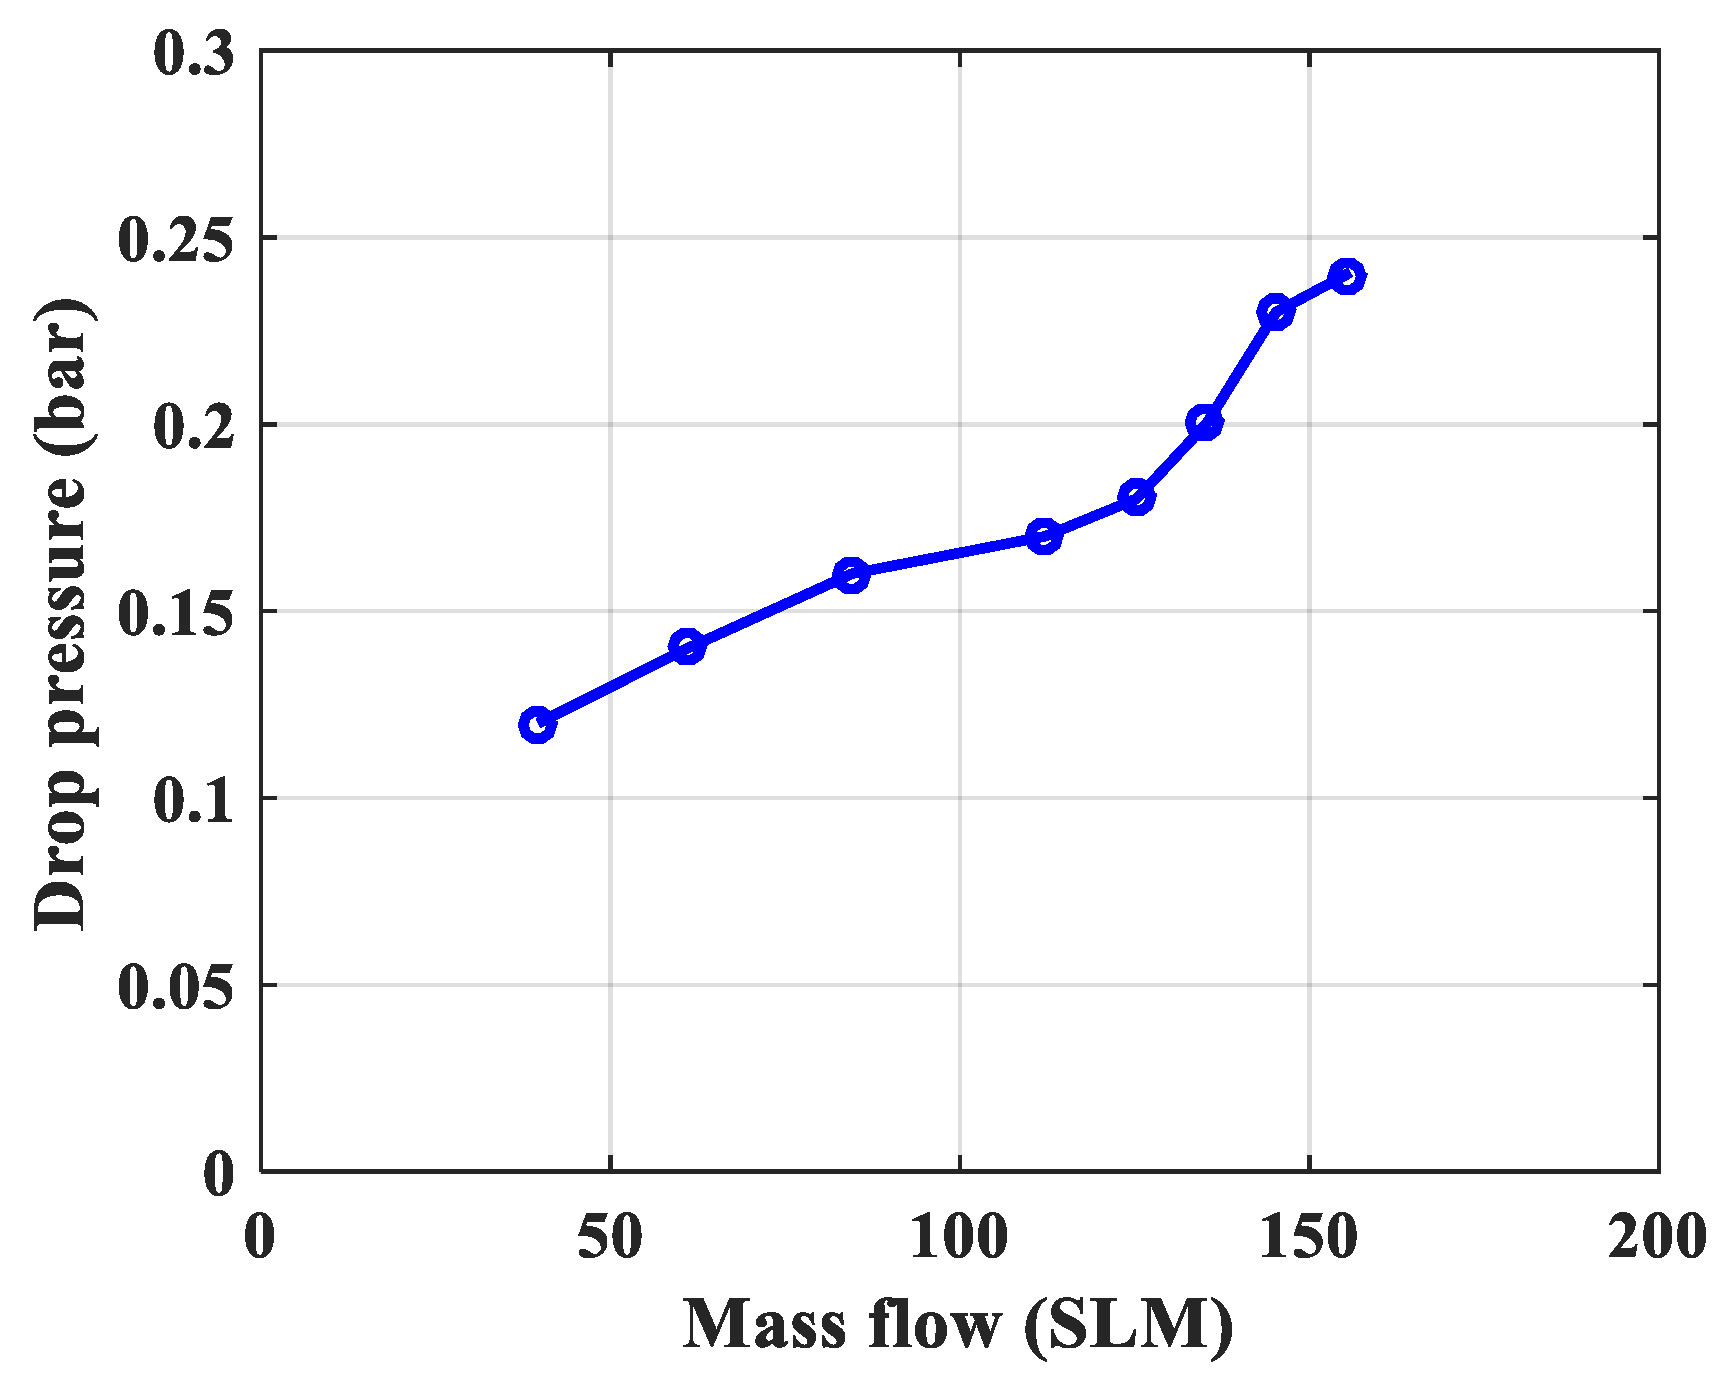
| ΔP | [bar] | Drop pressure of the column |
| qi | [g·g−1] | The amount of gas absorbed in the adsorbent of the component i |
| q*i | [g·g−1] | The amount of gas adsorbed in the material adsorbing when equilibrium of the component i |
| rp | [µm] | Particle radius |
| Total porosity (porosity inside and between particles) | ||
| P | [mmHg, KG/cm2] | Pressure |
| V | [m3] | Volume |
| T | [K] | Absolute temperature |
| Ci | [mole/cm3] | The concentration of component i in the gas mixture |
| t | [s] | Time |
| U | [m/s] | velocity inside the column |
| ρp | [g/cm3] | Particle density of adsorbent |
| KL | [J/cm·s·K] | Thermal conductivity coefficient along the axis |
| Tw | [K] | The temperature of the column wall |
| Tatm | [K] | Temperature of the surrounding environment |
| ρg | [g/cm3] | Density of gas |
| ρb | [g/cm3] | Bulk density of adsorbent |
| ρw | [g/cm3] | The density of material column wall |
| Cpg | [J/g·K] | Specific heat capacity of gas |
| Cps | [J/g·K] | Specific heat capacity of adsorbent |
| Cpw | [J/g·K] | Specific heat capacity of material column wall |
| −ΔH | [J/mol] | Heat effect of adsorption process |
| hi | [J/cm2·K·s] | Internal heating factor |
| ho | [J/cm2·K·s] | External heating factor |
| RBi | [cm] | Inner radius of the column |
| RBo | [cm] | Outside radius of the column |
| Aw | [cm2] | Cross-sectional area of the wall |
| B | [kPa−1] | Langmuir equation parameters expanded |
| qm | [mol/kg] | The equilibrium parameter for the extended Langmuir equation |
| Pi | [kPa] | Pressure of the component i |
| K | - | The coefficient of Langmuir equation extends |
References
- Kulkarami, S.J. Pressure Swing Adsorption: A Summary on Investigation in Recent Past. Int. J. Res. Rev. 2016, 3, 46–49. [Google Scholar]
- Ashkan, M.; Masoud, M. Simulation of a Single Bed Pressure Swing Adsorption for Producing Nitrogen. In Proceedings of the International Conference on Chemical, Biological and Environmental Sciences, Bangkok, Thailand, 23–24 December 2011. [Google Scholar]
- Smith, A.R.; Klosek, K. A review of air separation technologies and their integration with energy conversion processes. Fuel Process. Technol. 2011, 70, 115–134. [Google Scholar] [CrossRef]
- Carlos Grande, A. Advance in Pressure Swing Adsorption for Gas Separation. ISRN Chem. Eng. 2012, 2012, 982934. [Google Scholar]
- Snehal Patel, V.; Patel, J.M. Separation of High Purity Nitrogen from Air by Pressure Swing Adsorption on Carbon Molecular Sieve. Int. J. Eng. Res. Technol. 2014, 3, 450–454. [Google Scholar]
- Delavar, M.; Nabian, N. An investigation on the Oxygen and Nitrogen separation from air using carbonaceous adsorbents. J. Eng. Sci. Technol. 2015, 10, 1394–1403. [Google Scholar]
- Roy Chowdhury, D.; Sarkar, S.C. Application of Pressure Swing Adsorption Cycle in the quest of production of Oxygen and Nitrogen. Int. J. Eng. Sci. Innov. Technol. 2016, 5, 64–69. [Google Scholar]
- Shafeeyan, M.S.; Daud, W.M.A.W.; Shamiri, A. A review of mathematical modeling of fixed-bed columns for carbon dioxide adsorption. Chem. Eng. Res. Des. 2014, 92, 961–988. [Google Scholar] [CrossRef]
- Zhe, X.U. Mathematically modeling fixed-bed adsorption in aqueous systems. Appl. Phys. Eng. 2013, 3, 155–176. [Google Scholar]
- Ehsan, J.S.; Masoud, M. Pilot-Scale Experiments for Nitrogen Separation from Air by Pressure Swing Adsorption. S. Afr. J. Chem. Eng. 2014, 19, 42–56. [Google Scholar]
- Shokrooi, E.J.; Motlaghian, S.M.A.M. A robust and user friendly sofware (TB-PSA-SS) for numberical simulation of two-bed pressure swing adsorption processes. Pet. Coal 2015, 57, 13–18. [Google Scholar]
- Furtat, I.B. Mathematical model of the process of adsorption. Models and modeling. ASTU Bull. 2008, 42, 24–30. [Google Scholar]
- Akulinin, E.I.; Butler, D.S.; Dvoretsky, S.I.; Simanenkov, A.A. Mathematical Modeling of the Process of Oxygen Enrichment with Air in the Installation of Short-Cycle Adsorption. TSTU Bull. 2009, 2, 341–355. [Google Scholar]
- Akulinin, E.I.; Dvoretsky, D.S.; Dvoretsky, S.I. Investigation of Heat and Mass Transfer Processes for Enriching Air with Oxygen with Hydrogen through Short-Cycle Adsorption Method. TSTU Bull. 2016, 22, 411–419. [Google Scholar]
- Kevin Wood, R.; Liu, Y.A.; Yu, Y. Design, Simulation and Optimization of Adsorption and Chromatographic Separation: A Hand-on Approach, 1st ed.; Wiley-VCH Verlag GmbH and Co. KGaA: Hoboken, NJ, USA, 2018. [Google Scholar]
- Suzuki, M. Adsorption Engineering; University of Tokyo: Tokyo, Japan, 1990. [Google Scholar]
- Ruthven, D.M. Principles of Adsorption and Adsorption Process; Wiley-VCH Publishers: New York, NY, USA, 1984. [Google Scholar]
- Douglas Ruthven, M.; Shamsuzzanman, F.; Kent Knaebel, S. Pressure Swing Adsorption; Wiley-VCH Publishers: New York, NY, USA, 1994. [Google Scholar]
- Seader, J.D.; Ernest Heney, J.; Keith Roper, D. Separation Process Principles Chemical and Biochemical Operations; John Wiley and Sons, Inc.: Hoboken, NJ, USA, 2011. [Google Scholar]


| 1 | Porosity outside or between particles | εi | m3/m3 | 0.1326 | |
| 2 | Porosity in the grain | εp | m3/m3 | 0.556 | |
| 3 | Total porosity | εt | m3/m3 | 0.615 |
| Order | Pressure | P | bar | 1 | 2 | 3 | 4 | 5 | 6 | 7 | 8 |
|---|---|---|---|---|---|---|---|---|---|---|---|
| 1 | Gas velocity in the column | uc | m/s | 0.058 | 0.038 | 0.029 | 0.023 | 0.019 | 0.016 | 0.014 | 0.013 |
| 2 | Temperature | T | K | 298 | 298 | 298 | 298 | 298 | 298 | 298 | 298 |
| 3 | Pore radius | Rp | 10−8 cm | 2 | 2 | 2 | 2 | 2 | 2 | 2 | 2 |
| 4 | Molecular weight | M(O2) | kg/kmol | 32 | 32 | 32 | 32 | 32 | 32 | 32 | 32 |
| 5 | Flow diffusion coefficient | Dk | 10−6 cm2/s | 592 | 592 | 592 | 592 | 592 | 592 | 592 | 592 |
| 6 | Molecular diffusion coefficient | DAB | 10−6 cm2/s | 8.6 | 5.8 | 4.3 | 3.5 | 2.9 | 2.5 | 2.2 | 1.92 |
| 7 | Axial diffusion coefficient | DL | 10−6 cm2/s | 8.5 | 5.7 | 4.29 | 3.44 | 2.87 | 2.46 | 2.16 | 1.92 |
| 8 | Equilibrium constant O2 | K | - | 9.25 | 9.25 | 9.25 | 9.25 | 9.25 | 9.25 | 9.25 | 9.25 |
| Time, Pressure Set Up | T = 460 s; P = 1 to 8 Bar | |
|---|---|---|
| Valve status | T1 = 60 s | T2 = 400 s |
| V1 | ON | OFF |
| V7 | ON | ON |
| Parameter/Experiment | 1 | 2 | 3 | 4 | 5 |
| Pressure, bar | 1 | 2 | 3 | 4 | 5 |
| Number of unstable cycles, n | 4 | 3 | 3 | 3 | 2 |
| Weight of CMS in single bed, kg | 3.5 | 3.5 | 3.5 | 3.5 | 3.5 |
| Pressurization time, s | 5 | 9 | 9 | 10 | 15 |
| Adsorption time, s | 27 | 29 | 31 | 33 | 35 |
| Drop pressure, bar | 0.12 | 0.14 | 0.16 | 0.17 | 0.18 |
| Mass Flow Input FM1, sml | 39.65 | 60.97 | 84.56 | 112.16 | 125.20 |
| Recovery ratio, R | 0.62 | 0.86 | 0.80 | 0.77 | 0.82 |
| Mass Flow Output FM2, sml | 24.58 | 52.43 | 67.65 | 86.36 | 102.66 |
| The best concentration N2, % (Take the product at atmospheric pressure) | 82.60 | 87.90 | 88.90 | 93.40 | 93.40 |
| O2 gas flow is calculated adsorption, sml | 3.65 | 5.85 | 9.40 | 16.73 | 18.26 |
| Specific gravity of O2 at standard conditions, kg/m3 | 1.43 | 1.43 | 1.43 | 1.43 | 1.43 |
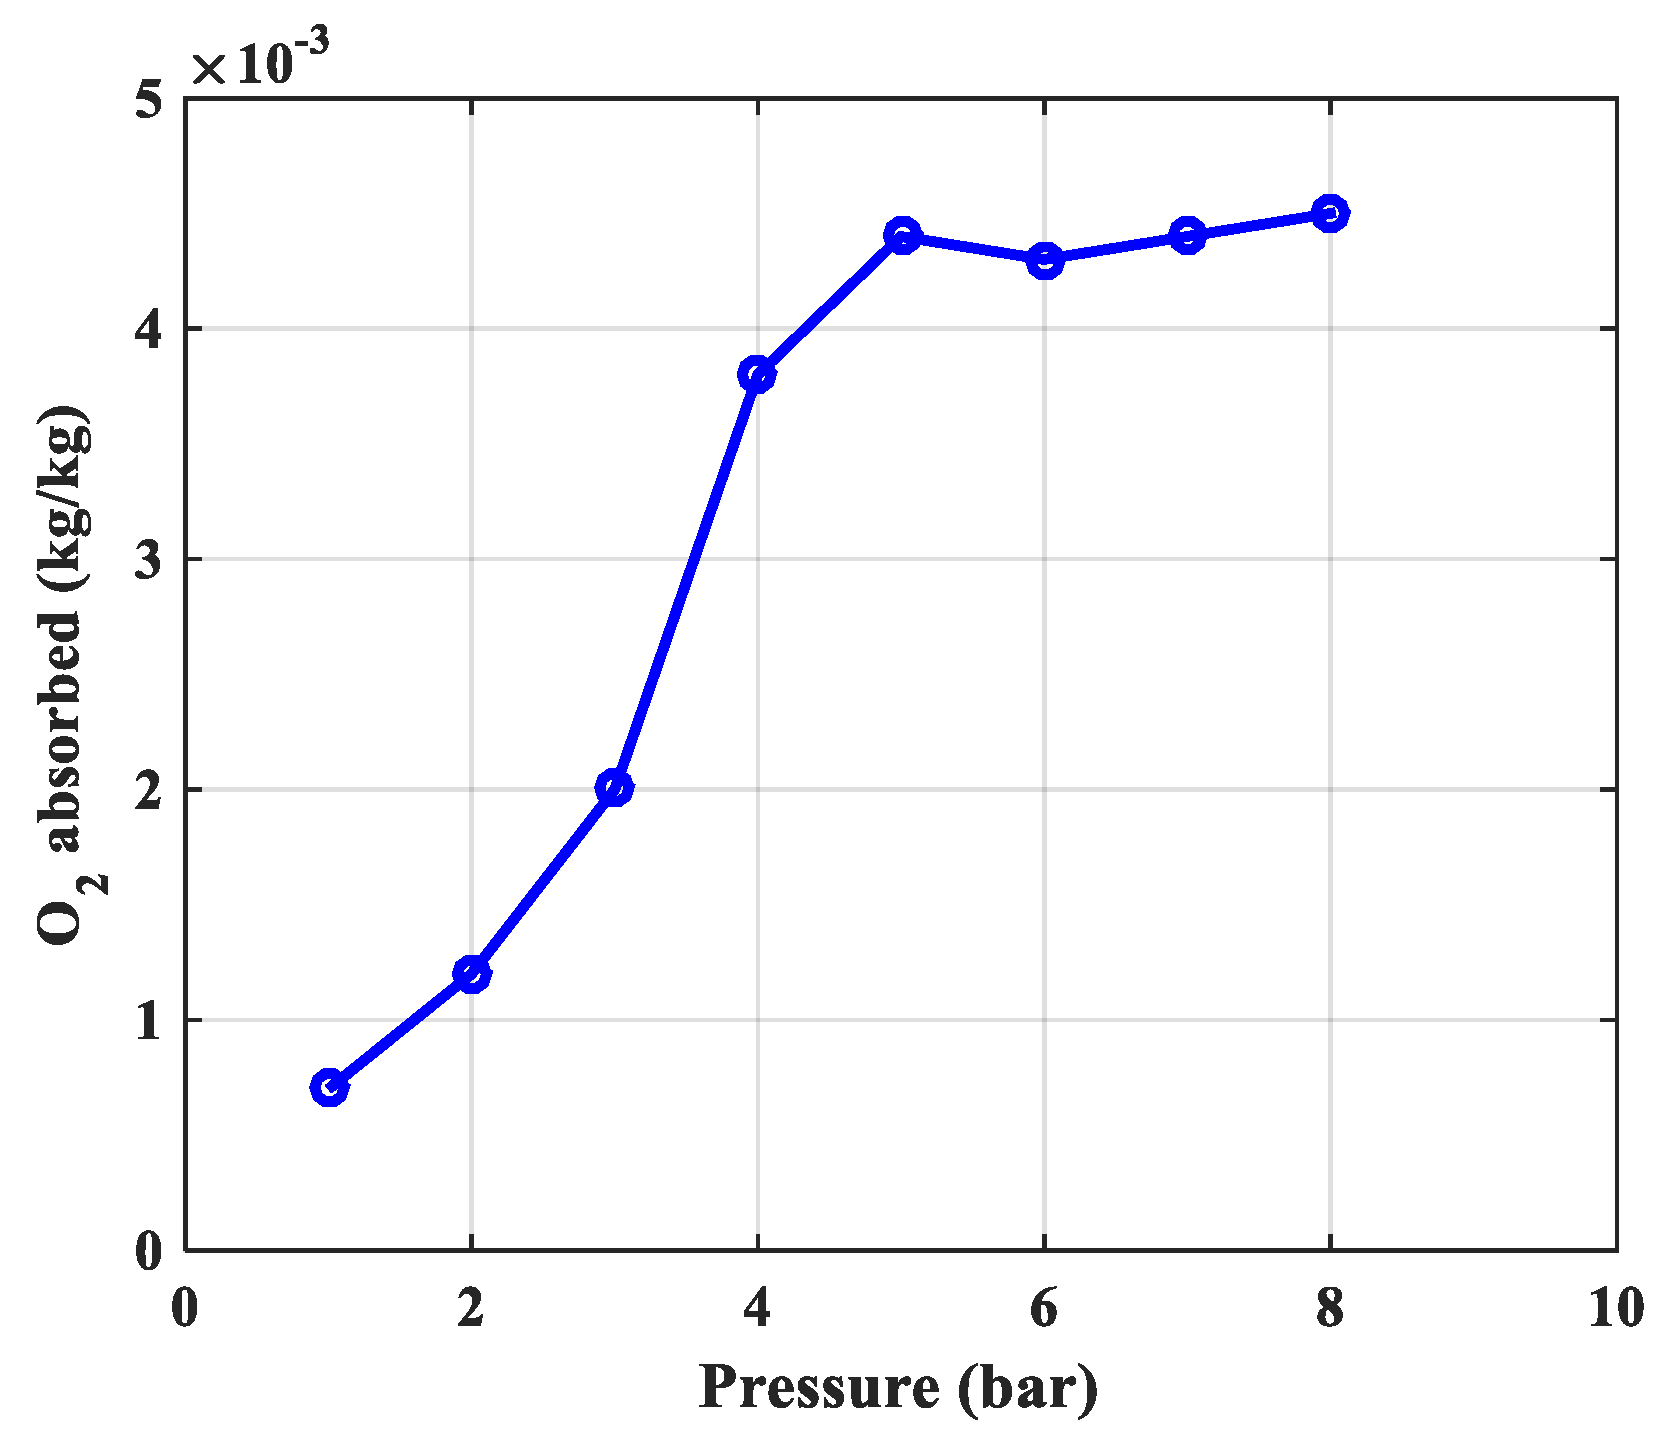
| The amount of O2 gas absorbed per 1 kg CMS-240, kg | 0.0007 | 0.0012 | 0.0020 | 0.0038 | 0.0044 |
| Order. | Research Parameters | Simulation | Experimental | Conclusion |
|---|---|---|---|---|
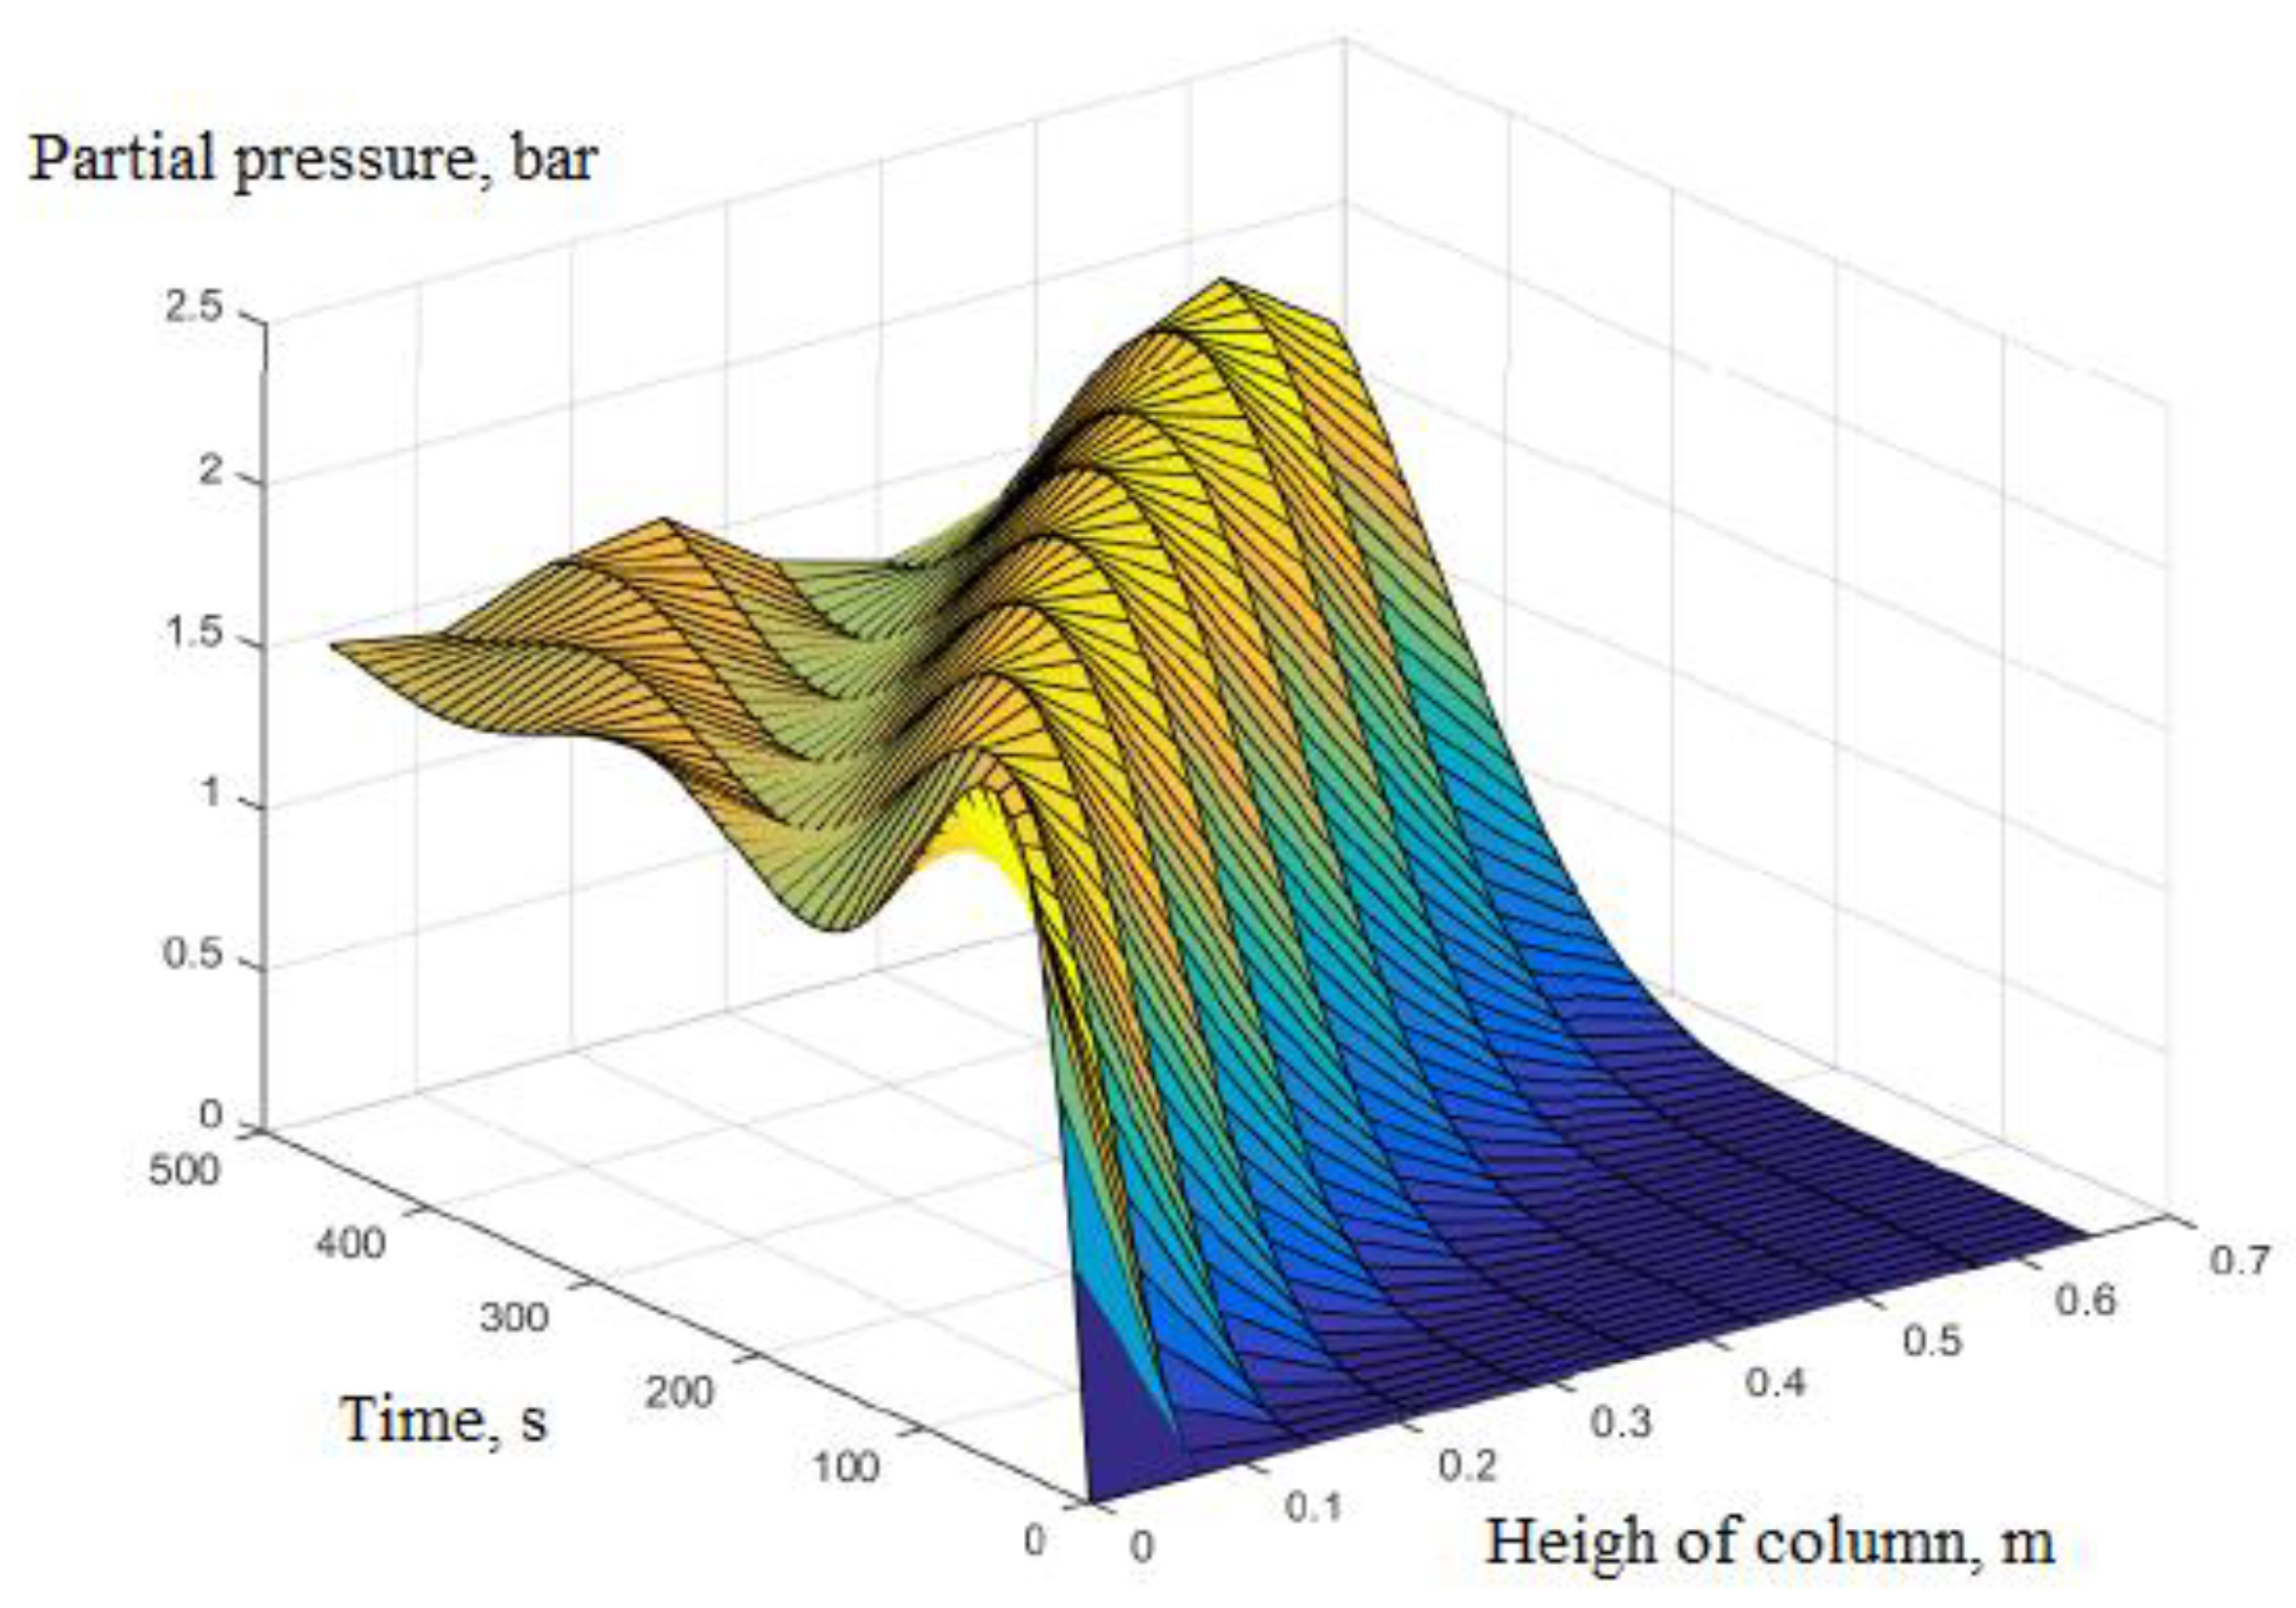
| 1 | Rules of pressure change, bar | Partial pressure (O2) changes over time and according to the height of the column. | The change in total pressure over time and the height of the column. | The same rule, but the experiment measured the rule of total pressure and gas concentration N2 and O2 at the output of the column. The concentration of O2 gas decreases in accordance with the height of the column, which can confirm the reliability of the model being established. |
| 2 | The optimal working pressure of the column, bar | 5.5 bar | 5 bar | The optimum pressure is nearly the same, because this error is chosen because the speed in the model is constant, in fact it is changed by 20% because O2 is adsorbed. In addition, there are errors due to the calculation of porosity and diffusion coefficient. So, this error is acceptable. |
| 3 | Drop pressure, bar | 0.148 bar | 0.18 bar | The drop pressure measured is greater because in the simulation only the material layer is calculated without taking into account the upper and lower filter materials and sieves. |
| 4 | Adsorption time, s | 25 s | 35 s | Experimental adsorption time is greater due to the late flow of air through the empty front and rear cylinders to stabilize the pressure and evenly distribute the gas. |
© 2019 by the authors. Licensee MDPI, Basel, Switzerland. This article is an open access article distributed under the terms and conditions of the Creative Commons Attribution (CC BY) license (http://creativecommons.org/licenses/by/4.0/).
Share and Cite
Chinh, P.V.; Hieu, N.T.; Tien, V.D.; Nguyen, T.-Y.; Nguyen, H.N.; Anh, N.T.; Thom, D.V. Simulation and Experimental Study of a Single Fixed-Bed Model of Nitrogen Gas Generator Working by Pressure Swing Adsorption. Processes 2019, 7, 654. https://doi.org/10.3390/pr7100654
Chinh PV, Hieu NT, Tien VD, Nguyen T-Y, Nguyen HN, Anh NT, Thom DV. Simulation and Experimental Study of a Single Fixed-Bed Model of Nitrogen Gas Generator Working by Pressure Swing Adsorption. Processes. 2019; 7(10):654. https://doi.org/10.3390/pr7100654
Chicago/Turabian StyleChinh, Pham Van, Nguyen Tuan Hieu, Vu Dinh Tien, Tan-Y Nguyen, Hoang Nam Nguyen, Ngo Thi Anh, and Do Van Thom. 2019. "Simulation and Experimental Study of a Single Fixed-Bed Model of Nitrogen Gas Generator Working by Pressure Swing Adsorption" Processes 7, no. 10: 654. https://doi.org/10.3390/pr7100654
APA StyleChinh, P. V., Hieu, N. T., Tien, V. D., Nguyen, T.-Y., Nguyen, H. N., Anh, N. T., & Thom, D. V. (2019). Simulation and Experimental Study of a Single Fixed-Bed Model of Nitrogen Gas Generator Working by Pressure Swing Adsorption. Processes, 7(10), 654. https://doi.org/10.3390/pr7100654