1. Introduction
The increased attention received by the advance of a biomass-based economy resulted in the development of numerous technologies to convert biomass-based feedstocks into several different products. Tied to it, methodologies and tools to evaluate the standalone performance of the technologies, as well as processing pathways, have also received attention within the (chemical) Process Systems Engineering (PSE) community.
PSE contributions to the area can be broadly divided in two levels of analysis/evaluation: the first level implies the creation of suitable processing flowsheets for each technology or set of technologies which, after modeling and simulation, allows for the calculation of overall yields and economic parameters. At the second level, these results might be combined to create feedstock to products processing superstructures that can be modeled as networks and optimized to find optimal processing strategies.
Tools used for modeling and simulation include commercial process simulators such as Aspen Tech softwares, SuperPro Designer, Chemcad, etc., which are commonly taught in undergraduate Chemical Engineering courses. Therefore, many (experimental) research groups working in the development of technologies/new products have a certain level of familiarity with them, and perform techno-economic evaluations of their proposed processes either by themselves or in collaboration with research groups with a PSE background. Other more advanced tools allow for integrating process design with process control, and evaluation of impacts (see ICAS [
1]), and to systematically generate processing alternatives that improve a base case processing route (see SustainPro [
2] and the works by the authors of [
3,
4] for examples specific to biomass-based products). In particular, the latter are helpful in the creation of processing trees that can be used as input for the proposal of processing superstructures.
Although being a powerful tool for comparison among alternative strategies and for pathway selection, superstructure-based approaches require an optimization background, and thus are not commonly used outside the PSE community. This fact was recognized by Kim et al. [
5], and resulted on the development of a nonexpert friendly web application for optimization-based synthesis of biomass to fuel strategies, which was recently launched (see [
6]). As described in the article that presents the tool [
7], the application allows the user to define the compounds and technology nodes and enter the required parameters (prices, availability/demand, conversion/yields, etc.), either by hand or by uploading a spreadsheet such as the ones that are prepared by commercial simulators. Then, the network is cast into the optimization problem reported by Kim et al. [
5] and solved after selecting an appropriate objective function.
A generic biorefinery contains processes for the conversion of biomass into fuels as well as processes for the conversion of biomass into higher value-added products. In previous work (see the works by the authors of [
8,
9]), it was discussed that the generic biorefinery can be divided in two very distinct sections: a section that is devoted to deconstruct the biomass in different intermediates, and another one that sequentially upgrades these intermediates into a series of products, creating a valorization chain. Commonly, research groups developing biomass-based technologies focus on a portion of the value chain, and work in collaboration with other research groups to proper design upstream and downstream processes. To provide a framework that integrates and organizes the designs proposed by these different research groups, Torres et al. [
8] proposed an Aspen Plus-based “Collaborative Environment” for simulation. As seen in
Figure S1, it makes use of Aspen’s “Hierarchy” blocks to organize alternative technologies of the same type. For example, technologies required for fractionation of biomass are classified in four categories: “Biomass Conditioning”, “Recovery of proteins and extractives”, “Pretreatment”, and “Hydrolysis”; each category is considered a technology type, and underneath the hierarchy the user can find process flowsheets for the technologies themselves. As an example, the “Pretreatment” block contains process flowsheets for acid, alkaline, and organosolv pretreatments, and the “Hydrolysis” block process flowsheets for chemical and enzymatic hydrolysis. Technologies for the upgrade of pretreatment products, such as glucose, cellulose, lignin, etc., are categorized so that outlet compounds of these technologies coincide with the classification of chemical products proposed by the 2004 US-DOE “Top value-added chemicals” report [
10]. Clearly, by mixing and matching technologies within different blocks, any researcher working on biorefineries, and experienced in simulations, can easily create and evaluate different processing pathways.
Moving forward, the next step is to connect the proposed Aspen Plus-based Collaborative Environment with an optimization tool that automatically formulates a pertinent network optimization problem, allowing the locating of the best processing pathway. In this paper we report the development of a web-based tool that mimics the structure of the Collaborative Environment, automatizes the generation of a GAMS-executable optimization problem and programmatically connects with Aspen Plus to load and simulate data.
The paper is organized as follows. The first section presents the web-based tool and discusses its structure, scope, and use in view of the process network that will be generated; data entry focusing on the connection with Aspen Plus is discussed at the end of it. The second section describes the formulation of the optimization problem generated by the tool. The third section presents an example of implementation of the tool. A summary of the work is provided in the final section.
2. Description of the Web-Based Tool
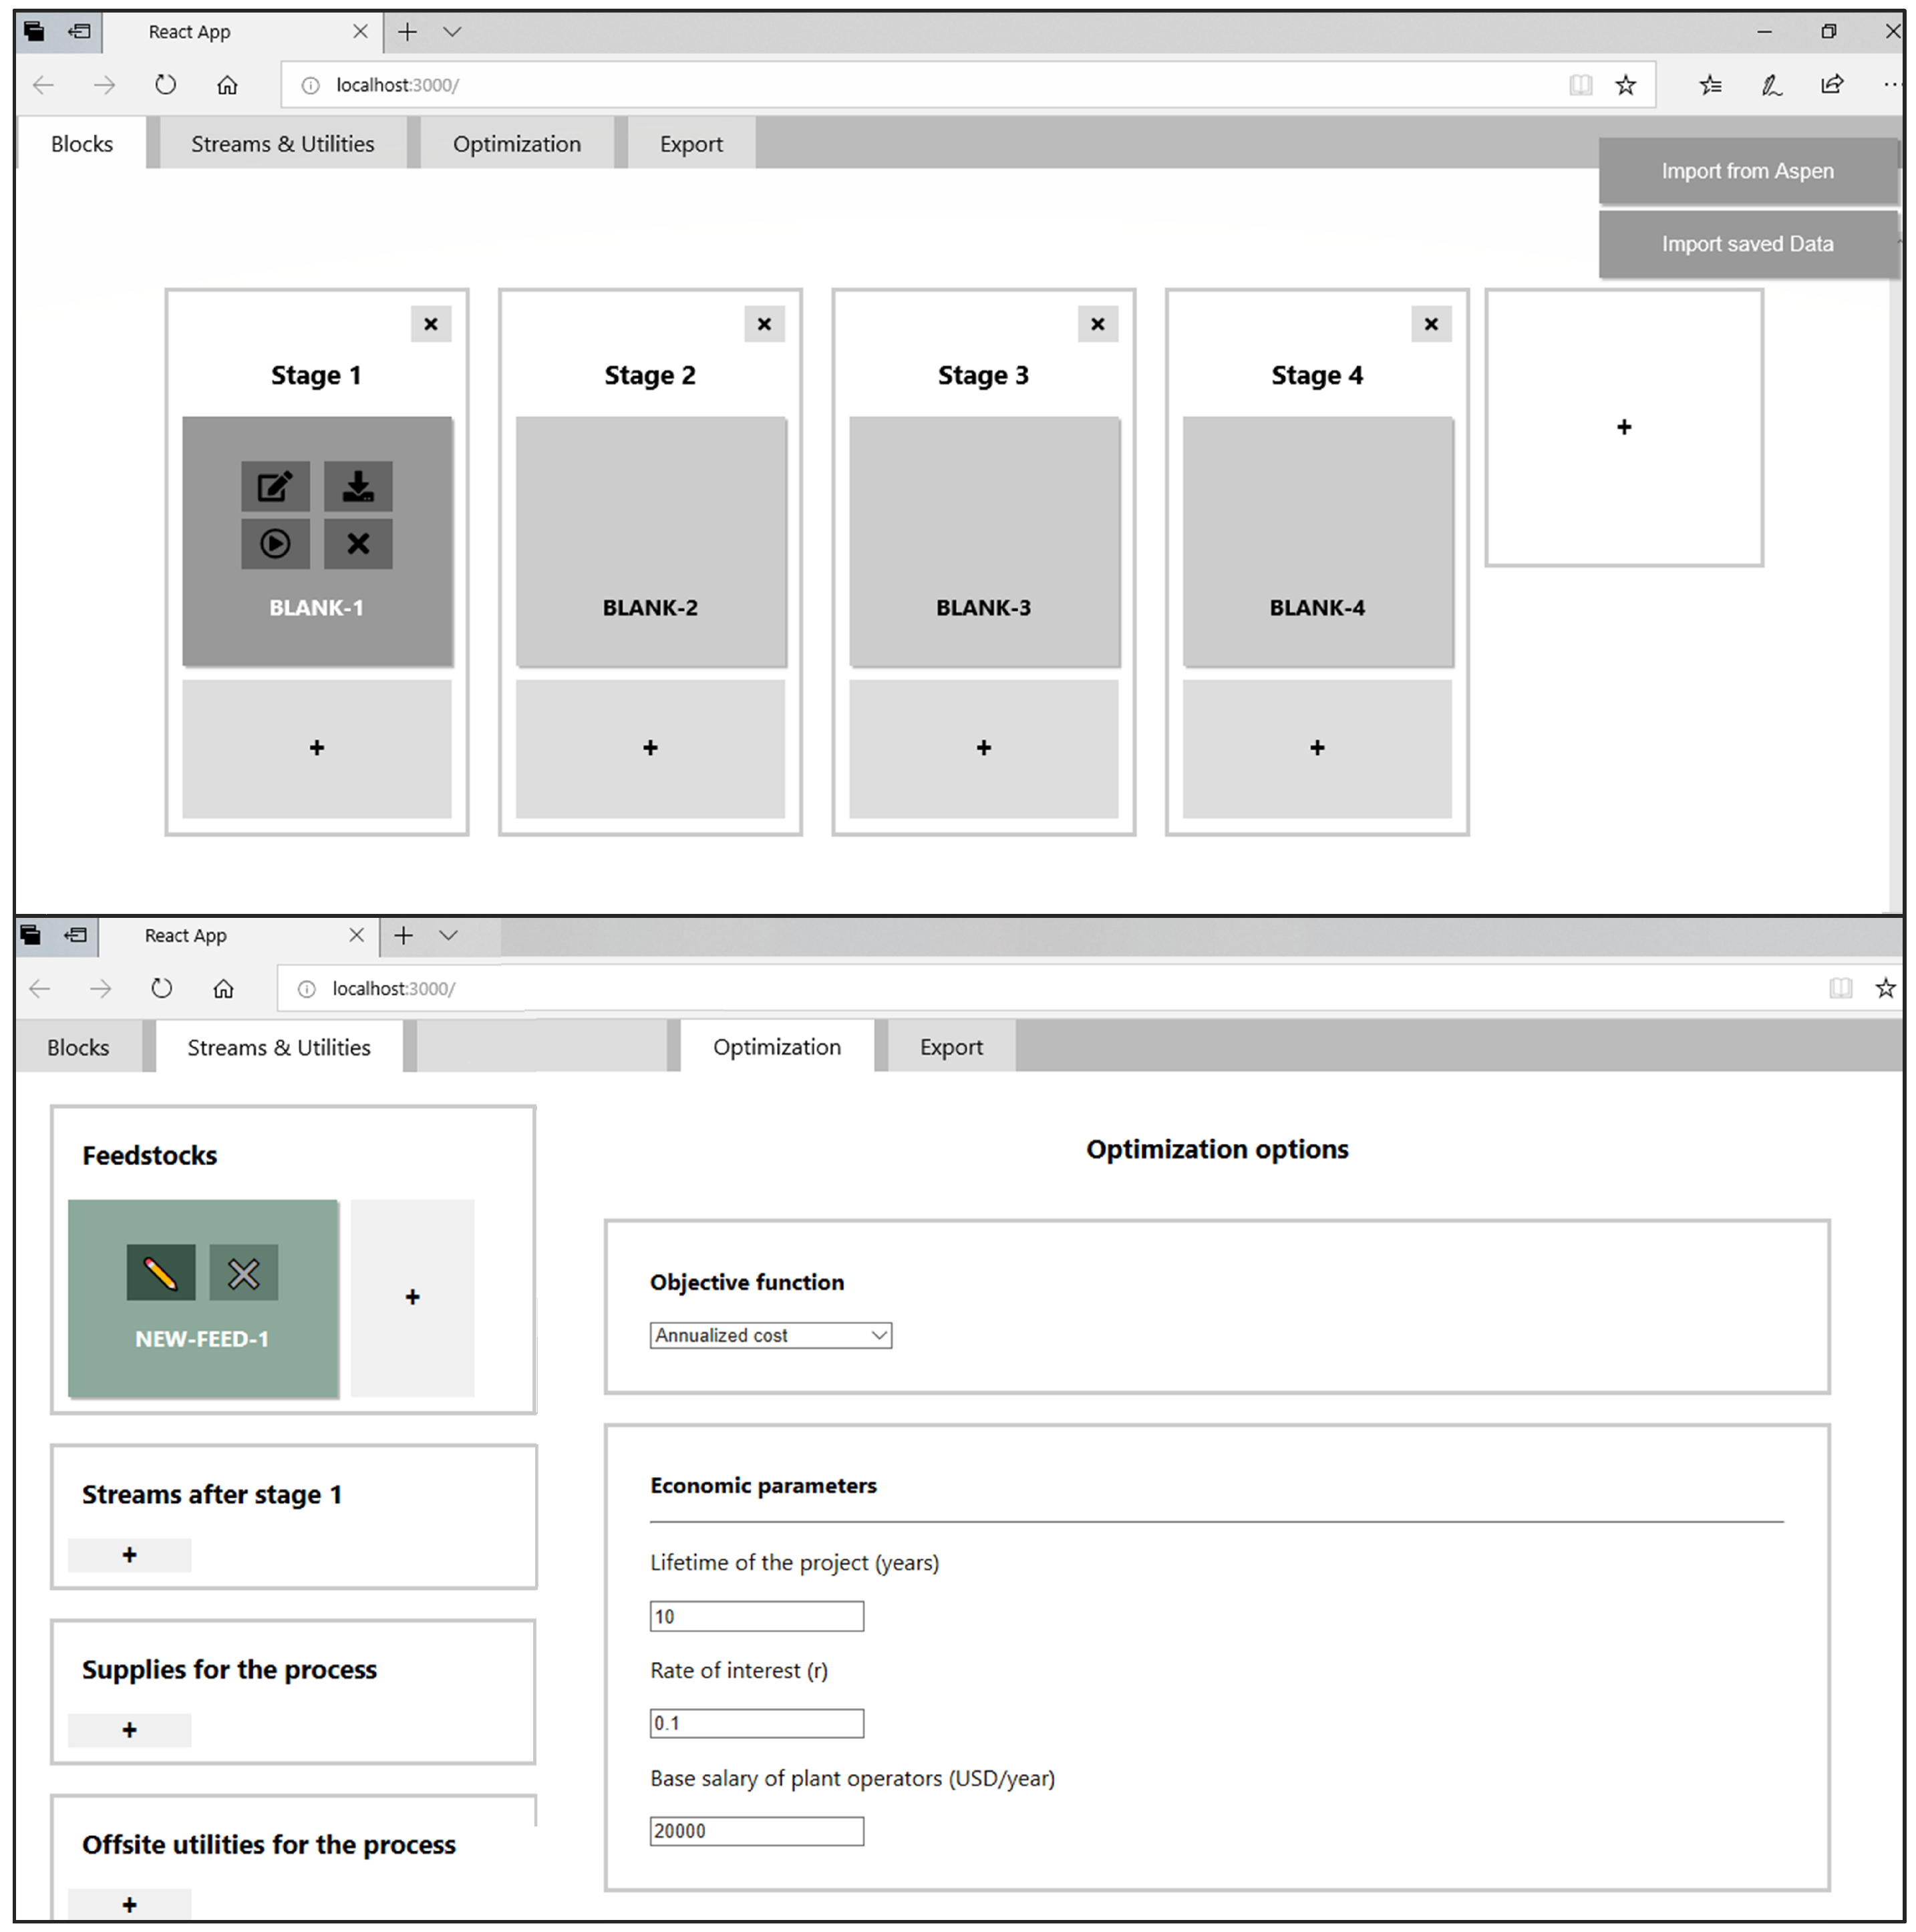
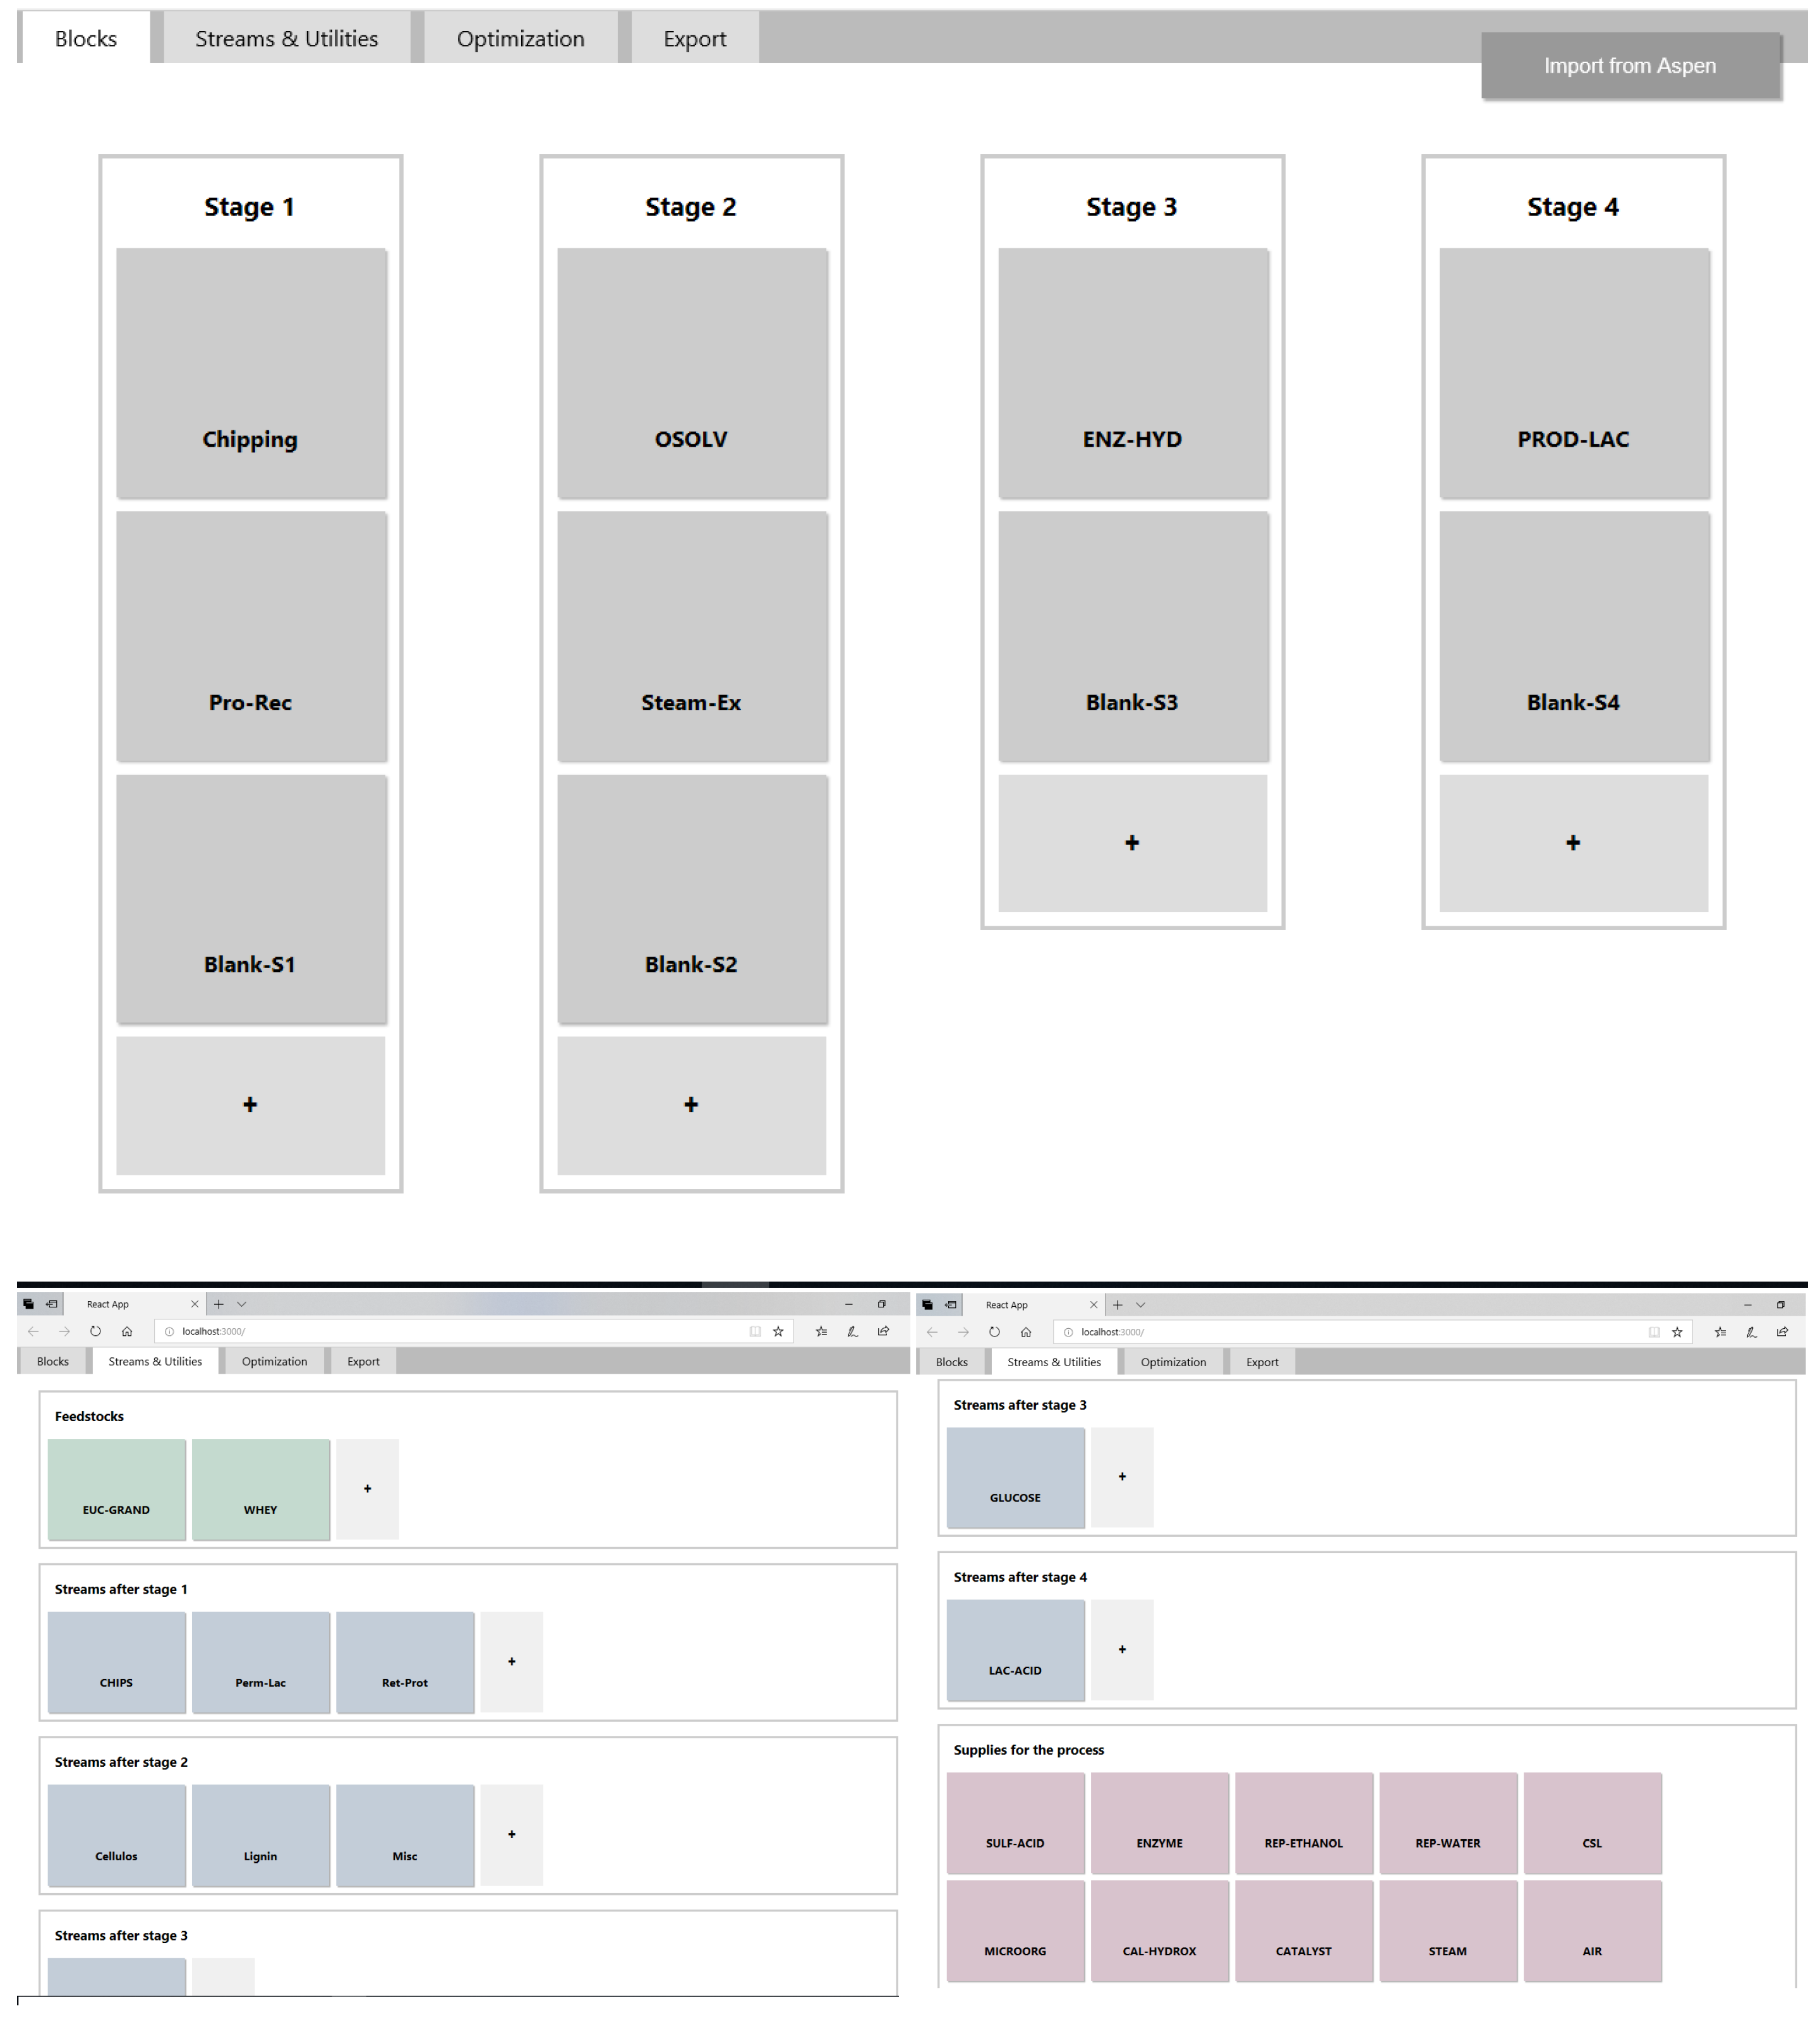
Figure 1 shows a screenshot of the GUI of the tool, which is written in React, a JavaScript library for building user interfaces [
11]. In the example shown, four consecutive stages are considered. For each stage, the user inputs as many technologies as desired. Note that although the tool was thought to mimic the structure of the Collaborative Environment, exact match is not a requirement, i.e., the user only inputs those stages and technologies that are pertinent to her/his work.
Feedstocks, intermediate compound streams, as well as supplies and utilities required for the technologies are entered in the “Streams & Utilities” tab. As will be explained later, both technology blocks and streams for the intermediate compounds, represent nodes of the processing network and are placed in alternation. Thus, streams that contain biomass-based compounds must be placed following the “after stage” rationale. This is, all streams serving as feedstocks are placed within the “Feedstocks” block; all streams that represent a product from any of the technologies categorized as “Stage 1” are placed within the “Streams after stage 1” block, etc. Supplies and Utilities are entered in specific blocks included within the same tab.
Regarding data needs, “Feedstocks”, “Streams”, and “Supplies” blocks only require a name for the stream; a price for the stream might also be entered. Utilities required by the process might be purchased or produced internally. Following Seider et al. [
12], if being produced internally, the cost of the off-site facilities must be included so that it can be considered within the capital costs.
Conversion and all data required for cost estimation must be entered into the Technology blocks; the GUI provides a clickable button to open up a new window where data is entered. Conversion data is entered by specifying fluxes for all inlet and outlet streams. For each technology, a key inlet stream must be defined; this stream is the one that has the most relevant compound, i.e., the one whose conversion is sought. As examples, a key inlet stream for a “Pretreatment block” might be any stream rich in lignocellulosic biomass; and a key stream for a “Hydrolysis block” any stream rich in cellulose. As a technology might process key streams that are similar but actually represent different compounds (e.g., cellulose pulp from eucalyptus vs. cellulose pulp from pine or cellulose pulp from organosolv pretreatment vs. cellulose pulp from acid hydrolysis), and thus also result in different specifications for the outlet streams, all possible key input streams must be included at this point. The way the tool handles this possibility is by keeping track of the processing steps required to reach a particular stream. Any other input stream (including supplies) that does not contain the key compound, is entered in a similar fashion as a plain input stream. Output streams are entered similarly.
Costs associated with the equipments required by each technology block are bulk entered in the same window. Following Seider et al. [
12], labor-related costs can be estimated considering the number of operations related to fluids, solids, and mixed fluid-solids, thus information regarding these might be entered.
Once “Streams and Utilities” and “Blocks” are defined and all possible connections established, a processing network is built, and the GAMS code for the optimization problem described in
Section 3, is automatically generated. Two possible objective functions—the Net Present Value and the Annualized Cost—have already been built in the code; the user has to select one of them through the “Optimization” tab. The “Optimization” tab also includes some options for computation of the objective functions that the user may change. The options include the lifetime of the project, the interest rate, the yearly base salary of plant operators and the annualization factor. Two other options, namely “Big M value” and “ Maximum number of Blank Technologies”, that affect the optimization code have also been included, the need for these options will become clear after describing the problem in
Section 3, and will be discussed at that point. In the present version, the GAMS code is not automatically executed, requiring manual download of the user. The code is self-contained, so it can be easily submitted to the (free) online NEOS Server [
13] for resolution, if the user does not have a license for it.
Upload of Aspen-Plus Simulation Data
As described above, data can be manually entered into the tool. However, this is a time-consuming and error-prone activity, whose automatization is desirable. To simplify data entry, the tool includes a connection to Aspen Plus so that data from converged simulations can be uploaded.
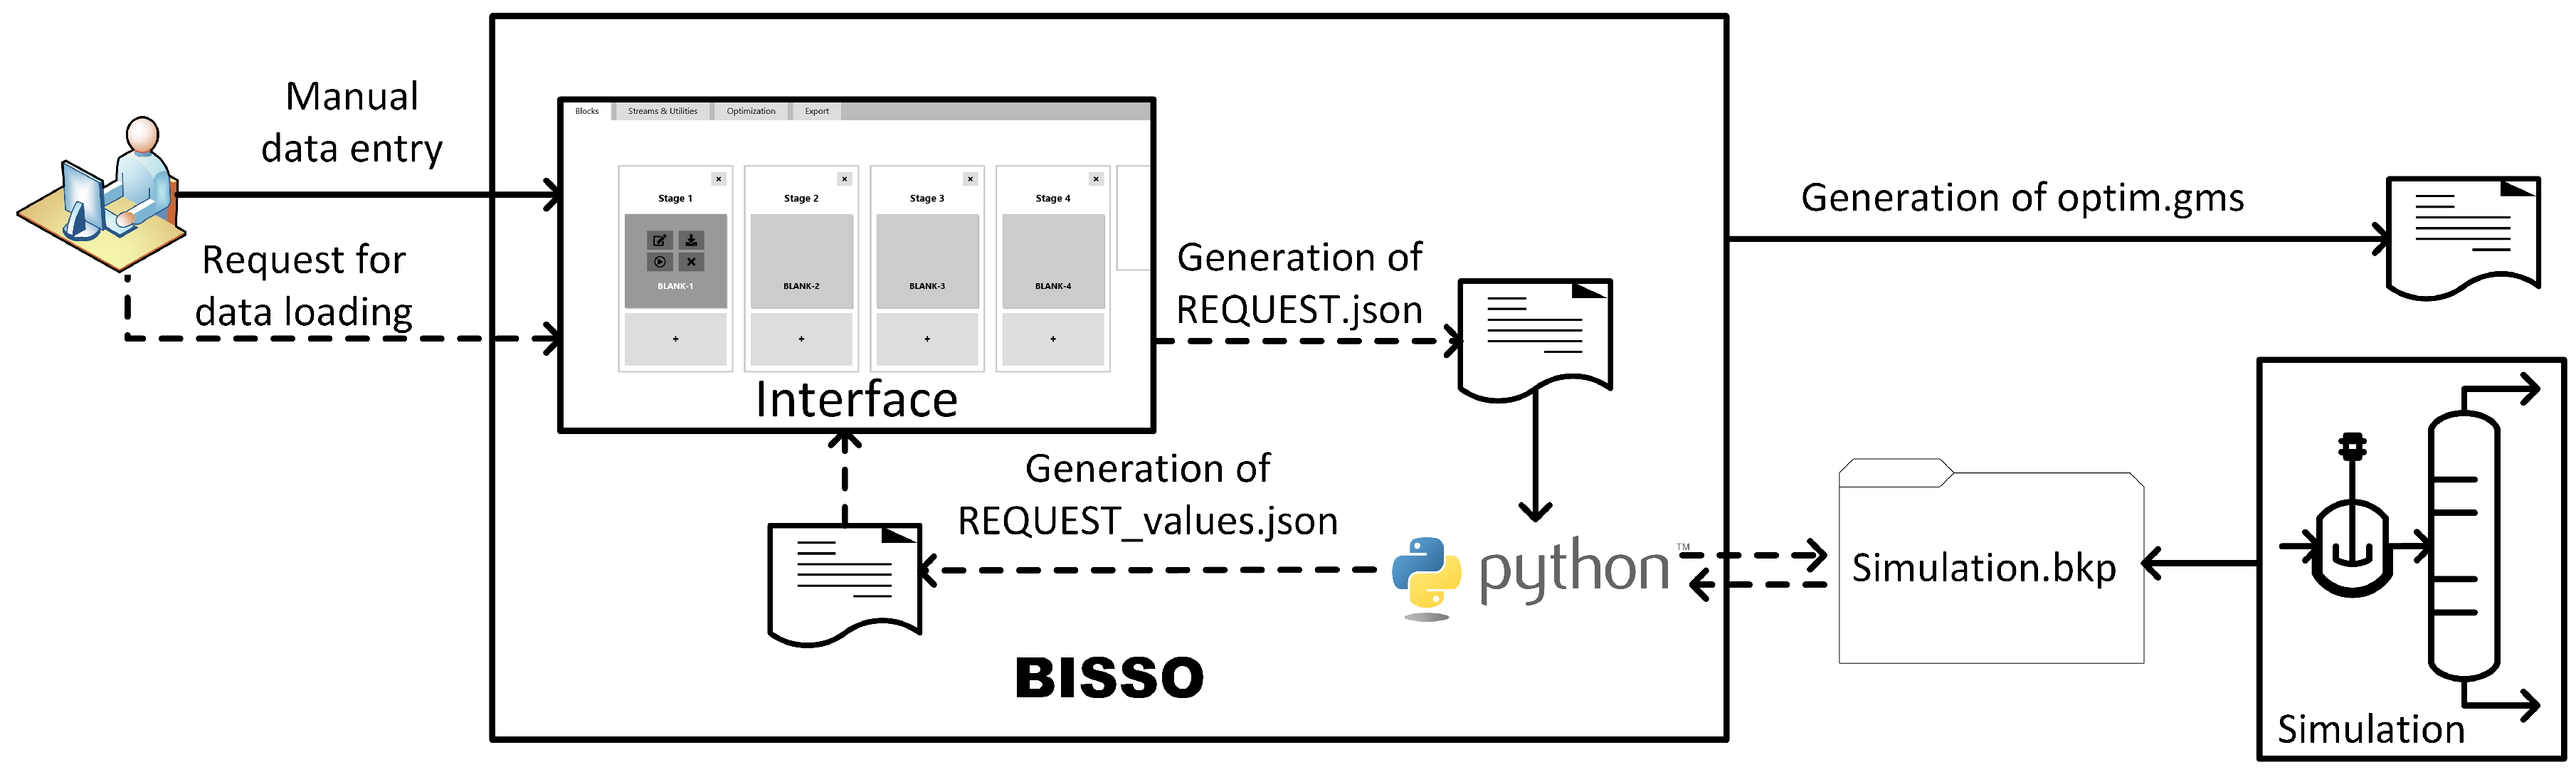
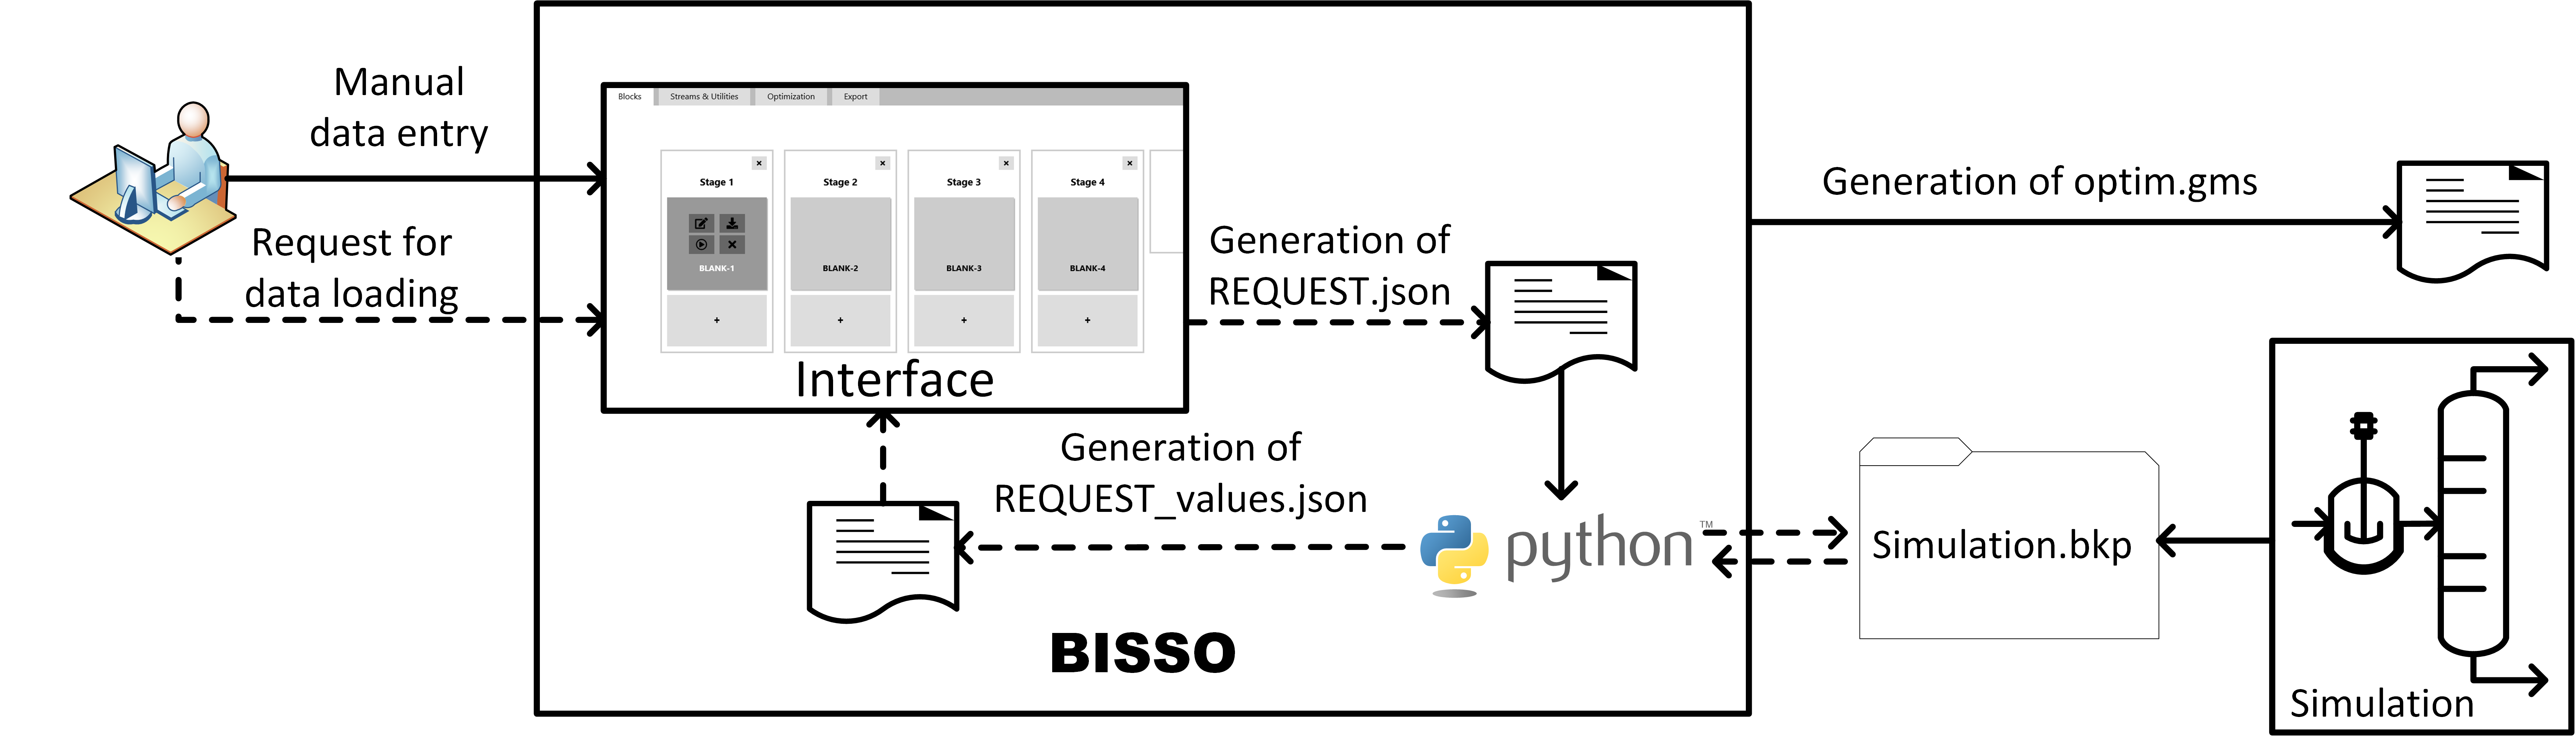
For connecting with Aspen Plus, we have considered the procedure reported in Kitchin et al. [
14]. Briefly, the reference describes a way of using Python [
15] to access data from an Aspen Plus simulation that has already been run. In the present version of the tool, we have generated a Python algorithm that receives the requests from data from the tool (in the form of a
.json file), translates the request into the variables used in an Aspen Plus simulation, loads the results saved in the
.bkp file, translates back the results into the variables used in the tool, and generates an output
.json file that can be loaded back by the tool. The flow of information for this procedure is summarized in
Figure 2.
Within the tool itself, a clickable button placed next to the “Edit” button used for manual data entry is available for generation of the request file to be sent to the Python code (see
Figure 1). By clicking this button, a new window opens up and requests the user to (i) specify the path leading to the technology (i.e., feedstock and all previous processing steps which as mentioned before affect the properties of the outlet streams) and (ii) identify the names given in the Aspen Plus simulation to the streams relevant to the technology under consideration and match them with the names given to these streams within the tool. An example is given in
Section 4. Upon doing this, the import data request file is generated. As the intention is to use the tool in conjunction with the Collaborative Environment described in the introduction, it is assumed that the Aspen Plus
.bkp file is that of this environment. However, the code could be modified to upload data from technologies saved in different Aspen Plus files.
The option of sending data to Aspen Plus so as to re-run simulations is also included as an extra clickable button. So far, BISSO has the capability of programmatically requesting changes in mass flows, recycle rates, and yields in RYIELD reactors. A request file similar to the one described in the previous paragraph is used for this purpose. Data files generated by executing the Python code are imported back to BISSO using a specific clickable button included to this end.
3. Optimization Problem Generated by BISSO
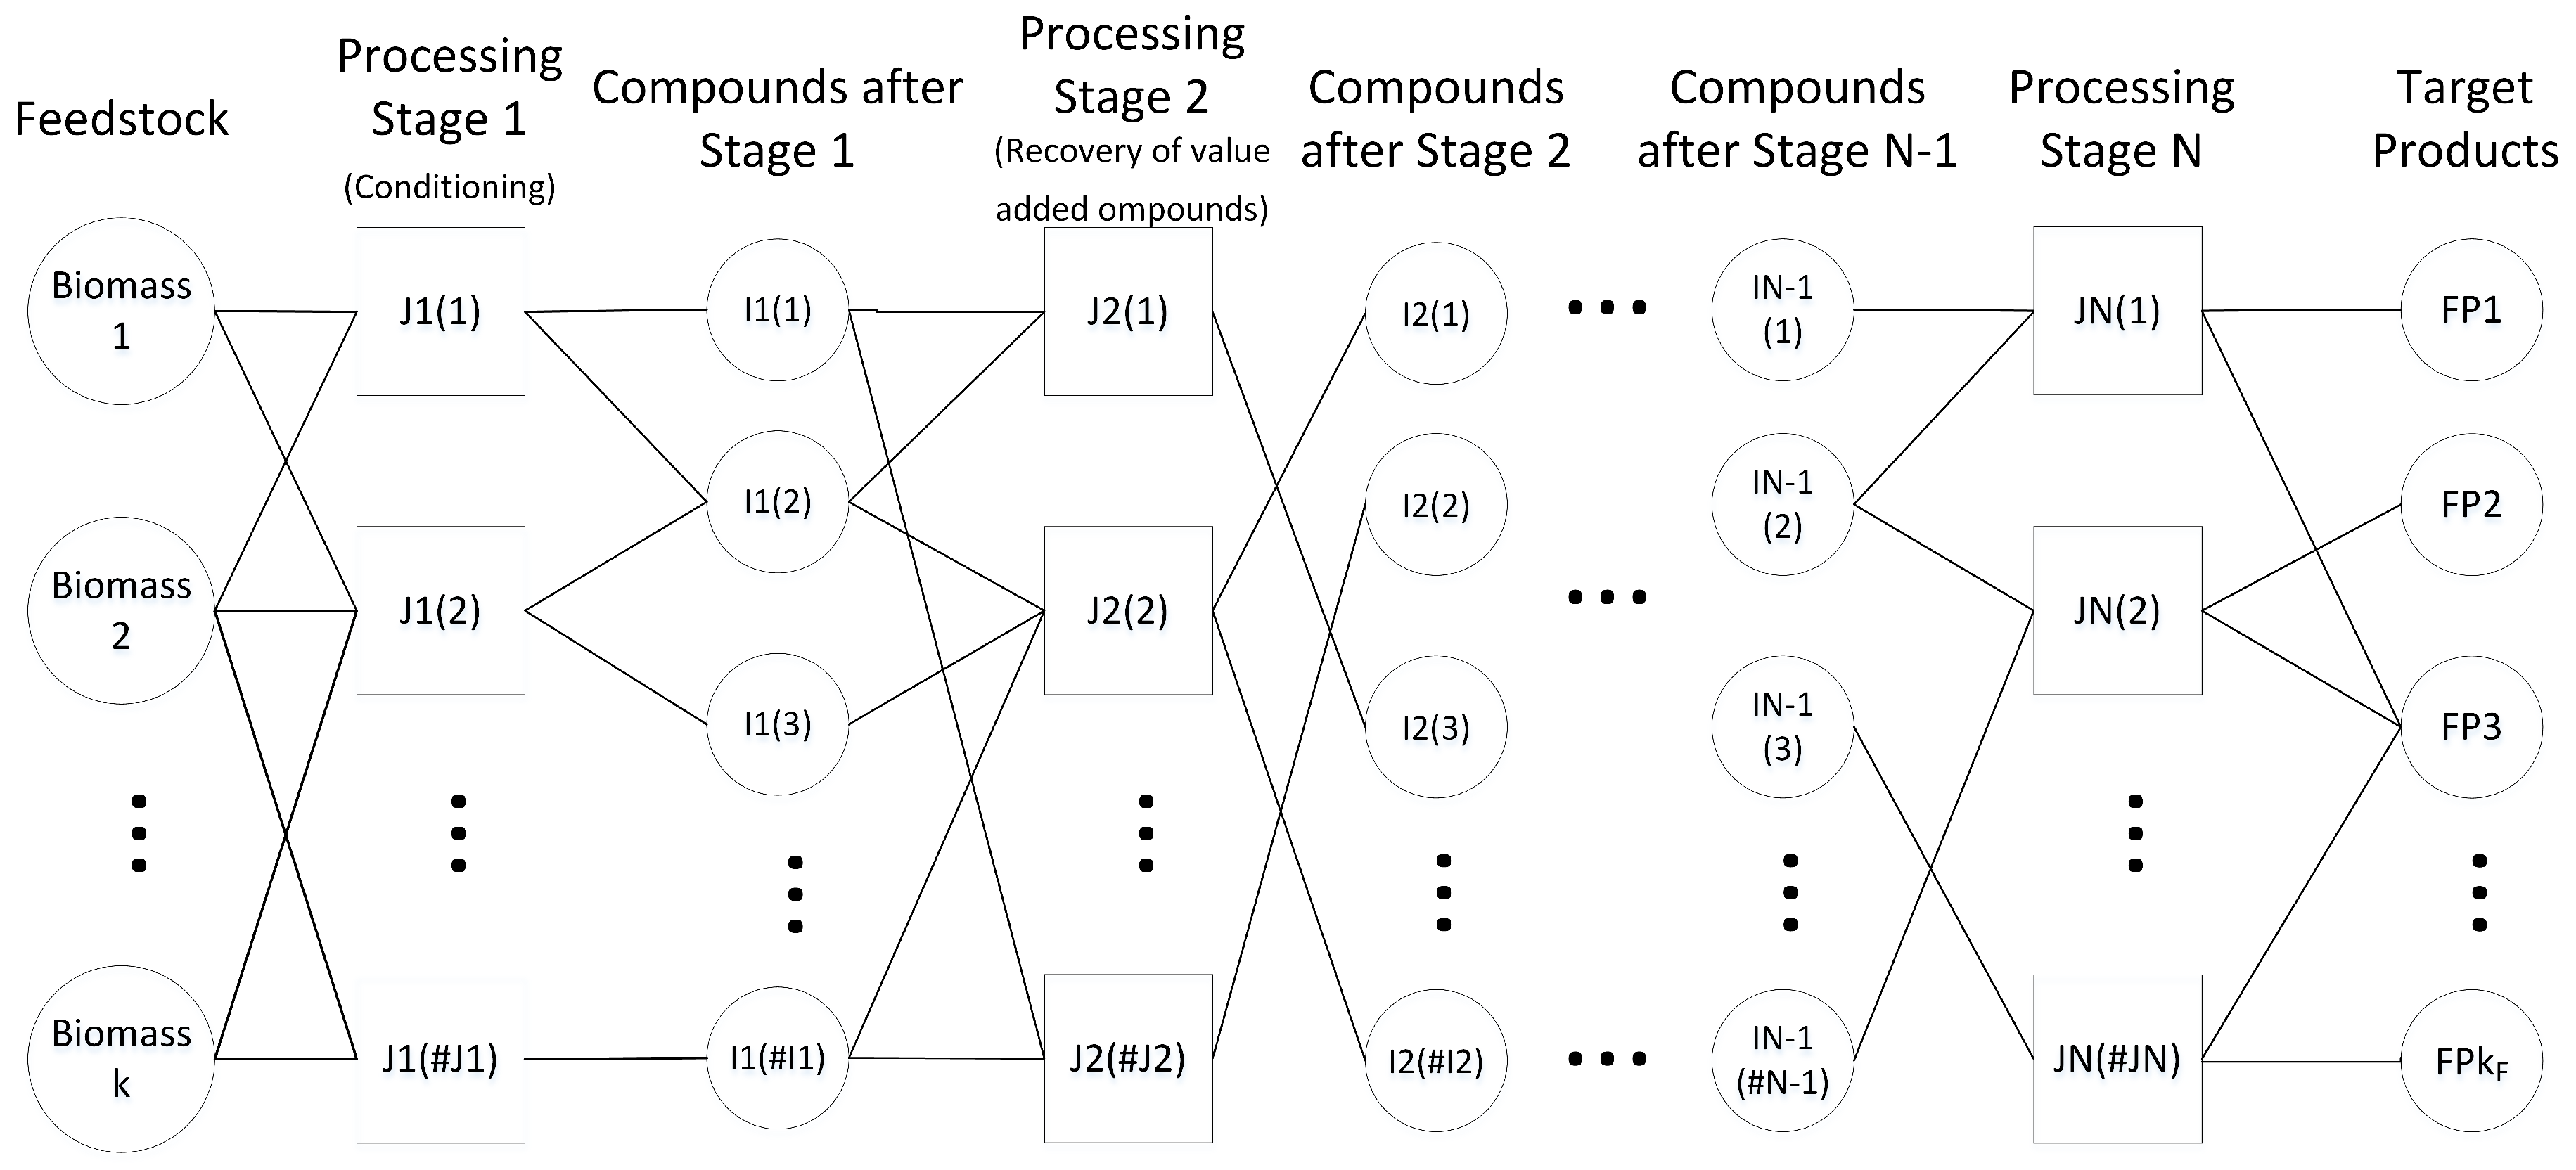
Figure 3 shows a simplified network representation of the biomass to products superstructure considered in the tool we have developed. As seen, two types of nodes are considered: compounds nodes, which represent streams with a certain composition rather than pure compounds, and technology nodes, which represent the processing alternatives described in the Collaborative Environment. Arcs connecting the nodes indicate possible inlet/outlet flows of each compound in/out of each technology.
The constraints of the optimization problem are defined by the mass balances in the nodes. Compound nodes act as mixers/splitters of the streams coming from and going to technology nodes, i.e., they do not change their physical characteristics or chemical composition. Technology nodes perform all the operations related to chemical/physical changes. For derivation of the model, we have considered linear input–output relationships for each technology; these relationships correspond to conversion data obtained for example from the Aspen Plus Collaborative Environment.
As compounds and technologies may or may not be present in the optimal process, each node is assigned a binary variable: denotes the binary variable assigned to feedstock f, and denotes the binary variable assigned to technology block in stage i. The following equations provide the relations that act as constraints of the optimization problem.
Feedstock selection. It is assumed that one and only one feedstock must be selected (i.e., there is no trivial solution):
Technology nodes:
- –
Technology selection. One and only one technology block is allowed for each processing stage. Herein, it has to be noted that stage bypassing is still allowed as each stage is assumed to have a “Blank” technology block:
- –
Mass balances in technology nodes. As mentioned before, inlet–outlet streams for each technology block are inputs provided by the user, and as they are the result of process simulations, it is reasonable to assume that mass balances are satisfied. The complexity of modeling the relationships in the technology nodes stem from the fact that the outlet of a technology block depends not only on the inlet compound but also on how that inlet compound was obtained. For example, consider a technology block that represents an enzymatic hydrolysis process. This type of process would be at least a stage 3 technology block, as it requires a stage 1 technology block that processes wood logs into chips of a certain size and a stage 2 technology block that separates the cellulose from the rest of the matrix (pretreatment technology blocks). Evidently, the result of processing cellulose by enzymatic hydrolysis is not the same if cellulose resulted from a steam explosion process or an organosolv process. Therefore, constraints relating to input–output information of technology blocks have to take into account not only which compound is being processed, but also the path that allowed production of that compound. We have taken the approach detailed below:
- ∗
A variable
is defined to assign an index to order all the possible processing paths and feedstock combinations up to stage
i as
This variable
then denotes a pathway,
g:
. An example of the assignment is provided in the
Supplementary Information.
- ∗
A binary variable
is defined for each pathway, then
if and only if the pathway is active i.e.,
,
,
, etc. This can be written as
Note that the restrictions in Equations (
1) and (
2) imply that there exists only one
so that
, i.e., only one pathway is possible (thus the constraint
is not required for this formulation). Also, it has to be noticed that Equation (
4) implies a nonlinear function of binary variables, which can be recast in a set of linear equations as reported in Biegler, Grossmann and Westerberg [
16]. Thus, in the formulation, Equation (
4) is substituted by the set of Equation (
5).
- ∗
with the above definitions, inlet and outlet streams for compounds, supplies, and utilities are computed as
where
,
,
, are GAMS parameters that are defined by BISSO using the data uploaded by the user, as discussed in
Section 2, and
is the index given to the Technology block in stage
i that is related to
.
- –
Logical restrictions stating that if at a certain technological stage a non-blank technology node is active, then a key stream associated with a non-blank technology node has to have a non-zero flow, and vice versa. Basically, these restrictions force
to
and
to
for all non-blank technology nodes, or in other words blank technology nodes become active (i.e.,
) if and only if all key streams have zero flow.
where
and
are arbitrary large numbers.
Compound nodes:
- –
Binary variables associated to the nodes: Given the restrictions in Equations (
6)–(8), if a compound has an inlet or outlet non-zero flow from a technology,
, then the node is consumed or produced by a technology, thus is active. We define binary variables
and
that become active if and only if an intermediate compound is consumed or produced; thus, the following constraints apply,
where, as before,
–
are arbitrary large numbers.
- –
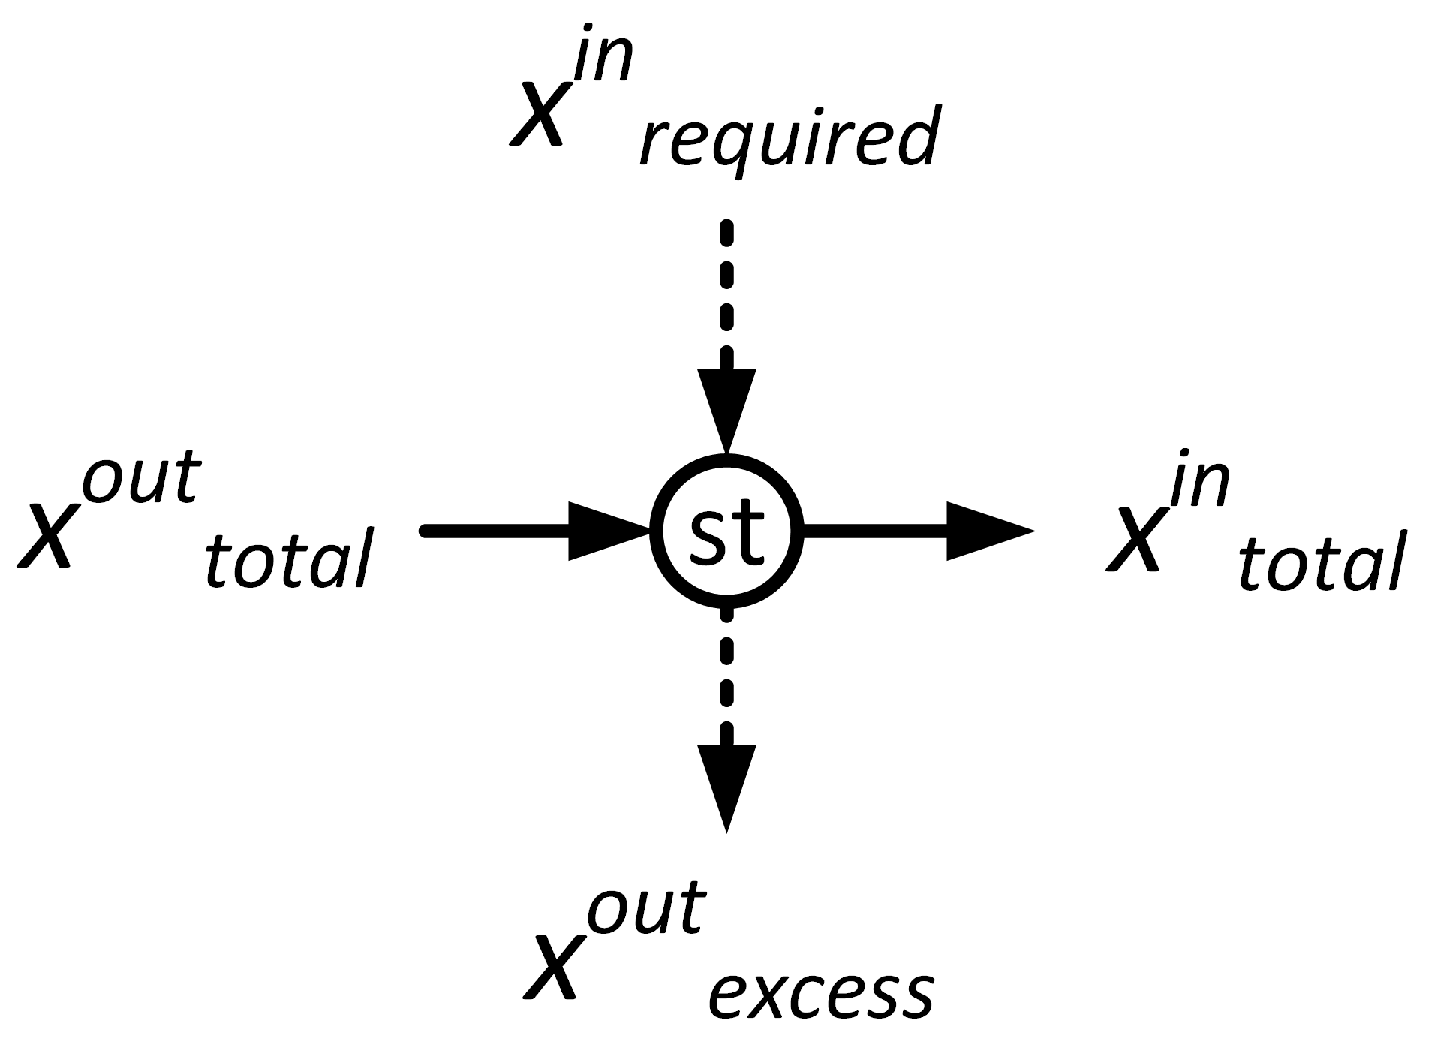
Mass balances: We do not consider the constraint
, which states that all the intermediate produced must be consumed within the superstructure as it is not realistic; for example, an intermediate might be only partially consumed by downstream technologies or a small external purchase might be required. Instead we compute the total imbalance of intermediates as
Then, if
is negative, there is a need for an external (i.e., market purchase) source of intermediate and, if positive, the intermediate must be disposed. With this consideration a generic compound node might be represented as shown in
Figure 4, and Equation (
16) or Equation (
17) must be included in the node.
Binary variables
and
are defined as active if Equation (
16) or Equation (
17) are satisfied, respectively, and can be related to
using a big M approach as before,
To prevent a solution in which the node is solved by buying and selling an intermediate without producing (i.e.,
) binary variables,
and
also have to be related, as shown in Equation (
22)
Within the BISSO GUI, we have included for each stream the option of considering it a possible final product, this is, streams resulting from nonfinal stages may also be considered as salable products. The optimization code generated by the tool incorporates a constraint which forces the selection of just one of these products.
In the current first version, BISSO includes the capability of computing capital and operational expenses (i.e., CAPEX and OPEX), and computes either the Total Annualized Cost (TAC) or the Net Present Value (NPV) as the objective functions to be minimized, these are computed as:
where
is the annualization factor,
represents the lifetime of the project, and
r is the interest rate, all inputs from the user which might be changed in the “Optimization tab”.
For computation of CAPEX, as total equipment (installed) cost for each technology block is requested by BISSO, the total equipment cost is computed by multiplying these by the corresponding binary and adding the contributions of all the blocks:
The Total Capital Investment (TCI) is then computed by considering appropriate factors for yard improvements, buildings, service installations (i.e., steam generators and electricity), etc., as recommended in process design textbooks.
OPEX include raw materials and utilities costs, labor costs, maintenance costs, operating overhead, and depreciation. Raw materials and utilities costs are computed by multiplying their prices (data requested by BISSO) to the corresponding flows and binary variables, and adding up. All the other costs are estimated following the procedure in Seider et al. [
12], which considers the type of process included in each block (i.e., only solids, only fluid, mixed, and information that is requested by BISSO) to compute labor costs, and then uses factors to estimate maintenance and overhead costs. Labor costs are then estimated by multiplying individual contributions of type of process for each technology block to the corresponding binaries and adding up all the blocks. Depreciation is computed by considering linear depreciation assuming a salvage value of 20%.
Considering the equations above the problem is a Mixed Integer Linear Programming optimization problem, the GAMS file generated by BISSO includes a call to GAMS/Cplex [
17] for its solution. Solver options are as default with the exception of the addition of the solution pool option so that in addition to the optimal solution; other nonoptimal solutions are also reported.
4. Demonstration of BISSO: Production of Lactic Acid from Residues
Lactic acid is one of the “top ten” biomass-based building blocks [
18], which has gained attention as it can be easily produced by fermentation of many biomass-based feedstocks. The lactic acid global market is projected to be USD 3.82 billion in 2020 and is growing at a compound annualized growth rate (CAGR) of 18.6% [
19], due to the popularity of polylactic acid (PLA), a biobased and biodegradable polymer, for use as a sustainable replacement of many fossil-based polymers. In previous works [
20], we have analyzed different pathways for the production of Lactic Acid from lignocellulosic and milk & cheese industry (whey) residues. Although the number of processing options simulated so far do not justify the use of optimization to find the most economical solution, we will still use this example as a demonstration of the tool we have developed.
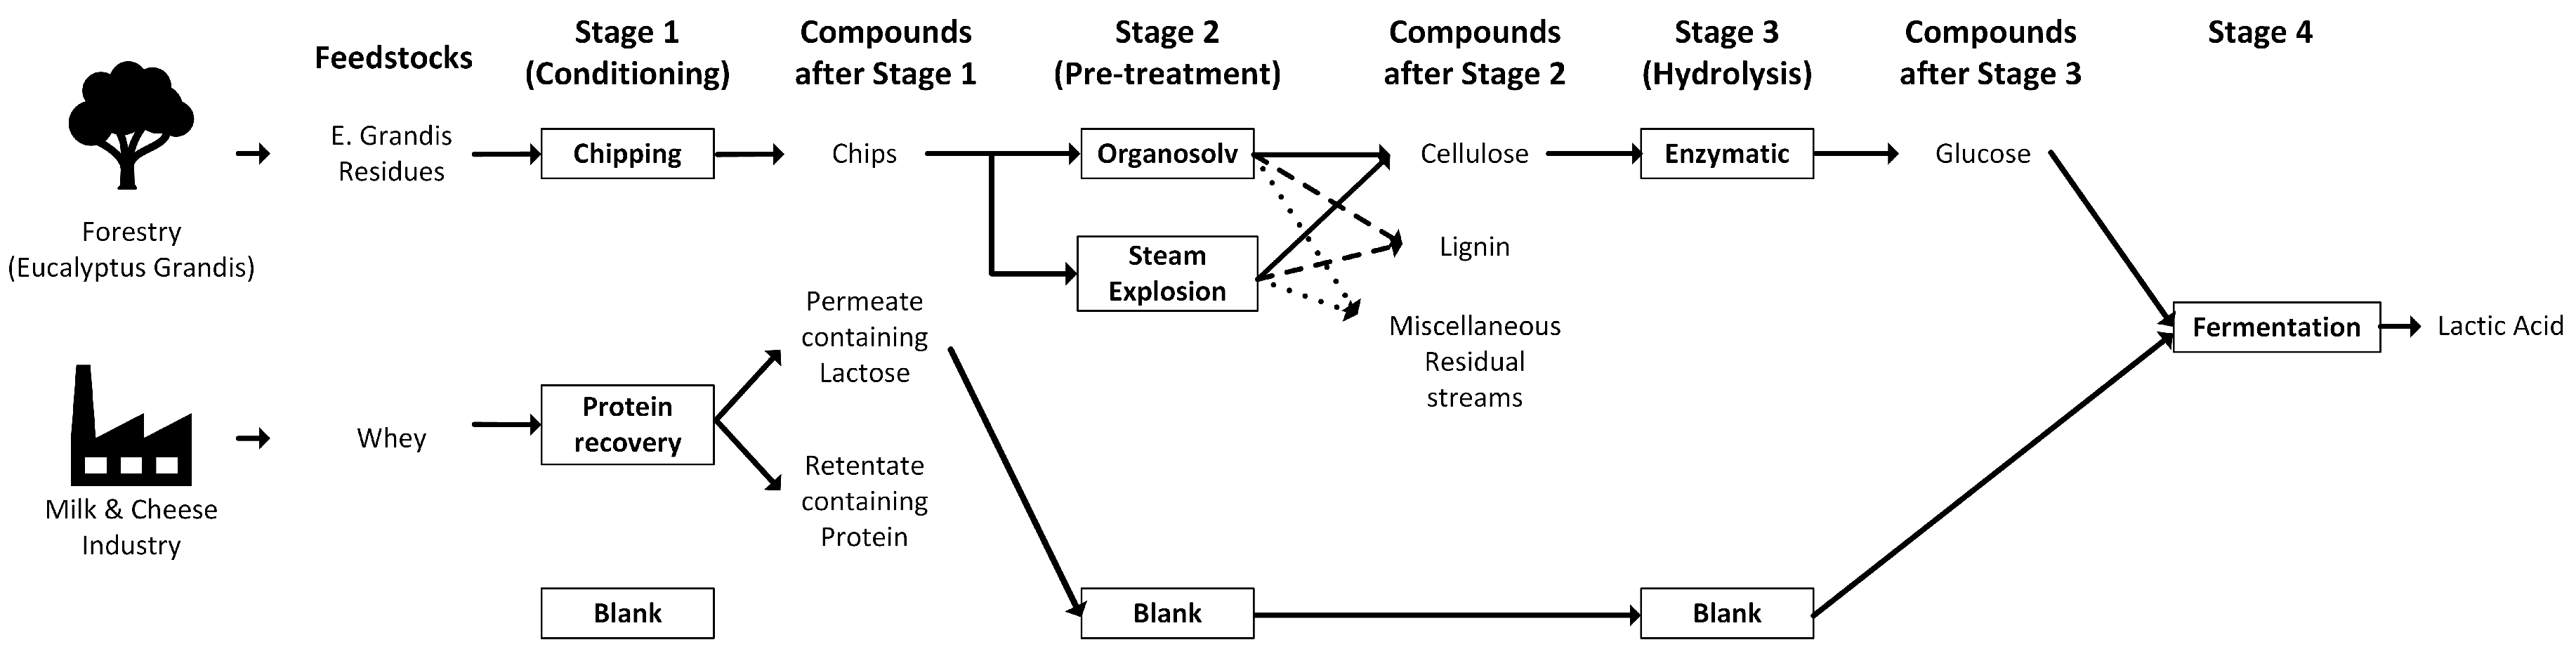
Figure 5 shows the lactic acid production network that was considered for the demonstration. As seen, it includes two feedstocks, four processing stages with six technology blocks plus a blank each (i.e., a total of ten technology blocks will be included), and eight compounds (seven intermediates and the lactic acid product).
Figure 6 shows a screenshot of how these blocks are implemented in BISSO.
Aspen Plus process flowsheets are available for all the technologies and are discussed in a previous work [
20]; data from the simulations provided information on the supplies and utilities that were required. The
E. grandis → Chipping →
E. grandis chips → Organosolv Pretreatment → Cellulose → Enzymatic Hydrolysis
E. glucose → Fermentation Lactic Acid pathway has been also implemented in the form required by the Aspen Plus Collaborative Environment described in the Introduction (see
Figures S1 and S2 for screenshots of the Collaborative Environment for this pathway).
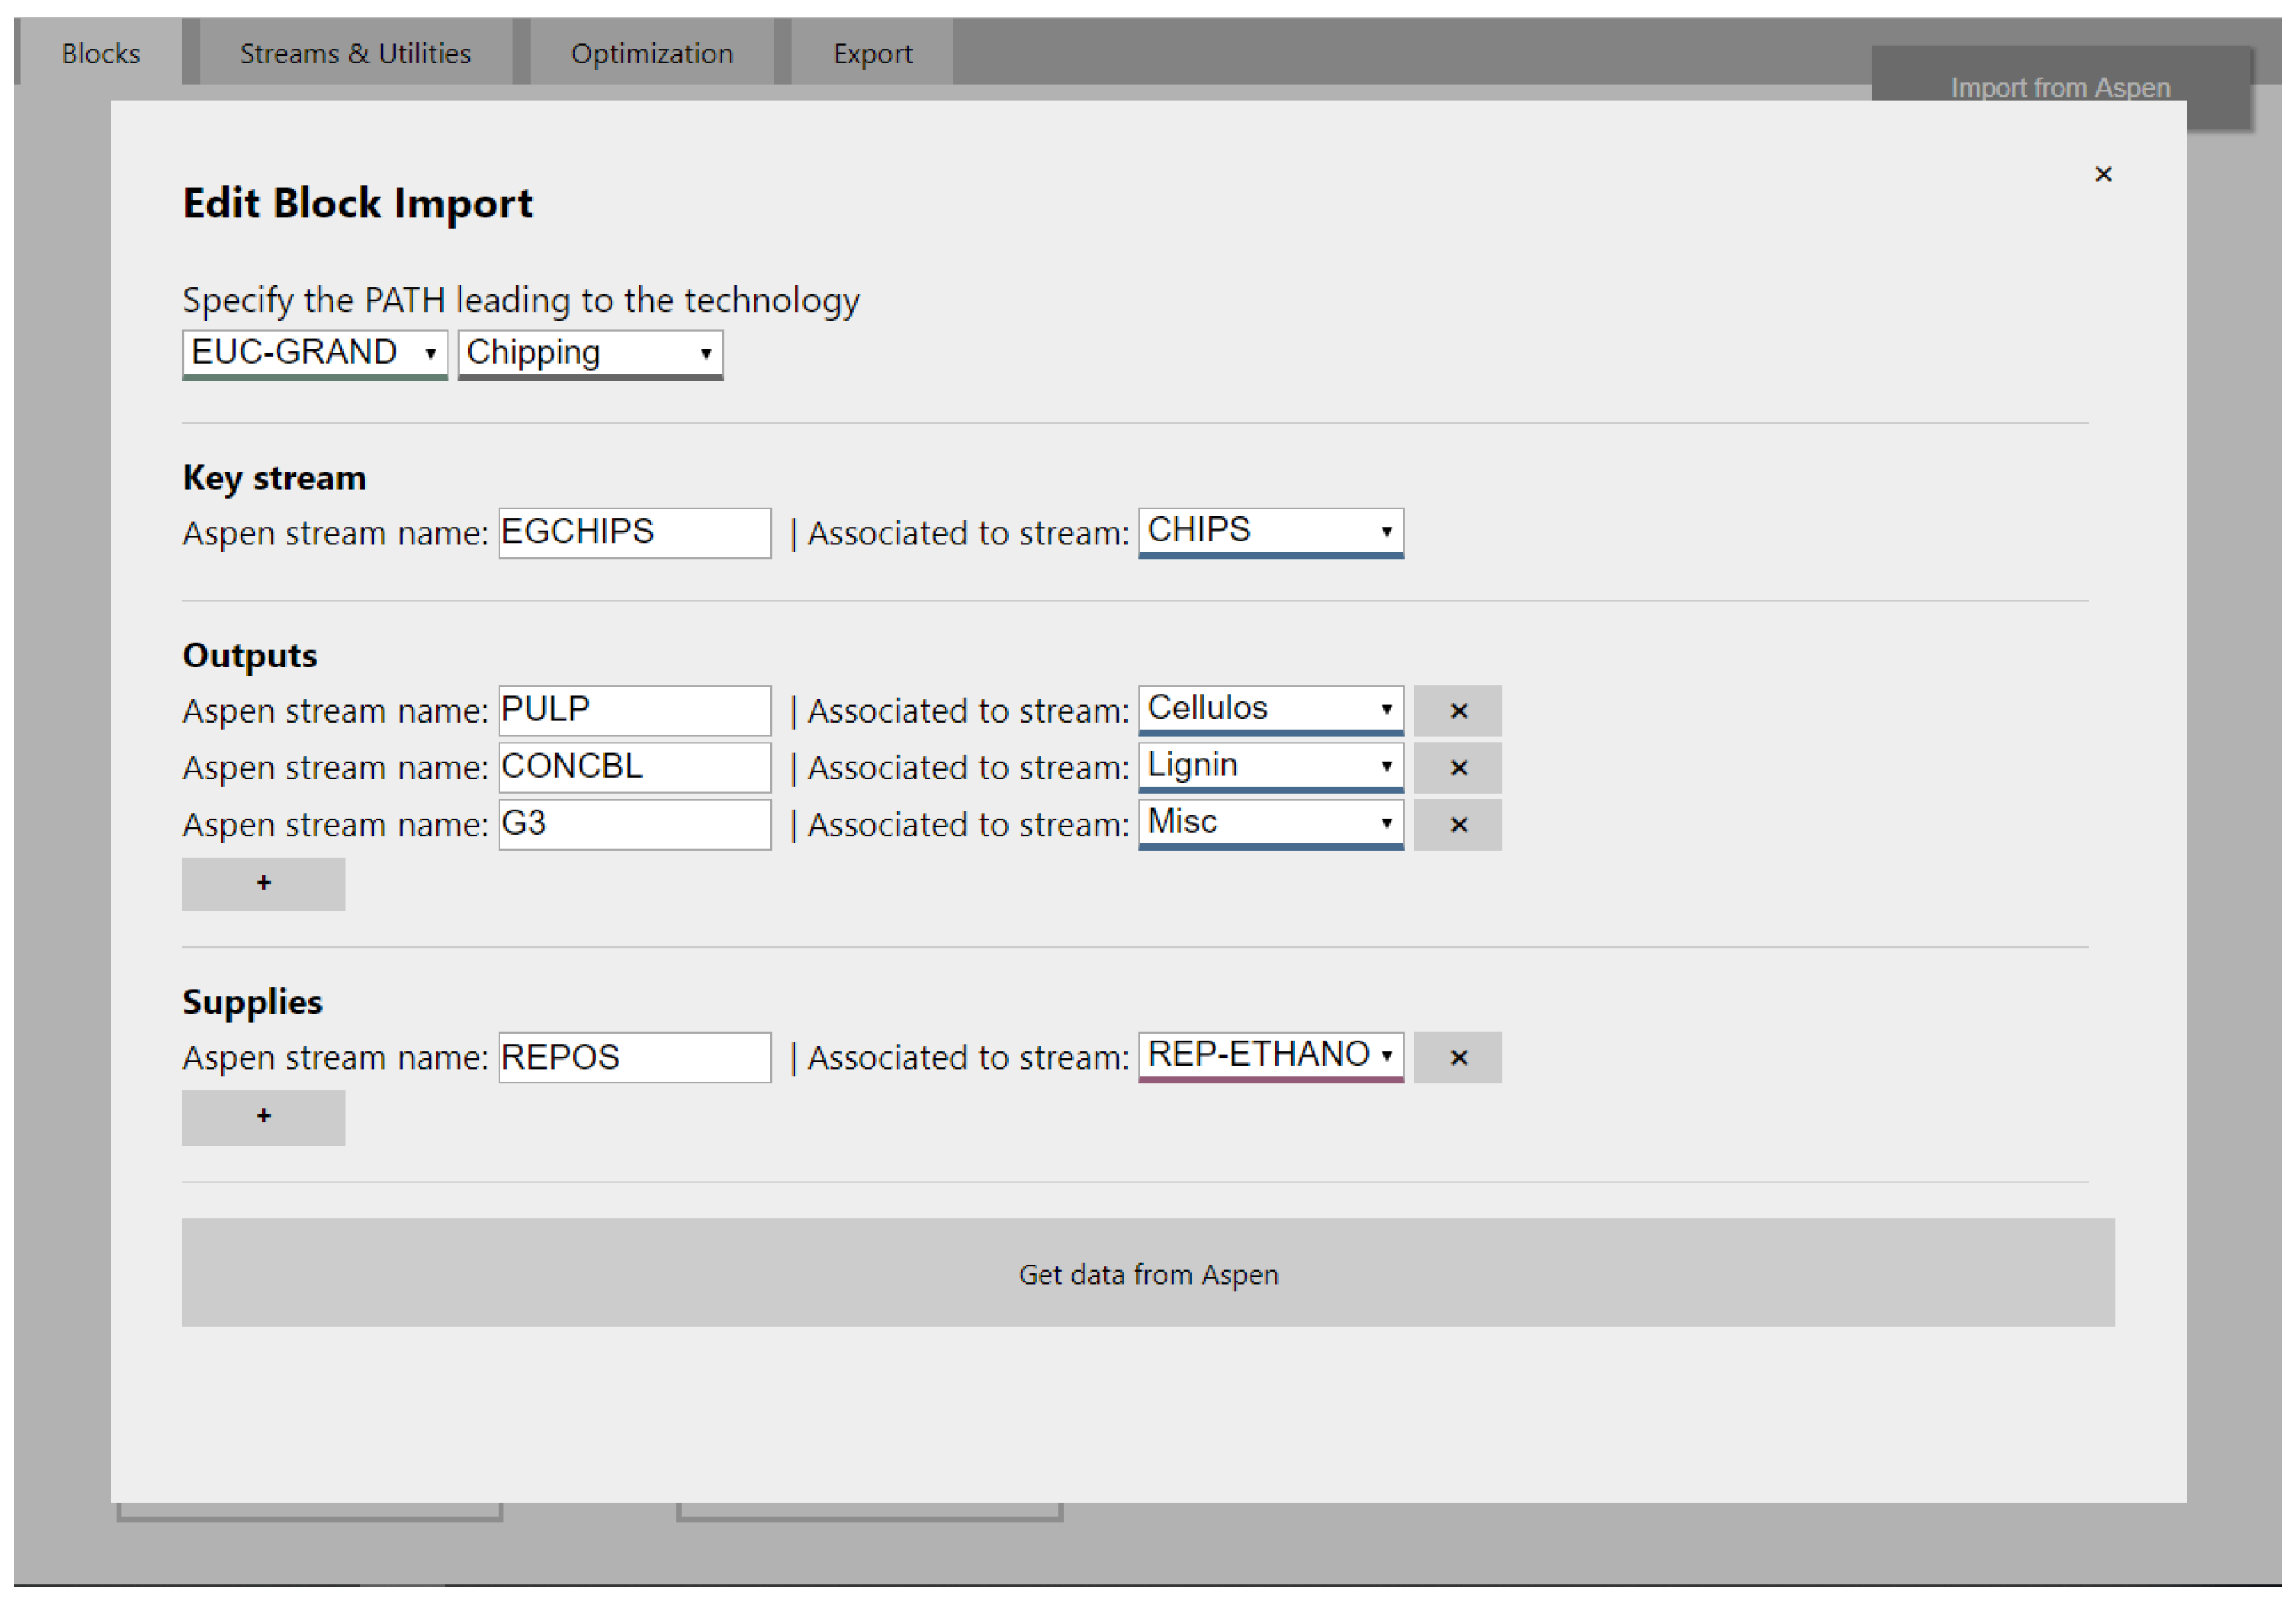
As an example of how the data loading from Aspen works,
Figure 7 shows the case of the Organosolv block. Notice the difference between the name of the compound in the tool and in the source
.bkp file, and also that data loading has only been allowed for streams connecting technology stages, i.e., the streams correspond to those that are outside the hierarchy blocks. This is not a limitation is a choice that we have made to make the use of the tool simpler. Access to the individual flowsheets (i.e., data inside the hierarchy blocks) has been implemented for cases where Aspen Plus runs need to be performed.
Section S4 in Supplementary Materials shows the
.json file generated to request access to Aspen Plus data and the Python code used to perform the request. Cost-related data (i.e., equipment and utilities/supplies costs) was manually entered.
The optimization code was validated by considering different sets of cost data. The base case data corresponds to the simulations reported in the already mentioned previous work and is presented in
Section S5 in Supplementary Materials. As expected, when lactic acid is set as the desired product, the optimal solution (for both economic objective functions) corresponds to the Whey → Separation of lactose and proteins (centrifugation) → lactose → Fermentation → lactic acid pathway; the second best solution is the
E. grandis → Chipping → Chips → Organosolv → Cellulose → Enzymatic Hydrolisis → Glucose→ Fermentation → Lactic Acid pathway. If Cellulose, Glucose, and Lactose are also marked in BISSO as possible salable products, the code returns as the optimal solution the pathway that has the least number of processing steps; this is also expected, as neither pathway has a positive NPV with the prices costs and economic parameters considered in the original data set.
Other sets of data used to run the code were variations of the base case intentionally manipulated to favor different solutions or failure to find a solution. The code was tested against several of these validation sets, which included diminishing the costs of the ”desired” pathway by at least three orders of magnitude, varying the prices of desired/undesired products, establishing impossible connections between nodes and technologies, the addition of new pathways leading to other fermentation products, etc. In all cases, the code was able to retrieve the desired optimal solution. However, in here it has to be mentioned, that in some cases using the default options GAMS/CPLEX retrieves a suboptimal solution. Although this is solved by manipulating the optimality tolerances of the algorithm, as the intention of this tool is to be useful for nonoptimization experts, we do not expect users to be knowledgeable on which tolerance should be adjusted. We have circumvented this by including the solution pool option as a default feature of the tool. With this, all case studies retrieved the optimal solution and at least the three next best solutions.
5. Summary and Future Perspectives
In this work, we have presented a tool for optimization of biomass conversion processes that was developed thinking on its use by researchers knowledgeable in biomass conversion and process modeling, but lacking a background in optimization. The tool has its basis in an Aspen Plus Collaborative Environment idea for the development and analysis of biomass conversion pathways that was proposed in previous works [
8]. The goal is that researchers working on different processes of an overall biomass conversion network may contribute with flowsheets specifically developed for their part of the process and connect them with flowsheets developed by other researchers working on other areas. Although the tool is exemplified through a case study that considers biochemical conversion processes, thermochemical-based processes may also be fit to the same structure (see
Section S3 in Supplementary Materials).
In the current version, the tool is presented as a web application in which researchers must provide the technology and compounds that will build the network. Data might be either entered manually or uploaded from Aspen Plus .bkp files. Then, given the network structure, yield, economic data, and the set of products that might be of interest, the tool automatically generates a GAMS file that solves the network for maximization of the NPV or minimization of the annualized cost. The tool uses CPLEX for solving the generated MILP problem, and besides the optimal solution, other possible solutions are also reported through CPLEX’s solnpool feature.
The main advantages of BISSO over currently existing tools for optimization of biomass-based processes are (i) ease of use, (ii) the possibility of connecting with Aspen Plus, and the (iii) recognition that although having the same main chemical compounds, the properties of an intermediate node depend on the pathway that led to that intermediate.
In the near future, we expect to make BISSO available through our University’s web host. We are currently working towards improving the tool by adding a feature that processes the results obtained by GAMS into user-friendly graphics, and expanding the Aspen-Plus connection capabilities.
Author Contributions
Conceptualization, A.I.T.; Formal analysis, F.M., J.F. and A.I.T.; Funding acquisition, A.I.T.; Investigation, F.M., J.F. and A.I.T.; Methodology, A.I.T.; Project administration, A.I.T.; Resources, A.I.T.; Software, F.M. and J.F.; Supervision, A.I.T.; Validation, A.I.T.; Writing—original draft, F.M. and A.I.T.; Writing—review & editing, A.I.T.
Funding
This research received funding from Agencia Nacional de Investigación e Innovación (ANII) Uruguay, Grant FSE_1_2015_1_1099976.
Acknowledgments
J. Ferreira thanks the Agencia Nacional de Investigación e Innovación (ANII) Uruguay for financial support for her graduate studies (Award n POS_NAC_2018_1_152185). A. I. Torres acknowledges partial support from Sistema Nacional de Investigadores (SNI).
Conflicts of Interest
The authors declare no conflict of interest.
Abbreviations
The following abbreviations are used in this manuscript:
| Biomass Interface for Superstructure Simulation and Optimization |
| Compound Annualized Growth Rate |
| Capital Expenses |
| installed cost of each technology |
| F | index for Feedstocks |
| Generalized Algebraic Modelling System |
| Graphic User Interface |
| i | index for Processing Stages |
| J | index for Technologies |
| index for Technology J at Processing Stage i |
| arbitrary big numbers |
| Net Present Value |
| operational expenses |
| P | index for the subset of compounds that might be sold to the market |
| index for the set of compounds |
| Total Annualized Costs |
| total |
| x | flow |
| inlet flow of a compound to a specific technology |
| inlet flow of a compound that needs to be purchased from the market |
| total amount of a compound that needs to be disposed (if positive) or purchased (if negative) |
| inlet flow of the compound selected as the key compound to a specific technology |
| outlet flow of a compound from a specific technology |
| flow of a compound produced in excess of technology needs |
| inlet flow of a supply to a specific technology |
| binary variable associated with consumption of a compound |
| binary variable associated with production of a compound |
| binary variable for feedstock F |
| binary variable for technology J |
| z | binary variable for individual pathways |
| , | binary variables for flow compounds required extra or produced in excess |
| individual index for each path |
References
- Gani, R.; Hytoft, G.; Jaksland, C.; Jensen, A.K. An integrated computer aided system for integrated design of chemical processes. Comput. Chem. Eng. 1997, 21, 1135–1146. [Google Scholar] [CrossRef]
- Carvalho, A.; Matos, H.A.; Gani, R. SustainPro-A tool for systematic process analysis, generation and evaluation of sustainable design alternatives. Comput. Chem. Eng. 2013, 50, 8–27. [Google Scholar] [CrossRef]
- Alvarado-Morales, M.; Terra, J.; Gernaey, K.; Woodley, J.; Gani, R. Biorefining: Computer aided tools for sustainable design and analysis of bioethanol production. Chem. Eng. Res. Des. 2009, 87, 1171–1183. [Google Scholar] [CrossRef]
- Papadakis, E.; Tula, A.K.; Anantpinijwtna, A.; Babi, D.K.; Gani, R. Sustainable Chemical Process Development through an Integrated Framework. In 26th European Symposium on Computer Aided Process Engineering; Kravanja, Z., Bogataj, M., Eds.; Elsevier: Amsterdam, The Netherlands, 2016; Volume 38, pp. 841–846. [Google Scholar] [CrossRef]
- Kim, J.; Sen, S.M.; Maravelias, C.T. An optimization-based assessment framework for biomass-to-fuel conversion strategies. Energy Environ. Sci. 2013, 6, 1093–1104. [Google Scholar] [CrossRef]
- Great Lakes Bioenergy Research Center. Biomass Utilization Superstructure: An Optimization-Based Web Application for Synthesis and Analysis of Biomass-to-Fuel Strategies. Available online: https://bus.glbrc.org/ (accessed on 20 September 2019).
- Ng, R.T.L.; Patchin, S.; Wu, W.; Sheth, N.; Maravelias, C.T. An optimization-based web application for synthesis and analysis of biomass-to-fuel strategies. Biofuels Bioprod. Biorefin. 2018, 12, 170–176. [Google Scholar] [CrossRef]
- Torres, A.; Cybulska, I.; Fang, C.; Thomsen, M.; Schmidt, J.; Stephanopoulos, G. A Novel Approach for the Identification of Economic Opportunities within the Framework of a Biorefinery. In 12th International Symposium on Process Systems Engineering and 25th European Symposium on Computer Aided Process Engineering; Krist, V., Gernaey, J.K.H., Gani, R., Eds.; Elsevier: Amsterdam, The Netherlands, 2015; Volume 37, pp. 1175–1180. [Google Scholar] [CrossRef]
- Torres, A.; Ures, P.; Philippi, C.; Kreimerman, R.; Gutiérrez, S. Creación de Herramienta Computacional Para la Simulación de Procesos de Conversión de Biomasa; Asociación de Ingenieros Químicos del Uruguay: Montevideo, Uruguay, 2017. [Google Scholar]
- Werpy, T.; Petersen, G. Top Value Added Chemicals From Biomass, Volume I-Results of Screening for Potential Candidates from Sugars and Synthesis Gas; Technical Report; U.S. Department of Energy: Washington, DC, USA, 2004. [Google Scholar]
- React.org. Available online: https://reactjs.org/ (accessed on 20 September 2019).
- Seider, W.D.; Lewin, D.R.; Seader, J.D.; Widagdo, S.; Gani, R.; Ng, K.M. Product and Process Design Principles: Synthesis, Analysis and Evaluation, 4th ed.; Wiley: Hoboken, NJ, USA, 2017. [Google Scholar]
- NEOS Server for Optimization. Available online: https://neos-server.org/neos/ (accessed on 20 September 2019).
- Kitchin, J. Pycse-Python3 Computations in Science and Engineering; Technical Report; Department of Chemical Engineering Carnegie Mellon University: Pittsburgh, PA, USA, 2018. [Google Scholar]
- Python Software Foundation. Available online: https://www.python.org/ (accessed on 20 September 2019).
- Biegler, L.; Grossman, I.; Westerberg, A. Systematic Methods of Chemical Process Design; Prentice Hall PTR: Upper Saddle River, NJ, USA, 1997. [Google Scholar]
- GAMS-Cplex. Available online: https://www.gams.com/latest/docs/S_CPLEX.html (accessed on 20 September 2019).
- Bozell, J.J.; Petersen, G.R. Technology development for the production of biobased products from biorefinery carbohydrates-the US Department of Energy’s “Top 10” revisited. Green Chem. 2010, 12, 539–554. [Google Scholar] [CrossRef]
- Markets and Markets. Lactic Acid Market by Application (Biodegradable Polymer, Food & Beverage, Personal Care & Pharmaceutical) & Polylactic Acid Market by Application (Packaging, Agriculture, Automobile, Electronics, Textile), & by Geography-Global Trends & Forecasts to 2020. Available online: https://www.marketsandmarkets.com/Market-Reports/polylacticacid-387.html?gclid=Cj0KCQjwuLPnBRDjARIsACDzGL32HN29hzLTDwfztVQQGJcGCHlbH8VuMwOHPUgf9XYfB70wjgIL11UaApoOEALw_wcB (accessed on 20 September 2019).
- Torres, A.; Helal, A.; Ures, P.; Estefan, N.; Kreimerman, R.; Gutiérrez, S. Selección de productos y tecnologías para valorización de residuos de biomasa: PLA como caso de estudio. In Proceedings of the 1er Congreso Nacional de Gestión Sostenible de Residuos, Montevideo, Uruguay, 28–29 November 2018. [Google Scholar]
© 2019 by the authors. Licensee MDPI, Basel, Switzerland. This article is an open access article distributed under the terms and conditions of the Creative Commons Attribution (CC BY) license (http://creativecommons.org/licenses/by/4.0/).

