Article

Lattice Strain Analysis of a Mn-Doped CdSe QD System Using Crystallography Techniques

by
Nor Aliya Hamizi
1,*,
Mohd Rafie Johan
1,
Nadiah Ghazali
1,
Yasmin Abdul Wahab
1,
Zaira Zaman Chowdhury
1,
Omid Akbarzadeh
1,
Suresh Sagadevan
1,
Irfan Anjum Badruddin
2,
T. M. Yunus Khan
2 and
Sarfaraz Kamangar
2
1
Nanotechnology & Catalysis Research Centre, Deputy Vice Chancellor (Research & Innovation) Office, University of Malaya, 50603 Kuala Lumpur, Malaysia
2
Department of Mechanical Engineering, College of Engineering, King Khalid University, PO Box 394, Abha 61421, Saudi Arabia
*
Author to whom correspondence should be addressed.
Processes 2019, 7(10), 639; https://doi.org/10.3390/pr7100639
Submission received: 22 August 2019 / Revised: 6 September 2019 / Accepted: 10 September 2019 / Published: 20 September 2019
(This article belongs to the Section Materials Processes)

Abstract

:
In this work, we report on the different sizes of manganese-doped cadmium selenide quantum dots (Mn-doped CdSe QDs) synthesized for 0 to 90 min using a reverse micelle organic solvent method and surfactant having a zinc blende structure, with physical size varying from 3 to 14 nm and crystallite size from 2.46 to 5.46 nm and with a narrow size distribution. At similar reaction times, Mn-doped CdSe QDs displayed the growth of larger QDs compared with the pure CdSe QDs. Due to the implementation of lattice strain owing to the inclusion of Mn atoms in the CdSe QD lattice, the lattice parameter was compressed as the QD size increased. Strain was induced by the particle size reduction, as observed from X-ray diffractometer (XRD) analysis. The analyses of the strain effect on the QD reduction are discussed relative to each of the XRD characteristics.

1. Introduction

Cadmium selenide (CdSe) QDs are a type of II-VI semiconductor nanocrystal which exhibit a nearly complete variety of visible light emissions within a reasonable range of size, different from other colloidal semiconductor nanocrystals [1]. Since the related technology and applications are advancing quicker with time, generating more adequate QDs to meet the needs of applications is essential to the research field around the globe. Earlier works reported on modifying QDs’ characteristics by incorporating multiple doping components to generate core–shell QDs in order to improve or tailor the QDs’ characteristics to satisfy application requirements [2]. There has been an effort to dope QDs as it has been realized that pure QDs possess an unpassivated surface due to the low surface atomic coordination numbers compared to the interior atoms. Therefore, incomplete bonding with the interior atoms forms unpassively localized orbitals with slightly negative and positive charge [3]. Mn-doped CdSe QDs (zinc blende) have tremendous importance for the research area of semiconductors because the inclusion of Mn into CdSe QDs promises a high-density diluted semiconductor for spintronic implementation, providing the excellent electronic excitation traps that are essential for electronic and optoelectronic devices [4]. Tuning the size of the QDs [5] to target a particular application requirement can achieve bandgap tunability. In addition, the intrinsic optical properties of CdSe QDs are reported to be able to be modified by the introduction of a transition metal dopant (i.e., Mn, Mg, or Zn) [6,7,8,9,10]. The incorporation of size variation and the introduction of a transition metal dopant into a CdSe QD system has strongly attracted attention to its outcome analysis and how it can be manipulated towards applications. In this paper, we report lattice strain calculations based on the work proposed by Williamson and Hall [11]. The crystallite size was first obtained using Scherer’s method by extracting the full width at half-maximum (FWHM) value from the X-ray diffractogram. By employing crystallite size broadening, the strain value was calculated and then analyzed. This strain-induced lattice parameter tailoring effect is expected to greatly support further discussion on the QDs’ properties, particularly their optical properties.

2. Experimental Procedure

Mn-doped CdSe QDs were synthesized using Mn–Cd and Se precursors. Quantities of 0.5 g of Mn acetate, 0.5 g of CdO, 25 ml of paraffin oil, and 15 ml of oleic acid were placed into a three-neck, round-bottom flask. The mixture was placed in vacuum conditions in a glove box. The solution was heated to 160 °C and stirred until the CdO was totally dissolved, obtaining a light yellowish homogeneous solution. Then, 0.079 g of Se in 50 ml of paraffin oil was heated to 220 °C in a glove box under vacuum conditions with fast stirring in another three-neck, round-bottom flask. The solution turned light orange and then wine red. During fast stirring, approximately 5 ml of Mn–Cd solution was quickly injected into the Se solution. Immediately after the injection, the temperature dropped to 210 °C and then rose to 220 °C. This temperature drop was due to an endothermic reaction that is required for the nucleation process to occur. For the growth of CdSe QDs at different times, i.e. at 0, 0.2, 0.5, 1, 5, 16, 46, and 90 minutes, the temperature was maintained at 220 °C. After each reaction, the three-neck, round-bottom flask containing the sample solution was immediately transferred to a water bath for a quenching process. Finally, the precipitate was isolated by centrifugation from the solvents and unreacted reagent, further washed several times with methanol, and dried in a 50 °C vacuum oven [12]. The experimental setup for the Mn-doped CdSe QDs was as shown in Figure 1.

Characterization Techniques

Determination of the particle size of the Mn-doped CdSe QDs was conducted using a 120 kV LEO LIBRA instrument with a high-resolution transmission electron microscope (HRTEM). Structural tests of the Mn-doped CdSe QD samples were conducted using a Panalytical Empyrean X-ray diffractometer (XRD) fitted with graphite monochromatized Cu Kα radiation (λ = 1.54060 Ǻ) with a scanning speed of 0.02°s−1 and usable range of 2–80°.

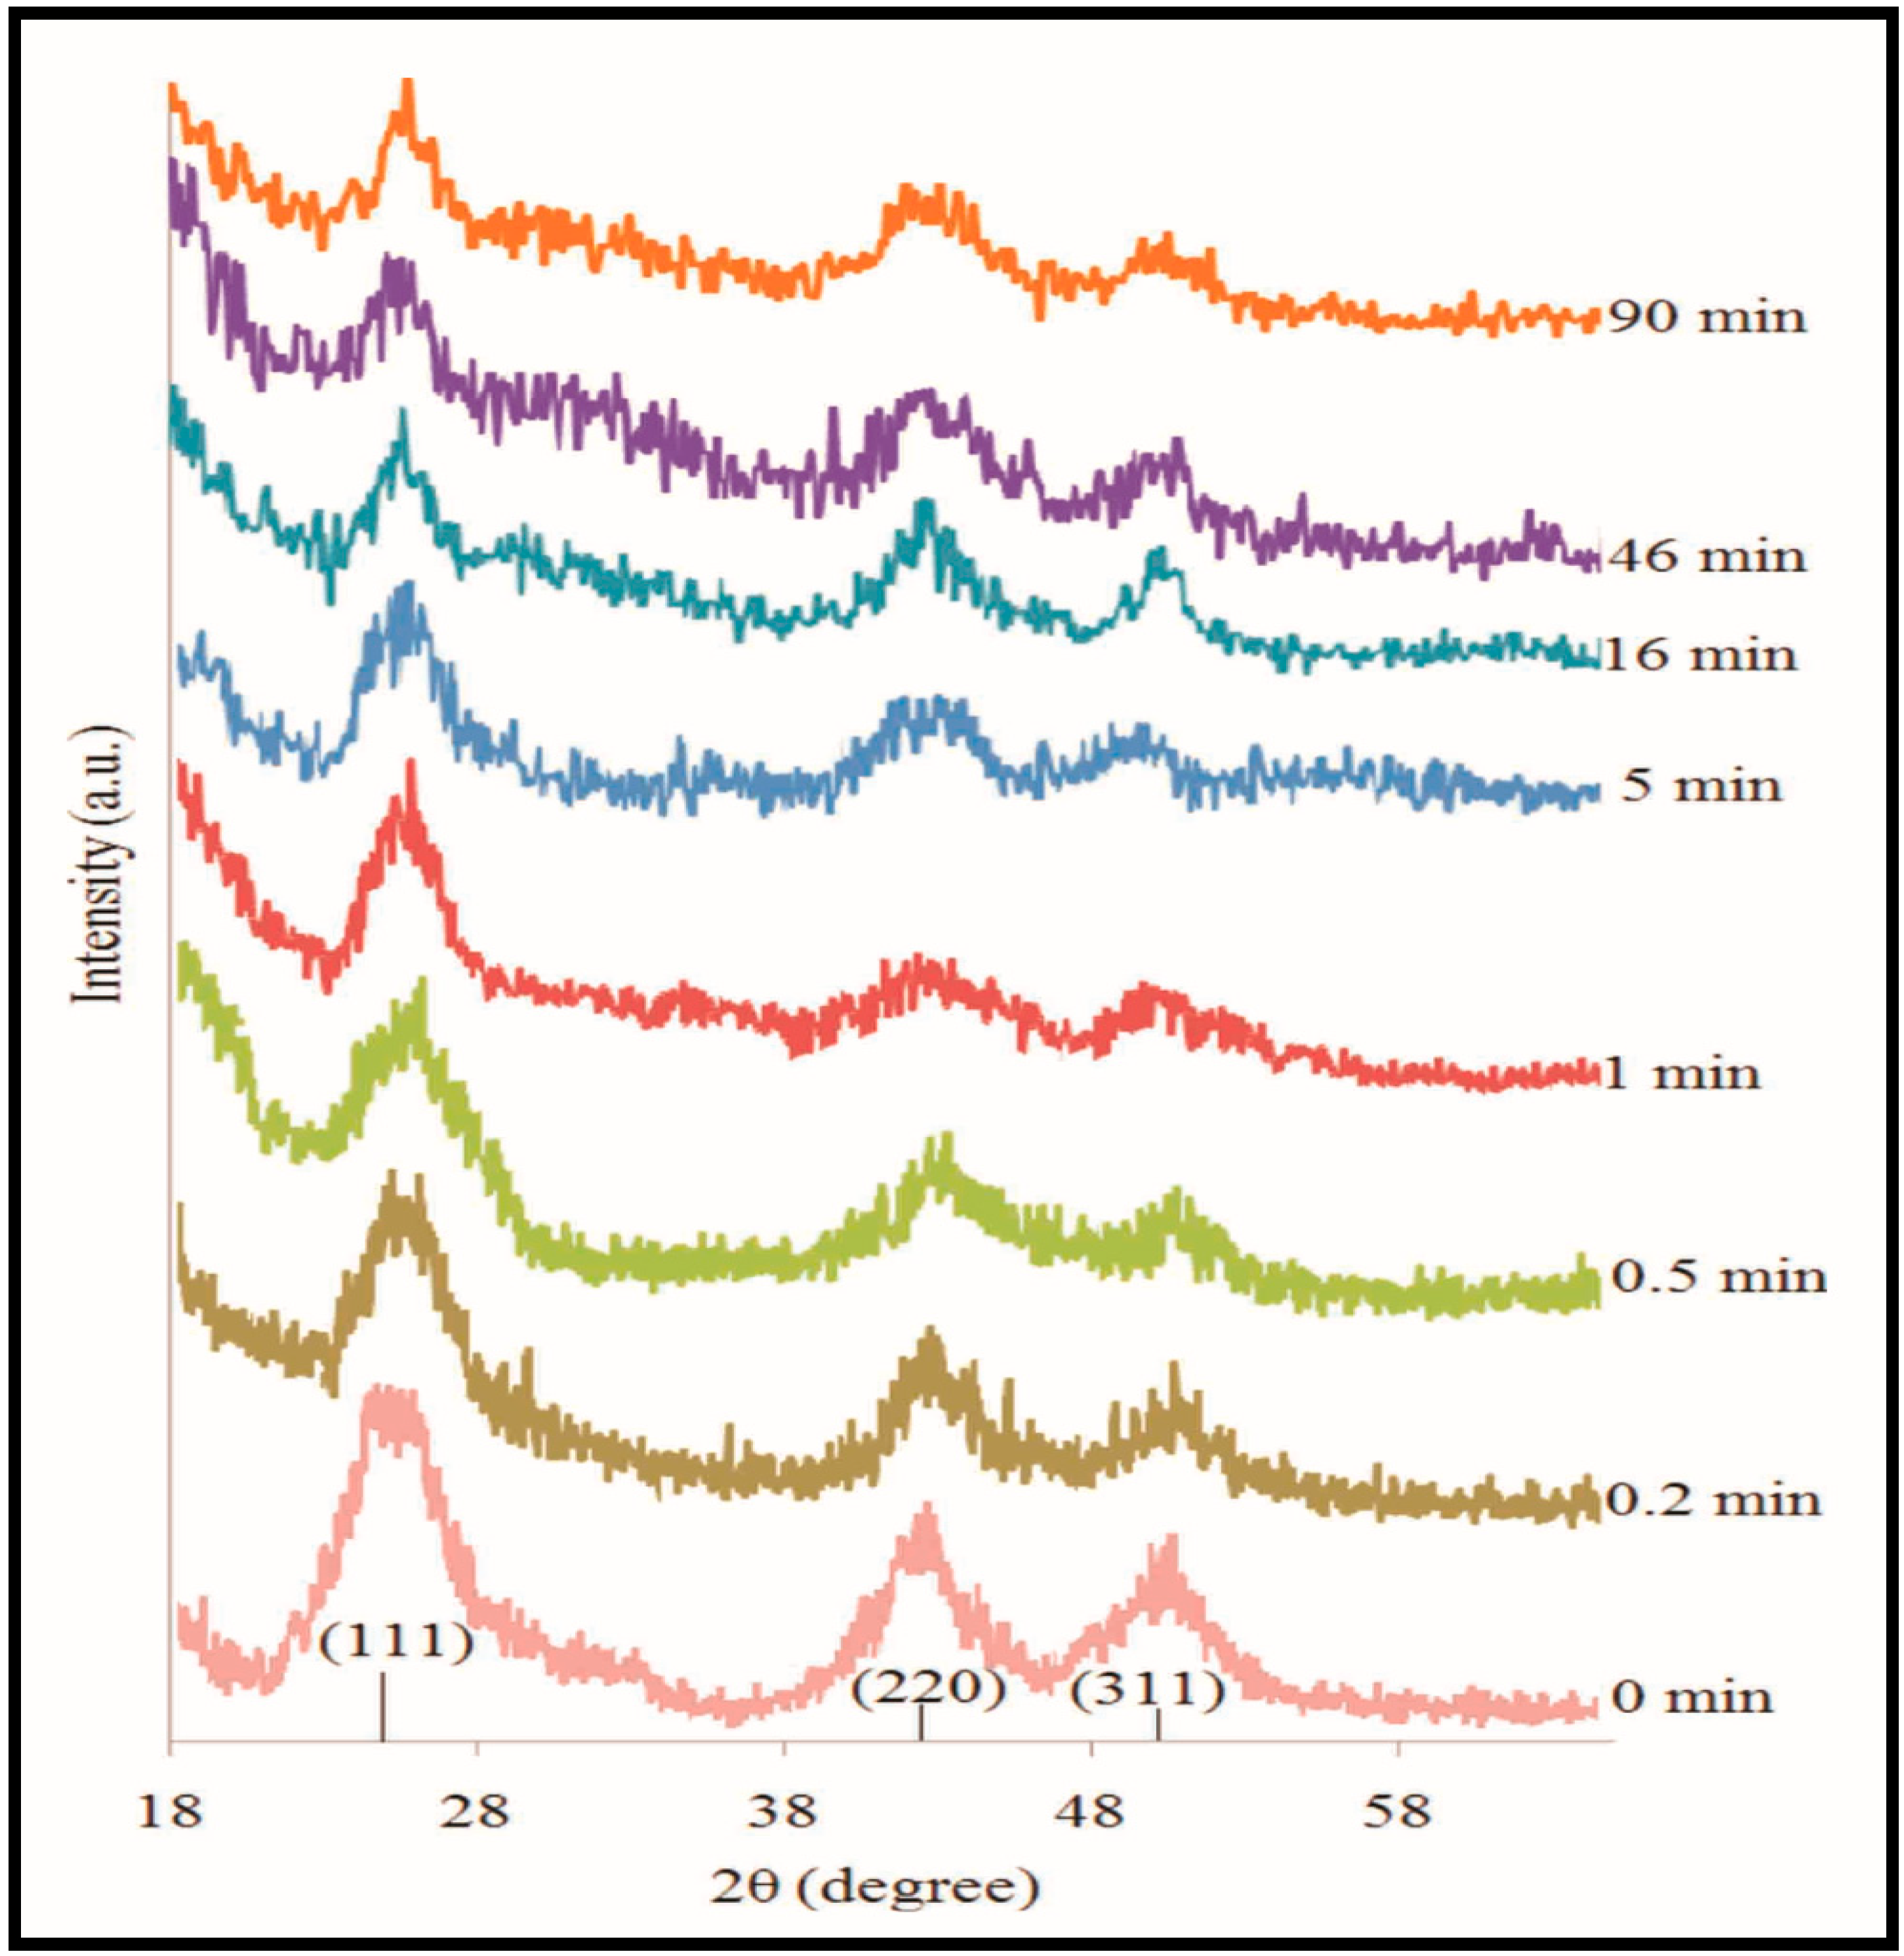
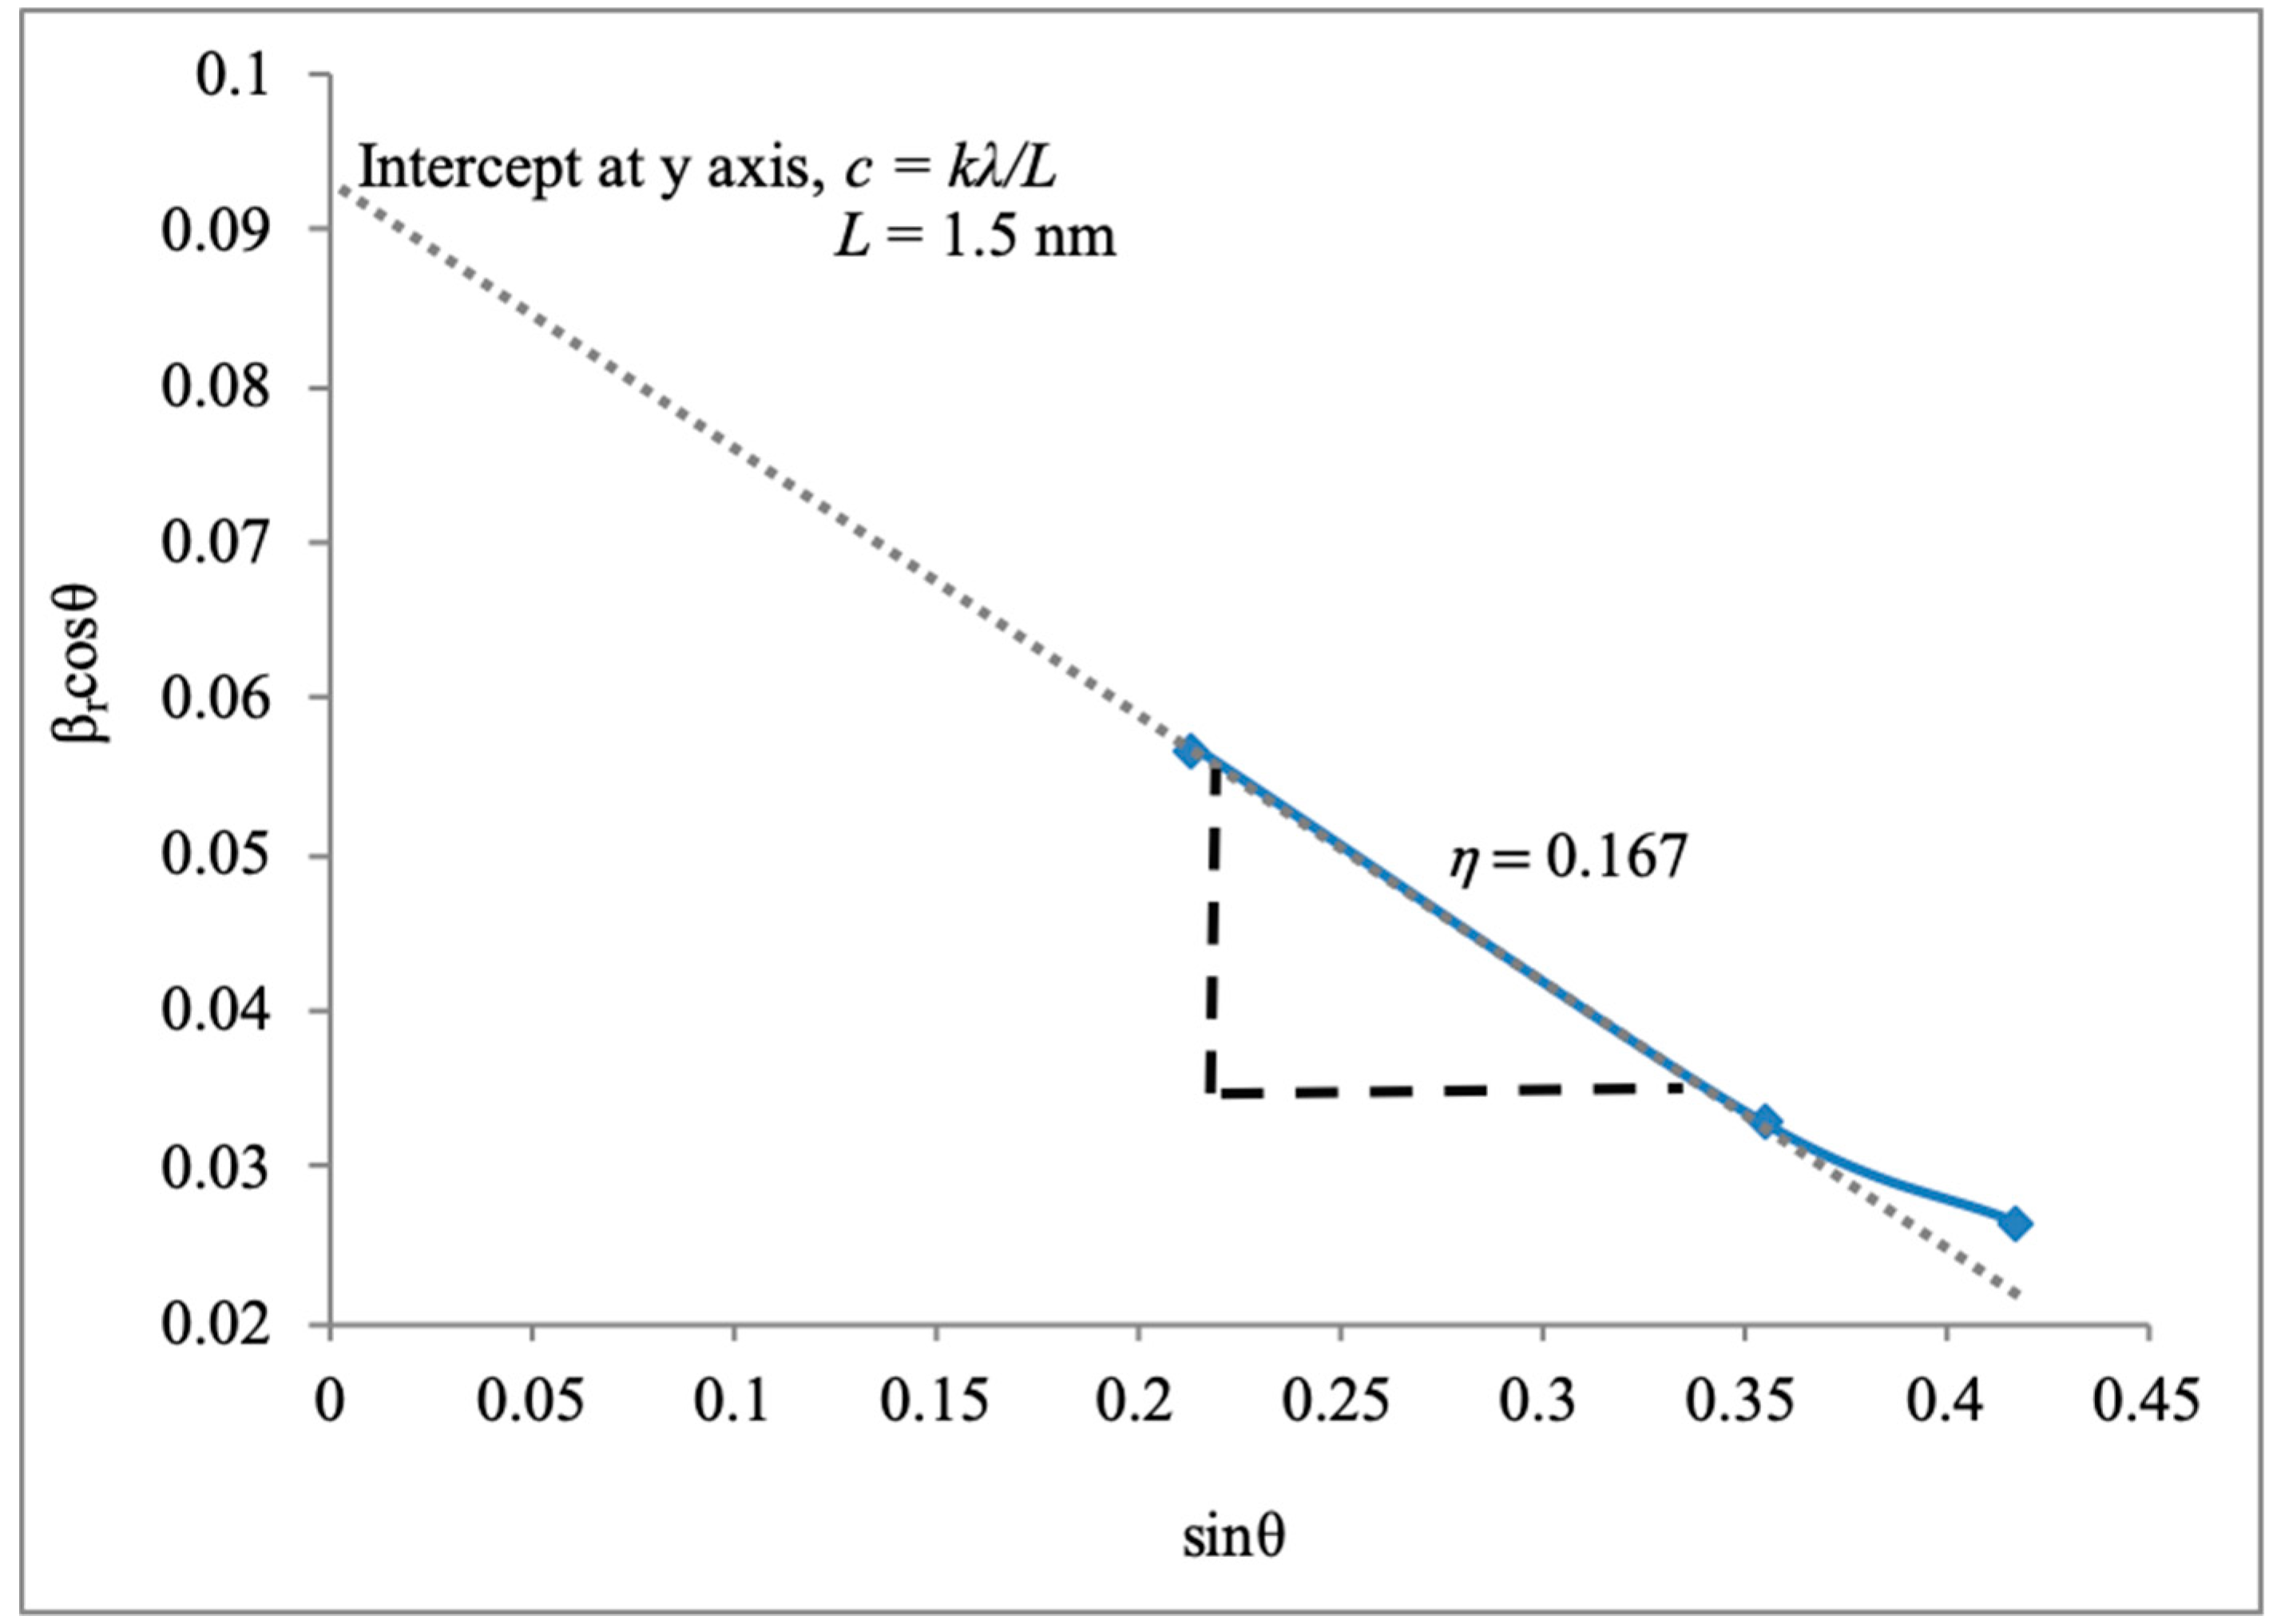
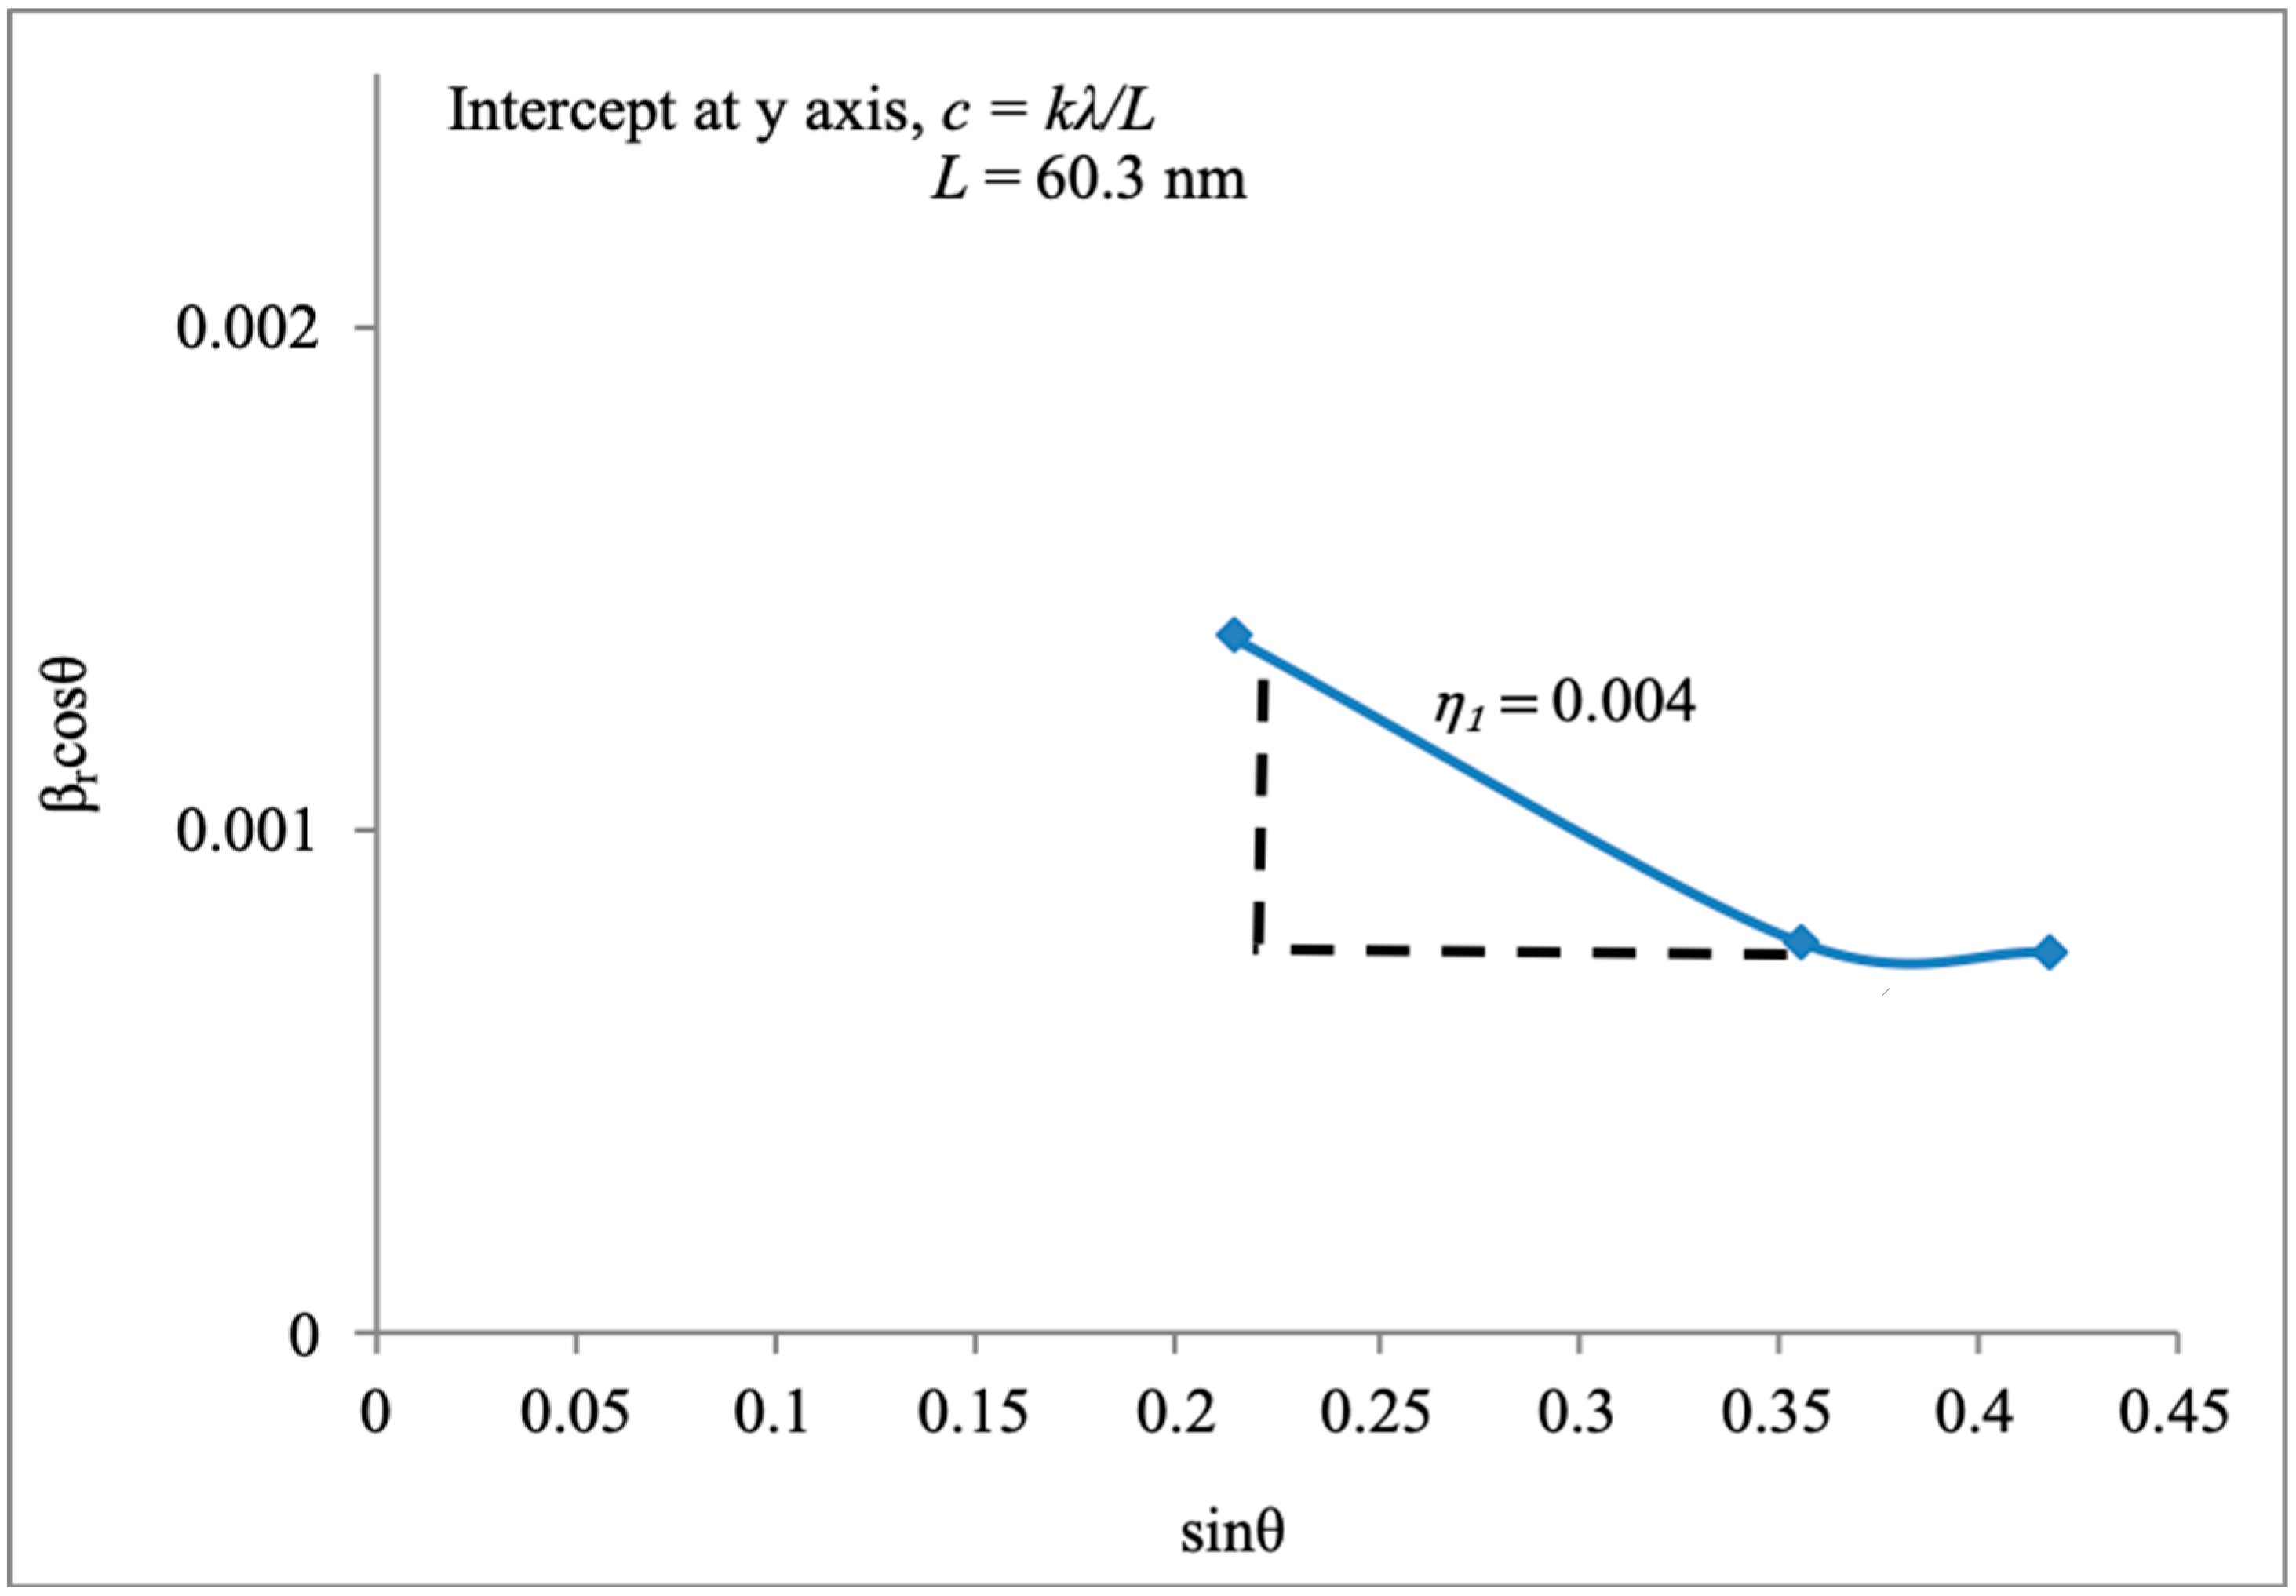
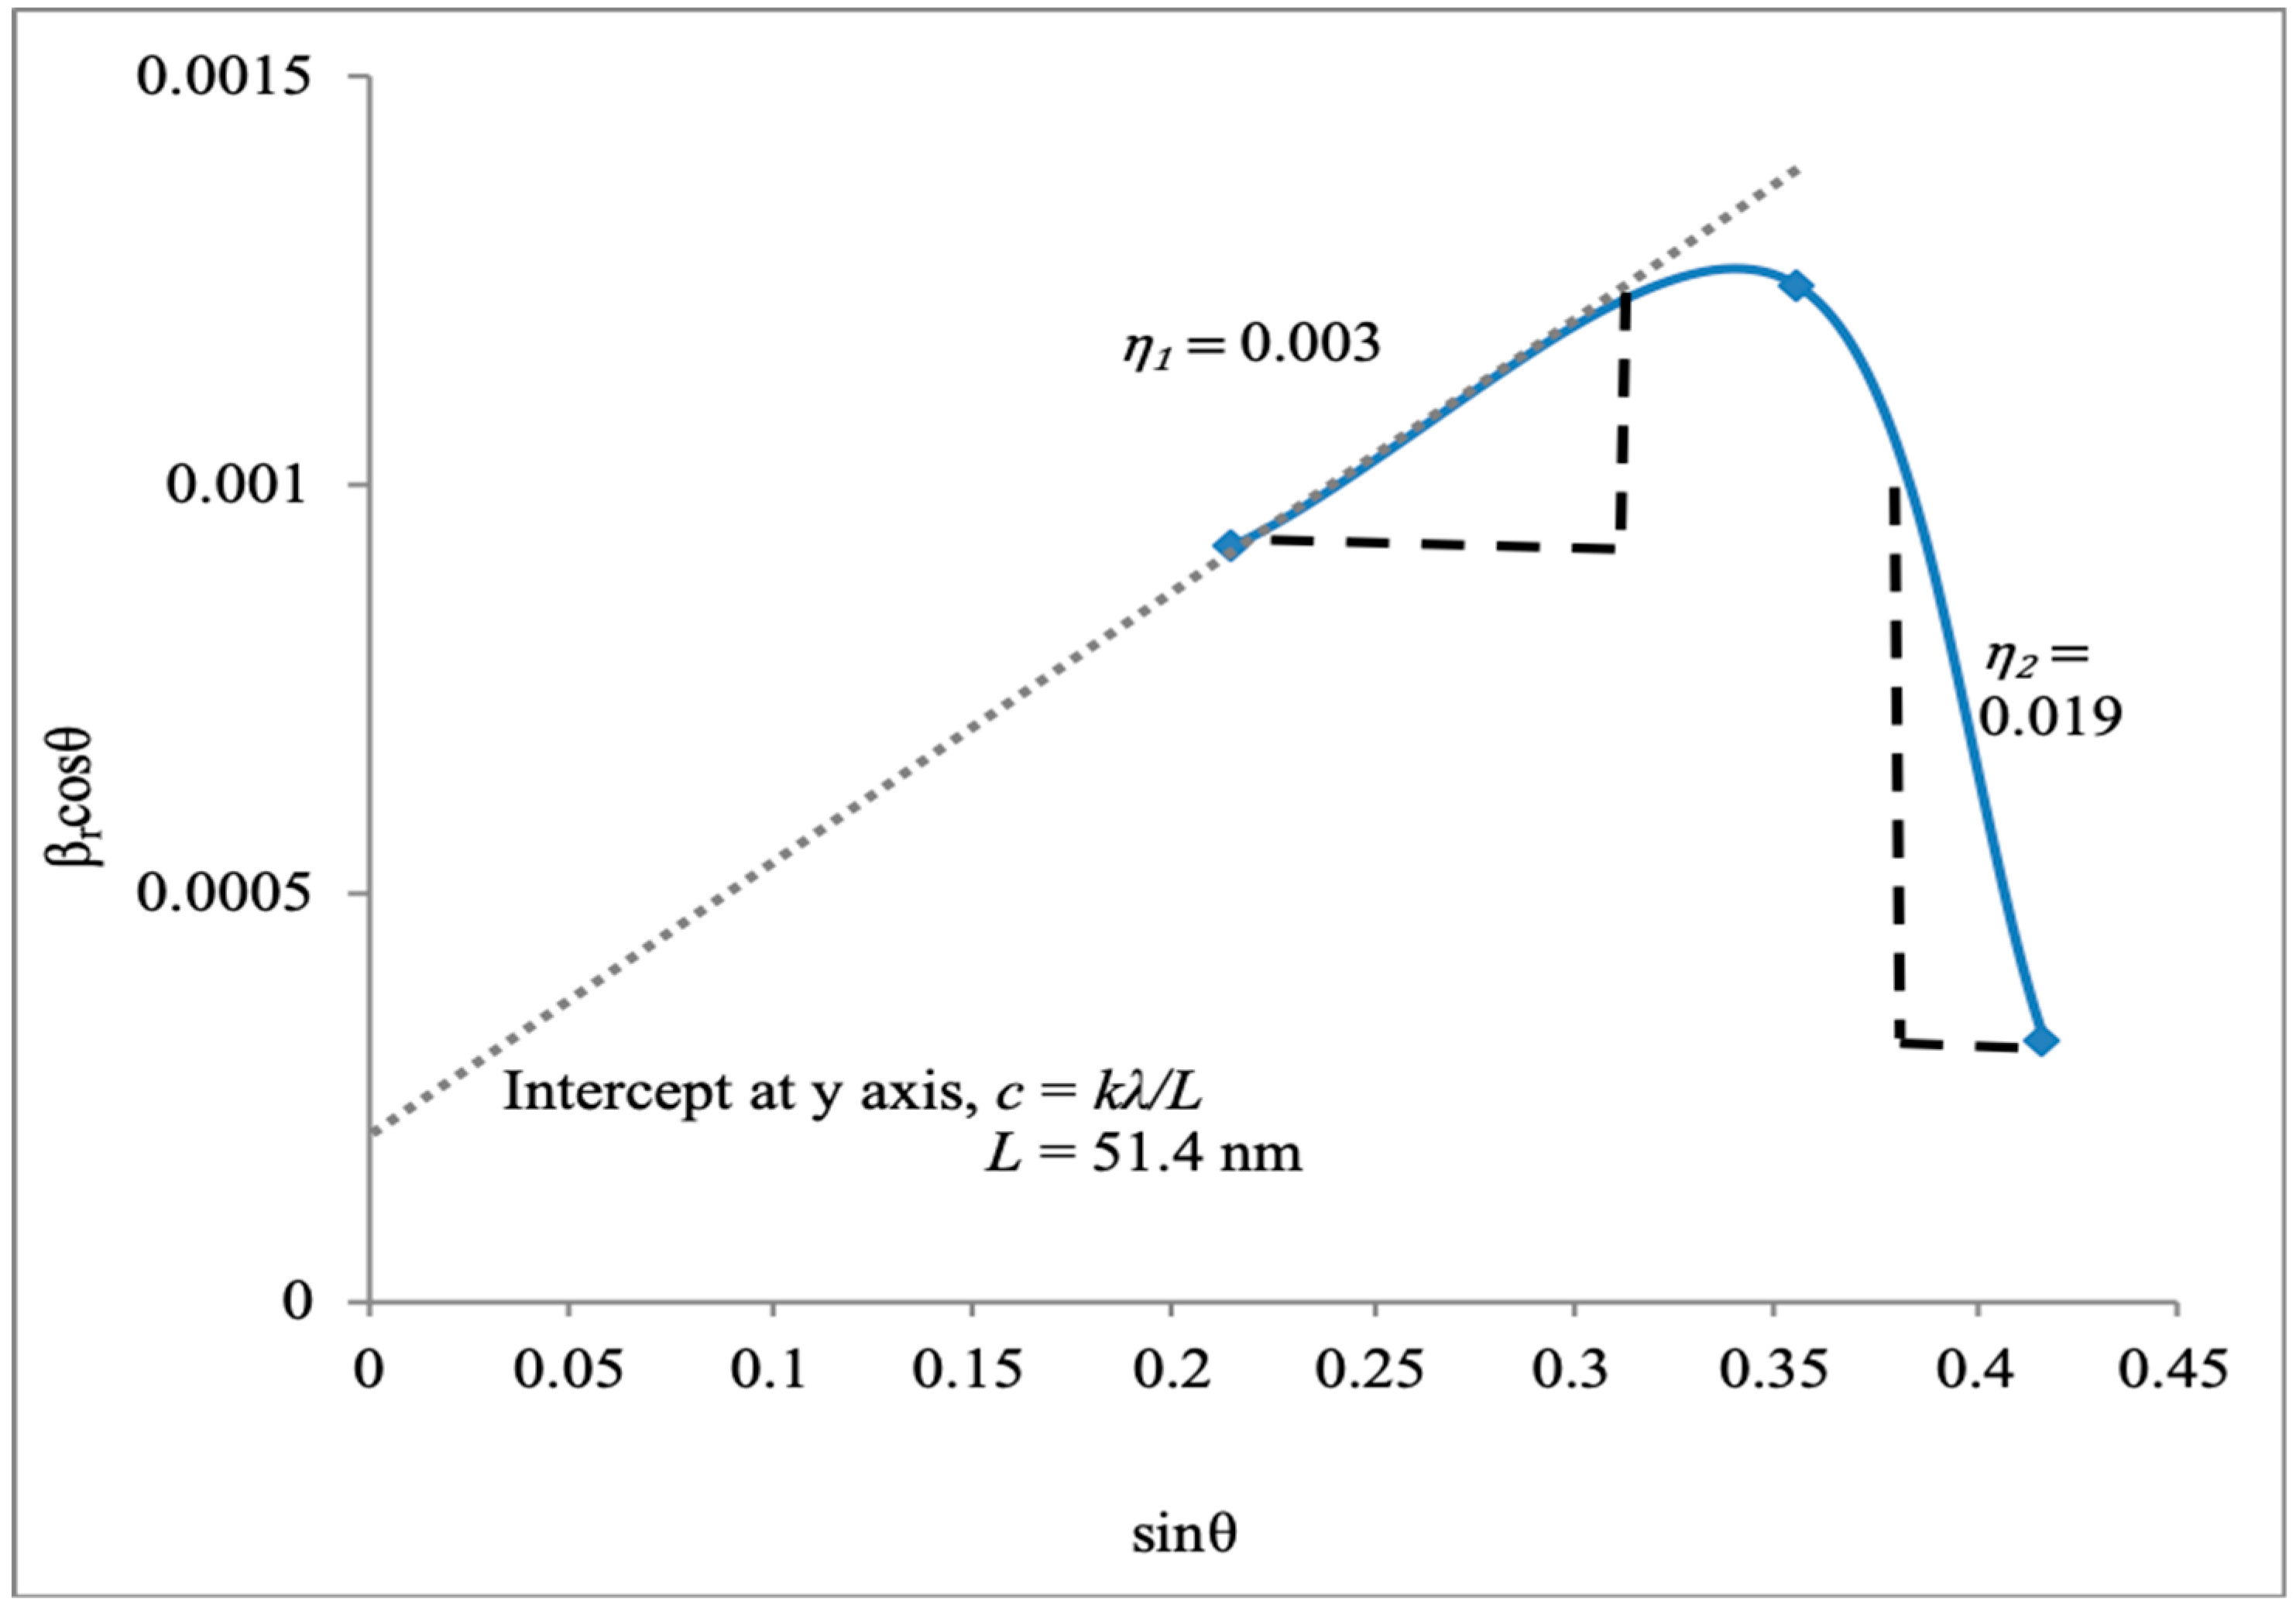
3. Results and Discussions

The HRTEM images as shown in Figure 2 demonstrate the temporal development of the Mn-doped CdSe QDs, which have a quasi-sphere shape. The QDs’ mean size and distribution were as shown in Figure 2 (inset), with physical size ranging from 3 to 14 nm. This may be due to the contribution of Mn shelling the CdSe QD cores. These findings also suggest that the Mn-doped CdSe nucleation method occurred instantly after the injection of the Mn–Cd complex into the Se solution, as the immediate sample (0 min) indicated an average particle size of 3 nm.
The XRD pattern demonstrated three well-defined peaks observed at 2θ values of 24.7°, 41.6°, and 49.3°, corresponding to the (111), (220), and (311) planes, respectively, as shown in Figure 3. The peaks were slightly changed in this XRD pattern compared to that of pure CdSe QDs, where the peaks were situated at 2θ = 25.9°, 42.5°, and 50.3° [13]. This shifting trend towards reduced angles (~0.9° to 1.2°) may correspond to the (001) face-centered cubic lattice filling with Mn ions in the interstitial site. Mn2+ ions have a high tendency to fill the CdSe QD lattice’s interstitial sites due to the typically small size of Mn2+ ions (~0.8 Å) compared to that of Cd2+ ions (~0.95 Å) [6,14]. This interstitial phenomenon of Mn in the CdSe QD lattice can lead to lattice microstrain resulting in CdSe core lattice growth or compression [6].
For crystallite size analysis, the model introduced by Scherrer was implemented. Scherrer (1918) was the first to observe that small crystallite size could increase line broadening and thus derived the well-known Scherrer formula [15]. Scherrer’s formula (Equation (1)) is the formula commonly used to calculate crystallite size (L) using the data extracted from XRD spectra [16]:
L = k λ β cos θ
where k is Scherrer’s constant of the order of unity for normal crystals and takes a specific value of 0.9 for the full width at half-maximum (FWHM) of spherical crystals with cubic symmetry. The FWHM of the analyzed data was used instead of the integral breadth since it is more precise when taking into consideration the high noise diffraction peak. The X-ray wavelength λ was represented using a value of 1.5406 Å. β is the full width at half-maximum (FWHM) or the peak broadening, and θ is Bragg’s diffraction angle [17]. By incorporating the obtained FWHM values into the given Scherrer’s formula, the crystallite sizes were calculated and are shown in Table 1. The crystallite size shows an increasing trend as a function of reaction time, which in good agreement with the HRTEM results (Figure 1). The crystallite size is most likely smaller than the particle size because there is a small degree of nanostructure lattice coherence compared to the particle size. Crystallite sizes are also not able to be like the grain size of a single crystal. Likewise, the particle size is the size of a single crystal or the agglomeration of several crystals [16].
The XRD peak broadening feature was not only limited to the QD size reduction but was also observed in anisotropic peak broadening. Table 2 presents the individual FWHM diffraction peaks corresponding to the (111), (220), and (311) planes. The (111) plane peaks narrowed as the reaction time increased. The (111) peak showed wider FWHM compared to the (220) and (311) peaks for the samples at 0, 0.2, and 0.5 min. This indicates that the QD dimension was reduced predominantly in directions perpendicular to the (111) planes where the unit cells h, k, and l are not equal to zero [18,19]. On the other hand, for samples at 1, 5, 46, and 90 min, the (220) diffraction peaks showed wide FWHM in comparison with the (111) and (311) peaks. This may correspond to the QD dimension decreasing predominantly in directions perpendicular to the (220) particular planes where the unit cell l is equal to zero. Interestingly, the 16 min sample’s diffraction peak FWHM remained constant for each peak, implying that the anisotropic broadening in Mn-doped CdSe QDs is less dependent on the size of the QDs [20,21,22]. The lattice parameter analyzed from XRD analysis (Table 1) showed an increasing pattern as a function of QD size. This indicates that the lattice experienced compression or expansion strain independent of the QD size [20].
The pure CdSe QDs exhibited a broader XRD diffraction peak corresponding to (111) compared to the Mn-doped CdSe QDs since the crystallite size was observed to be in the range of ~2 to 4 nm [8]. This narrowing of the diffraction peak in Mn-doped CdSe QDs may be caused by the lattice strain phenomenon, which is also called microstrain since it occasionally happens in nanocrystalline materials. The Mn2+ ion interstices in the CdSe QD lattice introduced microstrain to the unit cells, which can be caused by nonuniform lattice distortion [23]. It can be assumed that the strain introduced to the CdSe QD lattice induced compression of the lattice parameter as a result of the Mn2+ interstitials, since the lattice parameters recorded in Table 1 are smaller in comparison with those of pure CdSe QDs [13].
Another interesting feature of the XRD diffraction peak was the maximum peak intensity ( I max ), which can be expressed by a very complex equation [22]. The I max of the XRD diffraction peak (Figure 2) was observed to increase as the QD size decreased. This further verifies the findings that the decrease in QD size had an essential effect on the crystal structure and phase diffraction featuring absorption of the Mn-doped CdSe QDs in a specific pattern. Other influences such as instrument factors, environment, and diffraction angle also contribute to changes in I max but are not as critical as the QD size reduction [2]. Equation (2) expresses I max in a much simpler derivation:
I max = | s ( h k l ) | 2 × M h k l × L P ( θ ) × T F ( θ )
where s ( h k l ) is a structural factor, M h k l is multiplicity, L P ( θ ) is the Lorentz and polarization factors, and T F ( θ ) is the temperature factor which is more precisely referred to as the displacement parameter [22]. Stokes and Wilson (1944) first discovered that strained crystals have different line broadening compared to small crystals. Therefore, size and strain broadening show different Bragg’s angle (θ) dependence [16], which forms Equation (3). In addition, Williamson and Hall (1953) proposed a method for the deconvolution of size and strain broadening by considering the peak width as a function of 2θ, as shown in the equations below [20]:
β o = β i + β r
β r = β c + β s = k λ L cos θ + η tan θ
where βo is an observed broadening of the peak, βi is the broadening by instrument factors, βr is the broadening induced by crystallite size and strain, and βc is broadening due to crystallite size. By rearranging Equation (3) to form a general equation for a straight line (Equation (4)), kλ/L becomes the y-axis intercept, and the slope of the graph is the strain (η).
β r cos θ = k λ L + η tan θ
The contributions of crystallite size and microstrain to the broadening of the XRD peak can be exploited for the determination of the strain which dominates the lattice strain since both parameters change with the Bragg angle. A graph of βrcos θ versus sin θ was plotted by assuming zero instrument effect (βi) on the XRD peak broadening since the value is extremely small.
The plots in Figure 4, Figure 5, Figure 6, Figure 7, Figure 8, Figure 9, Figure 10 and Figure 11 show inconsistency in the straight lines which may due to the anisotropic broadening effect [20]. Since Equation (5) is generally in the form of a straight line, all potential slopes are taken into consideration. The slopes of the graphs obtained are equal to the lattice strain (η), observed to change in a fluctuating manner as a function of QD size. More than one lattice strain value was observed in the samples at 0.5, 1, 5, 46, and 90 min, which may be caused by anisotropic broadening of the XRD peaks and inhomogeneous lattice strain. The inhomogeneous lattice strain may be due to uneven Mn2+ ion distribution within the CdSe QD interfacial area [20].
Smith et al. (2009) compared the strain parameters (percentage of lattice mismatch) of CdTe/ZnSe (core/shell) QDs and CdSe/ZnS (core/shell). Their study suggested that CdSe/ZnS QDs have a higher percentage of lattice mismatch due to the inhomogeneity of the lattice strain arising from the inability of CdSe and ZnS to withstand strain without forming y defects. In addition, CdSe and ZnS QD lattices are considered to be less elastic compared to CdTe and ZnSe QD lattices when subjected to stress [20]. This may explain the strain inhomogeneity shown in Figure 4, Figure 5, Figure 6, Figure 7, Figure 8, Figure 9, Figure 10 and Figure 11. Furthermore, the Mn2+ dopant in the CdSe QD lattice may induce either compressive or/and expansion stress in the lattice, resulting in strain inhomogeneity in Mn-doped CdSe QDs [21]. The overall lattice strain (η1) in Figure 12 shows a decreasing trend with the growth of Mn-doped CdSe QDs. The strain effect on the Mn-doped CdSe QD lattice became less prominent with QD growth. The larger QDs required larger strain energy density to allow the lattice to be compressed by stress. The strain energy density depends on the size of the QDs and the thickness of the doped shell [22].
CdS/CdSe (core/shell) QDs were reported to possess insufficient lattice strain as the size of the core CdSe increases and reaches a critical size where uniform CdS shell growth is unfavorable as a strain inducer [23,24]. In addition, Meulenberg et al. (2004) reported that ZnS shells induced large strain on significantly small CdSe core (particle size ~1.9 nm)—nearly 1 GPa of compressive stress. This may be due to the larger surface reconstruction possessed by small QDs from strong phosphine–surface interaction [25]. For the Mn-doped CdSe QD system, the smaller QDs may possess larger surface reconstruction due to the influence of strong oleate–ligand surface interaction, thereby inducing larger strain on the interfacial areas of QDs. Despite this, the implication of strain in the Mn-doped CdSe QDs’ properties may not be significantly affected by the value of the strain since there are several other factors to be considered, such as the type of strain (compression or/and expansion), anisotropic strain, and Poisson effect [25,26,27]. Crystallite size (L) values were calculated by taking the intercept value (graph tangent line and y axis) and were shown to be irrelevant to this discussion. In addition, the tangent line of the 90 min samples intercepted at a negative value of βrcos θ which prohibited the calculation of the crystallite size value for these samples. Hence, the broadening of the XRD peak is predominantly due to strain and anisotropic broadening rather than crystallite size broadening, which is due to QD size growth.
The 1 min sample (crystallite size = 4.18 nm) shows an odd spike pattern in Figure 12, suggesting that the lattice strain (η1) value abruptly increased. XRD patterns of three sets of samples were analyzed to identify the presence of any error. It was found that there was no prominent change in the FHWM values of the (111), (220), and (311) plane peaks. The hypothesis pertaining to this is related to the transition from nucleation to the particle growth process. The critical crystallite size for zinc blende Mn-doped CdSe QDs is expected to be approximately 4.18 nm and achieve maximum free energy. Further analysis should be done to study the mechanism of this transition and its effect on the lattice strain value.
The surface composition of the Mn-doped CdSe QDs was analyzed using X-ray photoelectron spectroscopy (XPS), as shown in Figure 13 The XPS scans traced the presence of CdSe crystal Se 3d and Cd 3d bands with binding energies of 54.1 and 404.5 eV, respectively [28]. The Mn 2p band from Mn element was traced to have a binding energy of roughly 640.7 eV [29], thus confirming the existence of Mn interstitial sites on the surface of CdSe QD cores, acting like a doped element. This background correction to tailor the shift of the peak due to the retarding field at the surface of the specimen is called static charging. The static charging phenomenon reduces the kinetic energy of the excited electrons [30].

4. Conclusions

In summary, rapid quenching immediately after the reaction time is over is recommended to reduce the ripening effect on QD sizes as the solution bath remains at significantly high temperatures close to the reaction temperature after the heating process has been stopped. Mn-doped CdSe QDs with a physical size of 3 to 14 nm and crystallite size of 2.46 to 5.46 nm were effectively produced using an inverse micelle method, resulting in a narrow QD size distribution and quasi-spherical QD shape. The size decrease of the QDs was discovered to be less important to tailoring the value of the lattice parameter than the impact of the doping mechanism. The strain was evaluated effectively using the Williamson and Hall technique. It is suggested that the introduction of strain to the core CdSe QD lattice is prominent at the QD interface due to the presence of Mn dopants.

Author Contributions

N.A.H.—Date curstion, format analisis, investugation, project administration, writing—original draft; M.R.J.—Format analisis, resources, supervision; N.G.—Writing—review & editing; Y.A.W.—Date curation; Z.Z.C.—Date curation; O.A.—Date curation; S.S.—Writing—review & editing; I.A.B.—Funding acquisition; T.M.Y.K.—Funding acquisition; S.K.—Funding acquisition.

Funding

The authors extend their appreciation to the Deanship of Scientific Research at King Khalid University for funding this work through research groups program under grant number (R.G.P. 2/11/39). This work was also financially supported by University of Malaya Research Grant (RU001-2018 and ST018-2018).

Conflicts of Interest

The authors declare no conflict of interest.

References

  1. Sung, Y.-M.; Kwak, W.-C.; Kim, T.G. Coarsening kinetics of Mn-doped CdSe nanocrystals. Cryst. Growth Des. 2008, 8, 1186–1190. [Google Scholar] [CrossRef]
  2. Jiang, F.; Muscat, A.J. Ligand-controlled growth of ZnSe quantum dots in water during Ostwald ripening. Langmuir 2012, 28, 12931–12940. [Google Scholar] [CrossRef] [PubMed]
  3. Smith, A.M.; Nie, S. Semiconductor nanocrystals: structure, properties, and band gap engineering. Acc. Chem. Res. 2010, 43, 190–200. [Google Scholar] [CrossRef] [PubMed]
  4. Erwin, S.C.; Zu, L.J.; Haftel, M.I.; Efros, A.L.; Kennedy, T.A.; Norris, D.J. Doping semiconductor nanocrystals. Nature 2005, 436, 91–94. [Google Scholar] [CrossRef] [PubMed]
  5. Alivisatos, P. Semiconductor clusters, nanocrystals, and quantum dots. Science 1996, 271, 933–937. [Google Scholar] [CrossRef]
  6. Kwak, W.C.; Sung, Y.M.; Kim, T.G.; Chae, W.S. Synthesis of Mn-doped zinc blende CdSe nanocrystals. Appl. Phys. Lett. 2007, 90. [Google Scholar] [CrossRef]
  7. Yousaf, M.; Wang, Y.; Chen, Y.; Wang, Z.; Firdous, A.; Ali, Z.; Mahmood, N.; Zou, R.; Guo, S.; Han, R.P. A 3D Trilayered CNT/MoSe2/C Heterostructure with an Expanded MoSe2 Interlayer Spacing for an Efficient Sodium Storage. Adv. Energy Mater. 2019, 9, 1900567. [Google Scholar] [CrossRef]
  8. Farooq, M.U.; Butt, S.; Gao, K.; Zhu, Y.; Sun, X.; Pang, X.; Khan, S.U.; Mohmed, F.; Mahmood, A.; Mahmood, N.; et al. Cd-doping a facile approach for better thermoelectric transport properties of BiCuSeO oxyselenides. RSC Adv. 2016, 6, 33789–33797. [Google Scholar] [CrossRef]
  9. Farooq, M.U.; Butt, S.; Gao, K.; Sun, X.; Pang, X.; Khan, S.U.; Xu, W.; Mohmed, F.; Mahmood, A.; Mahmood, N. Enhanced thermoelectric efficiency of Cu2− xSe–Cu2S composite by incorporating Cu2S nanoparticles. Ceram. Int. 2016, 42, 8395–8401. [Google Scholar] [CrossRef]
  10. Jian, X.; Tian, W.; Li, J.; Deng, L.; Zhou, Z.; Zhang, L.; Lu, H.; Yin, L.; Mahmood, N. Ferroferric oxide/multiwalled carbon nanotube vs polyaniline/ferroferric oxide/multiwalled carbon nanotube multiheterostructures for highly effective microwave absorption. ACS Appl. Mater. Interfaces 2019, 11, 15869–15880. [Google Scholar] [CrossRef]
  11. Williamson, G.; Hall, W. X-ray line broadening from filed aluminium and wolfram. Acta Metall. 1953, 1, 22–31. [Google Scholar] [CrossRef]
  12. Hamizi, N.A.; Johan, M.R.; Chowdhury, Z.Z.; Wahab, Y.A.; Al-Douri, Y.; Saat, A.M.; Pivehzhani, O.A. Optical structure modification induced by lattice strain in Mn-doped CdSe QDs. Opt. Mater. 2018, 86, 441–448. [Google Scholar] [CrossRef]
  13. Hamizi, N.A.; Johan, M.R. Synthesis and size dependent optical studies in CdSe quantum dots via inverse micelle technique. Mater. Chem. Phys. 2010, 124, 395–398. [Google Scholar] [CrossRef]
  14. Bryan, J.D.; Gamelin, D.R. Activation of high-TC ferromagnetism in Co2+: TiO2 and Cr3+: TiO2 nanorods and nanocrystals by grain boundary defects. Prog. Inorg. Chem. 2012, 54, 47–126. [Google Scholar]
  15. Scherrer, P. Bestimmung der inneren Struktur und der Größe von Kolloidteilchen mittels Röntgenstrahlen. Göttinger Nachr. 1918, 2, 98–100. [Google Scholar]
  16. Langford, J.I.; Wilson, A. Scherrer after sixty years: A survey and some new results in the determination of crystallite size. J. Appl. Crystallogr. 1978, 11, 102–113. [Google Scholar] [CrossRef]
  17. Stokes, A.R.; Wilson, A.J.C. The diffraction of X rays by distorted crystal aggregates-I. Proc. Phys. Soc. 1944, 56, 174. [Google Scholar] [CrossRef]
  18. Smith, J.G.; Fieser, L.F.; Fieser, M. Fieser and Fieser’s Reagents for Organic Synthesis; John Wiley and Sons: New York, NY, USA, 1990; Volume 1–12. [Google Scholar]
  19. Thanikaikarasan, S.; Shajan, X.S.; Dhanasekaran, V.; Mahalingam, T.J. X-ray line broadening and photoelectrochemical studies on CdSe thin films. Mater. Sci. 2011, 46, 4034–4045. [Google Scholar] [CrossRef]
  20. Smith, A.M.; Mohs, A.M.; Nie, S. Tuning the optical and electronic properties of colloidal nanocrystals by lattice strain. Nat. Nanotechnol. 2009, 4, 56–63. [Google Scholar] [CrossRef]
  21. Devi, L.S.; Devi, K.N.; Sharma, B.I.; Sarma, H.N. Influence of Mn doping on structural and optical properties of CdS nanoparticles. Indian J. Phys. 2014, 88, 477–482. [Google Scholar] [CrossRef]
  22. Jian, Z.; Hejing, W. The physical meanings of 5 basic parameters for an X-ray diffraction peak and their application. Chin. J. Geochem. 2003, 22, 38–44. [Google Scholar] [CrossRef]
  23. Chen, H.Y.; Maiti, S.; Nelson, C.A.; Zhu, X.; Son, D.H. Tuning Temperature dependence of dopant luminescence via local lattice strain in core/shell nanocrystal structure. J. Phys. Chem. C 2012, 116, 23838–23843. [Google Scholar] [CrossRef]
  24. Gong, K.; Kelley, D.F. Lattice strain limit for uniform shell deposition in zincblende CdSe/CdS quantum dots. J. Phys. Chem. Lett. 2015, 6, 1559–1562. [Google Scholar] [CrossRef]
  25. Meulenberg, R.W.; Jennings, T.; Strouse, G.F. Compressive and tensile stress in colloidal CdSe semiconductor quantum dots. Phys. Rev. B 2004, 70, 235311. [Google Scholar] [CrossRef]
  26. Chen, X.; Lou, Y.; Samia, A.C.; Burda, C. Coherency strain effects on the optical response of core/shell heteronanostructures. Nano Lett. 2003, 3, 799–803. [Google Scholar] [CrossRef]
  27. Thanh, N.T.; Maclean, N.; Mahiddine, S. Mechanisms of nucleation and growth of nanoparticles in solution. Chem. Rev. 2014, 114, 7610–7630. [Google Scholar] [CrossRef]
  28. Agostinelli, E.; Battistoni, C.; Fiorani, D.; Mattogno, G.; Nogues, M. An XPS study of the electronic structure of the ZnxCd1− xCr2 (X= S, Se) spinel system. J. Phys. Chem. Solids 1989, 50, 269–272. [Google Scholar] [CrossRef]
  29. Ivanov-Ehmin, B.; Nevskaya, N.; Zajtsev, B.; Ivanova, T. Synthesis and properties of calcium and strontium hydroxomanganates (3). Zhurnal Neorg. Khimii 1982, 27, 3101–3104. [Google Scholar]
  30. Dai, Q.; Sabio, E.M.; Wang, W.; Tang, J. Pulsed laser deposition of Mn doped CdSe quantum dots for improved solar cell performance. Appl. Phys. Lett. 2014, 104, 183901. [Google Scholar] [CrossRef] [Green Version]
Figure 1. The experimental setup for the Mn-doped CdSe QD (quantum dot) sample.
Processes 07 00639 g001
Figure 2. HRTEM image of Mn-doped CdSe QDs with the QD size distribution (inset) at (a) 0 and (b) 90 min reaction time.
Processes 07 00639 g002
Figure 3. XRD patterns of Mn-doped CdSe QD samples at various reaction times (θ ± 0.5).
Processes 07 00639 g003
Figure 4. Plot of βrcos θ versus sin θ from XRD data of the 0 min sample.
Processes 07 00639 g004
Figure 5. Plot of βrcos θ versus sin θ from XRD data of the 0.2 min sample.
Processes 07 00639 g005
Figure 6. Plot of βrcos θ versus sin θ from XRD data of the 0.5 min sample.
Processes 07 00639 g006
Figure 7. Plot of βrcos θ versus sin θ from XRD data of the 1 min sample.
Processes 07 00639 g007
Figure 8. Plot of βrcos θ versus sin θ from XRD data of the 5 min sample.
Processes 07 00639 g008
Figure 9. Plot of βrcos θ versus sin θ from XRD data of the 16 min sample.
Processes 07 00639 g009
Figure 10. Plot of βrcos θ versus sin θ from XRD data of the 46 min sample.
Processes 07 00639 g010
Figure 11. Plot of βrcos θ versus sin θ from XRD data of the 90 min sample.
Processes 07 00639 g011
Figure 12. Lattice strain effect with growth of the Mn-doped CdSe QDs’ crystallite size.
Processes 07 00639 g012
Figure 13. XPS wide scan of Mn-doped CdSe QDs at different reaction times.
Processes 07 00639 g013
Table 1. Calculated crystallite sizes and lattice parameters of Mn-doped CdSe QDs at various reaction times.
Reaction TimeCrystallite SizeLattice Parameter, a
(min)(nm)(Å)
02.462.09
0.22.902.13
0.54.062.14
14.182.16
54.302.24
164.932.29
465.202.37
905.462.56
Table 2. FWHM values of the XRD diffraction peaks of Mn-doped CdSe QDs corresponding to the (111), (220), and (311) planes.
Reaction Time FWHM (radians)
(min)(111)(220)(311)
00.0580.0350.029
0.20.0490.0290.029
0.50.0350.0290.012
10.0340.0520.029
50.0330.0580.035
160.0290.0290.029
460.0270.0460.029
900.0260.0520.029

