Article

Characterization of Pores and Fractures in Soft Coal from the No. 5 Soft Coalbed in the Chenghe Mining Area

1
State Key Laboratory of Coal Mine Disaster Dynamics and Control, Chongqing University, Chongqing 400044, China
2
College of Resources and Environmental Science, Chongqing University, Chongqing 400044, China
3
Development Department, Tarim Oilfield Company, China National Petroleum Corporation, Korla 841000, China
4
College of Safety Science and Engineering, Xi’an University of Science and Technology, Xi’an 710054, China
*
Authors to whom correspondence should be addressed.
Processes 2019, 7(1), 13; https://doi.org/10.3390/pr7010013
Submission received: 29 November 2018 / Revised: 23 December 2018 / Accepted: 25 December 2018 / Published: 31 December 2018
(This article belongs to the Special Issue Fluid Flow in Fractured Porous Media)

Abstract

:
The characteristics of the pore structure and gas migration in soft coalbeds are the premise of evaluating gas discharge in soft coalbeds. To explore the pore structure characteristics of soft coal masses, the No. 5 soft coalbed in the eastern zone of Chenghe Mining Area, was investigated and compared with the No. 5 hard coalbed in the western zone. By using a mercury intrusion method, low-temperature liquid nitrogen adsorption, and scanning electron microscopy (SEM), the pore structure characteristics of the No. 5 coalbed were explored. Moreover, based on fractal theory, the pore structure of coal was characterized. The results showed the pores in soft coal mainly appeared as small pores and micropores in which the small pores accounted for nearly half of the total pore volume. Mesopores and macropores were also distributed throughout the soft coal. The mercury-injection and mercury-ejection curves of soft coal showed significant hysteresis loops, implying that pores in coal samples were mainly open while the mercury-injection curve of hard coal was consistent with its mercury-ejection curve, showing no hysteresis loop while having an even segment, which indicated that closed pores occupied the majority of the pore volume in the coal samples. The curves of low-temperature nitrogen adsorption of soft coal all follow an IV-class isotherm. Moreover, the fractal dimensions of soft coal are respectively larger than the fractal dimensions of hard coal. It can be seen that the characterization of pores and fractures of the soft coal was different from the hard coal in the western distinct of the old mining area. The gas prevention and control measures of soft coal should be formulated according to local conditions.

Graphical Abstract

1. Introduction

With increasing industrial development, the demand for fossil-fuel energy has constantly increased, and especially that for oil and coal [1]. Since the implementation of reform and opening-up policies, China’s economy has grown rapidly, causing China’s demand for energy to rise; however, China’s coal resource reserve ranks third in the world at a proportion of 11.6%, so the coal-based energy consumption structure of China will not change within the short-term. Therefore, coal resources show a significant promotional effect on the development of China’s economy, exerting strategic influences thereon [2,3].
To satisfy the demand for coal and realize high-yield, rapid coal mining, many coal mine accidents occur in China [4,5]. Coal mine accidents which result in more than 10 deaths are generally gas accidents, which occur at the highest frequency and cause the largest damage [6,7]. Besides, coal generates a large amount of greenhouse gas (CO2) during its near-constant consumption, consequently leading to increasingly severe climate warming. It also causes problems such as the re-distribution of global precipitation, the melting of glaciers and frozen soil, and sea-level rise. Moreover, airborne haze not only threatens the natural ecological balance but also threatens human survival [8,9,10]. Currently, cities, towns, and villages in China have begun burning gas instead of coal and dismantling numerous coal-burning boilers. The reasons are attributed to two aspects: on the one hand, coal combustion generates greenhouse gases; on the other, gas problem appears in coalbeds during mining [11]. Gas in coalbed is both a source of disasters and energy (as coalbed methane (CBM)). CBM is an associated resource of coal, and as a non-conventional natural gas, is an efficient clean energy source [12,13].
The greenhouse effect of methane is more than 20 times that of CO2 [14]. For gas prevention in coalbed, gas extraction plays an important role, however, the permeability of coalbed in China is poor and gas extraction efficiency in coalbed is low. Moreover, the gas concentration in the pipeline for gas extraction is low and the technology and equipment available for efficiently utilizing this low-concentration gas remain immature, which results in a low utilization ratio of gas. Additionally, existing equipment and operating costs are high. Therefore, in many mines, the measures necessary for gas utilization are not taken and also the extracted gas is directly emitted to atmosphere, so gas drainage rather than gas extraction and coal mining is implemented [15]. As an efficient clean energy source, CBM has good prospects in terms of being developed to a large-scale and utilized [12]. The efficient extraction of gas in coalbed can reduce the occurrence of gas disasters in mines to ensure safety. To extract gas at a high concentration exerts a positive influence on changes to China’s energy structure and reduced greenhouse effect contribution [15].
Coalbed is also called a double-porosity medium owing to its containing tiny pore structures with multiple morphologies [16]. The pore and fracture network in a coal mass becomes the main channel for gas migration in coalbed, therefore, the higher the degree of development of the pore and fracture network in a coal mass is, the higher the gas permeability is, and the higher the gas extraction effect is [17,18,19]. However, the permeability of coalbed in China is generally poor. Therefore, to improve the connection of pores and fractures in coalbed, it is necessary to increase the permeability of coalbed by utilizing hydraulic fracturing, hydraulic slotting, directional drilling, or deep-hole blasting [20,21,22,23]. In particular, the majority of soft coal shows dynamic phenomena or outburst risk owing to it exhibiting various characteristics such as poor permeability, low strength, rapid gas desorption velocity, and high gas content. The thickness of soft coalbed changes and the majority thereof is unstable. The thickness of soft coalbed varies from several centimeters to the height of the whole coalbed and soft coalbed in different areas show a great discrepancy. Thus, investigating the characteristics of pore and fracture structure is important [11].
Pore structure in coal refers to the size, shape, development, and interactive relationship in coalbed. The basic parameters for characterizing pore structure in coal include: pore size, specific pore volume, specific surface area (SSA), porosity, and median pore size [24,25,26,27]. Numerous scholars have explored the porosity characteristics of coalbed by utilizing different methods [28,29,30,31,32,33,34,35,36,37,38,39,40,41,42,43,44,45,46,47,48,49]. The methods for quantitatively characterizing the porosity characteristics of coalbed mainly include liquid injection methods, non-fluid injection methods, and image analysis methods. The fluid injection methods mainly involve mercury intrusion porosimetry, CO2 adsorption, liquid nitrogen adsorption, and nuclear magnetic resonance (NMR) [28,31]. Non-fluid injection methods mainly include: small angle X-ray scattering (SAXS), small angle neutron scattering (SANS), focused ion beam-scanning electron microscope (FIB-SEM), and micron-resolution computed tomography (μ-CT) [34,41,42,43]. The image analysis methods mainly use scanning electron microscopy (SEM), atomic force microscope (AFM), transmission electron microscope (TEM), and field emission scanning electron microscopy (FESEM) [46,47,48,49].
Due to being restricted by experimental method limitations, fluid injection methods are only able to test open pores in coal masses while failing to characterize closed pores: however, fluid injection methods are widely used in coal masses. Generally, when investigating the characteristics of pores and fractures in a coalbed, the pore and fracture structures thereof are quantitatively characterized by combining CO2 (or low-temperature N2) adsorption methods with mercury intrusion porosimetry. On this basis, the specific area of pores, pore volume, and pore size distribution characteristics are discussed. Additionally, the fractal characteristics of pores and fractures with different sizes are investigated based on different mathematical models [28,29,30,31,32]. The mercury intrusion experiment is also widely applied, based on which the relationship between pore volume and pressure can be established [33].
In recent years, multiple non-destructive and efficient non-fluid injection technologies have been applied to characterize pores and fractures in coalbed. SAXS/SANS technology is applicable to fragile samples whose core is hard to drill. By using this method, coal samples are not damaged during measurement. Compared with CO2/N2 adsorption methods, SAXS/SANS technology can be used for testing under different temperatures and pressures and the acquired pore information is not restricted by the interactive effect between fluids and surfaces, shielding effects, and pore connectivity. It is feasible to analyze information about closed pores in coalbed and various parameters including porosity, pore size distribution, and SSA [34,35,36]. FIB-SEM and μ-CT technologies can reveal the three-dimensional (3D) continuous change and anisotropic characteristics of pores and fractures [37,38,39,40,41]. FIB-SEM technology is widely used to quantify nano-sized pores in coal of different ranks [42,43,44,45].
Image analysis technology can be adopted to observe the pores in coalbed by using micro-observation technology under a microscope to further acquire images and qualify various characteristics such as size, shape, connectivity, and surface morphology of pores. The results are intuitively visible and qualitative and quantitative analyses can be combined with statistical analysis: data on pores obtained by using SEM image analysis technology has become a research hot-spot [46,47,48,49]. By using TEM and AFM technologies, one not only can explore the molecular structure and surface characteristics of coal but also can characterize the pore structure [47].
As we can see, different methods for characterizing pore and fracture structures have their own advantages and disadvantages as well as the pore diameter measurement ranges. Investigating the basic characteristics of pore and fracture structures in soft coal from different regions is important when efficiently developing CBM, improving the gas extraction efficiency in coalbed, controlling gas accidents in mines, and reducing the greenhouse effect caused by coalbed gas. The No. 5 coalbed in the western zone of Chenghe Mining Area, Shaanxi Province, China contains hard coal. Heyang, Shanyang, and Xizhuo Coal Mines are located in the new district in the eastern part of the mining area. During the construction of the three new mines, the property of No. 5 coalbed exposed was quite different from that of No. 5 coalbed in the west area. The No. 5 coalbed in the east area is softer and higher gas content than No. 5 coalbed in the west area. On this basis, the characterization of pores and fractures of the No. 5 soft coal newly exposed in the east area were investigated by applying mercury intrusion porosimetry, low-temperature liquid nitrogen adsorption, and SEM: the pore structure of coal was also characterized by use of fractal theory, which can be used for the future gas prevention and control foundation of the new mining area, as well as studying the No. 5 hard coal in the west area. In this way, the pore structure of soft coal in Chenghe Mining Area was investigated and compared with that of the No. 5 hard coalbed of Dongjiahe Coal Mine in the western part of the mining area which are same coalbed and belonged to the same mining area. This provides a theoretical basis for investigating the gas adsorption, desorption, and gas extraction of the No. 5 coalbed in the eastern zone of the new mining area.

2. Materials and methods

2.1. Selection of Coal Samples

The No. 5 main mineable coalbed in Shanyang (SY), Heyang (HY), and Xizhuo (XZ) Coal Mines and the No. 5 main mineable coalbed of Dongjiahe (DJH) Coal Mine were used for the experiments. Moreover, the coal samples were all taken from the newly exposed surface of coalbed. Table 1 and Table 2 list the parameters pertaining to the gas in coal samples and the coal-rock analysis result of coal samples, respectively.
HY, SY, and XZ show a low Protodyakonov coefficient and a large initial diffusion velocity (Table 1). Additionally, HY, SY, and XZ are softer, more friable, and cohesive, compared with DJH, and showing unclear macroscopic bedding, and their surfaces appear as clastic, flake-shaped structures, exhibiting typical characteristics of soft coal.
It can be seen from Table 2 that SY coal samples showed 73.8% vitrinite content while DJH exhibited the lowest vitrinite content, implying that the higher the gelatinization, the higher the vitrinite content. The inertinite content was from 18.7% to 46.6%, which was proportional to the fusinization in the later period of coal formation, and there was little-to-no exinite present.

2.2. Experimental Equipment and Test Methods

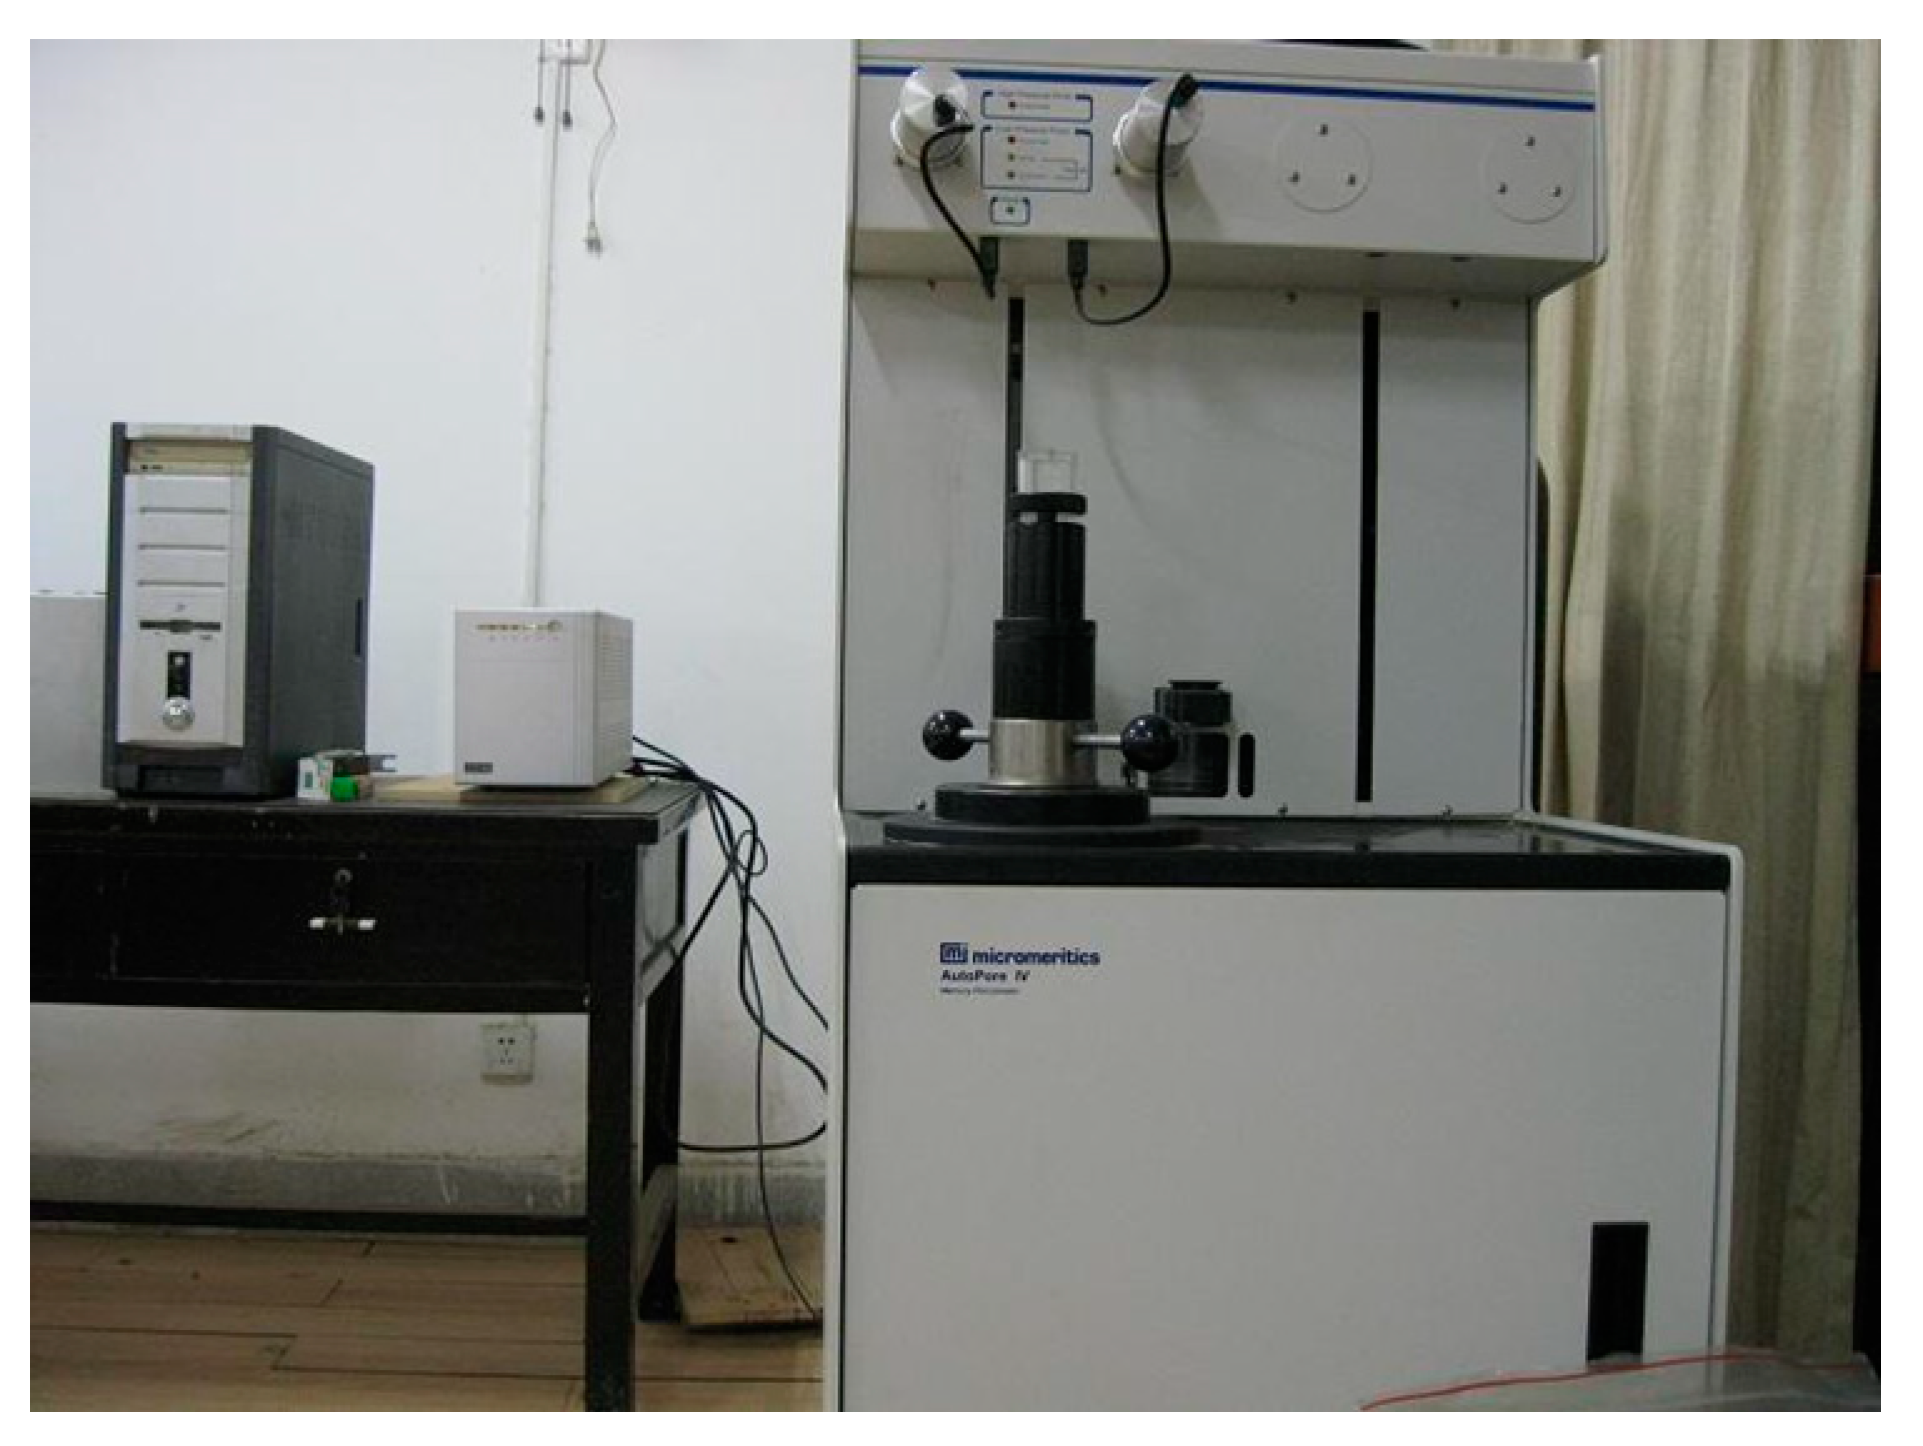
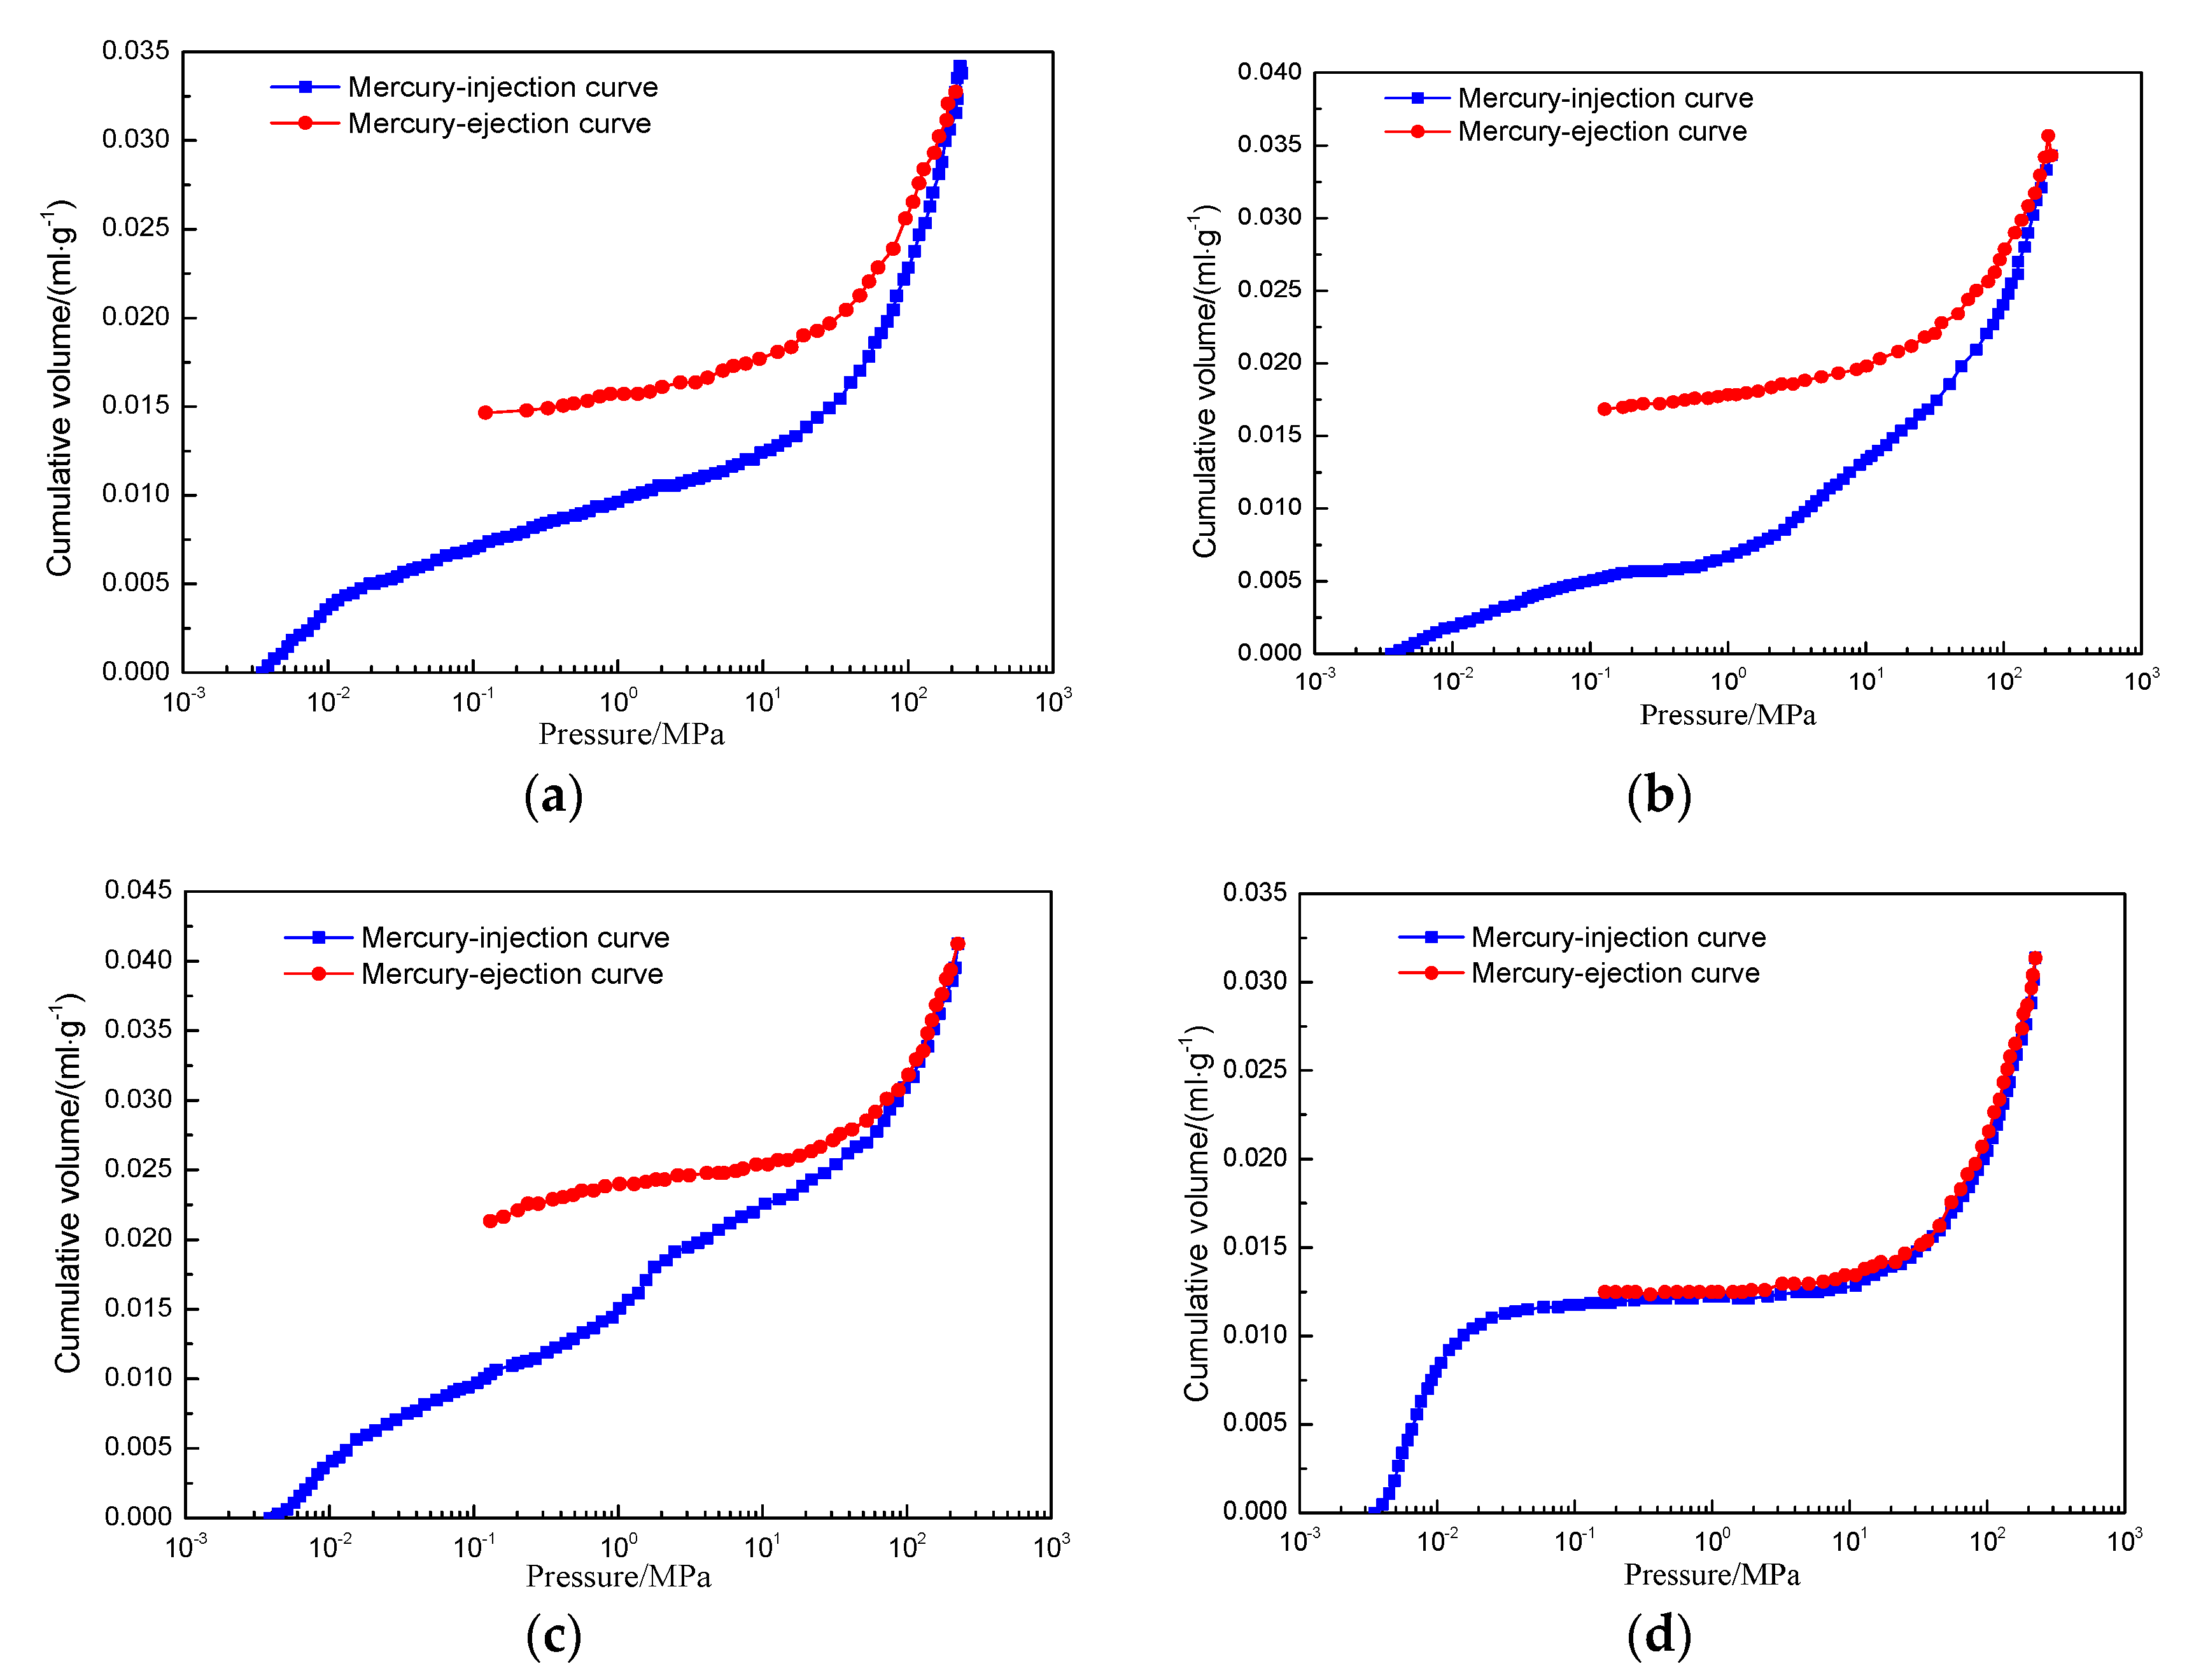
2.2.1. Mercury Intrusion Porosimetry

The MK-AutoPore IV9510 mercury injection apparatus (Micromeritics Instrument Corp, Norcross, GA, USA) (Figure 1) was used, with a measurable pore size range of 0.003 to 1000 µm, which can be used with two low-pressure (LP) pump stations and a high-pressure (HP) pump station or four LP pump stations and two HP pump stations. The apparatus, at a pressure of 33,000 or 60,000 psi, allowed volume precision for mercury injection or ejection of better than ±0.1 μL. To eliminate the influences of mineral impurities in coal samples and fractures caused by human factors on the measurement result as far as possible, four types of experimental coal samples were crushed into particles at about 2 mm diameter.

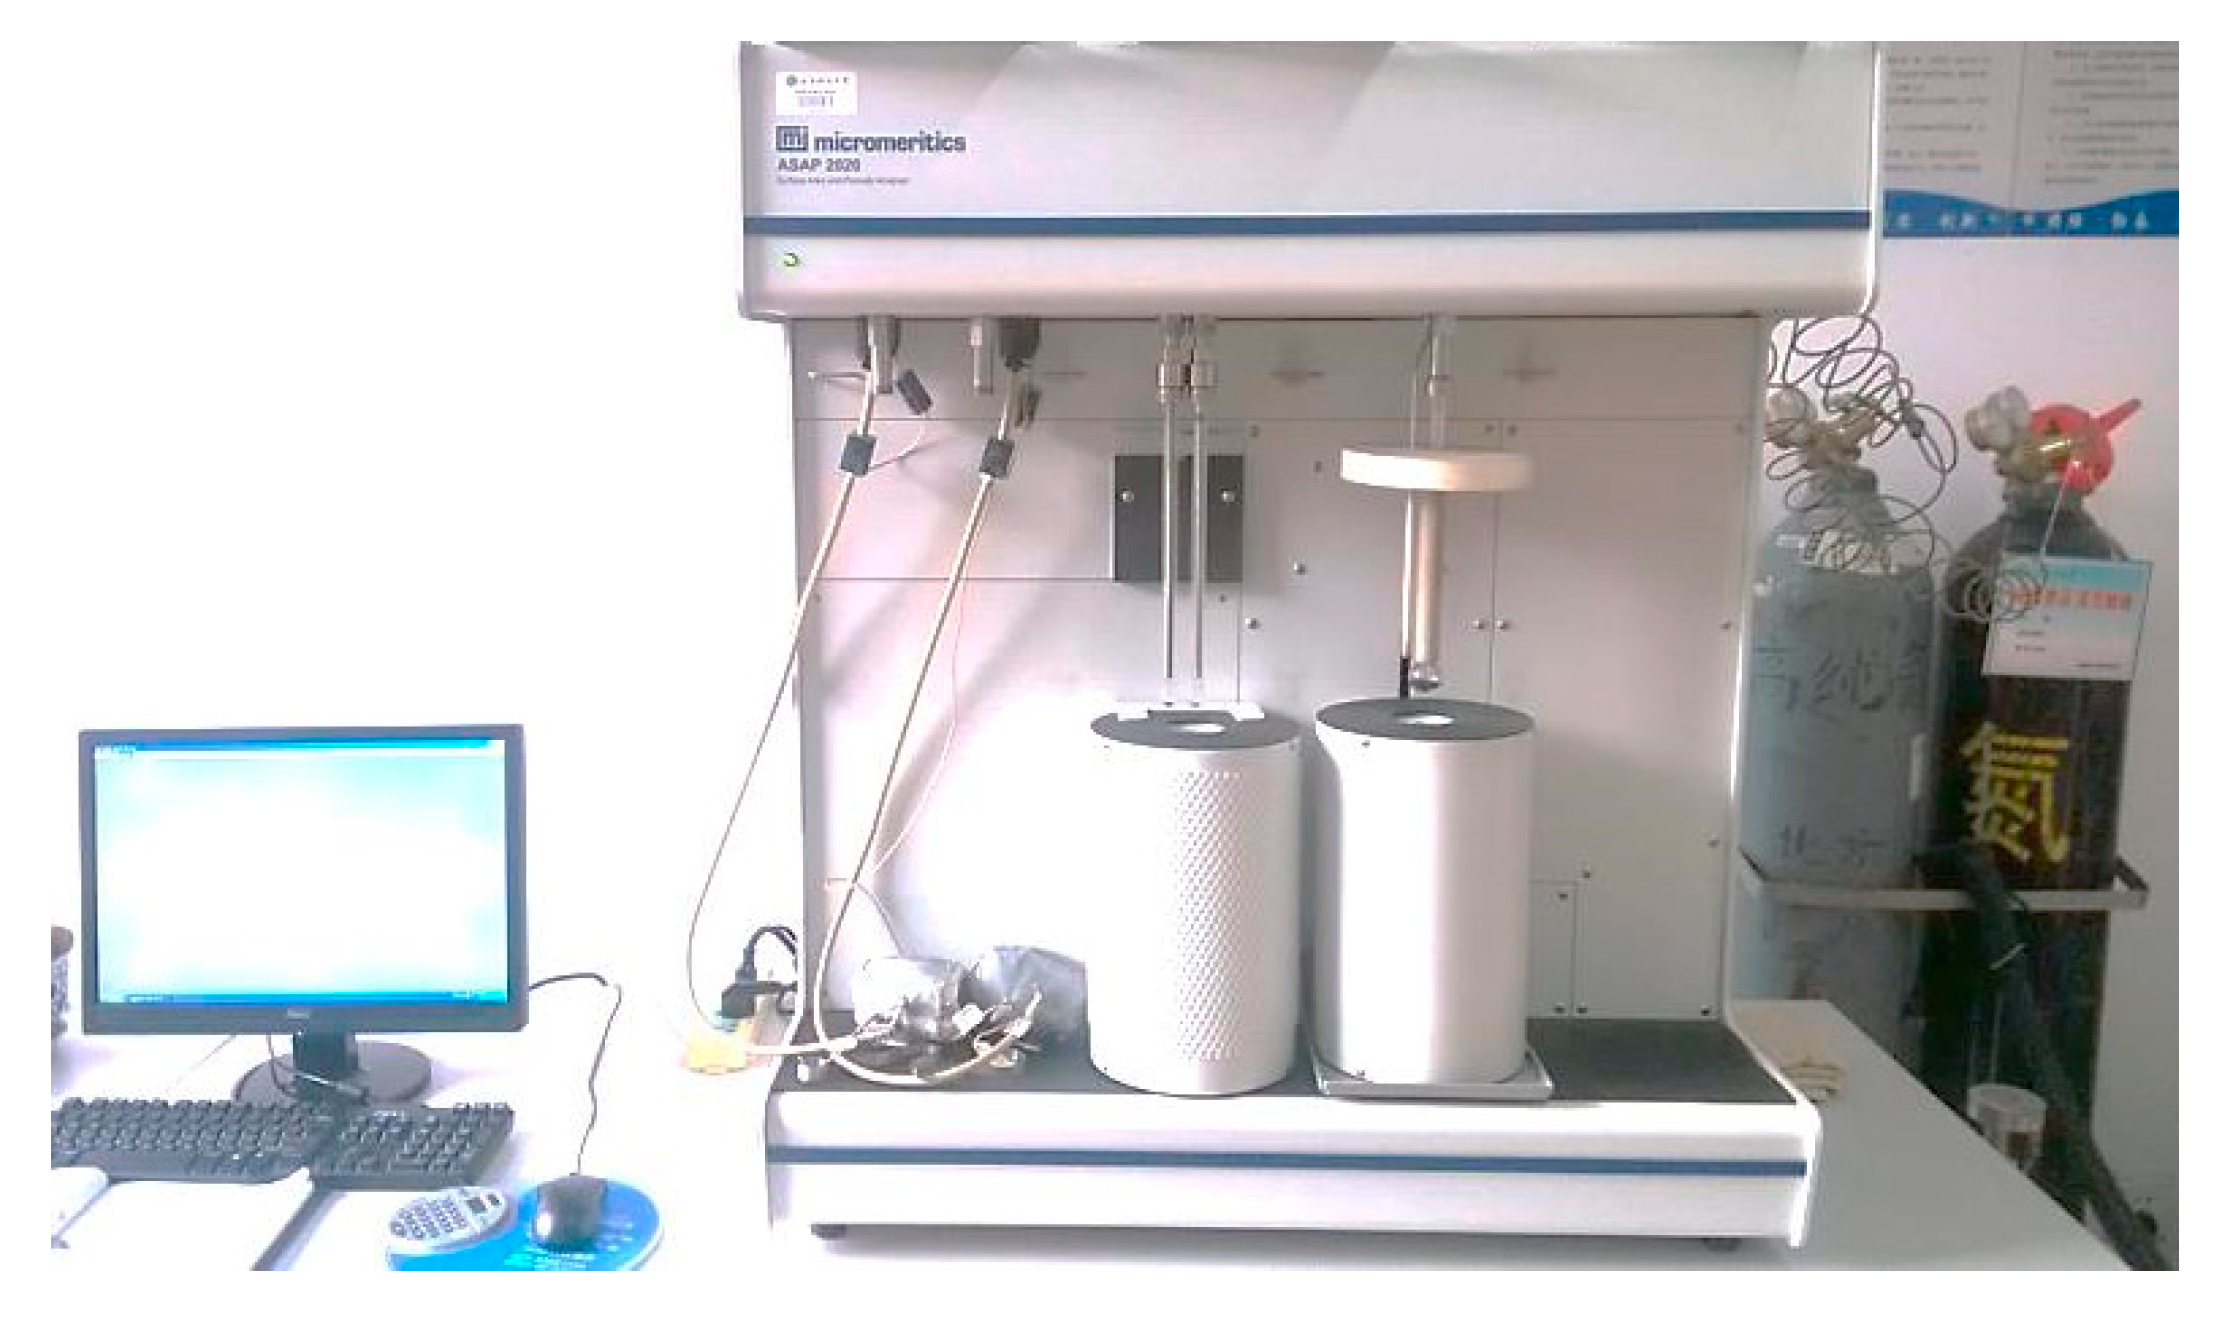
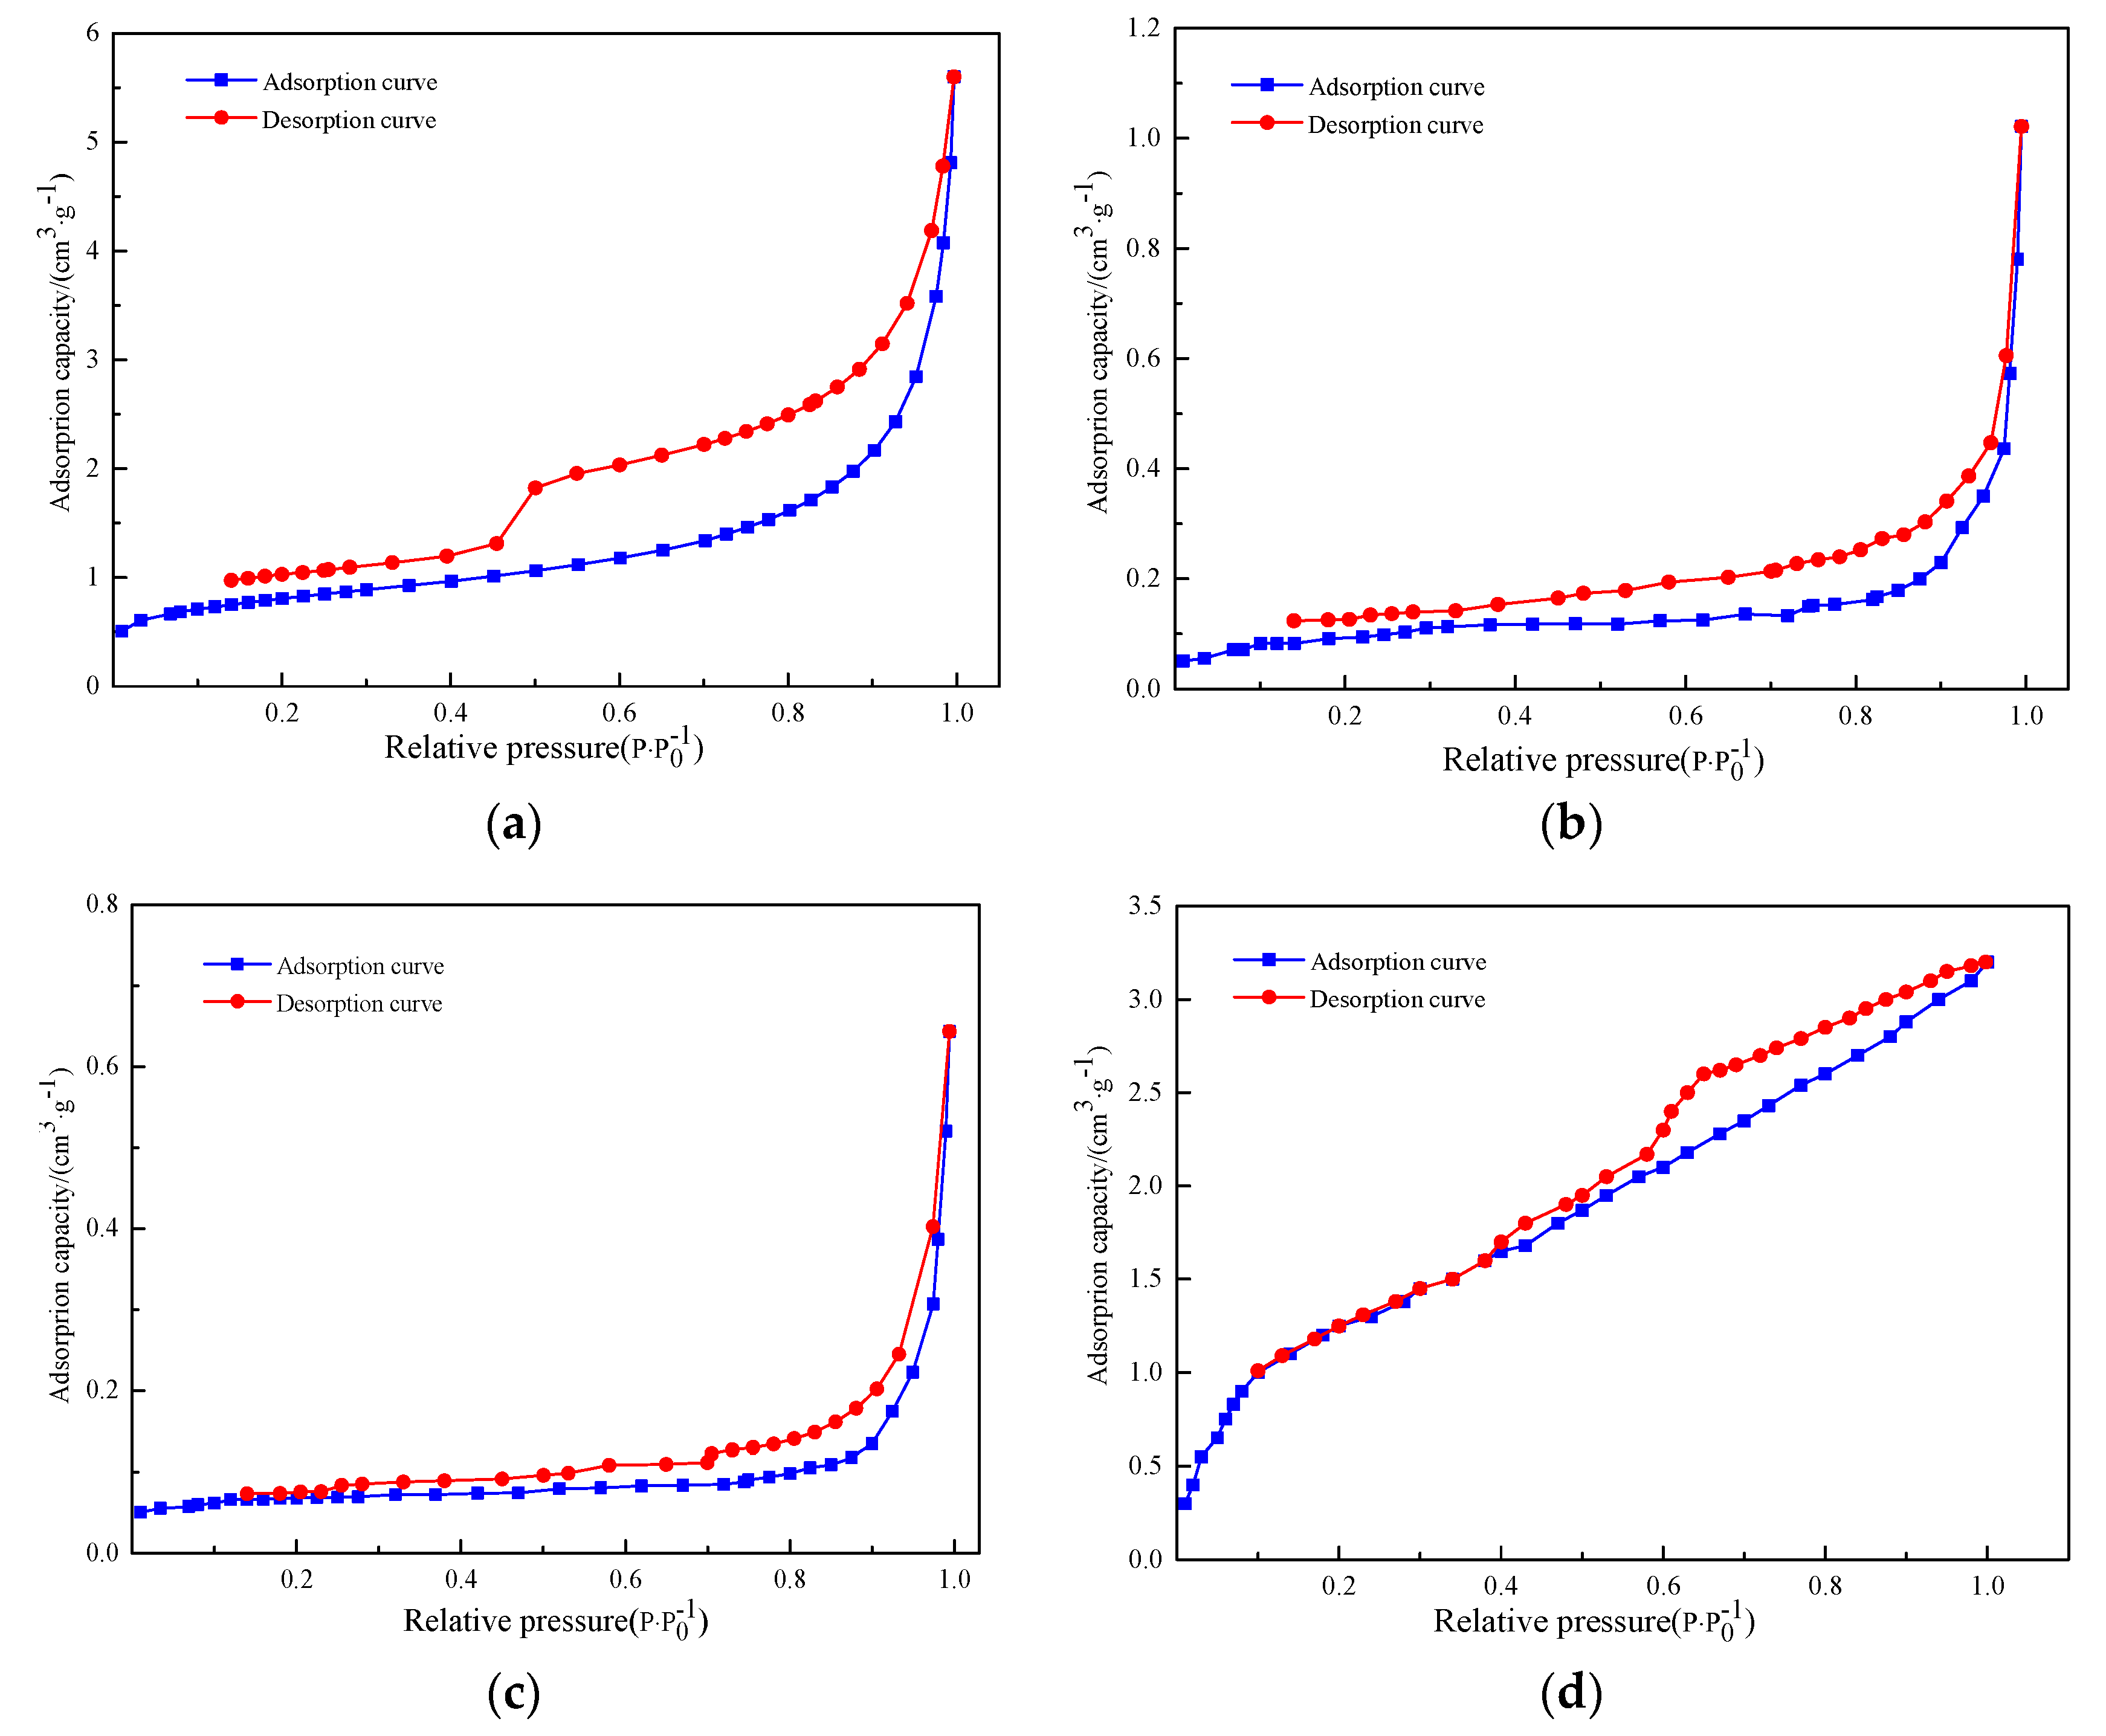
2.2.2. Low-Temperature Nitrogen Adsorption Method

The ASAP2020M (Micromeritics Instrument Corp, Norcross, GA, USA) automatic analyzer for SSA and micropores (Figure 2) was employed. It can be used to analyze various parameters including single- and multi-point BET (Brunauer, Emmett, and Teller) SSA, Langmuir SSA, pore size distribution, and pore volume according to a static gauging method for isothermal physical adsorption. It is a classical method for measuring the samples whose SSA is greater than 1 m2/g. Before preparing samples, it is necessary to clean the sample cell using ethyl alcohol or acetone and then dry it. Three grams of experimental coal samples (four types of each) were separately weighed and stored. Moreover, the sample cells and tube plugs were labeled.

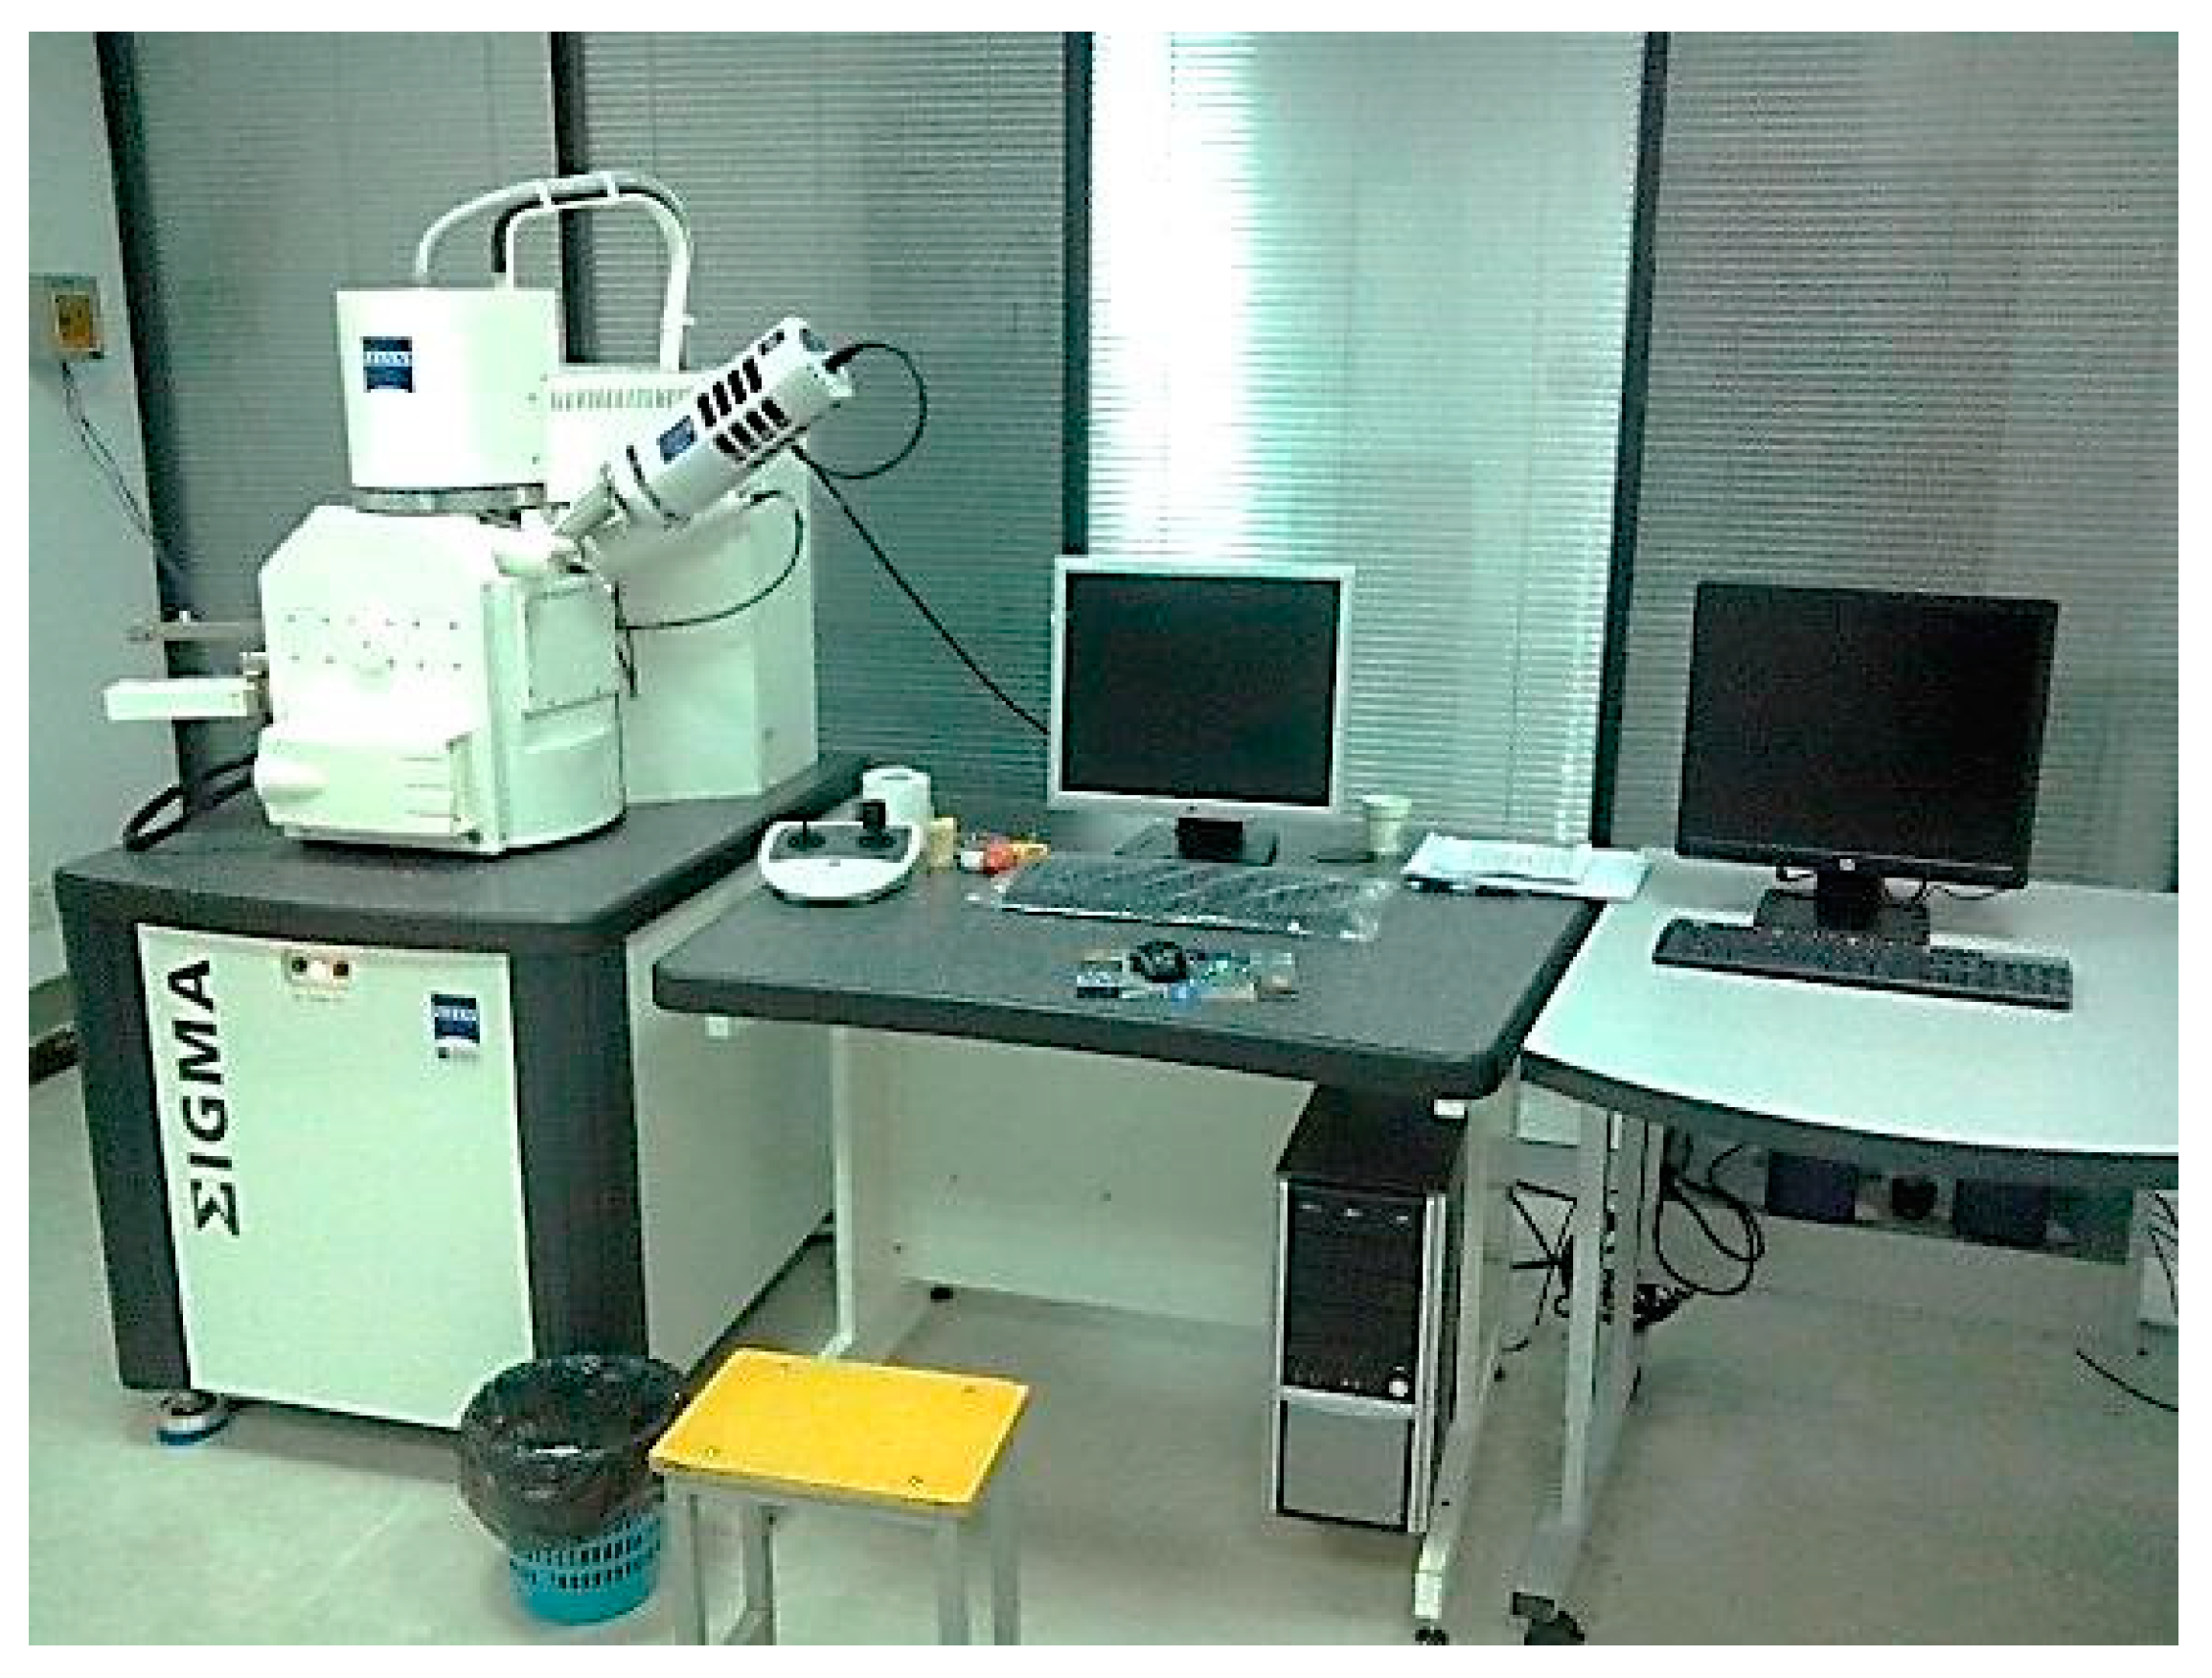
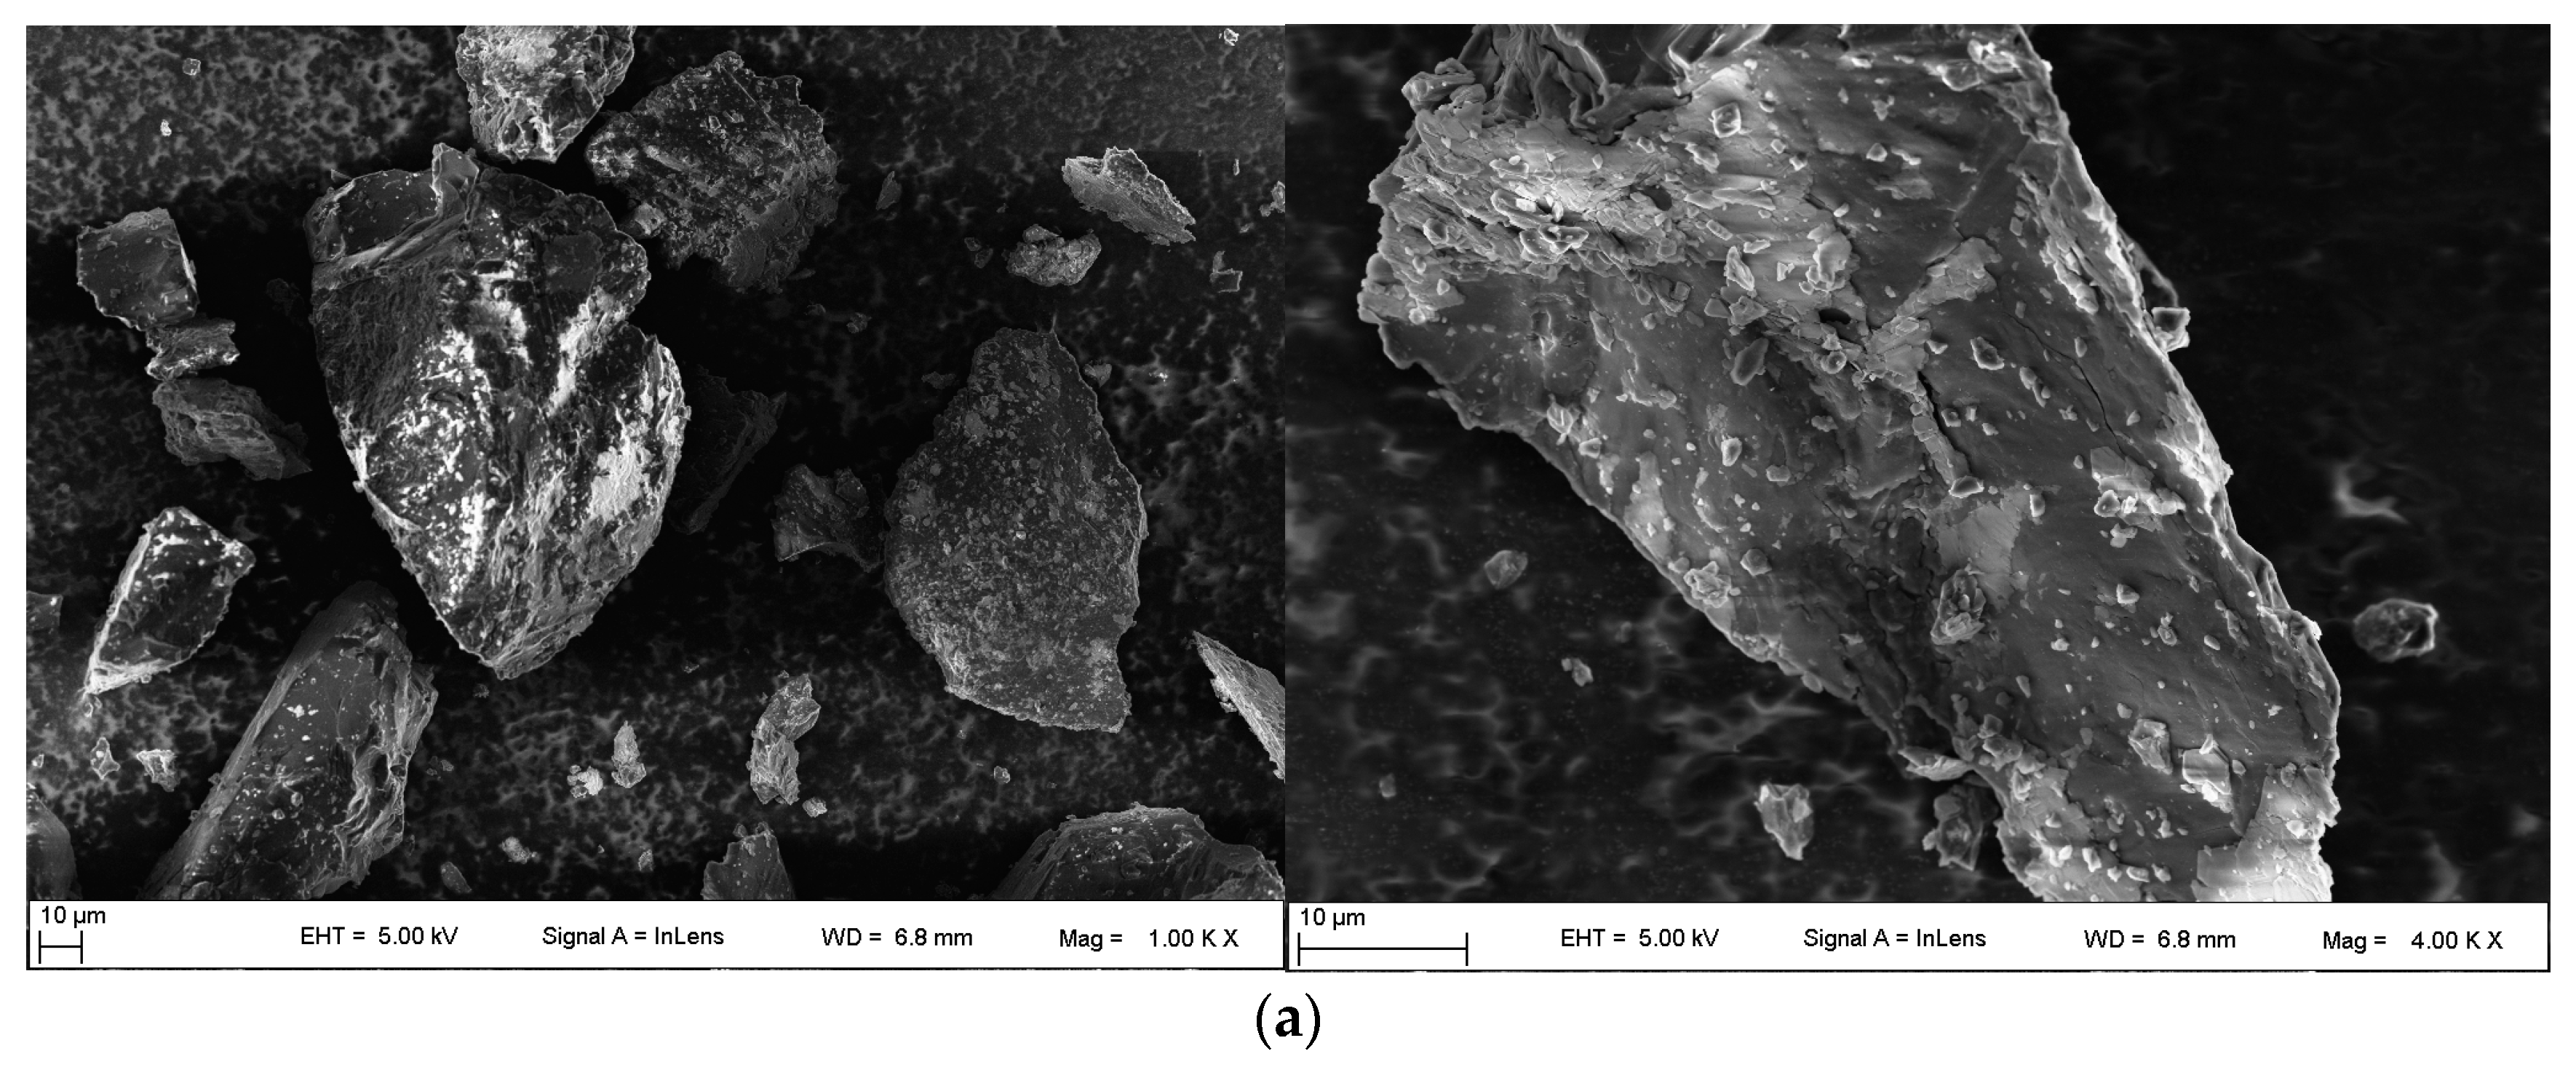
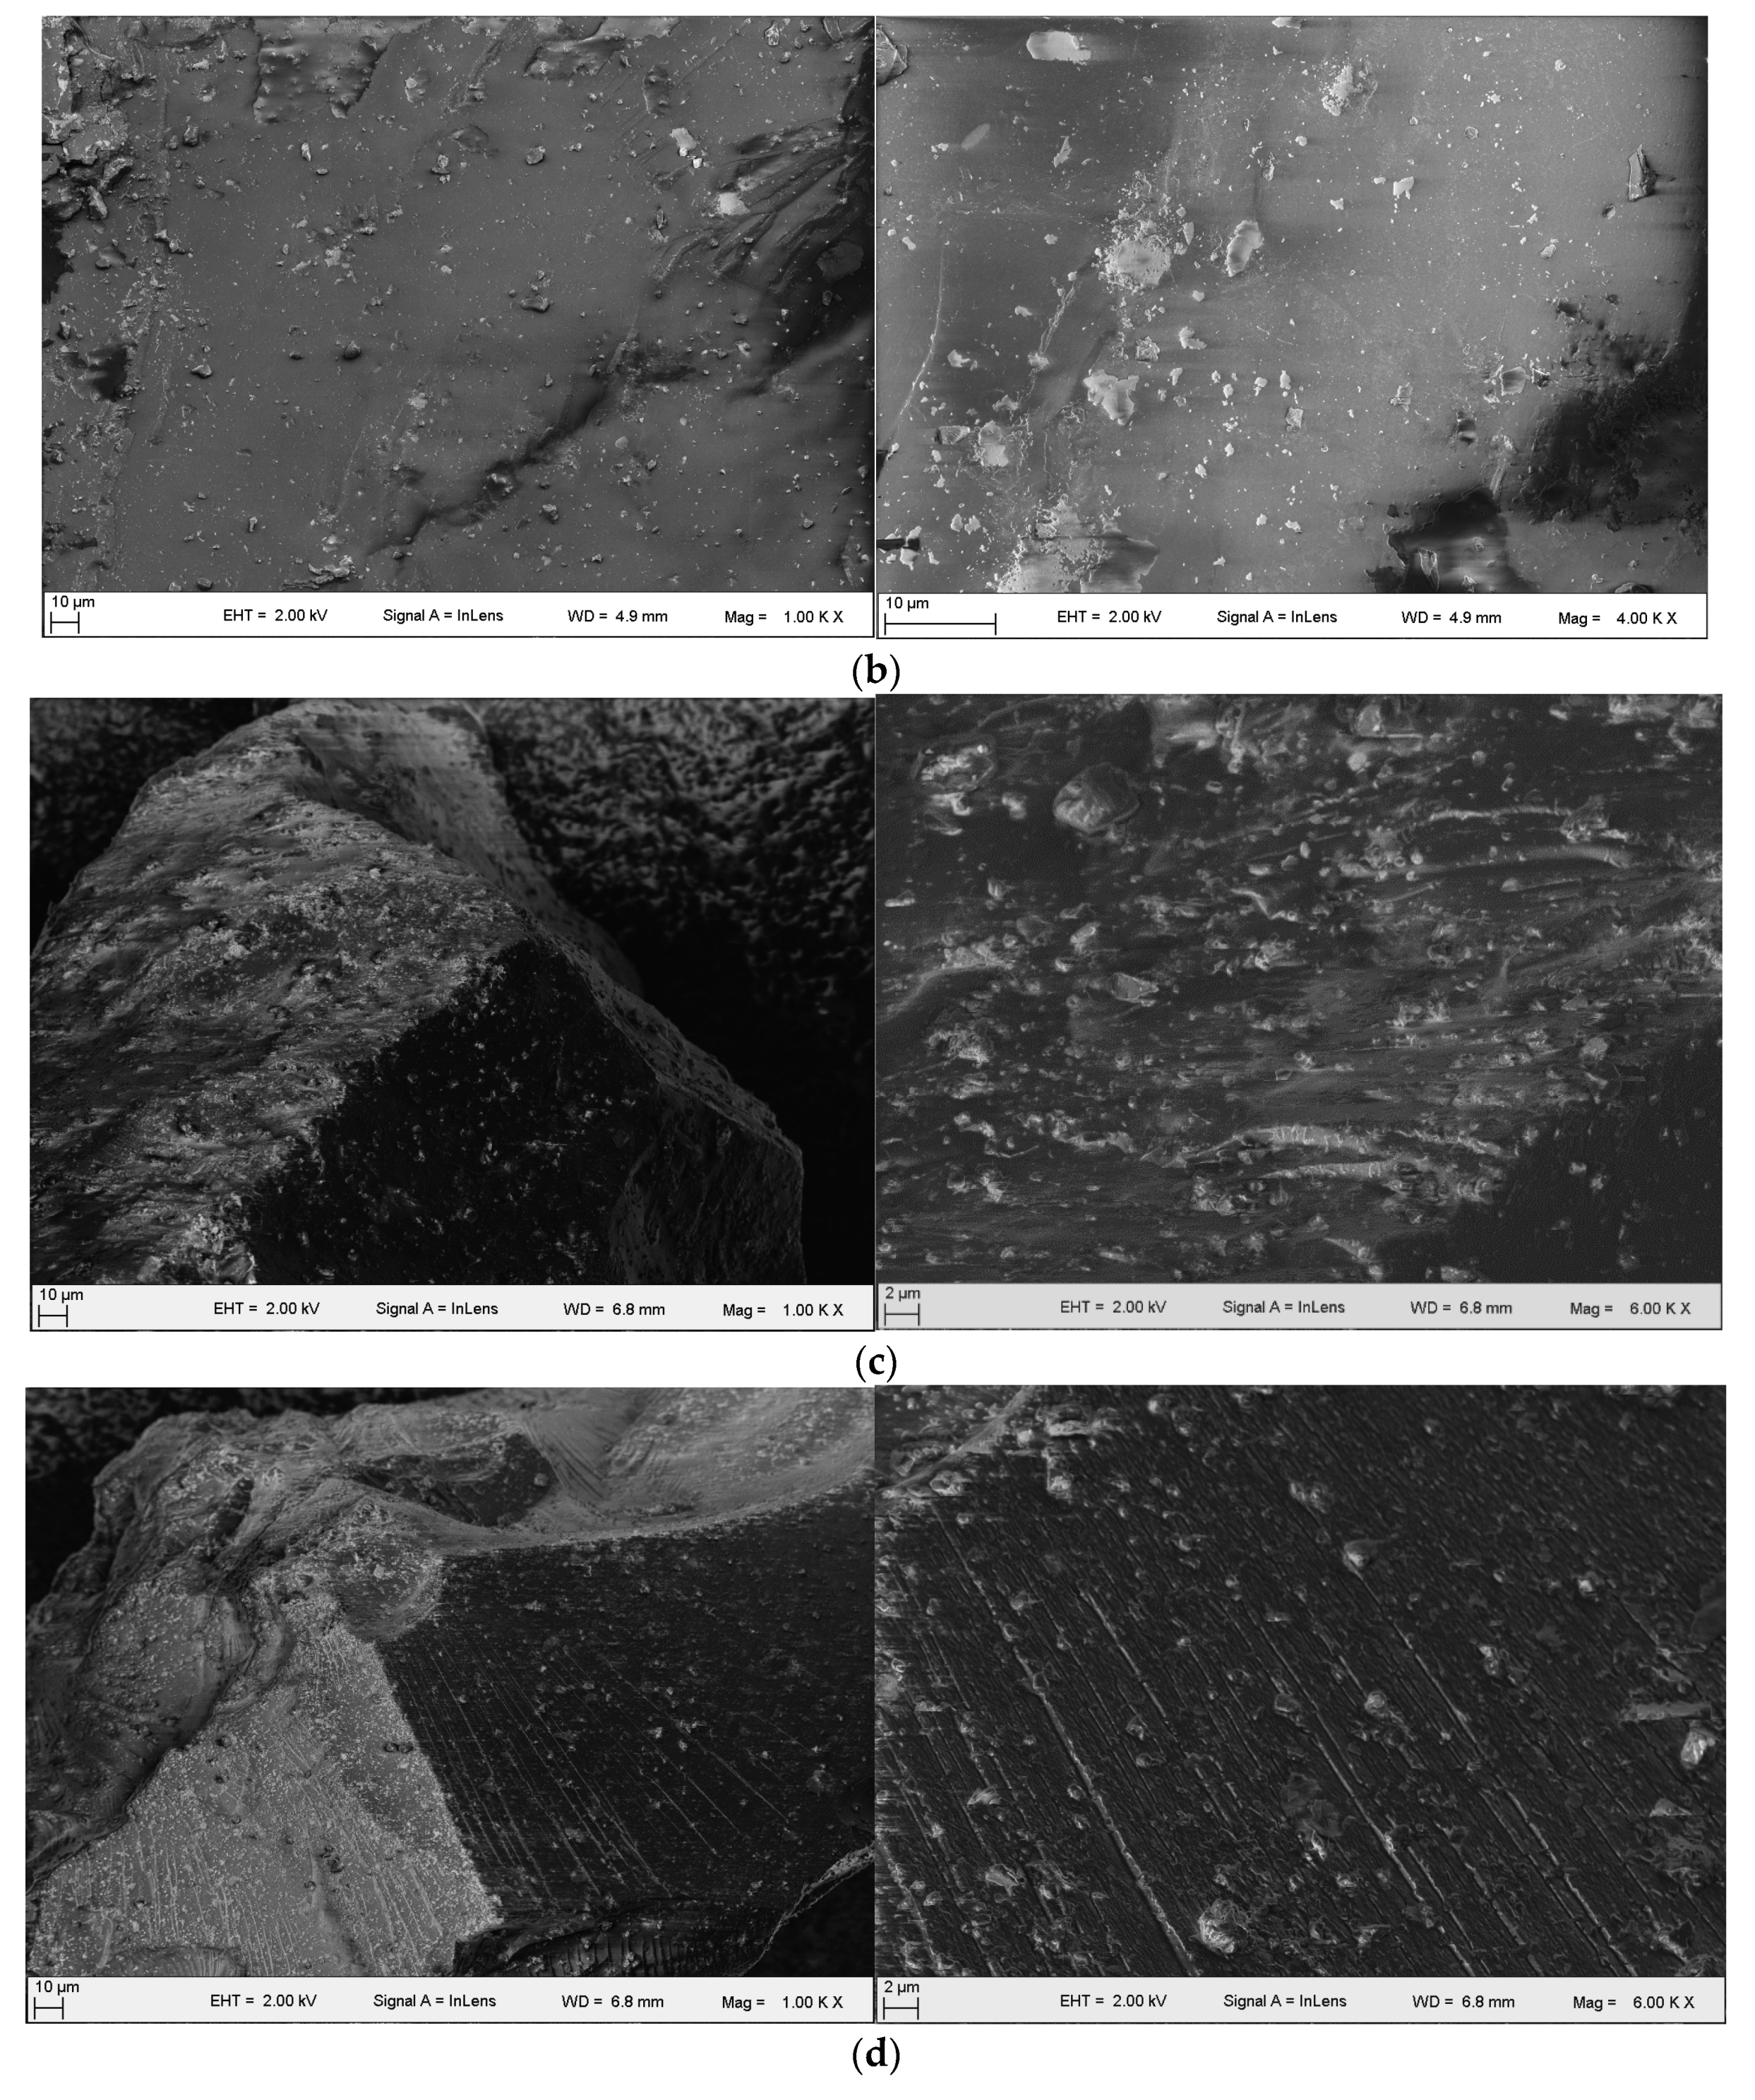
2.2.3. SEM Observation

The applied ΣIGMA SEM (Carl Zeiss AG, Oberkochen, Baden-Württemberg, Germany) (Figure 3) was characterized by a digital control system whose acceleration voltage was in the range 0.1 to 30 kV, and it can be magnified by 12,000 to 500,000 times. Equipped with a zoom focusing system with high resolution and high precision, it can be used to analyze microstructures of powdery, blocky, and thin-film samples.
In the experiment, 1 to 2 cm3 small-blocky coal samples were taken from coal blocks. Moreover, relatively even natural fracture surfaces were chosen for observation, which were cleaned by gas absorption. Afterwards, the observed surface was plated to form a conducting layer. The loosened fragile soft coal should be treated gently at all times.

3. Results and Discussion

3.1. Characteristics of Pore Structure

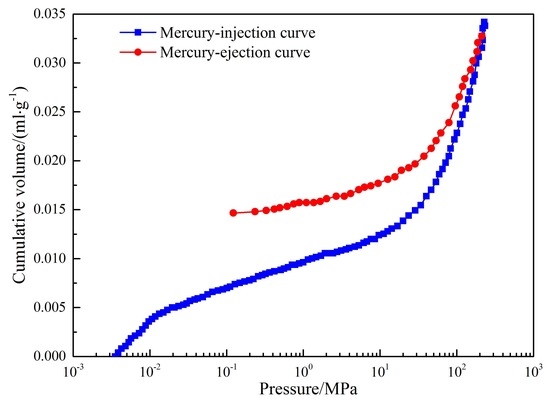
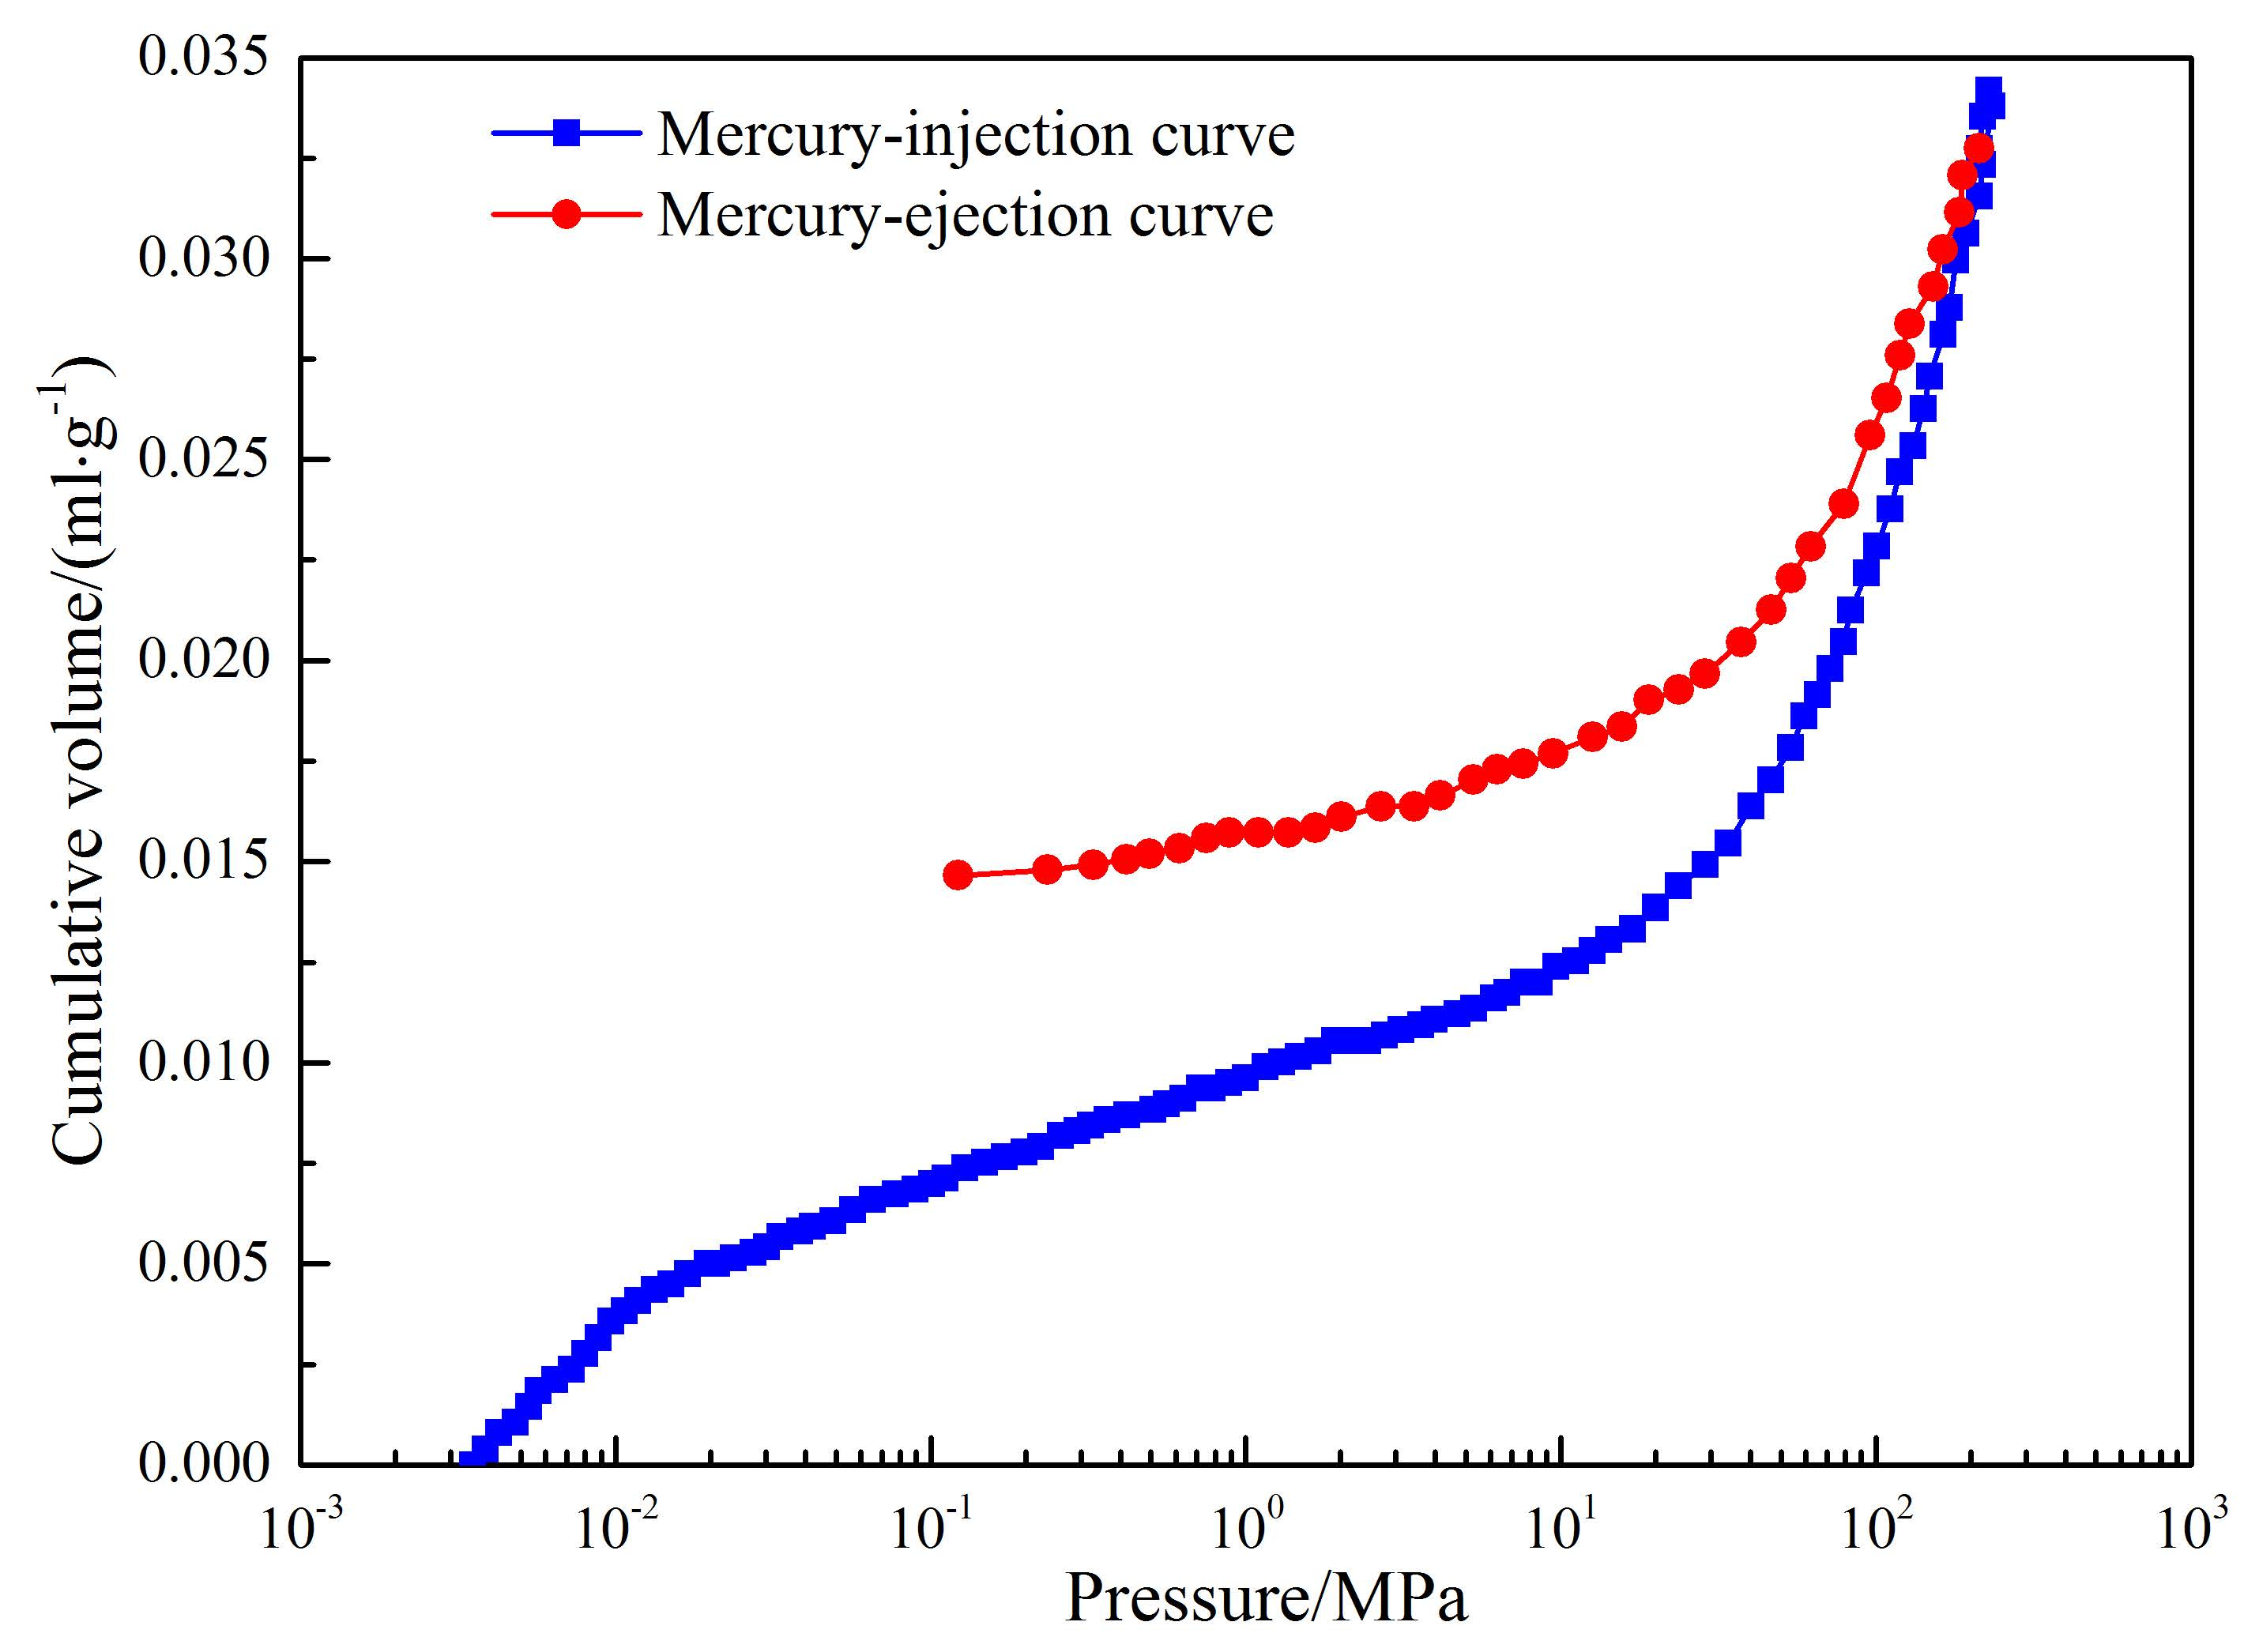
3.1.1. Measuring Pore Structure by Mercury Intrusion Porosimetry

The results of mercury intrusion experiments are listed in Table 3: the displacement pressures of soft coal were all larger than those of hard coal. The displacement pressure can be used to measure the permeability of coalbed: the lower the displacement pressure, the better the permeability of a coalbed. The permeability of soft coal was lower than that of hard coal. The mean radius of throat of soft coal was 201.85 nm while the DJH hard rock showed the largest mean radius of throat of 341.29 nm. The mean mercury saturation of soft coal was 78.33% while DJH hard coal exhibited the largest mercury saturation (92.97%). The mean mercury-ejection ratio of soft coal was 57.78% while the mercury-ejection ratio of DJH hard rock was the largest, reaching 97.73%.
The mean proportions of macropores, mesopores, small pores, and micropores in soft coal were 6.19%, 16.67%, 44.67%, and 32.38%, while those in DJH hard coal were 1.85%, 41.74%, 22.55%, and 33.86%, respectively. It can be seen that small pores and micropores are dominant in soft coal in which small pores accounted for nearly half of the total pore volume, and mesopores and macropores were also evenly distributed. The pores in hard coal mainly appeared as mesopores, followed by micropores, while small pores and macropores accounted for a minor proportion overall. Under the effect of geostress, the gas in the coal mass was mainly adsorbed in micropores and small pores and flowed through mesopores and macropores: however, under the effect of geostress, the pore volume of the coal mass decreased and therefore the porosity of the coal was reduced, thus resulting in a reduction in permeability, which impaired the seepage and migration of gas in coalbed. After the pressure-relief process, the desorbed gas can be more constantly diffused in soft coal than in hard coal.
According to the initial data of mercury intrusion experiment, the mercury-injection and mercury-ejection curves of the four types of coal samples were plotted (Figure 4). The curves were divided into two types: Figure 4a–c are classified as the first type while Figure 4d is belonged to the other.
The mercury-intrusion loops shown in Figure 4a–c showed significant hysteresis loops and there was no platform segment in the curves. The injected and ejected amounts of mercury differed, implying that pores in coal samples mainly appeared as open pores. The mercury-injection curves were similar to the mercury-ejection curves, which indicated that certain amounts of semi-closed pores were present in the coal. The absence of a platform segment in the curves implied that the matrix pores in coal exhibited large differences, with non-uniform structures therein. The tectonic stress augmented the connectivity between mesopores and macropores in soft coal, thus improving the capability of pores for storing gas. However, the pores in soft coal were mainly semi-closed and therefore much gas was likely to be released once the pressure on the coalbed was relieved. The curve in Figure 4d showed an even segment and the mercury-injection curve was consistent with the mercury-ejection curve, without a hysteresis loop, which implied that pores in coal masses were mostly closed. The presence of the platform segment in the curve indicated that the matrix pores in coal masses exhibited little difference, with a uniform structure therein. The primary pores in coal masses were compressed or appeared as long, thin gaps. The deformation led to the reduction in volume of coal masses and therefore gas pressures increased. The non-connected microfractures, abundant with gas, comprised a closed system, and once surrounding stress decreased, particularly during mining, a stress concentration zone was formed at the front of working face. In this case, the accumulated gas in coal masses flowed to the working face space.

3.1.2. Measuring Pore Structure by Low-Temperature Nitrogen Adsorption

After analyzing the trend in the adsorption isotherm, the characteristic parameters of pore surfaces in coal masses can be qualified. Moreover, the interaction between the surface of coal masses and gas was analyzed. The low-temperature nitrogen adsorption and desorption curves of coal samples are shown in Figure 5.
The low-temperature nitrogen adsorption and desorption isotherms of soft coal in Figure 5a–c all belong to IV-type isotherms (based on International Union of Pure and Applied Chemistry (IUPAC)), showing different sizes of adsorption hysteresis loops. Shapes of the hysteresis loops can reflect the characteristic of the pore structure. As shown in Figure 5b,c, the adsorption hysteresis loops in the curves of the coal samples were small, indicating that impermeable pores were found in coal samples, and the adsorption curves were bulged, which indicated that there was significant interaction between coal masses and nitrogen and therefore many micropores could be found in the coal. When the relative pressure exceeded 0.8, the adsorption–desorption curves suddenly increased, reflecting the poor permeability of the coal.
The curves in Figure 5a showed a large adsorption hysteresis loop and a significant inflection point, reflecting the presence of flask-shaped pores. It can be seen from the Kelvin formula [50,51] that the corresponding pore size was about 4 nm under a relative pressure of 0.5, which was larger than the diameter of the gas molecules. The presence of flask-shaped pores caused the adsorbed gas to be difficult to desorb. The adsorption curves were not significantly convex, which meant that the interaction between coal masses and nitrogen was weak. When the relative pressure exceeded 0.8, the adsorption–desorption curves suddenly increased. The curves in Figure 5d showed a small adsorption hysteresis loop, and a significant inflection point, reflecting the presence of flask-shaped pores. However, the relative pressure region corresponding to the hysteresis loop was large. After the inflection point of the hysteresis loop, the condensed liquid in the open hole evaporated completely, and then transited to a closed pore at one end. That is why the adsorption curve coincided with the desorption curve in the low relative pressure region. For curves in Figure 5a–d, under a relative pressure of zero, the adsorption capacities of soft and hard coal for nitrogen were both positive because nitrogen was preferentially adsorbed in the micropores in coal masses while soft coal contained more micropores. The superposed effect of adsorption force fields in micropores led to an increased adsorption potential of soft coal. As the relative pressure changed from 0.4 to 1, both soft and hard coal showed different sizes of hysteresis loop.
When adsorption tests were carried out on solid with capillary pores, the pore with corresponding Kelvin radius would be capillary condensation with the increase of relative pressure on the basis of the theory of adsorption and condensation [52,53]. If the pressure was increased and then decompressed, the adsorbent would gradually desorb and evaporate. The relative pressure of condensation and evaporation of the same pore may be same or different due to the different specific shape of the capillary. If the relative pressure of condensation and evaporation was the same, the adsorption curve overlapped the desorption curve. On the contrary, if the two relative pressures were different, the two branches of the adsorption isotherm would separate to form a loop that we called it hysteresis loop [53].
In the desorption process, the relative pressure gradually decreased at the beginning, and the hysteresis loop was generated at the neck of flask-shaped pores due to the difference in shape of the gas-liquid interface during the condensation of the open pores and evaporation. However, due to the existence of pores with different diameters, when the relative pressure drops to a certain value, the corresponding larger pores begin to evaporate, resulting in a decrease in the adsorption amount and a gradual decrease in the desorption line. When the relative pressure dropped to the value corresponding to the inflection point, it meant that the condensed liquid of the smallest open pore was about to evaporate, and while the pressure continued to drop slightly, the liquid in it would gush out immediately. Therefore, there was a sharp drop in the inflection point on the hysteresis loop.
By using a low-temperature nitrogen adsorption method, the experimental data on SSA and pore volume of coal samples can be acquired (Table 4). The value of BET SSA was different from that of Langmuir SSA (Table 4). The reason for this was that the Langmuir model assumes that the adsorption of coal for gas is single-layer adsorption-based while the BET model supposes that the adsorption of coal for gas is multi-layer adsorption-based.
The BET SSA of soft coal samples ranged from 10.4228 to 14.3245 m2/g, with a mean of 11.7263 m2/g, and that of hard coal samples was 8.2412 m2/g. The Langmuir SSA of soft coal was between 12.1175 and 16.2412 m2/g, with a mean of 13.8691 m2/g, and that of hard coal was 10.3258 m2/g. Moreover, the Barrett–Joyner–Halenda (BJH) pore volume of soft coal ranged from 0.006117 to 0.006214 cm3/g (0.006582 cm3/g on average) while that of hard coal was 0.004157 cm3/g. The mean pore size of soft coal ranged from 6.2112 to 8.9146 nm (with a mean of 7.7834 nm) while that of hard coal was 13.5496 nm. It can be seen that the BET SSA, Langmuir SSA, and BJH pore volume of soft coal were all larger than those of hard coal while only the mean pore size of the former was lower than that of the latter. The SSA and pore volume of soft coal were larger than those of hard coal while the mean pore size was lower than that of hard coal. This reflected the fact that soft coal is capable of adsorbing a larger volume of gas and there were more gas adsorption sites on its internal surfaces per unit pore volume in soft coal than in hard coal.
According to the mercury intrusion and low-temperature nitrogen adsorption experiments, it can be seen that the lower the pore size, the larger the surface area. The number of small pores in coal was larger than that of mesopores, which was larger than the number of macropores. Therefore, the surface area of pores depends on micropores. It is supposed that pores were connected and therefore the pores in coal were distributed in a form similar to a tree in which macropores represent the trunk while mesopores and micropores refer to branches. Macropores determine the volume and branches determine the pore area so that the tree-shaped pore distribution is more luxuriant in soft coal masses.

3.1.3. Observing Pore Structure by Using SEM

The SEM image of HY coal samples obtained is shown in Figure 6a. The coal particles of HY coal samples generally appeared as irregular polyhedra, with sharp edges, reflecting the high brittleness of the coal samples. The pores showed tearing and irregular zigzag fractures, with different lengths, and pores were developed, showing different sizes, which not only led to the reduction of coal strength but also resulted in the increase of surface area thereof, reflecting the fact that coal masses showed a certain gas-storing capacity.
As shown in Figure 6b, the surface of SY coal samples showed a low roughness and a favorable evenness: a fracture shown in the image cut lengthways through the surface of the coal mass. Small particles were stacked on the surface of large particles and further pits were found due to the exfoliation of small particles. Moreover, some clay substances were distributed on the surface of coal masses and various inorganic components were mixed in coal mass, causing a certain influence on the strength of the coal mass.
XZ presenting a rough fracture surface contained a great number of developed and staggered fractures (Figure 6c). Coal masses were made of countless approximately spherical fine ellipsoids or granules. Small fractures were developed around the macro-fractures and the two kinds of fractures were jointly developed, appearing as irregular mesh- and branch-shaped fractures. Holes were found on the fracture surface on which a large number of stacked strip-shaped milk-white clay substances were distributed.
DJH, with favorable surface evenness, exhibited a high mass density, on which some mineral components were distributed. Moreover, regularly distributed cracks were found on the surface of the coal samples (Figure 6d).
It can be seen from SEM images of coal masses that the microstructures of coal masses showed the following characteristics: micropores were densely distributed where coal masses were fractured; tectonism strengthened the connectivity of pores on the surface of coal masses and the compression direction of compressed micropores was the same as the exfoliation direction of the coal-rock mass, therefore, observing the occurrence of micropores in a coal-rock mass can also reflect the tectonic deformation of soft coal.

3.2. Fractal Characteristics of Pore Structures

3.2.1. Mercury Intrusion Method

It is supposed that there is a cube of side-length R: the cube is divided into m small isometric cubes. A rule is adopted to remove a part of these small cubes and the number of the remaining small cubes is Nb1. After undergoing k such operations, the side length of the remaining cubes is a k = R / m k and the total number is calculated using Equation (1) [54,55].
N b k = ( R a k ) D b = R D b a k D b = C a k D b = C a k D b
where, Db refers to fractal dimension of pore volume, and D b = log ( N b 1 ) / log ( m ) .
According to the aforementioned formula, the relationship between the pore volume V k of coal and a k can be derived as in Equation (2).
d V k d a k a k 2 D b
When measuring the pores in coal by mercury intrusion method, the applied pressure p(r) and r satisfy the Washburn equation and the total pore volume under a constant pressure is equal to the volume of mercury injected into the pores (Equation (3)).
l o g [ d V p ( r ) / d p ( r ) ] ( 4 D b ) l o g r ( D b 4 ) l o g p ( r )
where, p(r) and r denote the external pressure (MPa) and the diameter (nm) of pores in coal samples, respectively.
After plotting the best-fit line l o g [ d V p ( r ) / d p ( r ) ] and l o g p ( r ) , slope K can be attained and therefore Equation (4) is acquired.
D b = K + 4
According to experimental data obtained by mercury intrusion porosimetry, the fractal dimensions of the four types of coal samples can be obtained (Table 5).
The adsorption of coal for gas is conducted on the surface of pores. The fractal dimension is used for measuring the irregularity and roughness of the surface of pores. The fractal dimension of coal is highly correlated with the complex pore structures and heterogeneous surface area of coal. As shown in Table 5, the fractal dimensions ( D b ) of the four types of experimental coal samples differed little: HY coal samples exhibited the largest D b (2.9321) while D b for the DJH was the lowest, that is, D b of soft coal is larger than that of hard coal. This reflects the fact that the surface of pores in soft coal is more irregular and rough compared with that in hard coal.

3.2.2. Low-Temperature Nitrogen Adsorption

According to the experimental data obtained by low-temperature nitrogen adsorption, the fractal dimension of pores on the surface of coal masses can be calculated. Based on the parameters related to the adsorption capacity, Equation (5) is established.
l n ( Q ) = ( D 3 ) l n ( l n p 0 p ) + C
where, Q and p refer to the adsorption capacity (cm3/g) under equilibrium pressure P and the partial pressure (MPa) of nitrogen, respectively. Moreover, p0, D and C denote the saturated vapor pressure of gas adsorption, fractal dimension, and a constant, respectively.
In terms of SSA of coal masses, Equation (6) gives
l n ( A ) = ( D 2 ) l n ( l n p 0 p ) + C
where, A refers to the SSA (m2/g) of the surface of coal masses.
Data for ln (ln P0/P) are plotted by separately using ln Q and ln A to conduct linear fitting. According to the slope of the fitted line, the fractal dimension D can be obtained (Table 6).
As shown in Table 6, the calculation result obtained using Equation (5) was slightly different from that using Equation (6), which was mainly caused by the presence of micropores. The difference in size of micropores caused the change in adsorption potential of micropores in coal masses for nitrogen. By analyzing the data in Table 6, the fractal dimensions of pore surfaces in soft coal were between 2.26 and 2.34, with a mean some 1.25 times that of hard coal. The larger the fractal dimension, the larger the surface roughness of coal masses. This indicated that there were more pores per unit volume of soft coal and thereby more sites for adsorbing gas per unit pore space.

3.2.3. Images Taken by SEM

By utilizing the box-counting dimension method [56,57,58], the fractal characteristics of the pore structure of soft coal masses were analyzed. When observing the surface characteristics of coal samples by using SEM, the inhomogeneity of energy on the surface of coal samples and structural differences on the pore surface led to a significant difference in intensities of secondary reflection electron beams from the SEM. It is supposed that each disparate point corresponds to a geometrical characteristic of the structure. According to fractal theory, within each length of ε cm, the number Nc(L) of geometrical characteristics within the length of L is expressed by Equation (7)
N c ( L ) a L 2 D
where, a, D, and L denote the proportionality coefficient, fractal dimension, and the area (cm2) of the fractal plot, respectively.
According to the box-counting dimension calculation principle, the relationship between the box dimension and the total surface area can be plotted by using “Tri Prism surface area” algorithm of fractal analysis software Fractal Fox 2.0 [56,57]. By fitting the curve, the fractal dimensions of SSA distribution of pores in different coal samples were attained.
By conducting binarization the image, each pixel point in the image is set to be black (0) or white (1) to acquire a series of two-dimensional matrices consisting of 0 s and 1 s, that is, the data file of a binary image. Block division was carried out on the data file, so that the line number of the blocks was equal to the column number (marked as k). The number of blocks was recorded as Nk (k = 1, 2, 4, …, 2i). By using the size of the pixel point as the side length to conduct block division, the box counts were recorded as N1, N2, N4, …, N2i. The dimension ε of the pixel point was equal to the number of pixel points in a line of the image and each line and column of the blocks both consisted of k pixel points, with the side length of the blocks being ε = k ε . By conducting linear fitting on the datum point ( l n ε k , l n N k ), the negative of the slope of the fitted curve represents the box dimension D.
In a similar way, by using “Box counting dimension” algorithm in the Fractal Fox 2.0 software [57,58], the relationship between box dimension and the box number can be acquired. By fitting the curve, the fractal dimension of the pore distribution in these coal samples could be calculated.
According to fractal theory, a larger fractal dimension value indicates higher roughness of a pore surface, a larger number of pores per unit volume, and more developed pores. By analyzing the data in Table 7, the fractal dimension of the pore distribution in SY coal samples was 1.1696 and that of the SSA of pores in HY coal samples was 2.6783, reflecting the fact that the pores in HY and SY coal masses were well developed. Therefore, these coal samples contained more gas adsorption sites per unit pore space, thus augmenting the adsorption capacity for gas. The resulting SEM image only approximately showed the one-dimensional space. If 3D spatial factors were taken into account, the pore volume would have been larger in such coal masses.

3.3. Prospect of Future Work

The eastern part of Chenghe Mining area is a new mining area. The No.5 coalbed exposed is all soft coal, with a relatively large the gas content in the coalbed. However, the western part is the old mining area, and the No. 5 coal seam is hard coal. Moreover, the No. 5 soft coalbed in the eastern part and the No. 5 hard coalbed in the western part are the same coalbed. Under such a background condition, the pore structure characteristics of No. 5 coal seam in Chenghe Mining area are studied in this paper. Furthermore, based on fractal theory, the pore structure of coal was characterized. However, because there was no gas emission in other mines in the west area, only gas emission occurred locally in Dongjiahe Coal Mine, while a large amount of gas emission occurred in the No. 5 soft coal of the coal mines in the east area. Therefore, in order to contrast with No. 5 soft coal in the east area, only the hard coal was sampled in Dongjiahe Coal Mine, and no other coal mines in the western area were sampled the hard coal. Hence, we should study No. 5 hard coal of other coal mines in the western part in the future research plan. At the same time, other methods can be used to study the pore structure characteristics more comprehensively and systematically.
This provides a theoretical basis for investigating the gas adsorption, desorption, and gas extraction of the No. 5 coalbed in the eastern zone of the new mining area. So, based on the study of pore structure, we will have a further study on the adsorption and desorption rules of both soft and hard coal in Chenghe Mining area in order to study the different adsorption and desorption rules between them. Moreover, the layout of drainage boreholes under different drilling radius, different negative pressure of extraction and different layout modes will be studied on the basis of the study of adsorption and desorption law, which will lay a foundation for the prediction of gas emission and the formulation of coalbed gas prevention and control measures in the working face, so as to achieve the safe co-mining of coal and gas.

4. Conclusions

The structural characteristics of pores and fractures in soft coal masses were explored and compared with those of hard coal from the same mining area. The following conclusions are drawn:
(1) The displacement pressure of soft coal was larger than that of hard coal, implying that the permeability of soft coal masses was lower than that of hard coal, with a poor permeability. However, the mean radii of the pore-throats of soft coal were all lower than those of hard coal. Pores in soft coal mainly appeared as small pores and micropores in which small pores accounted for half of the total pore volume, and mesopores and macropores were also evenly distributed. In hard coal, mesopores were widely distributed, followed by micropores, and small pores and macropores accounted for a minority thereof.
(2) The changing trends seen in mercury-injection and mercury-ejection curves of soft coal were the same, showing a significant hysteresis loop, which implied that pores in soft coal samples mainly appeared as open pores. Moreover, the matrix pores in coal showed significant differences, with non-uniform structures appearing therein. During the formation of soft coal, the tectonic stress strengthened the connectivity of mesopores and macropores, thus improving the capacity of pores for storing gas: however, owing to pores in soft coal mainly appearing as semi-closed pores, it was likely to release much gas once the pressure on the coalbed was relieved. Therefore, when mining a soft coalbed, it is necessary to take suitable gas-control measures. The mercury-injection and mercury-ejection curves of hard coal showed no hysteresis loop while having an even segment, which indicated that closed pores accounted for the majority of the pores in these hard coal samples.
(3) The low-temperature nitrogen adsorption curves of soft coal all followed a IV-type isotherm, which showed adsorption hysteresis loops with different sizes under relative pressures of 0.4 to 1. This indicated that soft coal contained more micropores while the superimposed effect of adsorption force fields in micropores strengthened the adsorption potential of soft coal. The BET SSA, Langmuir SSA, and BJH pore volume of soft coal obtained through use of the nitrogen adsorption method were all larger than those of hard coal while only the mean pore size was lower than that of hard coal. This reflected the fact that the soft coal presented a larger gas adsorption capacity and there were more gas adsorption sites on internal surfaces per unit pore space therein.
(4) The fractal dimensions of soft coal calculated by mercury intrusion porosimetry showed subtle differences to those in hard coal while all were larger than those in the latter. The fractal dimensions of the surface area of pores in soft coal, calculated using a low-temperature nitrogen adsorption method, were all larger than those in hard coal. The fractal dimensions of pore distribution and SSA of soft coal attained through SEM were also all larger than those of hard coal. A large fractal dimension of the pore surface of a coal mass meant that the surface of coal masses was rough. In addition, the pores and fractures per unit pore space were better developed and therefore there was favorable connectivity between pores and fractures, thus providing many adsorption sites for gas to enhance the adsorption capacity.

Author Contributions

Each author has contributed to the present paper. P.W. and R.M. conceived and designed the experiments; P.W., X.L., and S.Z. performed the experiments and analyzed the experimental data. P.W. drafted the manuscript. S.P., Y.L., and X.L. revised the manuscript.

Funding

This work was supported by National Key R & D Program of China (2018YFC0808303), the Basic and Frontier Research Projects of Chongqing (cstc2016jcyjA0117, cstc2018jcyjAX0626) and the Fundamental Research Funds for the Central Universities (2017CDJQJ248825).

Conflicts of Interest

The authors declare no conflict of interest.

References

  1. Asif, M.; Muneer, T. Energy supply, its demand and security issues for developed and emerging economies. Renew. Sustain. Energy Rev. 2007, 11, 1388–1413. [Google Scholar] [CrossRef]
  2. Zhang, Y.; Shao, W.; Zhang, M.; Li, H.J.; Yin, S.J.; Xu, Y.J. Analysis 320 coal mine accidents using structural equation modeling with unsafe conditions of the rules and regulations as exogenous variables. Accid. Anal. Prev. 2016, 92, 189–201. [Google Scholar] [CrossRef] [PubMed]
  3. Geng, F.; Saleh, J.H. Challenging the emerging narrative: Critical examination of coalmining safety in China, and recommendations for tackling mining hazards. Saf. Sci. 2015, 75, 36–48. [Google Scholar] [CrossRef]
  4. Chen, H.; Qi, H.; Long, R.; Zhang, M. Research on 10-year tendency of China coal mine accidents and the characteristics of human factors. Saf. Sci. 2012, 50, 745–750. [Google Scholar] [CrossRef]
  5. Li, X.L.; Li, Z.H.; Wang, E.Y.; Liang, Y.P.; Li, B.L.; Chen, P.; Liu, Y.J. Pattern recognition of mine microseismic (MS) and blasting events based on wave fractal features. Fractals 2018, 26, 1850029. [Google Scholar] [CrossRef]
  6. Wang, L.; Cheng, Y.P.; Liu, H.Y. An analysis of fatal gas accidents in Chinese coal mines. Saf. Sci. 2014, 62, 107–113. [Google Scholar] [CrossRef]
  7. Yin, W.; Fu, G.; Yang, C.; Jiang, Z.G.; Zhu, K.; Gao, Y. Fatal gas explosion accidents on Chinese coal mines and the characteristics of unsafe behaviors: 2000–2014. Saf. Sci. 2017, 92, 173–179. [Google Scholar] [CrossRef]
  8. Nanda, S.; Reddy, S.N.; Mitra, S.K.; Kozinski, J.A. The progressive routes for carbon capture and sequestration. Energy Sci. Eng. 2016, 4, 99–122. [Google Scholar] [CrossRef] [Green Version]
  9. Yu, C.H.; Huang, C.H.; Tan, C.S. A review of CO2 capture by absorption and adsorption. Aerosol Air Qual. Res. 2012, 12, 745–769. [Google Scholar] [CrossRef]
  10. Jokar, S.M.; Rahimpour, M.R.; Shariati, A.; Iulianelli, A.; Bagnato, G.; Vita, A. Pure hydrogen production in membrane reactor with mixed reforming reaction by utilizing waste gas: A case study. Processes 2016, 4, 33. [Google Scholar] [CrossRef]
  11. Cheng, Y.P.; Wang, L.; Zhang, X.L. Environmental impact of coal mine methane emissions and responding strategies in China. Int. J. Greenh. Gas Control 2011, 5, 157–166. [Google Scholar] [CrossRef]
  12. Hu, Q.T.; Liang, Y.P.; Wang, H.; Zou, Q.L.; Sun, H.T. Intelligent and integrated techniques for coalbed methane (CBM) recovery and reduction of greenhouse gas emission. Environ. Sci. Pollut. Res. 2017, 24, 17651–17668. [Google Scholar]
  13. Karacan, C.Ö.; Ruiz, F.A.; Cotè, M.; Phippsc, S. Coal mine methane: A review of capture and utilization practices with benefits to mining safety and to greenhouse gas reduction. Int. J. Coal Geol. 2011, 86, 121–156. [Google Scholar] [CrossRef]
  14. Ju, Y.; Sun, Y.; Sa, Z.; Pan, J.N.; Wang, J.L.; Hou, Q.L.; Li, Q.G.; Yan, Z.F.; Liu, J. A new approach to estimate fugitive methane emissions from coal mining in China. Sci. Total. Environ. 2016, 543, 514–523. [Google Scholar] [CrossRef] [PubMed]
  15. Zhou, F.; Xia, T.; Wang, X.; Zhang, Y.F.; Sun, Y.N.; Liu, J.S. Recent developments in coal mine methane extraction and utilization in China: A review. J. Nat. Gas Sci. Eng. 2016, 31, 437–458. [Google Scholar] [CrossRef]
  16. Zhao, J.L.; Xu, H.; Tang, D.; Mathews, J.P.; Li, S.; Tao, S. A comparative evaluation of coal specific surface area by CO2 and N2 adsorption and its influence on CH4 adsorption capacity at different pore sizes. Fuel 2016, 183, 420–431. [Google Scholar] [CrossRef]
  17. Zhao, J.L.; Xu, H.; Tang, D.Z.; Mathews, J.P.; Li, S.; Tao, S. Coalbed porosity and fracture heterogeneity of macrolithotypes in the Hancheng Block, eastern margin, Ordos Basin, China. Int. J. Coal Geol. 2016, 159, 18–29. [Google Scholar] [CrossRef]
  18. Liu, T.; Lin, B.; Zou, Q.; Zhu, C.j. Microscopic mechanism for enhanced coal bed methane recovery and outburst elimination by hydraulic slotting: A case study in Yangliu mine, China. Greenh. Gases Sci. Technol. 2016, 6, 597–614. [Google Scholar] [CrossRef]
  19. Liu, T.; Lin, B.; Yang, W. Impact of matrix–fracture interactions on coal permeability: Model development and analysis. Fuel 2017, 207, 522–532. [Google Scholar] [CrossRef]
  20. Li, Q.G.; Lin, B.Q.; Zhai, C. The effect of pulse frequency on the fracture extension during hydraulic fracturing. J. Nat. Gas Sci. Eng. 2014, 21, 296–303. [Google Scholar] [CrossRef]
  21. Li, Q.G.; Lin, B.Q.; Zhai, C. A new technique for preventing and controlling coal and gas outburst hazard with pulse hydraulic fracturing: A case study in Yuwu coal mine, China. Nat. Hazards 2015, 75, 2931–2946. [Google Scholar] [CrossRef]
  22. Zou, Q.L.; Lin, B.Q.; Liu, T.; Zhou, Y.; Zhang, Z.; Yan, F.Z. Variation of methane adsorption property of coal after the treatment of hydraulic slotting and methane pre-drainage: A case study. J. Nat. Gas Sci. Eng. 2014, 20, 396–406. [Google Scholar] [CrossRef]
  23. Zou, Q.; Lin, B.; Zheng, C.; Zheng, C.S.; Hao, Z.Y.; Zhai, C.; Liu, T.; Liang, J.Y.; Yan, F.Z.; Yang, W.; et al. Novel integrated techniques of drilling–slotting–separation-sealing for enhanced coal bed methane recovery in underground coal mines. J. Nat. Gas Sci. Eng. 2015, 26, 960–973. [Google Scholar] [CrossRef] [Green Version]
  24. Radlinski, A.P.; Mastalerz, M.; Hinde, A.L.; Hainbuchner, M.; Rauch, H.; Baron, M.; Lin, J.S.; Fan, l.; Thiyagarajan, P. Application of SAXS and SANS in evaluation of porosity, pore size distribution and surface area of coal. Int. J. Coal Geol. 2004, 59, 245–271. [Google Scholar] [CrossRef]
  25. Gryglewicz, G.; Machnikowski, J.; Lorenc-Grabowska, E.; Lota, G.; Frackowiak, E. Effect of pore size distribution of coal-based activated carbons on double layer capacitance. Electrochim. Acta 2005, 50, 1197–1206. [Google Scholar] [CrossRef]
  26. Ross, D.J.K.; Bustin, R.M. The importance of shale composition and pore structure upon gas storage potential of shale gas reservoirs. Mar. Pet. Geol. 2009, 26, 916–927. [Google Scholar] [CrossRef]
  27. Gan, H.; Nandi, S.P.; Walker, P.L. Nature of the porosity in American coals. Fuel 1972, 51, 272–277. [Google Scholar] [CrossRef]
  28. Cai, Y.D.; Liu, D.M.; Pan, Z.J.; Pan, Z.J.; Yao, Y.B.; Li, J.Q.; Qiu, Y.K. Pore structure and its impact on CH4 adsorption capacity and flow capability of bituminous and subbituminous coals from Northeast China. Fuel 2013, 103, 258–268. [Google Scholar] [CrossRef]
  29. Clarkson, C.R.; Solano, N.; Bustin, R.M.; Bustin, A.M.M.; Chalmers, G.R.L.; He, L.; Melnichenko, B.; Radliński, A.P.; Blach, T.P. Pore structure characterization of North American shale gas reservoirs using USANS/SANS, gas adsorption, and mercury intrusion. Fuel 2013, 103, 606–616. [Google Scholar] [CrossRef]
  30. Yao, Y.B.; Liu, D.M.; Tang, D.Z.; Tang, S.H.; Huang, W.H. Fractal characterization of adsorption-pores of coals from North China: An investigation on CH4 adsorption capacity of coals. Int. J. Coal Geol. 2008, 73, 27–42. [Google Scholar] [CrossRef]
  31. Fu, H.J.; Tang, D.Z.; Xu, H.; Xu, T.; Chen, B.L.; Hu, P.; Yin, Z.Y.; Wu, P.; He, G.J. Geological characteristics and CBM Exploration potential evaluation: A case study in the middle of the southern Junggar Basin, NW China. J. Nat. Gas Sci. Eng. 2016, 30, 557–570. [Google Scholar] [CrossRef]
  32. Hou, S.H.; Wang, X.M.; Wang, X.J.; Yuan, Y.D.; Pan, S.D.; Wang, X.M. Pore structure characterization of low volatile bituminous coals with different particle size and tectonic deformation using low pressure gas adsorption. Int. J. Coal Geol. 2017, 183, 1–13. [Google Scholar] [CrossRef]
  33. Kenvin, J.; Jagiello, J.; Mitchell, S.; Pérez-Ramírez, J. Unified method for the total pore volume and pore size distribution of hierarchical zeolites from argon adsorption and mercury intrusion. Langmuir 2015, 31, 1242–1247. [Google Scholar] [CrossRef]
  34. Melnichenko, Y.B.; Radlinski, A.P.; Mastalerz, M.; Cheng, G.; Rupp, J. Characterization of the CO2 fluid adsorption in coal as a function of pressure using neutron scattering techniques (SANS and USANS). Int. J. Coal Geol. 2009, 77, 69–79. [Google Scholar] [CrossRef]
  35. Okolo, G.N.; Everson, R.C.; Neomagus, H.W.J.P.; Roberts, M.J.; Sakurovs, R. Comparing the porosity and surface areas of coal as measured by gas adsorption, mercury intrusion and SAXS techniques. Fuel 2015, 141, 293–304. [Google Scholar] [CrossRef]
  36. Zhao, Y.X.; Sun, Y.F.; Liu, S.M.; Wang, K.; Jiang, Y.D. Pore structure characterization of coal by NMR cryoporometry. Fuel 2017, 190, 359–369. [Google Scholar] [CrossRef]
  37. Karpyn, Z.T.; Alajmi, A.; Radaelli, F.; Halleck, P.M.; Grader, A.S. X-ray CT and hydraulic evidence for a relationship between fracture conductivity and adjacent matrix porosity. Eng. Geol. 2009, 103, 139–145. [Google Scholar] [CrossRef]
  38. Watanabe, N.; Ishibashi, T.; Hirano, N.; Ohsaki, Y.; Tsuchiya, Y.; Tamagawa, T.; Okabe, H.; Tsuchiya, N. Precise 3D numerical modeling of fracture flow coupled with X-ray computed tomography for reservoir core samples. SPE J. 2011, 16, 683–691. [Google Scholar] [CrossRef]
  39. Golab, A.; Ward, C.R.; Permana, A.; Lennox, P.; Botha, P. High-resolution three-dimensional imaging of coal using microfocus X-ray computed tomography, with special reference to modes of mineral occurrence. Int. J. Coal Geol. 2013, 113, 97–108. [Google Scholar] [CrossRef]
  40. Jing, Y.J.; Armstrong, R.T.; Ramandi, H.L.; Mostaghimi, P. Coal cleat reconstruction using micro-computed tomography imaging. Fuel 2016, 181, 286–299. [Google Scholar] [CrossRef]
  41. Jing, Y.; Armstrong, R.T.; Mostaghimi, P. Digital coal: Generation of fractured cores with microscale features. Fuel 2017, 207, 93–101. [Google Scholar] [CrossRef]
  42. Liu, S.; Sang, S.; Wang, G.; Ma, J.S.; Wang, X.; Wang, W.F.; Du, Y.; Wang, T. FIB-SEM and X-ray CT characterization of interconnected pores in high-rank coal formed from regional metamorphism. J. Pet. Sci. Eng. 2017, 148, 21–31. [Google Scholar] [CrossRef] [Green Version]
  43. Zhou, S.D.; Liu, D.M.; Cai, Y.D.; Yao, Y.B.; Li, B. 3D characterization and quantitative evaluation of pore-fracture networks of two Chinese coals using FIB-SEM tomography. Int. J. Coal Geol. 2017, 174, 41–54. [Google Scholar] [CrossRef]
  44. Li, Z.T.; Liu, D.M.; Cai, Y.D.; Shi, Y.L. Investigation of methane diffusion in low-rank coals by a multiporous diffusion model. J. Nat. Gas Sci. Eng. 2016, 33, 97–107. [Google Scholar] [CrossRef]
  45. Li, Z.T.; Liu, D.M.; Cai, Y.D.; Ranjith, P.G.; Yao, Y.B. Multi-scale quantitative characterization of 3-D pore-fracture networks in bituminous and anthracite coals using FIB-SEM tomography and X-ray μ-CT. Fuel 2017, 209, 43–53. [Google Scholar] [CrossRef]
  46. Louw, E.B.; Mitchell, G.D.; Wang, J.; Winans, R.E.; Mathews, J.P. Constitution of drop-tube-generated coal chars from vitrinite-and inertinite-rich South African coals. Energy Fuels 2015, 30, 112–120. [Google Scholar] [CrossRef]
  47. Zhou, H.; Wilkes, G.L. Comparison of lamellar thickness and its distribution determined from d.s.c. SAXS, TEM and AFM for high-density polyethylene films having a stacked lamellar morphology. Polymer 1997, 38, 5735–5747. [Google Scholar] [CrossRef]
  48. Agbabiaka, A.; Wiltfong, M.; Park, C. Small angle X-ray scattering technique for the particle size distribution of nonporous nanoparticles. J. Nanoparticles 2013, 2013, 11. [Google Scholar] [CrossRef]
  49. Lee, S.; Fischer, T.B.; Stokes, M.R.; Klingler, R.J.; Ilavsky, J.; McCarty, D.K.; Wigand, M.; Derkowski, A.; Winans, R.E. Dehydration effect on the pore size, porosity, and fractal parameters of shale rocks: Ultrasmall-angle X-ray scattering study. Energy Fuels 2014, 28, 6772–6779. [Google Scholar] [CrossRef]
  50. Thomson, W. 4. On the equilibrium of vapour at a curved surface of liquid. Proc. R. Soc. Edinb. 1872, 7, 63–68. [Google Scholar] [CrossRef]
  51. Chen, P.; Tang, X.Y. The research on the adsorption of nitrogen in low temperature and micro-pore properties in coal. J. China Coal Soc. 2001, 26, 552–556. [Google Scholar]
  52. Yan, J.M.; Zhang, P.Y.; Gao, J.C. Adsorption and Cohesion; Science Press: Beijing, China, 1986; pp. 113–137. [Google Scholar]
  53. De Boer, J.H. The Structure and Properties of Porous Materials; Butterworths: London, UK, 1958; Volume 389, pp. 68–94. [Google Scholar]
  54. Li, Y.H.; Gao, Q.L.; Rudolph, V. Compressibility and fractal dimension of fine coal particles in relation to pore structure characterisation using mercury porosimetry. Part. Part. Syst. Charact. 1999, 16, 25–31. [Google Scholar] [CrossRef]
  55. Zhu, J.F.; Liu, J.Z.; Yang, Y.M.; Cheng, J.; Zhou, J.H.; Cen, K.F. Fractal characteristics of pore structures in 13 coal specimens: Relationship among fractal dimension, pore structure parameter, and slurry ability of coal. Fuel Process. Technol. 2016, 149, 256–267. [Google Scholar] [CrossRef]
  56. Ai, T.; Zhang, R.; Zhou, H.W.; Pei, J.L. Box-counting methods to directly estimate the fractal dimension of a rock surface. Appl. Surf. Sci. 2014, 314, 610–621. [Google Scholar] [CrossRef]
  57. Li, J.; Du, Q.; Sun, C. An improved box-counting method for image fractal dimension estimation. Pattern Recognit. 2009, 42, 2460–2469. [Google Scholar] [CrossRef]
  58. Sarkar, N.; Chaudhuri, B.B. An efficient differential box-counting approach to compute fractal dimension of image. IEEE Trans. Syst. Man Cybern. 1994, 24, 115–120. [Google Scholar] [CrossRef]
Figure 1. MK-AutoPore IV9510 mercury injection apparatus.
Processes 07 00013 g001
Figure 2. ASAP 2020M automatic analyzer for SSA (specific surface area) and micropores.
Processes 07 00013 g002
Figure 3. The ΣIGMA SEM.
Processes 07 00013 g003
Figure 4. Mercury intrusion curve. (a) HY (Heyang); (b) SY (Shanyang); (c) XZ (Xizhuo); (d) DJH (Dongjiahe).
Processes 07 00013 g004
Figure 5. Low-temperature nitrogen adsorption and desorption isotherms. (a) HY; (b) SY; (c) XZ; (d) DJH.
Processes 07 00013 g005
Figure 6. SEM images of the coal samples. (a) HY; (b) SY; (c) XZ; (d) DJH.
Processes 07 00013 g006aProcesses 07 00013 g006b
Table 1. Coal sample basic parameters.
SampleProtodyakonov CoefficientInitial Speed of Methane Diffusion (mL/s)Porosity (%)Adsorption ConstantIndustrial Analysis
a (cm3/g)b (Mpa−1)Aad (%)Mad (%)Vdaf (%)
HY0.9322.2711.1922.661.3433.280.5418.35
SY0.8720.1511.6317.371.5134.580.6623.17
XZ0.7326.8710.8618.761.2730.981.7121.10
DJH2.215.058.9114.121.3111.250.5715.85
Note: HY, SY, XZ, and DJH refer to the coal samples taken from Heyang, Shanyang, Xizhuo, and Dongjiahe Coal Mines, respectively. Soft coal includes HY, SY, and XZ while DJH represents a hard coal sample.
Table 2. Coal components.
SampleVitrinite Reflectance (%)MaceralsMineral Content (%)
Vitrinite Content (%)Inertinite Content (%)Chitinous Content (%)
HY1.5769.230.000.8
SY1.7673.818.707.5
XZ1.8665.133.60.11.2
DJH1.7840.446.6012.8
Table 3. Results of mercury intrusion experiments.
SampleDisplacement Pressures
(MPa)
Mean Radius of Throat
(nm)
Mercury Saturation
(%)
Mercury Ejection Ratio
(%)
Proportions of Pore Volume (%)
MacroporeMesoporeSmall PoreMicropore
HY0.04215.5184.5265.374.5310.7744.9839.72
SY0.06176.7370.4848.766.1626.4845.4421.92
XZ0.05213.3079.9959.227.8913.0343.5935.49
DJH0.03341.2992.9797.731.8541.7422.5533.86
Table 4. Characteristics of pore distribution in coal masses. SSA: specific surface area; BJH: Barrett–Joyner–Halenda.
SampleBET SSA
(m2/g)
Langmuir SSA
(m2/g)
BJH Pore Volume
(m2/g)
Mean Pore Size
(nm)
HY10.431713.24850.0062148.2244
SY10.422812.11750.0061178.9146
XZ14.324516.24120.0074156.2112
DJH8.241210.32580.00415713.5496
Table 5. Calculated fractal dimensions of pores.
SamplePore Diameter Range (nm)KDb
HY74.16~100,0001.06792.9321
SY89.21~100,0001.10832.8917
XZ77.69~100,0001.08262.9174
DJH93.45~100,0001.12982.7303
Table 6. Calculated fractal dimensions of pore surfaces.
Samplep/p0 RangeFractal Dimensions of Pore Surfaces Calculated by Equation (5)Fractal Dimensions of Pore Surfaces Calculated by Equation (6)
HY0.15~0.962.342.23
SY0.44~0.992.262.18
XZ0.41~0.992.312.12
DJH0.44~0.991.841.81
Table 7. Calculated fractal dimensions of pores.
SampleAmplificationFractal Dimension of Pore DistributionCorrelation CoefficientFractal Dimension of Pore SSACorrelation Coefficient
HY4.00KX1.07430.95582.67830.9673
SY4.00KX1.16960.95452.64210.9649
XZ6.00KX1.12480.95122.26460.9704
DJH6.00KX1.00540.95782.16420.9621

