Article

A Model-Based Investigation of Cytokine Dynamics in Immunotherapies

1
Department of Chemical Engineering, Villanova University, Villanova, PA 19085, USA
2
Friends Select School, Philadelphia, PA 19103, USA
*
Author to whom correspondence should be addressed.
Processes 2019, 7(1), 12; https://doi.org/10.3390/pr7010012
Submission received: 5 November 2018 / Revised: 21 December 2018 / Accepted: 26 December 2018 / Published: 30 December 2018
(This article belongs to the Section Pharmaceutical Processes)

Abstract

:
With the advent of effective immunotherapies to battle cancers and diseases, an obstacle in recovery has become the potential side effects, specifically cytokine release syndrome (CRS). As there is little quantitative understanding of risks for developing CRS and the degree of its severity, this work explored a model-based approach to produce a library of in silico patients through sensitivity analysis of cytokine interaction parameters and a Monte Carlo sampling. The objective of producing the in silico patients was to correlate a known grading system of cytokine release syndrome severity and thus design a new formula for grading CRS. Using our CRS grading system as the foundation, this work produced not only a formula which related the in silico patient data to the different grades, but we effectively demonstrated a selective approach to reduce the grade of CRS with sequential cytokine inhibition targets. We achieved the reduction of grades by applying the insight from the sensitivity analysis, beginning with the most sensitive targets. Cytokines IL-1, IL-8, TNF-α, INF-γ, IL-6, IL-2, IL-4, IL-10, and IL-12 were in turn the best targets for inhibition to alleviate CRS. Using this approach, patient cytokine time profiles in real-time can be related to the CRS grading system and if the grade is severe enough, action can be taken earlier during the treatment to prevent potentially life-threatening symptoms. What’s more, the identified inhibition sequence of the 9 cytokines provides guidance for clinical intervention of CRS.

1. Introduction

The objective of immunotherapy is primarily harnessing a patient’s own immune system to fight the proliferation of cancer and disease [1]. The most successful immunotherapies have treated pediatric CD19-based B-cell acute lymphoblastic leukemia (ALL) and other blood-based cancers [2]. Unfortunately there are frequent deleterious side-effect of immunotherapies. For example CAR-T cell [3] and monoclonal antibody therapies [4] can induce what is known as cytokine release syndrome (CRS) [5]. CRS is a term used to describe patients whose cytokine levels have acutely risen in an unregulated manner in response to immunotherapies like genetically re-engineered T-cells, T-cell receptor (TCR) molecules and monoclonal antibodies designed for unilateral T-cell expansion cascades. IL-6 is one example cytokine that is notorious for being present in high, sustained concentrations during a cytokine storm [6].
In CRS, cytokine levels show a marked imbalance as inflammatory and anti-inflammatory cytokines compete with one another. This can cause various symptoms that range from some which are flu-like, to more serious conditions leading to organ failure and death; an example of which was marked in a Phase I clinical trial of TGN1412 [7]. TGN1412 is a CD28 monoclonal antibody super-agonist, originally designed and tested in other animal models successfully. TGN1412 was initially designed to initiate T-cell expansion without the need for a co-stimulatory domain. Shortly after administration of TGN1412 in the 6 healthy male subjects, life-threatening symptoms began to take shape in organ failure and a cytokine storm. Without the intervention of doctors using corticosteroids and a cytokine inhibitor, none of the patients would likely be alive today. The TGN1412 trial highlights the complexity and uncertainty of the reactions the human body can have as compared to successfully validated animal models.
While large uncertainties of cytokine concentrations exist in CRS, no quantitative formula has been designed to evaluate the grade (i.e., severity) of CRS from the profiles of related cytokines. The grade of CRS is qualitatively determined from certain important cytokines involved in CRS in present existing approaches. For example, Hay et al. [8] provided ranking and grading of cytokine levels concerning the evolution of CRS during immunotherapy treatment. Teachey et al. [9] showed lower quantitative assertion of CRS likelihood based on three cytokines, which is most accurately predicted in the pediatric cases rather than in the adult cases. Lee et al., 2014 [2] was one of the first to introduce a delineated grading system ranging from Grade 0 to Grade 5 of CRS. Lee also describes relevant treatment schedules for different types of CRS, where Grade 3 and above warrants commercially available cytokine inhibitors like Tocilizumab and corticosteroids [2]. Even if we observe Lee’s grading system for the given set of patients in the study, there is no existing way to truly quantify a patient’s cytokine release trajectory prior to or during an episode of CRS, nor is there an quantitative method to relate other patient data to this grading scheme.
Since multiple highly-interacting cytokines are involved in CRS, a good mathematical model is helpful to study the interaction of cytokines and guide the inhibition of single or multiple cytokines. However, little modelling work has been done for CRS. As an example, Marianne Waito explored the dynamics of 13 cytokines using non-linear models in a murine population, not for human cells [10]. Only one human multi-cytokine profile has been modelled as a function of time using a system of linear differential equations. This model was developed by Stengel’s group on the basis of the data from the aforementioned TGN1412 Phase I clinical trial [11]. This model mainly studied the profiles of 9 cytokines in one simulation (i.e., one in silico patient), we further studied the variation of cytokine peak values in a large group of in silico patients. In particular, we further implemented sensitivity analysis to identify the most important interactions among the cytokines involved in CRS. Monte Carlo sampling was then applied to the parameters identified as most sensitive to capture the uncertainties of cytokine concentrations shown in CRS. The in silico patients were generated from the model with different values in the most sensitive parameters. The large uncertainty identified in the result further motivated us to define a new mathematical function to grade a patient’s degree of CRS by relating similar functions of cytokine concentrations over time to a common grading system. Finally, using the new CRS grading formula, we explored the impact of individual, successive cytokine inhibitions on the grade of quantified CRS to provide a hierarchy of inhibition targets during medical intervention.

2. Materials and Method

2.1. Clinical Data and a Mathematical Model of CRS

The model was developed from the Phase 1 clinical trial data that was obtained for 6 patients treated by the monoclonal antibody TGN1412 (a CD-28 superagonist monoclonal antibody) in 2006 [7]. An average of 0.1 mg mAb/kg body weight was administered over the course of 4 min to the six male patients, who nearly immediately began experiencing adverse reactions. The time profiles of nine cytokines (i.e., TNF-α, IL-1, IFN-γ, IL-2, IL-6, IL-4, IL-8, IL-12 and IL-10), were recorded [7]. Yiu et al. [11] developed the first and only mathematical model to predict the dynamics of the aforementioned cytokines simultaneously. It can show individual cytokine profiles as well as the interaction between the cytokines. The model was validated by the TGN1412, although it was not able to predict the variability of cytokines for different patients. The model was used by Stengel’s group to map the interactions of each cytokine with the others, demonstrating the inhibitive and inductive effects that cytokines can have on one another. The model has 18 ODEs (ordinary differential equation) and 90 parameters. The 18 ODEs relate to the concentration of the cytokines in pg/L and the acceleration (rate) of cytokine concentration growth and decay. In Yiu’s model [11], each cytokine has been modelled using a linear ordinary differential equation (ODE), where the respective cytokine concentration over time (i.e., x2i−1) takes the form of Equation (1). Equation (2) represents a vector of the 9 cytokine change rates (i.e., x2i). Constants a2i,2j−1 and a2i,2i are the model parameters.
d x 2 i 1 d t = x 2 i
d x 2 i d t = j = 1 9 a 2 i , 2 j 1 x 2 j 1 + a 2 i , 2 i x 2 i
The model shown in Equations (1) and (2) can elucidate the inhibitive effect between cytokines (e.g., the effect from IFN-γ on IL-6) by using negative coefficients. Likewise, the inductive effect of cytokines (e.g., the effect from IL-1, IL-2 and IL-4 on IL-6) is also represented by the model by applying positive coefficients between them. Figure 1 shows the cytokine interaction network constructed from coefficients. Using IFN-γ and IL-6 as an example, Figure 1 shows that INF-γ has inhibitive effect on IL-6, but IL-6 has inductive effect on INF-γ. It can be seen from Figure 1 that many cytokines in the system of equations developed by Stengel’s group have both inductive and inhibitive effects on one another and is an important point to raise due to the biological impacts of inhibiting and inducing different cytokines, especially during a cytokine storm.

2.2. Investigate the Uncertainty of CRS Using Sensitivity Analysis, Monte Carlo Sampling, and Principal Component Analysis

In order to perturb the coupled cytokine model developed by Yiu et al. [11] to study the uncertainty in the dynamics of cytokines, a local sensitivity analysis was used to determine the most sensitive parameters out of 90 model parameters. We selected the 10 most important parameters in this work to keep a reasonable balance between complexity and real-world application. A Monte Carlo sampling was then applied to randomly vary those selected parameters to quantify the uncertainties shown in cytokine profiles. The approach of randomizing parameters is what is used to create the in silico patients. The Monte Carlo sampling result was then visualized onto a two-dimensional space using principal component analysis so that the similarity of 9 cytokines’ uncertainties were identified.
Sensitivity analysis is a common approach to evaluate the impact of a parameter on the outputs [12,13,14], which are the peak values of the 9 cytokine concentrations (recorded in the vector Y in Equation (3)). The vector Y0 represents the original peak values of the cytokines from the ODE model fitting the TGN1412 trial data. In this work, sensitivity analysis was conducted to modulate every parameter within 50% and 150% of the nominal parameter value (i.e., pi,0), according to Equation (3). The lower the sensitivity value si,j indicates the less sensitive the parameter. Parameters were then ranked based on their sensitivity values.
s i , j = Y Y 0 / Y 0 | p i p i , 0 | / | p i , 0 |
Monte Carlo sampling is one of the most popular approaches to simulate models for studying output uncertainties [15,16]. On the basis of the sensitivity analysis, a Monte Carlo sampling was used to obtain the cytokine profiles of in silico patients by randomly varying the ten most sensitive coupling parameters. Parameters were sampled from a uniform distribution in the range of ±10%, ±25%, and ±50% of their nominal values that were determined from Grade-5 CRS patient data. In the Monte Carlo sampling, we varied the top 10 most sensitive parameters while maintaining the least sensitive 80 parameters as constant. The most sensitive 10 parameters were randomly modulated to generate 5000 in silico patients, and captured peak cytokine values for these patients.
The Monte Carlo sampling returns the profiles of 9 cytokines for 5000 in silico patients. Principal component analysis is further implemented to visualize the similarity of the uncertainties shown in the 9 cytokines. This may indicate the cytokine candidates for inhibition to suppress CRS. Principal component analysis is a popular multivariate statistical analysis approach that can project high-dimensional data into the two orthogonal dimensions that retain the largest variance in the data [17,18]. In this work, the 9 cytokines are projected onto the two dimensional space characterized by Principal Component 1 and 2 (i.e., PC1 and PC2). The distance between the projected locations of cytokines on the PC1-PC2 space indicates the similarity of the uncertainties shown in the profiles of cytokines.

2.3. The Approach to Quantify the CRS Grade

No approach has been taken to mathematically quantify the grading of CRS on the basis of cytokine concentrations. In this work, we address this issue by grading CRS on the basis of the magnitudes of cytokines TNF-α, IFN-γ, IL-1, IL-2, IL-4, IL-6, IL-8, IL-10 and IL-12. Some of these cytokines had been used in Hay’s CRS grading system where Grade 0, Grades 1–3 and Grade 4–5 were isolated for each of 8 different cytokines including IFN-γ, IL-6, IL-8, IL-10, IL-15, MCP-1, TNF-α and MIP-1β [8]. IL-15, MCP-1 and MIP-1β were not selected in this work as they were not included in the CRS model. The ranges for the grading of each cytokine were different, which enabled the viewer to understand specificity of each signalling molecule. However, Hay et al. [8] did not offer a formula that can quantify the grading of CRS from the concentrations of those cytokines. We thus defined CRS grade similarity in Equation (4) and used cytokine values tabulated from Hay et al. [8] to validate our CRS grade formula.
G r a d e S i m i l a r i t y = ( V r T × V n ) / ( V r · V n ) ( V r / V n + V n / V r ) / 2
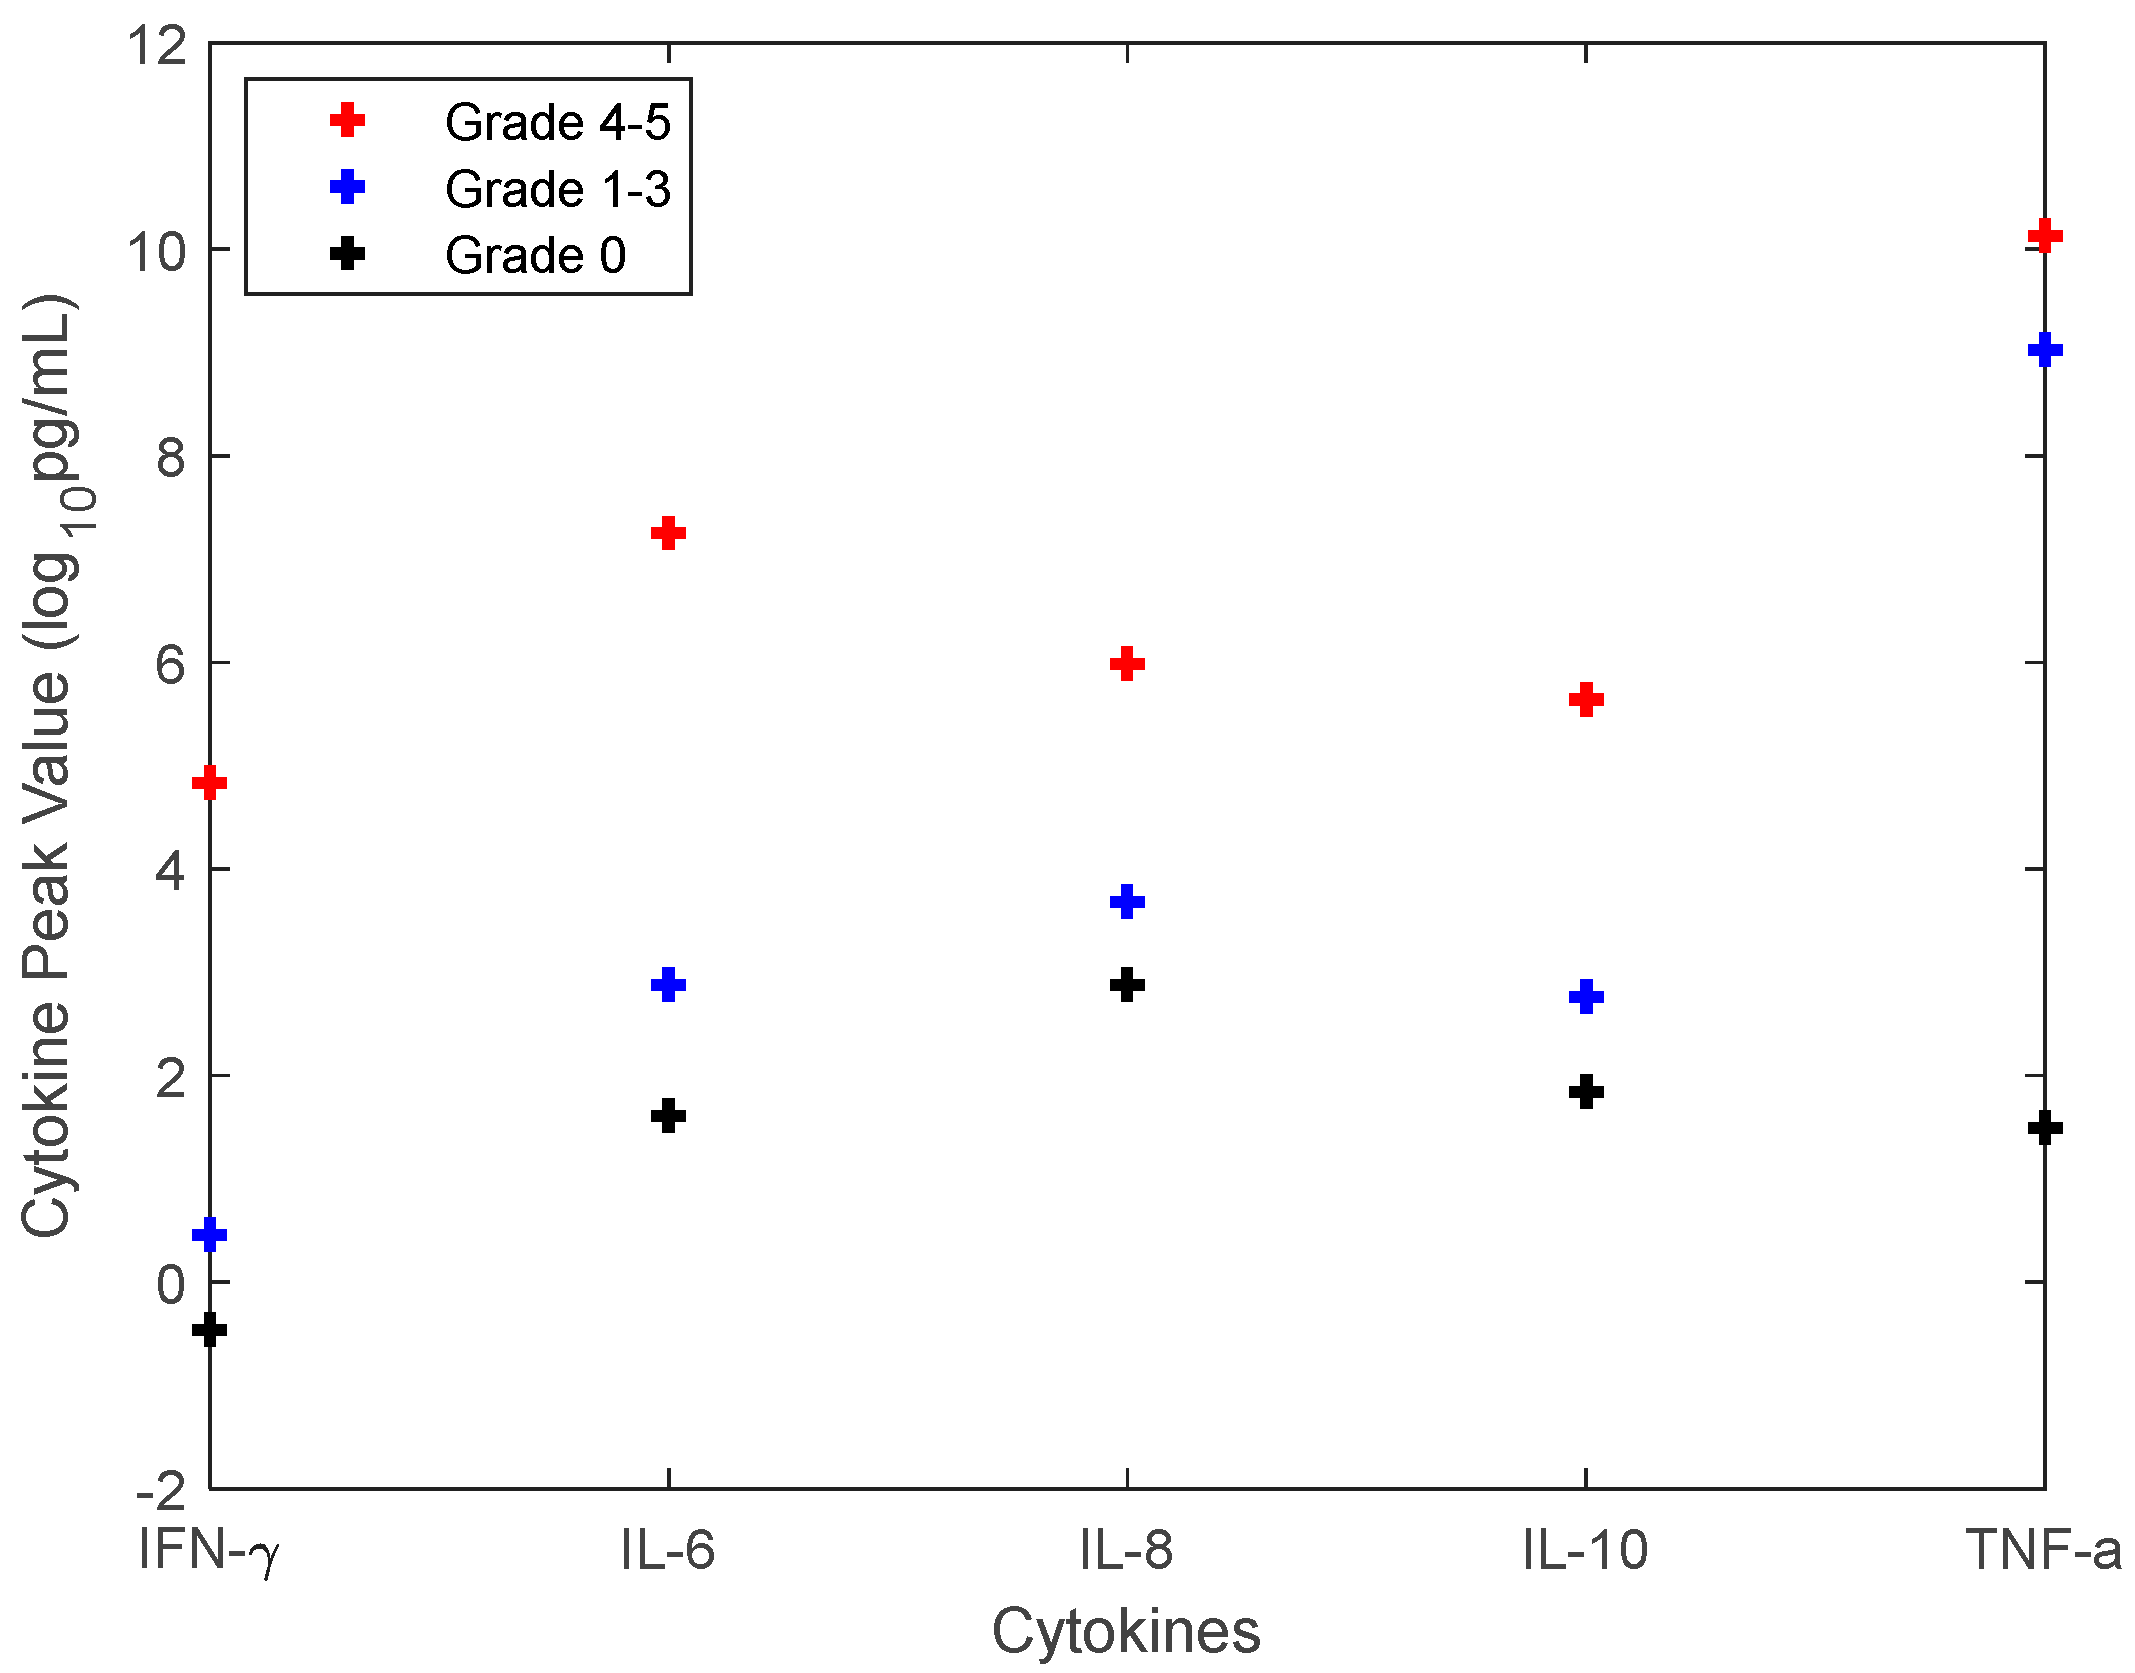
where the numerator term describes the similarity in the shapes of Vectors Vr and Vn, which always have the same number of elements. The Euclidean norm is used here to take the product or quotient of the reference vector or the new vector. Vr is the reference vector consisted of peak concentrations of the 9 cytokines (i.e., [CTNF−α, CIFN−γ, CIL−1, CIL−6, CIL−8, CIL−2, CIL−4, CIL−10, CIL−12]) for Grade-5 CRS (the most severe CRS), while Vn is the new vector of peak concentrations of the aforementioned 9 cytokines that is needed for grading. Since Vr and Vn record the peak values of the 9 cytokines, their Euclidean norms should be above zero. If the peak-value profiles of two cytokines have similar shapes, the numerator has a value close to one. In other words, the dot product of the two vectors (i.e., V r T × V n ) should be similar to the product of the Euclidean norms of Vr and Vn. When Vr equals to Vn, the numerator becomes one. The denominator of Equation (4) describes the similarity of the magnitudes of Vr and Vn. If the peak values of cytokines in Vr and Vn are similar, the denominator term is equal to one. If the peak values in the two vectors are quite different, one of the term in the denominator is quite large. This results in a denominator larger than one. The closer that Gradesimilarity is to one indicates the more severe CRS is, as the profile is more similar to the one for Grade-5 CRS. For example, if Vn is very similar to Vr (i.e., Grade-5 CRS), the patient with the clinical data of Vn has a Grade-5 CRS. The similarity defined by Equation (4) can thus be used to determine the CRS grade of a patient with cytokine peak values recorded in Vn. For example, the cytokine profiles for different CRS gradings from the TGN1412 trial [8] were summarized in Figure 2. Since only 5 cytokines are involved in Figure, Vr and Vn are of the form of [CIFN−γ, CIL−6, CIL−8, CIL−10, CTNF−α]. The similarity of the average cytokine profiles for Grade 4–5 (i.e., Vr) and Grade 1–3 (i.e., Vn) is 0.560, while the similarity for Grade 4–5 (i.e., Vr) and Grade 0 (i.e., Vn) is 0.001. It can be seen from Figure 2 that the cytokine profile for Grade 1–3 is of more similar shape and magnitude to the one for Grade 4–5 than the one for Grade 0. In this work, the simulated result that matches the experimental data for Grading 4–5 shown in Figure 2 was used as the reference profile Vr. While TGN1412 trial only contains the data for 5 of the 9 selected cytokines, simulated data from the model was used to determine the peak values of the other 4 cytokines in Vr. A profile Vn with a larger similarity to Vr indicates the patient is of higher CRS grade. On the basis of this, we applied Equation (4) as a quantitative criterion to determine the CRS grade of single or multiple cytokine inhibitions that can reduce CRS.

2.4. Investigation of Cytokine Inhibition
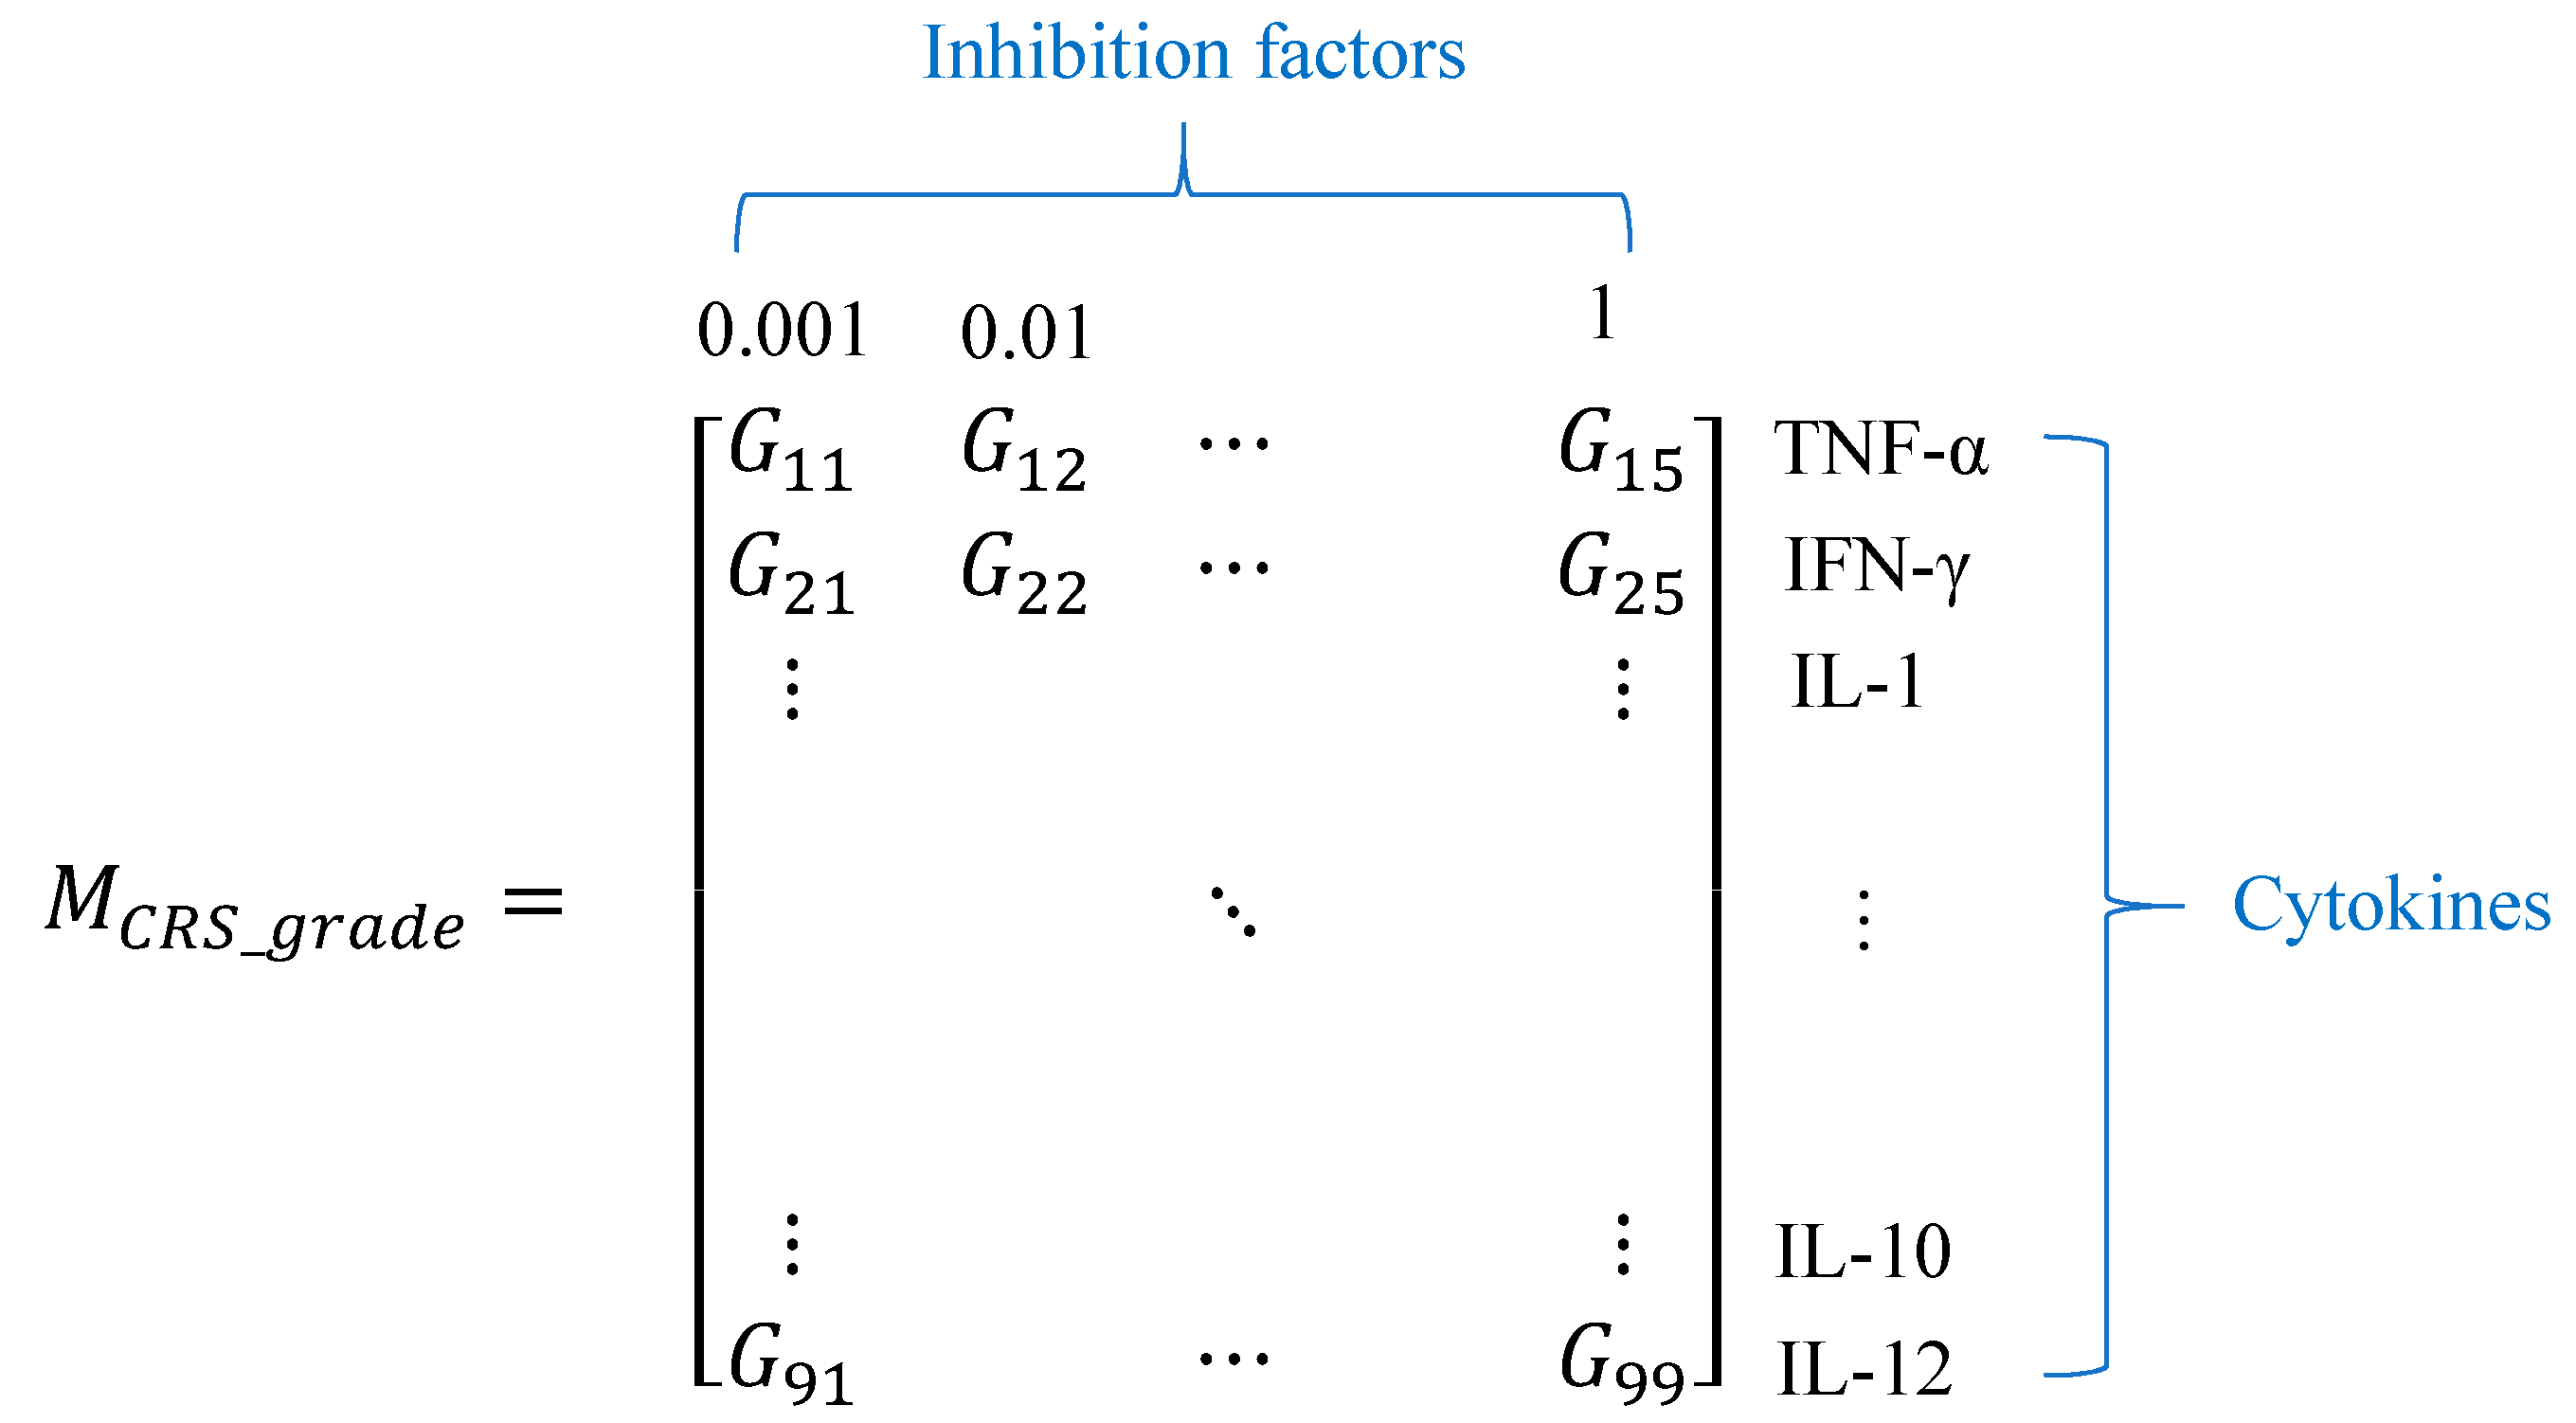
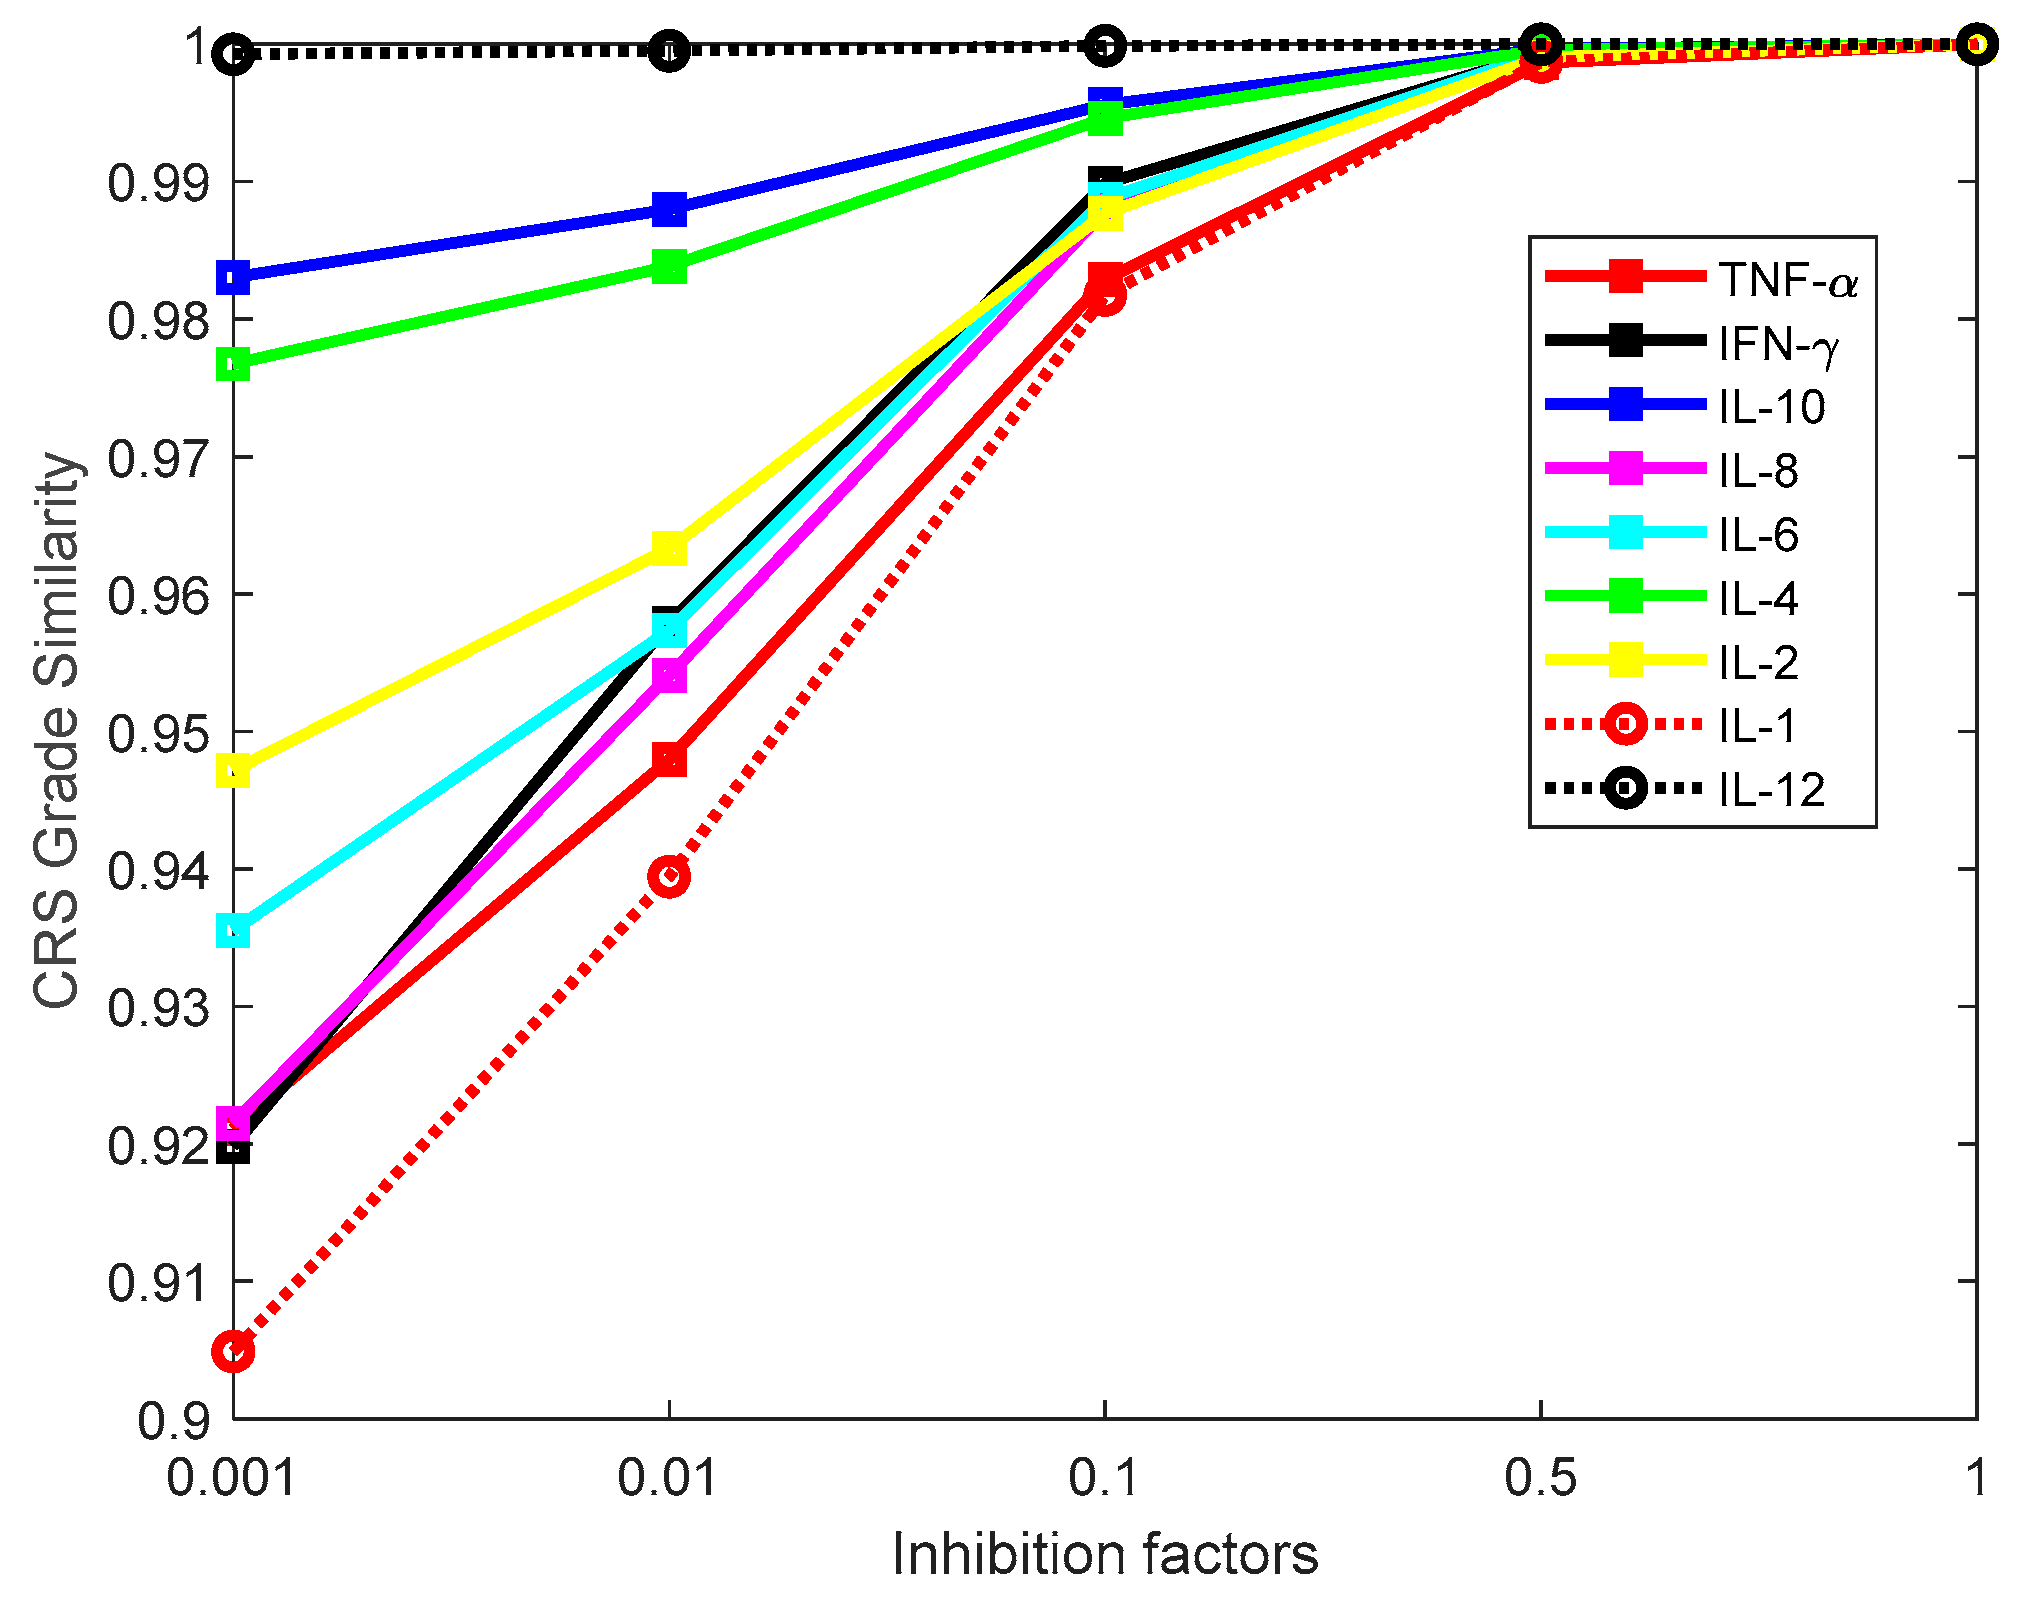
On the basis of the aforementioned mathematical model, each of the 9 cytokines was inhibited by multiplying inhibition factors of 0.001, 0.01, 0.1, 0.5, and 1 individually with the accumulation rate of the target cytokine for the inhibition. We applied these five inhibition factors to provide a comprehensive spectrum of inhibitions for clinical application. The CRS grade was then evaluated using Equation (4). In particular, both Vr and Vn are a nine by one vector, in the format of [CTNF−α, CIFN−γ, CIL−1, CIL−6, CIL−8, CIL−2, CIL−4, CIL−10, CIL−12]. Vr represents the vector of the peak values of the 9 cytokines for Grade-5 CRS, while Vn represents the vector for an inhibition condition. Five inhibition factors, including the factor of 1 for the control, were used to evaluate the impact of the degree of inhibition on reducing CRS. For instant, a larger dosage of a cytokine inhibitor corresponds to a smaller inhibition factor. For each cytokine (i.e., one row in the matrix shown in Equation (5)), inhibition simulations were conducted with the aforementioned five inhibition factors. For each simulation, the CRS grade similarity, represented by Gi,j, was recorded in the column for the corresponding inhibition factor. Only one cytokine was inhibited at one time. A larger Gi,j indicates the CRS grade is more similar to CRS Grade 5, which is the most severe CRS. The inhibition simulation resulted in the matrix MCRS_grade in Equation (5), in which each row stood for one cytokine and each column represented an inhibition factor. Matrix MCRS_grade was then analyzed by principal component analysis and hierarchical clustering [19,20] to group the nine cytokines on the basis of the effectiveness of their inhibitions on reducing CRS.
Processes 07 00012 i001
In addition to the inhibition of single cytokines, inhibition of multiple cytokines were investigated in the following steps: (1) the cytokine was inhibited by multiplying the factor 0.001 with the accumulation rate associated with the cytokine in the mathematical model, Equations (1) and (2); (2) when inhibiting less than 5 cytokines, all possible combinations of cytokines for inhibition were studied and the cytokine combination returning the lowest CRS grade was determined; (3) when inhibiting more than 4 cytokine, one cytokine was tested and added into the selected cytokines at one time for inhibition to avoid the exponentially increased number of combinations of cytokines. Step (3) is also supported by the simulation results (not shown) that indicated the cytokines whose inhibitions had large influence on CRS grades typically remained on the inhibition list when a new cytokine was additionally inhibited.

3. Results

3.1. Investigation of Uncertainties in CRS

Sensitivity analysis indicated that the ten most sensitive parameters were found to be associated with the following cytokines: IL-1, IL-8, IFN-γ, TNF-α, and IL-6. It should come as no surprise that IL-1 has a parameter that is the most sensitive due to its ability to induce other pro-inflammatory cytokines [21]. Additionally, IL-8 has one of the top 10 most sensitive parameters. IL-8 is a chemokine which can direct and induce neutrophil expansion [7]. Neutrophil expansion acceleration was highest in comparison with CD3+, CD4+ and CD8+ T-cells as well as monocytes [7]. In the clinical data of CRS presented in [7], the pro-inflammatory cytokines IFN-γ and TNF-α concentrations rose quickly. TNF-α was the cytokine measured to have the fastest response, and IFN-γ had the second fastest response to the immunotherapy. These cytokines are the quintessential markers of inflammation. In addition to the aforementioned cytokines, IL-6 is one of the most prominent markers of endothelial activation, and it is involved in both the pro-inflammatory and anti-inflammatory mechanisms.
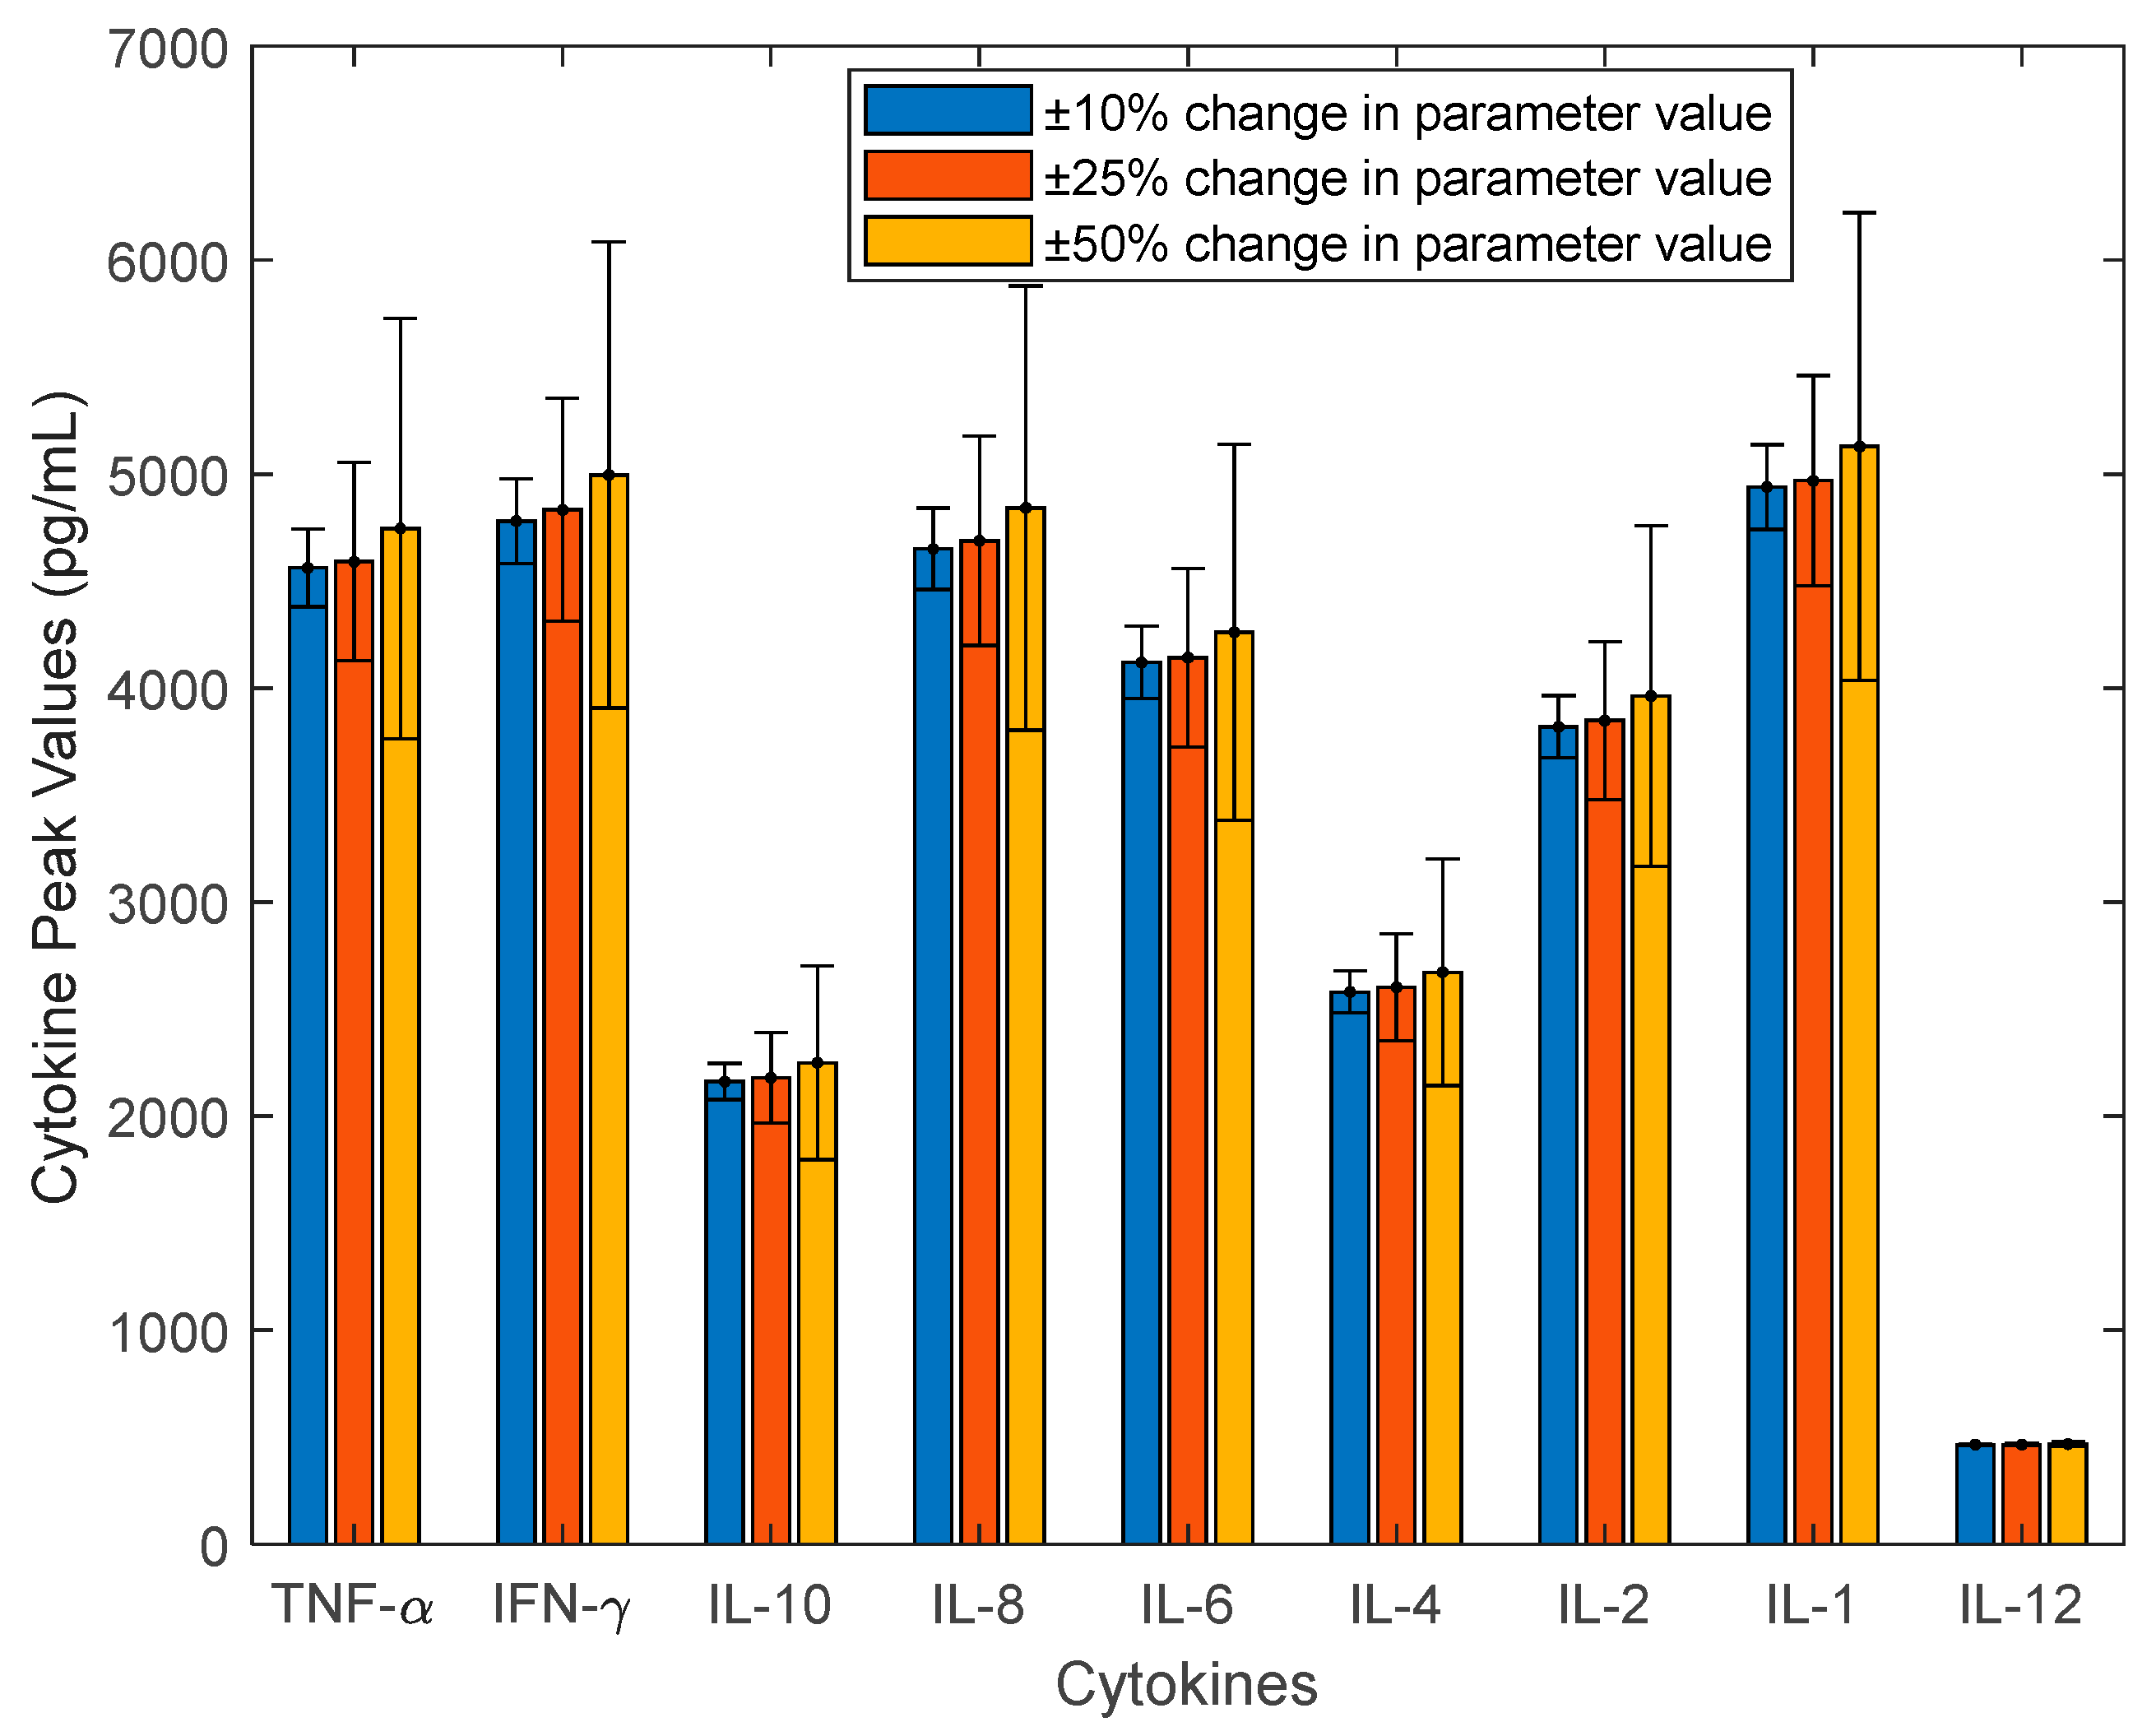
The selected 10 parameters were perturbed in the Monte Carlo sampling. Most cytokines surge to their peak values between the 5th to 12th hours after the T-cell therapy. CRS mostly happened in the first day of the therapy. Individual cytokines show varying peak value and time in different samples (i.e., in silico patients represented by the model). The peak values of cytokines are the most important for triggering CRS, and they were widely measured and used in clinical trials. Therefore, they are the major variables used in this work to indicate the CRS severity. They were recorded and represented in Figure 3, in which the mean value of each cytokine’s peak values was plotted along with the error bar of one standard deviation. The parameter values for Grade 4–5 patients were used as the nominal values for parameter perturbation within +/−10%, +/−25%, +/−50% ranges. As seen in Figure 3, cytokines IFN-γ, IL-1, IL-8, TNFα, IL-6, and IL-2 have large variation evidenced by their standard deviation of values. These cytokines are found to have large variation in CRS. For example, a marked increase of IFN-γ was found essential for the T-cell to detect the antigen of the cancer cells in solid tumors that could not be cured by previous T-cell therapy approaches [22]. Figure 3 also indicates that a larger variability is obtained for a larger parameter change range. When the change range is large enough (e.g., +/−50%), the variability shown in cytokine peak values is comparable to the values shown in the TGN1412 clinical data [7]. In order to match the variability shown in TGN1412 clinical data, cytokine data of individual patients are further needed to identify the distribution for parameter values. This is an interesting problem for future study. Figure 3 shows that the mean of the sampled peak values for individual cytokines slightly increases for a larger parameter perturbation. This may be due to the unsymmetrical effect of parameter perturbation. In other words, the increased magnitude in a cytokine peak value is larger than the decreased one even for the same absolute magnitude change in parameter values.
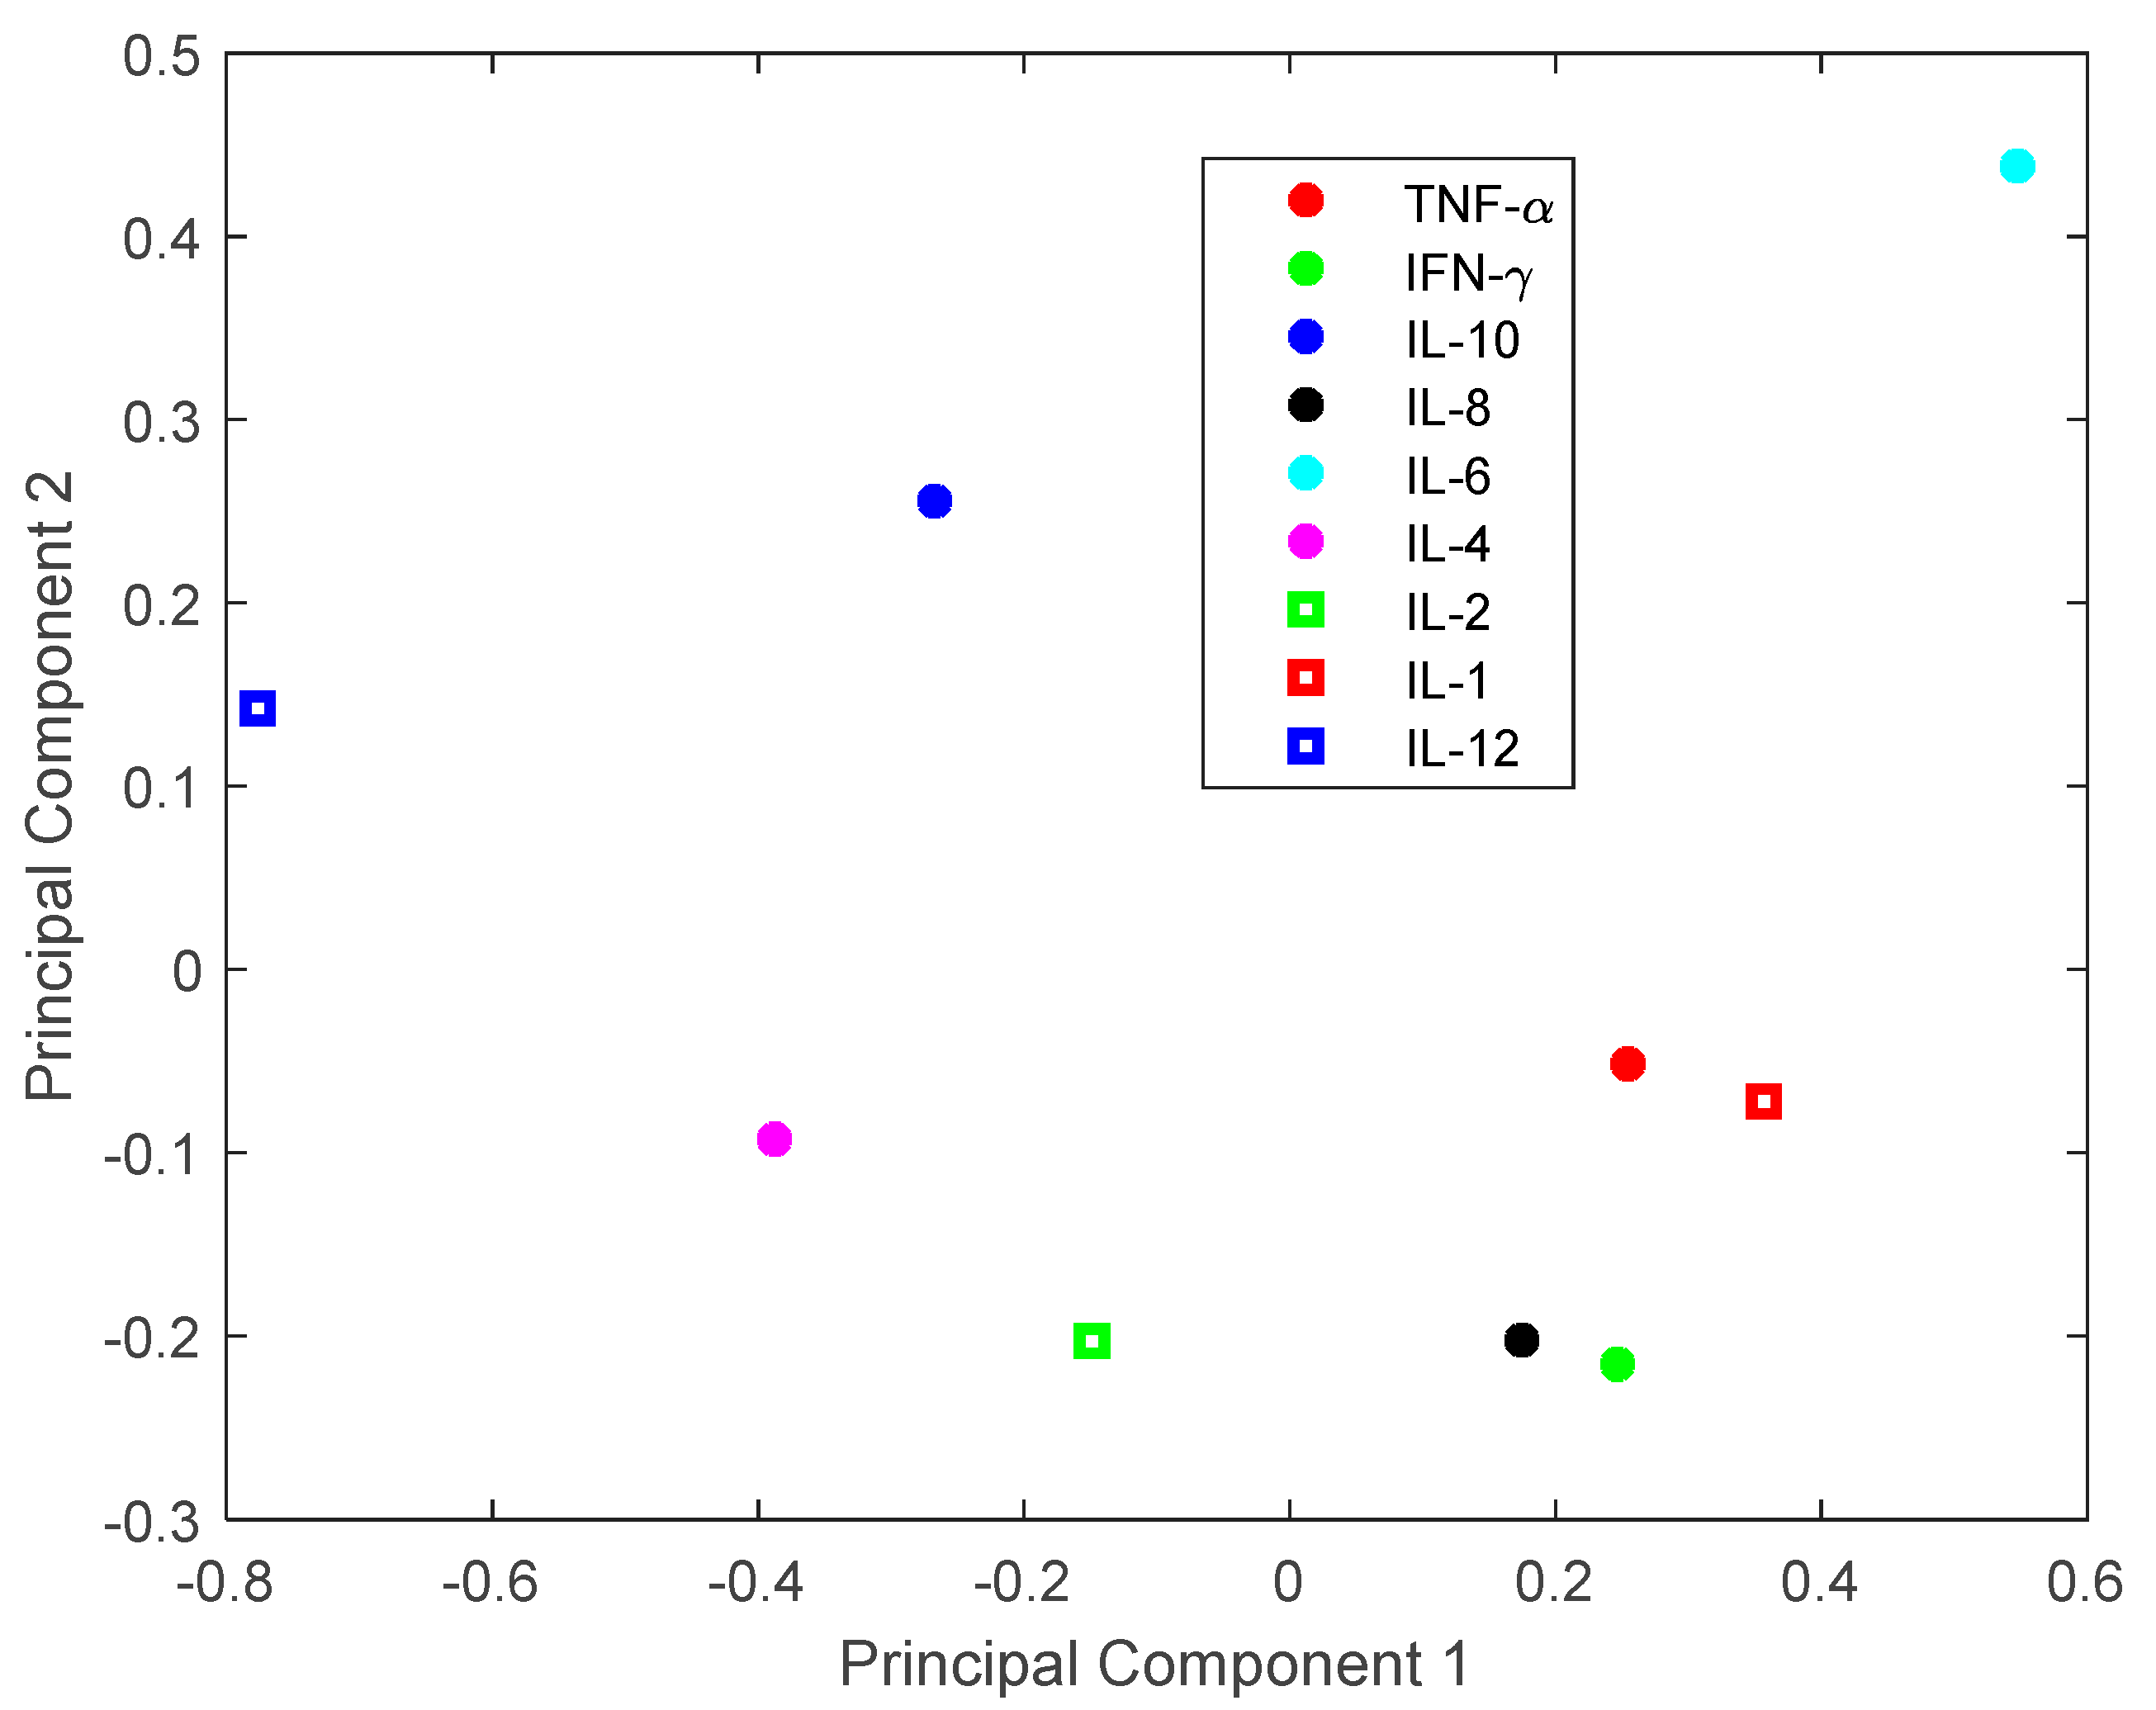
Yiu et al. [11] implemented principal component analysis (PCA) to classify the 9 cytokines on the basis of their wave shape for only one simulation (i.e., one patient). Here we further extended PCA to analyze the mean value and error bar data shown in Figure 3. Instead of analyzing one profile of each cytokine as shown in Yiu et al. [11], we considered the peak concentrations of each cytokines in all patients (Figure 4). The rationale for this is that it is the peak concentrations that matter the most for CRS. It can be seen from Figure 4 that IL-12 stays on the left side of the figure and it is away from other cytokines. This may be because that IL-12 is generally of a lower peak concentration and a smaller standard deviation than other cytokines (Figure 3). On the other hand, cytokines TNF-α, IL-8, IFN-γ, IL-1, IL-6, and IL-2 have larger magnitudes and uncertainties in their peak concentrations. They are located on the right side of Figure 4. Cytokines that are located close to each other in Figure 4 have more similar peak values. For example, TNF-α has a more similar peak value with IL-6 than with IL-12.

3.2. Investigation of Single Cytokine Inhibition

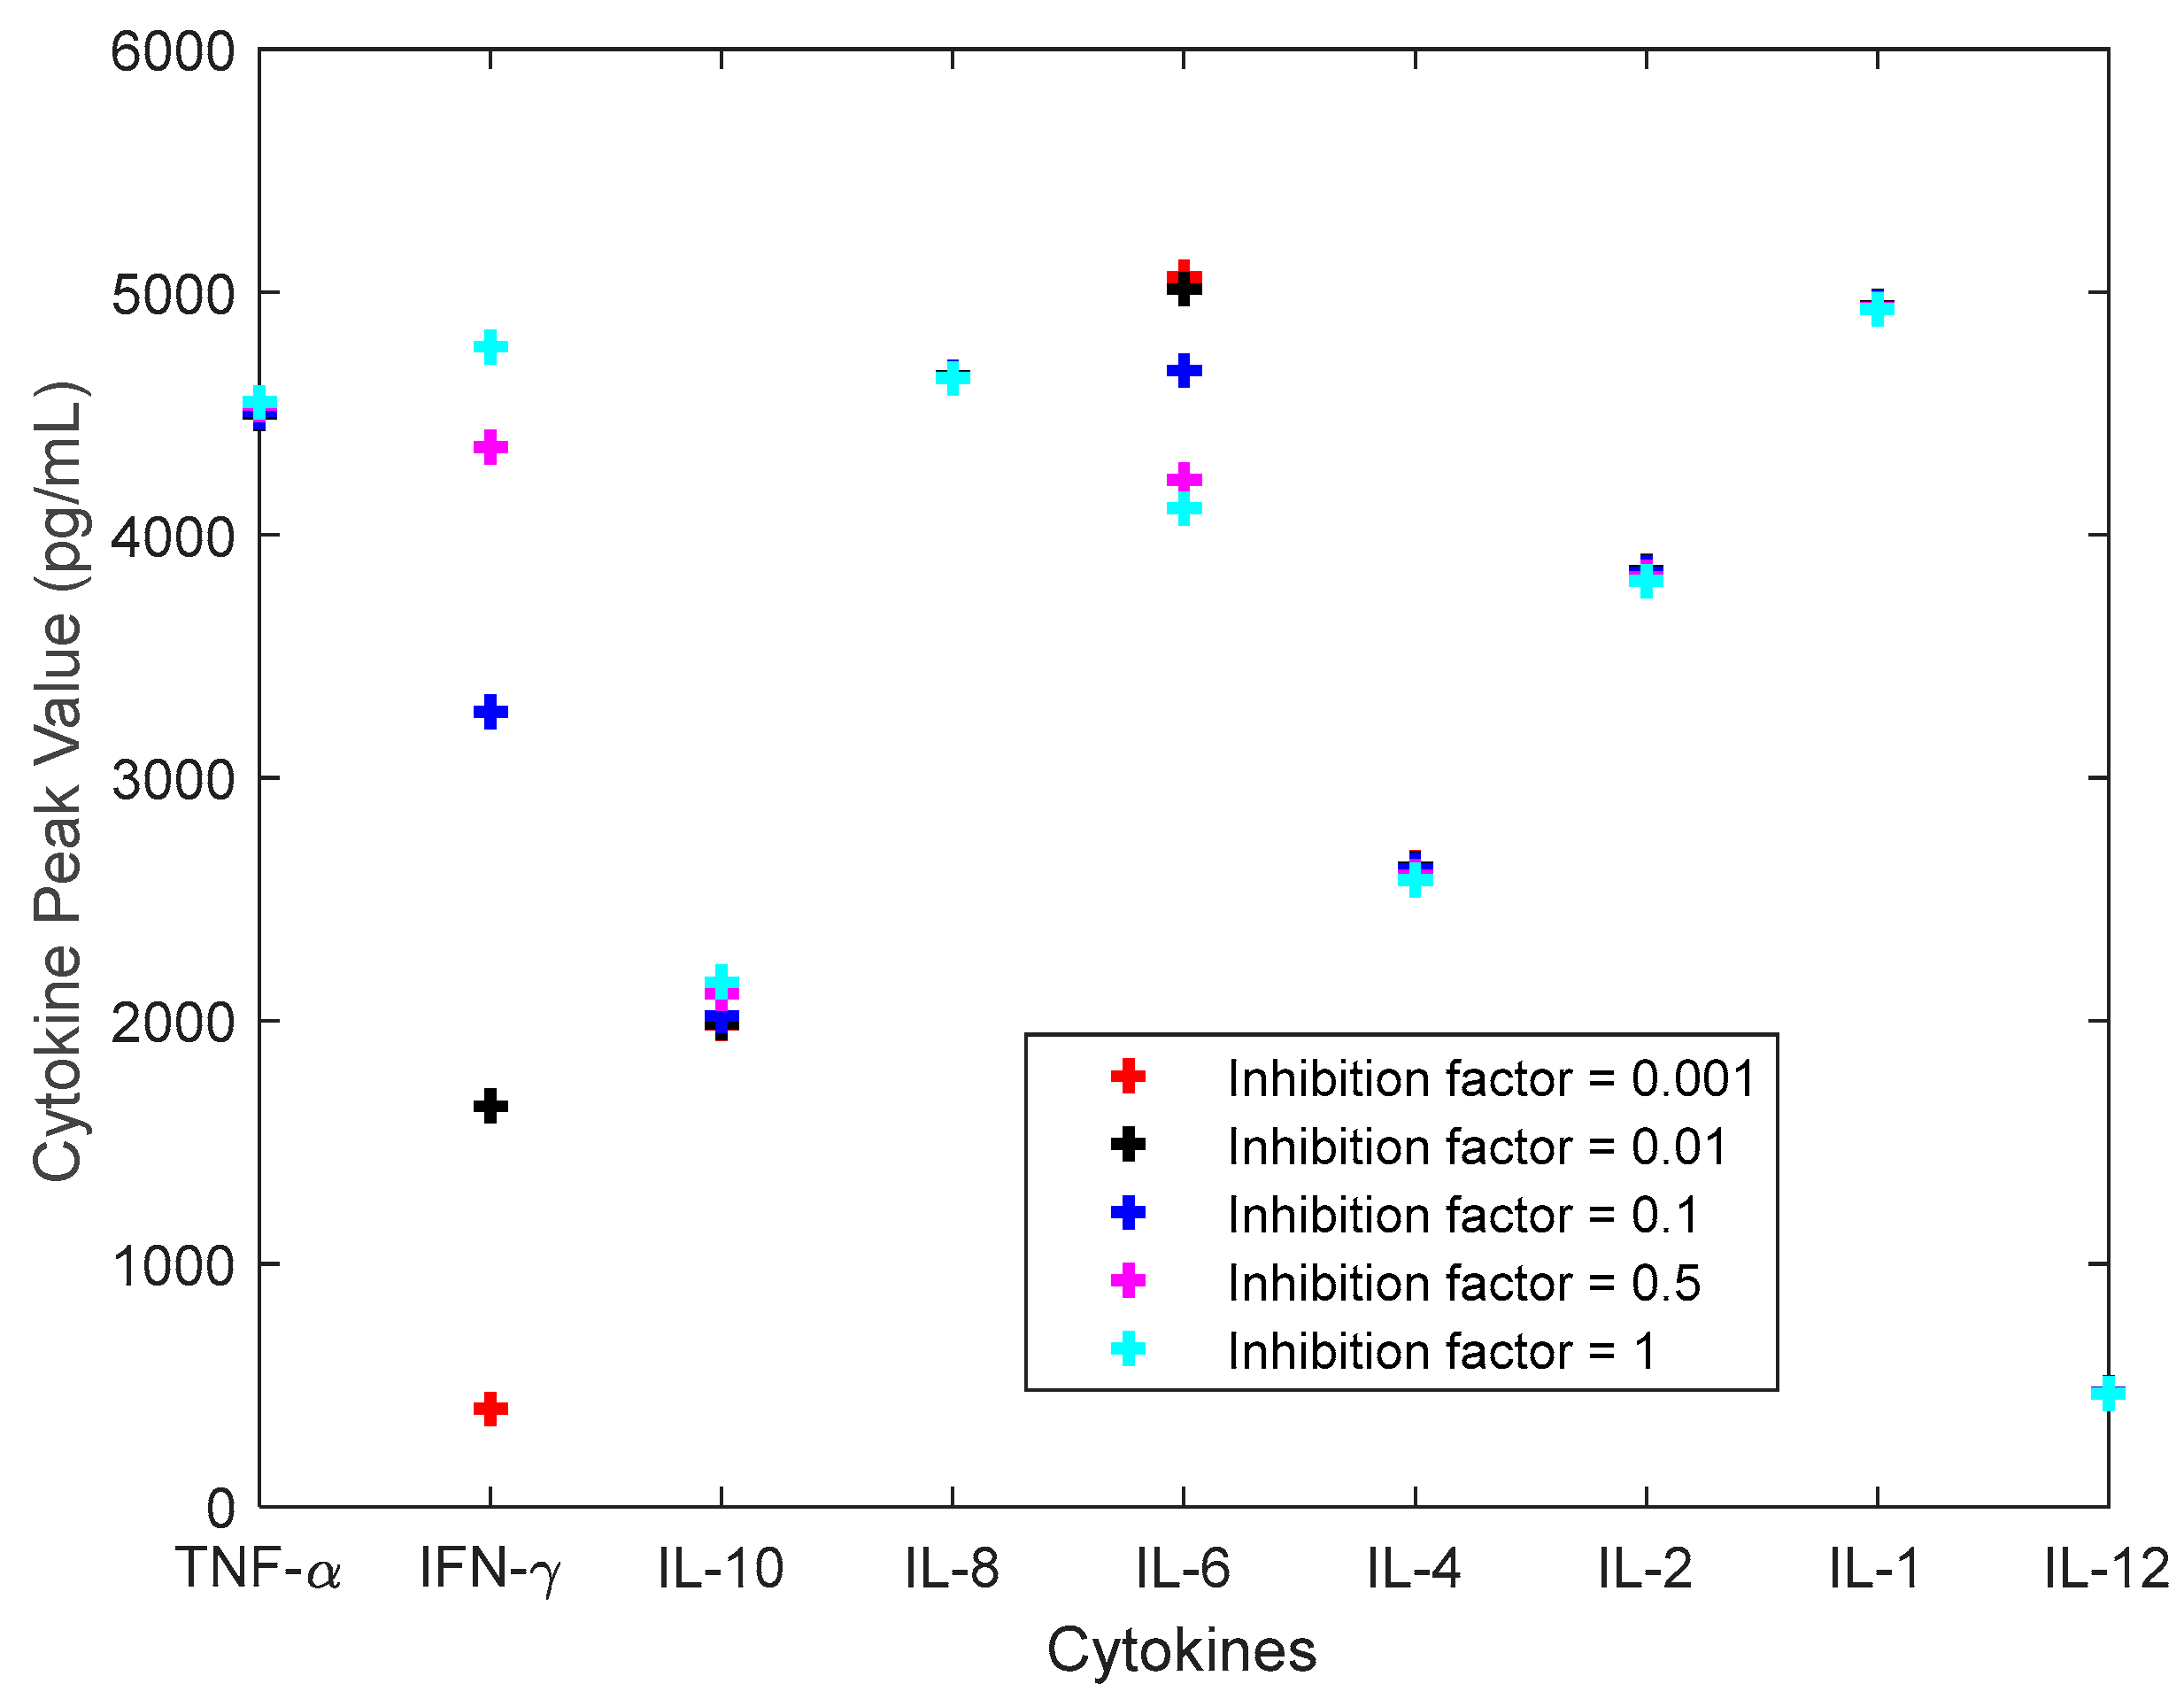
In the past, cytokine inhibition has proven to be effective at reducing the severity of cytokine release syndrome [2]. One cytokine inhibitor example is given by Tocilizumab, an anti-IL-6 receptor molecule. This has helped reduce, but not solve the CRS problem as it takes days to help a patient’s immune system to recover. During the TGN1412 trial, an anti-IL-2 receptor molecule was used, called Doclizumab, in tandem with dexamethasone, a corticosteroid [7]. Unfortunately, there has not yet been any studies which have taken a novel approach to quantifying the grade of CRS as a function of the inhibition of single and multiple cytokines. We designed the approach below to take a successive logarithmic-style reduction of 1, 1/2, 1/10, 1/100 and 1/1000 of the parameter values for specific cytokines to illustrate how it may not be necessary to completely knock out a cytokine but rather reduce its potency in order to drive a magnitude of difference in the resulting grade of CRS developed by the patient. Compared to the other 7 cytokines monitored in the TGN1412 trial, IL-6 and IL-2 are more easily inhibited because commercialized inhibitors have been developed to modify their respective receptor sites on the surface of different cells. We, however, take the approach of investigating all the measured cytokines, and in Figure 5 illustrate our logarithmic-style inhibitive simulation on IFN-γ as this cytokine is tantamount to inflammation in many studies, including those which are involved in the quantitative methods of measuring cytokines themselves.
Figure 5 below uses IFN-γ to demonstrate the inhibitive effect of this cytokine on the other cytokines using peak cytokine concentrations. Yiu et al. [11] completed a graphing analysis of the overall concentration curves for each cytokine, but we took this approach because it is more impactful to understand the peak cytokine concentrations as they relate to the grade of CRS. In Figure 5, one can see that inhibiting IFN-γ in a logarithmic trend has the largest impact on IFN-γ concentration because the inhibition of that cytokine is directly proportional to its own concentration. Furthermore, this illustration confirms the inhibitive effect of IFN-γ has a net positive effect on IL-6, which has a biological basis, and is confirmed in the Yiu et al. paper [11] showing the inhibitive effect of increasing IFN-γ concentration on IL-6. As can also be seen in the figure, there is little impact of inhibiting IFN-γ on other cytokines.
While Figure 5 shows the cytokine peak values for the inhibition of IFN-γ, it doesn’t show the CRS grade for each inhibition scenario. Figure 6 takes the findings of Figure 5 a step further and confirms the cytokines with the overall greatest impacts on the patient’s CRS grade for each inhibition scenario of each cytokine. Figure 6 elucidates that the greatest impact to reduction in patient CRS grade is IL-1, because the similarity of this function to the highest grade is lowest when inhibiting only IL-1. Effectively, Figure 6 has advantage over Figure 5 because it graphically shows the distribution of each cytokine’s inhibition on the overall grade of CRS, not just one individual cytokine’s inhibition on the other cytokines’ concentrations. Figure 6 has a basis in using the similarity function previously defined, and using selective inhibition of each cytokine, relating the magnitude of peak cytokine concentration functions to the highest grade of CRS. The figure suggests that using this approach, by selectively inhibiting IL-1 at different logarithmic levels could have the greatest impact on reducing a patient’s symptoms of CRS.
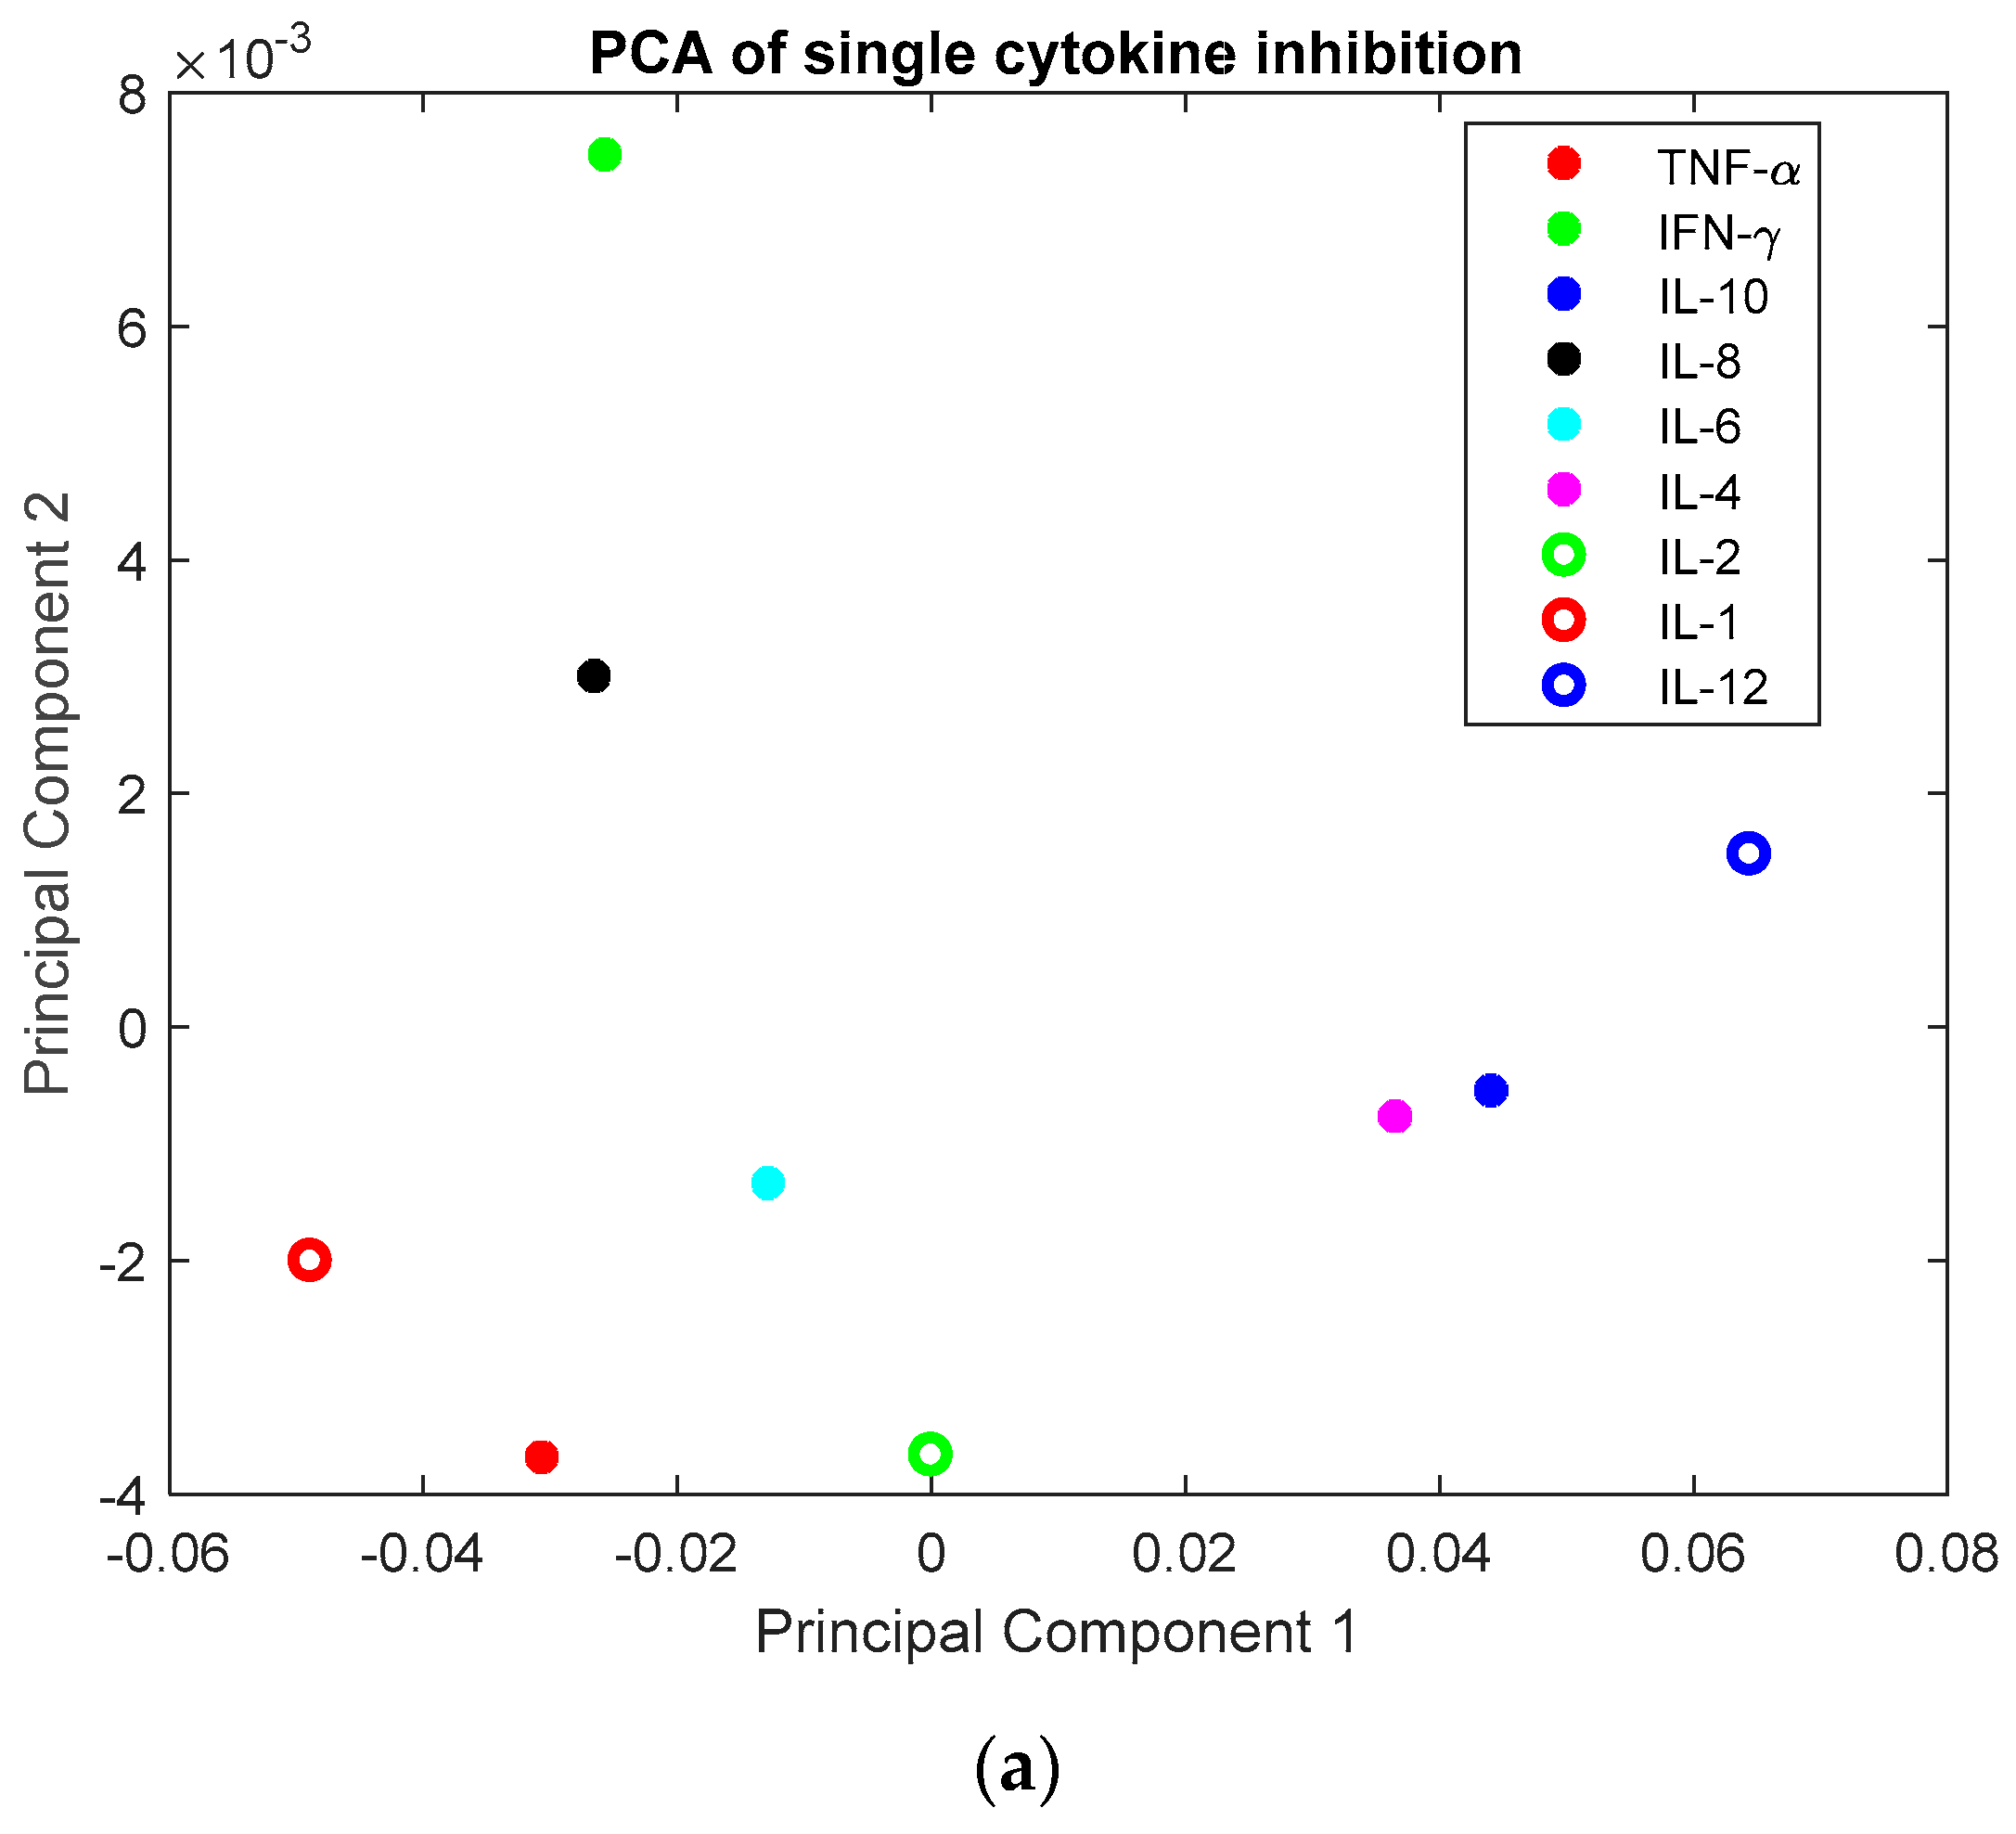
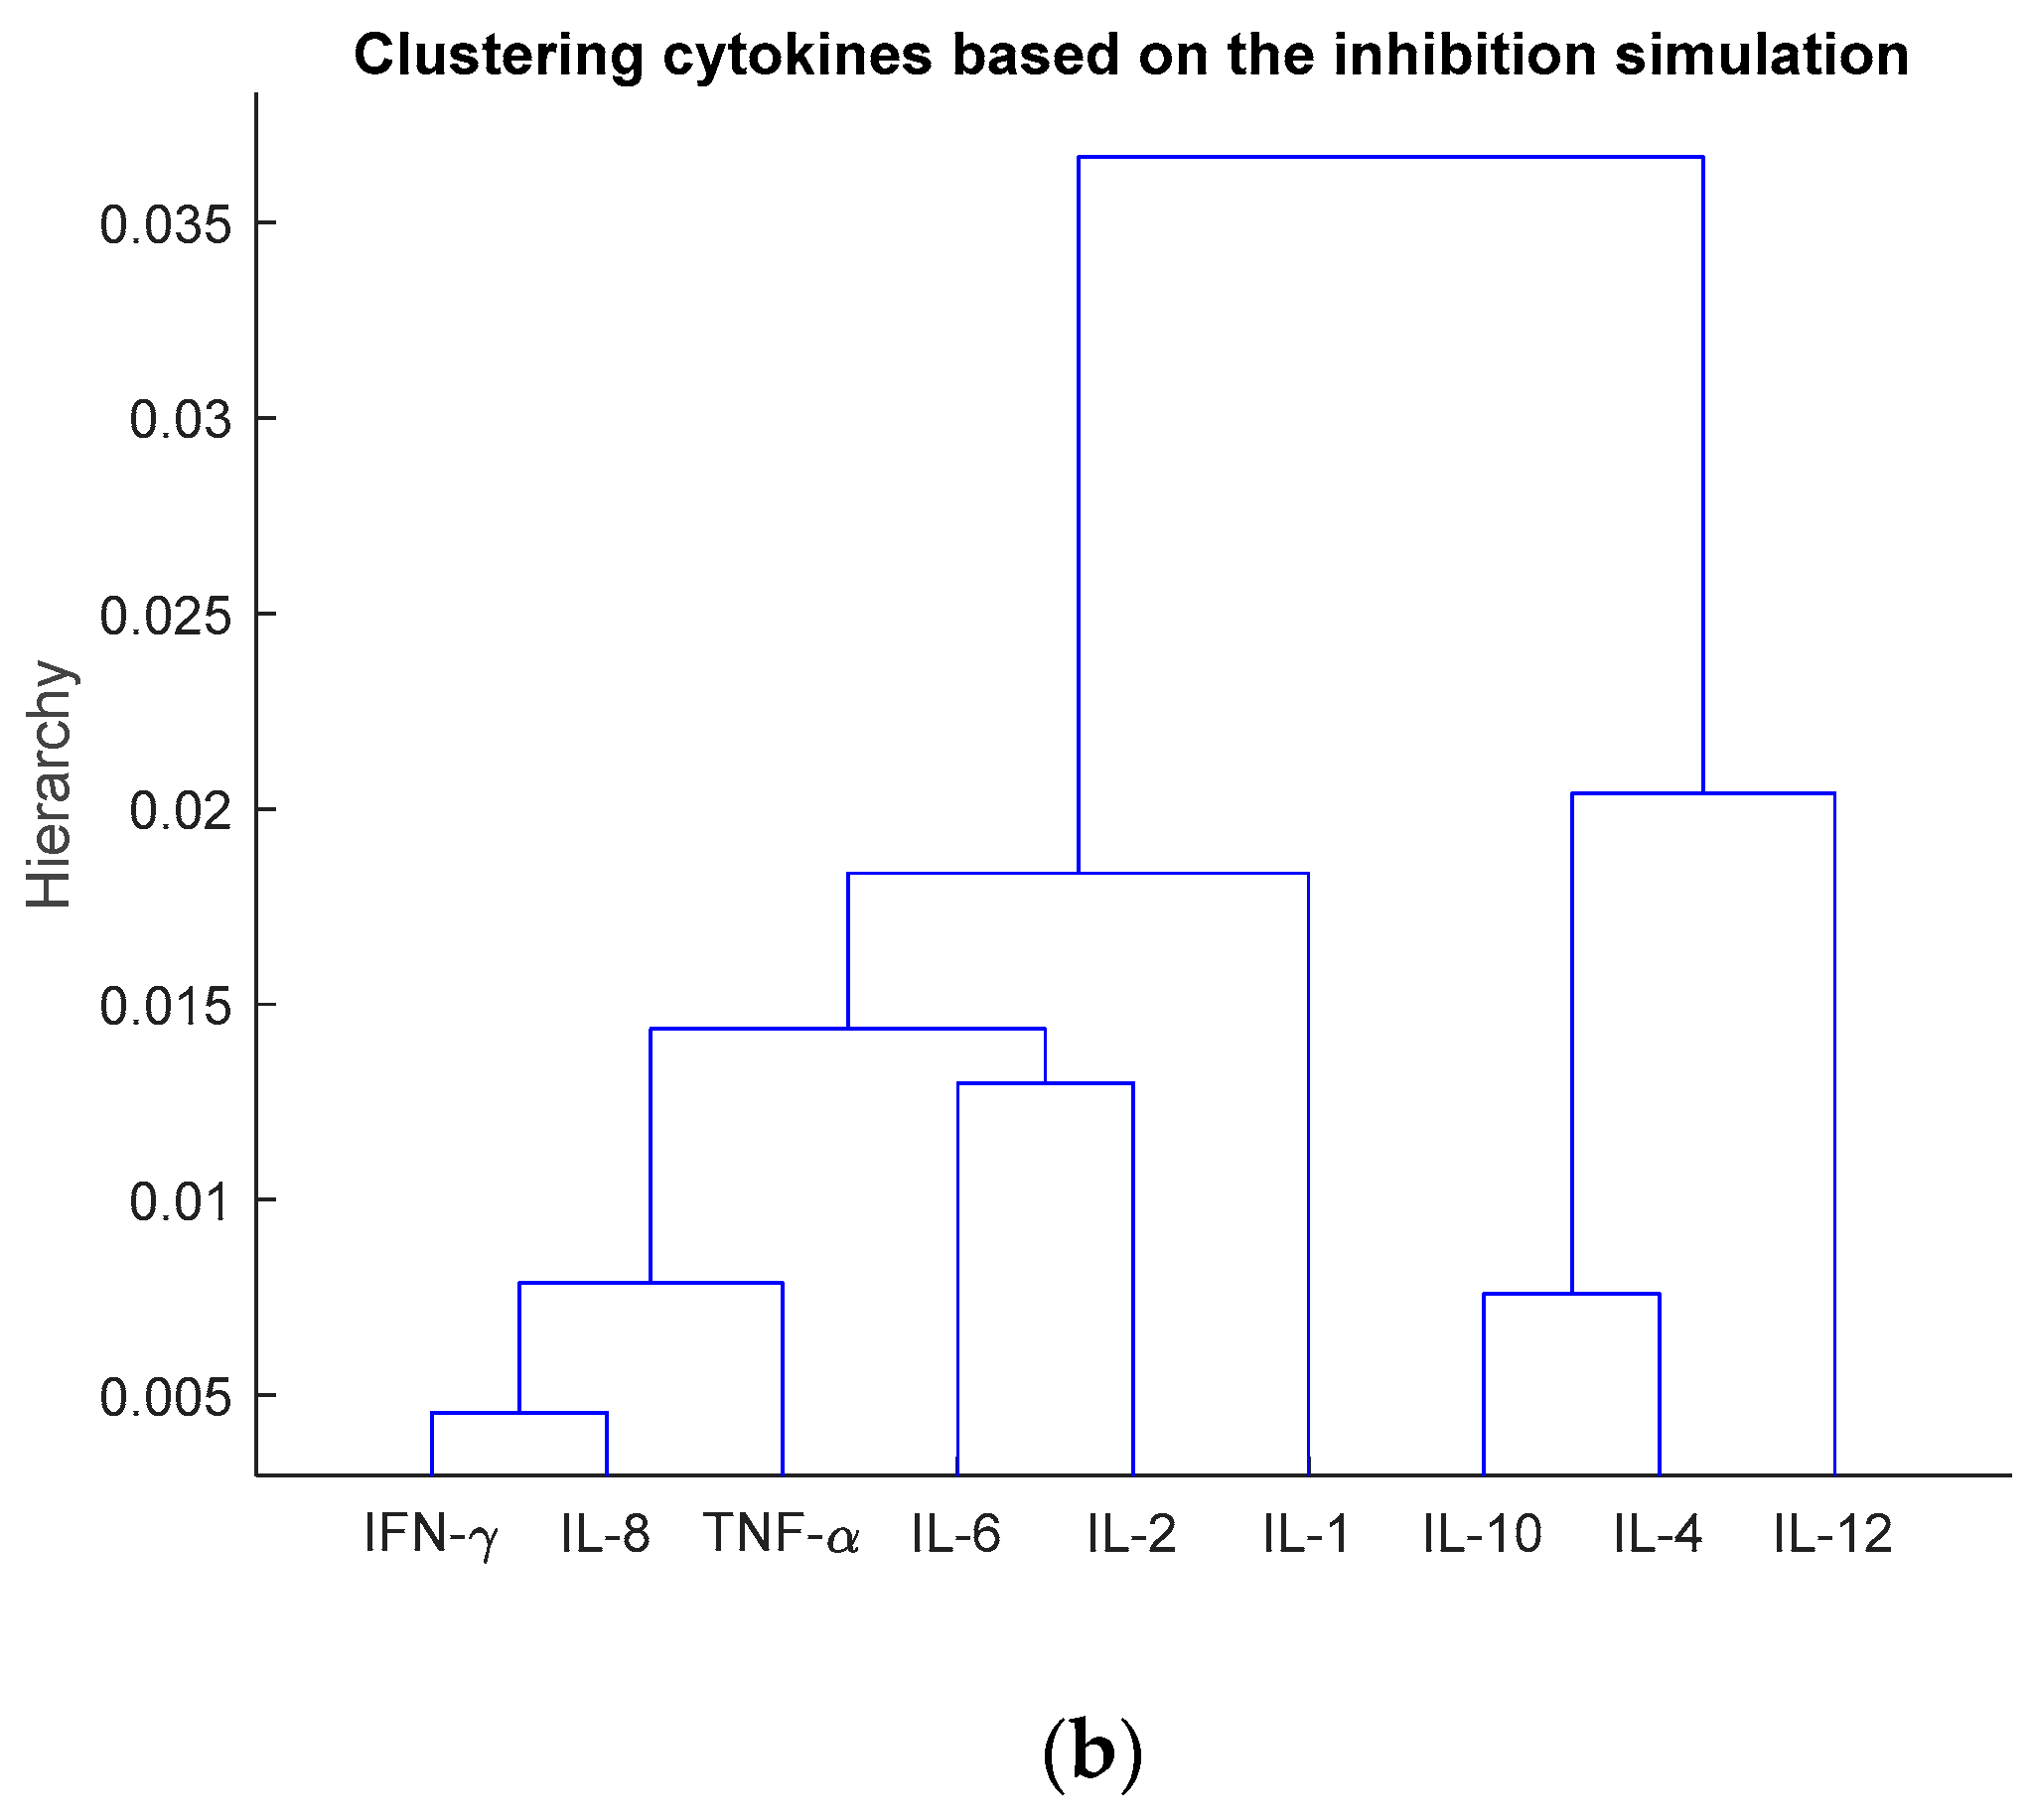
On the basis of the profiles shown in Figure 6, the cytokines were projected onto the PC1–PC2 two dimensional space in Figure 7a using principal component analysis. These cytokines were then grouped in Figure 7b by hierarchical clustering. The PCA suggests the impact of inhibition is grouped with cytokines IL-10 and IL-4, TNF-α and IL-1, IFN-γ and IL-8, and finally IL-12 being most different from all the other cytokine inhibitions. The finding regarding IL-12’s dissimilarity with the rest of the selective inhibitions of other cytokines is consistent with findings in Yiu et al. [11].

3.3. Investigation of Multiple Cytokine Inhibition

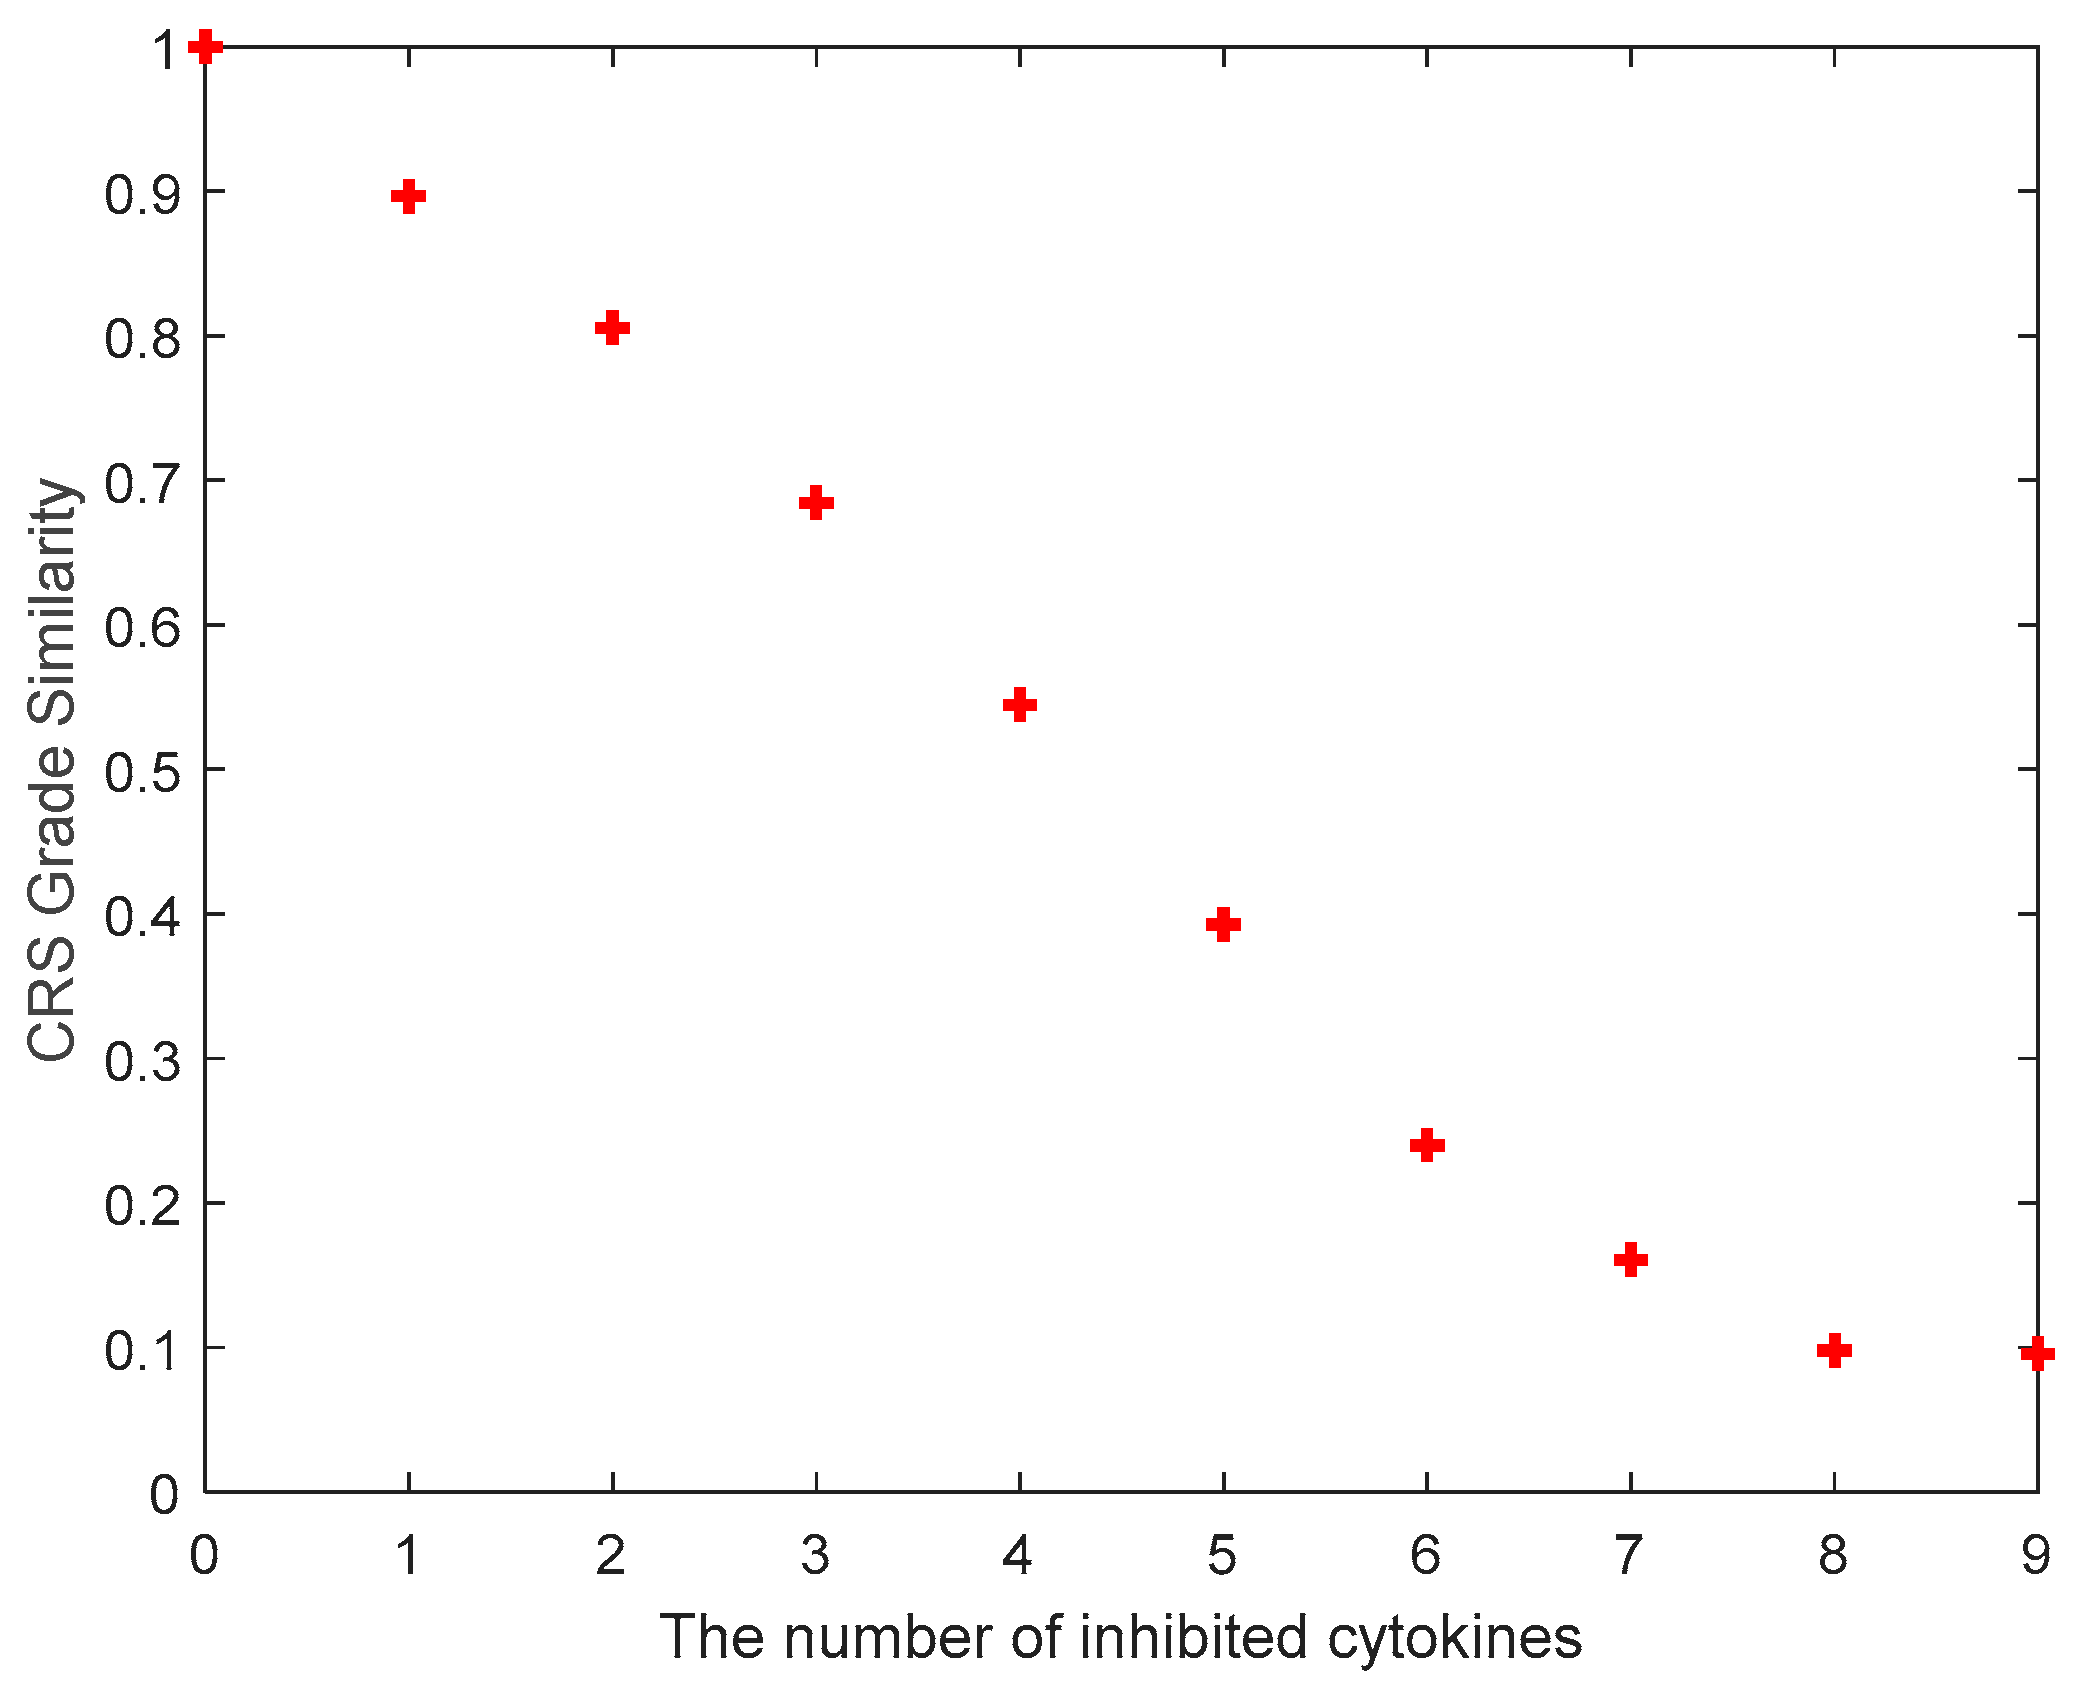
This section extends the study from single cytokine inhibitor to combinations of multiple cytokine inhibitors using the approach presented in the Methods section. The number of cytokines for inhibition was increased from one to nine, and the set of cytokines returning the lowest CRS grade was recorded and plotted for each case in Figure 8. The best combination of cytokines for inhibition that returned the lowest CRS grade for Figure 8 were given in Table 1.
In Figure 8, the number of inhibited cytokines begins at zero, which would correlate to the findings of the Monte Carlo sampling with no cytokine inhibited. From there, a simulation was conducted using the most impactful cytokines in reducing the grade of CRS, where each cytokine was additionally inhibited one at a time, sequentially. The first cytokine to be inhibited with the inhibition factor of 0.001 (i.e., 99.9% inhibition), bearing the highest single impact in reducing the CRS was IL-1. Table 1 captures the successive inhibitions. After IL-1, the additional inhibition of IL-8 returned the lowest CRS. These first two cytokines correlate with Figure 5 and Figure 6, where the impact on the overall grade of CRS is impacted most with IL-1. After IL-8, TNF-α is inhibited. As was mentioned previously, TNF-α concentration accelerated to an average of 1760 pg/mL at hour 1 following the injection of TGN1412; it was the first biomarker of inflammation, according to the group monitoring the blood chemistry during the trial [7]. After TNF-α there was IFN-γ and IL-6. It is important to note that during each successive inhibition that the simulation was reassessed with the cytokines which were uninhibited. Each cytokine was compared against one another in the resulting mix to assess which was the next best to inhibit, which is why Table 1 illustrates the suggested mix of cytokines to minimize the grade of CRS.

4. Discussion

Some existing works presented models to link concentrations of certain cytokines with the probability for patients to get CRS. For example, a current model predicts whether a patient will develop critical CRS just by a fever of value 38.9 °C and MCP-1 levels above 1350 pg/mL threshold [8]. Another model looks at the development of CRS based on certain cytokine levels over the course of 72 h, which shows patients with CRS ≥ 4 had IFN-γ levels higher than 75 pg/mL and IL-10 ≥ 60 pg/mL. Finally the last two predictive models are mathematical equations. They delivered the highest level of accuracy, which only monitored levels of IFN-γ, spg130 and IL-1RA in the first model and measures spg130, MCP-1 and Eotaxin levels in the second model [8]. The models, however, lack a few key items. For example, they lacked timeliness. Most models are predictive models only after 3 days. After 3 days, this is likely too late for patients who may develop CRS grade ≥ 4 and are at risk of death. On the basis of the data presented in these existing work/models, we presented the first approach to quantify the grade of CRS from cytokine profiles that can be applied to any timely cytokine data, meaning cytokine concentration data taken during and throughout administration of immunotherapy [9]. Utilizing the grading system developed by Hay et al. [8] was useful in comparing to other existing data because it verifies a gradient of values falling within the broader range of possible peak cytokine values. Furthermore, after tabulating and adapting the Grading system defined by Hay, we were able to use this Grading system and develop the program to relate external data using the same grading system to assess degree of CRS corresponding to each patient’s data in silico. In deriving the Similarity function, we accurately demonstrated success in relating 1–100% nominal values of the TGN1412 Phase I trial to the Grading system defined by Hay, and in the future may be able to use this type of approach to accurately help identify early phase CRS to prevent it from spiraling out of control using cytokine concentrations.
We presented the first systematic investigation for multiple inhibition of cytokines to reduce CRS. Table 1 shows the suggested sequence for multiple cytokine inhibitions. This provides suggestions for clinical implementation. Figure 8 suggests that 8 cytokines need to be inhibited in order for the Similarity function to reach 0.1 of the original Similarity value where zero cytokines are inhibited (i.e., Grade-5 CRS). As we know from the Yiu model, the inhibitive relationships between different cytokines could be leveraged or coordinated to help reduce the concentration of multiple cytokines without having to cause side effects. This approach would currently be a problem because there are only commercially available inhibitors for IL-6 and IL-2 receptors. The Gradesimilarity for inhibiting IL-6 and IL-2 at the same time is 0.8757, higher than the best Gradesimilarity for double cytokine inhibition (i.e., 0.8056 achieved with IL-1 and IL-8 inhibitors). In time further commercially available inhibitors could be developed for acute inhibition of other specific cytokines. Results shown in Table 1 can used to generate hypotheses for experiment design. There is also data to suggest that fewer commercial inhibitors could be used to actually inhibit more than 1 cytokine at a time due to the inductive and inhibitive effects of one cytokine on the others [2]. While it is visually plotted in Figure 8 to show the effect of inhibiting just 1 cytokine, successively, it is suggested in other literature [2] that the biological basis for total system inhibition may be able to be achieved through fewer commercial inhibitors than assuming each cytokine needs its own inhibitor. There is not enough data, however, to suggest that our approach wouldn’t be a more effective option to help patients return to baseline levels faster, and reduce chances for organ failure, neurotoxicity and other permanent side-effects associated with CRS.
The peak values of cytokines were mainly used in this work to grade CRS, as they were the variables mostly used in clinical trials for determining the severity of CRS. In addition to the peak value, the duration of cytokine profiles is also important for CRS. Hopkins et al. [22] reported that IL-6 has the greatest area under the curve (AUC), followed by IL-1, TNF-α, IL-8, IFN-γ, IL-10, IL-2, IL-4 and finally IL-12. When we performed sensitivity analysis using AUC of cytokine profiles as the outputs, the most important parameters identified were similar to those obtained when using cytokine peak values as the outputs. Since the peak values were generally used in grading CRS (as shown in references [8,9]), we focused on the cytokine peak values when defining Equation (4) for CRS grading in this work.
The mathematical model was adapted from Yiu et al. [11]. While the model is able to accurately represent biological phenomena such as the inductive and inhibitive effects of cytokines on one another, the model does have its limitations. One key fact is that the model is based on cytokine concentrations being measured from zero, which is not a normal level of cytokines circulating in the human bloodstream. This point should not be disregarded. Another point to consider is that the model does not take into consideration the proliferation of T-cells. Although at the time of administration of the TGN1412 monoclonal antibody super agonist there was an immeasurable amount of T-cells for CD3+, CD4+ and CD8+ alike, the model does not consider the proliferation of cytokines or even the inductive effect stemming from T-cells. There is a real biological basis for the cytokine concentrations rising so acutely during the trial, and this is not captured in the model. In addition, Yiu’s model was developed from the 6 patients with Grade 4–5 treated by TGN1412 in 2006. It did not take the patient-to-patient variability into account. The model should be further improved to address the aforementioned issue in the future. Additional experimental data are thus required for validating the expanded model that incorporate T-cell proliferation. The cytokine data of individual patients are also needed to determine the distribution for parameter value to fit the patient variability shown in their cytokine peak values.

5. Conclusions

In this work, we aim to provide a formula to quantify the grade of CRS from cytokine profiles and thus use it to evaluate the inhibition of single/multiple cytokines on repressing CRS. On the basis of an existing CRS model composed after the TGN1412 clinical trial, we conducted a sensitivity analysis and Monte Carlo sampling to study the uncertainties shown in cytokine profiles from 5000 in silico CRS patients. In order to quantify the CRS uncertainties, we created a formula to determine the grade of CRS from cytokine profiles and evaluated the formula using an existing CRS grading data. On the basis of the CRS grade formula, single and multiple cytokines were inhibited in the model to evaluate their performance on repressing CRS. We hypothesized that there could be a hierarchy of inhibition targets to reduce the grade of cytokine release syndrome and predicted an inhibition order to simulate how inhibiting one or more cytokines in a particular order could reduce the grade of CRS. The results showed that IL-1, IL-8, TNF-α, INF-γ, IL-6, IL-2, IL-4, IL-10, and IL-12 were in turn the best target for inhibition to alleviate CRS. This approach is available to be taken in the future if real-time data is available, which would help characterize a patient’s cytokine profile into a specific grade, and simultaneously identify which cytokines could be knocked out using commercially available inhibitors to help reduce the grade. The contribution is tantamount to the advancement of novel approaches to characterize a patient’s severity of cytokine release syndrome and help reduce it to improve their prognosis during the adoptive immunotherapy process.

Author Contributions

B.H. and M.T. built the CRS ODE model, performed sensitivity analysis and Monte Carlo sampling; B.H. and Z.H. defined the CRS grading formula; B.H., Y.P., and Z.H. designed the single and multiple inhibition of cytokines; B.H., Y.P., Z.H. participated in the analysis of results and the preparation of the manuscript.

Funding

This research received no external funding.

Acknowledgments

We appreciated Robert Stengel from Princeton University for his conversation with us on the model developed in his group (i.e., the Yiu’s model) and on the data of TGN1412 Phase I clinical trial.

Conflicts of Interest

The authors declare no conflict of interest.

References

  1. Rosenberg, S.A.; Yang, J.C.; Restifo, N.P. Cancer immunotherapy: Moving beyond current vaccines. Nat. Med. 2004, 10, 909–915. [Google Scholar] [CrossRef] [PubMed]
  2. Lee, D.W.; Gardner, R.; Porter, D.L.; Louis, C.U.; Ahmed, N.; Jensen, M.; Grupp, S.A.; Mackall, C.L. Current concepts in the diagnosis and management of cytokine release syndrome. Blood 2014, 124, 188–195. [Google Scholar] [CrossRef] [PubMed] [Green Version]
  3. Almasbak, H.; Aarvak, T.; Vemuri, M.C. CAR T Cell Therapy: A Game Changer in Cancer Treatment. J. Immunol. Res. 2016, 2016, 5474602. [Google Scholar] [CrossRef] [PubMed]
  4. Adams, G.P.; Weiner, L.M. Monoclonal antibody therapy of cancer. Nat. Biotechnol. 2005, 23, 1147–1157. [Google Scholar] [CrossRef] [PubMed]
  5. Jin, Z.; Xiang, R.; Qing, K.; Li, X.; Zhang, Y.; Wang, L.; Zhu, H.; Mao, Y.; Xu, Z.; Li, J. The severe cytokine release syndrome in phase I trials of CD19-CAR-T cell therapy: A systematic review. Ann. Hematol. 2018, 97, 1327–1335. [Google Scholar] [CrossRef] [PubMed]
  6. Wang, Z.G.; Han, W.D. Biomarkers of cytokine release syndrome and neurotoxicity related to CAR-T cell therapy. Biomark. Res. 2018, 6, 4. [Google Scholar] [CrossRef] [PubMed]
  7. Suntharalingam, G.; Perry, M.R.; Ward, S.; Brett, S.J.; Castello-Cortes, A.; Brunner, M.D.; Panoskaltsis, N. Cytokine storm in a phase 1 trial of the anti-CD28 monoclonal antibody TGN1412. N. Engl. J. Med. 2006, 355, 1018–1028. [Google Scholar] [CrossRef] [PubMed]
  8. Hay, K.A.; Hanafi, L.A.; Li, D.; Gust, J.; Liles, W.C.; Wurfel, M.M.; López, J.A.; Chen, J.; Chung, D.; Harju-Baker, S.; et al. Kinetics and biomarkers of severe cytokine release syndrome after CD19 chimeric antigen receptor-modified T-cell therapy. Blood 2017, 130, 2295–2306. [Google Scholar] [CrossRef] [PubMed]
  9. Teachey, D.T.; Lacey, S.F.; Shaw, P.A.; Melenhorst, J.J.; Maude, S.L.; Frey, N.; Pequignot, E.; Gonzalez, V.E.; Chen, F.; Finklestein, J.; et al. Identification of Predictive Biomarkers for Cytokine Release Syndrome after Chimeric Antigen Receptor T-cell Therapy for Acute Lymphoblastic Leukemia. Cancer Discov. 2016, 6, 664–679. [Google Scholar] [CrossRef] [PubMed] [Green Version]
  10. Waito, M.; Walsh, S.R.; Rasiuk, A.; Bridle, B.W.; Willms, A.R. A Mathematical Model of Cytokine Dynamics During a Cytokine Storm; Springer International Publishing: Cham, Switzerland, 2016. [Google Scholar]
  11. Yiu, H.H.; Graham, A.L.; Stengel, R.F. Dynamics of a Cytokine Storm. PLoS ONE 2012, 7, e45027. [Google Scholar] [CrossRef] [PubMed]
  12. Zi, Z. Sensitivity analysis approaches applied to systems biology models. IET Syst. Biol. 2011, 5, 336–346. [Google Scholar] [CrossRef] [PubMed] [Green Version]
  13. Tomovic, R.; Vukobratovic, M. General Sensitivity Theory; Elsevier: New York, NY, USA, 1972. [Google Scholar]
  14. Eslami, M. Introduction to System Sensitivity Theory—Frank, P.M. IEEE Trans. Syst. Man Cybern. 1980, 10, 337–338. [Google Scholar]
  15. Van Mourik, S.; Ter Braak, C.; Stigter, H.; Molenaar, J. Prediction uncertainty assessment of a systems biology model requires a sample of the full probability distribution of its parameters. PeerJ 2014, 2, e433. [Google Scholar] [CrossRef] [PubMed]
  16. Doucet, A.; de Freitas, N.; Gordon, N. An Introduction to Sequential Monte Carlo Methods, in Sequential Monte Carlo Methods in Practice. In Statistics for Engineering and Information Science; Doucet, A., de Freitas, N., Gordon, N., Eds.; Springer: New York, NY, USA, 2001. [Google Scholar]
  17. Jolliffe, I.T.; Cadima, J. Principal component analysis: A review and recent developments. Philos. Trans. R. Soc. A Math. Phys. Eng. Sci. 2016, 374, 20150202. [Google Scholar] [CrossRef] [PubMed]
  18. Wold, S.; Esbensen, K.; Geladi, P. Principal Component Analysis. Chemom. Intell. Lab. Syst. 1987, 2, 37–52. [Google Scholar] [CrossRef]
  19. Johnson, S.C. Hierarchical Clustering Schemes. Psychometrika 1967, 32, 241–254. [Google Scholar] [CrossRef] [PubMed]
  20. Corpet, F. Multiple Sequence Alignment with Hierarchical-Clustering. Nucleic Acids Res. 1988, 16, 10881–10890. [Google Scholar] [CrossRef] [PubMed]
  21. Wojdasiewicz, P.; Poniatowski, L.A.; Szukiewicz, D. The Role of Inflammatory and Anti-Inflammatory Cytokines in the Pathogenesis of Osteoarthritis. Med. Inflamm. 2014, 2014, 561459. [Google Scholar] [CrossRef] [PubMed]
  22. Textor, A.; Schmidt, K.; Kloetzel, P.M.; Weißbrich, B.; Perez, C.; Charo, J.; Anders, K.; Sidney, J.; Sette, A.; Schumacher, T.N.; et al. Preventing tumor escape by targeting a post-proteasomal trimming independent epitope. J. Exp. Med. 2016, 213, 2333–2348. [Google Scholar] [CrossRef] [PubMed] [Green Version]
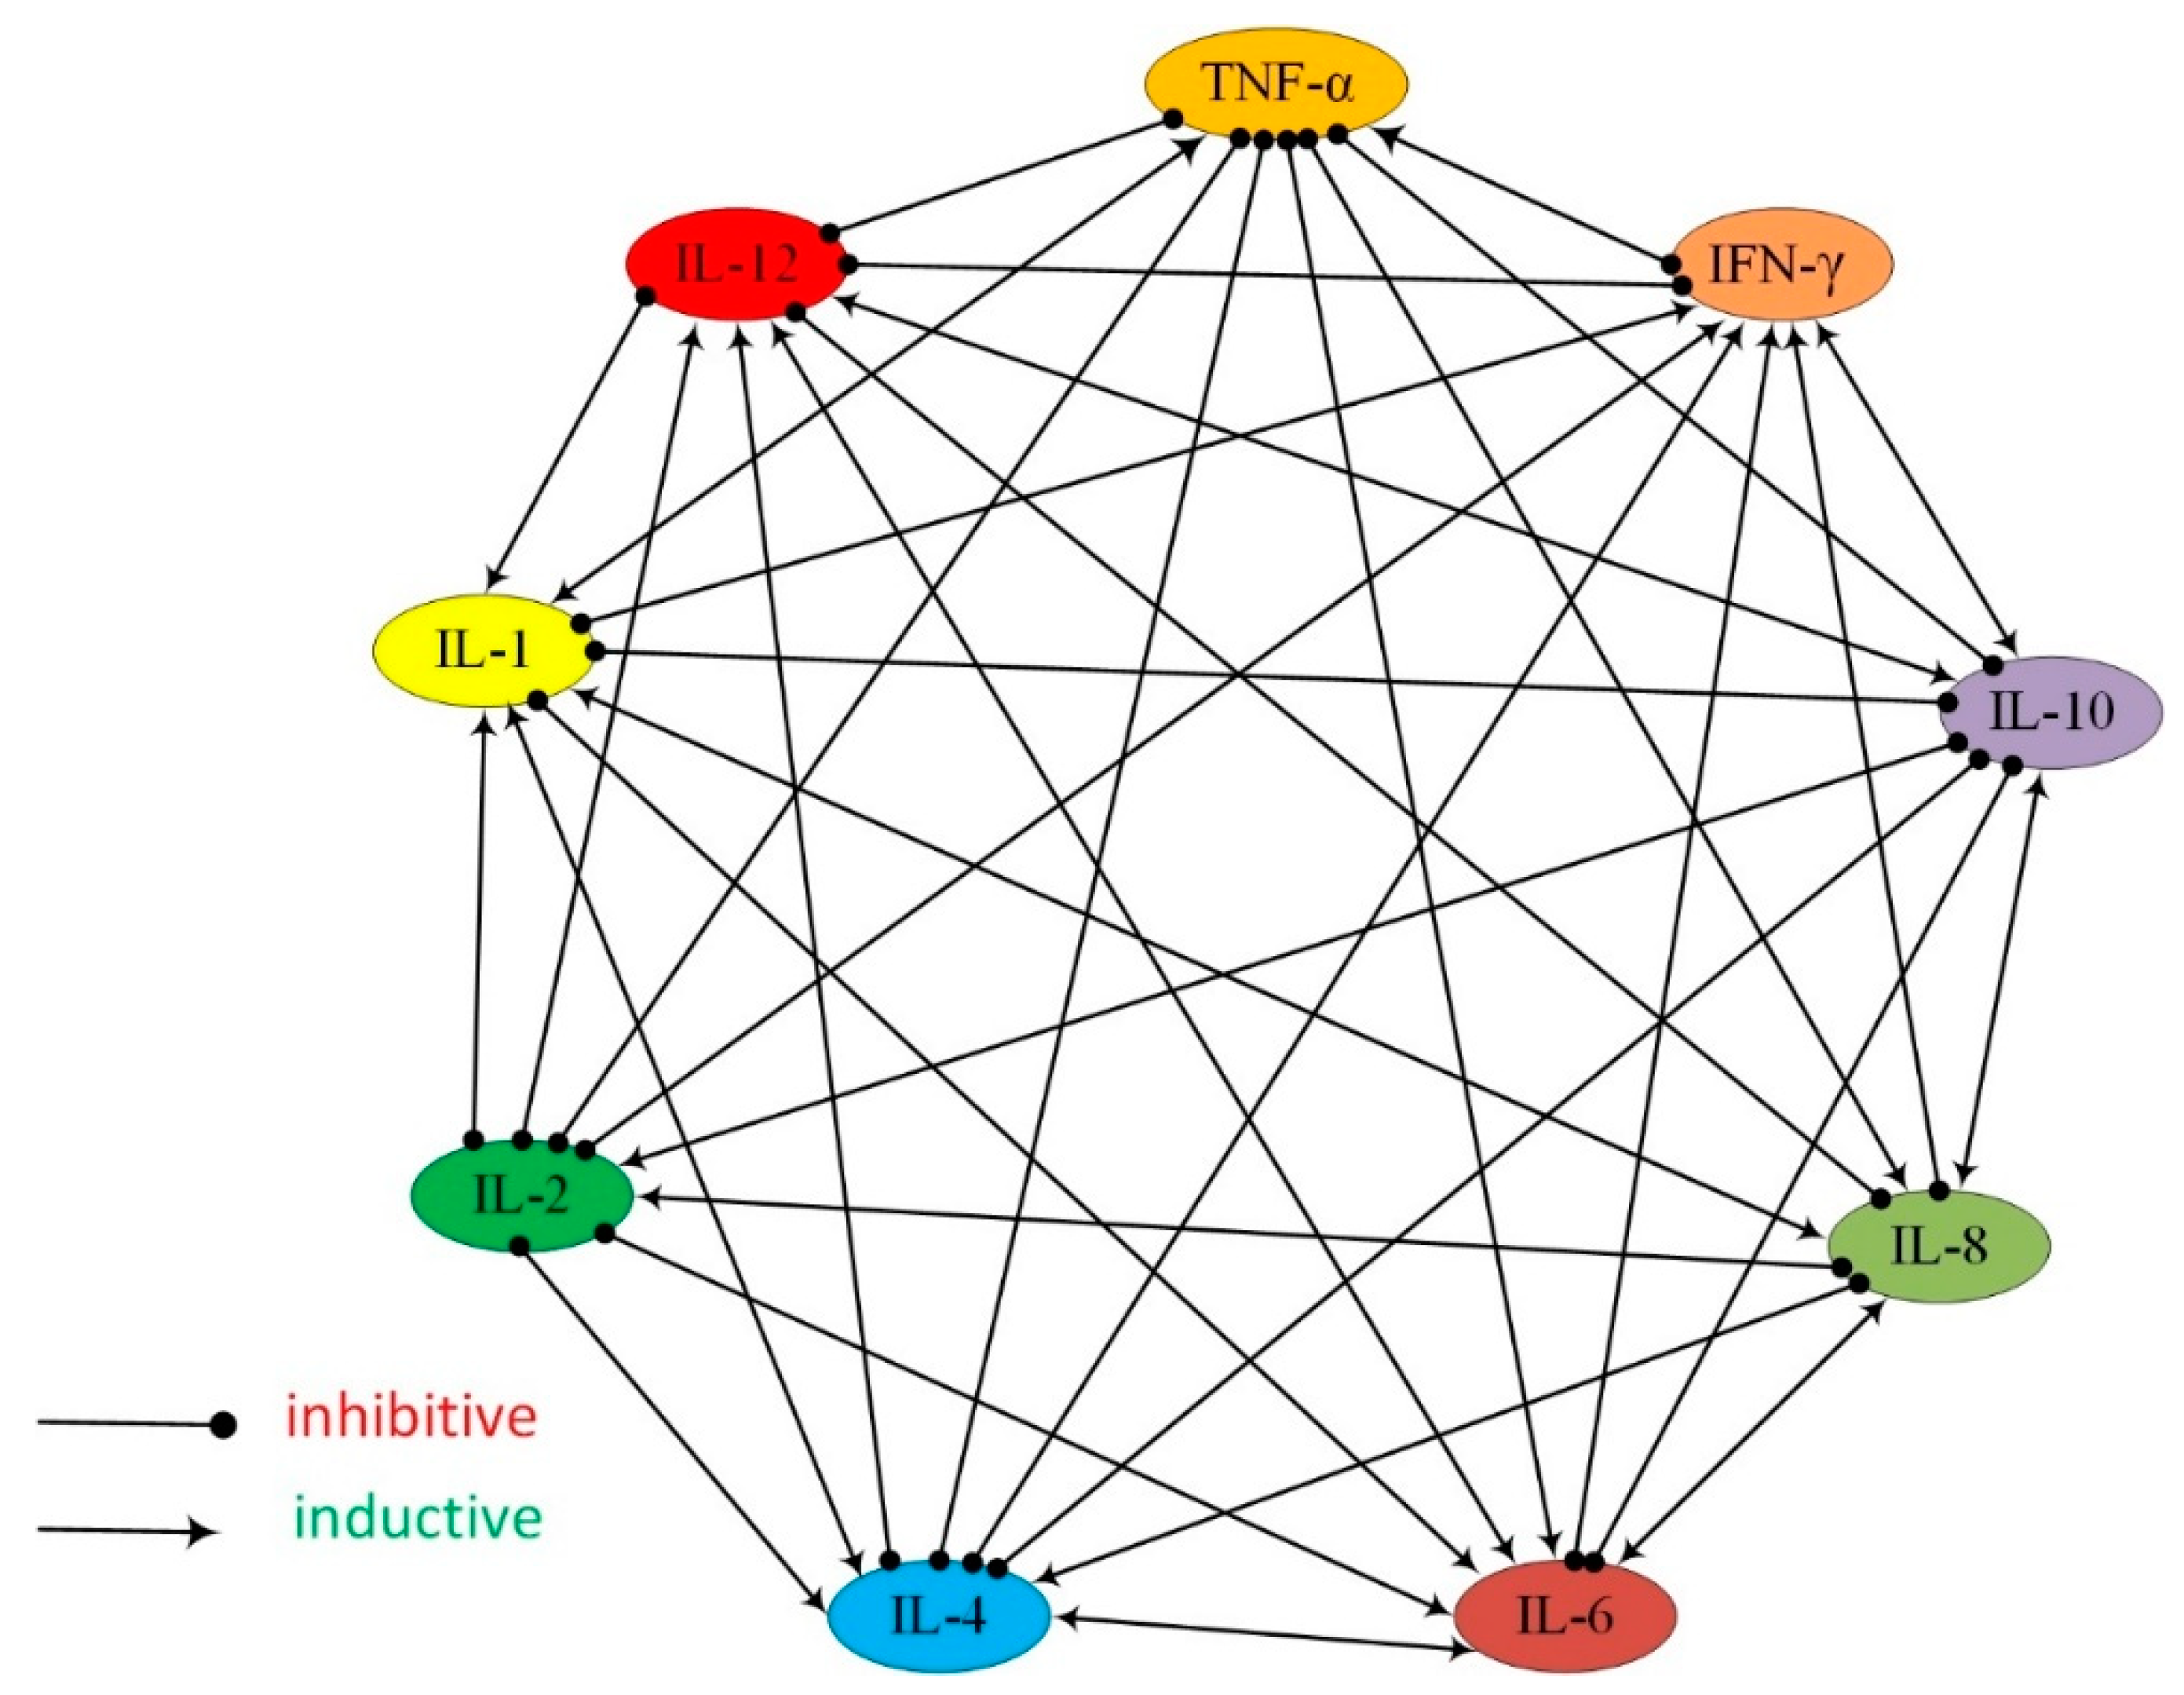
Figure 1. The interaction network of the 9 cytokines studied in this work. The arrow ending indicates the inductive effect, while the solid circle ending means inhibitive effect. For example, the link from IFN-γ to IL-6 ends with a solid circle. This indicates the inhibitive effect from IFN-γ to IL-6.
Processes 07 00012 g001
Figure 2. The concentrations of IFN-γ, IL-6, IL-8, IL-10, and TNF-α for each grade of cytokine release syndrome (CRS), adapted from Hay et al. [8].
Processes 07 00012 g002
Figure 3. The mean peak concentration of all 9 cytokines along with one standard deviation represented by the error bar that were generated in the Monte Carlo sampling of the TGN1412 trial.
Processes 07 00012 g003
Figure 4. The projection of the 9 cytokines on the space of Principals one and two according to their peak values. (PCA: principal component analysis).
Processes 07 00012 g004
Figure 5. The cytokine concentrations for the inhibition of INF-γ.
Processes 07 00012 g005
Figure 6. The CRS grade for different inhibition factors of each cytokine. A larger CRS Grade Similarity indicates the severity of CRS is more similar to the one for Grade-5 CRS.
Processes 07 00012 g006
Figure 7. Project the nine cytokines onto the Principal Component 1 and 2 (PC1–PC2) space on the basis of the CRS grade of their inhibition (a), and cluster them based upon their projection on to the PC1–PC2 space (b).
Processes 07 00012 g007aProcesses 07 00012 g007b
Figure 8. The CRS grades when various numbers of cytokines were inhibited. The cytokines that were inhibited to return the plotted CRS in this figure were listed in Table 1.
Processes 07 00012 g008
Table 1. The cytokines that were inhibited to return the cytokine release syndrome (CRS) grade shown in Figure 8.
Number of Cytokines for InhibitionThe Inhibited Cytokines
1IL-1
2IL-8, IL-1
3TNF-α, IL-8, IL-1
4INF-γ, TNF-α, IL-8, IL-1
5IL-6, INF-γ, TNF-α, IL-8, IL-1
6IL-2, IL-6, INF-γ, TNF-α, IL-8, IL-1
7IL-4, IL-2, IL-6, INF-γ, TNF-α, IL-8, IL-1
8IL-10, IL-4, IL-2, IL-6, INF-γ, TNF-α, IL-8, IL-1
9IL-12, IL-10, IL-4, IL-2, IL-6, INF-γ, TNF-α, IL-8, IL-1