Article

Modelling Condensation and Simulation for Wheat Germ Drying in Fluidized Bed Dryer

1
PhD Program in Nutrition and Food Science, Fu Jen Catholic University, New Taipei City 24205, Taiwan
2
Department of Information Technology, Lee-Ming Institute of Technology, New Taipei City 24346, Taiwan
3
Department of Food Science, Fu Jen Catholic University, New Taipei City 24205, Taiwan
*
Author to whom correspondence should be addressed.
Current Address: 510 Zhong-Zheng Road, Xinzhuang District, New Taipei City 24205, Taiwan.
Processes 2018, 6(6), 71; https://doi.org/10.3390/pr6060071
Submission received: 10 April 2018 / Revised: 1 June 2018 / Accepted: 5 June 2018 / Published: 9 June 2018
(This article belongs to the Special Issue Process Modelling and Simulation)

Abstract

:
A low-temperature drying with fluidized bed dryer (FBD) for wheat germ (WG) stabilization could prevent the loss of nutrients during processing. However, both evaporation and condensation behaviors occurred in sequence during FBD drying of WG. The objective of this study was to develop a theoretical thin-layer model coupling with the macro-heat transfer model and the bubble model for simulating both the dehydration and condensation behaviors of WG during low-temperature drying in the FBD. The experimental data were also collected for the model modification. Changes in the moisture content of WG, the air temperature of FBD chamber, and the temperature of WG during drying with different heating approaches were significantly different. The thermal input of WG drying with short heating time approach was one-third of that of WG drying with a traditional heating approach. The mathematical model developed in this study could predict the changes of the moisture content of WG and provide a good understanding of the condensation phenomena of WG during FBD drying.

Graphical Abstract

1. Introduction

Wheat germ (WG) is one of the wheat milling by-products. It is rich in many nutrients and bioactive compounds, thus, it is widely applied in bread, snack foods, and breakfast cereals [1]. Since WG contains phenolic compounds, it is also used to produce valuable antioxidant supplements [2]. However, fresh WG could easily undergo oxidative rancidity due to a high moisture content (MC), unsaturated fats, and endogenous enzymes, resulting in a limited shelf-life. Controlling the MC within a proper range or inactivating the enzymes is the key to preventing WG from deterioration, and consequently extending its shelf-life.
Several studies have been conducted to develop the suitable methods for WG stabilization, including short wave infrared radiation [3], gamma irradiation [4], roasting [5,6,7], steaming [8,9], microwave treatment [9,10,11,12], toasting [13,14], temperature controlled water-bath [11,12], sourdough fermentation [14], and fluidization method [9,15,16,17,18]. However, the processing temperature of these methods was high. High temperature processing not only imparted the color, flavor, and nutrients of WG but also affected the energy efficiency. In our research group, a low-temperature (<100 °C) drying process with a fluidized bed dryer (FBD) was developed for WG stabilization in order to prevent the loss of nutrients during processing [19]. FBD could introduce a high interface area of hot air on material and consequently reduce the drying temperature and time. However, low-temperature WG drying with FBD is complex in evaporation (dehydration at heating operation) and condensation (adsorption at cooling operation) behaviors, leading to an increase in the amount of trial and error in practice. Therefore, developing a mathematical model to simulate the evaporation and condensation of WG during the heating and cooling process is important for optimizing the operation of FBD.
Heat transfer between particles and air is complicated in the FBD [20]. The Davidson’s bubble model has been successfully applied to simulate the operational performance of FBD for chemical industry [20,21]. It provides helpful information between the macro fluid (air bubbles) and the micro fluid (suspended particles). The mass transfer equations for the thin-layer drying approach were used to calculate the MC of grain [22,23,24,25,26,27,28,29,30]. Thin-layer drying models for drying behaviors of biological products can be classified into three different types, namely, theoretical, semi-theoretical, and empirical models [26,27,28]. The theoretical type is generally derived from the Fick’s second law of diffusion with Arrhenius-type temperature dependent diffusivity or simultaneous heat and mass transfer equations [22,23,24,25,29]. The semi-theoretical type concerns the approximated theoretical equations, which is valid for the temperature, relative humidity, air velocity, and MC [29]. They can be categorized into the Lewis model, Page’s model, two-term model, Henderson and Pabis model, Thomson model, and the Wang and Singh model. An empirical type provides a direct relationship between average MC and time, but it neglects the physical correlation between the drying processes and their parameters [26]. Gili et al. [31] successfully developed an analytical series solution for the microscopic diffusion equations and applied a theoretical thin-layer model coupling with a macro-heat transfer model to predict the MC of WG during drying in the FBD. They also observed that the moisture loss occurred in the falling drying rate period for WG drying in the FBD. However, the condensation at the surface of WG was not investigated in these studies.
The objective of this study was to develop a theoretical thin-layer model coupled with the macro-heat transfer model and the bubble model for simulating both the dehydration and condensation of WG during low-temperature drying in the FBD. The experimental data of inlet air temperature and MC of WG during drying were also collected for the model verification in this study, in order to improve the accuracy of the prediction.

2. Materials and Methods

2.1. Materials

The raw WG was obtained from the local supplier in Taiwan and stored in a walk-in freezer at −20 °C immediately upon arrival. WG was tempered in an environment-controlled storeroom at 25 °C one day before the drying experiment. The particle size distribution of raw WG was measured by using the sieving process with the sieve trays of 50, 40, 30, 20 and 16 mesh sizes.

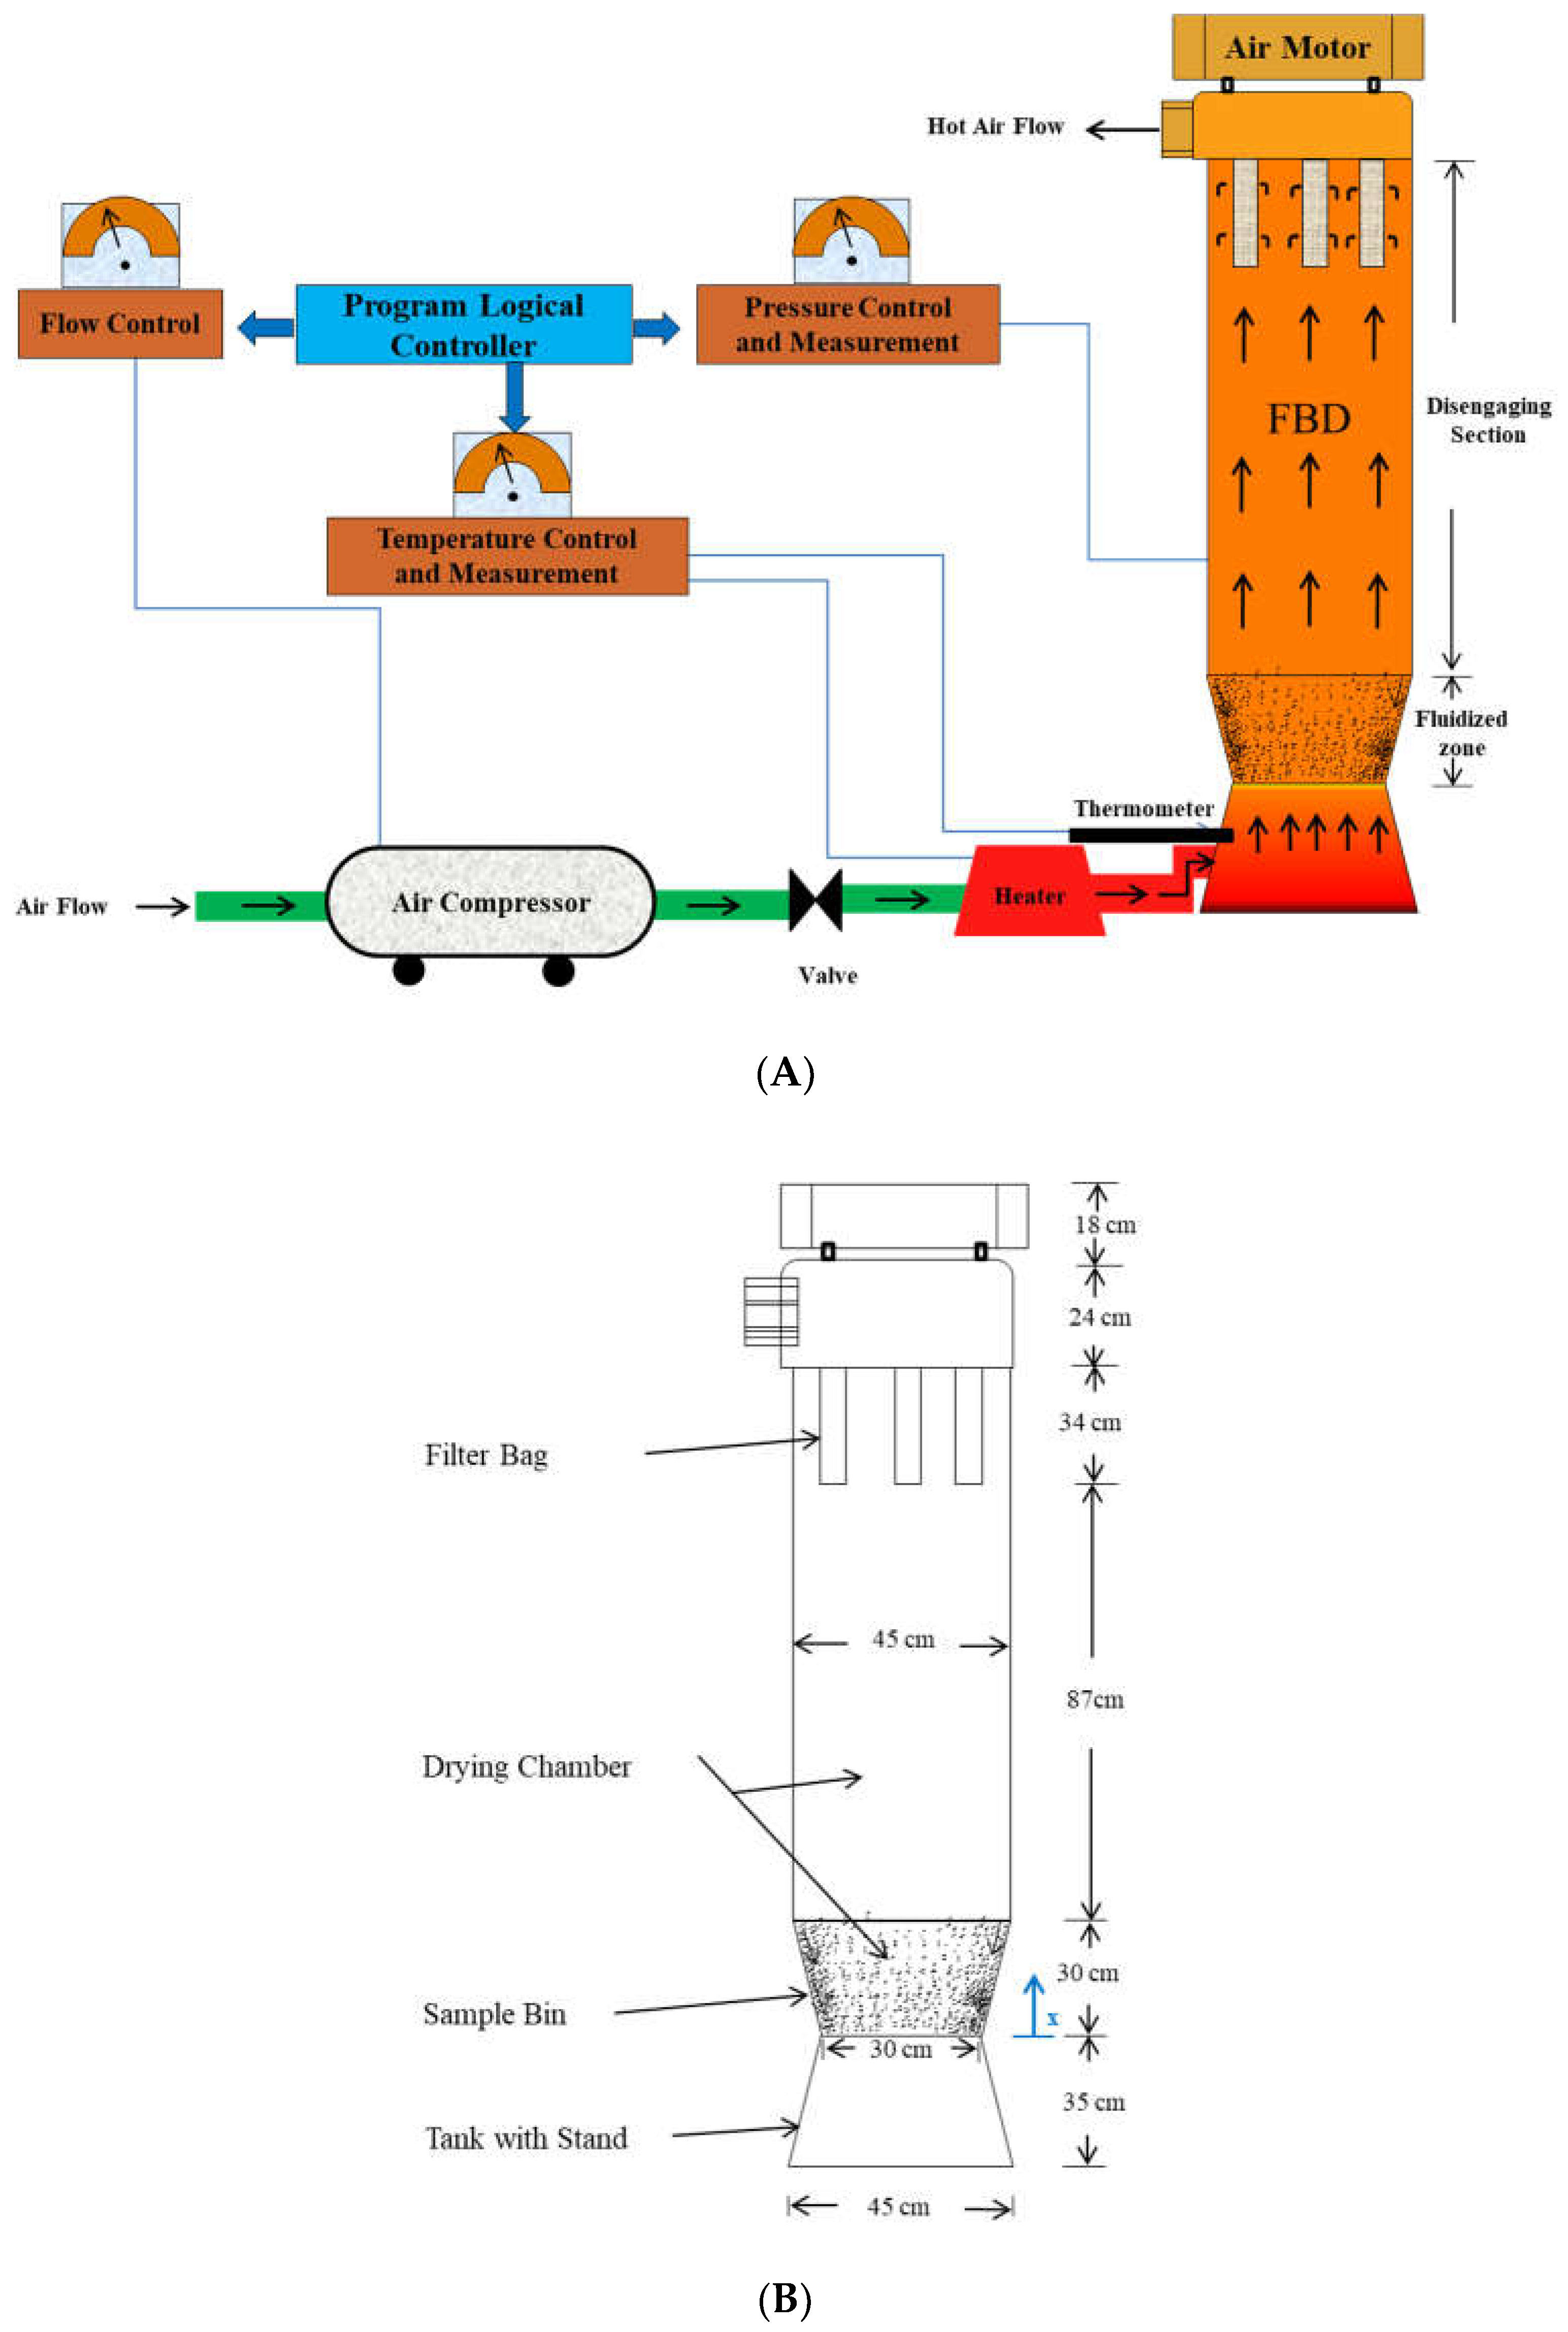
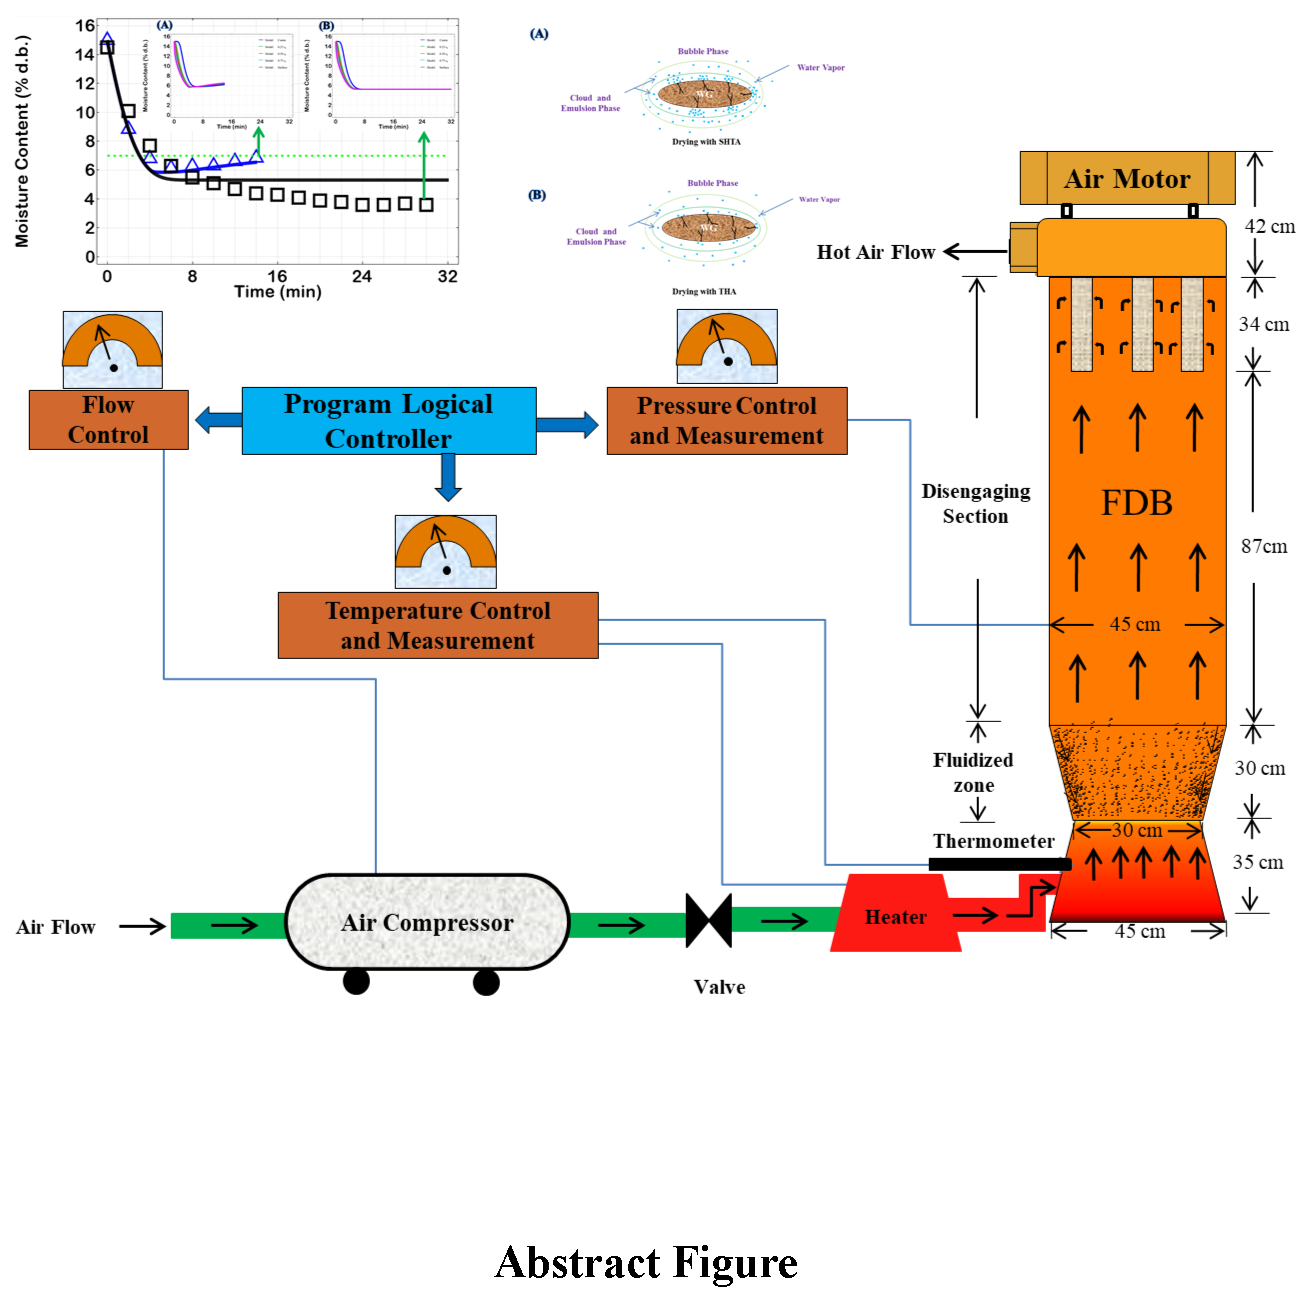
2.2. Fluidized Bed Dryer

A pilot-scale vertical FBD (Shia Machinery Industrial Co., Ltd., Taichung, Taiwan) with a height of 228 cm and a diameter of 45 cm was used for the drying of WG. The schematic diagram of the FBD is shown in Figure 1A. The FBD is made up of air compressor, heater, sample bin, drying chamber, filter bags, outlet air motor and inbuilt program logical controller. The dimensions of FBD are shown in Figure 1B. The surrounding air (about 25 °C) was first introduced into the heater by air compressor and passed through the bottom of FBD to the sample bin and drying chamber, and then flowed up to the filter bags. Finally, the air was exhausted to atmosphere. There are a total of seven filter bags positioned at the top part of the drying chamber to prevent the samples from escaping the chamber. The inlet air flow velocity was measured with a gas flow transmitter (LABO-FG, GHM Messtechnik GmbH, Erolzheim, Germany).
Once the velocity of air reached 1.2 m/s, the WG particles were loosened from the bottom of the sample bin and started to swirl and expand with air in the FBD. Practically, the 2 kg WG sample was fluidized at a height of 30 cm from the bottom of the sample bin with 1.2 m/s air velocity.

2.3. Drying Experiment

Both short heating time approach (SHTA) and traditional heating approach (THA) were conducted to dry the WG using FBD at 80 °C. The entire drying process was divided into four stages, preheating, sample loading, heating, and cooling (Table 1). The temperature of FDB chamber was controlled at 80 °C and preheated for 10 min to ensure an equilibrium condition. The 2 kg WG sample was spread as a thin layer (5 cm) on the bottom of the sample bin. After loading, the WG sample was heated at 80 °C for two different times, 4 min (SHTA) and 25 min (THA). In order to obtain a final product temperature of around 40 °C, the cooling time of SHTA and THA were 10 min and 4 min, respectively.

2.4. Analytical Methods

The changes of inlet air temperature, air humidity, and MC of WG during drying process were measured. The air humidity was measured by the thermal hygrometer (Testo 635, Testo Inc., Lenzkirch, Germary). The temperature of inlet air was measured by the K-type thermometer (Tecpel 318, Tecpel Co., Ltd., Taipei, Taiwan). The MC of WG was measured according to the American Association of Cereal Chemists (AACC) Method 44-19 [32]. 2 g ± 1 mg of the sample was dried at 135 °C for 2 h. Moreover, the protein, fat, and ash contents of WG were measured according to the AACC Methods 46-12, 30-25, and 08-03 [32], respectively.

3. Mathematical Modelling

3.1. Governing Equations and Assumptions

Due to the existence of temperature gradient on WG surface, the heat transfer takes place by conduction from the surface to the inside of WG and leads to moisture evaporation. The water vapor diffuses in an opposite direction from the inside to the surface of WG. The water vapor diffusion occurs in the micro pores of WG particles. Accordingly, the bubble model was developed in this study to link the information between the microscopic and the macroscopic heat and mass transfer for WG drying process. This model divided the fine particles distributed within the FBD chamber into three phases, including bubble phase, cloud phase, and emulsion phase. The bubble phase was the gas phase; the cloud phase was the gas phase with thin WG particles; the emulsion phase was the gas phase with dense WG particles [20]. However, WG drying in the FBD is a complex phenomenon because the heat transfer and mass transfer simultaneously occur. Thus, the microscopic assumptions (Terms (1)–(3)) and the macroscopic assumptions (Terms (4)–(10)) are made in this study as follows:
(1)
All particles of WG are uniform in size and shape [33].
(2)
All particles of WG have the same MC.
(3)
Volume shrinkage of WG is negligible during drying [22,23].
(4)
Horizontal variation of air temperature and humidity in the FBD are negligible [22,23].
(5)
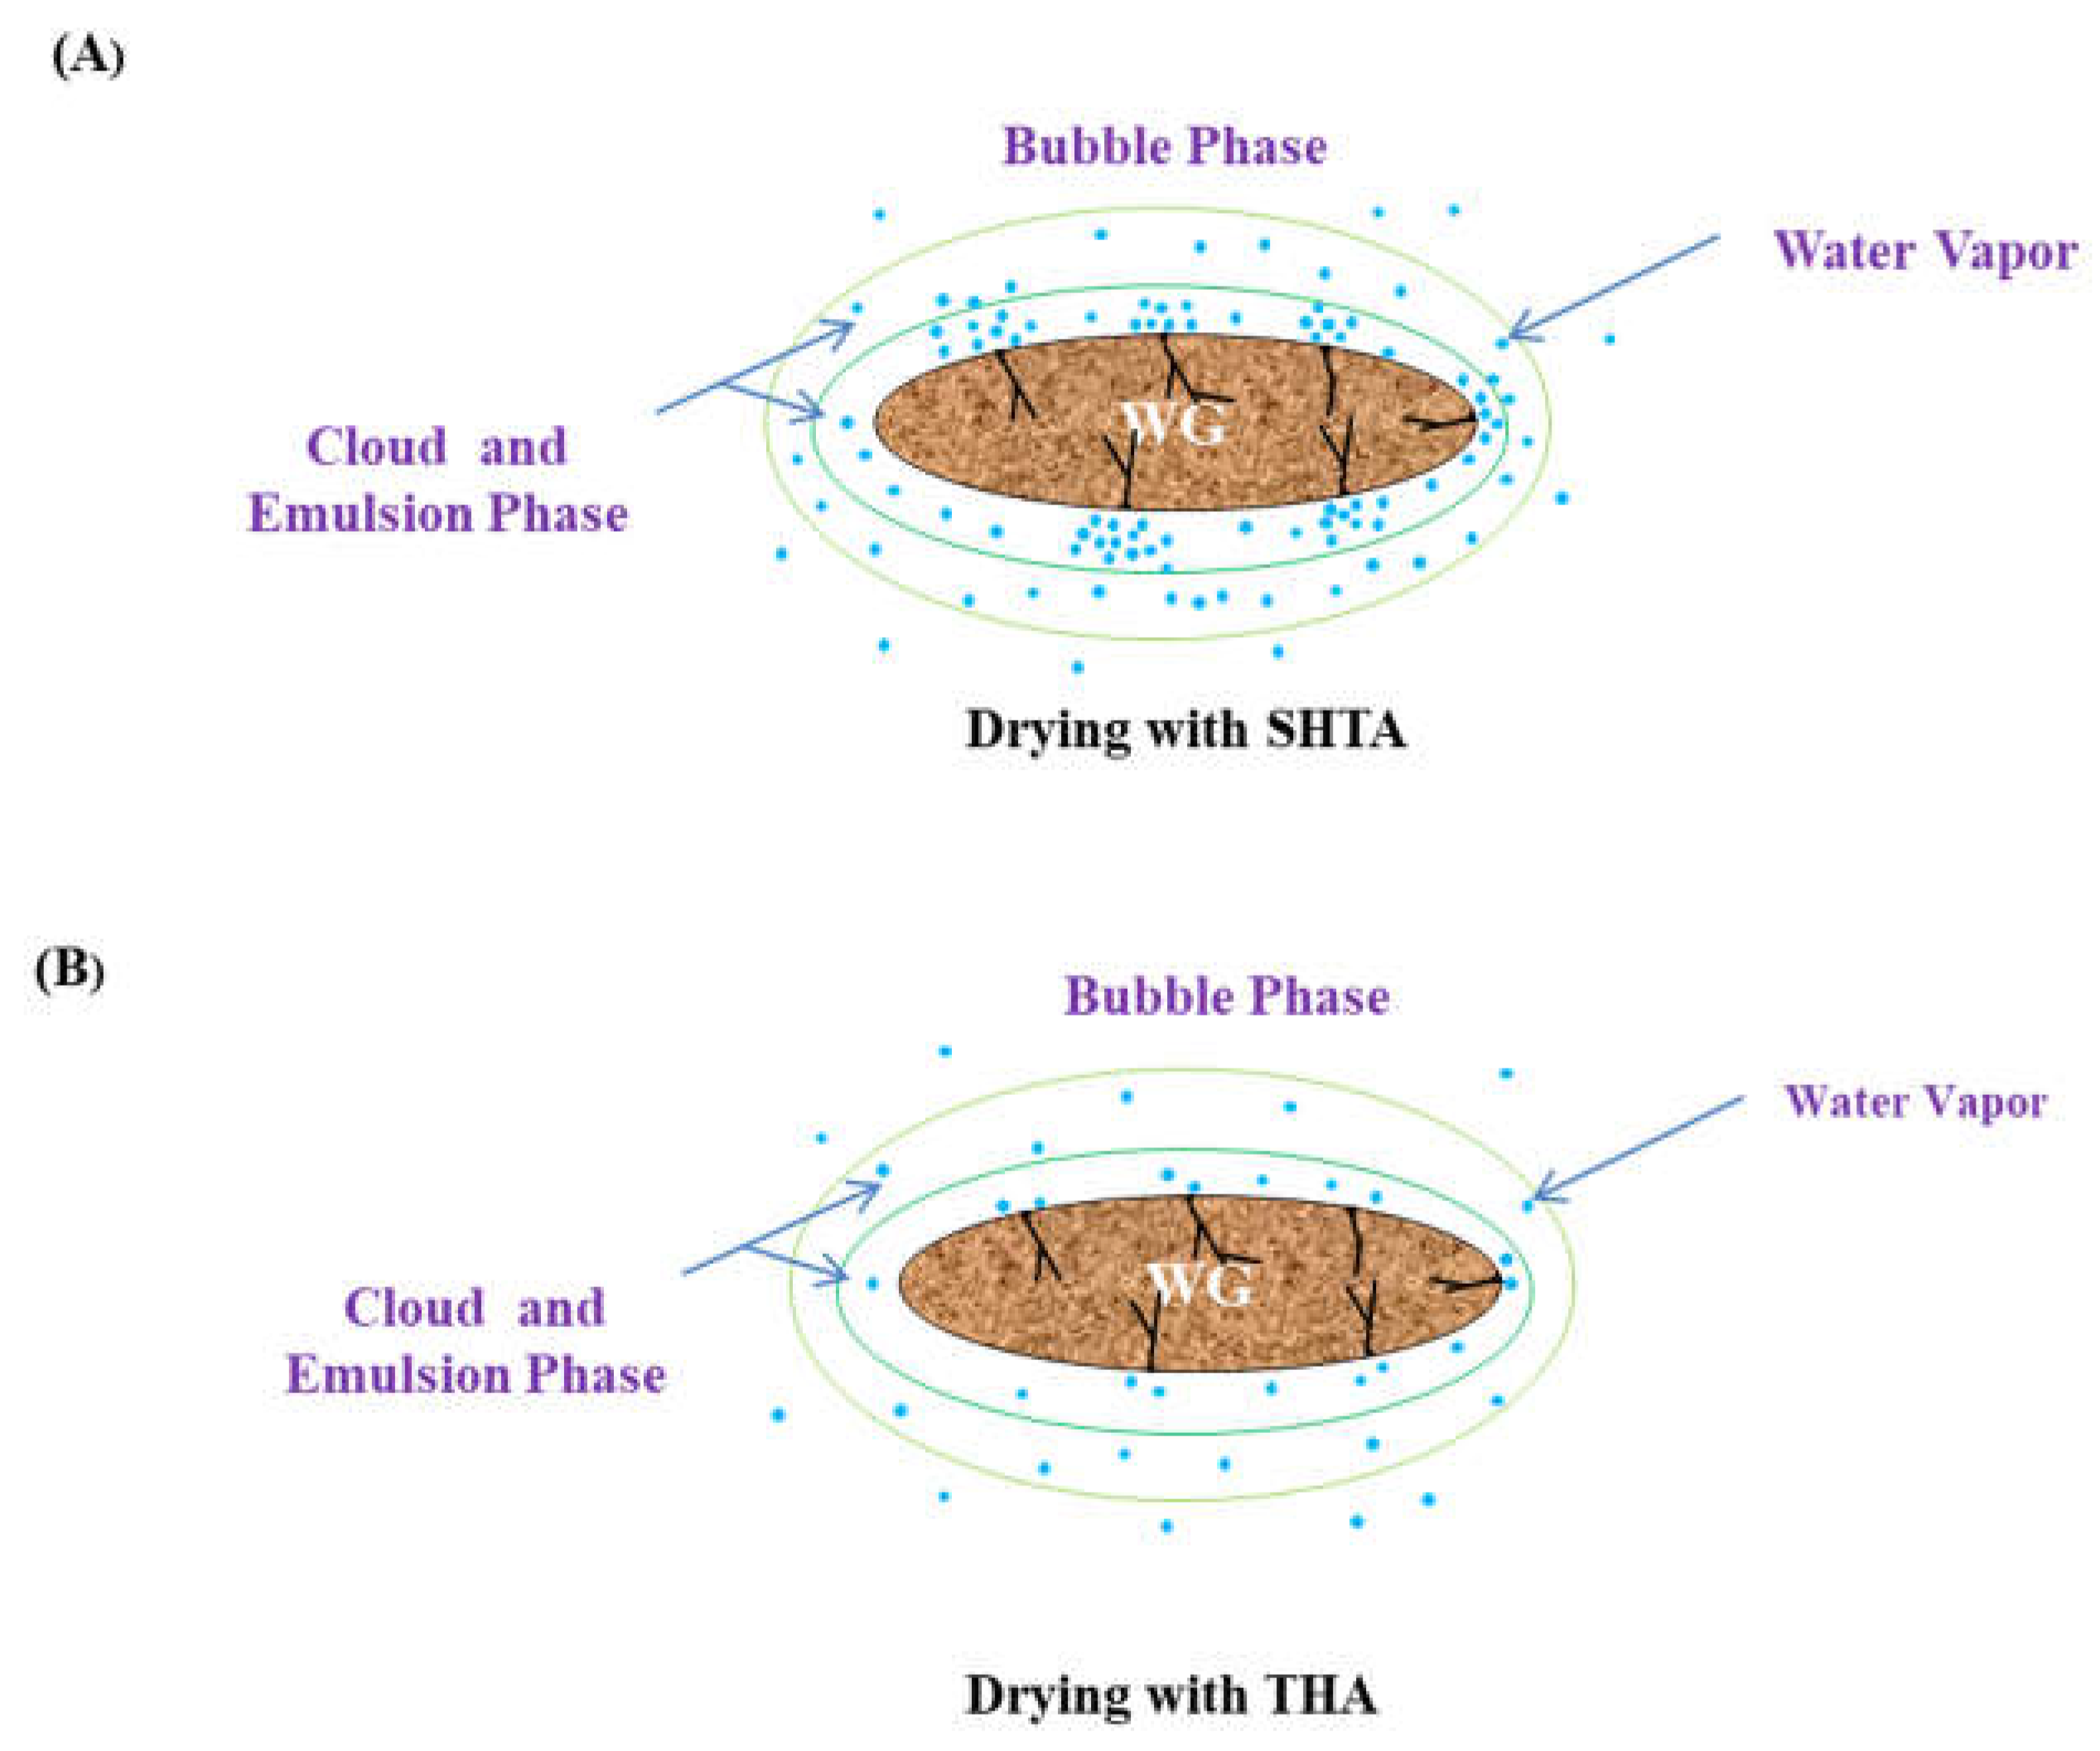
Cloud phase and emulsion phase are within one region [20].
(6)
Plug flow model is applied for air and mixed flow model is applied for emulsion phase.
(7)
The emulsion phase stays at minimum fluidizing conditions [21].
(8)
The size of bubble phase is uniform within the FBD [21].
(9)
The difference in temperature between emulsion phase and bubble phase is negligible.
(10)
Evaporation mechanism terminates during cooling.
Based on the above assumptions, the heat and mass transfer equations, including initial and boundary conditions are developed to estimate the heat and mass transfers in the FBD during WG drying. The equations for simulation the changes of MC and heat in WG, emulsion phase, and bubble phase during drying are developed in this study as well. In the microscopic point view, the r is the radial coordinate from the center to the surface of WG particle. The x axis is oriented from the base to the top of the FBD (Figure 1B). In macroscopic point of view, the balance of mass and temperature depend on the position x and the drying time t.

3.1.1. Microscopic Energy Balance of Wheat Germ Particles

The energy balance equation for the WG particles is given by:
ρ g C P , g T g t = 1 r 2 r ( r 2 k g T g r )
Initial condition:
T g = T g i   for   0 r r g
Boundary conditions:
T g r = 0   for   r = 0
k g T g r = h ( T e T g ) + λ D e C m g r   for   r = r g
where ρg is the density of WG; Cp,g is the specific heat of WG; kg is the thermal conductivity of WG; T g i is the initial WG temperature; r g is the radius of WG; h is the convective heat transfer coefficient; T e is the emulsion phase temperature in °C.

3.1.2. Microscopic Mass Balance of Wheat Germ Particles

The mass balance equation for the WG particles is given in Equation (5).
C m g t = 1 r 2 r ( r 2 D e C m g r )
Initial condition:
C m g = W L X w i M w V T   for   0 r r g
Boundary conditions:
C m g r = 0   for   r = 0
D e C m g r = K d e ( C m g C e ) f d e + K c o n ( C m e C s a t ) f c o n   for   r = r g
where D e is the effective diffusivity of water in WG; W L is the loading of WG; X w i is the initial MC of WG; M w is the water molecular weight; V T is the volume of fluidization; K d e is the bubble-emulsion mass transfer coefficient for dehydration; Cmg is the concentration of moisture in WG; C e is the equilibrium MC of WG; f d e is the step numerical parameter for dehydration; K c o n is the bubble-emulsion mass transfer coefficient for condensation; Cme is the concentration of moisture in emulsion phase; C s a t is the saturation concentration; f c o n is the step numerical parameter for condensation. The equilibrium MC of WG; C e is modified according to Giner and Calvelo [34] as
C e ( R H , T e ) = 1 100 [ ln ( 1 R H ) 1.2310 5 ( T e + 65.8 ) ] n
where R H is the relative humidity in the FBD; n is the constant coefficient.

3.1.3. Macroscopic Energy Balance of Emulsion Phase

The energy balance equation of emulsion phase in the FBD during drying is given in Equation (10).
ρ e m C P , e ( T e t + u T e x ) = x ( k e m T e x ) A g ( 1 φ b ) ( k g T g r )
Initial condition:
T e = T i   for   0 x H f
Boundary conditions:
T e = T i n   for   x = 0
T e x = 0   for   x = H f
where ρ e m is the density of emulsion phase; C P , e is the specific heat of emulsion phase; k e m is the thermal conductivity of emulsion phase; A g is the surface area per unit volume of WG; φ b is the porosity of fluidized bed; T i is the initial temperature of emulsion phase; H f is the height of fluidization; T i n is the inlet temperature of emulsion phase.

3.1.4. Macroscopic Mass Balance of Emulsion Phase

The mass balance equation of emulsion phase in the FBD during frying is given by:
C m e t = x ( D v C m e x ) A g ( 1 φ b ) ( D e C m g r ) R d l
Initial condition:
C m e = R H i P s a t ( T i ) R T T i   for   0 x H f
Boundary conditions:
C m e = R H i n P s a t ( T i n ) R T T i n   for   x = 0
C m e x = 0   for   x = H f
where D v is the diffusivity of water vapor; R d l is the rate of mass transfer between bubble and emulsion; R H i is the initial relative humidity of air in the fluidized bed; P s a t ( T i ) is the saturated vapor pressure of water and is the function of initial temperature; R T is the gas constant; T i is the initial air temperature in the fluidized bed; R H i n is the inlet relative humidity of air; P s a t ( T i n ) is the saturated vapor pressure of water and the function of inlet temperature. P s a t ( T ) is calculated according to Naghavi et al. [25] as
P s a t ( T ) = 0.1 exp ( 27.0214 6887 T 5.31 ln ( T 273.15 ) )
The cloud phase and the emulsion phase are considered as perfectly mixed [21]. The rate of mass transfer is modified as
Rdl = Kbe (CmeCmb)
where Kbe is the mass transfer coefficient between bubble and emulsion; Cmb is the concentration of moisture in bubble phase.

3.1.5. Macroscopic Mass Balance of Bubble Phase

The mass balance equation of bubble phase in the FBD during frying is given by:
C m b t + u C m b x = x ( D v C m b x ) + R d l
Initial condition:
C m b = R H i P s a t ( T i ) R T T i   for   0 x H f
Boundary conditions:
C m b = R H i n P s a t ( T i n ) R T T i n   for   x = 0
C m b x = 0   for   x = H f

3.2. Material Properties of Wheat Germ

3.2.1. Density, Heat Capacity, and Thermal Conductivity Properties of Wheat Germ

The chemical compositions of WG is complex, including moisture, protein, fat, carbohydrate, and ash. In the present study, the effective properties of WG, including density, heat capacity, thermal conductivity, and diffusivity, were estimated using a mass fraction averaged mixing rule [35] based on the compositions and the local temperature (Table 2). The temperature is expressed in °C.

3.2.2. Diffusivity of Moisture in Wheat Germ

The diffusivity of moisture depends on temperature [34]
D e = D o exp ( E a R g T g )
where E a is the activation energy of water diffusion in the WG.

3.3. Thermal Input for Drying Process

When WG was dried in the FBD, the energy must be transferred from the hot air to the surface of WG. The air temperature highly depends on the heater power. The surface temperature of WG is governed by the difference between air temperature and surface temperature of WG and the physicochemical properties of WG. The time–temperature curve of bread baking [36] was used to assess the thermal input (TI) in this study. For example, the combination of temperature and time was subjected during drying as
T I = 0 t T g d t

3.4. Numerical Step Function for Condensation

A numerical approach for the step function was employed to describe the condensation of WG, i.e., the temperature of emulsion phase is smaller than the WG temperature [37]
f c o n = { 0 if   T g < T e 1 if   T g T e
Based on the assumption (10), a step function, fde, for evaporation is obtained
f d e = 1 f c o n

4. Results and Discussion

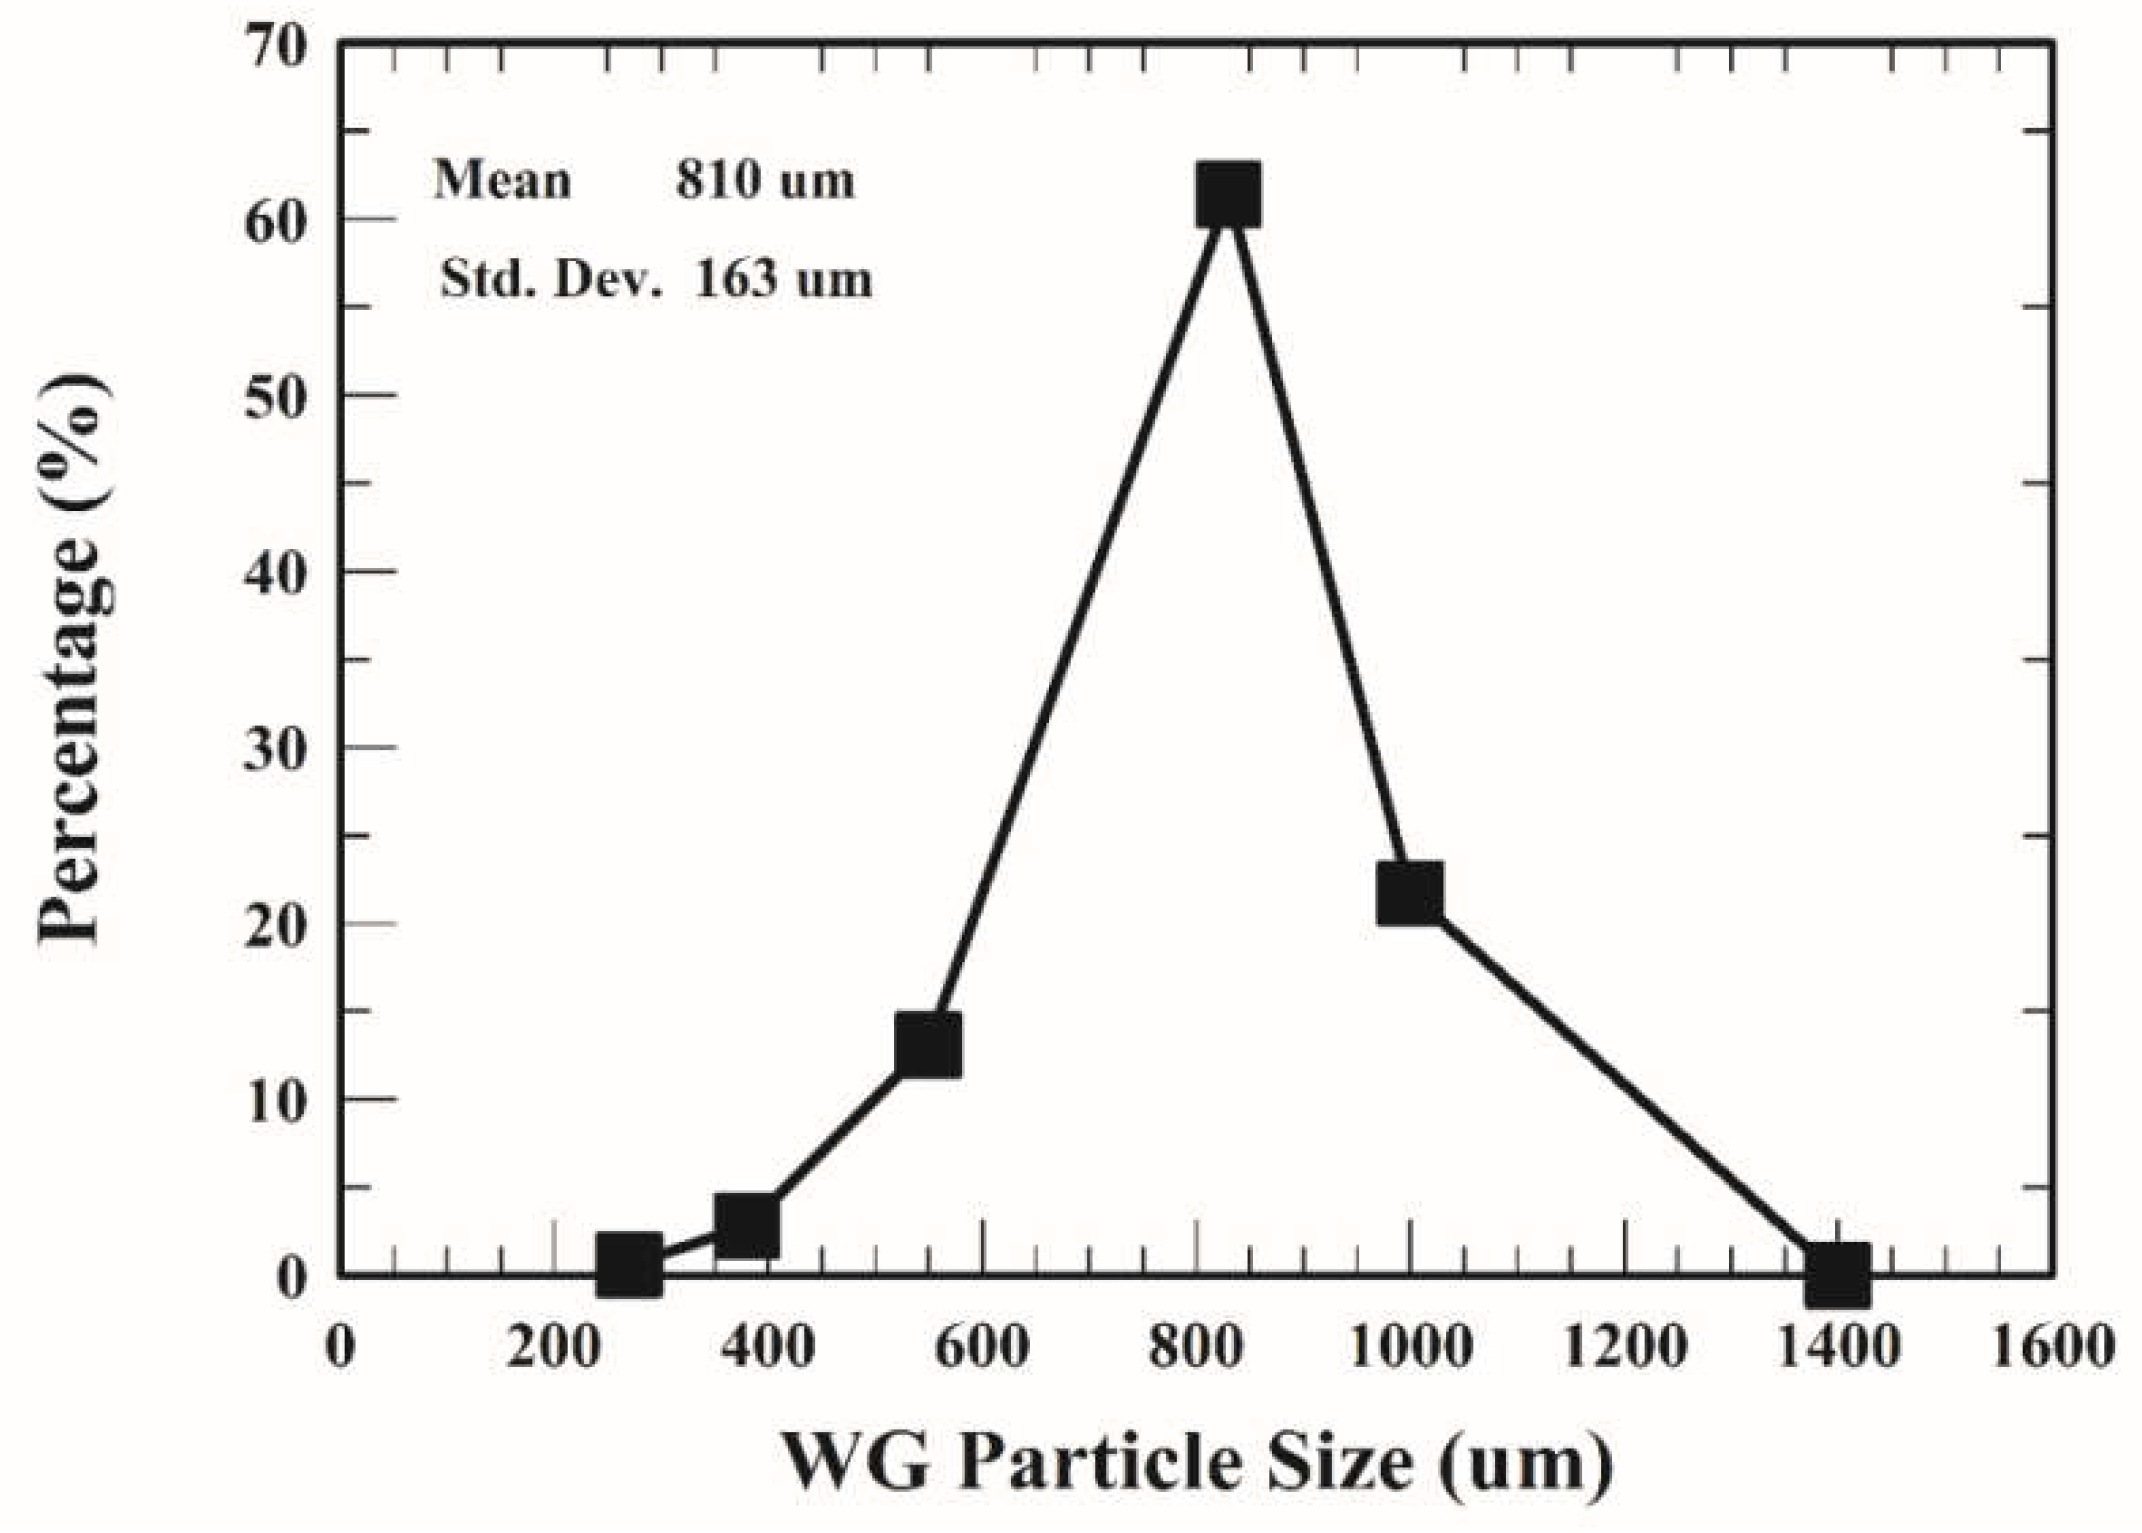
4.1. Physical Dimensions and Chemical Composition of Wheat Germ

The particle size distribution of WG is shown in Figure 2. There were about 67% of WG particles within the size range of 643–973 μm. The physical dimensions of WG with the average of 20 particles were 985 μm and 689 μm in long axis and short axis, respectively. The equivalent diameter (Deg) could be calculated based on the results of Figure 2 using a weight fraction averaged mixing rule. Thus, the Deg of WG particles was 810 μm. The diameter of WG particles observed by Gili et al. [30] was in the range between 766 μm and 1223 μm, and their result was similar to our study. According to Srinivasakannan and Balasubramanian [33], the ratio of surface area to volume (Ag) of WG could be calculated by 6/Deg. Therefore, the Ag of WG particles was 7407 1/m.
The chemical composition of WG is shown in Table 3. The WG comprised 13.2% moisture, 9.0% fat, 5.9% ash, 24.1% protein, and 48.2% carbohydrate. The above results are similar to other studies [1,4,38].

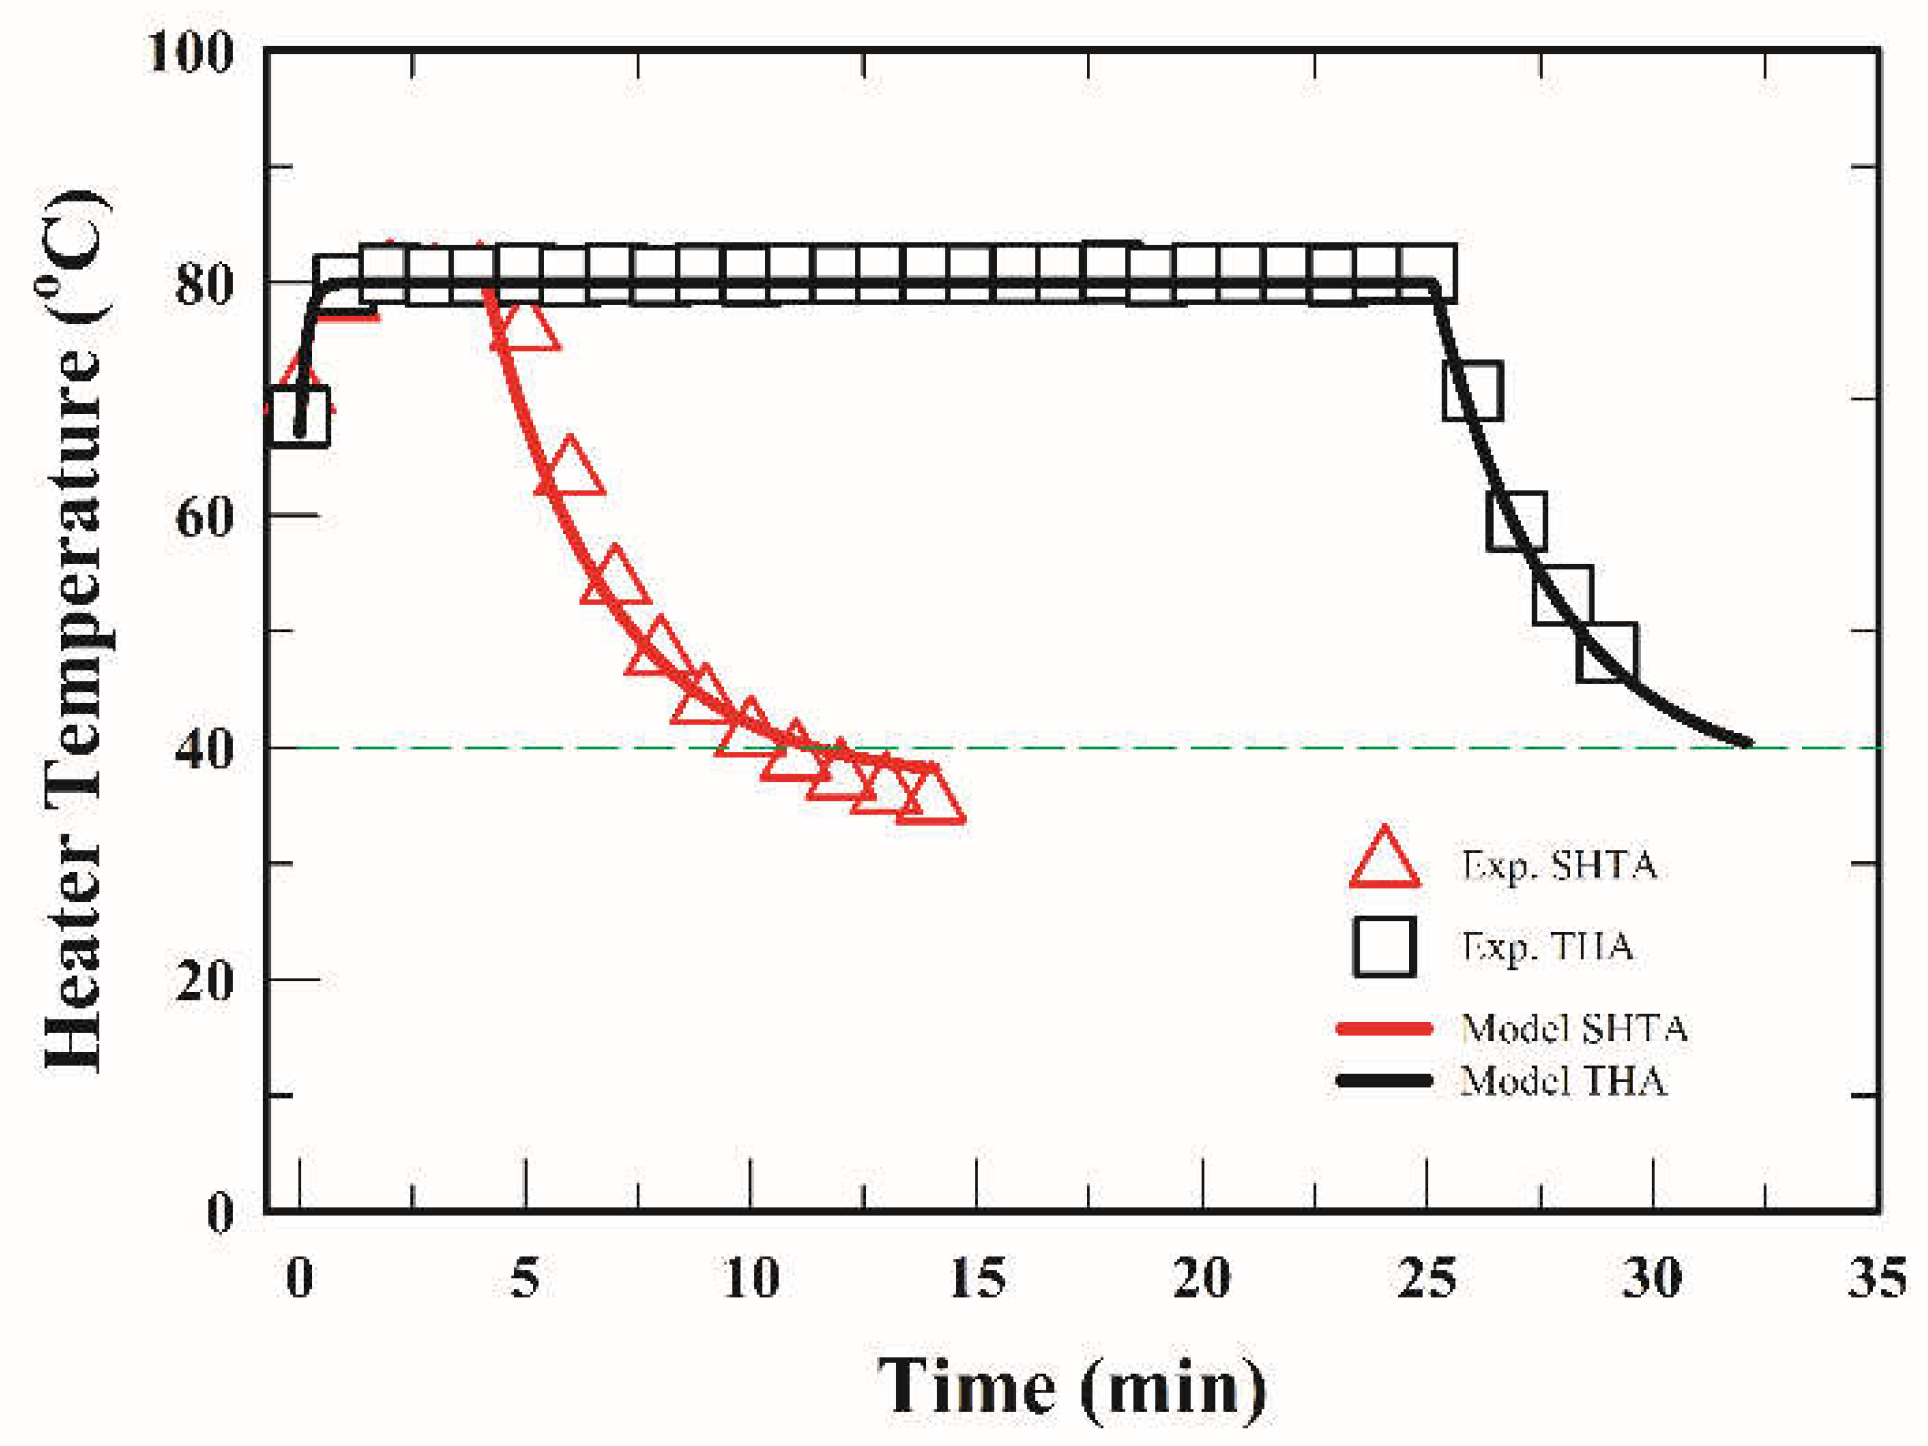
4.2. Simulation of the Inlet Air Temperature of FBD

In order to consider the effect of heater on the inlet air temperature of FBD, a function, Theater, is defined. The equations used to simulate the Theater are
Theater = Sheating × fstep + Scooling × (1 − fstep)
Sheating = Tstart + (TsTstart) × (1.0 − exp(−2.0t/20))
Scooling = 310.15 + 1.01 × (Ts − 310.15) × exp(−0.6 × (tth)/240)
where Sheating is the temperature at the heating stage; Scooling is the temperature at the cooling stage; fstep is the step function; Tstart is the measured temperature (67 °C) at the sample loading stage; th is the heating time; Ts is the set temperature (80 °C). The step function is expressed as
f s t e p = { 1 if   t < t h 0 if   t t h
The experimental data and the predicted values of the inlet air temperature (the heater temperature) during drying at 80 °C in the FBD are shown in Figure 3. The predicted values calculated by the Equations (27)–(30) were consistent well with the experimental data. Therefore, Theater could be applied to employ a boundary condition of heat equations for simulation.

4.3. Macroscopic Behavior

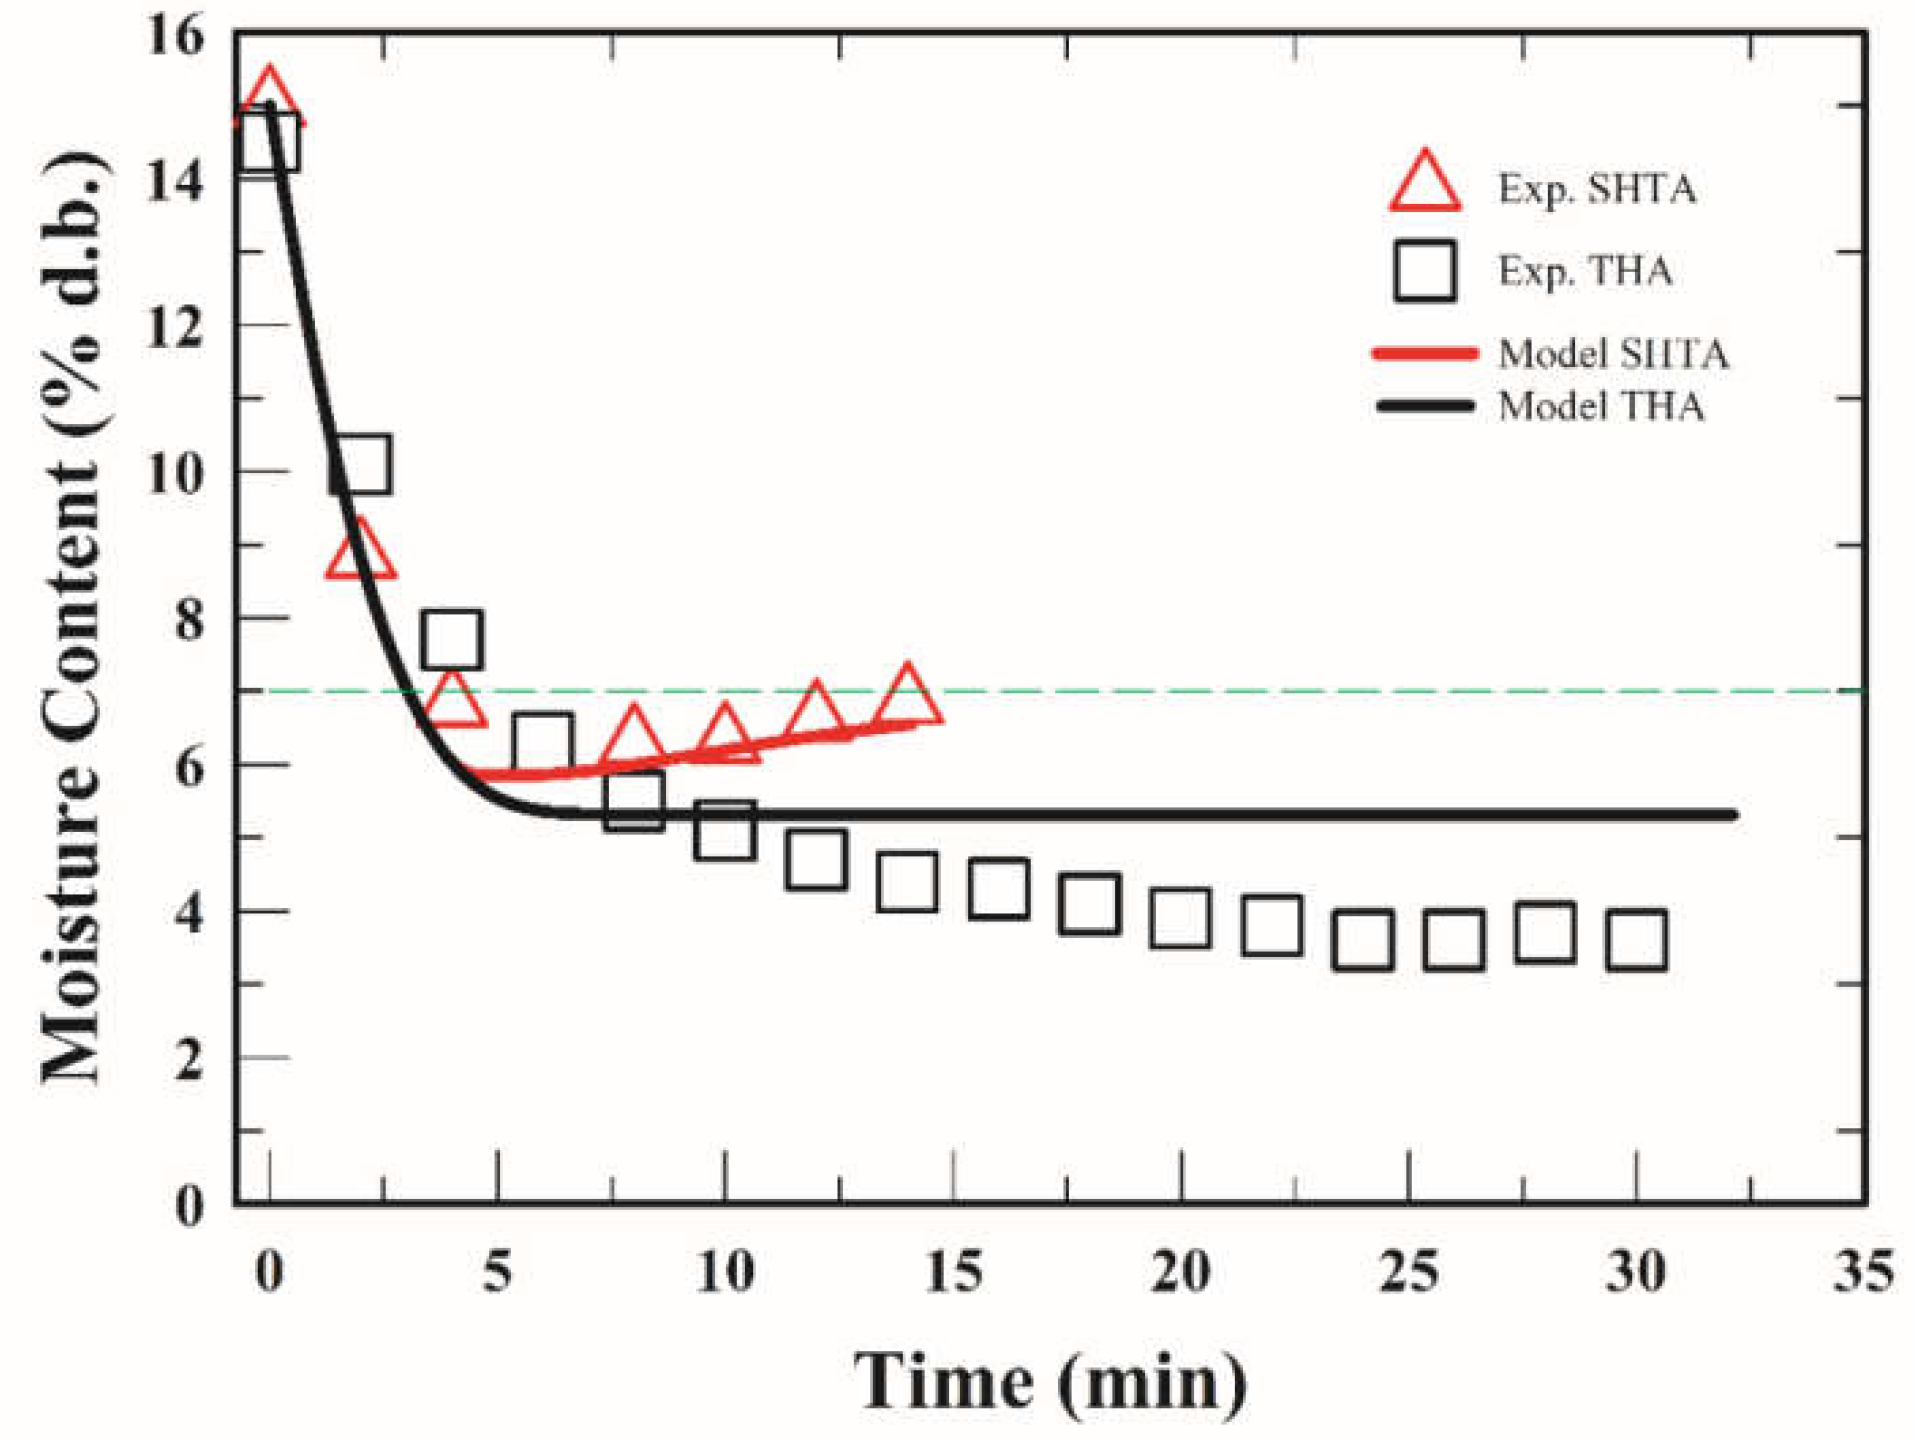
4.3.1. Response of the Moisture Content of Wheat Germ

It is important to simulate the changes of the MC of WG during drying with SHTA and THA in the FBD in order to control the quality of the final product. The experimental data and the predicted values of the MC of WG during drying at 80 °C in the FBD are illustrated in Figure 4. The experimental results revealed that the MC of WG drastically decreased to a minimal value of 6.0% at the heating stage with SHTA. Furthermore, the MC of WG slightly increased at the cooling stage. The MC of WG decreased sharply at the early stage of heating with THA and reduced gradually until 25 min of heating. According to Gili et al. [30], the MC of WG should be controlled within 5–8% to avoid spoilage. The SHTA applied in this study required longer cooling time to achieve this goal, but not THA.
The nonlinear partial differential equations presented in the mathematical model at Section 3 were solved by using COMSOL Multiphysics 5.1 with a finite element method. The model parameters listed in Table 4 are given for simulation. The local sensitivity analysis approach was used to verify the model parameter. The criterion of the model verification was calculated by using the minimum of the absolute average deviation (AAD) [31]. The equation is defined as
AAD = M i n ( 1 n j = 1 n | M C exp , j M C p r e , j | )
The mass transfer coefficient for condensation ( K c o n ) was the important parameter to predict the MC of WG during drying in the FBD. Therefore, the local impact of K c o n parameter was evaluated. Table 5 demonstrates the changes in the experimental MC, predicted MC of WG with different values of K c o n parameter, and the corresponding AAD values during drying. The values of AAD ranging from 0.23 to 0.74 were observed. The minimum value of AAD occurred when the value of K c o n parameter was 4.5 × 10⁻³ m/s. Accordingly, this value was selected to predict the MC of WG in this study.
The predicted values of the MC of WG during drying in the FBD were shown in Figure 4. The predicted values were consistent well with the experimental data of SHTA, indicating that the model is able to characterize the physical phenomenon of WG at the heating and cooling stages and predict the changes of the MC of WG during drying very well. Moreover, the predicted values of THA drying were slightly higher than the experimental data. In this study, the equilibrium MC of WG (Equation (9)) was used to fit different operating temperature, but it was not proper to simulate the MC of WG for longer drying time.

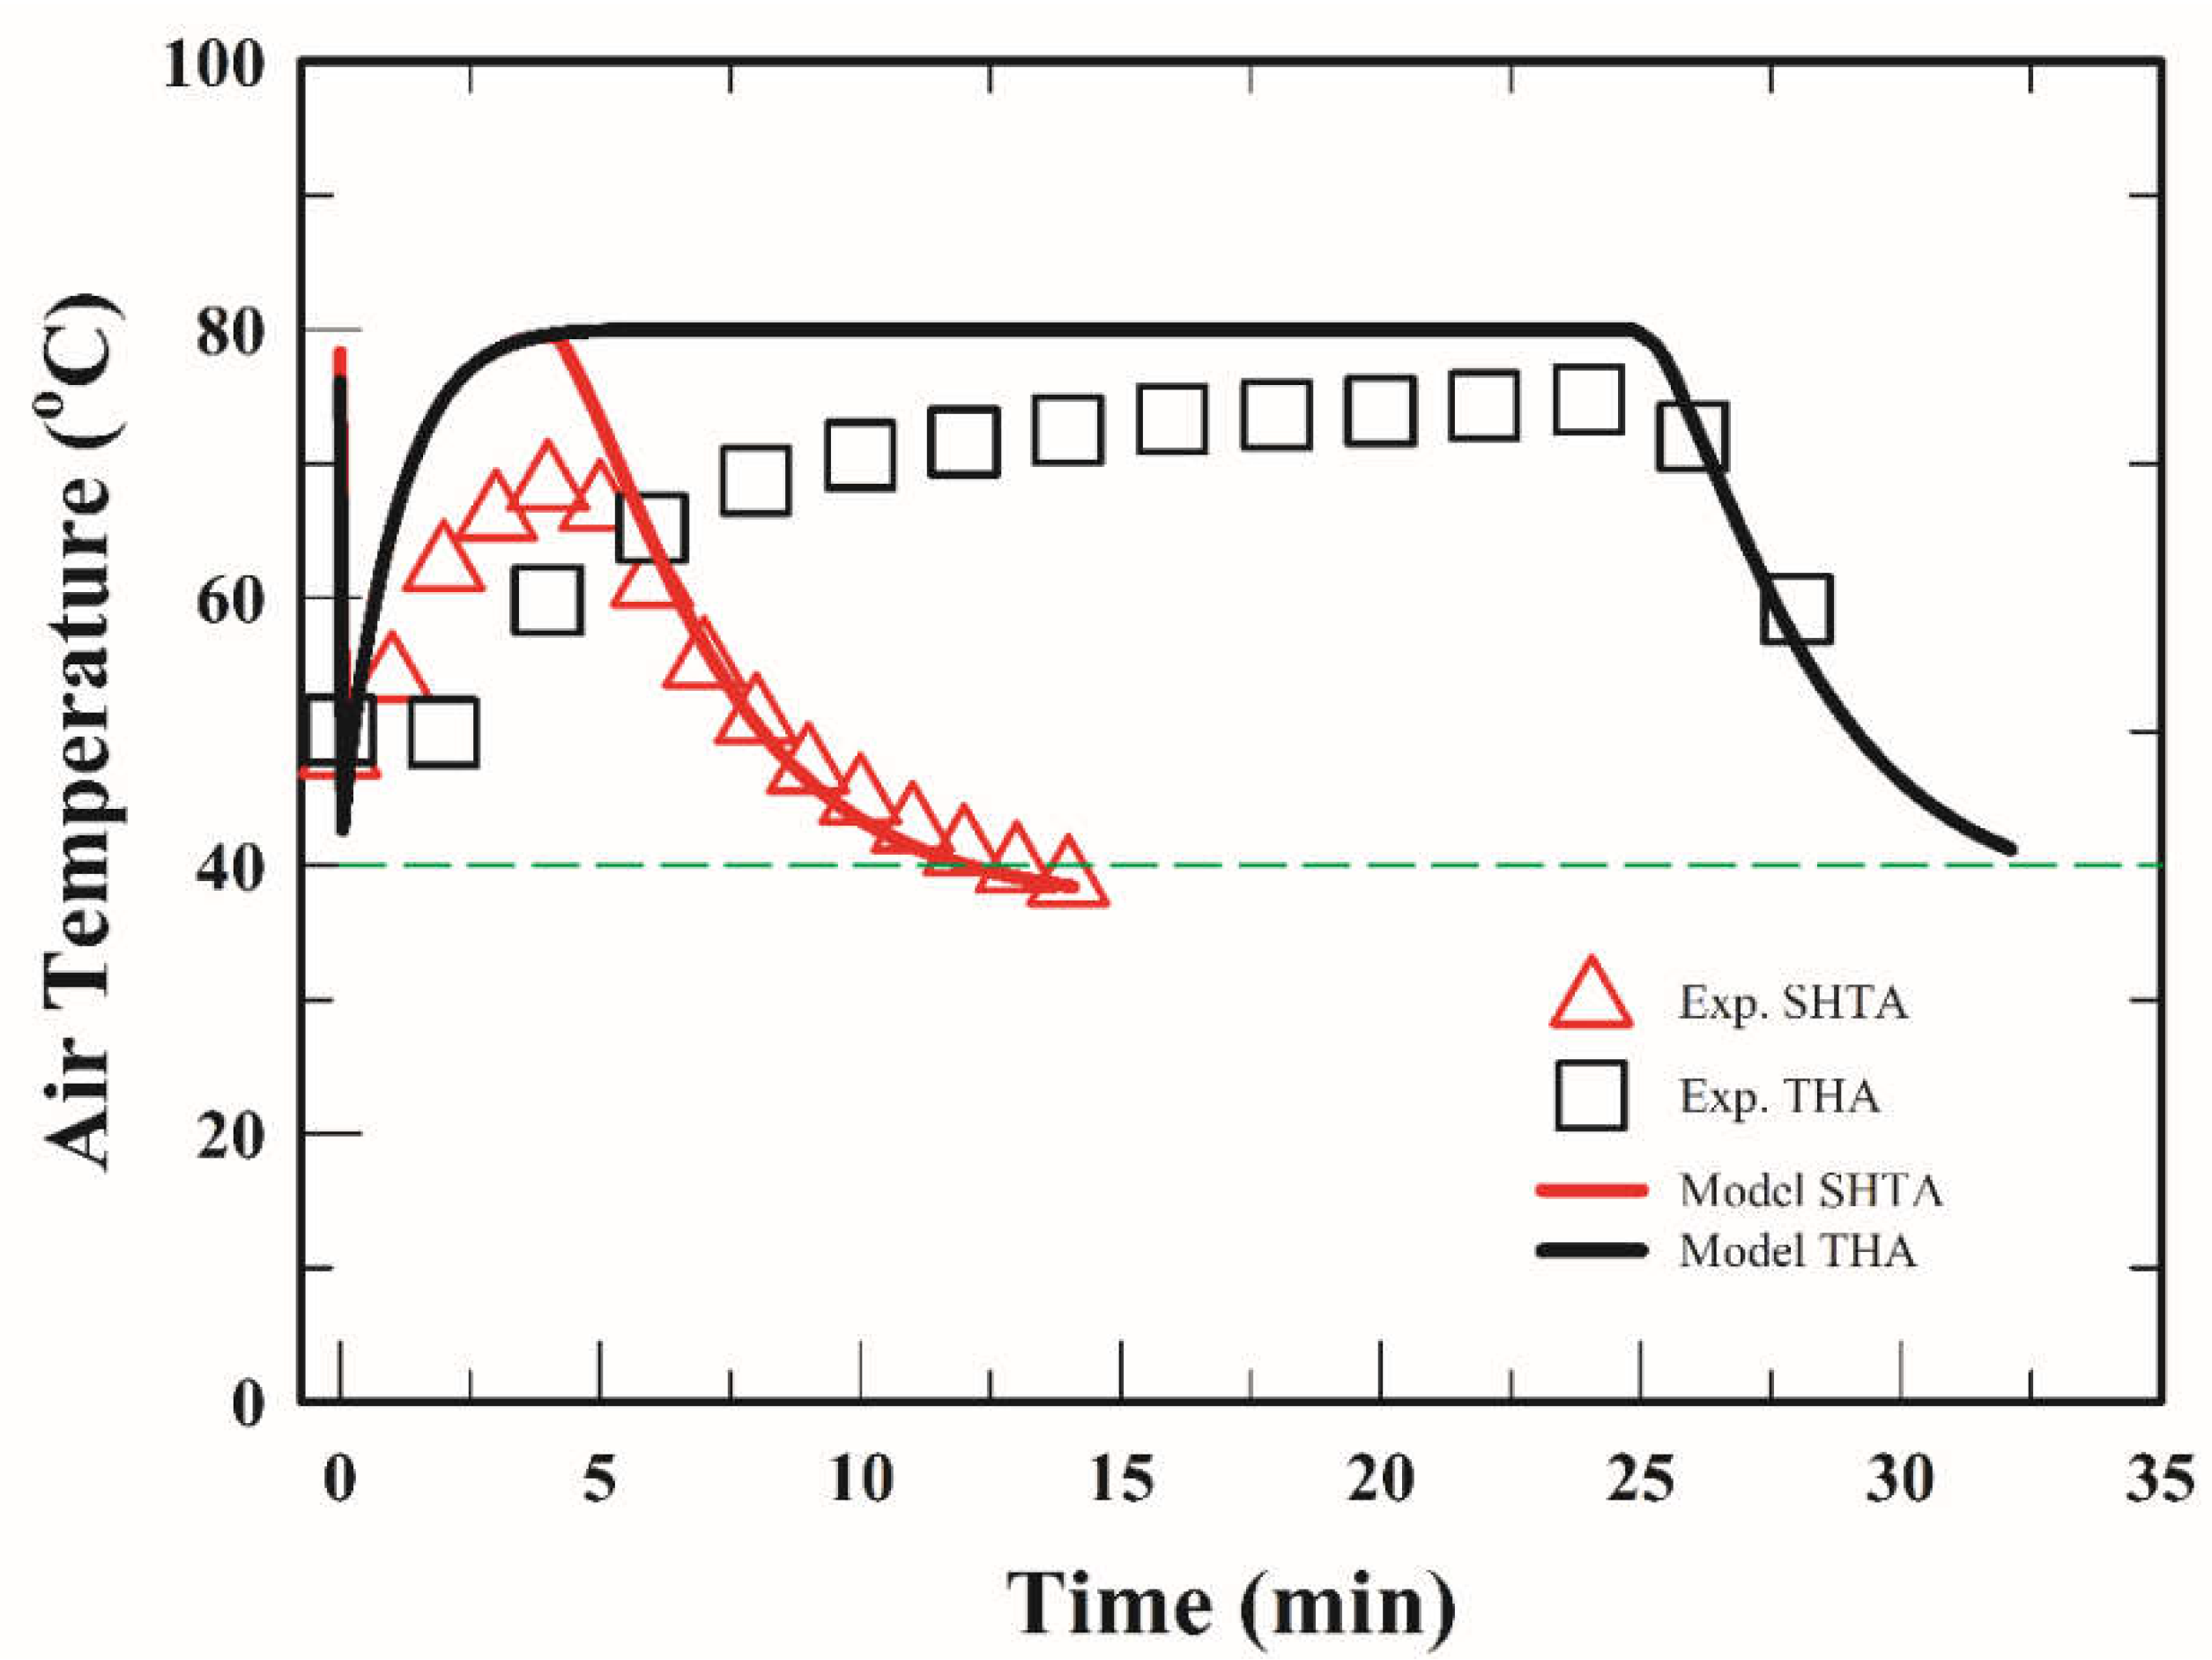
4.3.2. Responses of the Air Temperature in the FBD Chamber

The experimental data (at 1/2 height of FBD, about 70 cm above the bottom of bin) and the simulated average values of air temperature in the FBD chamber during drying at 80 °C with SHTA and THA are shown in Figure 5. During the loading of WG, the air temperature in the FBD chamber rapidly dropped from 80 °C, and then it increased gradually because the heat continuously transferred from the heater to the air. After 4-min heating with SHTA, the air temperature reached maximum of 70 °C. During cooling, the air temperatures quickly dropped to a lower level. The air temperature in the FBD chamber with THA drying reached maximum of 72 °C after 25 min. Comparing with Figure 3 and Figure 5, the air temperature in the FBD chamber strongly depends on the inlet air temperature (heater temperature). The simulated average air temperatures were slightly higher than the experimental data at the heating stage and were congruous with the experimental data at the cooling stage (Figure 5). The FBD height used for simulation was 30 cm which was closer to the heater, thus, the simulated air temperature was higher at the heating stage.

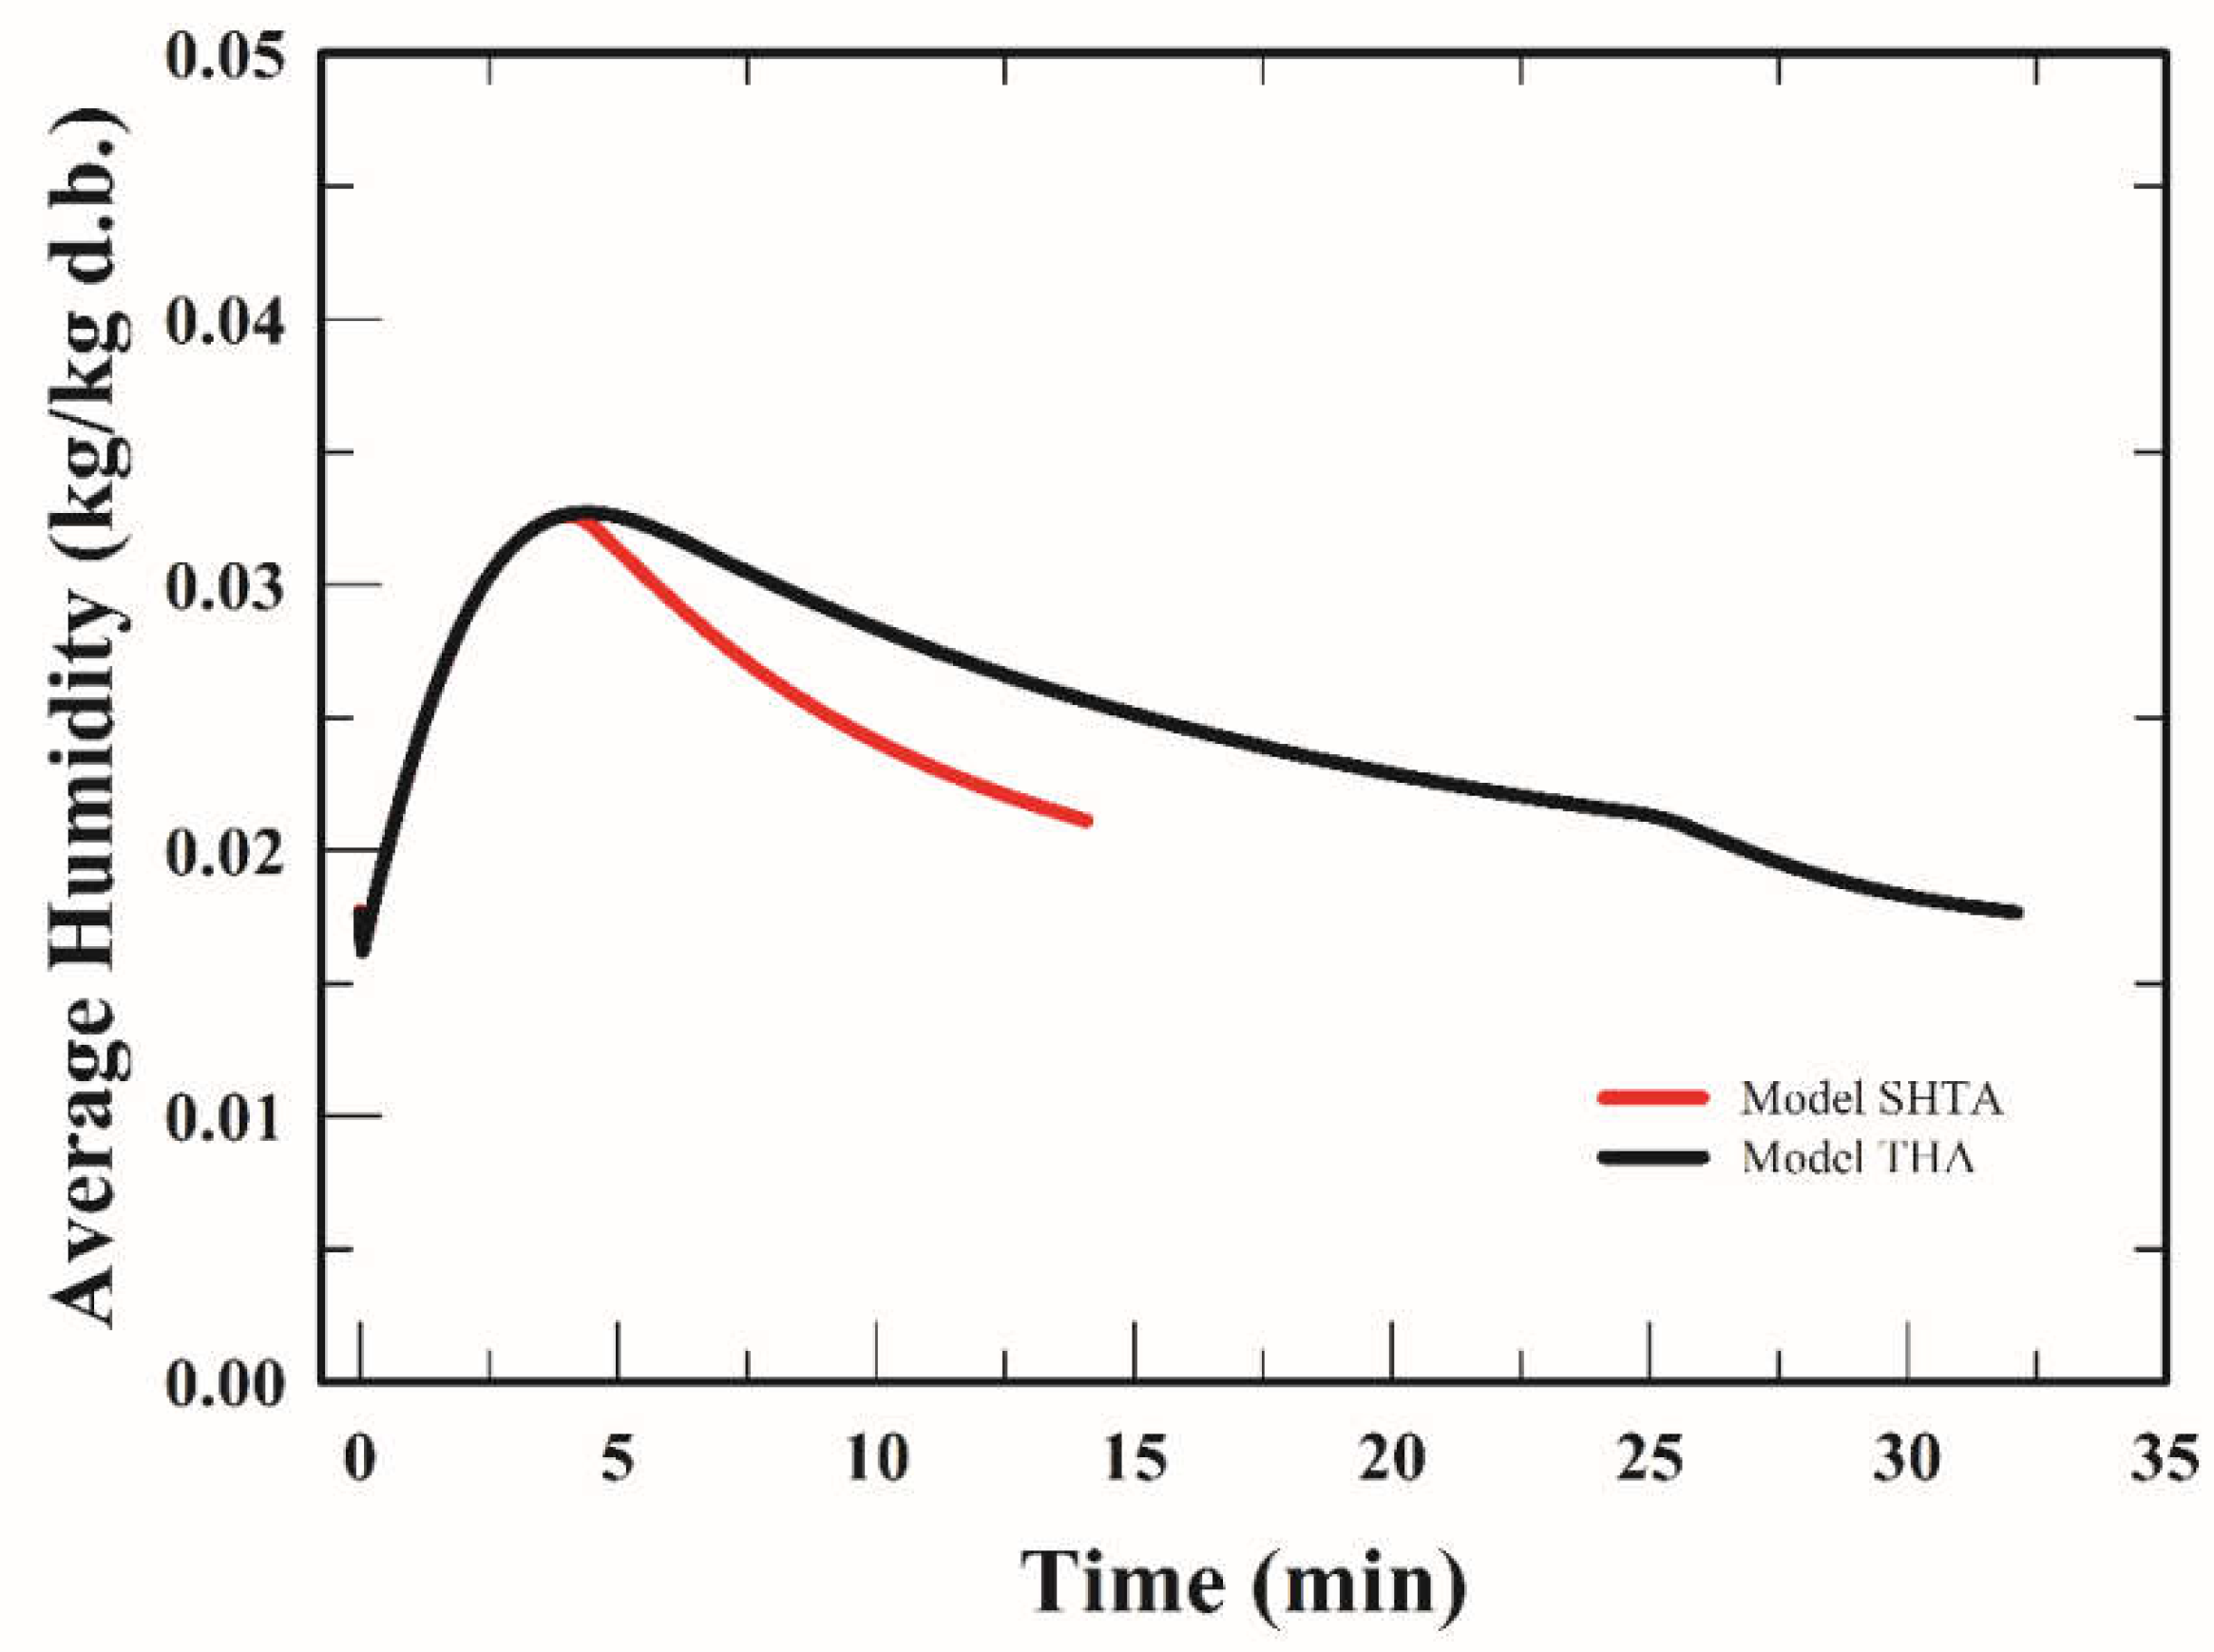
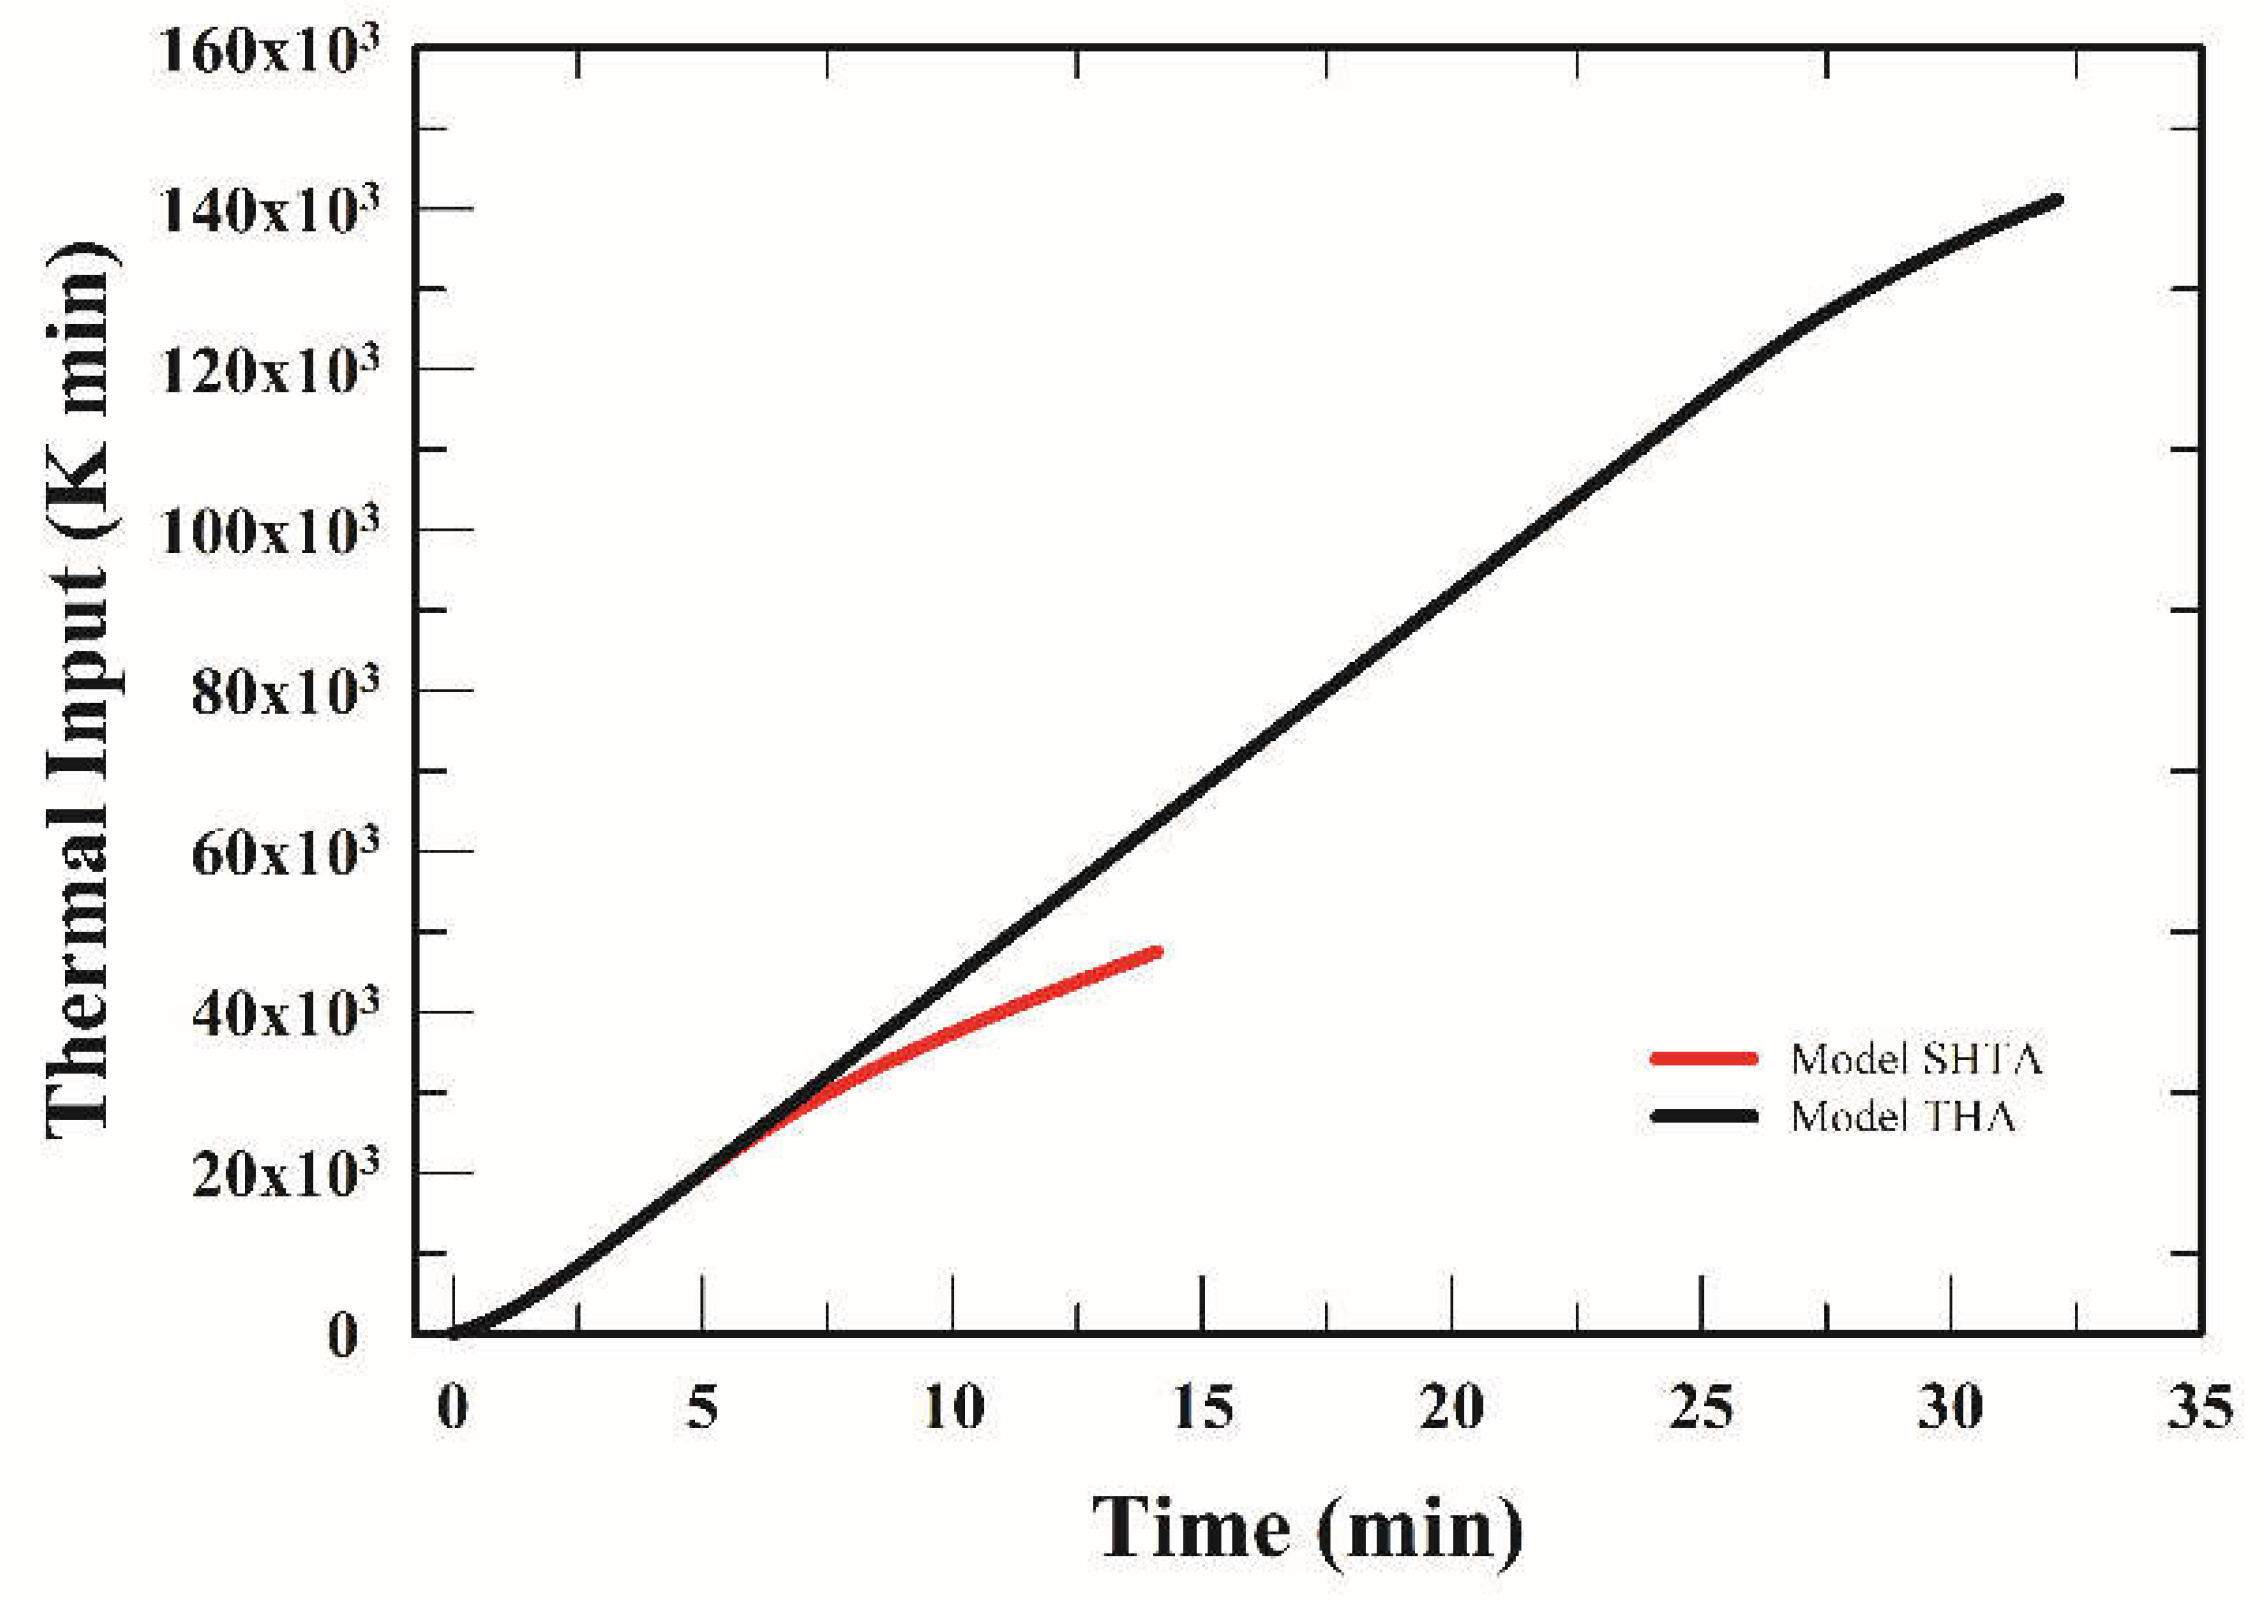
4.3.3. Responses of the Simulated Thermal Input and the Absolute Humidity in the FBD Chamber

The simulated thermal input during drying at 80 °C in the FBD with SHTA and THA is shown in Figure 6. The thermal input increased with drying time. It was about 0.33 × 10⁵ K × min at 8-min drying. At the end of drying process, the thermal input were 0.48 × 10⁵ and 1.41 × 10⁵ K × min with SHTA and THA, respectively. The thermal input of SHTA is one-third of THA. The above results indicated that the energy applied depended on the heating time, and SHTA could save more energy than THA.
The water vapor in the WG particles would diffuse from the micro pores inside the germ to the air phase of the FBD chamber during drying. The simulated absolute humidity in the FBD chamber during WG drying at 80 °C with SHTA and THA are shown in Figure 7. The absolute humidity increased sharply and then decreased gradually during drying. The maximum absolute humidity was 0.032 and 0.033 kg/kg with SHTA and THA drying, respectively. The time for the absolute humidity in the FBD chamber to reach maximum was about 4.1 min and 4.8 min with SHTA and THA drying, respectively.

4.4. Microscopic Behavior

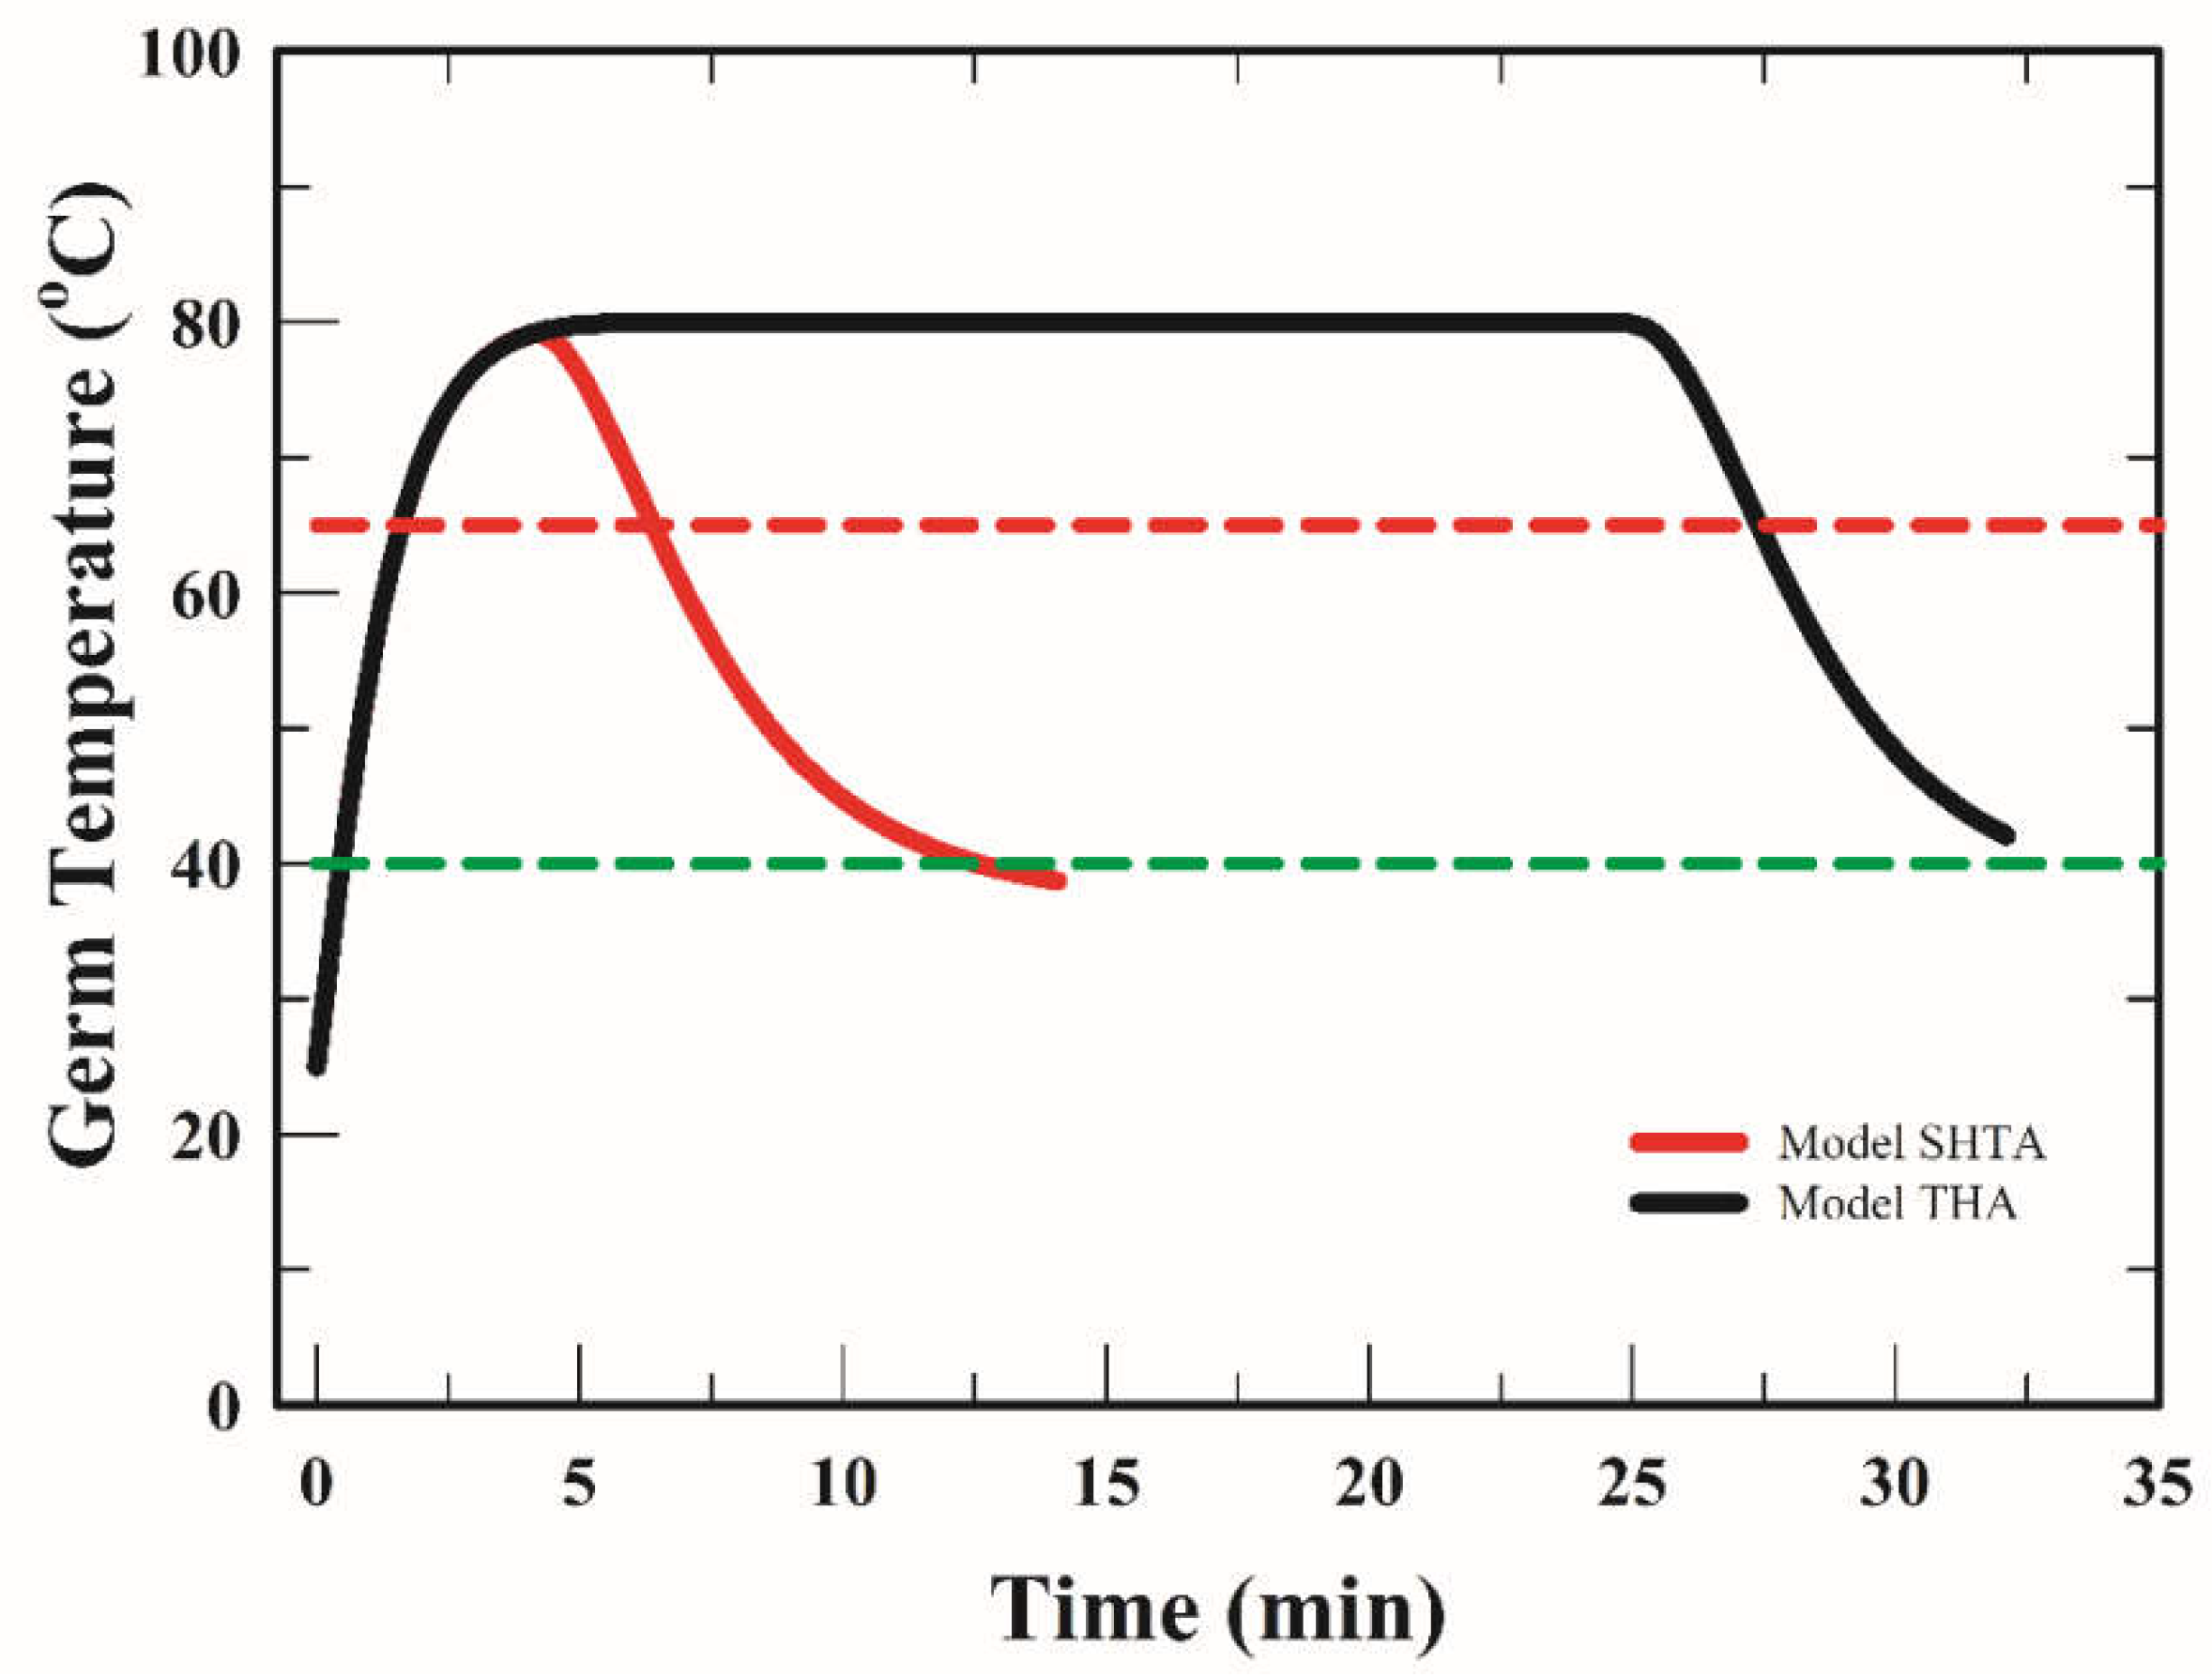
4.4.1. Responses of the Simulated Wheat Germ Temperature

Simulation of the local temperature of WG during frying in the FBD with different approaches is important to control the bulk quality. The microscopic behavior of WG during drying could be evaluated by the mathematical model. The simulated WG temperature during drying at 80 °C in the FBD with SHTA and THA is shown in Figure 8. The maximum temperature of WG was 79.0 °C and 80.0 °C with SHTA and THA drying, respectively. The time required to reach the maximum temperature was 4.1 min and 5.8 min with SHTA and THA drying, respectively. The WG temperature slowly dropped at the cooling stage. According to Giner and Calvelo [34], the grain might damage when the heating temperature was above 65 °C. During drying in the FBD with SHTA, the temperature of WG was over 65 °C for 4.4 min. However, the WG temperature was over 65 °C for 25.8 min (1.6–27.4 min) during drying with THA. The above results indicated that the low-temperature drying with SHTA was better for WG stabilization. The product temperature of 40 °C was employed in the industrial drying. Comparing the results between SHTA and THA in Figure 8, the time needed to cool the dried WG to 40 °C was the same.

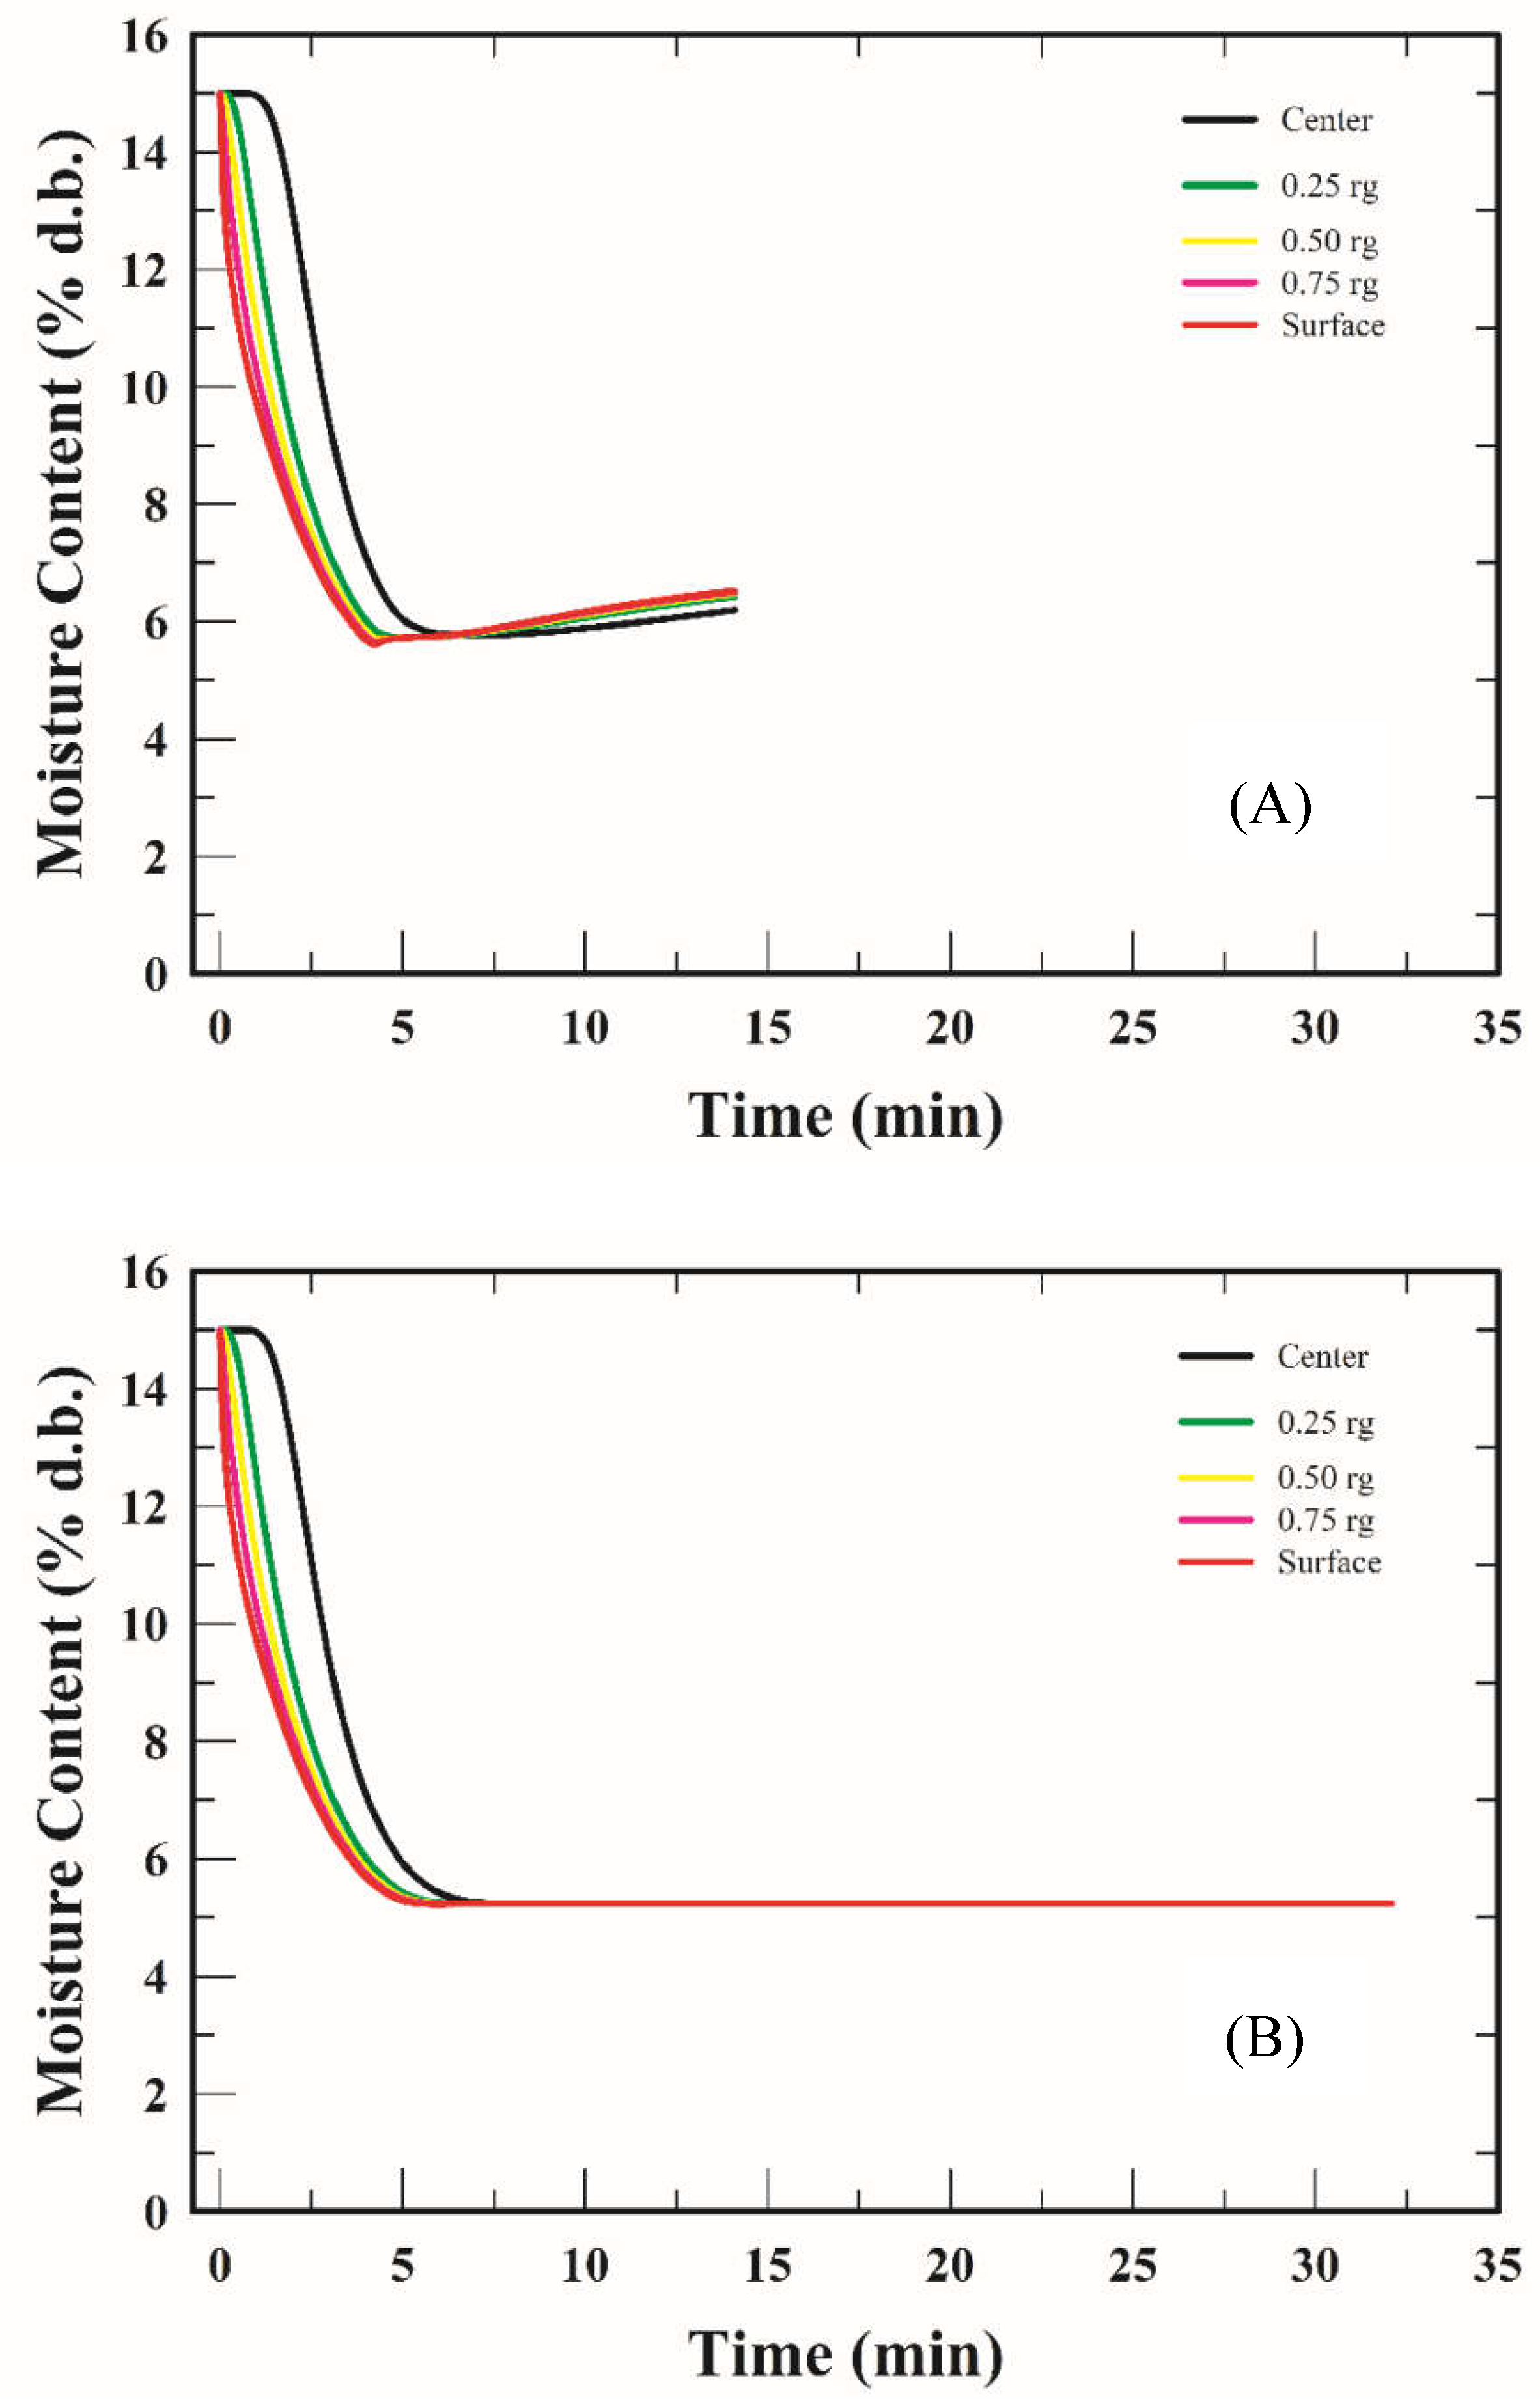
4.4.2. Responses of the Simulated Moisture Distribution in Wheat Germ

The simulated profiles of MC distribution of WG during drying at 80 °C in the FBD are shown in Figure 9. The microscopic changes of MC distribution of WG particles during drying were barely presented in the literature. The MC of WG at different location decreased with drying time, and the rate of dehydration was higher in the germ surface than the center. At 4 min of the heating stage, the MC of WG surface was 5.6%, but the center was 6.9%. At the cooling stage, the MC of WG surface increased due to vapor absorbing, resulting in the condensation of water vapor on the WG surface. Meanwhile, the water vapor still diffused from the center to the surface of WG particle. At the end of cooling stage, the MC of WG surface was higher than that of WG center (Figure 9A). However, the condensation phenomena of WG dried with THA was not observed (Figure 9B).
According to the results in Figure 9, we postulated that a dynamic equilibrium of water vapor might exist between the WG surface and the emulsion phase (Figure 10). The condensation phenomena of WG dried with SHTA might be more obvious than that of WG dried with THA.

5. Conclusions

A mathematical model coupling with the macro-heat transfer model and the bubble model was developed in this study to simulate the dehydration and condensation phenomena during low-temperature wheat germ (WG) drying in the fluidized bed dryer (FBD). Changes in the moisture content (MC) of WG and the air temperature and humidity of FBD chamber during drying with short heating time approach (SHTA) and traditional heating approach (THA) were significantly different. The vapor condensation of WG occurred at the cooling stage of drying with SHTA. SHTA proposed in this study could control both temperature and MC of WG product to 40 °C and 7%, respectively, at the end of drying process. In contrast, the temperature of WG product dried with THA could be controlled at 40 °C while the MC of WG product was 3.5%. The thermal input of the drying process with SHTA was one-third of that of the drying process with THA. Therefore, the low-temperature drying in the FBD with SHTA is the best strategy for the WG stabilization.

Author Contributions

D.-S.C. developed the process model and computational simulations. J.S.C. performed the experiments. M.-I.K. was responsible for the conception and research ideas.

Funding

This research was funded by Texture Maker Enterprise Co., Ltd., Taiwan Contract NO. 600312.

Conflicts of Interest

The authors declare no conflict of interest.

Nomenclature

SymbolMeaning (units)
A g surface area per unit volume of wheat germ (1/m)
C m b concentration of moisture in bubble phase (mol/m3)
C m e concentration of moisture in emulsion phase (mol/m3)
C m g concentration of moisture in wheat germ (mol/m3)
C s a t saturation concentration (mol/m3)
C e equilibrium moisture content (mol/m3)
C p , e effective heat capacity (J/kg K)
C p , j heat capacity of the jth compound (J/kg K)
D e effective diffusivity of water in wheat germ (m2/s)
D e g equivalent diameter of wheat germ (m)
D o pre-exponential factor (m2/s)
E a activation energy of water diffusion (J/mol)
f c o n step numerical parameter for condensation
f d e step numerical parameter for dehydration
H f height of fluidization (m)
h convective heat transfer coefficient (W/(m K))
K b e mass transfer coefficient between bubble and emulsion (1/s)
K c o n mass transfer coefficient for condensation (m/s)
K d e mass transfer coefficient for dehydration (m/s)
k g thermal conductivity of wheat germ (W/m K)
M w molecular weight of water (kg/mol)
r g radius of wheat germ (m)
R g gas constant (J/mol K)
R H relative humidity of air
T temperature (K, unless it is specified in °C)
ttime (s)
rr coordination (m)
xx coordination (m)
WLloading of wheat germ (kg)
X w i initial moisture content of wheat germ (%, d.b.)
Greek Symbols
κthermal conductivity (W/m K)
φ porosity of bed
ωmass fraction
ρ density (kg/m3)
λ latent heat of vaporization (J/mol)
Subscript
ashash
bbed
carbcarbohydrate
concondensation
eeffective or emulsion
fatfat
ggerm
hheating
iinitial
ininlet
jjth compound
mmoisture
mbmoisture in bubble phase
memoisture in emulsion phase
pprotein
satsaturation
sset
wwater

References

  1. Mahmoud, A.A.; Mohdaly, A.A.A.; Elneairy, N.A.A. Wheat germ: An overview on nutritional value, antioxidant potential and antibacterial characteristics. Food Nutr. Sci. 2015, 6, 265–277. [Google Scholar] [CrossRef]
  2. Zhu, K.X.; Lian, C.X.; Guo, X.N.; Peng, W.; Zhou, H.M. Antioxidant activities and total phenolic content of various extracts from defatted wheat germ. Food Chem. 2011, 126, 1122–1126. [Google Scholar] [CrossRef]
  3. Li, B.; Zhao, L.; Chen, H.; Sun, D.; Deng, B.; Li, J.; Liu, Y.; Wang, F. Inactivation of lipase and lipoxygenase of wheat germ with temperature-controlled short wave infrared radiation and its effect on storage stability and quality of wheat germ oil. PLoS ONE 2016, 9, e0167330. [Google Scholar] [CrossRef]
  4. Jha, P.K.; Kudachikar, V.B.; Kumar, S. Lipase inactivation in wheat germ by gamma irradiation. Radiat. Phys. Chem. 2013, 86, 136–139. [Google Scholar] [CrossRef]
  5. Zou, Y.P.; Yang, M.; Zhang, G.; He, H.; Yang, T.K. Antioxidant activities and phenolic compositions of wheat germ as affected by the roasting process. J. Am. Oil Chem. Soc. 2015, 92, 1303–1312. [Google Scholar] [CrossRef]
  6. Murthy, K.V.; Ravi, R.; Bhat, K.K.; Raghavarao, K.S.M.S. Studies on roasting of wheat using fluidized bed roaster. J. Food Eng. 2008, 89, 336–342. [Google Scholar] [CrossRef]
  7. Jurkovic, N.; Colic, I. Effect of thermal processing on the nutritive value of wheat germ protein. Die Nahrung. 1993, 37, 538–543. [Google Scholar] [CrossRef] [PubMed]
  8. Ferrara, P.J.; Ridge, R.D.; Benson, J.T. Method of producing shelf stable wheat germ. US Patent 5063079, 5 November 1991. [Google Scholar]
  9. Srivastava, A.K.; Sudha, M.L.; Baskaran, V.; Leelavathi, K. Studies on heat stabilized wheat germ and its influence on rheological characteristics of dough. Eur. Food Res. Technol. 2007, 224, 365–372. [Google Scholar] [CrossRef]
  10. Xu, B.; Zhou, S.L.; Miao, W.J.; Gao, C.; Cai, M.J.; Dong, Y. Study on the stabilization effect of continuous microwave on wheat germ. J. Food Eng. 2013, 117, 1–7. [Google Scholar] [CrossRef]
  11. Xu, B.; Wang, L.K.; Miao, W.J.; Wu, Q.F.; Liu, Y.X.; Sun, Y.L.; Gao, C. Thermal versus microwave inactivation kinetics of lipase and lipoxygenase from wheat germ. J. Food Process Eng. 2015, 39, 247–255. [Google Scholar] [CrossRef]
  12. Kermasha, S.; Bisakowski, B.; Ramaswamy, H.; Van De Voort, B. Comparison of microwave, conventional and combination heat treatments on wheat germ lipase activity. Int. J. Food Sci. Technol. 1993, 28, 617–623. [Google Scholar] [CrossRef]
  13. Ali, S.; Usman, S.; Nasreen, Z.; Zahra, N.; Nazir, S.; Yasmeen, A.; Yaseen, T. Nutritional evaluation and stabilization studies of wheat germ. Pak. J. Food Sci. 2013, 23, 148–152. [Google Scholar]
  14. Marti, A.; Torri, L.; Casiraghi, M.C.; Franzetti, L.; Limbo, S.; Morandin, F.; Quaglia, L.; Pagani, M.A. Wheat germ stabilization by heat-treatment or sourdough fermentation: Effects on dough rheology and bread properties. LWT-Food Sci. Technol. 2014, 59, 1100–1106. [Google Scholar] [CrossRef]
  15. Fernando, W.J.N.; Hewavitharana, L.G. Effect of fluidized bed drying on stabilization of rice bran. Drying Technol. 1993, 11, 1115–1125. [Google Scholar] [CrossRef]
  16. Shingare, S.P.; Thorat, B.N. Fluidized bed drying of sprouted wheat (Triticum aestivum). Int. J. Food Eng. 2014, 10, 29–37. [Google Scholar] [CrossRef]
  17. Martinez, M.L.; Marin, M.A. Optimization of soybean heat-treating using a fluidized bed dryer. J. Food Sci. Technol. 2013, 50, 1144–1150. [Google Scholar] [CrossRef] [PubMed]
  18. Yondem-Makascıoglu, F.; Gurun, B.; Dik, T.; Kıncal, N.S. Use of a spouted bed to improve the storage stability of wheat germ followed in paper and polyethylene packages. J. Sci. Food Agric. 2005, 85, 1329–1336. [Google Scholar] [CrossRef]
  19. Hung, J.M. Investigation on the Effect of Fluidized-Bed Drying Processing on the Storage Stability of Wheat Germ. Master’s Thesis, Fu-Jen Catholic University, Taiwan, 2017. [Google Scholar]
  20. Yang, W.C. Handbook of Fluidization and Fluid–Particle System; Marcel Dekker: New York, NY, USA, 2003. [Google Scholar]
  21. Levenspiel, O. Chemical Reaction Engineering, 3rd ed.; John Wiley & Sons, Inc.: New York, NY, USA, 1999. [Google Scholar]
  22. Hemis, M.; Singh, C.B.; Jaya, D.S.; Bettahar, A. Simulation of coupled heat and mass transfer in granular porous media: Application to the drying of wheat. Dry Technol. 2011, 29, 1267–1272. [Google Scholar] [CrossRef]
  23. Srivastava, V.K.; John, J. Deep bed grain drying model. Energy Convers. Manag. 2002, 43, 1689–1708. [Google Scholar] [CrossRef]
  24. Giner, S.A.; De Michelis, A. Evaluation of the thermal efficiency of wheat drying in fluidized beds: Influence of air temperature and heat recovery. J. Agric. Eng. Res. 1988, 41, 11–23. [Google Scholar] [CrossRef]
  25. Naghavi, Z.; Moheb, A.; Ziaei-Rad, S. Numerical simulation of rough rice drying in a deep-bed dryer using non-equilibrium model. Energy Convers. Manag. 2010, 51, 258–264. [Google Scholar] [CrossRef]
  26. Vijayaraj, B.; Saravanan, R.; Renganarayanan, S. Studies on thin layer drying of bagasse. Int. J. Energy Res. 2007, 31, 422–437. [Google Scholar] [CrossRef]
  27. Zare, D.; Minaei, S.; Mohamad Zadeh, M.; Khoshtaghaza, M.H. Computer simulation of rough rice drying in a batch dryer. Energy Convers. Manag. 2006, 47, 3241–3254. [Google Scholar] [CrossRef]
  28. Proietti, N.; Adiletta, G.; Russo, P.; Buonocore, R.; Mannina, L.; Crescitelli, A.; Capitani, D. Evolution of physicochemical properties of pear during drying by conventional techniques, portable-NMR, and modeling. J. Food Eng. 2018, 230, 82–98. [Google Scholar] [CrossRef]
  29. Mohapatra, D.; Rao, P.S. A thin layer drying model of parboiled wheat. J. Food Eng. 2005, 66, 513–518. [Google Scholar] [CrossRef]
  30. Gili, R.D.; Martín Torrez Irigoyen, R.; Cecilia Penci, M.; Giner, S.A.; Ribotta, P.D. Physical characterization and fluidization design parameters of wheat Germ. J. Food Eng. 2017, 212, 29–37. [Google Scholar] [CrossRef]
  31. Gili, R.D.; Martín Torrez Irigoyen, R.; Cecilia Penci, M.; Giner, S.A.; Ribotta, P.D. Wheat germ thermal treatment in fluidised bed. Experimental study and mathematical modelling of the heat and mass transfer. J. Food Eng. 2018, 221, 11–19. [Google Scholar] [CrossRef]
  32. American Association of Cereal Chemists. Approved Methods of Analysis, 10th ed.; AACC International PRESS: St. Paul, MN, USA, 2000. [Google Scholar]
  33. Srinivasakannan, C.; Balasubramanian, N. An Analysis on Modeling of Fluidized Bed Drying of Granular Material. Adv. Power Technol. 2008, 19, 73–82. [Google Scholar] [CrossRef]
  34. Giner, S.A.; Calvelo, A. Modeling of wheat drying in fluidized bed. J. Food Sci. 1987, 52, 1358–1363. [Google Scholar] [CrossRef]
  35. Romeo, T.T. Fundamentals of Food Process Engineering, 3rd ed.; Springer Asia Limited: Hong Kong, China, 2007. [Google Scholar]
  36. Purlis, E. Baking process design based on modelling and simulation: Towards optimization of bread baking. Food Control. 2012, 27, 45–52. [Google Scholar] [CrossRef]
  37. Christie, J.G. Transport Processes and Separation Process Principles (Includes Unit Operations), 4th ed.; Goodwin, B., Ed.; Prentice Hall: Upper Saddle River, NJ, USA, 2003. [Google Scholar]
  38. Brandolini, A.; Hidalgo, A. Wheat germ: Not only a by-product. Int. J. Food Sci. Nutr. 2012, 63, 71–74. [Google Scholar] [CrossRef] [PubMed]
Figure 1. Schematic diagram (A) and dimensions (B) of the fluidized bed dryer used in this study.
Processes 06 00071 g001
Figure 2. Particle size distribution of wheat germ used in this study.
Processes 06 00071 g002
Figure 3. Profiles of the inlet air temperature (the heater temperature) during drying at 80 °C in the FBD. Experimental data, SHTA (Δ) and THA (□); Predicted values, SHTA (red line) and THA (black line).
Processes 06 00071 g003
Figure 4. Profiles of the moisture content of wheat germ during drying at 80 °C in the FBD. Experimental data, SHTA (Δ) and THA (□); Predicted values, SHTA (red line) and THA (black line).
Processes 06 00071 g004
Figure 5. Profiles of air temperature during drying at 80 °C in the FBD chamber. Experimental data, SHTA (Δ) and THA (□); predicted values. SHTA (red line) and THA (black line).
Processes 06 00071 g005
Figure 6. Simulated thermal input of heating germ during drying at 80 °C in the FBD. SHTA (red line) and THA (black line).
Processes 06 00071 g006
Figure 7. Simulated profiles of absolute humidity of air during drying at 80 °C in the FBD. SHTA (red line) and THA (black line).
Processes 06 00071 g007
Figure 8. Simulated profiles of wheat germ temperature during drying at 80 °C in the FBD. SHTA (red line) and THA (black line).
Processes 06 00071 g008
Figure 9. Simulated profiles of MC distribution of wheat germ during drying at 80 °C in the FBD. (A) SHTA; (B) THA.
Processes 06 00071 g009
Figure 10. Schematic view of water vapor on the WG surface, emulsion phase, and bubble phase. (A) SHTA; (B) THA.
Processes 06 00071 g010
Table 1. Time (min) allocation of each stage for wheat germ drying at 80 °C.
StagesShort Heating Time Approach (SHTA)Traditional Heating Approach (THA)
Preheating1010
Sample Loading11
Heating425
Cooling104
Table 2. Material properties of wheat germ [35].
DescriptionEquation
Densityρg = Σρj ωjρw = 9.9718 × 10² + 3.1439 × 10⁻³ T − 3.7574 × 10⁻³ T2
ρp = 1.3299 × 10³ − 0.51814 T
ρfat = 9.2559 × 10² − 0.41757 T
ρcorb = 1.5991 × 10³ − 0.31046 T
ρash = 2.4238 × 10³ − 0.28063 T
Heat CapacityCP,g = ΣCP,j ωjCP,w = 4.1762 + 9.0862 × 10⁻³ T − 5.4731 × 10⁻⁶ T2
CP,p = 2.0082 + 1.2089 × 10⁻³ T − 1.3129 × 10⁻⁶ T2
CP,fat = 1.9842 + 1.4733 × 10⁻³ T − 4.8008 × 10⁻⁶ T2
CP,carb = 1.5488 + 1.9625 × 10⁻³ T − 5.9399 × 10⁻⁶ T2
CP,ash = 1.0926 + 1.8896 × 10⁻³ T − 3.6817 × 10⁻⁶ T2
Thermal conductivitykg = Σkj ωjkw = 5.7109 × 10⁻¹ + 1.7625 × 10⁻³ T − 6.7036 × 10⁻⁶ T2
kp = 1.788 × 10⁻¹ + 1.1958 × 10⁻³ T − 6.7036 × 10⁻⁶ T2
kfat = 1.8071 × 10⁻¹ − 2.7604 × 10⁻³ T − 1.7749 × 10⁻⁷ T2
kcarb = 2.014 10−1 + 1.3874 × 10⁻³ T − 4.3312 × 10⁻⁶ T2
kash = 3.296 × 10⁻¹ − 1.401 × 10⁻³ T − 2.9069 × 10⁻⁶ T2
Table 3. Chemical composition of raw wheat germ (%, wet basis).
MoistureProteinFatCarbohydrate *Ash
13.15 ± 0.2824.11 ± 0.239.02 ± 0.1348.25.91 ± 0.34
Values are mean ± standard deviations of n = 3. * Carbohydrate = 100-Moisture-Protein-Fat-Ash.
Table 4. Input parameter values.
MeasuredEstimatedSetTheoretical
ParameterValueParameterValueParameterValueParameterValue
Hf0.30 mAg7407 1/mDo2.3 × 10−4 m2/sMw0.018 kg/mol
RHi0.15 (-)rg4.05 × 10−3 mDv1.0 × 10−5 m2/sRT0.08205 atm/mol·K
RHin0.75 (-)n0.36Ea29.4 × 103 J/molRg8.314 J/mol·K
Tgi298.15 Kh32.5 W/m2 Kλ41.4 kJ/mol
Tstart340.15 KKcon4.5 × 10−3 m/s
WL2.0 kgKde1.2 × 10−2 m/s
u1.2 m/sKbe1.2 × 10−3 m/s
VT0.214 m3
Xwi15% d.b.
φ b 0.92 (-)
Table 5. The experimental moisture content (MC), predicted MC, K c o n parameter, and absolute average deviation (AAD).
Kcon (m/s)
01.0 × 10−34.5 × 10−39.0 × 10−31.8 × 10−2
Time (min)Experimental MCPredicted MC
0151515151515
28.849.569.569.569.569.56
46.816.436.436.436.436.43
66.155.895.905.95.915.93
86.295.895.946.086.256.53
106.315.896.016.46.827.46
126.615.896.096.717.328.14
146.855.896.176.967.688.53
AAD0.480.400.230.430.74

