Abstract
Due to the intrinsic stochasticity, the signaling dynamics in a clonal population of cells exhibit cell-to-cell variability at the single-cell level, which is distinct from the population-average dynamics. Frequently, flow cytometry is widely used to acquire the single-cell level measurements by blocking cytokine secretion with reagents such as Golgiplug™. However, Golgiplug™ can alter the signaling dynamics, causing measurements to be misleading. Hence, we developed a mathematical model to infer the average single-cell dynamics based on the flow cytometry measurements in the presence of Golgiplug™ with lipopolysaccharide (LPS)-induced NFB signaling as an example. First, a mathematical model was developed based on the prior knowledge. Then, average single-cell dynamics of two key molecules (TNF and IB) in the NFB signaling pathway were measured through flow cytometry in the presence of Golgiplug™ to validate the model and maximize its prediction accuracy. Specifically, a parameter selection and estimation scheme selected key model parameters and estimated their values. Unsatisfactory results from the parameter estimation guided subsequent experiments and appropriate model improvements, and the refined model was calibrated again through the parameter estimation. The inferred model was able to make predictions that were consistent with the experimental measurements, which will be used to construct a semi-stochastic model in the future.
1. Introduction
To integrate of multiple signaling pathways, their canonical transcription factors and downstream effector genes is required for cells to respond to various signals they encounter in their micro-environment. Therefore, understanding how information is sensed and processed by cells and the signaling pathways that are engaged by different stimuli can help elucidate cellular behaviors and responses. Typically, cellular signal dynamics and the response to stimuli have been studied using a combination of mathematical modeling and experimental analysis [1,2]. A majority of these studies has modeled cell signaling at the population level and used population-averaged measurements such as Western blots to infer the dynamics of different proteins in the signaling pathway, as well as the possible network structure of signaling pathways [1]. However, with recent advances in the ability to measure gene and protein expression at the single-cell level (reviewed in [2,3]), it has become possible to analyze signaling dynamics at the single-cell level. In contrast to the observations from population-average studies, the single-cell studies have demonstrated that individual cells in a clonal population may respond differently to the same stimulus, and the population level measurements could mask the temporal dynamics of individual cells [2]. This variability in the responses of individual cells poses a challenge to their implementation in biology and medicine [4]. Therefore, it is important to understand the stochasticity and heterogeneity in the single-cell responses that might be missed in population-averaged measurements.
Advances in experimental tools for single-cell analysis have led to a significant increase in single-cell studies [2,3]. Despite these advancements, it is still difficult to study the single-cell signaling dynamics due to complex interactions at multiple levels between different proteins that are involved in signal transduction [1]. Computational modeling has been proposed as a complementary approach to overcome some of these limitations and gain insights that cannot be obtained solely through experiments [1,2]. A viable and computationally efficient approach to study the cell-to-cell variability is to use a deterministic model with parameters that have distributions [2,5,6,7]. In this approach, the computational cost is generally reduced by simulating the signaling dynamics through a deterministic modeling approach while the stochasticity is preserved by assigning a set of different parameter values for each simulation based on predetermined parameter distributions.
In order to construct such models, an experimentally validated deterministic model, which can capture average signaling dynamics at the single-cell level, is required. Although various deterministic models have been proposed for several well-studied signal transduction pathways [1,8], many demonstrate good qualitative, but not quantitative, agreement with the experimental data. This has been attributed to, among other factors, the limited breadth of data used for training the model (e.g., models trained using one dataset with a single stimulus concentration), which makes the models unable to make robust predictions under different conditions. Moreover, the identifiability issue of model parameters [9], which arises due to the model structure as well as the limited availability of experimental data of intracellular proteins [10,11], is not always addressed, which may lead to a suboptimal estimation of model parameters [10,12]. Additionally, many models have been constructed and validated based on experimental data obtained from the population-averaged measurements, which mask the signaling dynamics at the single-cell level [2,13,14]. Consequently, these models are inadequate to predict the average signaling dynamics of single cells.
Motivated by the above considerations, we developed a deterministic model that can accurately predict the average signaling dynamics of single cells. We chose lipopolysaccharide (LPS)-induced nuclear factor B (NFB) signaling in mouse macrophages for our model system as it is an extensively studied and characterized signaling pathway [8,15,16]. In order to address the issues discussed above, both computational and experimental approaches have been implemented. First, a rigorous numerical scheme is used to identify the most important parameters that are to be estimated in the parameter estimation [17]. Specifically, the sensitivity analysis and the parameter selection method quantitatively assess the significance of each model parameter with respect to experimental measurements under different LPS concentrations and select parameters whose values could be uniquely estimated [10,18]. Second, flow cytometry with intracellular staining is used to measure the average single-cell dynamics of key molecules involved in the NFB signaling pathway in response to a broad range of LPS concentrations [19,20]. In this study, the intracellular concentrations of the inhibitor of B- (IB) and tumor necrosis factor (TNF) were measured. IB is an inhibitor of NFB activity, and therefore, the IB dynamics are inversely correlated with the NFB dynamics. At the same time, the activated NFB induces the transcription and translation of TNF upon the stimulation of LPS; hence, the TNF can also be used to infer the dynamics of the NFB signaling pathway [16]. The obtained average single-cell kinetics is used to quantitatively calibrate and validate the model. Third, the discrepancy between the experimental measurements and the model predictions reveals important, yet unconsidered mechanisms, which is validated experimentally afterwards and leads to the model refinement. Through this integrated model development methodology, predictions from the resultant model quantitatively agree with the experimental measurements. Therefore, the proposed model represents a first step towards the construction of single-cell semi-stochastic models to investigate the stochasticity of intracellular NFB signaling in macrophages.
2. Material and Methods
2.1. Materials and Cell Culture
RAW264.7 cells were obtained from ATCC (Manassas, VA, USA). Dulbecco’s Modified Eagle Medium (DMEM) and penicillin/streptomycin were obtained from Invitrogen (Carlsbad, CA, USA). Bovine serum and fetal bovine serum (FBS) were obtained from Atlanta Biologicals (Flowery Branch, GA, USA). Ultrapure LPS derived from was obtained from Invivogen (San Diego, CA, USA). RAW264.7 macrophages were cultured in DMEM supplemented with 10% FBS, penicillin (200 U/mL) and streptomycin (200 g/mL) at 37 °C in a 5% CO environment.
2.2. Flow Cytometry Analysis
The expression of TNF and IB under different experimental conditions was determined using flow cytometry. RAW264.7 cells were seeded into round-bottomed 96-well plate and stimulated with different concentrations of LPS for the indicated time. Golgiplug™ (BD Biosciences, San Jose, CA, USA) was added along with LPS for TNF detection experiments to block secretion of TNF. Cells were then stained with Alexa Flour 700 fluorescence-tagged TNF antibody (BD Biosciences) and PE-conjugated IB antibody (Cell Signaling Technology, Danvers, MA, USA) using the manufacturer’s suggested protocol. Stained cells were analyzed using a BD Fortessa flow cytometer (BD Biosciences) at the Texas A&M Health Science Center College of Medicine Cell Analysis Facility. Ten thousands events per sample were acquired, and the data were analyzed using FlowJo software (Tree Star, OR, USA). Cells were gated based on side scattered light (SSC) and forward scattered light (FSC) values to eliminate cell debris, and TNF- and IB-positive cells were gated based on the antibody isotype (see Supplementary Materials Figures S1–S3). All experiments were repeated using at least three different cultures.
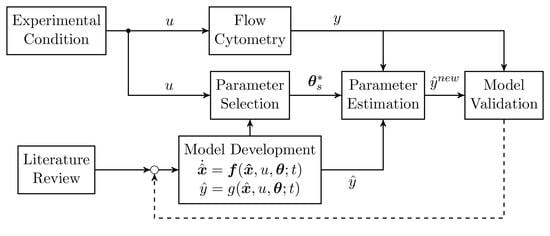
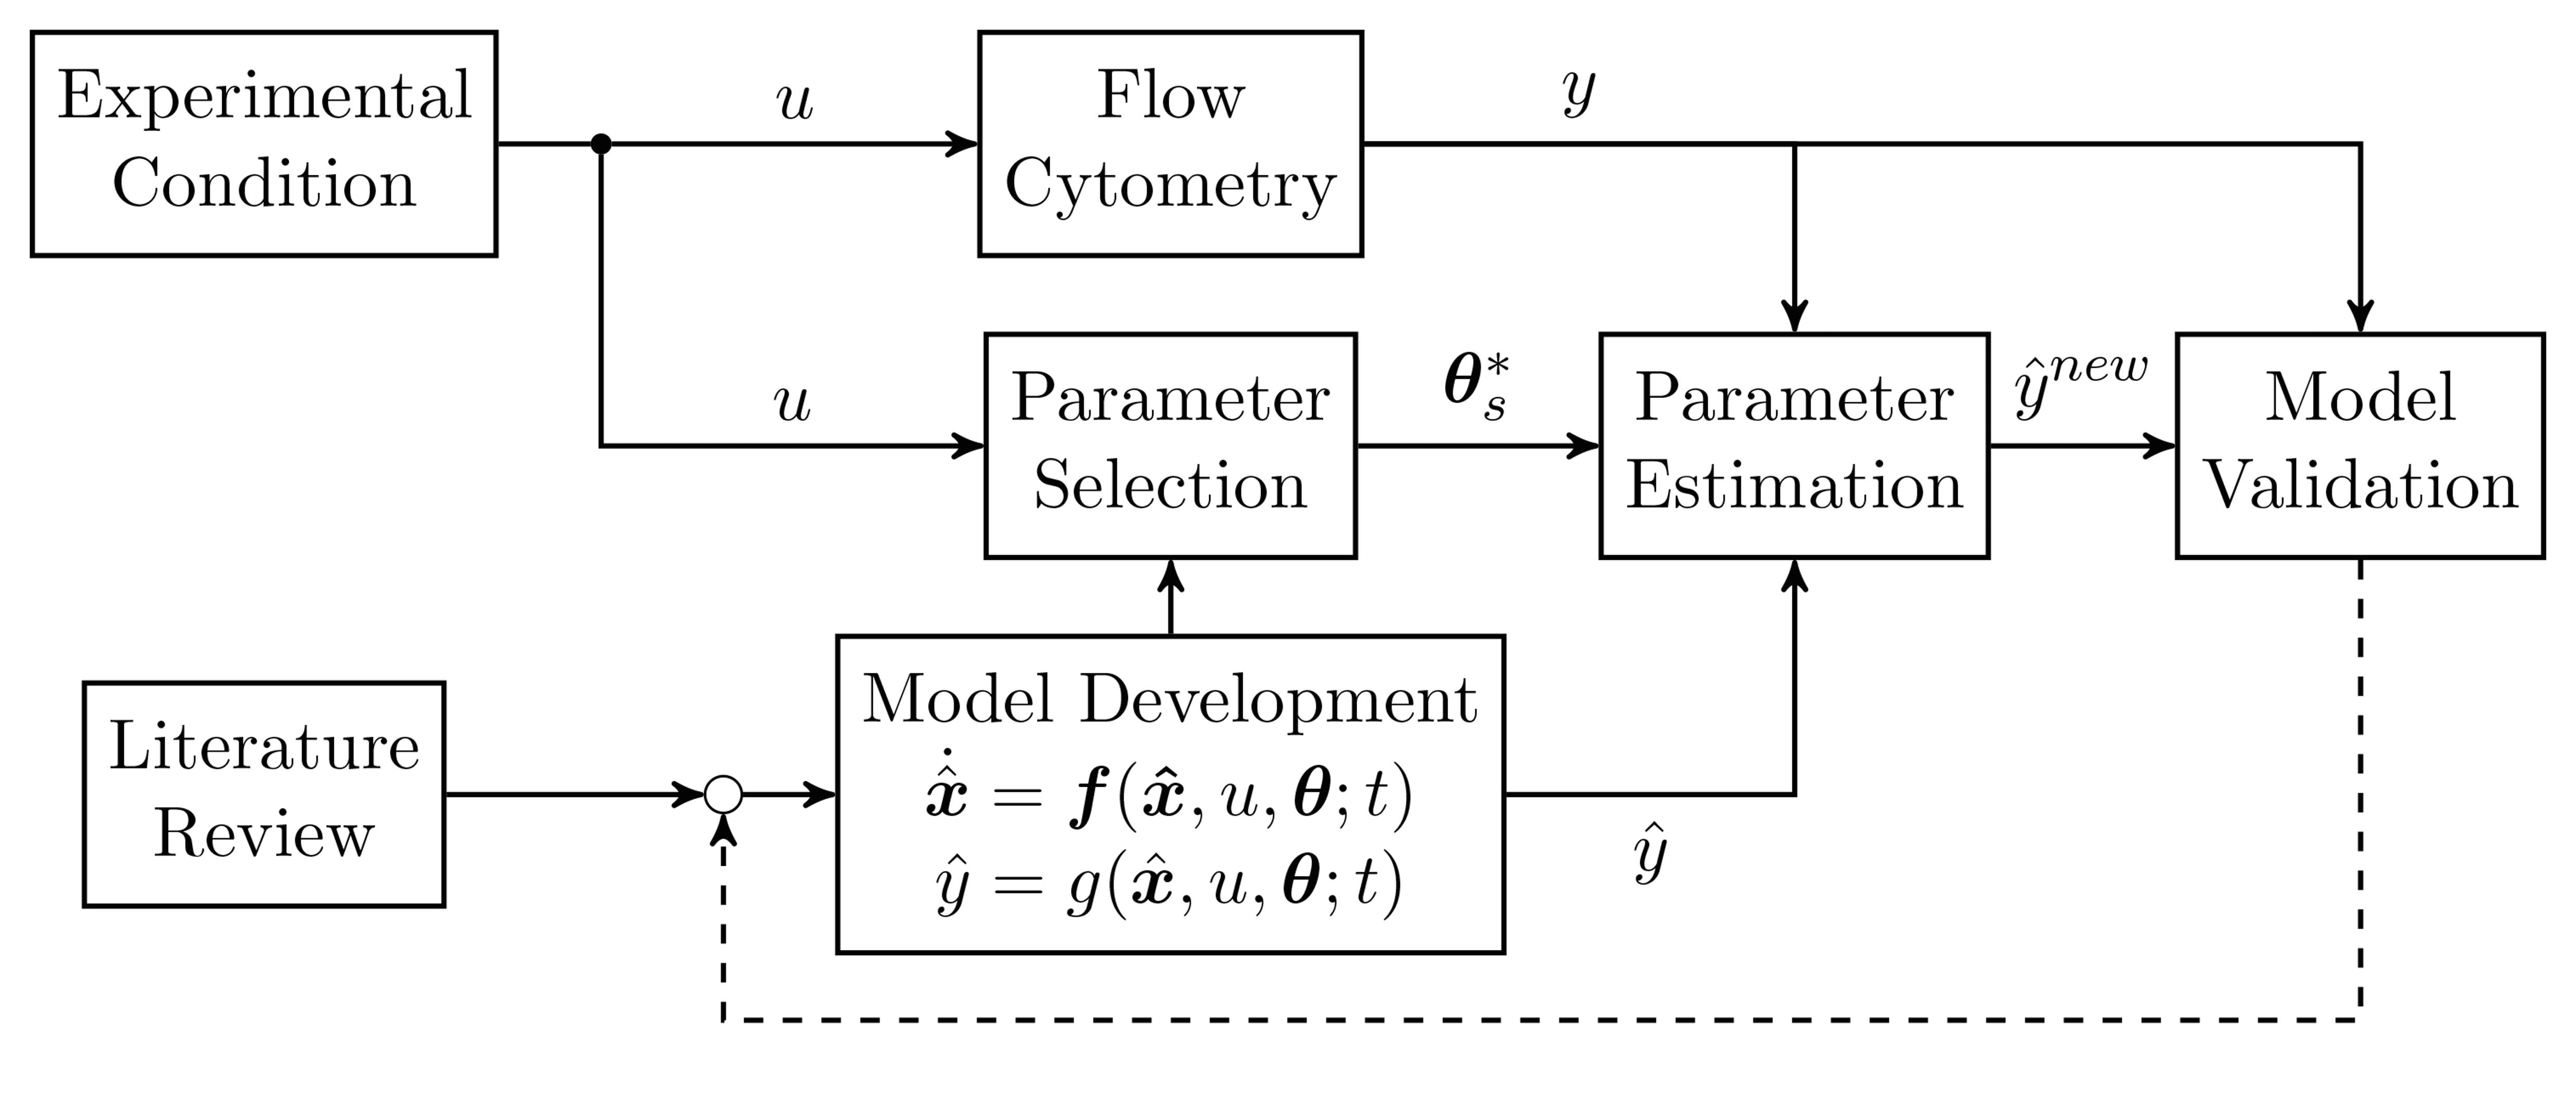
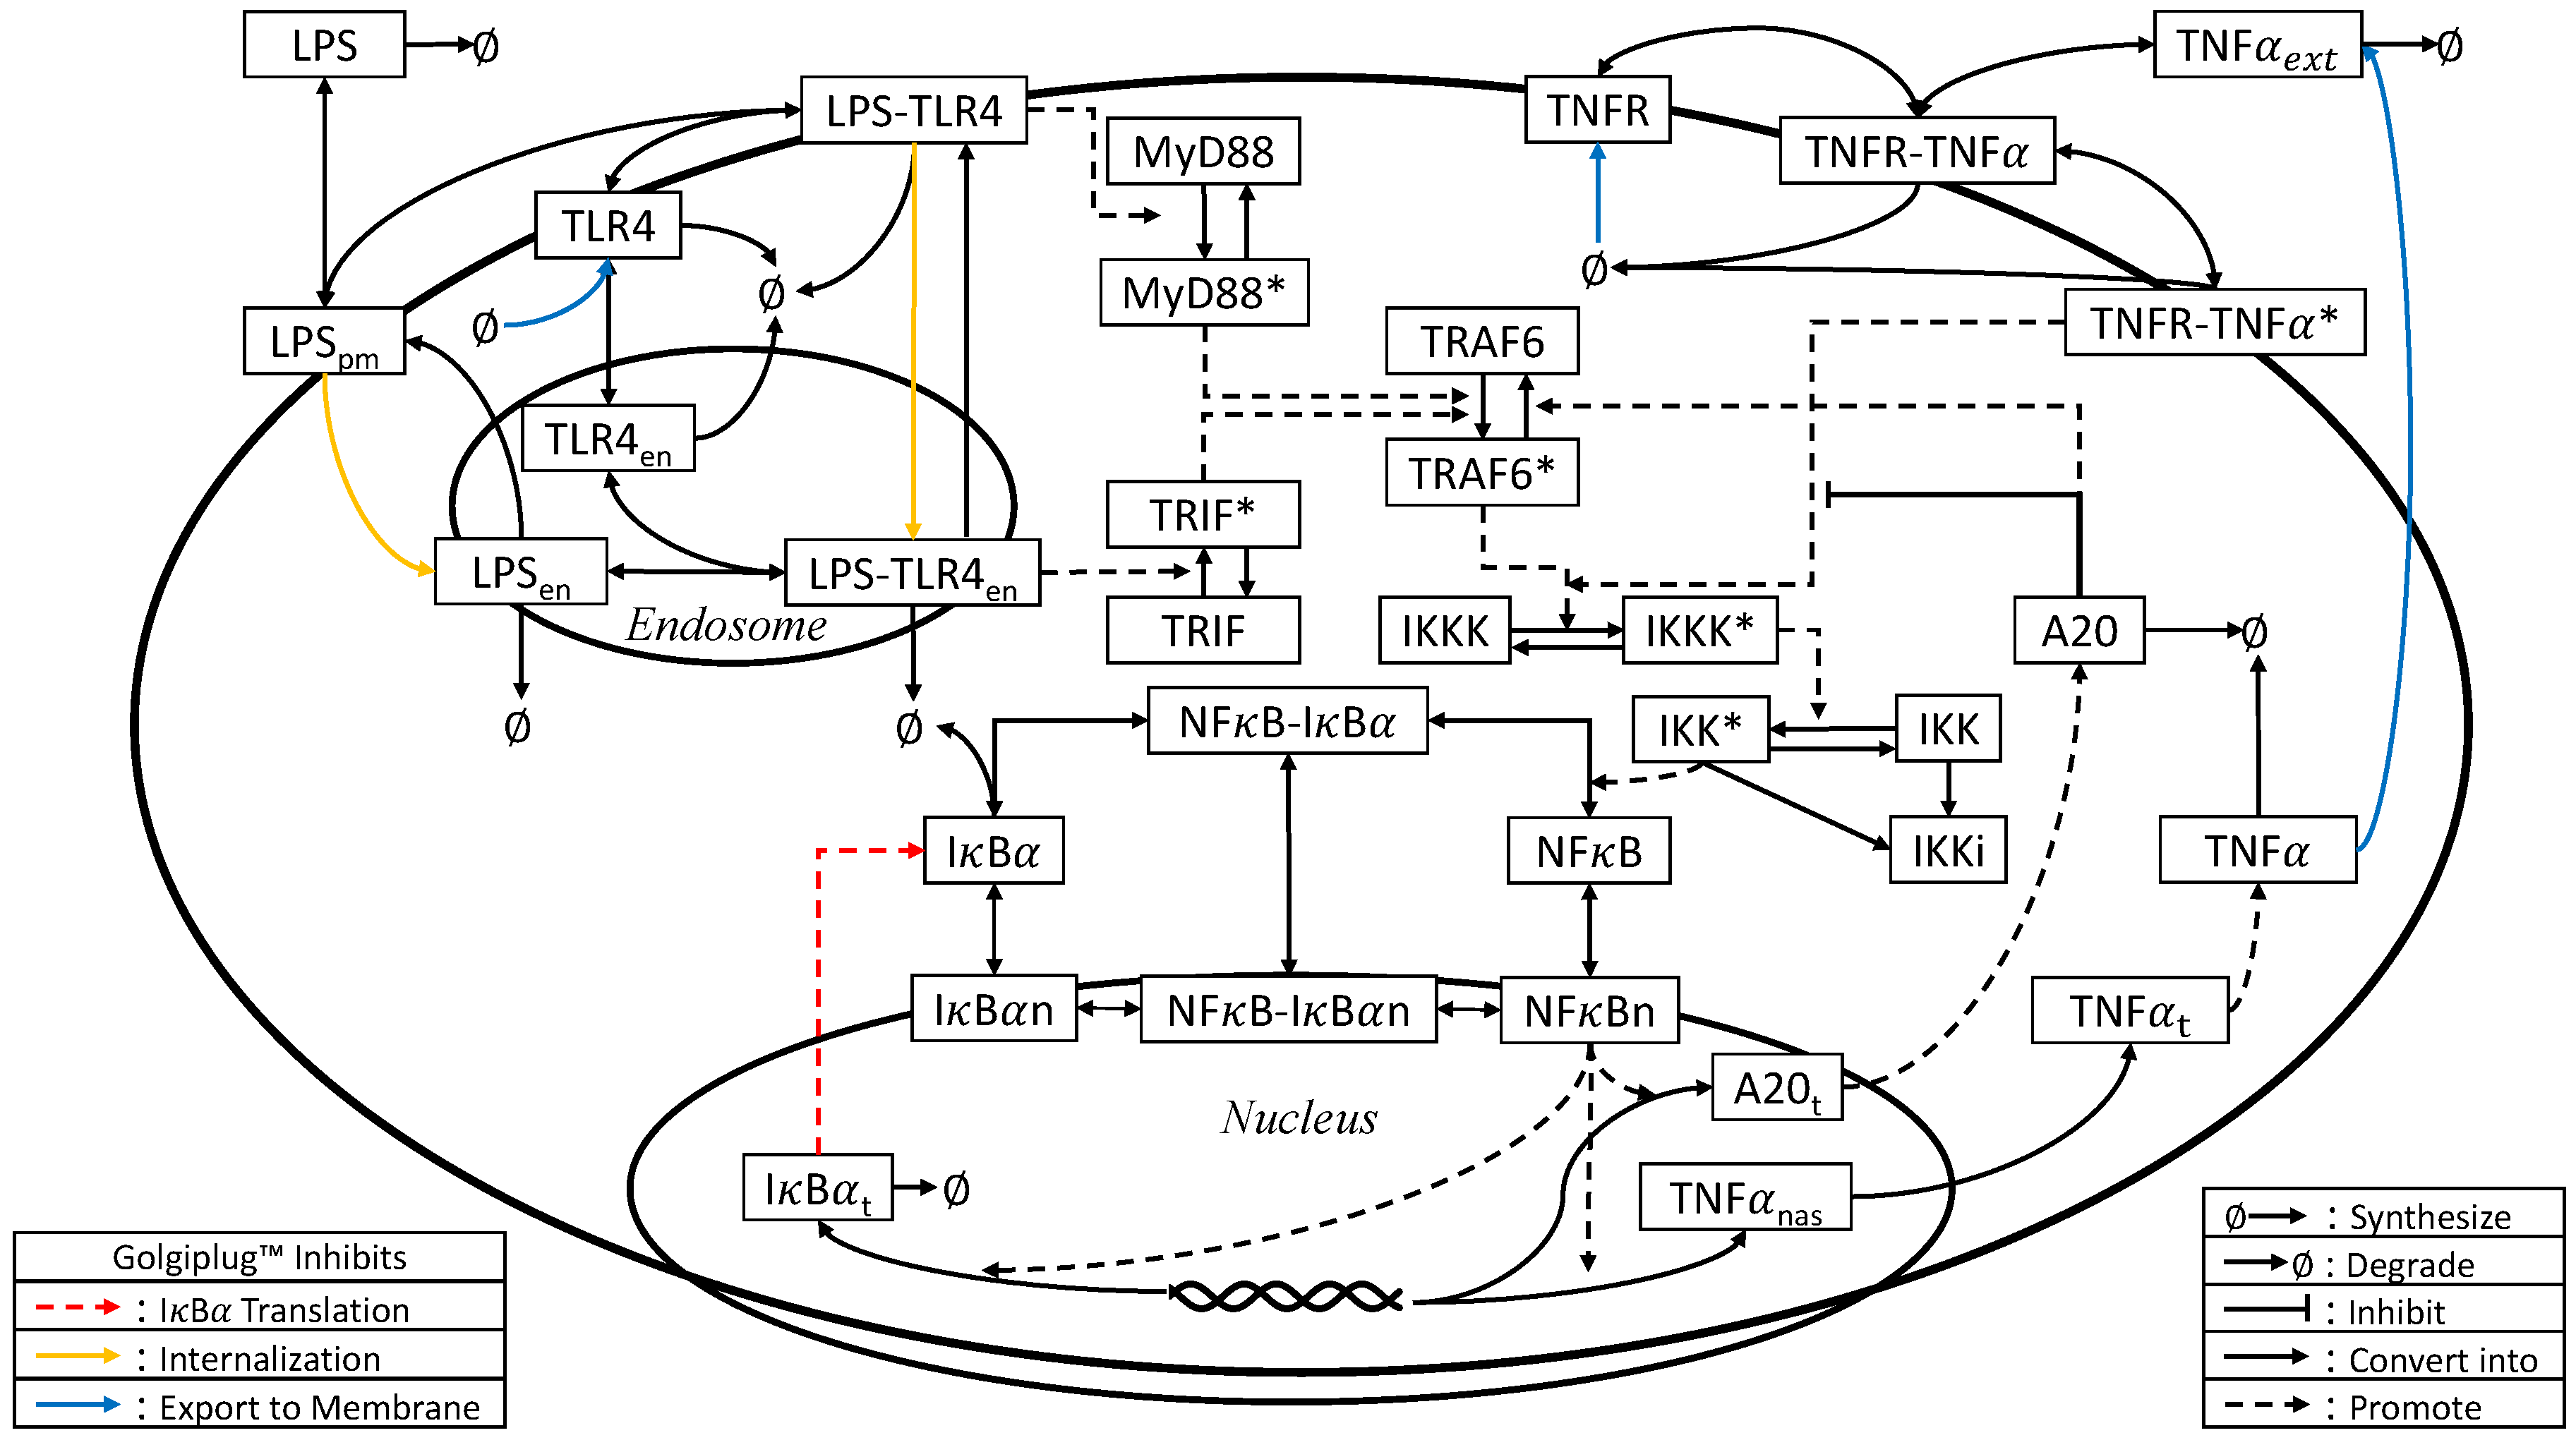
2.3. Model Development
The schematic diagram of the NFB signaling pathway is illustrated in Figure 1. The model used in this study was adopted from Caldwell et al. [21], which takes the extracellular LPS concentration as an input to predict the kinetics of key biomolecules in the NFB signaling pathway. In this model, by forming a complex with Toll-like receptor 4 (TLR4), LPS activates IB kinase (IKK) through myeloid differentiation primary response 88 (MyD88)- or TIR (Toll/Interleukin-1 receptor)-domain-containing adaptor-inducing interferon- (TRIF)-dependent activation of TNF receptor-associated factor 6 (TRAF6). The activated IKK in turn promotes the translocation of NFB to the nucleus, where the nuclear NFB induces the transcription of NFB inhibitors (IB-, -, - and A20), as well as TNF. Once translated, these inhibitors inhibit the NFB signaling pathway. In contrast, the translated TNF is secreted to the extracellular medium, and some of the secreted TNF proteins will bind with TNF receptor (TNFR) on the cellular membrane to initiate the TNF-induced NFB signaling pathway (see [21,22,23] for details of the model).
Figure 1.
Schematic diagram for the LPS-NFB-TNF signaling pathway. Due to space limitation, TRIF-dependent regulation of TNF production, IB and IB-dependent NFB deactivation and eIF2-induced translation inhibition are not illustrated. Furthermore, some states related to TNF-induced activation of IKK kinase (IKKK) are not shown. Colored arrows indicate the processes affected by the addition of Golgiplug™ (see the text for details).
Additionally, nonlinear functions proposed by Junkin et al. [24] were added to describe how the rates of TNF production and secretion increase as the amount of activated TRIF complex increases. This model incorporates the TLR4-mediated NFB dynamics induced by LPS, as well as the production of TNF in macrophages (see [21,23] for details). For the purpose of this study, two modifications were made to the model presented by Caldwell et al. [21]. First, transcription delays were ignored to facilitate the simplicity of subsequent calculations for sensitivity analysis and parameter estimation. Second, a new role of A20 protein, which was introduced in the previous model [21,23] as an inhibitor of the TNF-induced NFB signaling [23,25,26], was included in the modified model to downregulate the LPS-induced signaling through deubiquitinating of TRAF6 [27].
For this study, the TNF production at the single-cell level was measured using flow cytometry by adding Golgiplug™ since brefeldin A, the active agent of Golgiplug™, causes the Golgi apparatus to merge with endoplasmic reticulum (ER) and inhibits protein export from the Golgi complex [28,29]. Hence, the addition of Golgiplug™ enabled us to measure average single-cell production of TNF. On the other hand, because Golgiplug™ interferes with the normal cellular processes, it inevitably affects the NFB signaling dynamics. Specifically, Golgiplug™ suppresses the expression of receptors on the cellular membrane, which negatively regulates the LPS-mediated NFB signaling pathway in different ways. First, the addition of Golgiplug™ can block the translocation of TLR4 and its accessory molecules from the Golgi complex, which leads to the termination of signaling as these receptors are not replenished after turnover [28,30,31,32]. Similarly, TNFR is also depleted from the cellular membrane due to Golgiplug™ [33,34], which may inhibit subsequent TNF autocrine and paracrine signaling [35,36,37]. Second, Golgiplug™ can hinder the membrane expression of the cluster of differentiation 14 (CD14), which regulates the endocytosis of LPS or the TLR4-LPS complex [38,39,40]. Therefore, the TRIF-dependent pathway, which is initiated only after LPS or LPS-TLR4 is endocytosed into cytoplasm [5,41], can also be partially impaired. Lastly, the secretion of TNF proteins translated in response to the NFB activation will also be inhibited, which helps measure the TNF production at the single-cell level.
Consequently, the dynamic effects of Golgiplug™ were parameterized and included in the model by the following equations:
where G is the normalized activity of Golgiplug™, t is the elapsed time from the addition of Golgiplug™, is the characteristic time associated with Golgiplug™ activity, and are the constitutive synthesis rates of TNFR and TLR4, respectively, in the absence of Golgiplug™, and are the endocytosis rates of LPS and the LPS-TLR4 complex, respectively, in the absence of Golgiplug™, is the TNF secretion rate in the absence of Golgiplug™ and , , , and are the corresponding rates in the presence of Golgiplug™. After Golgiplug™ is added to the cells at , G slowly increases from zero to one, which corresponds to no inhibition of protein export to complete inhibition of protein export from the Golgi apparatus in the presence of Golgiplug™.
Since the signaling kinetics under the stimulation of LPS in the presence of Golgiplug™ were measured experimentally, the dynamic model that consists of the model presented in [21] and Equation (1) was used to simulate the dynamics of LPS-induced NFB signaling in the presence of Golgiplug™. In general, the dynamic model that simulates the signaling pathway can be represented by a set of nonlinear ordinary differential equations as follows:
where represents the concentration of the biomolecules involved in the signaling pathway (i.e., a vector of states), is a vector of model parameters that describe the biochemical reaction rates in the process, u is the concentration of LPS added to the cells (i.e., the process input), and y is the model output (i.e., the experimental measurements predicted by the model). When Golgiplug™ is added, Equation (1) is included in Equation (2), and the overall model consists of 49 states and 146 parameters (see Supplementary Materials Tables S1-S2 and Equations (S1)–(S60)).
2.4. Parameter Estimation
Since we added the Golgiplug™ module to the model developed by Caldwell et al. [21], the integrated dynamic model (the model presented in [21] and Equation (1)) was quantitatively calibrated by estimating its parameters using experimental measurements in response to different LPS concentrations in the presence of Golgiplug™.
The model parameter values were estimated by minimizing the difference between the experimental measurements and the model predictions of the protein concentration. In this work, we used flow cytometry to measure two key molecules in the LPS-induced NFB signaling pathway: TNF and IB. Since flow cytometry does not provide direct measurements of protein concentration, the mean fluorescence intensity (MFI), which is a measure of the number of copies of the target molecule per cell, was used to infer the protein concentration by assuming a linear relationship between MFI and protein concentration. The experimental data and model prediction were compared based on fold changes of MFI, which are defined as follows:
where and are the fold changes of the IB and TNF concentration at time t, , , , and are the cytoplasmic IB, nuclear IB, cytoplasmic IB-NFB complex, nuclear IB-NFB complex and intracellular TNF concentration, respectively, is the initial concentration of the corresponding biomolecules, and are the MFI of IB and intracellular TNF, respectively, and and , IB, TNF, are the corresponding MFI at and MFI of negative control, respectively. In each cell, IB can be part of four biomolecules (, , , ); however, flow cytometry measurements can only provide the total IB concentration in each cell. Therefore, the simulated concentrations of four IB-containing biomolecules were initially summed, and the fold change of the sum (i.e., ) was computed to compare with the measurements in the subsequent parameter estimation procedure.
One of the biggest challenges in estimating parameters of signaling pathways with a large number of parameters is the parameter identifiability issue [10]. That is, the exact values of some model parameters cannot be uniquely determined from experimental measurements even if a large amount of experimental measurements are available [10,11]. As the proposed model has a large number of parameters, not all the model parameters can be estimated. To this end, a subset of the model parameters, which can be uniquely estimated from the available experimental measurements, was identified through a parameter selection method [10,18]. Only these parameters were estimated against the experimental data.
First, local sensitivity analysis [10,42] was performed to compute two different sensitivity matrices and to quantify the effect of each model parameter on and (i.e., the process outputs). and represent the sensitivity matrices of the model parameters with respect to and , respectively, when the cells were stimulated with LPS in the presence of Golgiplug™. Specifically, a sensitivity matrix is defined as:
where is the number of parameters in in Equation (2), and quantifies the effect of a parameter on an output at , where is the number of measurement instants. can be computed by the following equation:
Additionally, the term in Equation (5) can be computed by integrating the following equation along with Equation (2):
Second, the Gram–Schmidt orthogonalization method [10,18] was used to identify the most important model parameters to be estimated for each . Here, is the number of singular values of whose magnitudes are at least 5% of the largest singular value [17,18]. As a result, the parameter subset to be estimated, , is chosen as the union of the selected parameters from and . Third, the least-squares problem was solved to estimate the values of by minimizing the difference between the model predictions and the experimental data of and while the values of the unselected parameters were fixed at their nominal values selected from the literature [21,24,43,44] with some modifications.
In this study, three LPS concentrations (10, 50 and 250 ng/mL) were used to stimulate cells, and the MFI of IB and TNF were measured at 0, 10, 20, 30, 60, 120, 240 and 360 min after the addition of LPS with Golgiplug™ (i.e., ). Specifically, the MFI data from 10 and 250 ng/mL of LPS (i.e., ) were used to estimate the parameter values, while the dataset from 50 ng/mL LPS was used to validate the model with the updated parameters. Then, the least-squares problem is formulated as follows:
where and are the simulated fold changes of IB and TNF, respectively, through Equation (9) at under the initial LPS concentration of in the presence of Golgiplug™, and are the corresponding experimentally measured fold changes and is the vector of the initial conditions of (see Supplementary Materials Table S1).
In the least-squares problem of Equations (7)–(11), the objective function of Equation (7) computes the difference between model predictions and the experimental measurements of the proteins in the presence of Golgiplug™. As a whole, the objective function minimizes the difference by varying the values of . While Equation (8) is integrated to compute the predicted protein concentration , , which includes Equation (1), is used if Golgiplug™ is present; otherwise, , which does not involve Equation (1), is integrated. The initial condition of the model, , is assumed based on a previous study [21,23]. Equations (10)–(11) impose lower and upper bounds on the states and parameters, respectively, based on previous studies and underlying biological knowledge [5,21,23].
It should be noted that we preserved one set of the experimental measurements (one obtained under 50 ng/mL of LPS) to validate the parameter estimation results [45]. As Equations (7)–(11) are likely to be non-convex, the choice of the initial guesses is important. In this study, the initial guesses for the above least-squares problem were obtained from Caldwell et al. [21], which were validated experimentally by comparing with the population-level measurements. Therefore, the parameter values estimated by Caldwell et al. [21] were suitable initial guesses. At the same time, Equations (7)–(11) were solved multiple times with different initial values to avoid any suboptimal optima. Model simulations and the parameter estimation were performed in MATLAB via its functions and . The absolute and relative tolerance criterion for ode15s were set as , and fmincon was implemented with multistart to obtain a better result by solving Equations (7)–(11) multiple times with different initial conditions.
3. Results
Profiles of synthesized intracellular TNF under the stimulation of LPS in the presence of Golgiplug™ demonstrated that the TNF production increased around one hour after the stimulation (Figure 2). At around the same time, the IB concentration reached its minimum, which is consistent with experimental observations in the literature [46,47,48]. Subsequently, the IB concentration increased due to the induction of IB transcript (IB) by nuclear translation of NFB, while the TNF production rate slowed down beyond 4 h of LPS stimulation (Figure 2). It should be noted that no experiments were conducted beyond 6 h after LPS was added to the cell culture based on the manufacturer’s guideline on Golgiplug™ use. This is most likely based on the fact that Golgiplug™ might induce the apoptosis of cells exposed to it for a long time [49,50]. As a result, the calibrated model is more suitable to describe the early NFB signaling pathway (≤6 h) upon the LPS stimulation.
Figure 2.
Parameter estimation before considering the Golgiplug™-induced ER stress. (a–c) Measured (empty circle) and simulated (solid line) fold changes of intracellular TNF concentrations over time were plotted under different LPS concentrations in the presence of Golgiplug™. (d–f) Measured (empty circle) and simulated (solid line) fold changes of IB concentrations over time were plotted under different LPS concentrations in the presence of Golgiplug™. Indicated amounts of LPS were used for experiments and simulations. Experimental data are given as means ± SEM (standard error of means) with at least n = 6.
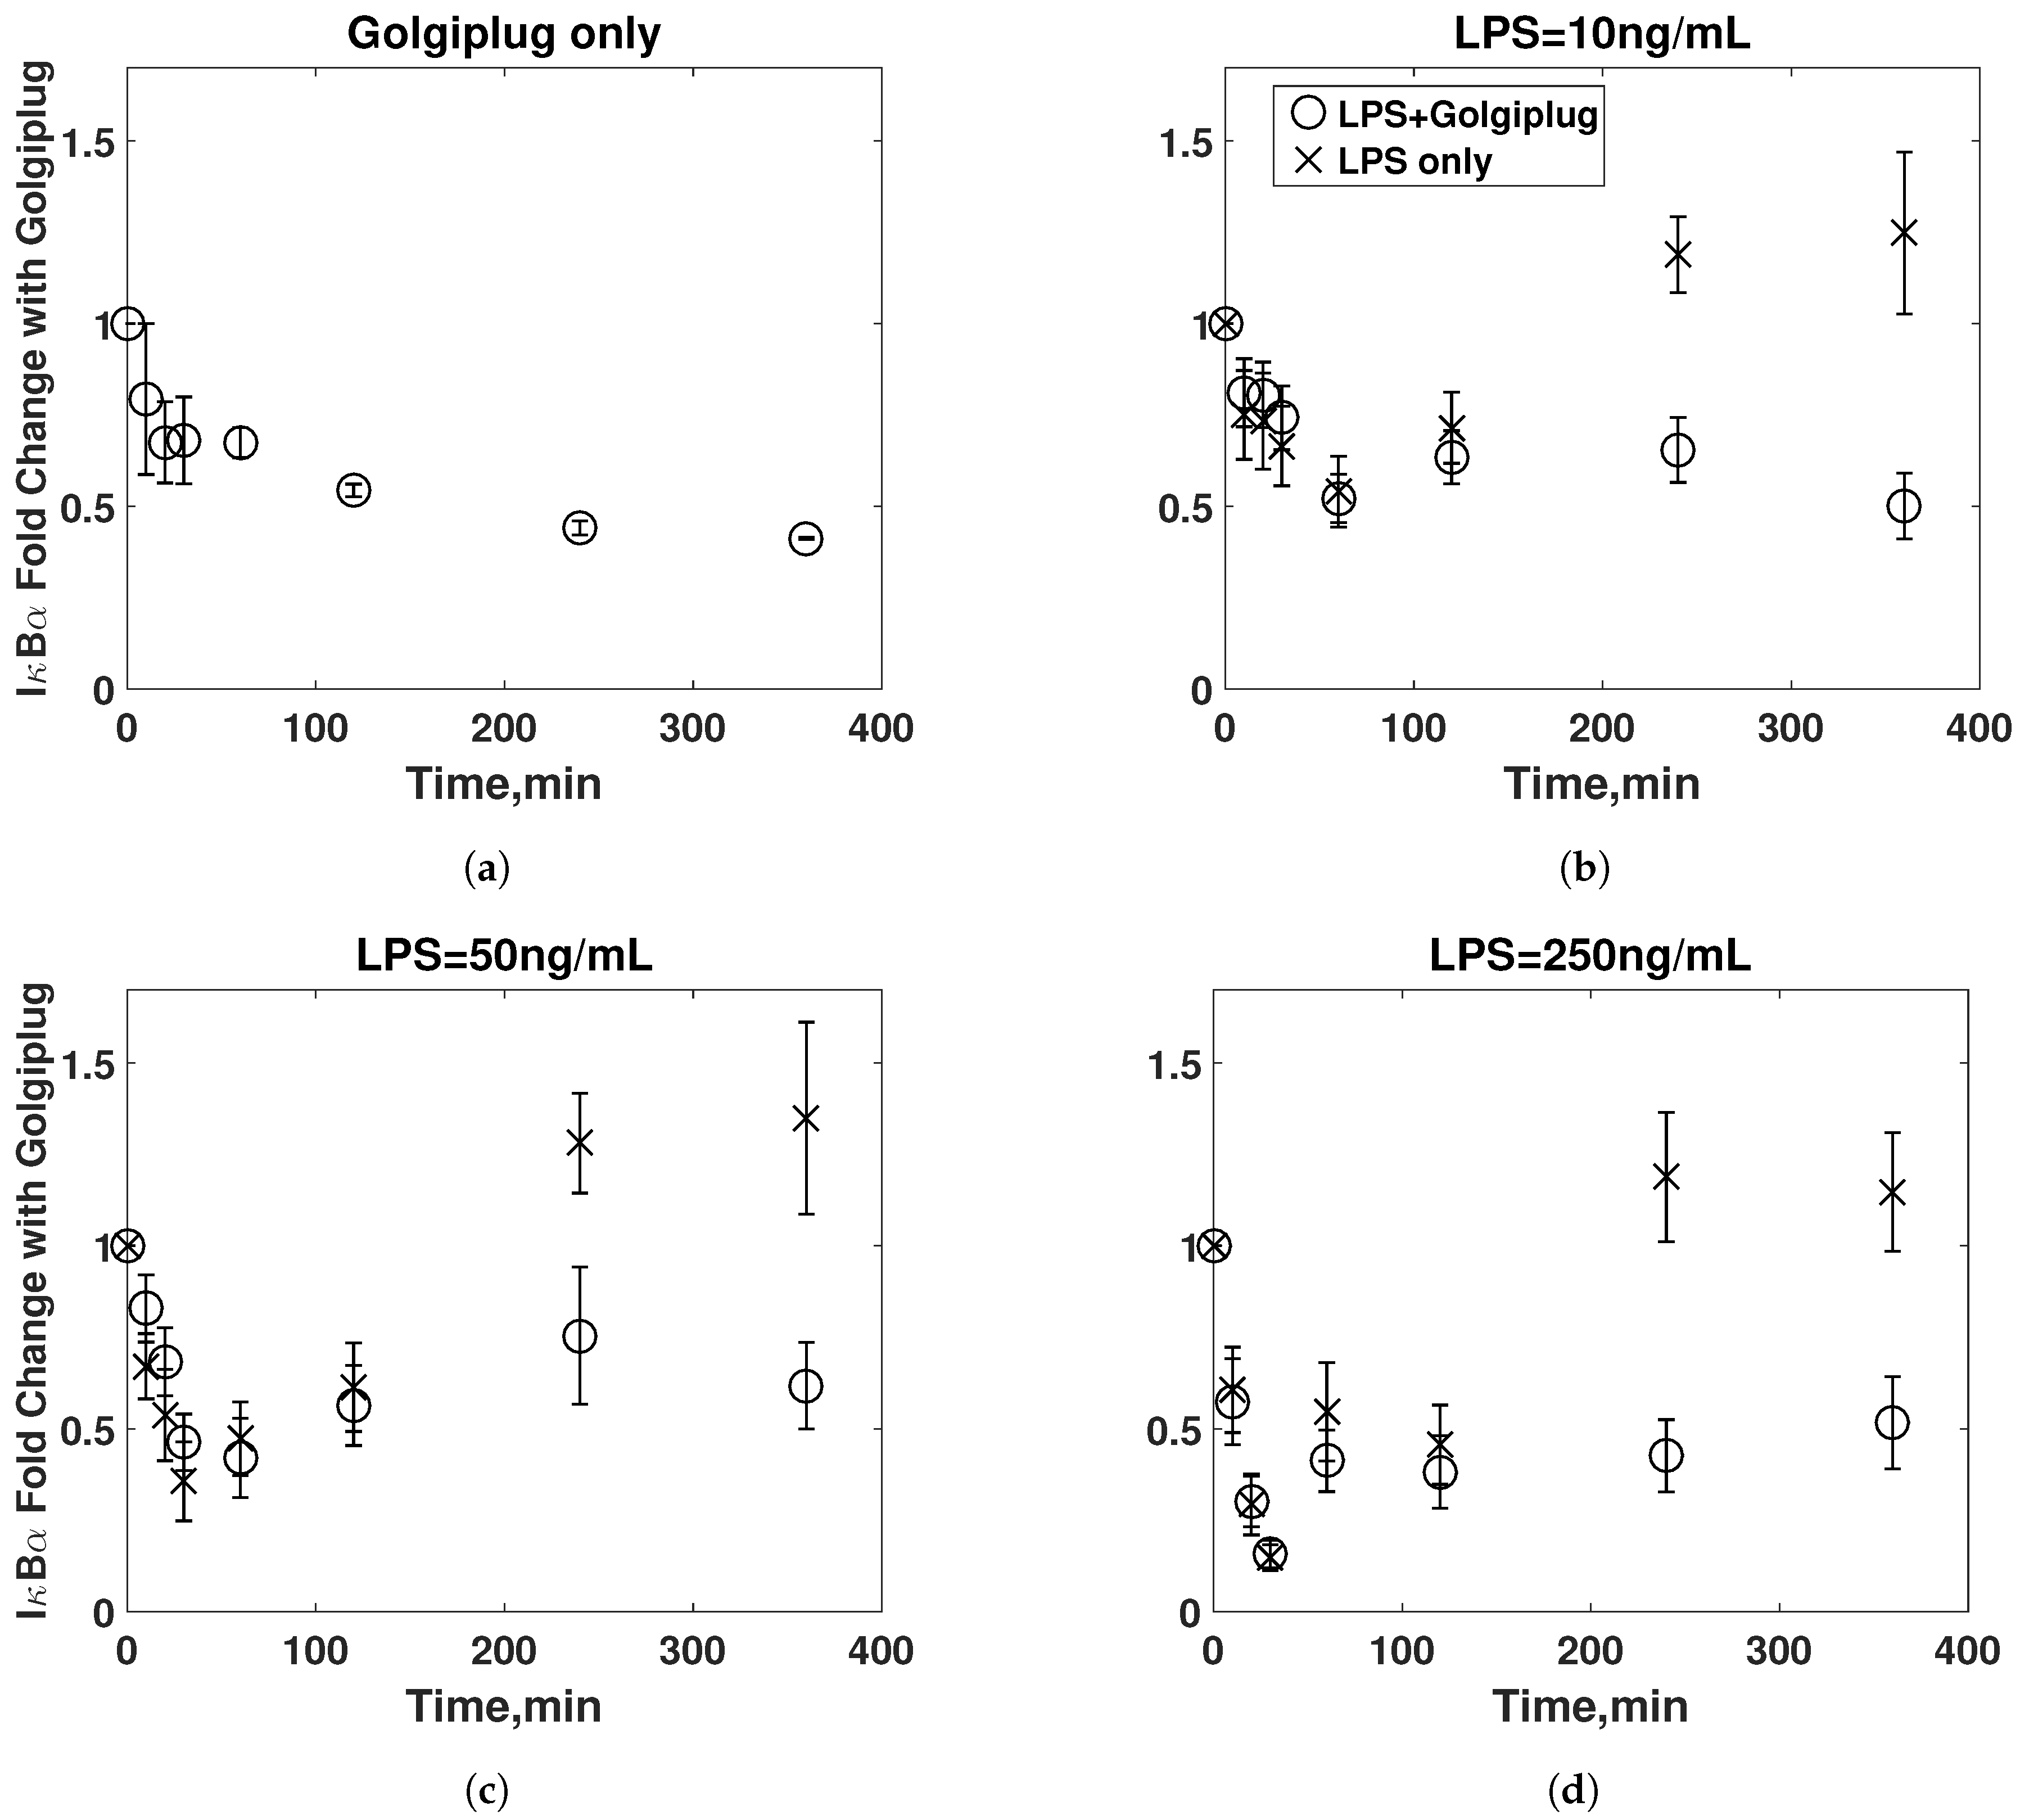
3.1. Model Validation
Based on the criteria outlined above in the previous section, six parameters (Table 1) were selected for parameter estimation. Figure 2 shows the simulated profiles of intracellular TNF and IB in macrophages under the stimulation of LPS in the presence of Golgiplug™ after the parameter estimation. While the model predictions agreed well with the experimental data obtained for 250 ng/mL of LPS, less concordance was observed between simulations and experimental data for 10 ng/mL of LPS. Specifically, the simulated concentration of intracellular TNF was one order of magnitude lower than the MFI data, while the simulated IB dynamics were qualitatively similar to the measured MFI values. Since the discrepancy between the model prediction and the experimental measurements was pronounced with 10 ng/mL of LPS, we hypothesized that the lack of agreement between the simulations and experimental data was because the effects of Golgiplug™ addition were not adequately represented in the model structure and were more pronounced at the lower LPS concentration.
Table 1.
The selected parameters when Golgiplug™-induced IB translation inhibition was not considered.
3.2. Golgiplug™-Induced ER Stress
One possible explanation for this discrepancy could be that the addition of Golgiplug™ induced other signaling pathways, which altered NFB signaling dynamics [51]. As Golgiplug™ prevents protein secretion by causing collapse of the Golgi apparatus into the ER, synthesized proteins will be redistributed from the Golgi complex into the ER [29]. A direct consequence of Golgiplug™ addition could be accumulation of newly synthesized proteins in ER, which may induce ER stress [51]. It is well established that the ER stress leads to phosphorylation of eukaryotic initiation factor 2 -subunit (eIF2), which partially inhibits the translation of IB in the NFB signaling pathway [51,52,53,54]. This could lead to a decrease in the overall kinetics of the LPS-induced NFB signaling as the concentration of IB proteins would be kept lower, leading to the aforementioned mismatch between the model predictions and experimental data. Since the low LPS concentration induces less IB and its isomers (IB and IB) (Figure 2), the entire LPS-induced NFB pathway dynamics would be affected more significantly by Golgiplug™ at a lower LPS concentration than at a high LPS concentration if the translation of IB and its isomers is partially inhibited. If this is true, it can lead to the pronounced disagreement between the model prediction and the experimental measurement under the stimulation of 10 ng/mL LPS as shown in Figure 2.
Therefore, we examined whether the Golgiplug™ addition could modulate IB levels in macrophages. First, the fold change in IB MFI with the stimulation of LPS alone, Golgiplug ™ alone, and LPS and Golgiplug ™ in macrophages were compared. Figure 3a shows that Golgiplug™ alone lowers the concentration of IB, and Figure 3b–d show that the IB kinetics were altered when the cells were stimulated with LPS and Golgiplug™. While IB levels initially decreased when cells were exposed to LPS alone, they recovered to pre-stimulation levels after 3 h of exposure. However, when LPS was added along with Golgiplug™, IB levels continued to be lower than pre-stimulation levels (Figure 3b–d). These results suggested that Golgiplug™ could affect the IB kinetics (presumably through the eIF2 phosphorylation) [52,54]. This also explains the observations in Figure 2a–c, where the intracellular TNF concentration continued to increase since the Golgiplug™-induced response prolonged the NFB activation by inhibiting the IB synthesis.
Figure 3.
Kinetics of IB fold changes when the cells were stimulated by (a) 0, (b) 10, (c) 50, and (d) 250 ng/mL of LPS in the presence (empty circles) or absence (x marks) of Golgiplug™. Data are given as means ± SEM with at least n = 3.
3.3. Model Refinement
In order to account for the Golgiplug™-induced translation inhibition, the following equation was considered in addition to Equation (1):
where and are the IB, translation rates in the presence and absence of Golgiplug™, respectively, is a coefficient for the maximum translation inhibition and K is the Michaelis constant of the eIF2 phosphorylation. Equation (12) was included in Equation (2) along with Equation (1) for an accurate simulation. The process affected by this translation inhibition is shown in Figure 1 via a red arrow.
The proposed dynamic model was calibrated again using the parameter estimation procedure as described above. Since the additional measurements of the IB dynamics in the absence of Golgiplug™ were obtained, an extra sensitivity matrix was calculated, and the following was added to the objective function (7):
where and are the simulated and measured IB fold change, respectively, in the absence of Golgiplug™.
3.4. Final Model Validation
Based on the updated model structure and the available experimental data, the aforementioned parameter selection approach determined eight parameters, which could be uniquely estimated (Table 2). Most of the parameters selected by the proposed parameter selection procedure were relevant to the core NFB-IB feedback system such as Hill coefficients for IB- and - transcription, IKK deactivation, and IB transcript degradation rate. The remaining identified parameters are the TLR4 constitutive generation rate, C1 (TNFR complex [23]) deactivation rate and eIF2 phosphorylation coefficient, which are most relevant to the LPS- and TNF-induced NFB activation, as well as the effects of Golgiplug™, respectively. Hence, all major processes considered in this system, which included the LPS- and TNF-induced NFB signaling pathway in the presence of Golgiplug™, were quantitatively validated against the single-cell experimental data.
Table 2.
Selected parameters and their newly estimated values for the final model.
Figure 4 shows simulated fold changes in IB and intracellular TNF after parameter estimation. The simulated profiles were again compared with the experimental data. The normalized root-mean-squares of the parameter estimation results before and after the incorporation of the Golgiplug™ model (Equation (12)) were 3.8 and 2.5, respectively, which demonstrated the improvement of the model fidelity. Overall, the model predictions were in qualitative and quantitative agreement with both training datasets and validation datasets, as well as the literature data, which validated the prediction capability of the calibrated model, as well as our hypothesis on the effect of Golgiplug™ on the inhibition of IB translation. The results demonstrated that the calibrated model is capable of predicting input-output responses in the NFB pathway. Additionally, the predictions from the current model were compared with the model proposed by Caldwell et al. [21] (Figure 4g–i). The proposed model was able to predict the observed IB dynamics under all LPS concentrations more accurately than the previous model by Caldwell et al. [21], which again demonstrated that the predictive capability of the model was improved in terms of simulating the IB dynamics.
Figure 4.
Parameter estimation considering Golgiplug™-induced ER stress. (a–c) Measured (empty circle) and simulated (solid line) fold changes of intracellular TNF concentrations over time were plotted in the presence of Golgiplug™. (d–f) Measured (empty circle) and simulated (solid line) fold changes of IB concentrations over time were plotted in the presence of Golgiplug™. (g–i) Measured (empty circle) and simulated (solid line) fold changes of IB concentrations over time were plotted in the absence of Golgiplug™. The IB dynamics predicted by the model in [21,24] were also plotted in (g–i) for comparison. Indicated amounts of LPS were used for experiments and simulations.
In order to further assess the predictive capability of the newly calibrated model, the simulated dynamics of nuclear NFB levels (i.e., activated NFB) in the absence of Golgiplug™ were computed and plotted in Figure 5a. The maximum NFB translocation to the nucleus occurred within 2 h of LPS addition, which was consistent with previous experimental studies [15,55,56]. Moreover, as the LPS concentration increased, the nuclear NFB levels reached their maximum value earlier (i.e., at 50, 60, 75 and 105 min after adding LPS), and the areas under the curves in Figure 5a, which were computed as indicators of the signal strength, were around 20 M·min for different concentrations of LPS. Interestingly, a 25-fold change in the LPS concentration only resulted in less than a 100% change in the signal strength. This observation was consistent with single-cell studies by Tay et al. [14,57], where they observed a relatively constant peak intensity and decreasing response time of the NFB signal in mouse 3T3 cells upon TNF or LPS stimulation.
Figure 5.
Simulated dynamics of NFB nuclear translation and TNF secretion. (a) Nuclear NFB concentration and (b) the amount of TNF secreted to the medium upon stimulation by 10, 50, 100 and 250 ng/mL of LPS. (c) The simulated dynamics of TNF concentration in the medium was compared with the measurement by Maiti et al. [15] in response to 100 ng/mL of LPS. The TNF concentration at each point was normalized to the maximum value obtained.
Figure 5b shows the predicted amount of TNF secreted under different LPS stimulation conditions in macrophages. As the LPS concentration increased, the concentration of secreted TNF increased, which was expected since the signal (area under the peak) became stronger. Furthermore, similar to previous studies [15,21,58], the TNF concentration peaked around 5 h after stimulation and gradually declined thereafter; however, the rate of decline was slower than that reported by Maiti et al. [15] (Figure 5c), where they measured the TNF secretion dynamics from RAW264.7 macrophages in response to LPS stimulation at the population level. This observation was consistent with the observation reported by Xue et al. [13], who observed using human monocyte-derived macrophages the amount of TNF secreted to the medium from a single cell in a cell population was less than that from an isolated single-cell at 20 h after the LPS stimulation. This suggested that the simulated dynamics by the proposed model is qualitatively similar to the signaling dynamics of an isolated single-cell instead of population-averaged dynamics, which was expected since the kinetic data obtained under Golgiplug™ were used to train the model.
4. Discussion
In this study, we have developed a dynamic model that can accurately simulate the average single-cell dynamics of the NFB signaling pathway by combining the single-cell measurements and a numerical scheme with sensitivity analysis, parameter selection and parameter estimation. The dynamic model was built based on a previously developed NFB model [21,23,24] and calibrated using the experimental data and the aforementioned numerical scheme. Predictions from the developed dynamic model are in good agreement with the experimental measurements under all LPS concentrations, which demonstrates that the model is capable of simulating the average single-cell dynamics.
Previous studies have used stochastic simulation algorithms such as Gillespie’s algorithm [59] and approximate methods of Gillespie’s algorithm [60,61,62,63] to study single-cell dynamics and investigate heterogeneity in signaling pathways at the single-cell level [2,5,64]. For example, Lipniacki et al. [14,64] proposed a hybrid stochastic-deterministic model of the TNF-induced NFB signaling pathway that was able to reproduce the heterogeneous responses observed in the single-cell measurements [14,65] and identify possible origins of the heterogeneity. However, stochastic simulation algorithms are computationally expensive, and they are difficult to fit to experimental measurements for model validation [7,66,67]. A more viable method is a semi-stochastic model, which uses deterministic modeling with model parameters that have distributions [5,6,7], to reduce the computational cost while still studying the cell-to-cell variability. The dynamic model developed here can accurately simulate average single-cell dynamics and is a first step towards building a semi-stochastic model of the NFB signaling.
The development of such a deterministic model for building a semi-stochastic model requires accurate parameter estimation, where values of model parameters are estimated by solving an optimization problem (Equations (7)–(11)). However, parameter estimation is a nontrivial problem due to, but not limited to, ill conditioning, over-fitting and the non-identifiability of model parameters [9,68,69]. The ill-conditioning and over-fitting problems during parameter estimation are attributed to the fact that available experimental measurements are usually very limited and noisy, while mathematical models of signaling pathways are often very comprehensive and include a large number of parameters [9,10]. As a result, the solution to the parameter estimation problem is likely to be non-unique or very sensitive to noise present in the experimental measurements. Furthermore, even if a large number of noise-free experimental measurements are available, the value of a parameter cannot be uniquely determined if the parameter is not identifiable [10,11]; hence, it is necessary to check the parameter identifiability a priori.
The model developed in this work contains 148 parameters with limited experimental data, and hence, parameter estimation is very likely to suffer from the aforementioned issues in the parameter estimation procedure. Therefore, we implemented an integrated method combining sensitivity analysis and parameter selection before parameter estimation. Specifically, the sensitivity analysis quantified the effects of each parameter on the measurements, and the parameter selection method selected identifiable parameters via Gram–Schmidt orthogonalization. Then, the values of only the selected parameters were estimated in the parameter estimation, while the values of remaining parameters were fixed at their nominal values, which effectively alleviated the ill-conditioning problem by reducing the degrees of freedom in Equations (7)–(11) [9,10,68].
After parameter estimation, the simulated profiles of intracellular TNF and IB exhibited reasonable agreement between the model predictions and the experimental measurements at all LPS concentrations (Figure 4). Furthermore, as shown in Figure 5c, model predictions after parameter estimation were distinct from that of a cell population as the simulated profiles were closer to the signaling dynamics of isolated single-cells. This was likely because the use of Golgiplug™ inhibited secretion of cytokines [70] and hence minimized potential autocrine and paracrine signaling from the secreted cytokines. This is important as the autocrine and paracrine signaling has been proposed as a key component in determining the overall signaling dynamics of cells in a population [13,35,36,71]. Therefore, the proposed model, which was trained by the single-cell dynamics from flow cytometry in the presence of Golgiplug™, was able to describe the single-cell NFB dynamics under minimal cytokine feedback.
It should be noted that the current model simulates the LPS-induced NFB signaling dynamics in a cell, but it does not consider the initiation of the NFB signaling pathway by TNF secreted by neighboring cells. Hence, the flow cytometry measurements obtained in the presence of Golgiplug™ are appropriate to identify realistic parameter values to reproduce average single-cell dynamics. At the same time, as flow cytometry measures cellular responses from thousands of cells simultaneously, flow cytometry can provide distributions of the measurements (see Supplementary Materials Figures S1–S3). Based on this statistical information, one can estimate the distributions of the parameters by different methods such as Bayesian approaches [6,7] or generalized polynomial chaos [72]. The model with the estimated parameter distributions is then the semi-stochastic model that can be used to study the heterogeneity in cellular responses.
The present study also suggests that cytokine production data acquired using flow cytometry in the presence of Golgiplug™ should be interpreted cautiously. As Golgiplug™ can block cytokine secretion, it is often used to assess the cytokine production at the single-cell level using flow cytometry [73,74,75]. The data shown in the work suggest that the dynamics of transcription factors and other signaling intermediates may be altered by the addition of Golgiplug™ (Figure 3). Therefore, data from studies using Golgiplug™ need to be interpreted cautiously, and a model-based approach like the one presented here can be useful in eliminating the effects of Golgiplug™ and extract true signaling dynamics from flow cytometry data.
5. Conclusions
We systemically extracted the average single-cell dynamics of the LPS-induced NFB signaling pathway through the integration of sensitivity analysis and a parameter selection scheme with flow cytometry data of key protein intermediates. Based on the measurements and the model structure, key model parameters were identified and estimated to maximize the prediction accuracy of the calibrated model while avoiding overfitting. The mismatch between the model predictions and experimental observations even after the parameter estimation revealed the existence of a previously unconsidered, yet important, mechanism related to Golgiplug™, which was subsequently validated by experiments and led to the update of the proposed model. Then, the resultant model was validated, and the simulated profiles from the updated model were in good agreement with experimental datasets under three different LPS concentrations. This model can be used as the nominal model to construct a deterministic model that has parameters with distributions and can be used to study the stochasticity in signaling.
Supplementary Materials
The model parameters and equations are available at http://www.mdpi.com/2227-9717/6/3/21/s1. Furthermore, representative histograms of IB and TNF levels measured using flow cytometry are provided in the Supplementary Materials Figures S1–S3.
Acknowledgments
Financial support from Artie McFerrin Department of Chemical Engineering, the Texas A&M Energy Institute, the National Institutes of Health (1R01 AI110642-01) to AJand the Ray Nesbitt Chair endowment is acknowledged. We thank Zhang Cheng and Professor Alexander Hoffmann (University of California, Los Angeles) for sharing their MATLAB scripts for simulating the NFB signaling pathway, and we also thank Professor Juergen Hahn (Rensselaer Polytechnic Institute) for critical comments and suggestions.
Author Contributions
D.L., Y.D., A.J. and J.K. conceived of and designed the study. Y.D. performed the experiments. D.L. and J.K. developed the mathematical model and estimated its parameters. D.L., Y.D., A.J. and J.K. analyzed the data. D.L., Y.D., A.J. and J.K. wrote the paper.
Conflicts of Interest
The authors declare no conflict of interest. The funding sponsors had no role in the design of the study; in the collection, analyses or interpretation of the data; in the writing of the manuscript; nor in the decision to publish the results.
Abbreviations
The following abbreviations are used in this manuscript:
| LPS | lipopolysaccharide |
| NFB | nuclear factor B |
| TNF | tumor necrosis factor |
| IB | inhibitor of B, |
| TLR4 | Toll-like receptor 4 |
| IKK | IB kinase |
| MyD88 | myeloid differentiation primary response 88 |
| TIR | Toll/interleukin-1 receptor |
| TRIF | TIR-domain-containing adaptor-inducing interferon- |
| TRAF6 | TNF receptor-associated factor 6 |
| IKKK | IKK kinase |
| ER | endoplasmic reticulum |
| TNFR | TNF receptor |
| CD14 | cluster of differentiation 14 |
| MFI | mean fluorescence intensity |
| IB | IB transcript |
| eIF2 | eukaryotic initiation factor 2 -subunit |
| C1 | TNFR complex |
References
- Hughey, J.J.; Lee, T.K.; Covert, M.W. Computational modeling of mammalian signaling networks. Wiley Interdisciplin. Rev. Syst. Biol. Med. 2010, 2, 194–209. [Google Scholar] [CrossRef] [PubMed]
- Handly, L.N.; Yao, J.; Wollman, R. Signal transduction at the single-cell level: Approaches to study the dynamic nature of signaling networks. J. Mol. Biol. 2016, 428, 3669–3682. [Google Scholar] [CrossRef] [PubMed]
- Gaudet, S.; Miller-Jensen, K. Redefining signaling pathways with an expanding single-cell toolbox. Trends Biotechnol. 2016, 34, 458–469. [Google Scholar]
- Cohen, A.A.; Geva-Zatorsky, N.; Eden, E.; Frenkel-Morgenstern, M.; Issaeva, I.; Sigal, A.; Milo, R.; Cohen-Saidon, C.; Liron, Y.; Kam, Z.; et al. Dynamic proteomics of individual cancer cells in response to a drug. Science 2008, 322, 1511–1516. [Google Scholar] [CrossRef] [PubMed]
- Cheng, Z.; Taylor, B.; Ourthiague, D.R.; Hoffmann, A. Distinct single-cell signaling characteristics are conferred by the MyD88 and TRIF pathways during TLR4 activation. Sci. Signal. 2015, 8, ra69. [Google Scholar] [CrossRef] [PubMed]
- Hasenauer, J.; Waldherr, S.; Doszczak, M.; Radde, N.; Scheurich, P.; Allgöwer, F. Identification of models of heterogeneous cell populations from population snapshot data. BMC Bioinform. 2011, 12, 125. [Google Scholar] [CrossRef] [PubMed]
- Hasenauer, J.; Waldherr, S.; Doszczak, M.; Scheurich, P.; Radde, N.; Allgöwer, F. Analysis of heterogeneous cell populations: A density-based modeling and identification framework. J. Process Control 2011, 21, 1417–1425. [Google Scholar] [CrossRef]
- Williams, R.A.; Timmis, J.; Qwarnstrom, E.E. Computational models of the NF-κB signalling pathway. Computation 2014, 2, 131–158. [Google Scholar] [CrossRef]
- Gábor, A.; Villaverde, A.F.; Banga, J.R. Parameter identifiability analysis and visualization in large-scale kinetic models of biosystems. BMC Syst. Biol. 2017, 11, 54. [Google Scholar] [CrossRef] [PubMed]
- Kravaris, C.; Hahn, J.; Chu, Y. Advances and selected recent developments in state and parameter estimation. Comput. Chem. Eng. 2013, 51, 111–123. [Google Scholar] [CrossRef]
- Raue, A.; Kreutz, C.; Maiwald, T.; Bachmann, J.; Schilling, M.; Klingmüller, U.; Timmer, J. Structural and practical identifiability analysis of partially observed dynamical models by exploiting the profile likelihood. Bioinformatics 2009, 25, 1923–1929. [Google Scholar] [CrossRef] [PubMed]
- Kravaris, C.; Seinfeld, J.H. Identification of parameters in distributed parameter systems by regularization. SIAM J. Control Optim. 1985, 23, 217–241. [Google Scholar] [CrossRef]
- Xue, Q.; Lu, Y.; Eisele, M.R.; Sulistijo, E.S.; Khan, N.; Fan, R.; Miller-Jensen, K. Analysis of single-cell cytokine secretion reveals a role for paracrine signaling in coordinating macrophage responses to TLR4 stimulation. Sci. Signal. 2015, 8, ra59. [Google Scholar] [CrossRef] [PubMed]
- Tay, S.; Hughey, J.J.; Lee, T.K.; Lipniacki, T.; Quake, S.R.; Covert, M.W. Single-cell NF-κB dynamics reveal digital activation and analogue information processing. Nature 2010, 466, 267. [Google Scholar] [CrossRef] [PubMed]
- Maiti, S.; Dai, W.; Alaniz, R.C.; Hahn, J.; Jayaraman, A. Mathematical modeling of pro- and anti-inflammatory signaling in macrophages. Processes 2015, 3, 1–18. [Google Scholar] [CrossRef]
- Hayden, M.S.; Ghosh, S. NF-κB, the first quarter-century: Remarkable progress and outstanding questions. Genes Dev. 2012, 26, 203–234. [Google Scholar] [CrossRef] [PubMed]
- Chu, Y.; Hahn, J. Parameter set selection via clustering of parameters into pairwise indistinguishable groups of parameters. Ind. Eng. Chem. Res. 2009, 48, 6000–6009. [Google Scholar] [CrossRef]
- Yao, K.Z.; Shaw, B.M.; Kou, B.; McAuley, K.B. Modeling ethylene/butene copolymerization with multi-site catalysts: Parameter estimability and experimental design. Polym. React. Eng. 2003, 3, 563–588. [Google Scholar] [CrossRef]
- Prussin, C. Cytokine flow cytometry: Understanding cytokine biology at the single-cell level. J. Clin. Immunol. 1997, 17, 195. [Google Scholar] [CrossRef] [PubMed]
- Schulz, K.R.; Danna, E.A.; Krutzik, P.O.; Nolan, G.P. Single-cell phospho-protein analysis by flow cytometry. Curr. Protoc. Immunol. 2012, 8–17. [Google Scholar] [CrossRef]
- Caldwell, A.B.; Cheng, Z.; Vargas, J.D.; Birnbaum, H.A.; Hoffmann, A. Network dynamics determine the autocrine and paracrine signaling fucntions of TNF. Genes Dev. 2014, 28, 2120–2133. [Google Scholar] [CrossRef] [PubMed]
- Hoffmann, A.; Levchenko, A.; Scott, M.L.; Baltimore, D. The IκB-NF-κB signaling module: Temporal control and selective gene activation. Science 2002, 298, 1241–1245. [Google Scholar] [CrossRef] [PubMed]
- Werner, S.L.; Kearns, J.D.; Zadorozhnaya, V.; Lynch, C.; O’Dea, E.; Boldin, M.P.; Ma, A.; Baltimore, D.; Hoffmann, A. Encoding NF-κB temporal control in response to TNF: Distinct roles for the negative regulators IκBα and A20. Genes Dev. 2008, 22, 2093–2101. [Google Scholar] [CrossRef] [PubMed]
- Junkin, M.; Kaestli, A.J.; Cheng, Z.; Jordi, C.; Albayrak, C.; Hoffmann, A.; Tay, S. High-content quantification of single-cell immune dynamics. Cell Rep. 2016, 15, 411–422. [Google Scholar] [CrossRef] [PubMed]
- Krikos, A.; Laherty, C.D.; Dixit, V.M. Transcriptional activation of the tumor necrosis factor α-inducible zinc finger protein, a20, is mediated by κB elements. J. Biol. Chem. 1992, 267. [Google Scholar]
- Lee, E.G.; Boone, D.L.; Chai, S.; Libby, S.L.; Chien, M.; Lodolce, J.P.; Ma, A. Failure to regulate TNF-induced NF-κB and cell death responses in A20-deficient mice. Science 2000, 289, 2350–2354. [Google Scholar] [CrossRef] [PubMed]
- Boone, D.L.; Turer, E.E.; Lee, E.G.; Ahmad, R.C.; Wheeler, M.T.; Tsui, C.; Hurley, P.; Chien, M.; Chai, S.; Hitotsumatsu, O.; et al. The ubiquitin-modifying enzyme A20 is required for termination of Toll-like receptor responses. Nat. Immunol. 2004, 5, 1052–1060. [Google Scholar] [CrossRef] [PubMed]
- Chardin, P.; McCormick, F. Brefeldin A: The advantage of being uncompetitive. Cell 1999, 97, 153–155. [Google Scholar] [CrossRef]
- Ward, T.H.; Polishchuk, R.S.; Caplan, S.; Hirschberg, K.; Lippincott-Schwartz, J. Maintenance of Golgi structure and function depends on the integrity of ER export. J. Cell Biol. 2001, 155, 557–570. [Google Scholar] [CrossRef] [PubMed]
- Latz, E.; Visintin, A.; Lien, E.; Fitzgerald, K.A.; Monks, B.G.; Kurt-Jones, E.A.; Golenbock, D.T.; Espevik, T. Lipopolysaccharide rapidly traffics to and from the Golgi apparatus with the Toll-like Receptor 4-MD-2-CD14 complex in a process that Is distinct from the initiation of signal transduction. J. Biol. Chem. 2002, 49, 47834–47843. [Google Scholar] [CrossRef] [PubMed]
- Liaunardy-Jopeace, A.; Bryant, C.E.; Gay, N.J. The COPII adaptor protein TMED7 is required to initiate and mediate the anterograde trafficking of Toll-like receptor 4 to the plasma membrane. Sci. Signal. 2014, 7, ra70. [Google Scholar] [CrossRef] [PubMed]
- Wang, D.; Lou, J.; Ouyang, C.; Chen, W.; Liu, Y.; Liu, X.; Cao, X.; Wanga, J.; Lu, L. Ras-related protein Rab10 facilitates TLR4 signaling by promoting replenishment of TLR4 onto the plasma membrane. Proc. Natl. Acad. Sci. USA 2010, 107, 13806–13811. [Google Scholar] [CrossRef] [PubMed]
- Jones, S.J.; Ledgerwood, E.C.; Prins, J.B.; Galbraith, J.; Johnson, D.R.; Pober, J.S.; Bradley, J.R. TNF recruits TRADD to the plasma membrane but not the trans-Golgi Network, the principal subcellular location of TNF-R1. J. Immunol. 1999, 162, 1042–1048. [Google Scholar] [PubMed]
- Neznanov, N.; Kondratova, A.; Chumakov, K.M.; Angres, B.; Zhumabayeva, B.; Agol, V.I.; Gudkov, A.V. Poliovirus protein 3A inhibits tumor necrosis factor (TNF)-induced apoptosis by eliminating the TNF receptor from the cell surface. J. Virol. 2001, 75, 10409–10420. [Google Scholar] [CrossRef] [PubMed]
- Xaus, J.; Comalada, M.; Valledor, A.F.; Lloberas, J.; López-Soriano, F.; Argilés, J.M.; Bogdan, C.; Celada, A. LPS induces apoptosis in macrophages mostly through the autocrine production of TNF-α. Blood 2000, 95, 3823–3831. [Google Scholar] [PubMed]
- Covert, M.W.; Leung, T.H.; Gaston, J.E.; Baltimore, D. Achieving stability of lipopolysaccharide-induced NF-κB activation. Science 2005, 309, 1854–1857. [Google Scholar] [CrossRef] [PubMed]
- Lombardo, E.; Alvarez-Barrientos, A.; Maroto, B.; Boscà, L.; Knaus, U.G. TLR4-mediated survival of macrophages is MyD88 dependent and requires TNF-α autocrine signalling. J. Immunol. 2007, 178, 3731–3739. [Google Scholar] [CrossRef] [PubMed]
- Zanoni, I.; Ostuni, R.; Marek, L.R.; Barresi, S.; Barbalat, R.; Barton, G.M.; Granucci, F.; Kagan, J.C. CD14 controls the LPS-induced endocytosis of Toll-like Receptor 4. Cell 2011, 147, 868–880. [Google Scholar]
- Tan, Y.; Zanoni, I.; Cullen, T.W.; Goodman, A.L.; Kagan, J.C. Mechanisms of Toll-like receptor 4 endocytosis reveal a common immune-evasion strategy used by pathogenic and commensal bacteria. Immunity 2015, 43, 909–922. [Google Scholar] [CrossRef] [PubMed]
- Rajaiah, R.; Perkins, D.J.; Ireland, D.D.C.; Vogel, S.N. CD14 dependence of TLR4 endocytosis and TRIF signaling displays ligand specificity and is dissociable in endotoxin tolerance. Proc. Natl. Acad. Sci. USA 2013, 112, 8391–8396. [Google Scholar] [CrossRef] [PubMed]
- Kagan, J.C.; Su, T.; Horng, T.; Chow, A.; Akira, S.; Medzhitov, R. TRAM couples endocytosis of Toll-like receptor 4 to the induction of interferon-β. Nat. Immunol. 2008, 9, 361–368. [Google Scholar] [CrossRef] [PubMed]
- Chu, Y.; Jayaraman, A.; Hahn, J. Parameter sensitivity analysis of IL-6 signaling pathways. IET Syst. Biol. 2007, 1, 342–352. [Google Scholar] [CrossRef] [PubMed]
- Lin, S.C.; Lo, Y.C.; Wu, H. Helical assembly in the MyD88-IRAK4-IRAK2 complex in TLR/IL-1R signalling. Nature 2010, 465, 885–890. [Google Scholar] [CrossRef] [PubMed]
- Bagnall, J.; Boddington, C.; Boyd, J.; Brignall, R.; Rowe, W.; Jones, N.A.; Schmidt, L.; Spiller, D.G.; White, M.R.; Paszek, P. Quantitative dynamic imaging of immune cell signalling using lentiviral gene transfer. Integr. Biol. 2015, 7, 713–725. [Google Scholar] [CrossRef] [PubMed]
- Moya, C.; Huang, Z.; Cheng, P.; Jayaraman, A.; Hahn, J. Investigation of IL-6 and IL-10 signalling via mathematical modelling. IET Syst. Biol. 2011, 5, 15–26. [Google Scholar] [CrossRef] [PubMed]
- Sung, M.H.; Li, N.; Lao, Q.; Gottschalk, R.A.; Hager, G.L.; Fraser, I.D.C. Switching of the relative dominance between feedback mechanisms in lipopolysaccharide-Induced NF-κB signaling. Sci. Signal. 2014, 7, ra6. [Google Scholar] [CrossRef] [PubMed]
- Tsukamoto, H.; Fukudome, K.; Takao, S.; Tsuneyoshi, N.; Kimoto, M. Lipopolysaccharide-binding protein-mediated Toll-like receptor 4 dimerization enables rapid signal transduction against lipopolysaccharide stimulation on membrane-associated CD14-expressing cells. Int. Immunol. 2010, 22, 271–280. [Google Scholar] [CrossRef] [PubMed]
- Sakai, J.; Cammarota, E.; Wright, J.A.; Cicuta, P.; Gottschalk, R.A.; Li, N.; Fraser, I.D.C.; Bryant, C.E. Lipopolysaccharide-induced NF-κB nuclear translocation is primarily dependent on MyD88, but TNFα expression requires TRIF and MyD88. Sci. Rep. 2017, 7, 1428. [Google Scholar] [CrossRef] [PubMed]
- Shao, R.G.; Shimizu, T.; Pommier, Y. Brefeldin A Is a potent inducer of apoptosis in human cancer cells independently of p53. Exp. Cell Res. 1996, 227, 190–196. [Google Scholar] [CrossRef] [PubMed]
- Moon, J.L.; Kim, S.Y.; Shin, S.W.; Park, J.W. Regulation of brefeldin A-induced ER stress and apoptosis by mitochondrial NADP+-dependent isocitrate dehydrogenase. Biochem. Biophys. Res. Commun. 2012, 417, 760–764. [Google Scholar] [CrossRef] [PubMed]
- Cláudio, N.; Dalet, A.; Gatti, E.; Pierre, P. Mapping the crossroads of immune activation and cellular stress response pathways. EMBO J. 2013, 32, 1214–1224. [Google Scholar] [CrossRef] [PubMed]
- Mellor, H.; Kimball, S.R.; Jefferson, L.S. Brefeldin A inhibits protein synthesis through the phosphorylation of the α-subunit of eukaryotic initiation factor-2. FEBS Lett. 1994, 350, 143–146. [Google Scholar] [CrossRef]
- Tam, A.B.; Mercado, E.L.; Hoffmann, A.; Niwa, M. ER stress activates NF-κB by integrating functions of basal IKK activity, IRE1 and PERK. PLoS ONE 2012, 7, e45078. [Google Scholar] [CrossRef] [PubMed]
- Fishman, P.E.; Curran, P.K. Brefeldin A inhibits protein synthesis in cultured cells. FEBS Lett. 1992, 314, 371–374. [Google Scholar] [CrossRef]
- Ando, Y.; Oku, T.; Tsuji, T. Platelet supernatant suppresses LPS-induced nitric oxide production from macrophages accompanied by inhibition of NF-κB signaling and increased Arginase-1 expression. PLoS ONE 2016. [Google Scholar] [CrossRef] [PubMed]
- Selimkhanov, J.; Taylor, B.; Yao, J.; Pilko, A.; Albeck, J.; Hoffmann, A.; Tsimring, L.; Wollman, R. Accurate information transmission through dynamic biochemical signaling networks. Science 2014, 346, 1370–1373. [Google Scholar] [CrossRef] [PubMed]
- Kellogg, R.A.; Tian, C.; Lipniacki, T.; Quake, S.R.; Tay, S. Digital signaling decouples activation probability and population heterogeneity. eLife 2015, 4, e08931. [Google Scholar] [CrossRef] [PubMed]
- Noman, A.S.M.; Koide, N.; Hassan, F.; I.-E.-Khuda, I.; Dagvadorj, J.; Tumurkhuu, G.; Islam, S.; Naiki, Y.; Yoshida, T.; Yokochi, T. Thalidomide inhibits lipopolysaccharide-induced tumor necrosis factor-a production via down-regulation of MyD88 expression. Innate Immun. 2009, 15, 33–41. [Google Scholar] [CrossRef] [PubMed]
- Gillespie, D.T. Exact stochastic simulation of coupled chemical reactions. J. Phys. Chem. 1977, 82, 2340–2361. [Google Scholar]
- Haseltine, E.L.; Rawlings, J.B. Approximate simulation of coupled fast and slow reactions for stochastic chemical kinetics. J. Chem. Phys. 2002, 117, 6959–6969. [Google Scholar] [CrossRef]
- Cao, Y.; Petzold, L.R. The numerical stability of leaping methods for stochastic simulation of chemically reacting systems. J. Chem. Phys. 2004, 121, 12169–12178. [Google Scholar] [CrossRef] [PubMed]
- Kwon, J.S.I.; Nayhouse, M.; Christofides, P.D.; Orkoulas, G. Modeling and control of protein crystal shape and size in batch crystallization. AIChE J. 2013, 59, 2317–2327. [Google Scholar] [CrossRef]
- Kwon, J.S.; Nayhouse, M.; Christofides, P.D.; Orkoulas, G. Modeling and control of shape distribution of protein crystal aggregates. Chem. Eng. Sci. 2013, 104, 484–497. [Google Scholar] [CrossRef]
- Lipniacki, T.; Paszek, P.; Brasier, A.R.; Luxon, B.A.; Kimmel, M. Stochastic regulation in early immune response. Biophys. J. 2006, 90, 725–742. [Google Scholar] [CrossRef] [PubMed]
- Nelson, D.E.; Ihekwaba, A.E.C.; Elliott, M.; Johnson, J.R.; Gibney, C.A.; Foreman, B.E.G.; Nelson, V.S.; Horton, C.A.; Spiller, D.G.; Edwards, S.W.; et al. Oscillations in TNFα signaling control the dynamics of gene expression. Science 2004, 306, 704–708. [Google Scholar] [CrossRef] [PubMed]
- Wilkinson, D.J. Stochastic modelling for quantitative description of heterogeneous biological systems. Nat. Rev. Genet. 2009, 10, 122. [Google Scholar] [CrossRef] [PubMed]
- Gupta, A.; Rawlings, J.B. Comparison of parameter estimation methods in stochastic chemical kinetic models: Examples in systems biology. AIChE J. 2014, 60, 1253–1268. [Google Scholar] [CrossRef] [PubMed]
- Ashyraliyev, M.; Fomekong-Nanfack, Y.; Kaandorp, J.A.; Blom, J.G. Systems biology: Parameter estimation for biochemicalmodels. FEBS J. 2009, 276, 886–902. [Google Scholar] [CrossRef] [PubMed]
- Kiparissides, A.; Koutinas, M.; Kontoravdi, C.; Mantalaris, A.; Pistikopoulos, E.N. ‘Closing the loop’ in biological systems modeling—from the in silico to the in vitro. Automatica 2011, 47, 1147–1155. [Google Scholar] [CrossRef]
- Lamoreaux, L.; Roederer, M.; Koup, R. Intracellular cytokine optimization and standard operating procedure. Nat. Protoc. 2006, 1, 1507–1516. [Google Scholar] [CrossRef] [PubMed]
- Lee, T.K.; Denny, E.M.; Sanghvi, J.C.; Gaston, J.E.; Maynard, N.D.; Hughey, J.J.; Covert, M.W. A noisy paracrine signal determines the cellular NF-κB response to lipopolysaccharide. Sci. Signal. 2009, 2, ra65. [Google Scholar] [CrossRef] [PubMed]
- Xiu, D.; Karniadakis, G.E. The Wiener-Askey Polynomial Chaos for Stochastic Differential Equations. SIAM J. Sci. Comput. 2006, 24, 619–644. [Google Scholar] [CrossRef]
- Misumi, Y.; Yuko Misumi, K.M.; Takatsuki, A.; Tamura, G.; Ikehara, Y. Novel blockade by brefeldin A of intracellular transport of secretory proteins in cultured rat hepatocytes. J. Biol. Chem. 1986, 261, 1139–11403. [Google Scholar]
- Bueno, C.; Almeida, J.; Alguero, M.; Sánchez, M.; Vaquero, J.; Laso, F.; Miguel, J.S.; Escribano, L.; Orf, A. Flow cytometric analysis of cytokine production by normal human peripheral blood dendritic cells and monocytes: Comparative analysis of different stimuli, secretion-blocking agents and incubation periods. Cytometry Part A 2001, 46, 33–40. [Google Scholar] [CrossRef]
- Gottschalk, R.A.; Martins, A.J.; Angermann, B.R.; Dutta, B.; Ng, C.E.; Uderhardt, S.; Tsang, J.S.; Fraser, I.D.C.; Meier-Schellersheim, M.; Germain, R.N. Distinct NF-κB and MAPK activation thresholds uncouple steady-state microbe sensing from anti-pathogen inflammatory responses. Cell Syst. 2016, 2, 378–390. [Google Scholar] [CrossRef] [PubMed]
© 2018 by the authors. Licensee MDPI, Basel, Switzerland. This article is an open access article distributed under the terms and conditions of the Creative Commons Attribution (CC BY) license (http://creativecommons.org/licenses/by/4.0/).