Article

Feasibility of Using Gangue and Fly Ash as Filling Slurry Materials

1
College of Resources & Safety Engineering, China University of Mining & Technology, Beijing, D11 Xueyuan Road, Haidian District, Beijing 100083, China
2
State Key Laboratory of Hydroscience and Engineering, Tsinghua University, Haidian District, Beijing 100084, China
*
Author to whom correspondence should be addressed.
Processes 2018, 6(12), 232; https://doi.org/10.3390/pr6120232
Submission received: 14 October 2018 / Revised: 15 November 2018 / Accepted: 19 November 2018 / Published: 22 November 2018
(This article belongs to the Special Issue Fluid Flow in Fractured Porous Media)

Abstract

:
When used as filling aggregates, the physical and mechanical properties of gangue and fly ash are crucial for the design of filling and transportation systems. The mineral composition of gangue and fly ash affects the filling body’s strength, and the fluidity of the slurry affects the mining engineering process. In this study, gangue and fly ash samples were characterized by X-ray diffraction to ensure their suitability as filling materials. Tests were carried out with an Intelligent Torque Rheometer, and the optimal ratio of the slurry’s components was determined. After fitting the data using ORIGIN software, the following curves were obtained: (1) rheological parameters versus slurry mass fraction; (2) rheological parameters versus component ratio. On the basis of the curves, the recommended ratio of the components in the paste-like slurry was determined. We found that the mass concentration of the slurry must be kept strictly below 78%, and the optimal slurry composition includes coal gangue, fly ash, and a gelling agent at a weight ratio of 8:3:1. In order to illustrate the effectiveness of the filling technology, surface sink curves from different filling techniques in two closely situated positions of the Xinyang Coal Mine were compared. The results showed that the use of a paste-like slurry can effectively reduce surface subsidence. Furthermore, it will lead to cost-effective engineering designs for the sustainable development of coal mines.

1. Introduction

Gangue and fly ash are common industrial waste products, which are occupying an increasingly large area of land and polluting the environment. The coal mining method of paste-like slurry filling exemplifies the application and characteristics of green mining from the perspective of both resource recycling and waste reuse. In 2017, China’s coal production was about 3.5 × 10⁹ tons, of which 2.5 × 10⁹ tons came from underground mining [1]. Coal gangue is a kind of waste rock generated during coal mining and processing. It is collected from roofs, floors, mezzanines, and meteorites during roadway tunneling, and washed gangue is generated during coal washing. According to incomplete statistics, about 5 × 10⁹ tons of waste gangue has been deposited on the surface, and over 1600 large-scale waste dumps occupy a landmass of approximately 1.5 × 10⁷ hm2 [2,3]. The annual increase in the mining subsidence area is about 5 × 10⁴ hm2; the area related to coal resource exploitation is about 0.2 hm2 of subsidence per 104 tons of coal yield. Sulfur, phosphorus, carbon, and dozens of components in waste coal (wasted coal refers to the coal mixed in the gangue or attached to the surface of the gangue) combined with spontaneous combustion cause various degrees of pollution in the atmosphere, water, soil, and so forth. In addition, if rainwater infiltrates a spontaneously combusting waste dump, the rapid expansion of heated air will cause an explosion [4]. Increased fuel consumption has led to an increasingly prominent contradiction between the concern for resource exhaustion and environmental destruction and the interest in economic development [5,6].
There are several methods for filling a goaf: solid or direct backfilling, hydraulic filling, cemented filling, and so on [7,8,9]. Every filling method has its disadvantages. As for the gangue filling method, it is difficult to monitor the filling body’s strength and stability, while, for the cement filling process, the performance of the cementing material is strict [10]; in addition, with the paste filling method it is easy to block the pipe because of the high concentration of the filling material [11], whereas the high water filling technology is uneconomical [12]. In the 2000s, paste-like backfilling methods were developed in coal mines. The slurry was made of gangue and fly ash at concentrations that could be higher than 75%, and a gelling agent was added at a concentration of about 3–5% in order to rapidly consolidate the body and achieve high strength. The high mass concentration of the slurry resulted in an appearance similar to toothpaste. The paste-like filling technology has many remarkable advantages, such as extensive resource recovery, low cost, minimum environmental pollution, simple preparation technology, efficient transportation, and a filling body with high strength [13,14]. Applied to coal mining under buildings, railways, and water bodies, the technology effectively controls the surrounding rock reformation and subsidence, raises the resource recovery ratio, and realizes its goal without waste and harm [15].
A paste-like slurry is a mixture of gangue particles, fly ash, cement, and water. Gangue particles and fly ash are aggregates in the paste-like slurry. The widely present floc structures in water at a certain mass concentration maintain fluid homogeneity [16], and the coarse gangue particles are deposited slowly and freely in the homogeneous slurry. With the increase in mass concentration, the coarse particles are increasingly enveloped and become components of the slurry. When the slurry mass concentration exceeds a certain critical threshold, the entire fluid is converted into a homogeneous slurry [17]. The fluid is termed a heterogeneous–homogeneous composite fluid, which is a typical kind of Bingham fluid with good fluidity. The resistance of the composite flow is much lower than the resistance of a non-homogeneous flow in the same conditions [14]. Generally speaking, the effective and successful filling of the goaf with the slurry should guarantee a strength of the filling body that is sufficient to support roofs and to effectively transport material [16,17,18]. The physical composition and form of the material have a significant effect on the strength of the filling body [19,15]. X-ray diffraction (XRD) is usually used to identify the mineralogical phases of natural and anthropogenic materials. In this study, gangue and fly ash sample characterizations were performed by XRD first, and then a torque rheometer was used to determine the ratio of the slurry components. On the basis of a large number of experiments, the following curves were obtained: (1) rheological parameters versus slurry mass concentration and (2) rheological parameters versus composition ratio. On the basis of the trends of the curves, the optimum concentration of the slurry components and the optimum group distribution ratio were determined. An ill-proportioned ratio will inevitably affect the rheological properties of the slurry, thereby causing filling accidents, and the filling cost will rise. Limited by experimental equipment, the ratio of the paste-like slurry components has always been based on experience or a large number of similar tests [20,21,22]. This is a waste of materials and work. The new equipment described here not only avoids these drawbacks but also improves the accuracy of the results.
There have been many studies on surface sink caused by mining [23,24,25,26]. Previous research has shown that filling materials could meet the requirements to support the roof. Research has further shown the feasibility of using gangue and fly ash as filling materials and the resulting fluidity of the slurry, as well as the high efficiency of coal production and its environmental sustainability.

2. X-Ray Diffraction Experiment

2.1. Sample Preparation

As the main parts of the filling slurry, the basic physical and mechanical properties of gangue and fly ash are crucial for the design of filling and transportation systems. The mineral composition of washed gangue and fly ash affects the filling body’s strength, and the fluidity of the slurry affects the planning process.
Gangue samples were collected from the Xinyang Coal Mine in Gaoyang Town, Xiaoyi City, Shanxi Province, and fly ash was collected from a thermal power station in Wutong Town, which is 20 miles away from Gaoyang Town.

2.2. X-Ray Diffraction of Samples

The equipment used was a D/Max-3B X-ray diffractometer manufactured by Rigaku Corporation, Tokyo, Japan. Powder X-ray diffraction profiles were measured using the diffractometer (with Cu-Kα radiation) equipped with a curved graphite monochromator. The slit system was set as follows: DS: 1°; RS: 1°; SS: 0.15 mm; RSM: 0.6°. The voltage and electric current of the X-ray generator were 35 kV and 30 mA. The speed of continuous scanning in the qualitative analysis was 3°/min, and the sampling interval was 0.02°. The speed of continuous scanning in the quantitative analysis was 0.25°/min, and the sampling interval was 0.01°.
On the basis of the K-value method of the Chinese standard (GB5225-86), the composition of washed gangue was determined and is shown in Table 1, while the X-ray diffraction spectrum is shown in Figure 1. The composition of fly ash is shown in Table 2, and the X-ray diffraction spectrum is shown in Figure 2.
Comparative analyses with the standard powder diffraction data of various substances, provided by the Powder Diffraction Federation International Data Center (JCPDS-ICDD), were performed. The analyses show that the main components of the washed gangue were quartz, kaolinite, some illite, mixed-layer illite–smectite, non-crystalline materials, and a small quantity of other minerals, some of which may be considered coal or another substance. The main components of fly ash were non-crystalline; it contained slightly more quartz than gangue, some minerals, such as mixed-layer illite–smectite, and illite, and small amounts of calcite, CaSO4, and feldspar. The non-crystalline material in the sample can be produced by heating the clay at a moderate temperature. The results showed that SiO2 was the main component of gangue and fly ash, an attribute that would impart high strength to the filling body.

3. Development of the Intelligent Torque Rheometer and Rheological Experiments of the Paste-like Slurry

3.1. Development of the Intelligent Torque Rheometer

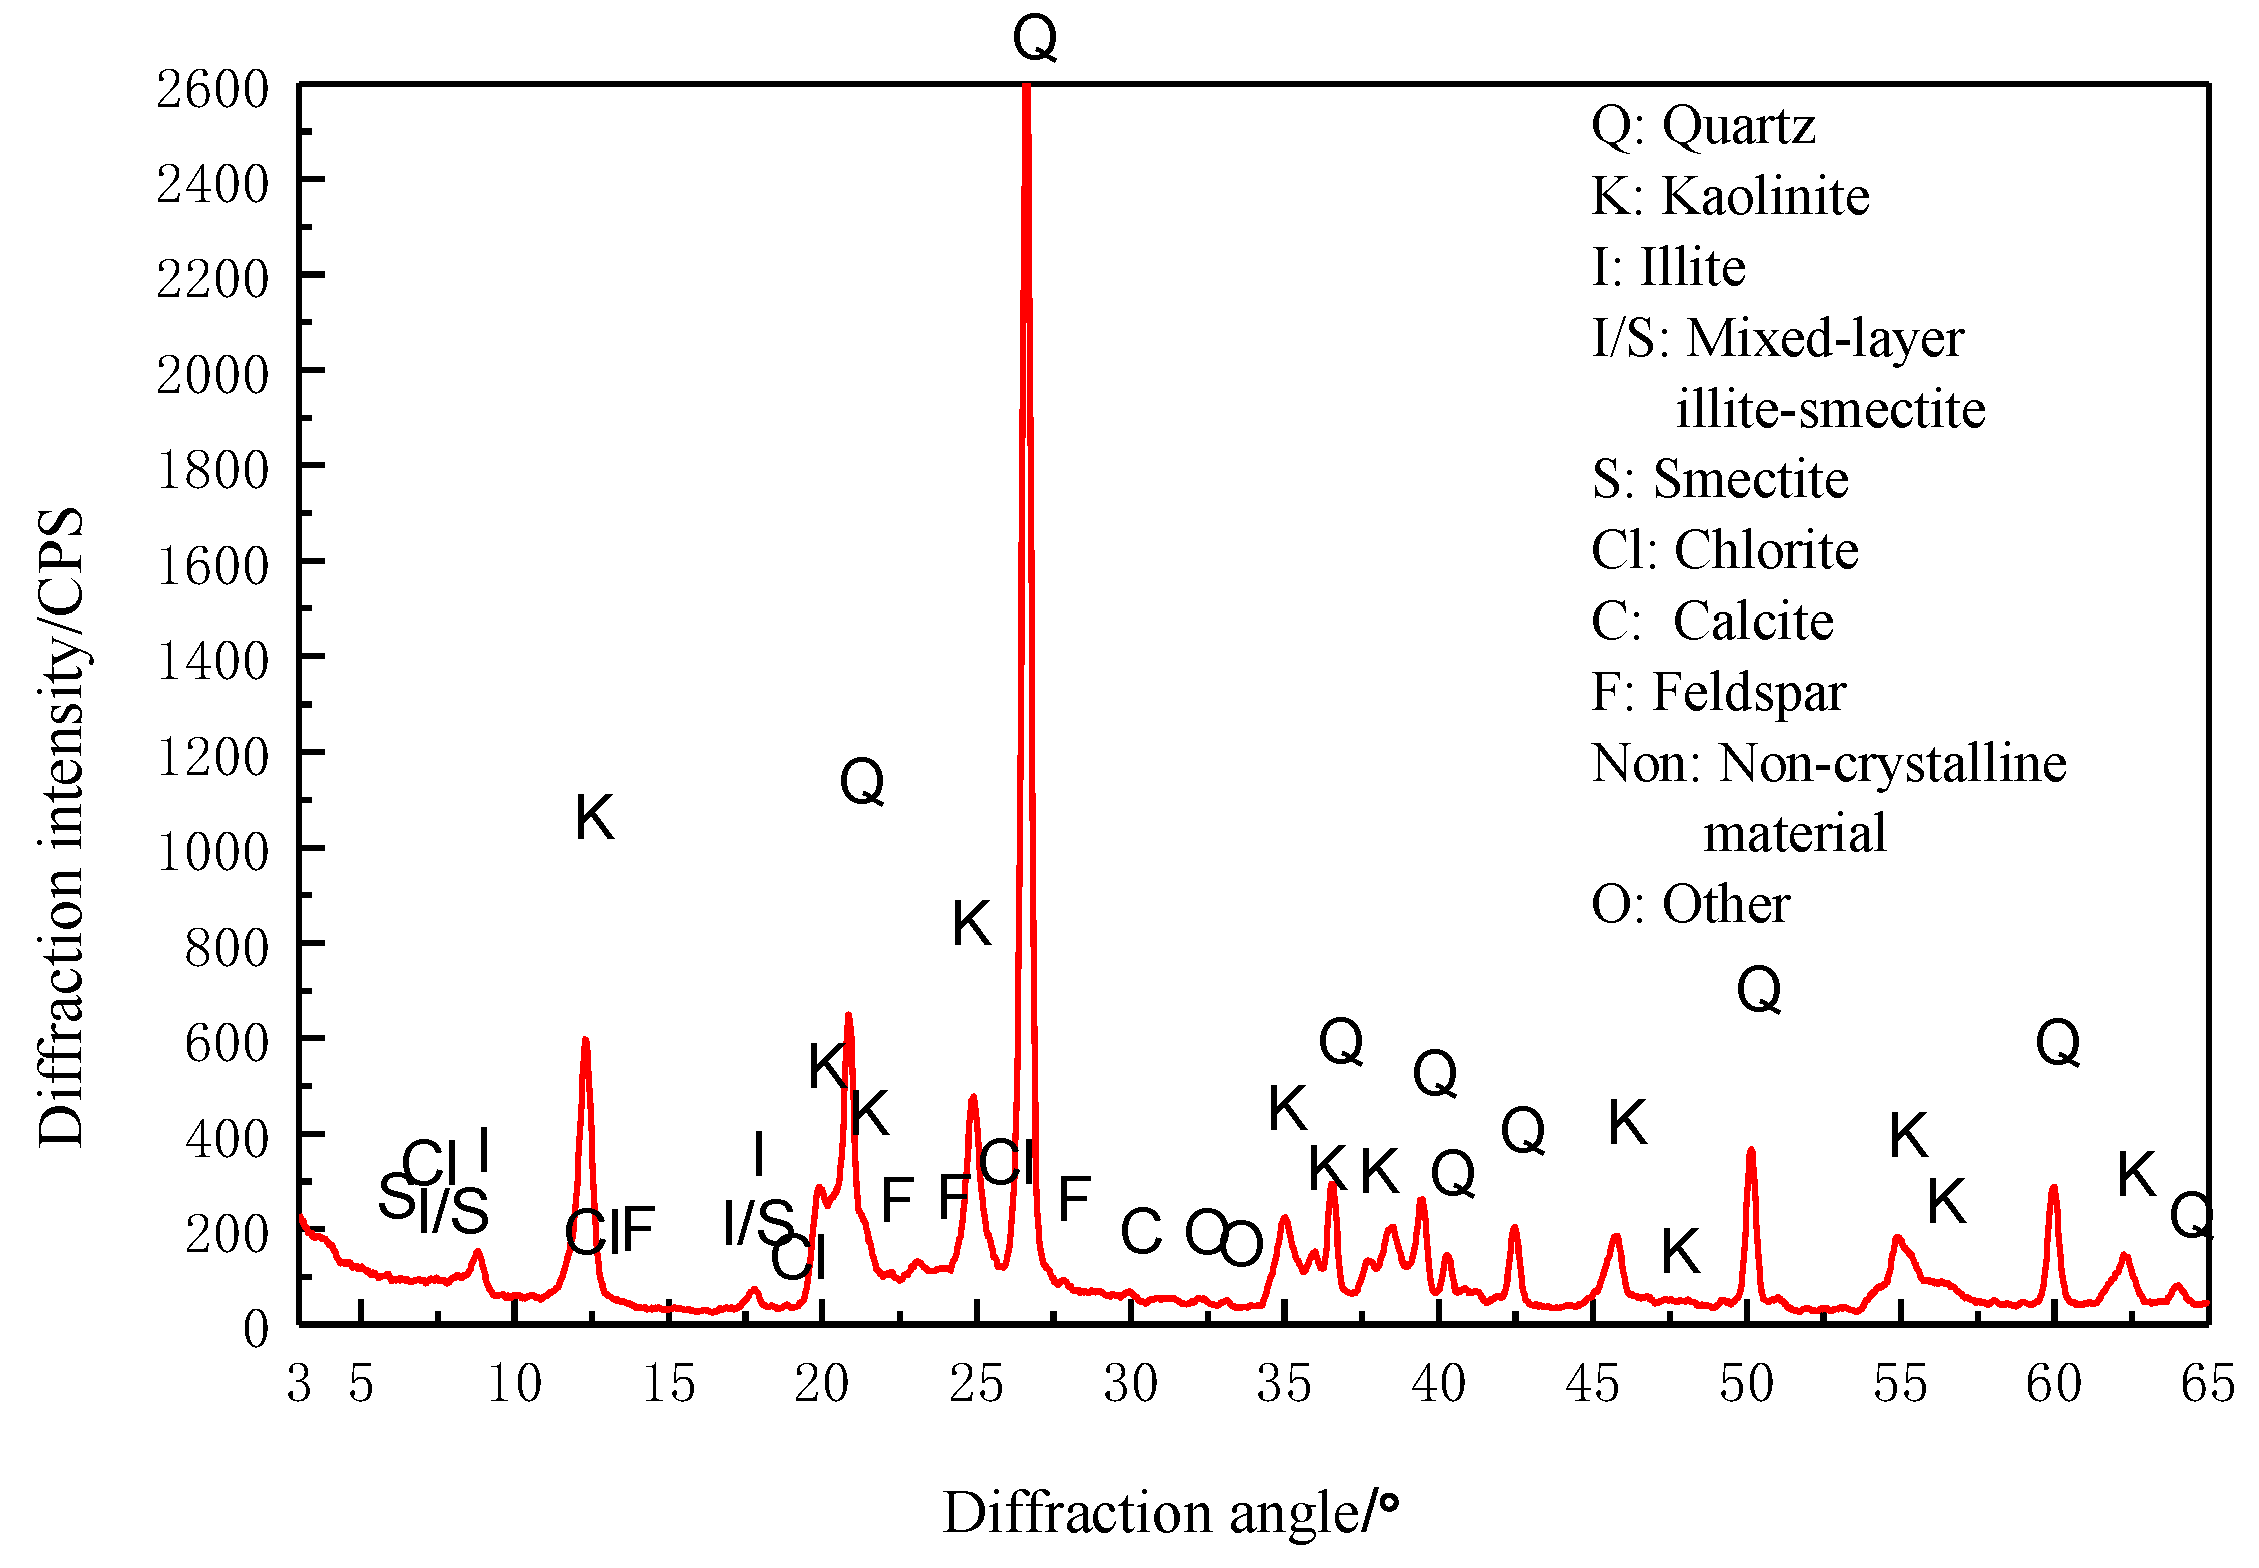
The paste-like slurry was made of coarse particles, fine particles, and water. The coarse particle was coal gangue, crushed to a size smaller than 20 mm in situ. The fine particle was fly ash, and the gelling agent was Portland cement.
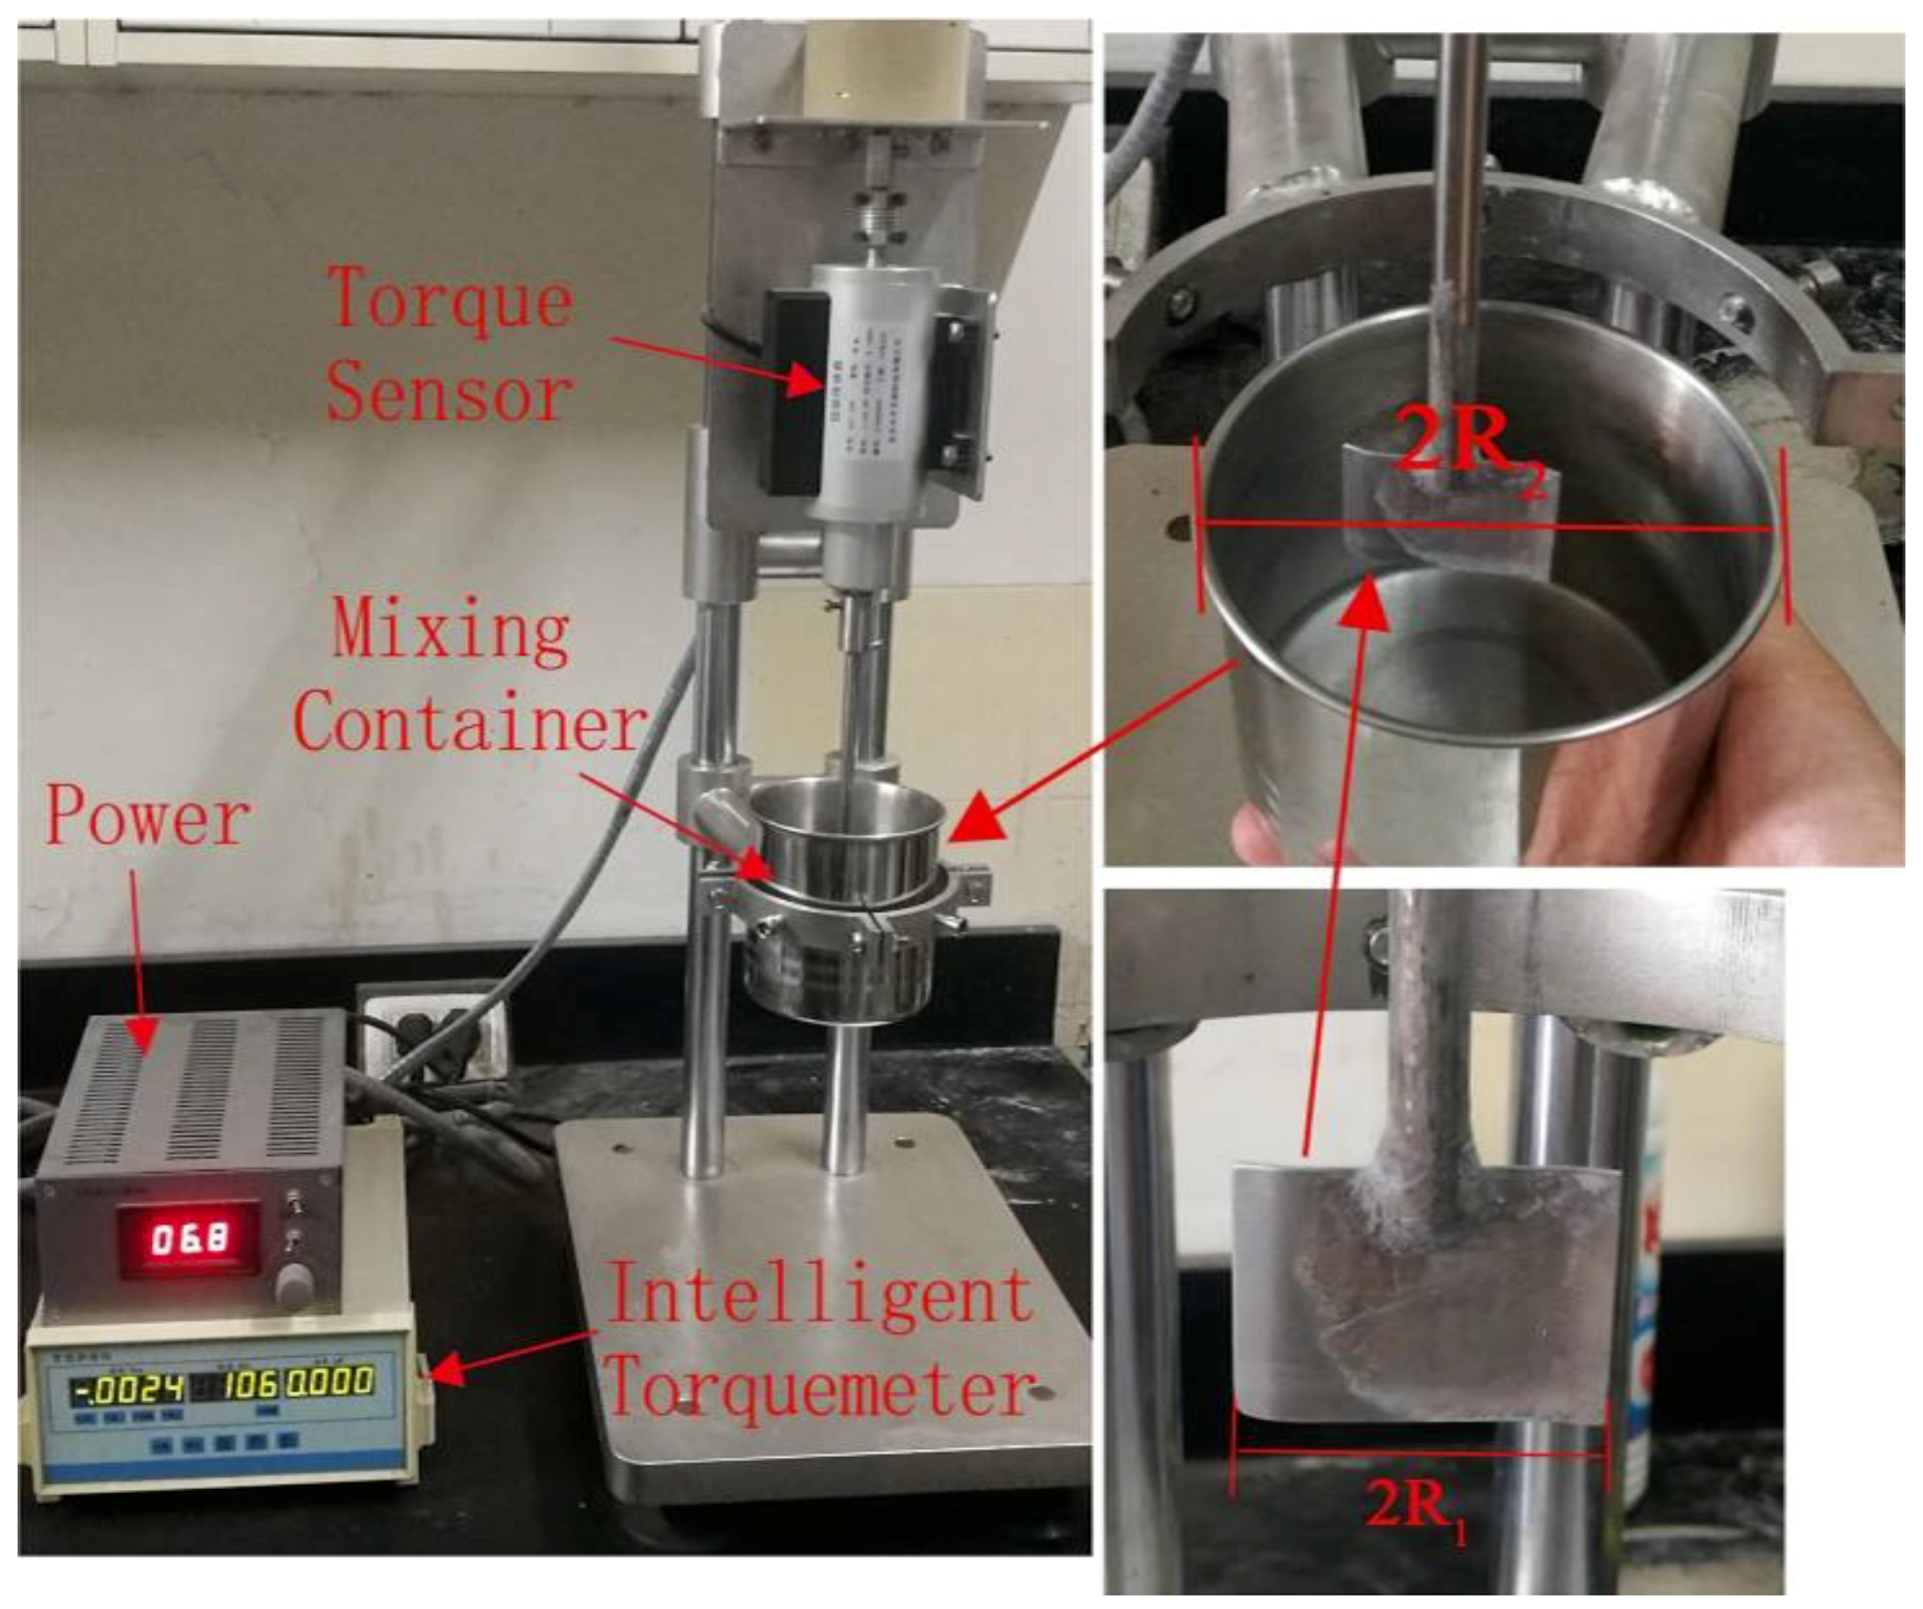
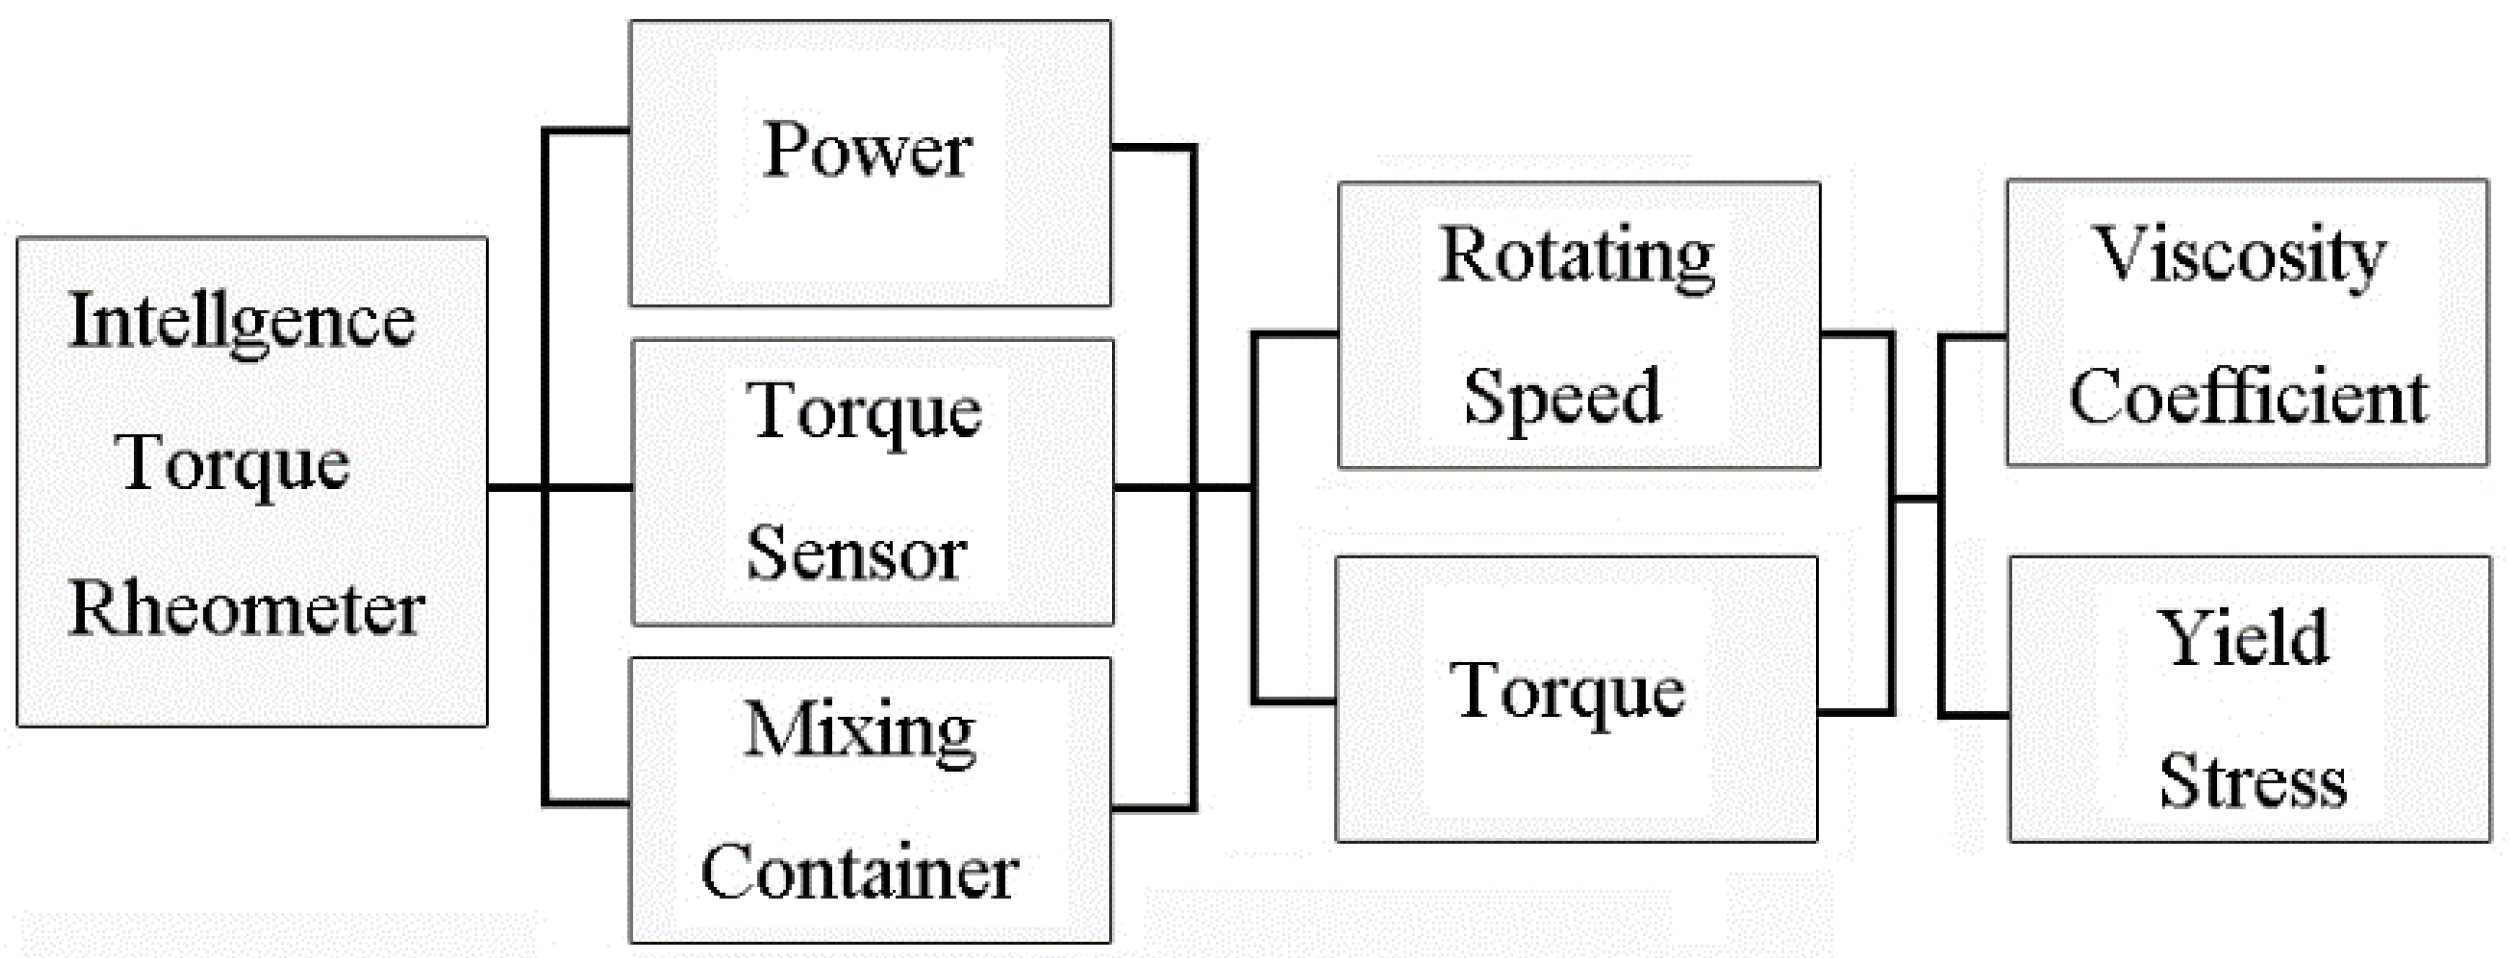
Because the maximum size of the coarse particles in the paste-like slurry was about 20 mm, the slurry could not be measured by normal rheometers. On the basis of rheometer principles and a torque sensor, an intelligent torque rheometer was developed. Figure 3 presents the intelligent torque rheometer, and Figure 4 shows a schematic of the Intelligent Torque Rheometer.
The most important part of the intelligent torque rheometer is a high-sensitivity iron piece leaf which can measure small deformations. When the iron piece leaf rotates at a speed of ω, the slurry will be driven to rotate in different layers. The slurry’s initial resistance causes the iron leaf to deform. The shape variables (γ) occurring at different radii (r) are different. The angular velocity of the position at r + dr is ω + dω.
d γ = ( r + d r ) ( ω + d ω ) d t ( r + d r ) ω d t d r = r d ω d r d ω d r r d ω d r d t
d γ d t =   r d ω d r
With the initial shear stress of the slurry expressed as τ 0 , Equation (3) can be established:
τ = τ 0 + η d γ d t = τ 0 + η r d ω d r
The moment M is:
M = τ · 2 π r h r = 2 π r 2 h ( τ 0 + η r d ω d r )
d ω = ( M 2 π h η r 3 τ 0 η r ) d r
Then, the formula’s integral is obtained:
0 α d ω = R 1 R 2 ( M 2 π h η r 3 τ 0 η r ) d r
Finally, the rheological parameters of the slurry can be calculated by Equation (7),
ω = M 4 π h η ( 1 R 1 2 1 R 2 2 ) τ 0 η l n R 2 R 1
M = 4 π h η 1 R 1 2 1 R 2 2   · ω + τ 0 · 4 π h 1 R 1 2 1 R 2 2 · l n R 2 R 1
where R 1 is the radius of the high-sensitivity iron piece leaf; R 2 is the radius of the mixing container; h is the height of the high-sensitivity iron piece leaf; M is the torque; η is the viscosity coefficient; τ 0 is the initial shear stress; ω is the rotating speed.

3.2. Calibration for the Intelligent Torque Rheometer

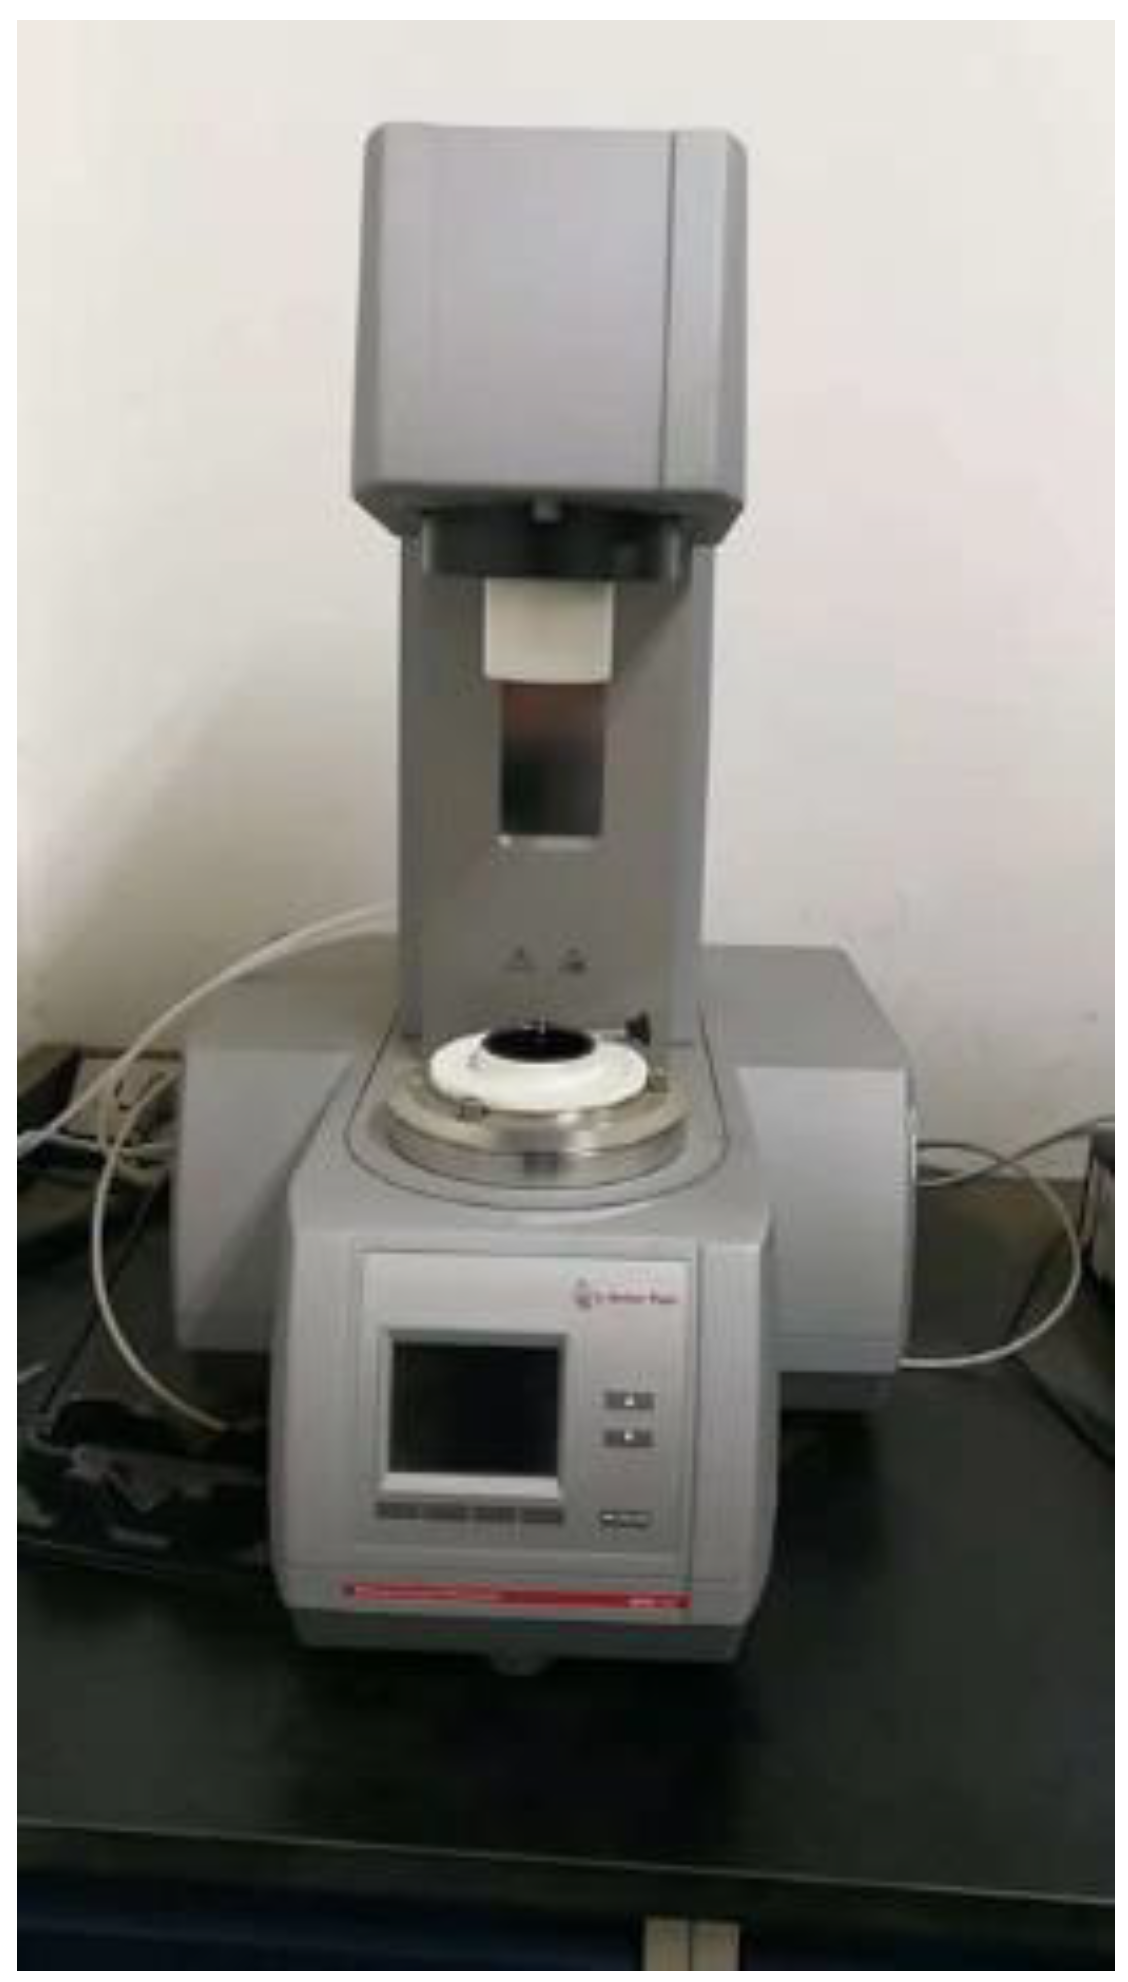
In order to obtain the true torque, the Anton Paar RheolabQC rheometer (Anton Paar RheolabQC rheometer, Graz, Austria) was used as a calibration instrument for accurately testing the rheological properties of Newtonian and non-Newtonian fluids and calibrate the intelligent torque rheometer. Figure 5 shows the Anton Paar RheolabQC rheometer.
The measured torque, named M1, and the actual torque, named M, can be represented by Equation (9):
M = k M 1 + a
where M is the actual torque; M 1 is the measured torque.
The torques and rotation speeds of slurries with different concentrations were measured using the RheolabQC rheometer and the intelligent torque rheometer and were then compared. Equation (9) was used in the process. Finally, the values of k and a were obtained. The test indicators of the RheolabQC rheometer are shown in Table 3.
Since the calibration instrument is mainly suitable for measuring a non-Newtonian fluid slurry, the experimental material was a mixture of tailings and fly ash. The slurry parametric test results are shown in Table 4.
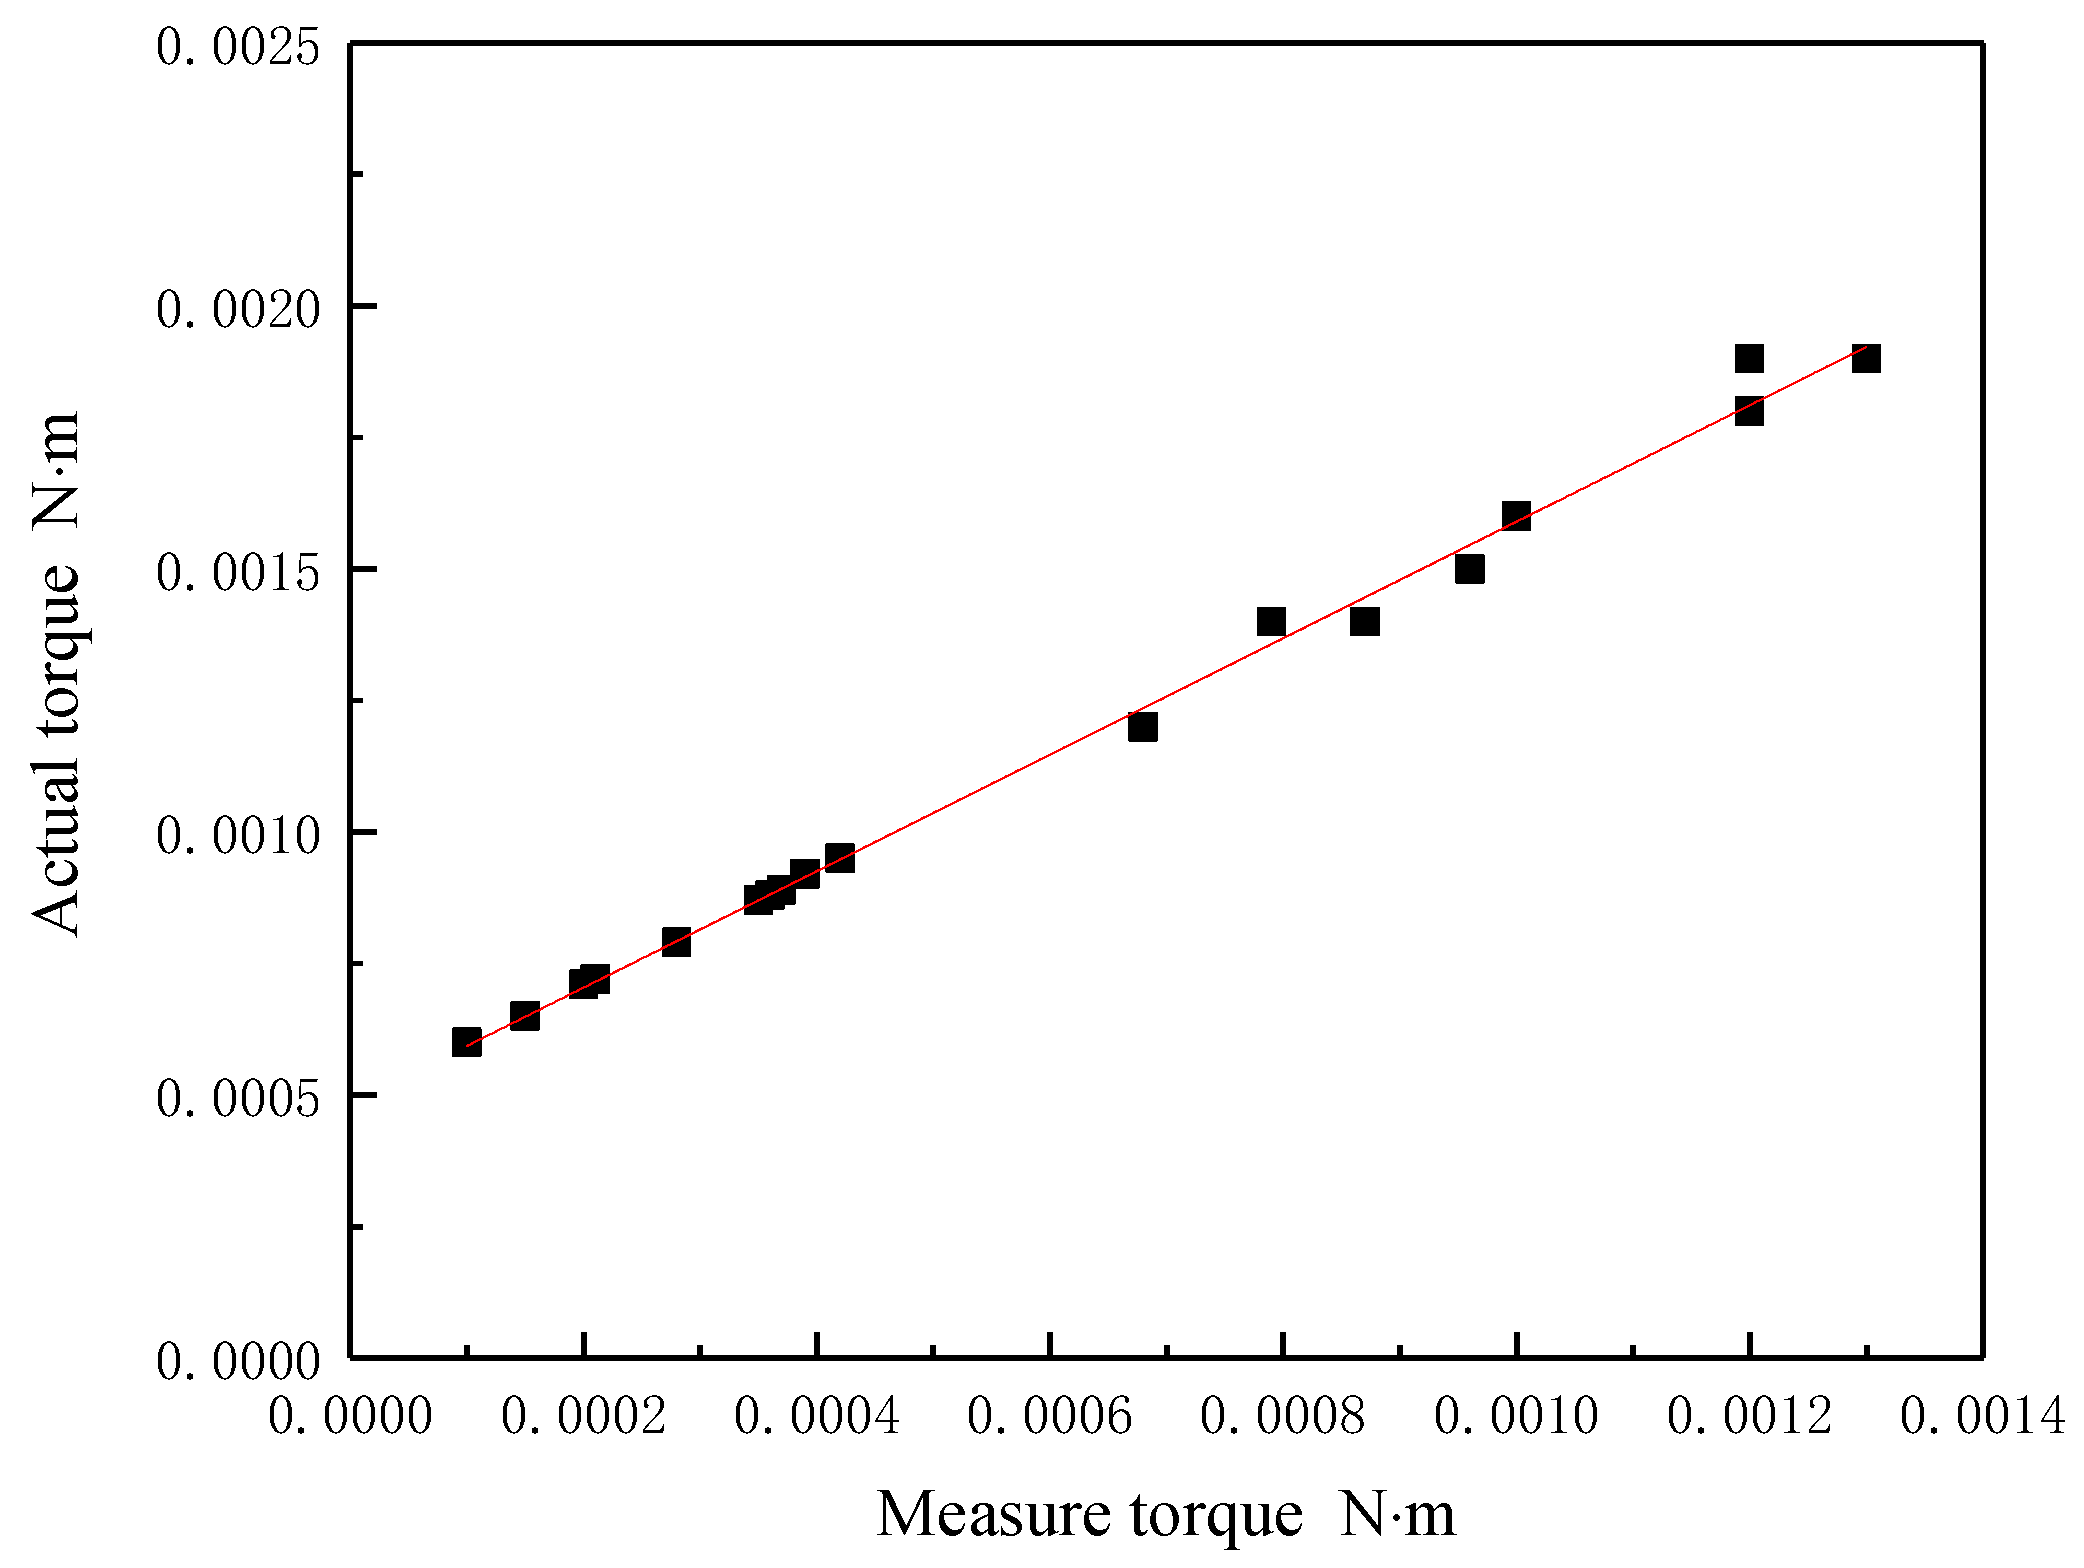
The rheological properties corresponding to different concentrations showed that the initial shear stress increased as the slurry concentration increased. When the slurry concentration was 54–58%, the plastic viscosity of the slurry changed gently. When the concentration was higher than 60%, the plastic viscosity of the slurry increased drastically. The rheological properties curve of the slurry was fitted by ORIGIN software (Northampton, MA, USA) and showed obvious characteristics of a Bingham fluid. Using ORIGIN, the measured torques were fitted with the actual torque, and the fitted regression line is shown in Figure 6.
The formula relating the measured torque to the actual torque is shown in Equation (10):
M = 1.107 M 1 + 4.825 × 10 4
According to Equation (8), the parameters of the Intelligent Torque Rheometer are: R1 = 2 cm, R2 = 5 cm, h = 3 cm. The relation between torque and rotating speed can be determined by Equation (11):
M = 1.787 × 10 4 η · ω + 1.638 × 10 4 τ 0
Table 5 shows the test values under different concentrations.
In order to reduce measurement errors with the intelligent torque rheometer, the following requirements should be met:
(1)
Avoiding high-speed rotations during the process;
(2)
Basing the weight of the slurry on the width of the mixing head leaf, the immersion depth, and the outer cylinder;
(3)
Using the average of multiple torque measurements to reduce the experimental error.

3.3. Rheological Properties of the Paste-Like Slurry

The rheological parameters of the filling slurry can be used to evaluate the pipe resistance of the slurry, that is, the head loss. There are many filling processes for coal mines, and the materials used are also different. They directly affect the solidification performance of the filling body. Therefore, the content of each material needs to be within a specific interval.
The experiments were carried out as described below, and the experimental data were fitted by ORIGIN.
(1) Five different mass concentrations were chosen: 74%, 75%, 76%, 78%, and 79%. Table 6 presents the ratios of the slurry composition at different mass concentrations.
(2) With a mass concentration of 76% and a ratio of cement to fly ash of 1:3, the ratios of fine particles to coarse particles were varied: 1:1, 1:1.5, 1:2, 1:2.5, 1:3. Table 7 presents the ratio of the slurry composition at different ratios of fine particles to coarse particles.
(3) With a mass concentration of 76% and the content of the coarse particles constant, the ratios of cement to fly ash content were varied: 1:3, 1:3.5, 1:4, 1:4.5, 1:5. Table 8 presents the ratio of the slurry composition at different ratios of fly ash to cement in the slurry.
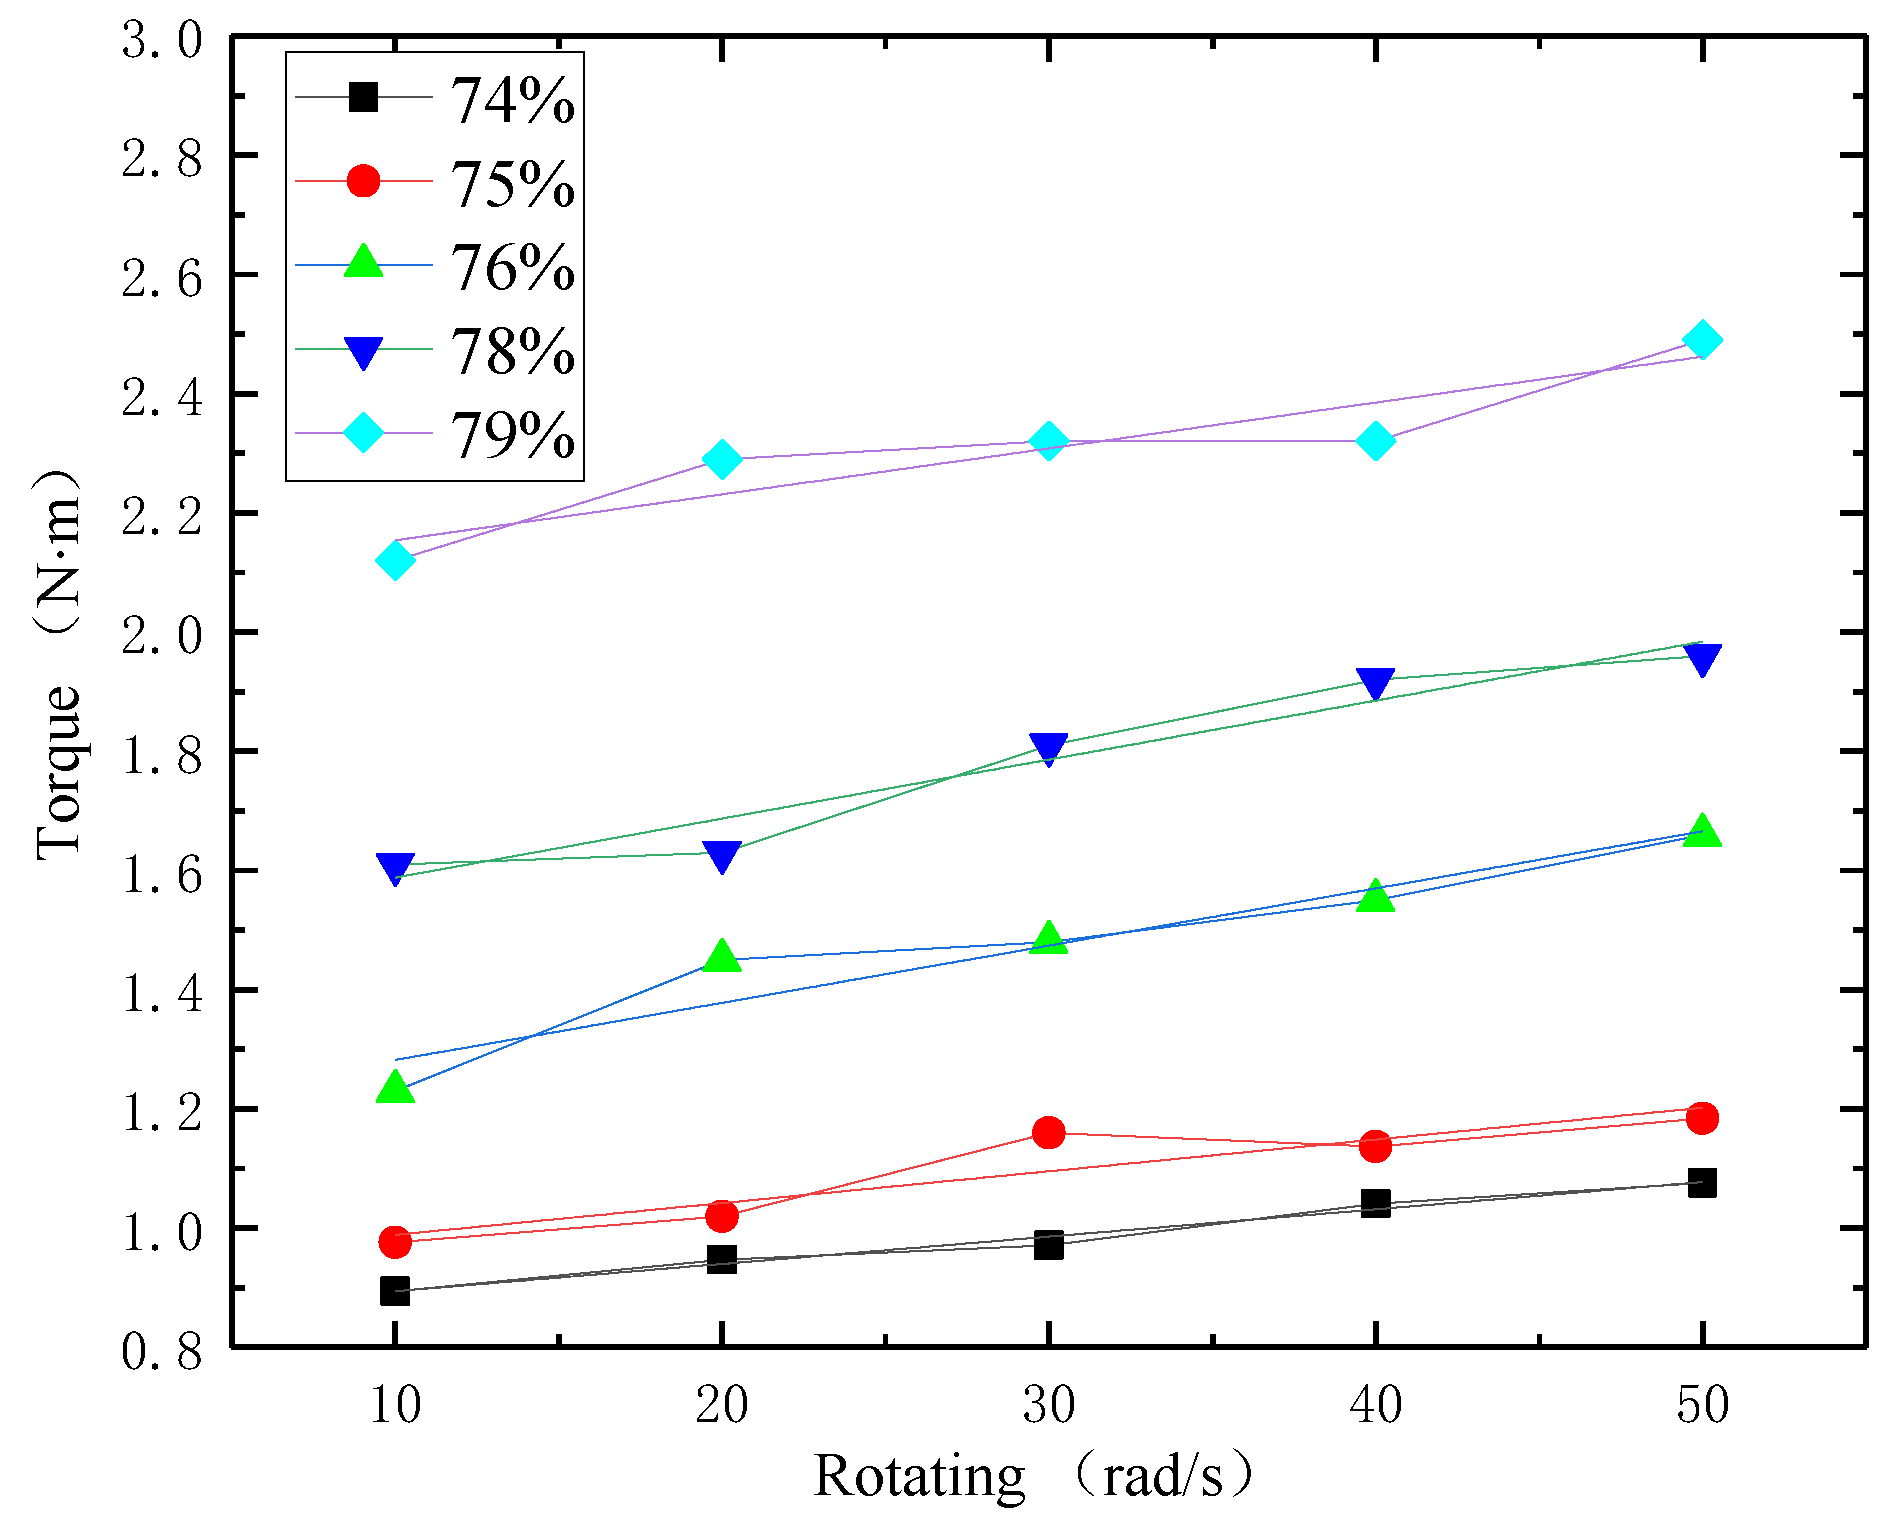
Figure 7 shows that higher mass concentrations increased the torque at the same rotating speed. The relationship between torque and rotating speed could be determined from the fitted curve in Figure 7. According to formula (11), the rheological parameters could also be obtained. The results are in Table 9.
Figure 7 shows the relation between rotating speed and torque at different mass concentrations.
Table 9 shows the relations between rotating speed and torque that arose from different mass concentrations of the slurry, along with the resulting rheological parameters.
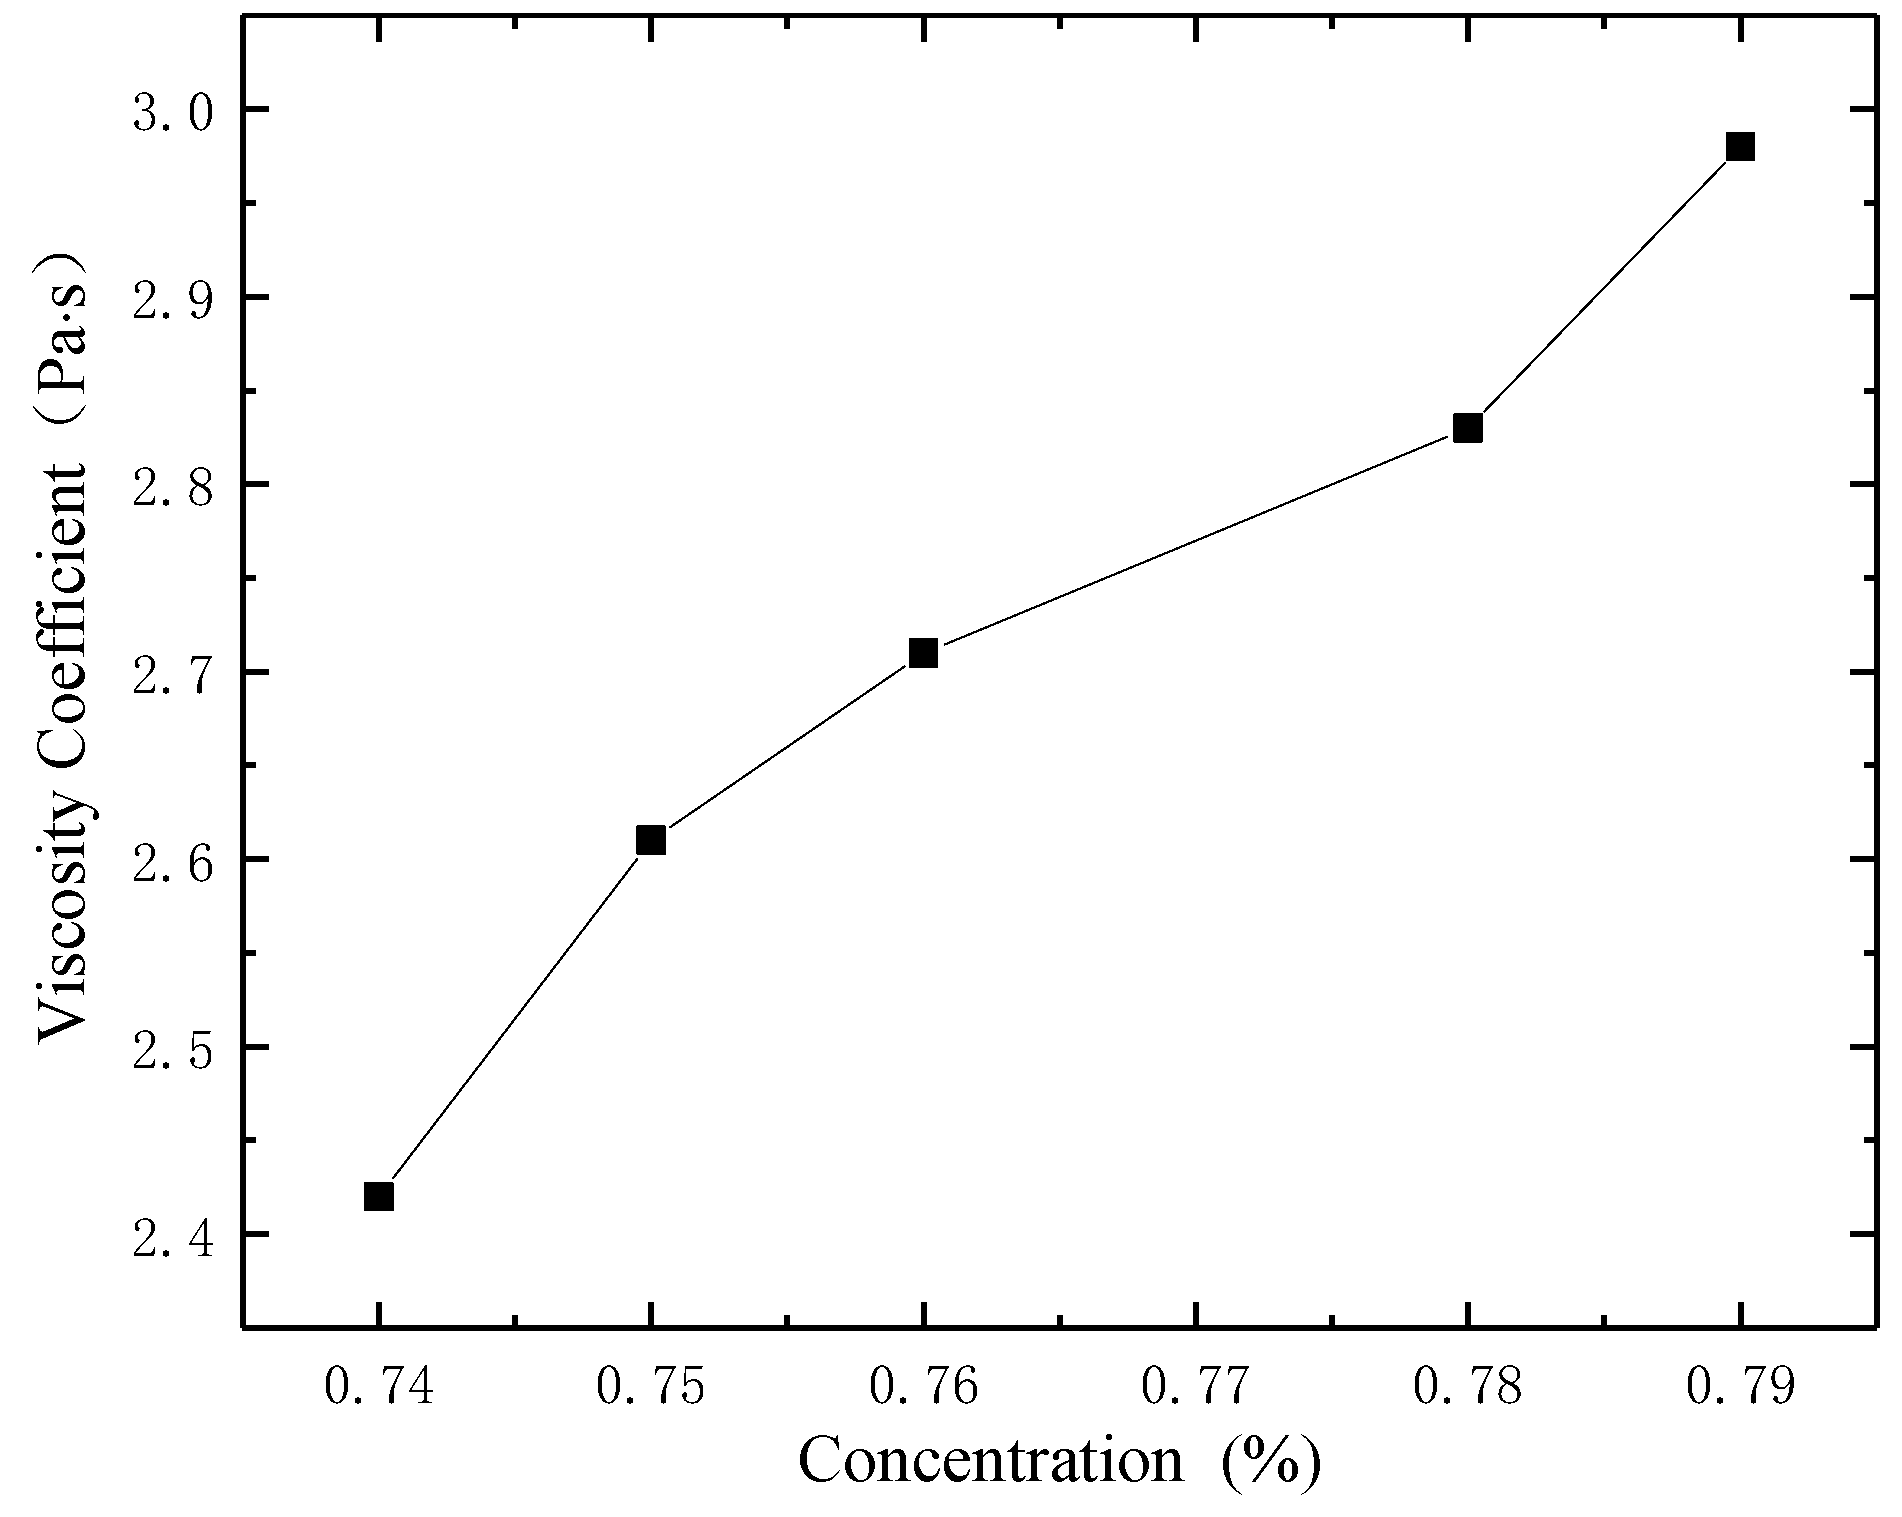
Figure 8 shows the relation between the viscosity coefficient and the slurry mass concentration; 
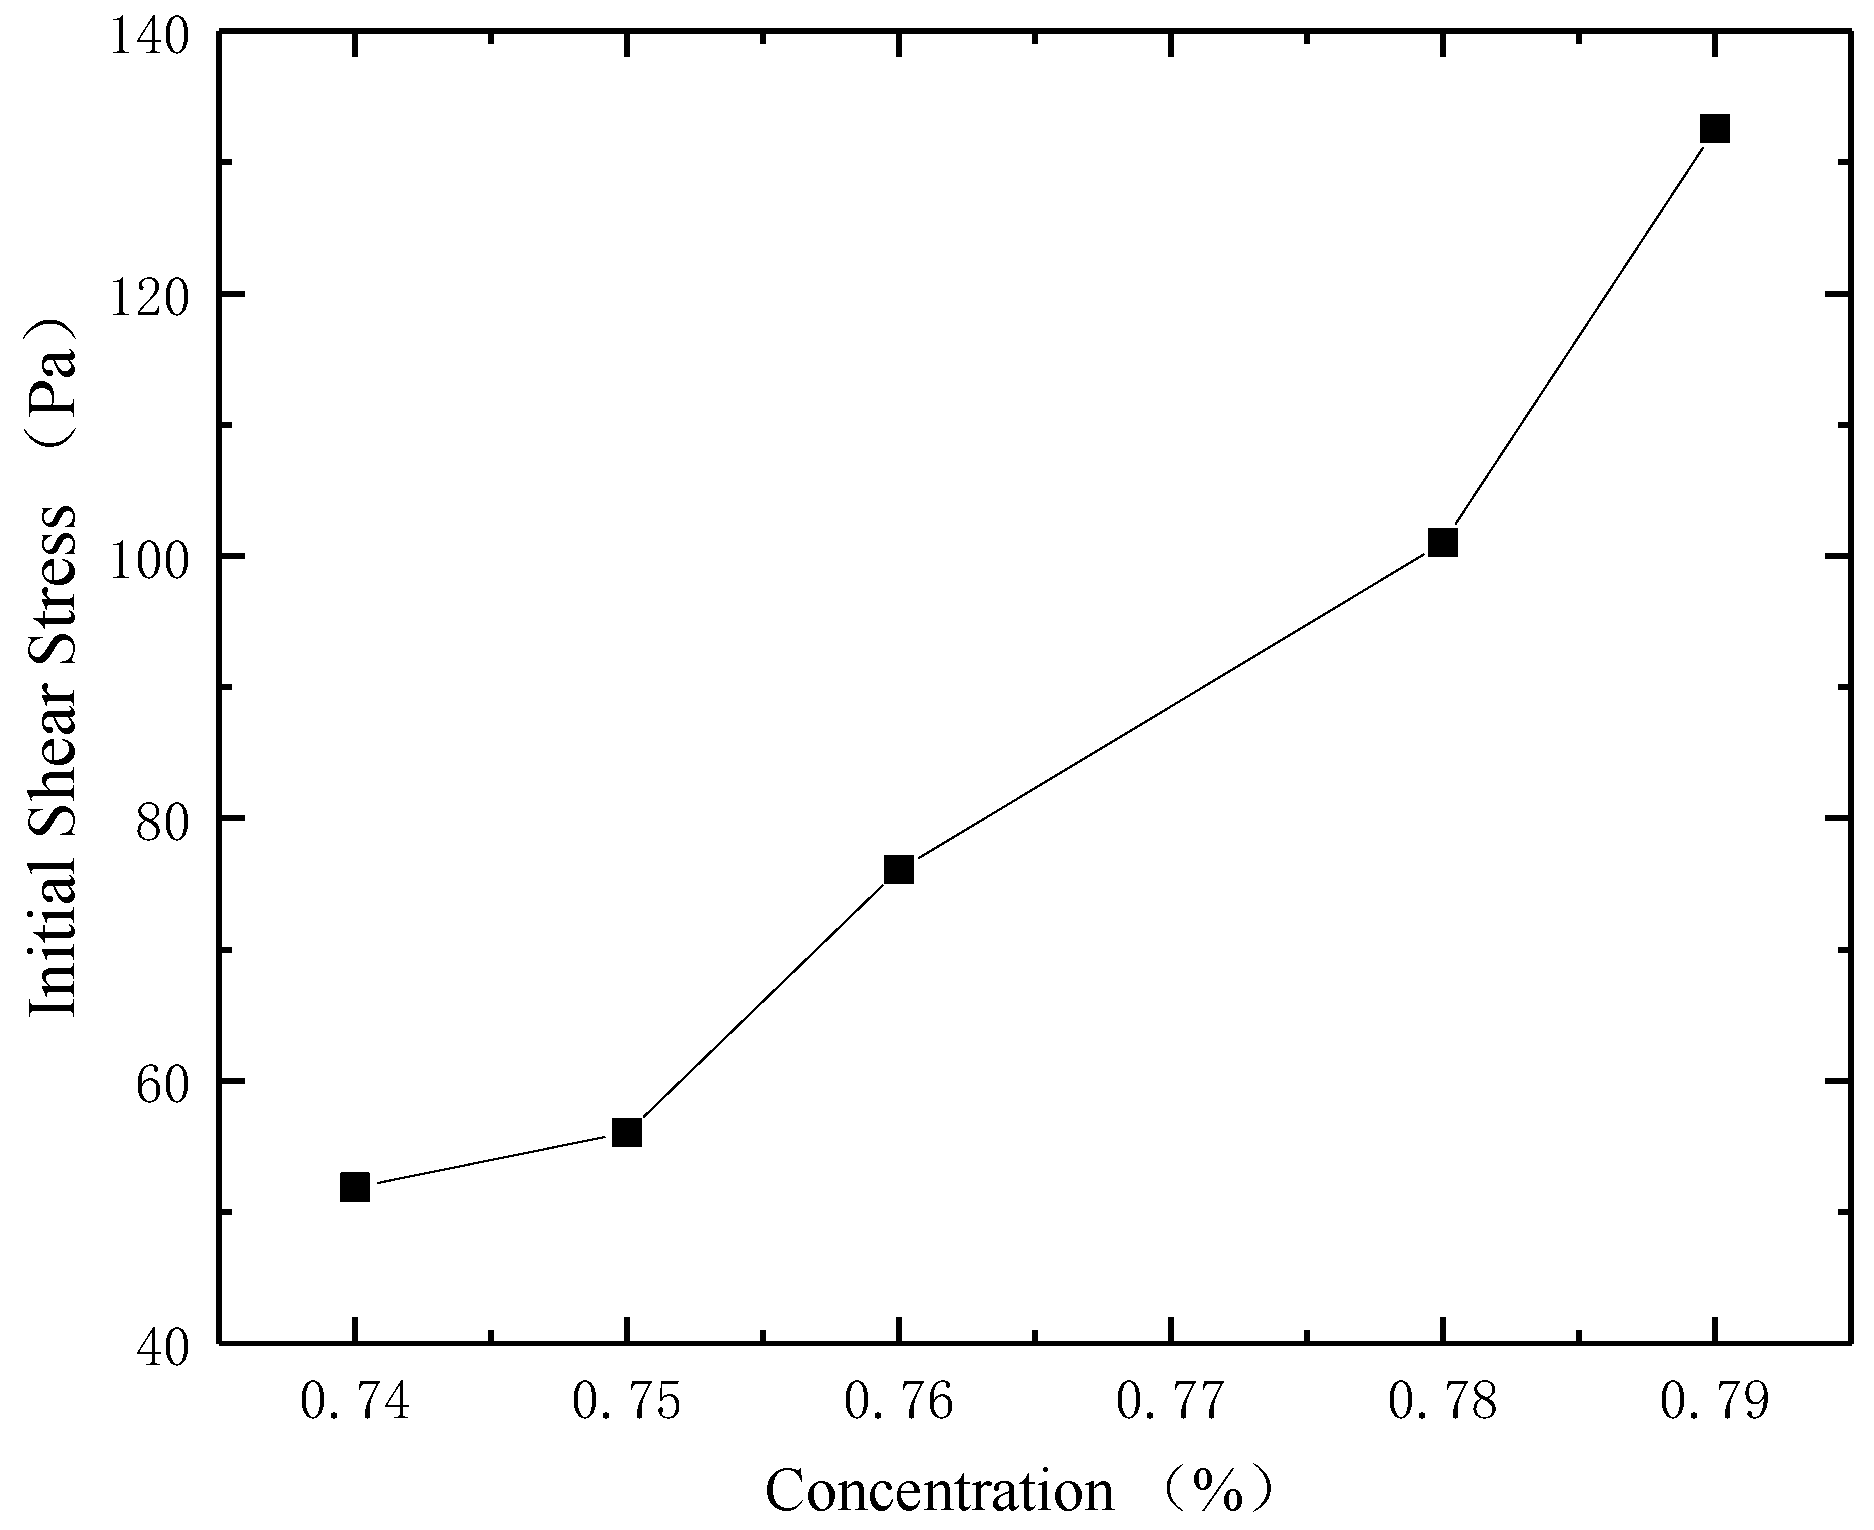
Figure 9 shows the relation between the initial shear stress and the slurry mass concentration.
The viscosity coefficient increased with the increase in the mass concentration, but the changing trend was different at different segments of the concentration curve. The viscosity coefficient increased sharply in the 74–75% segment, while it increased gently in the 75–78% segment. The viscosity coefficient growth trend in the 78–79% segment was the most obvious. Considering the safety of the filling system and the transmission efficiency, the mass concentration should be controlled below 78%.
The initial yield stress increased with the increase of the slurry mass concentration in the 74–79% segment, and the change trend varied with the concentration. The increase in the 74–75% segment was not obvious. Then, the increase rate was more obvious in the 75–76% segment than in the adjacent intervals. The most obvious increase trend was in the 78–79% segment. Considering the safety of the filling system and the transmission efficiency, the mass concentration should be controlled below 78%.
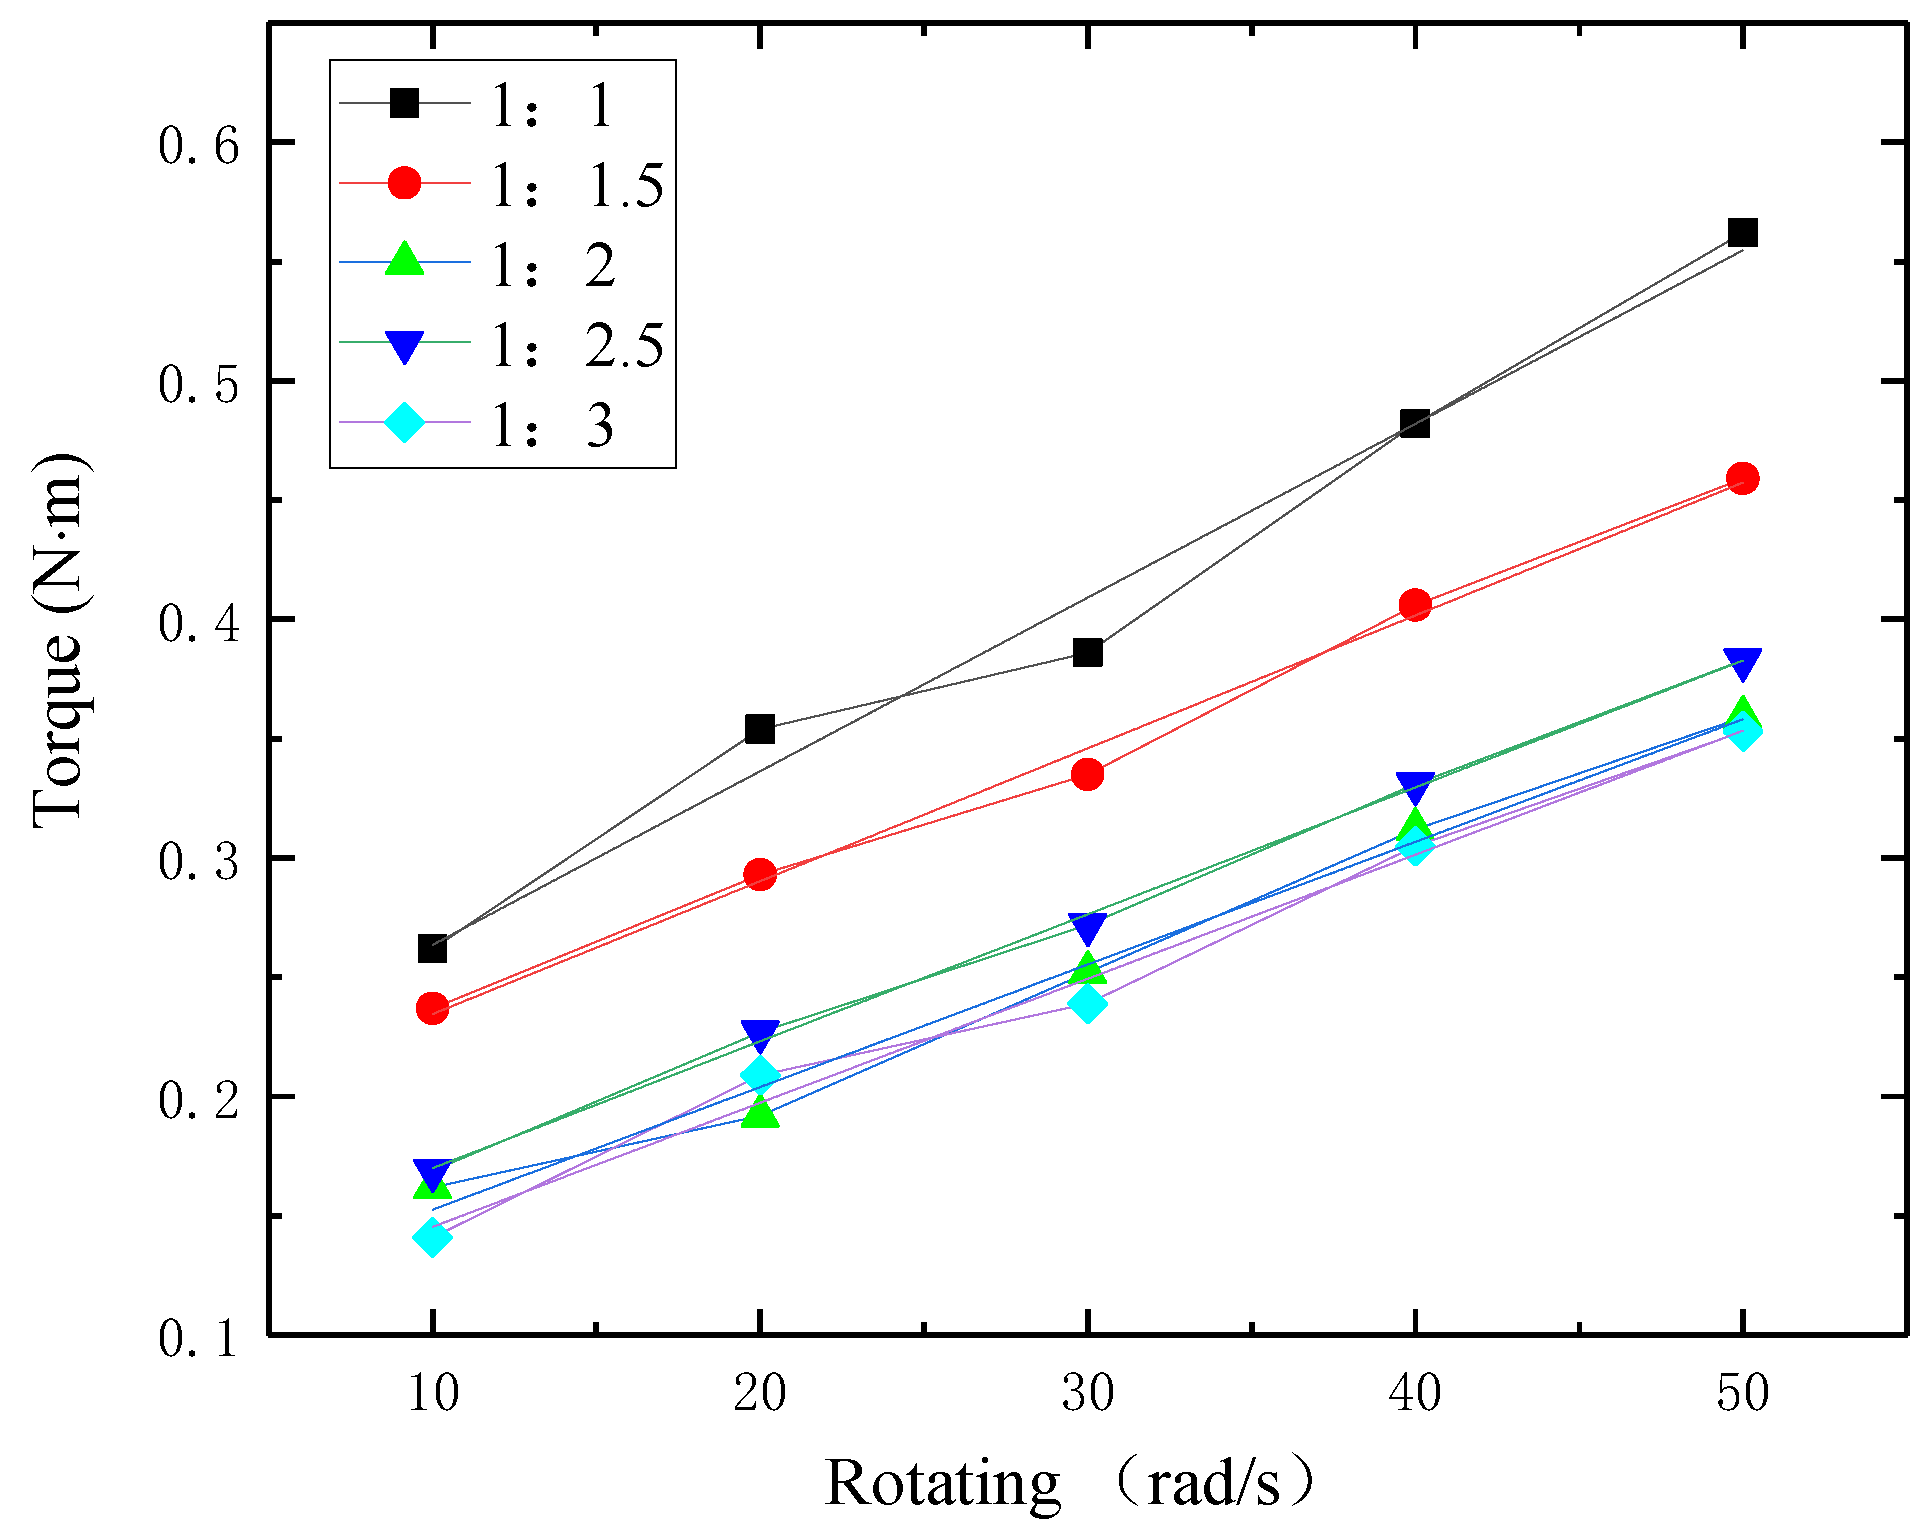
Figure 10 shows the relation between rotating speed and torque at different ratios of fine particles to coarse particles. It shows that the torque increased with the increasing ratio of fine particles to coarse particles at the same rotating speed. The slope of the fitted curves is significantly larger than the slope of the curves in Figure 7.
On the basis of Figure 10, Table 10 shows the relations between rotating speed and torque that arose from different ratios of fine particles to coarse particles, along with the resulting rheological parameters of the slurry.
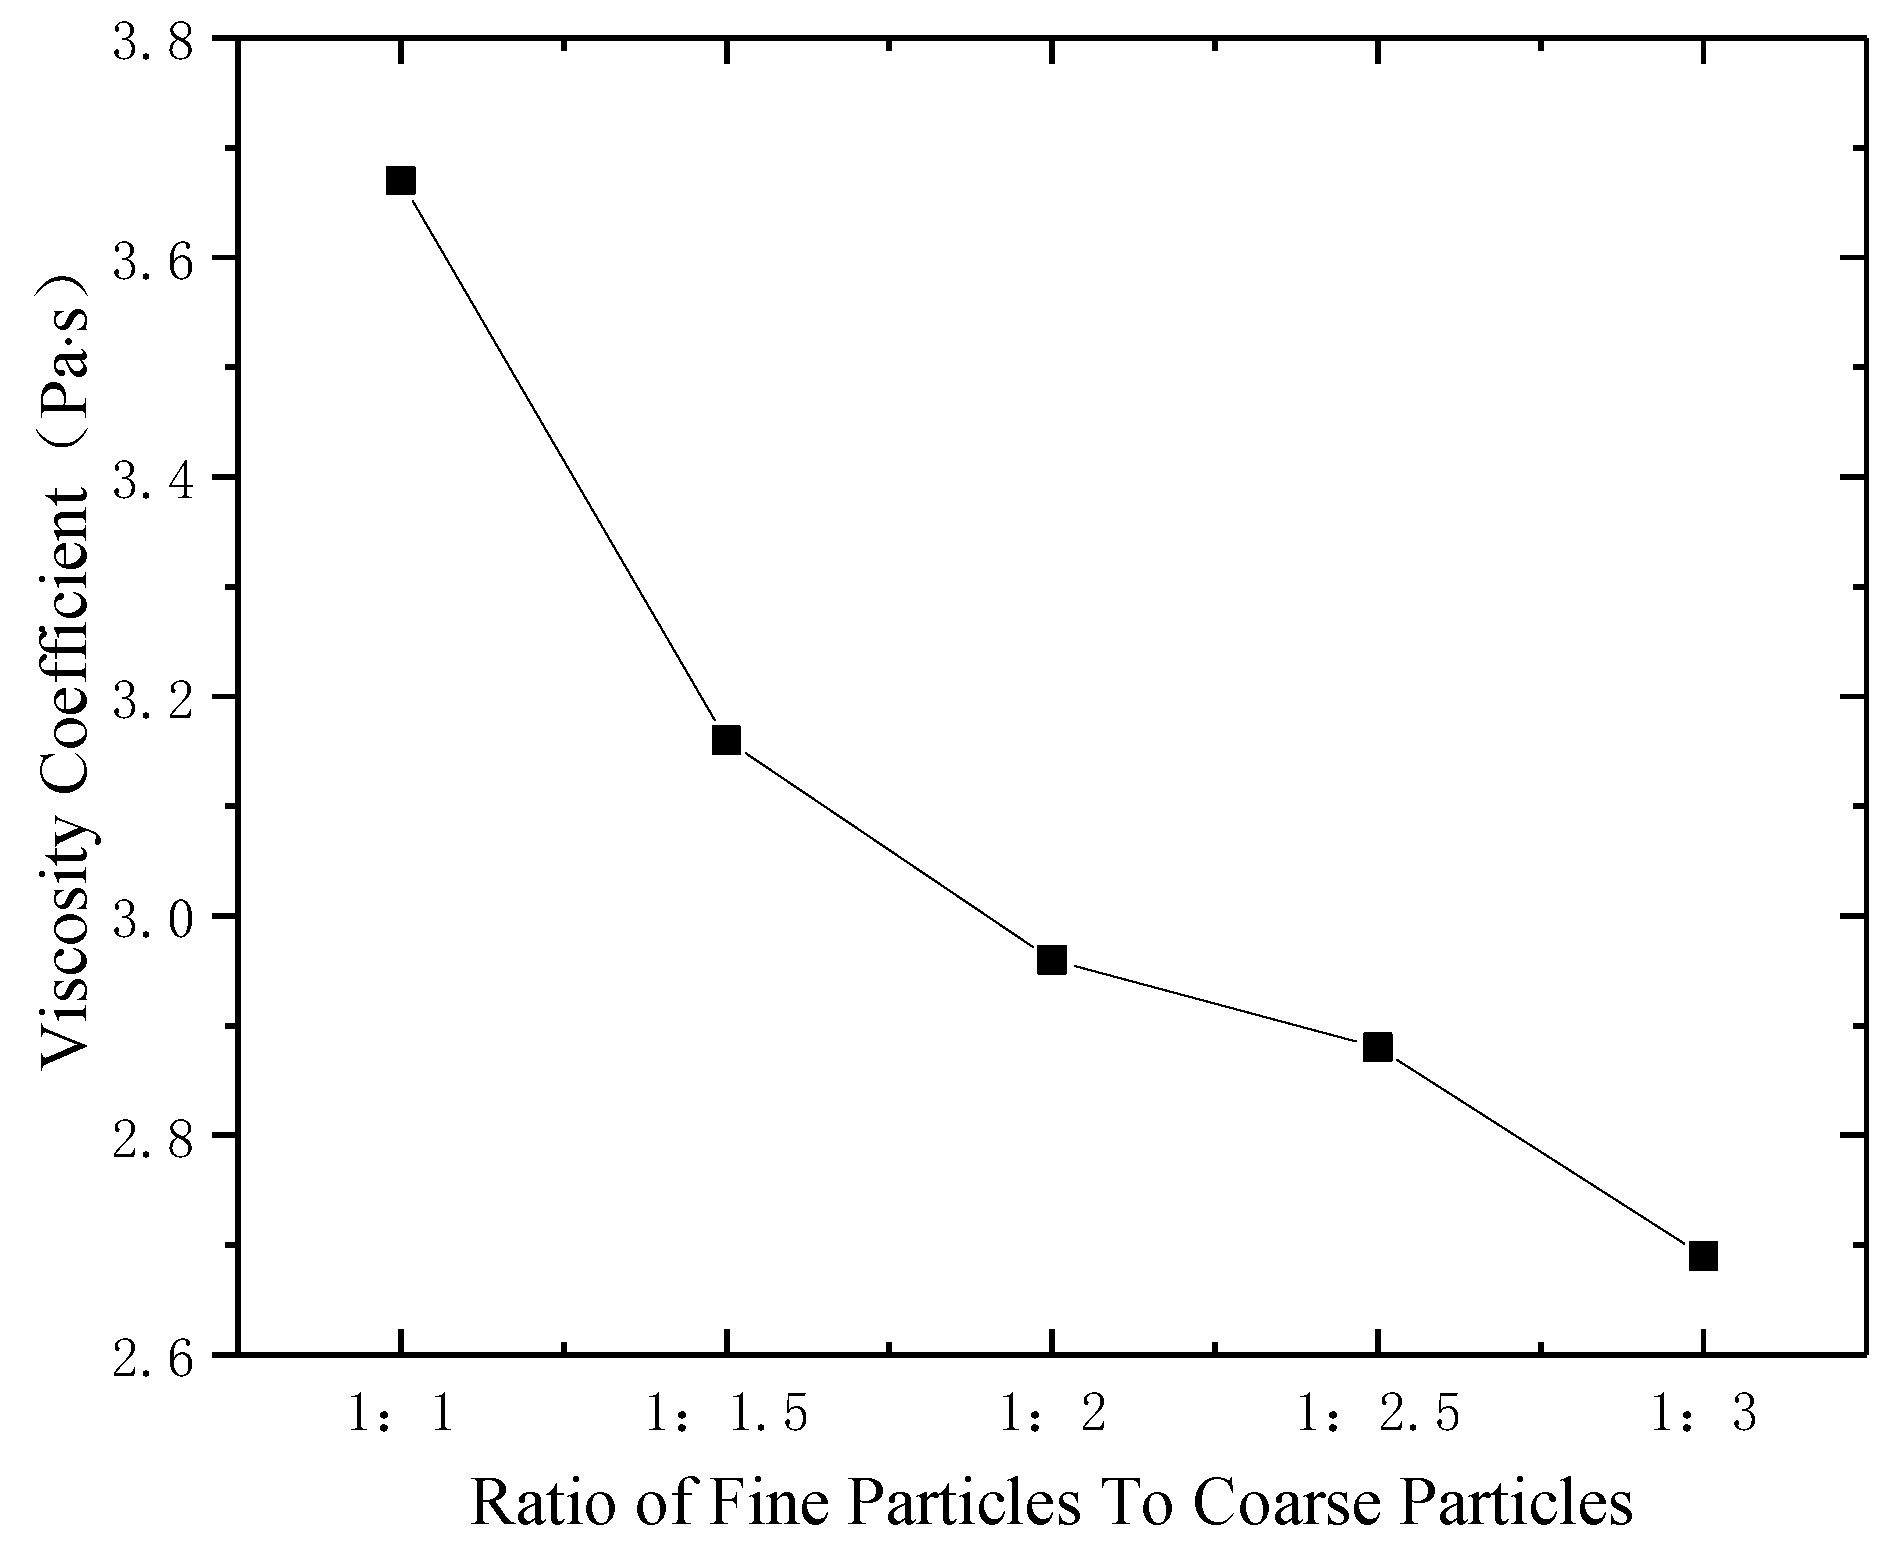
Figure 11 shows the relation between the viscosity coefficient and different ratios of fine particles to coarse particles; 
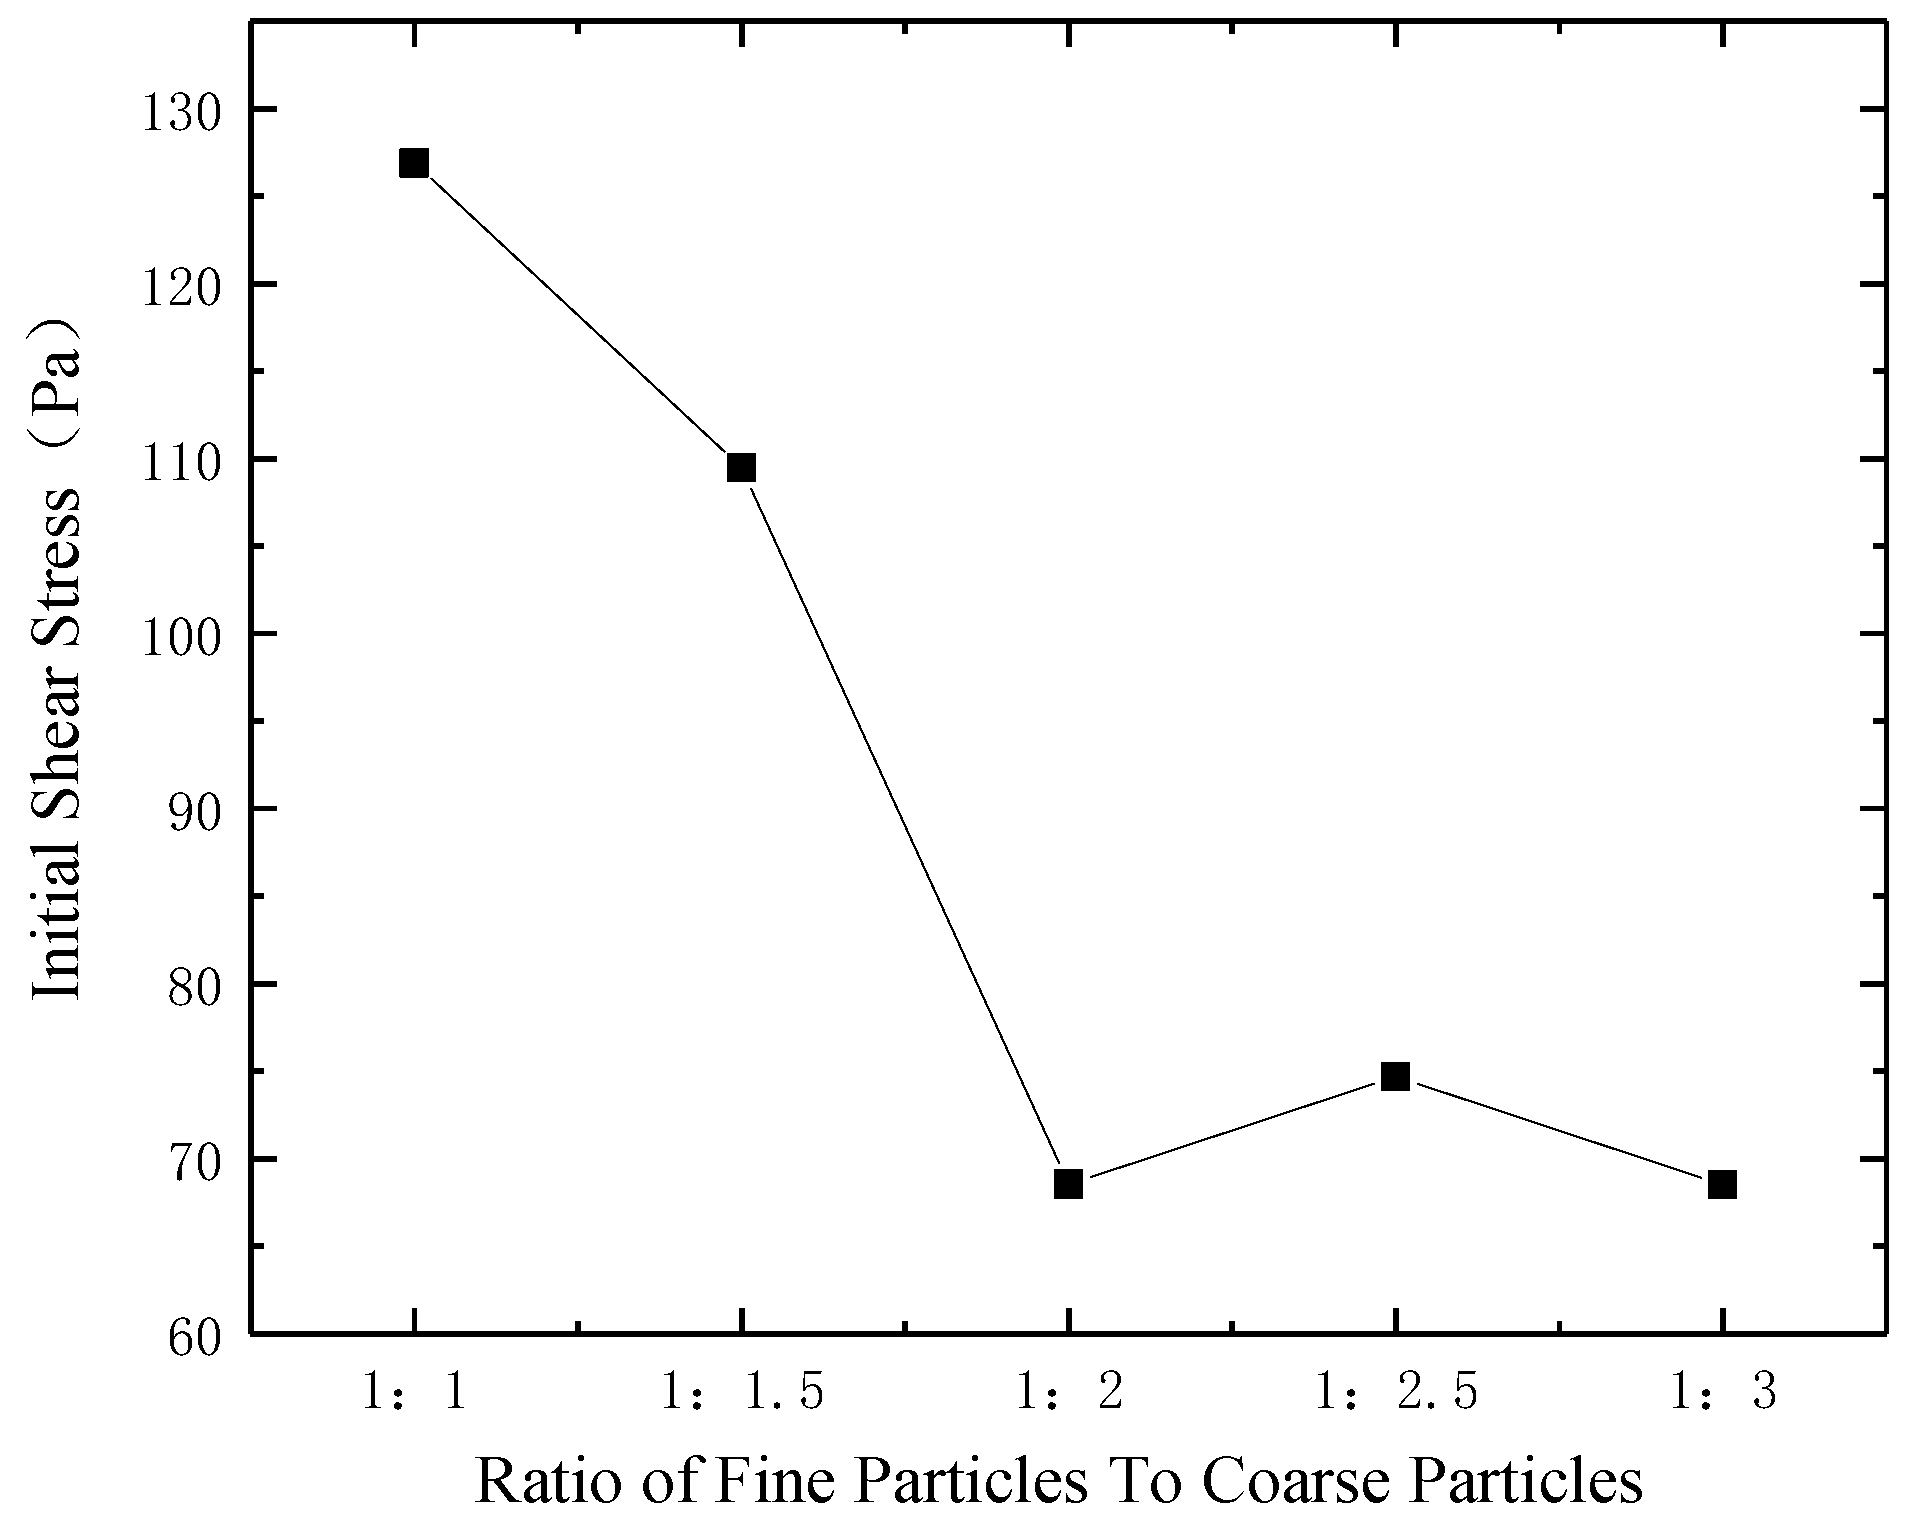
Figure 12 shows the relation between the initial shear stress and different ratios of fine particles to coarse particles.
The curve shows that the viscosity coefficient decreased with the increase in the ratio of fine particles to coarse particles. In particular, when the ratio increased from 1:1 to 1:1.5, the viscosity coefficient decreased significantly. The decreasing trend eased slightly when the ratio increased from 1:1.5 to 1:2, but the slope was still steeper than in the 1:2 to 1:2.5 segment. The decreasing trend from 1:2.5 to 1:3 was more obvious than in the 1:2 to 1:2.5 segment. The curve shows that the fine particle concentration was the key factor driving the viscosity coefficient change. Small changes in fine particle content will cause the viscosity coefficient to change remarkably.
The curve shows that the initial yield stress tended to decrease first and then fluctuated with the increase in the ratio of fine particles to coarse particles. When the content ratio changed from 1:1 to 1:2, the initial yield stress decreased notably; however, when the content ratio increased from 1:2 to 1:2.5, the yield stress became larger. Then, the initial yield stress decreased again when the ratio changed from 1:2.5 to 1:3. It can be seen from the trend of the rheological parameters that the best ratio of fine particles to coarse particles is 1:2.
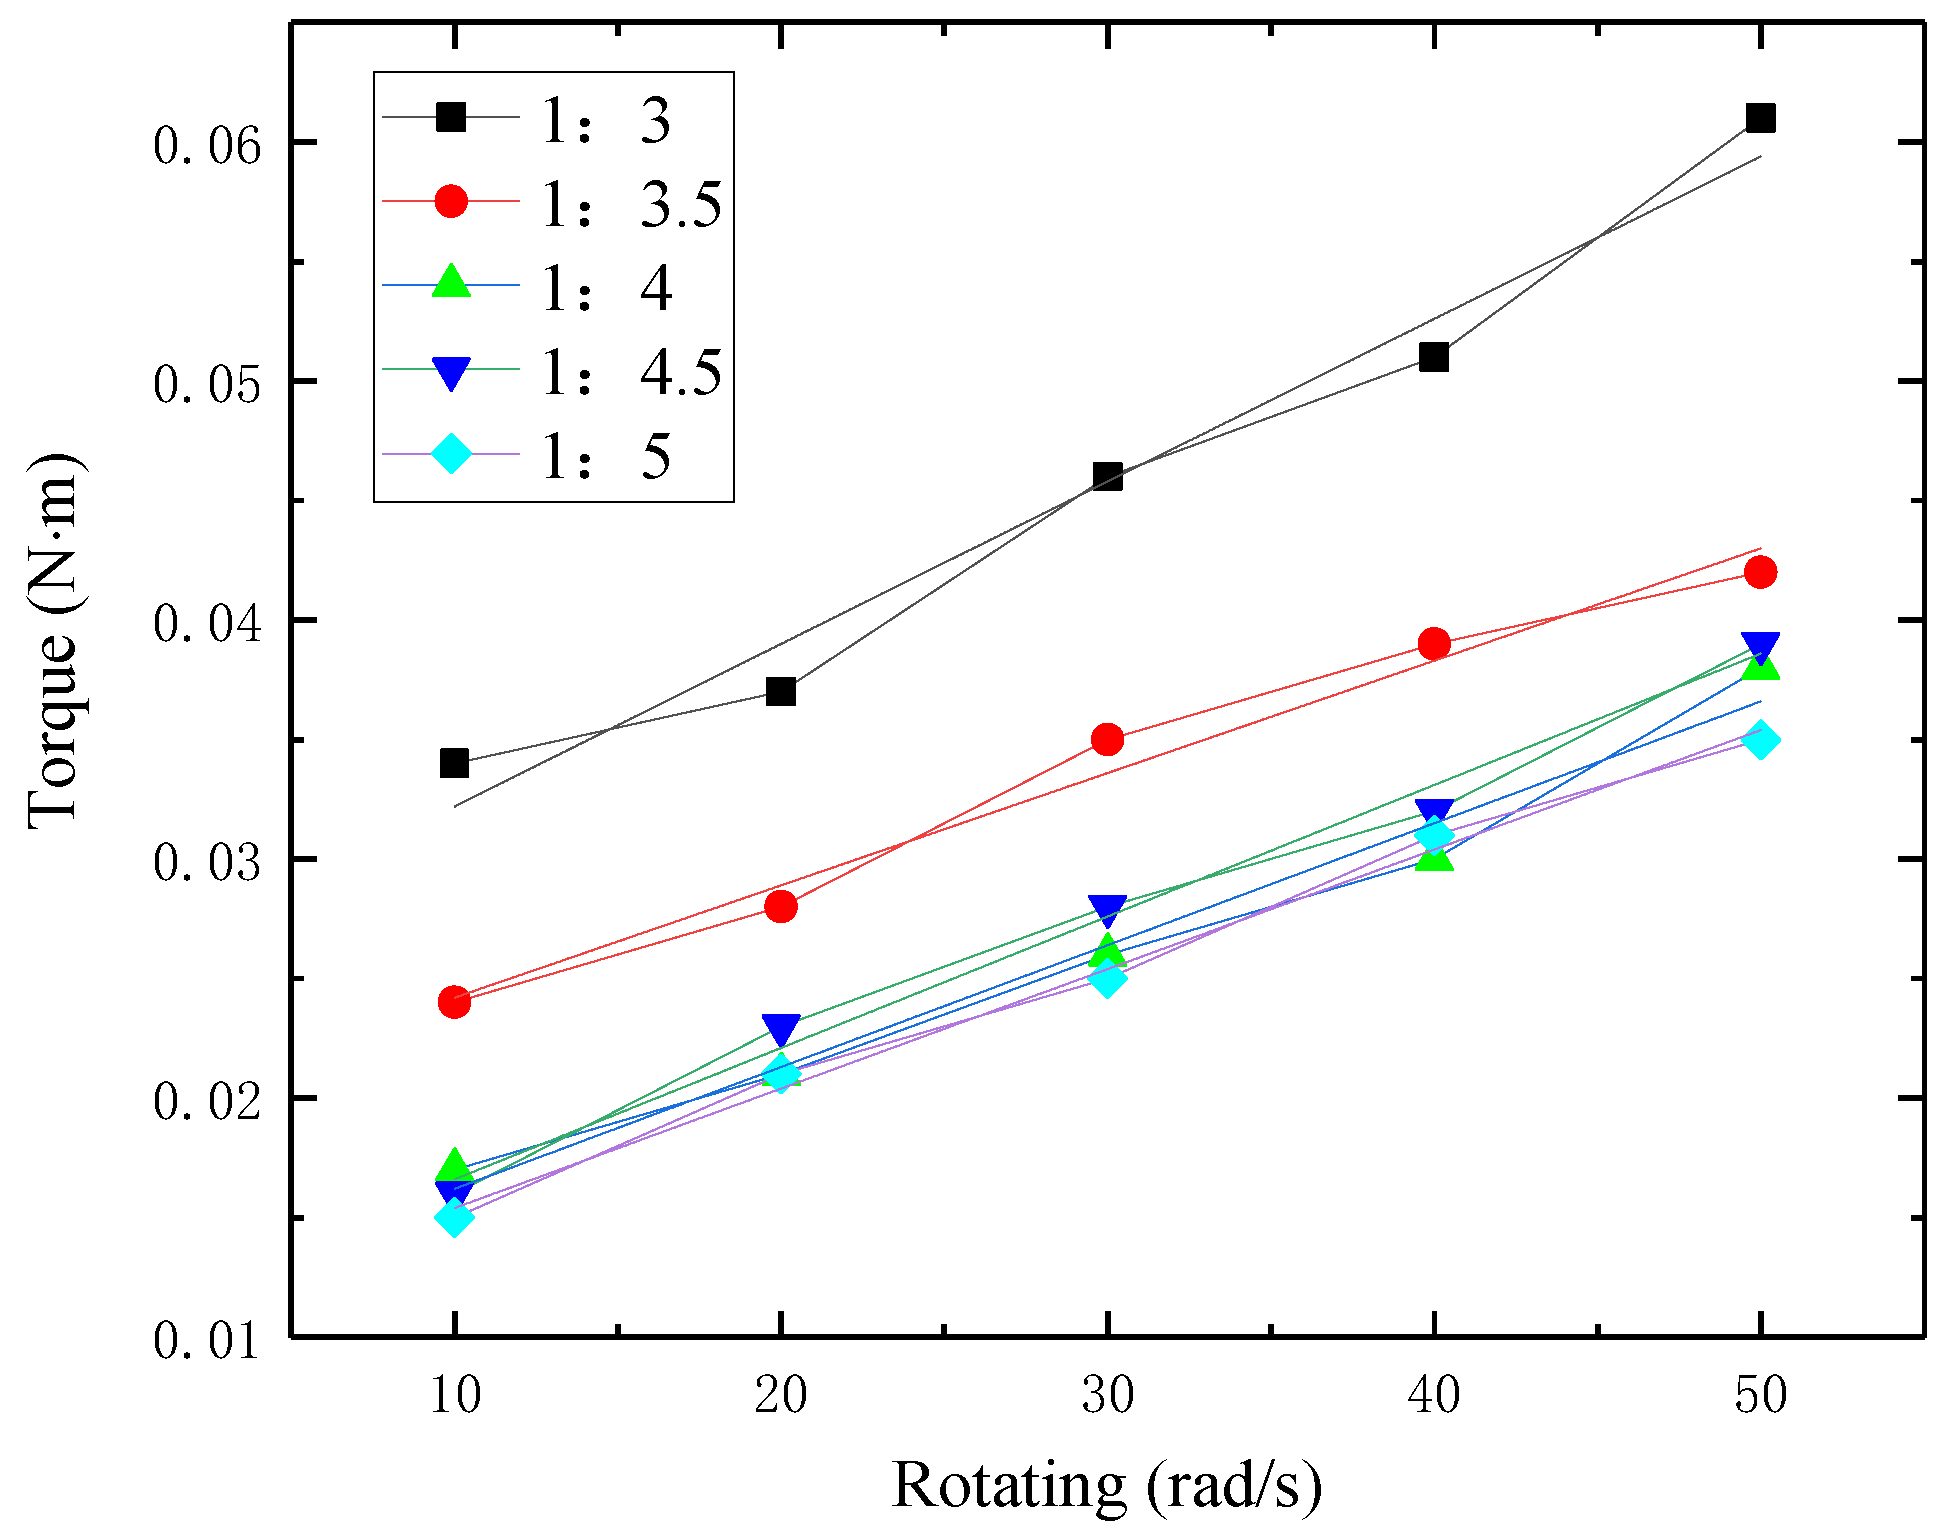
Figure 13 shows the relation between rotating speed and torque at different ratios of cement to fly ash in the slurry. It shows that the torque increased with the ratio of cement to fly ash in the slurry at the same rotating speed. The slopes of the fitted curves are roughly equal to the slopes of the curves in Figure 7.
Table 11 shows the relations between rotating speed and torque at different ratios of fine particles to coarse particles and the resulting rheological parameters of the slurry, based on Figure 13.
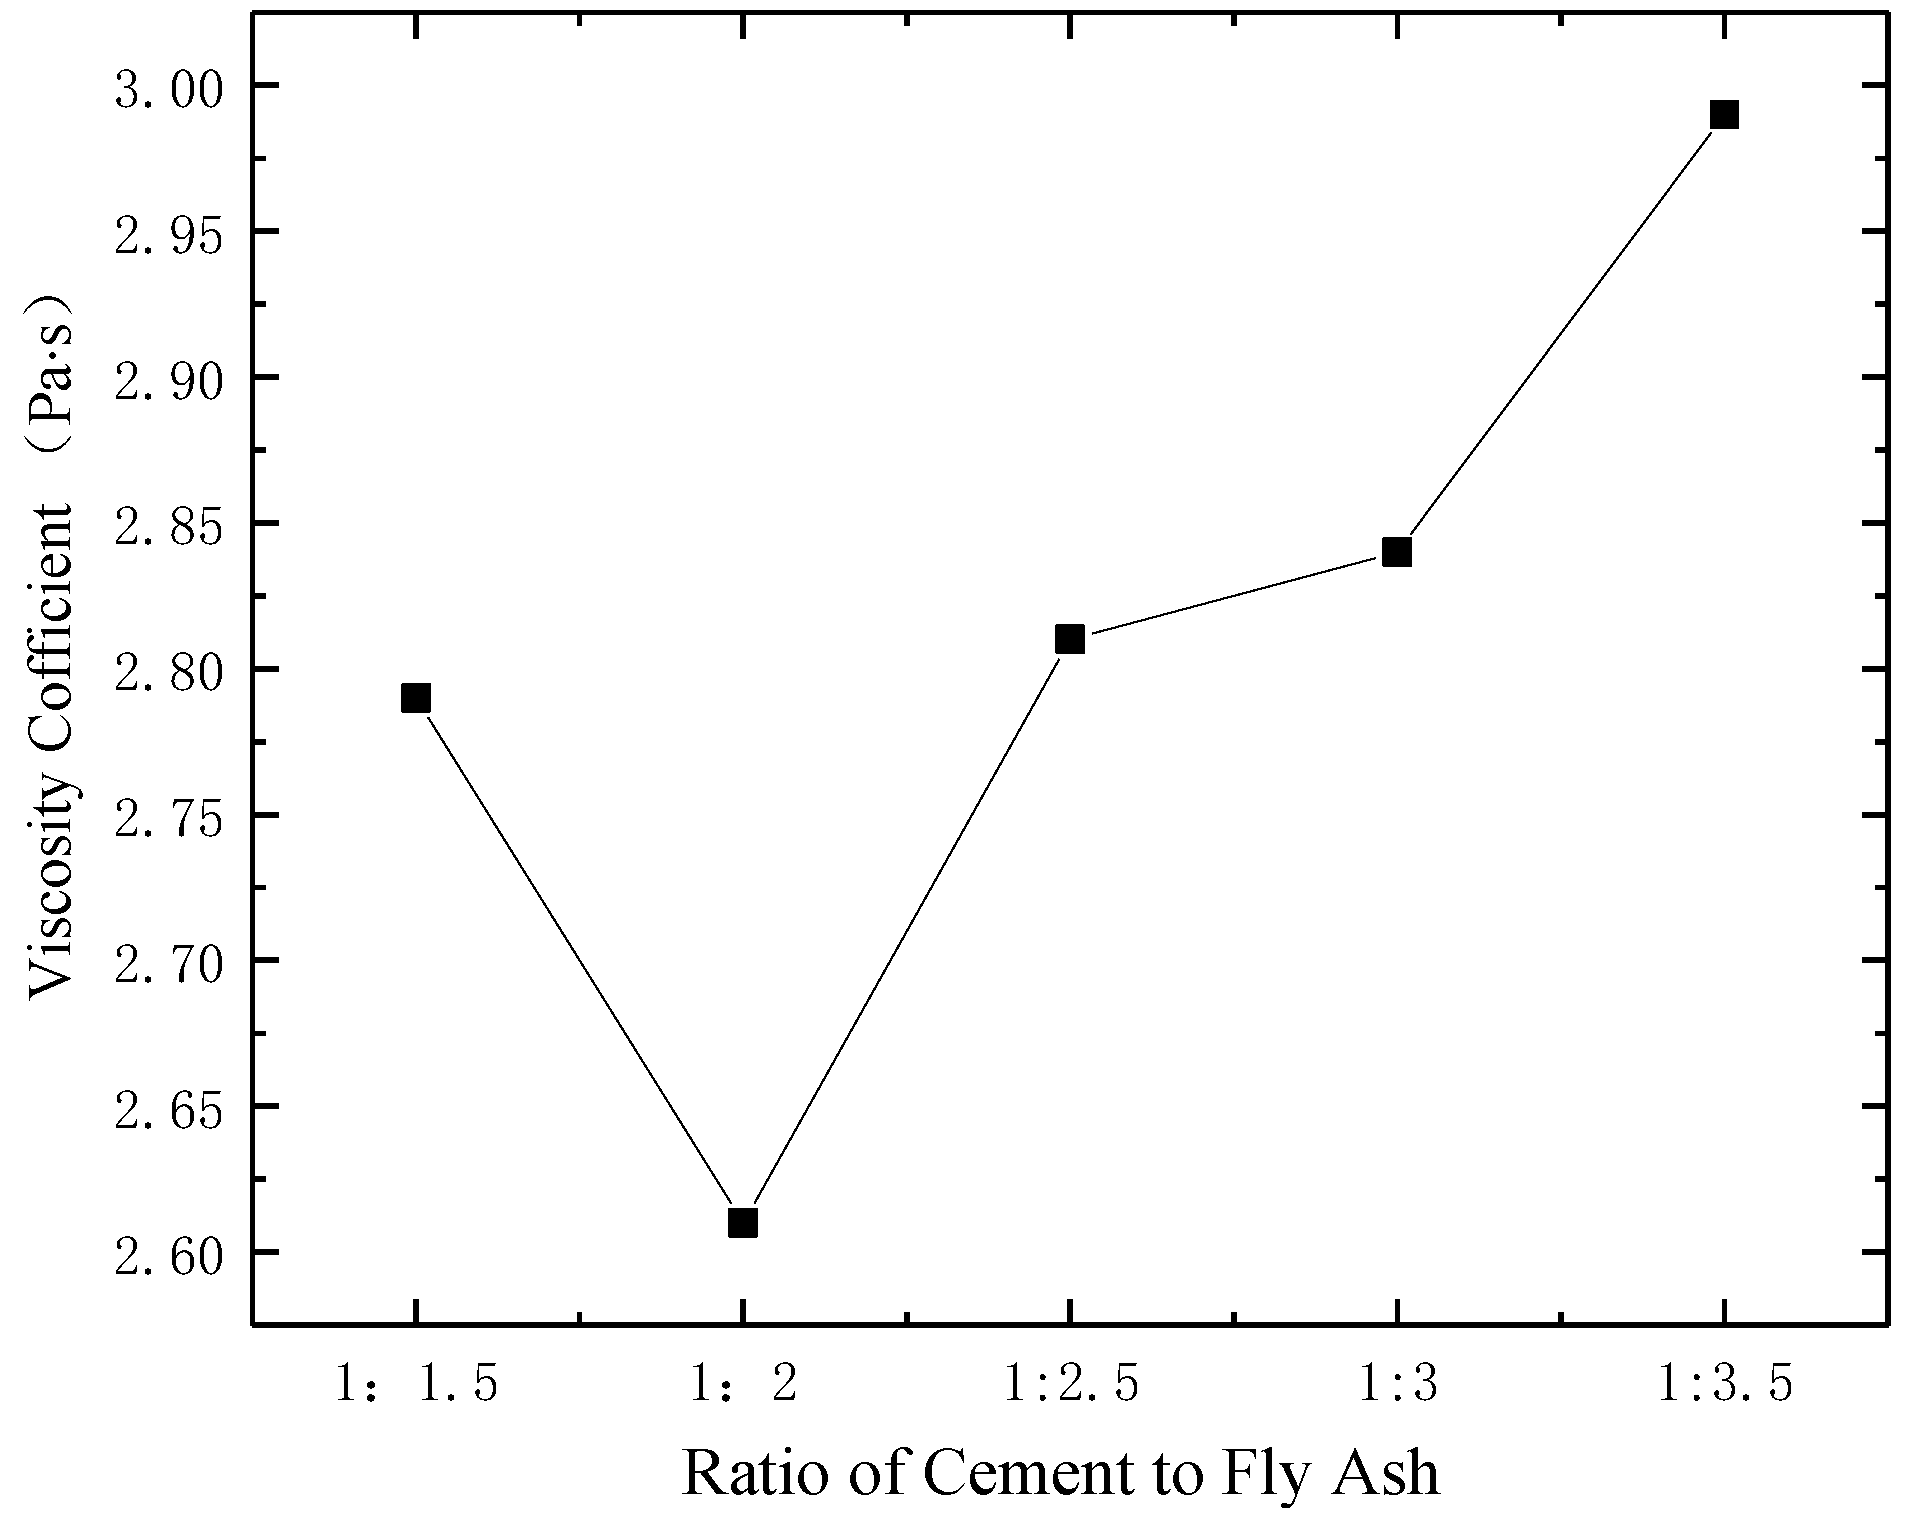
Figure 14 shows the relation between the viscosity coefficient and different ratios of cement to fly ash; 
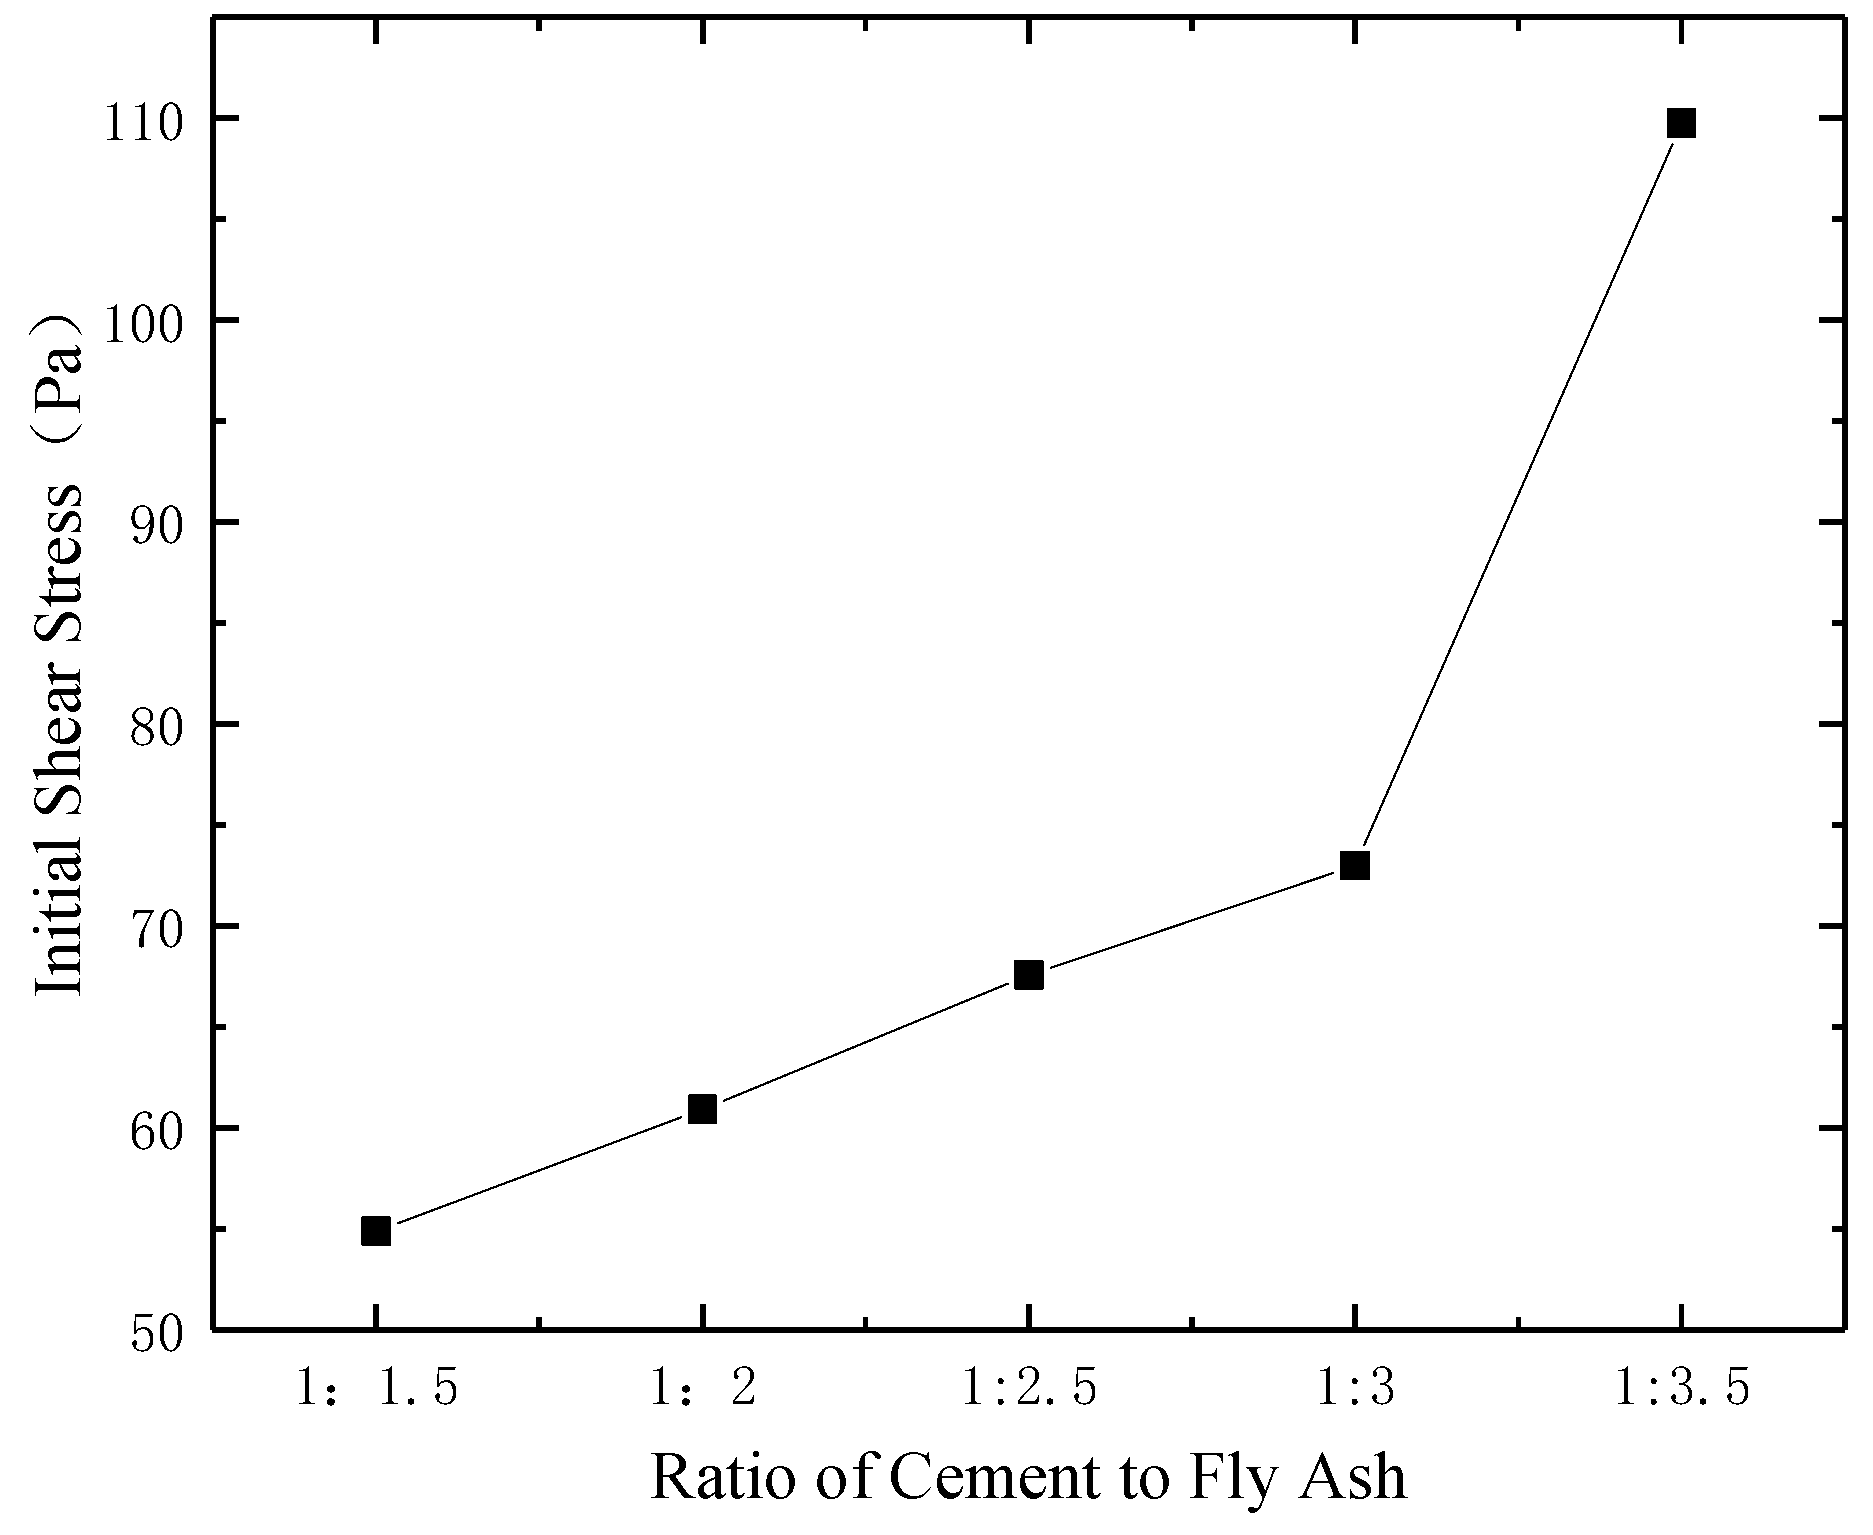
Figure 15 shows the relation between the initial shear stress and different ratios of cement to fly ash.
The curve shows that the viscosity coefficient tended to decrease first and then increased with the ratio of cement to fly ash. When the content ratio changed from 1:1.5 to 1:2, the initial yield stress decreased; however, when the content ratio increased from 1:2 to 1:3.5, the viscosity coefficient became large. The change in the segment from 1:2 to 1:2.5 was the most obvious of all. The segment from 1:2.5 to 1:3 changed more moderately than the segment from 1:3 to 1:3.5.
The initial yield stress increased with the cement and fly ash content ratio. However, the increasing tendency for the ratio change from 1:3 to 1:3.5 was more obvious than for the change in ratio from 1:1.5 to 1:3. Considering that the cost of cement is higher than that of fly ash, the cement content should be reduced as much as possible, i.e., with minimal sacrifice of the filling body’s strength. Taking into account the slurry’s flowability and the filling cost, the best ratio of cement to fly ash content is 1:3. In summary, the optimum ratio of Portland cement to fly ash to gangue is 1:3:8.

4. Evaluation of the Effectiveness of Slurry Filling

The paste-like slurry described in this paper was utilized in the Xinyang Coal Mine. The single-strike longwall mining method was used in this mine, with a mining height of 2.2 m. The average dip angle of the coal seam was 6°, and the average strike length of the working face was 569.7 m. The production capacity was 4.7 million t/a. The mining process alternated with the filling process. The mining face layout and filling face layout are shown in Figure 16.
According to the “Safety Regulations for Coal Mines (2016)” [27], coal pillars are left under the coal mine industrial square facilities to protect these constructions from subsidence and damage. The filling process of Xinyang Coal Mine was divided into two stages: The first stage consisted of filling by using high-concentration cementation filling at the front of the industrial square facilities. The use of a water-reducing admixture can retain the fluidity of the slurry with less water content, which is a unique feature of this filling method. This slurry was made of cement, fly ash, gangue, and a water-reducing admixture. The ratio of cement/fly ash/gangue/water-reducing admixture was 1:2:5:0.1. The mass concentration of the slurry was 74%. During the second stage, because of the presence of a large number of buildings and agricultural facilities on the surface, a smaller surface sink was allowed. The paste-like slurry filling method was used at this stage. The surface sink data was obtained by a monitoring station on the surface. The layout of the surface monitoring points is shown in Figure 17.
Table 12 presents the brick–concrete structure damage grades from the standard of the China Coal Association. Table 13 presents the surface deformation after using the high-concentration filling slurry. Table 14 presents the surface deformation after filling with the paste-like slurry. According to the “Building, Water Body, Railway and Main Mine Road Coal Pillar Retention and Coal Mining Regulations” [28] enacted by the China Coal Association, the surface deformation of the high-concentration cement filling process is graded as Class II, and the surface deformation of the paste-like slurry filling process is graded as Class I, meeting the requirements for surface building protection.
The surface sink curves of the two methods are shown in Figure 18.
Both surface sink-fitted curves were drawn using data collected from monitoring after six months. Figure 18 shows that: (1) the two curves are similar to a parabola and both high-concentration cementation filling and paste-like filling could effectively control surface sinking; (2) the area near the center of the goaf had the maximum surface sink; in the first stage, the variation of the radius, within a radius of 25 m, is not very obvious, then, when the radius changed from 25 m to 75 m, the sinking amount is sharply reduced from 180 mm to 30 mm; in the second stage, the sedimentation amount reduced from 75 mm to 25 mm; both curves have obvious changes; (3) when the radius is larger than 75 m, the two curves tend to be gentle again, up the boundary of the goaf; (4) the amount of surface sink when filling with the paste-like slurry was about 45% of the maximum amount of the surface sink when filling with the high-concentration cement slurry, indicating that the paste-like filling can better control surface subsidence.

5. Conclusions

The use of coal gangue and fly ash as filling materials is of significance to the sustainable development of mining. Our experimental results show that gangue and fly ash are suitable as filling materials. For practical use, the mass concentration of the slurry and the ratio of the components need to be controlled strictly.
XRD was used to analyze the gangue and fly ash. Their composition indicates that both have high strength characteristics and can be used as filling materials to support roof stability. The intelligent torque rheometer provides a new way to obtain the rheological parameters of a slurry that contains coarse particles. The equipment can also be used for other slurries containing large particles, such as a coarse coal slurry transported by pipeline. The optimized slurry ratio is determined from the viewpoint of rheology. Determining the rheological parameters according to the curves obtained from the measurements is a convenient method that produces accurate results.
The technology discussed in this paper is suitable for mines that employ paste-like backfilling. It may be useful to consider the strength of the optimized slurry after its consolidation with different component ratios, but that requires another research method. It may be that a lower filling rate can also control the sinking of the land surface, but this needs to be addressed by future studies.

Author Contributions

H.W. conceived and designed the experiments; H.W. and J.J. performed the experiments; H.W. and W.D. analyzed the data; Y.W. contributed analysis tools; H.W. wrote the paper.

Funding

This research received no external funding.

Conflicts of Interest

The authors declare no conflict of interest.

References

  1. China National Coal Association. Available online: http://www.coalchina.org.cn/page/tjsj.htm (accessed on 20 November 2018).
  2. Miao, X.X.; Qian, M.G. Research on green mining of coal resources in China: Current status and future prospects. J. Min. Saf. Eng. 2009, 26, 1–14. (In Chinese) [Google Scholar] [CrossRef]
  3. Qian, M.G. On sustainable coal mining in China. J. Chin. Coal Soc. 2010, 35, 529–534. (In Chinese) [Google Scholar]
  4. Li, J.; Huang, Y.; Qiao, M.; Chen, Z.; Song, T.; Kong, G.; Gao, H.; Guo, L. Effects of Water Soaked Height on the Deformation and Crushing Characteristics of Loose Gangue Backfill Material in Solid Backfill Coal Mining. Processes 2018, 6, 64. [Google Scholar] [CrossRef]
  5. Liang, Y.; Liang, H.; Zhu, S. Mercury emission from spontaneously ignited coal gangue hill in Wuda Coalfield, Inner Mongolia, China. Fuel 2016, 182, 525–530. [Google Scholar] [CrossRef]
  6. Wang, S.; Wang, X. Potentially useful elements (Al, Fe, Ga, Ge, U) in coal gangue: a case study in Weibei coal mining area, Shaanxi Province, northwestern China. Environ. Sci. Pollut. Res. Int. 2018, 25, 11893–11904. [Google Scholar] [CrossRef] [PubMed]
  7. Miao, X.X. Progress of fully mechanized mining with solid backfilling technology. J. Chin. Coal Soc. 2012, 37, 1247–1255. [Google Scholar] [CrossRef]
  8. Dickout, M.H. Filling effect on mining and properties of backfill materials. In Proceedings of the Jubilee Symposium on Mine Filling, North West Queensland Branch, Australia, August 1973; pp. 6–12. [Google Scholar]
  9. Feng, G.M. Research on the Superhigh-water Packing Material and Filling Mining Technology and Their Application. Ph.D. Thesis, China University of Mining and Technology, Xuzhou, China, 2009. [Google Scholar]
  10. Sun, H.; Liu, Q.; Liu, W. Commercial scale trial of a new consolidated backfill technology of full-range tailings with high water content. Nonferrous Met. 1993, 45, 7–13. [Google Scholar]
  11. Zhao, C.; Hu, N. Development and application of cementing filling material. Gold 2008, 29, 25–29. [Google Scholar] [CrossRef]
  12. Wang, X.; Xiao, W.; Wang, X.; Xiao, Z. Study on rheological properties of full tailing paste filling slurry of Jinchuan mine. Min. Metall. Eng. 2002, 22, 13–16. [Google Scholar] [CrossRef]
  13. Soete, J.; Claes, S.; Claes, H.; Janssens, N.; Cnudde, V.; Huysmans, M.; Swennen, R. Lattice Boltzmann Simulations of Fluid Flow in Continental Carbonate Reservoir Rocks and in Upscaled Rock Models Generated with Multiple-Point Geostatistics. Geofluids. 2017, 2017. [Google Scholar] [CrossRef]
  14. Lin, T. Research on the Flow Properties of the Gangue Paste-Like Slurry. Ph.D. Thesis, China University of Mining and Technology, Beijing, China, 2016. [Google Scholar]
  15. Fall, M.; Pokharel, M. Coupled effects of sulphate and temperature on the strength development of cemented tailings backfill: Portland cement-paste backfill. Cem. Concr. Compos. 2010, 32, 819–828. [Google Scholar] [CrossRef]
  16. Huang, Y.C. Mine Filling Theory and Technology; Metallurgical Industry Press: Beijing, China, 2014; pp. 59–60. ISBN 978-7-5024-6509-4. [Google Scholar]
  17. Fei, X. Slurry and Granular Materials Conveying Hydraulics; Tsinghua University Press: Beijing, China, 1994; p. 17. ISBN 978-7-3020-1384-6. [Google Scholar]
  18. Huang, Y.; Sun, H. Experimental Study on the Rheological Characteristic of Paste-like Slurry with Tailings as Aggregate. Metal Mine 2003, 324, 8–10. [Google Scholar] [CrossRef]
  19. Fall, M.; Benzaazous, M.; Ouellet, S. Experiment characterization of the influence of tailings fineness and density on the quality of cemented paste backfill. J. Mater. Sci. 2005, 18, 41–44. [Google Scholar] [CrossRef]
  20. Qiu, Z.; Cao, T.; Li, Y.; Wang, J.; Chen, Y. Rheological Behavior and Modeling of a Crushed Sandstone-Mudstone Particle Mixture. Processes 2018, 6, 192. [Google Scholar] [CrossRef]
  21. Fan, H.; Guo, Z.; Huang, W. Experiment of Mechanics Properties of Gangue Cementing Stowing Body. Coal Min. Technol. 2015, 20, 83–86. [Google Scholar] [CrossRef]
  22. Wang, Y.; Zhu, W.; Xie, G. Comparative analysis on the structure and properties of two paste-like cemented materials. Nonferrous Met. (Min. Sec.) 2017, 69, 71–75. [Google Scholar] [CrossRef]
  23. Wang, J.; Li, Y.; Zhou, X.; Wu, L.; Wei, S. Ground movement caused by mining under thick alluvium. J. Chin. Coal Soc. 1997, 22, 18–21. [Google Scholar] [CrossRef]
  24. Guo, G.; Wang, Y.; Ma, Z. A new method for ground subsidence contral in coal mining. J. Chin. Univ. Min. Technol. 2004, 33, 150–153. [Google Scholar] [CrossRef]
  25. Xu, J.; You, Q.; Zhu, W. Theoretical study of strip filling to control mining subsidence. J. Chin. Coal Soc. 2007, 32, 119–122. [Google Scholar] [CrossRef]
  26. Zhao, J.; Liu, C.; Li, J.; Wang, W. Three-Dimensional geological modeling and surface damage in gully area due to shallow coal seam mining. J. Min. Saf. Eng. 2018, 35, 969–977. [Google Scholar]
  27. State Administration of Work Safety. Safety Regulations for Coal Mines. Available online: http://www.chinasafety.gov.cn/ (accessed on 20 November 2018).
  28. National Coal Mine Safety Administration. Building, Water Body, Railway and Main Mine Road Coal Pillar Retention and Coal Mining Regulations. Available online: http://www.chinacoal-safety.gov.cn/ (accessed on 20 November 2018).
Figure 1. X-ray diffraction spectrum of washed gangue.
Processes 06 00232 g001
Figure 2. X-ray diffraction spectrum of fly ash.
Processes 06 00232 g002
Figure 3. Intelligent Torque Rheometer.
Processes 06 00232 g003
Figure 4. Schematic of the Intelligent Torque Rheometer.
Processes 06 00232 g004
Figure 5. Anton Paar RheolabQC Rheometer.
Processes 06 00232 g005
Figure 6. Torque comprehensive regression curve.
Processes 06 00232 g006
Figure 7. Relation between rotating speed and torque at different concentrations.
Processes 06 00232 g007
Figure 8. Relation between viscosity coefficient and slurry mass concentrations.
Processes 06 00232 g008
Figure 9. Relation between initial shear stress and slurry mass concentrations.
Processes 06 00232 g009
Figure 10. Relation between rotating speed and torque at different ratios of fine particles to coarse particles.
Processes 06 00232 g010
Figure 11. Relation between viscosity coefficient and different ratios of fine particles to coarse particles.
Processes 06 00232 g011
Figure 12. Relation between initial shear stress and different ratios of fine particles to coarse particles.
Processes 06 00232 g012
Figure 13. Relation between rotating speed and torque at different ratios of cement to fly ash in the slurry.
Processes 06 00232 g013
Figure 14. Relation between viscosity coefficient and different ratios of cement to fly ash.
Processes 06 00232 g014
Figure 15. Relation between initial shear stress and different ratios of cement to fly ash.
Processes 06 00232 g015
Figure 16. Layout diagram of the filling face.
Processes 06 00232 g016
Figure 17. Layout diagram of the monitoring stations.
Processes 06 00232 g017
Figure 18. Surface sink curves of two filling slurries at the same filling rate.
Processes 06 00232 g018
Table 1. Chemical composition of washed gangue.
SampleNa2OMgOAl2O3SiO2K2OCaOFe2O3PS
Washed Gangue (%)1.21.224.353.11.35.41.90.030.8
Table 2. Chemical composition of fly ash.
SampleNa2OMgOAl2O3SiO2K2OCaOFe2O3PS
Fly Ash (%)1.51.225.548.80.64.24.70.071.0
Table 3. Viscometer test indicators.
PowerMeasuring Range (η)Shear Stress (τ)Shear Rate (Ds)Rotating Speed (n)
220 ± 22 V
50 ± 0.5 Hz
1 to 109 mPa·s0.5 to 104 Pa10−2 to 6500 0.01~1200 r/min
Table 4. Slurry parametric test.
Mass ConcentrationViscosity Coefficient/Pa·sInitial Shear Stress/PaThe Relation of M–ω
54%0.0401.626 M = 1.76 × 10 5 ω + 1.66 × 10 4
56%0.0423.179 M = 1.89 × 10 5 ω + 3.21 × 10 4
58%0.0455.961 M = 2.09 × 10 5 ω + 5.88 × 10 4
60%0.0748.847 M = 3.31 × 10 5 ω + 8.74 × 10 4
Table 5. Test values under different concentrations.
Mass ConcentrationRotating Speed r/minMeasured Torque N·mActual Torque N·m
54%2200.000150.00065
2600.000210.00072
3300.000350.00087
3700.000370.00089
4000.000420.00095
56%2400.00010.0006
2700.00020.00071
3400.000280.00079
3800.000360.00088
4200.000390.00092
58%2600.000870.0014
3000.000960.0015
3300.0010.0016
4100.00120.0018
4600.00120.0019
60%2200.000680.0012
2600.000790.0014
3200.0010.0016
3400.00120.0018
3800.00130.0019
Table 6. Ratios of the slurry composition at different mass concentrations.
Mass ConcentrationGangue (g)Fly Ash (g)Portland Cement (g)Water (g)
74%296113.834.2156
75%300115.434.6150
76%304116.935.1144
78%31212036132
79%316121.536.5126
Table 7. Ratio of the slurry composition at different ratios of fine particles to coarse particles.
Ratio of Fine Particles to Coarse ParticlesGangue (g)Fly Ash (g)Portland Cement (g)Water (g)
1:122817157144
1:1.5273.6136.845.6144
1:230411438144
1:2.532697.532.5144
1:334285.528.5144
Table 8. Ratio of the slurry composition at different ratios of fly ash to cement in the slurry.
Ratio of Fine Particles Versus Coarse ParticlesGangue (g)Fly Ash (g)Portland Cement (g)Water (g)
1:3296114.245.8144
1:3.529612040144
1:4296124.435.6144
1:4.529612832144
1:529613129144
Table 9. Relation between rotating speed and torque and the rheological parameters at different concentrations of the slurry.
ConcentrationsRelation Between Rotating Speed and Torque Viscosity Coefficient (Pa·s)Initial Shear Stress (Pa)
74%M = 4.33 × 10⁻⁴ ω + 8.51 × 10−32.4251.89
75%M = 4.67 × 10⁻⁴ ω + 9.19 × 10−32.6156.06
76%M = 4.85 × 10⁻⁴ ω + 1.25 × 10−22.7176.12
78%M = 5.07 × 10⁻⁴ ω + 1.66 × 10−22.83101
79%M = 5.33 × 10⁻⁴ ω + 2.17 × 10−22.98132.55
Table 10. Relation between rotating speed and torque at different ratios of fine particles to coarse particles of the slurry and the resulting rheological parameters.
Ratio of Fine Particles to Coarse Particles Relation Between Rotating Speed and TorqueViscosity Coefficient (Pa·s)Initial Shear Stress (Pa)
1:1M = 6.60 × 10⁻⁴ ω + 2.08 × 10−33.67126.9
1:1.5M = 5.66 × 10⁻⁴ ω + 1.80 × 10−33.16109.5
1:2M = 5.02 × 10⁻⁴ ω + 1.12 × 10−22.9668.53
1:2.5M = 5.16 × 10⁻⁴ ω + 1.23 × 10−22.8874.68
1:3M = 4.82 × 10⁻⁴ ω + 1.12 × 10−22.6968.52
Table 11. Relation between rotating speed and torque at different ratios of cement to fly ash and the resulting rheological parameters of the slurry.
Ratio of Cement versus Fly Ash Relation Between Rotating and TorqueViscosity Coefficient (Pa·s)Initial Shear Stress (Pa)
1:3M = 4.99 × 10⁻⁴ ω + 9.00 × 10−32.7954.88
1:3.5M = 4.67 × 10⁻⁴ ω + 9.99 × 10−32.6160.9
1:4M = 5.02 × 10⁻⁴ ω + 1.11× 10−22.8167.56
1:4.5M = 5.08 × 10⁻⁴ ω + 1.21 × 10−22.8472.98
1:5M = 5.39 × 10⁻⁴ ω + 1.59 × 10−22.99109.75
Table 12. China Coal Association’s brick–concrete structure damage grade system.
Damage LevelSurface DeformationDamage Level
Horizontal Deformation ε (mm/m)Curvature k (10−3/m)Tilt Angle i (mm/m)
I≤2.0≤0.2≤3.0Negligible Damage or Slight Damage
II≤4.0≤0.4≤6.0Mild Damage
III≤6.0≤0.6≤10.0Moderate Damage
IV>6.0>0.6>10.0Severe Damage
Table 13. Surface deformation after filling with the high-concentration filling slurry.
Surface DeformationVertical Displacement (mm)Horizontal Displacement (mm)Tilt Angle (mm/m)Curvature (mm/m2)Horizontal Deformation (mm/m)
Maximum Deformation18987/−873.60/−3.600.06/−0.102.03/−2.95
Table 14. Surface deformation after filling with the paste-like slurry.
Surface DeformationVertical Displacement (mm)Horizontal Displacement (mm)Tilt Angle (mm/m)Curvature (mm/m2)Horizontal Deformation (mm/m)
Maximum Deformation8234/−341.13/−1.130.02/−0.040.57/−1.26

