Article

The Effect of Collision Angle on the Collision and Adhesion Behavior of Coal Particles and Bubbles

School of Chemical and Environmental Engineering, China University of Mining and Technology (Beijing), Beijing 100083, China
*
Authors to whom correspondence should be addressed.
Processes 2018, 6(11), 218; https://doi.org/10.3390/pr6110218
Submission received: 8 October 2018 / Revised: 30 October 2018 / Accepted: 31 October 2018 / Published: 5 November 2018
(This article belongs to the Special Issue Fluid Flow in Fractured Porous Media)

Abstract

:
The collision and adhesion behavior of particles and bubbles is the key to flotation. Many scholars have investigated the collision and adhesion law of regularly shaped and homogeneous particles (glass beads, glass fiber), but the particles in flotation cells are irregular and heterogeneous. Therefore, it is necessary to take actual coal samples as the research object. First, based on previous research, a particle–bubble collision and adhesion behavior measurement device was set up to study free falling coal particles with different surface properties colliding and adhering to a bubble (db = 1.0 mm). Then bituminous coal from Inner Mongolia was taken as the test object, and the collision and adhesion process of a large amount of coal particles was traced. The entire process is photographically recorded by a camera and analyzed frame by frame through a self-designed software. Finally, the relationship between collision angle and initial settlement position (initial), particle velocity (process), and adhesion efficiency (result) was studied by taking the collision angle as the cut-in point. It was found that both the distribution range of the initial settlement position and the particle central distribution interval are expanding outward with the increase of collision angle. The resistance layer has an important influence on the velocity of particles. The collision angle had an effect on adhesion efficiency and the adhesion efficiency of low-density particles was higher than that of high-density particles.

1. Introduction

Flotation is a kind of technology that takes bubbles as the carrier to recover useful minerals according to the difference between particle surface properties. It has the advantages of large throughput, highly precise separation, and simple operation, so it has been widely used in the separation of fine minerals such as coal, copper, and zinc ore [1,2,3]. The interaction between particles and bubbles will affect the flotation results. At present, it is generally believed that the process of particle–bubble interaction can be divided into three sub processes [4]: (1) particles collide with bubbles, (2) particles adhere to bubbles and form a stable combination, and (3) unstable adhesion particles detach from bubbles.
When a particle collides with a bubble and squeezes the free water between them, there is a thin liquid film between them [5]. As the particle keeps approaching the bubble, the thin liquid film gradually thins until it reaches the critical liquid film thickness. With the rupture of the thin liquid film, the particle adheres to the bubble and the extension of three-phase contact makes the adhesion more firm. Adhesion is influenced by the particle’s surface properties, the state of the fluid, and the chemical environment of the solution.
In recent years, many scholars have done experiments on the movement of particles on the surface of bubbles. The research method used is mainly particle sedimentation, that is, an injector is used to create a bubble on top of the needle in the water tank. The particles settle under the action of gravity. The collision and adhesion process of particles is observed by a high-speed camera [6,7,8].
At present, materials with homogeneous surface properties (glass beads, glass fiber) are usually used as test objects. It is found that the adhesion behavior is affected by the hydrophobicity of the particles [9,10,11]. Hydrophobic glass beads will jump in the bubbles, while this phenomenon is not observed if the test material is hydrophilic glass beads. Hydrophilic glass beads only slide along the upper hemisphere of the bubble and will detach if they cross the bubble equator, but hydrophobic glass beads will continue to slide along the bubble surface and eventually adhere to the bottom of the bubble after crossing the equator [12,13]. In addition to hydrophobicity, the shape of the particle also has a great influence on adhesion [14]. The irregular convex surface of particles can speed up the liquid film drainage and puncture the liquid film. The induction time of polygonal particles is much lower than that of spherical particles [15]. It was found that the collision angle also affects adhesion through studying the motion of hydrophobic glass fiber. Studies have shown that when the collision angle was less than 30°, the glass fiber adhered to the bubble along the long axis and adhered stably. When the collision angle was greater than 30°, the glass fiber adhered to the bubble along the short axis and was susceptible to the fluid environment [16].
In summary, most of the tested objects have been materials with regular shape and homogeneous surface properties (glass beads, glass fiber). Actual minerals have not been studied in depth because of their complex surface properties and irregular shape. Research work in other fields have shown that material heterogeneity has an important influence on many processes of particles, such as the strength and deformation behavior and micro-cracking process of minerals. Therefore, the influence of particle heterogeneity should be considered in the research of flotation [17,18,19]. In this paper, actual coal samples are taken as the research object and the relationship between collision angle and initial settling position, particle velocity, and adhesion efficiency is studied from the point of view of particle group.

2. Materials and Methods

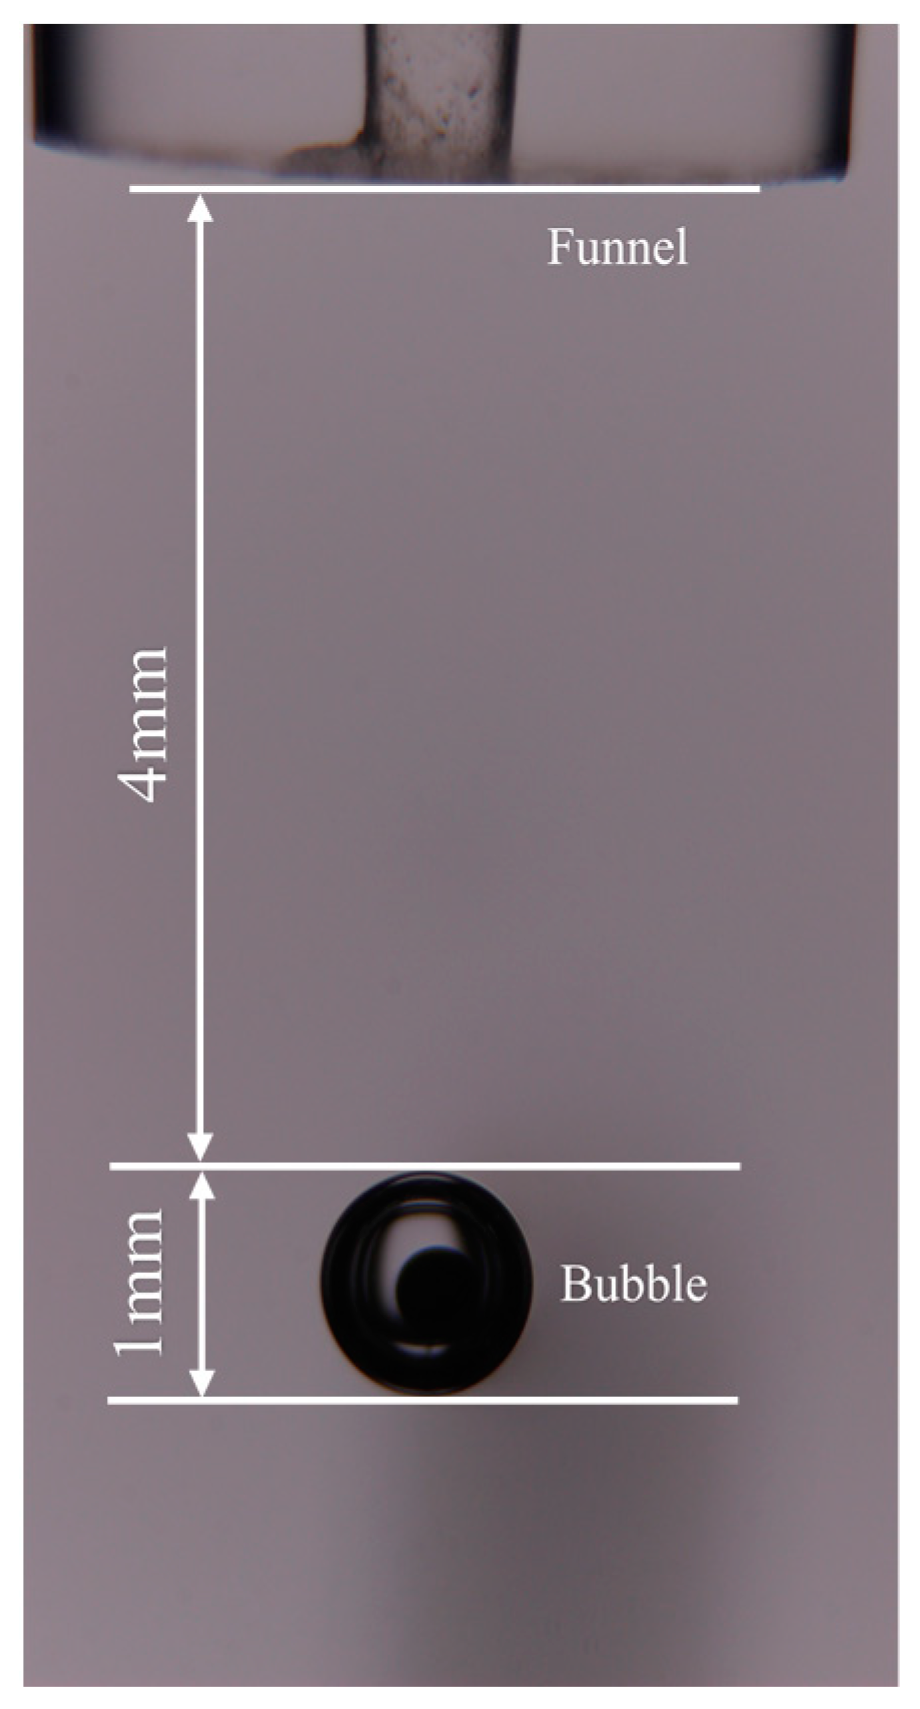
2.1. Experimental Device

A three-dimensional (3D) diagram of the test device is shown in Figure 1. The main part of the device is composed of a funnel micromoving device, a bubble micromoving device, a bubble-generating device, a feeding funnel, a water tank, a camera, and a light-emitting diode (LED) array light source.
The characteristics of the device are as follows: (1) The funnel position is adjusted by the funnel micromoving device to ensure that the particles settle in the depth of focus, and the adjustment accuracy is 0.01 mm. (2) The bubble micromoving device can move bubbles in the direction of XYZ, and the moving precision is 0.01 mm. (3) The bubble diameter can be adjusted to 0.5–2.0 mm. (4) The material of the water tank is PMMA (Polymethyl methacrylate) and the light transmittance rate is 92%. The water tank size is 80 mm × 90 mm × 150 mm. (5) The LED array light source, used to provide illumination, consists of 8 × 12 LED beads. The luminous flux is 1250 lm and the color-rendering index is 95.

2.2. Experimental Methods

The conversion relationship between the pixel and the actual distance is first established in the experiment. The method is as follows: (1) Generate a bubble with the bubble-generation device. (2) Move the bubble through the bubble micromoving device. Take 1 photo per 0.50 mm and move 5 times. (3) Calculate the actual distance of 1 pixel according to the actual moving distance of the bubble and the pixel movement of the bubbles in the image. The bubble size can be adjusted according to the conversion relationship, and the bubble diameter is adjusted to 1 mm in this experiment.
The relative position of the feeding funnel and the bubble is shown in Figure 2. The outlet of the funnel is 4 mm from the top of the bubble and the particle enters the water tank through the feeding funnel. No external force is applied in the feeding process, and particles only settle under gravity. Each experimental video was about 5 h, and the final count of effective particles was about 1200.

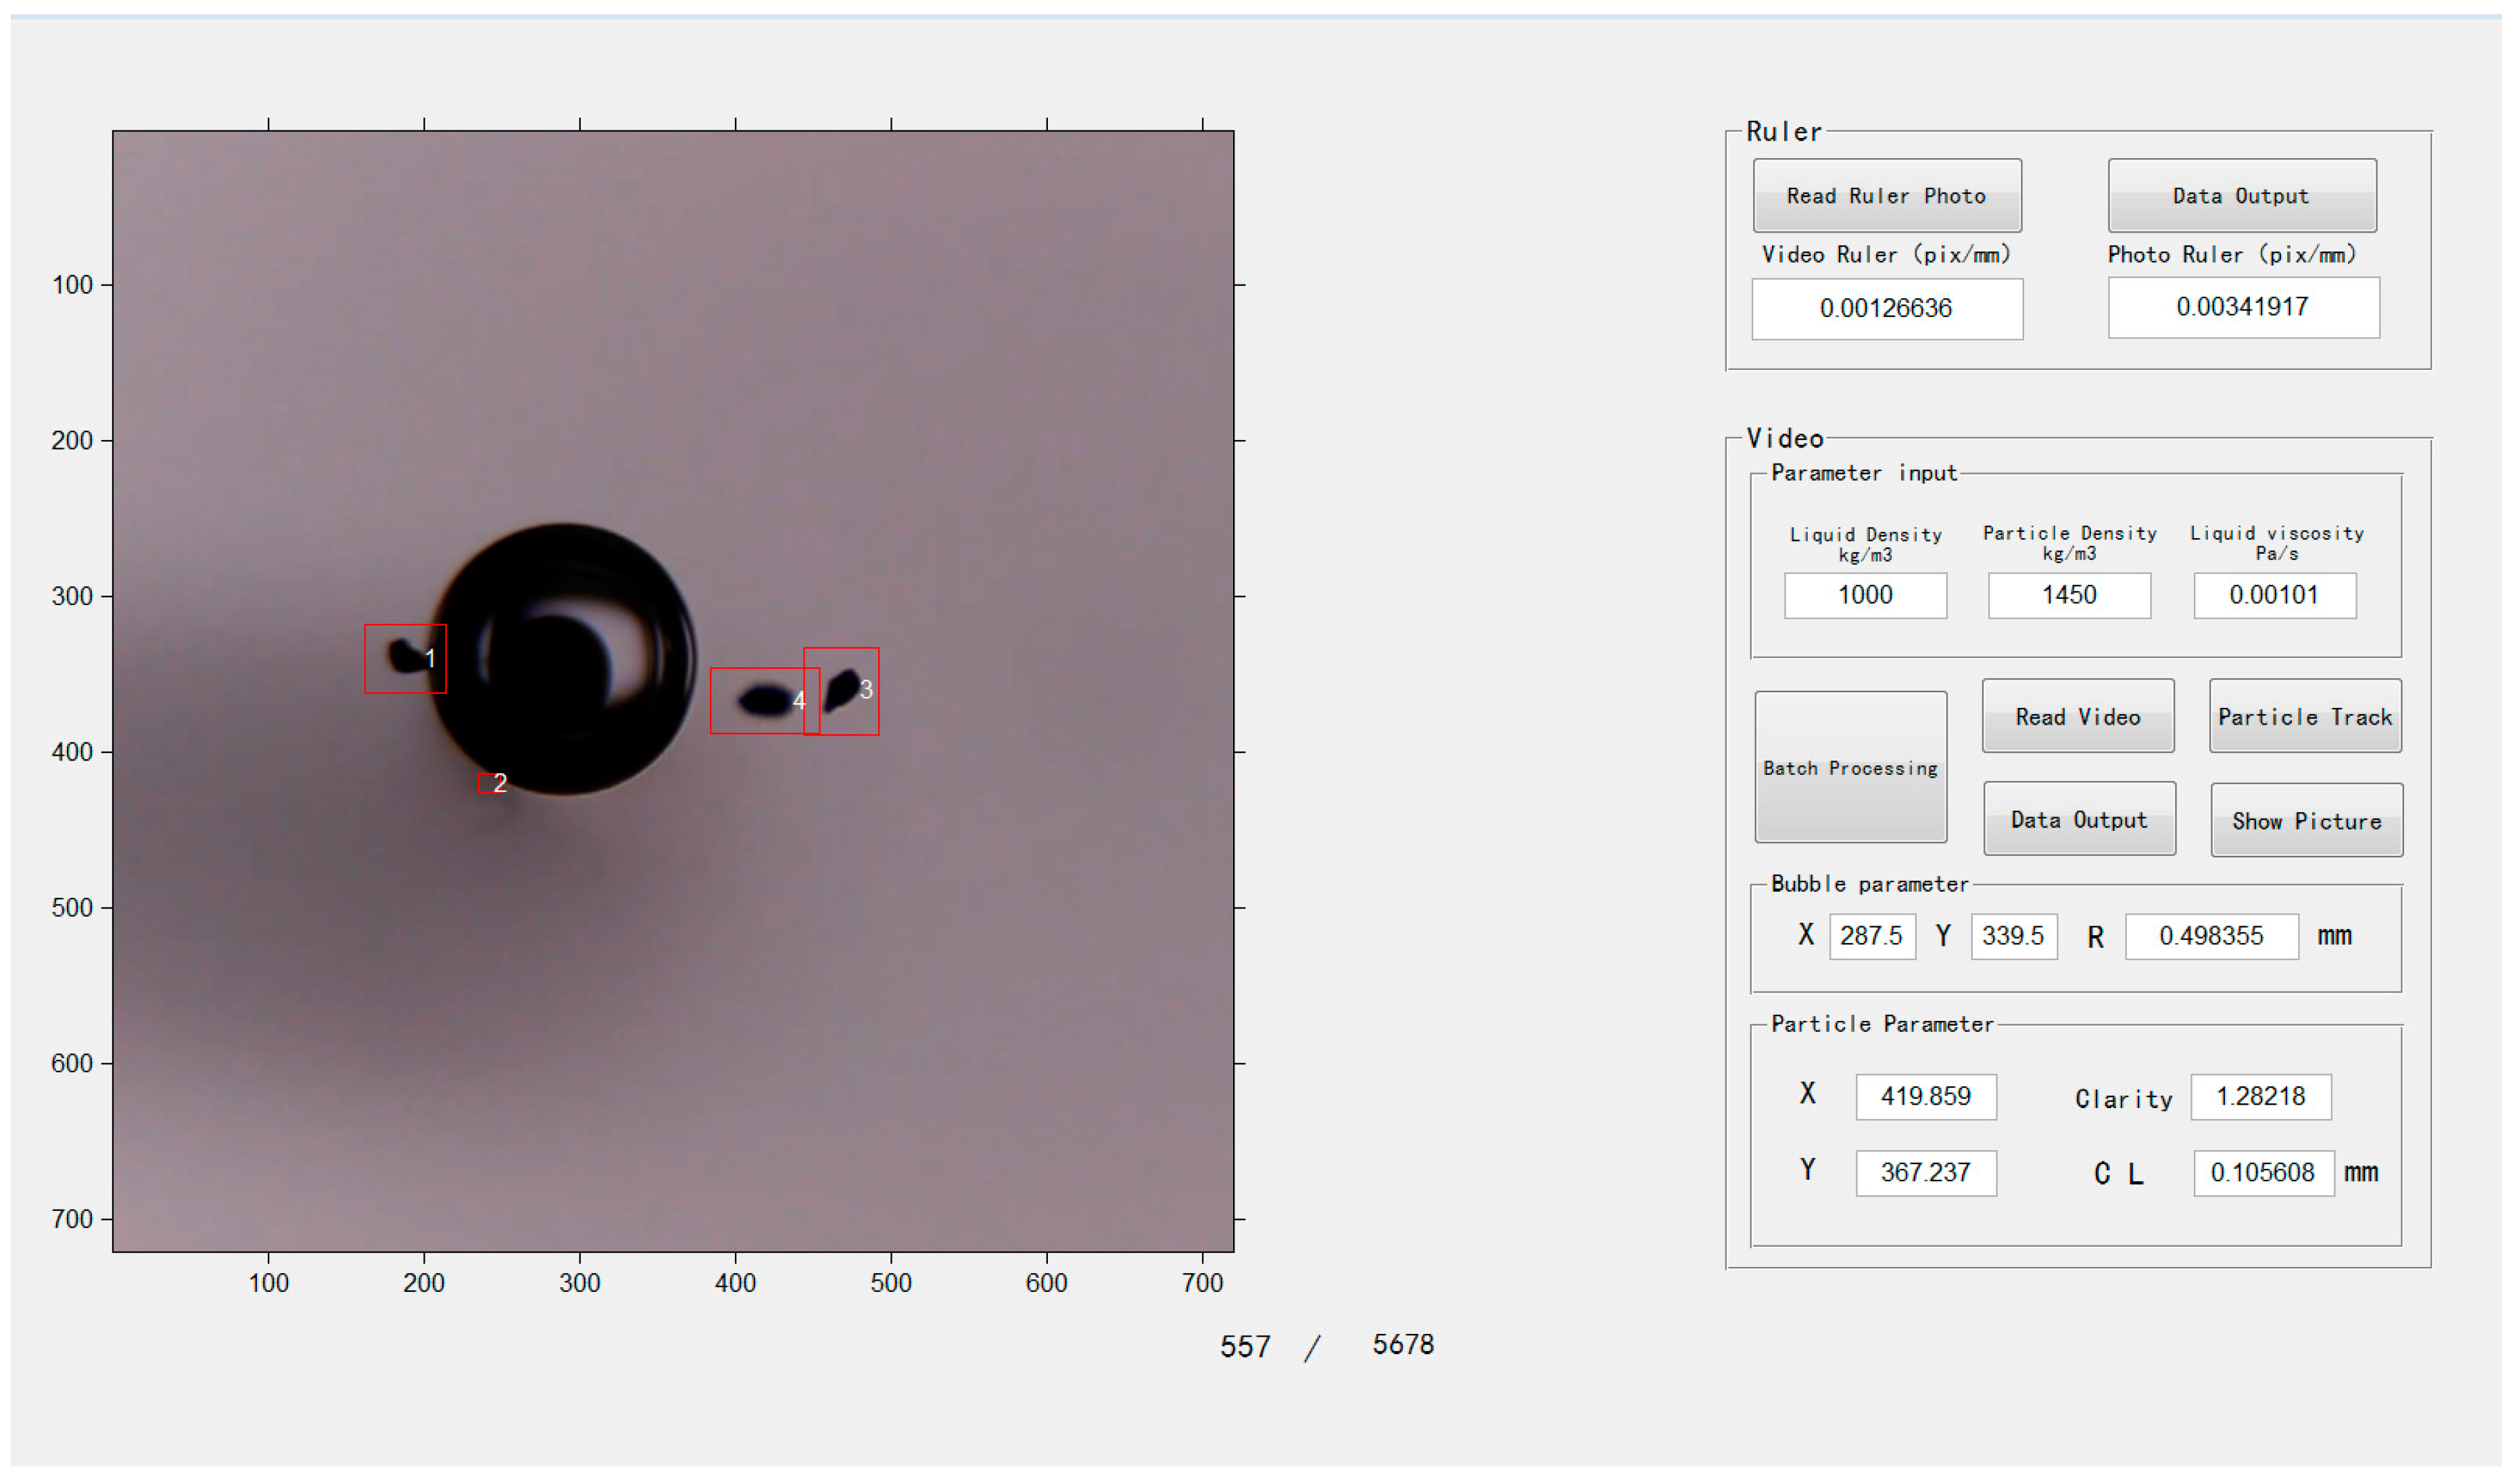
2.3. Video Processing Software.

The method of video processing is to combine artificial watching video and image processing software (Image-Pro-Plus 6.0) in the early stage. This method will consume a lot of manpower and cannot get enough parameters of particles. Besides, there are differences between different people’s results for the same video. To solve this problem, video processing software was programmed on the MATLAB platform to realize fully automated processing for the experimental video.
The software contains two modules. The first module is the ruler processing module, which is to get the actual distance corresponding to the pixels in the video by precisely moving the bubbles. The second module is the video processing module, which is to track all particles in the video. Then the parameters of particles and bubbles are analyzed. These parameters include the particles trajectories, the particles velocity, the collision point between particles and bubbles, the collision angle, the particles area, the particles circumference, the particles equivalent diameter and the particles clarity [20].

2.3.1. Principle of Software

The principle of video processing software is to extract each frame of the experimental video for processing. Each frame is processed by image interception and grayscale transformation. The grayscale image is transformed into a binary image by the OTSU algorithm. The OTSU algorithm is an efficient adaptive threshold algorithm. Although the gray-scale average algorithm is simple in calculation, the segmentation precision is lower for low-contrast images. The maximum entropy algorithm involves logarithmic operation and the operation speed is low. Because the object in this experiment is the experiment video which involves a large number of images and the computation is huge so it is not suitable for the maximum entropy algorithm. After the binarization process finished, the target area is processed by filling, denoising, and segmentation, and the locations of particles are obtained by background subtraction. Particle tracking was determined by comparing the shape, characteristic length, equivalent circle diameter, and position before and after the two frames to determine whether the particles in the two frames belonged to the same particle. In the process of video processing, the particle position is represented by centroid coordinates and the particle velocity is calculated by dividing the moving distance of the particles in the two frames by the time. The particle size is expressed in equivalent circle diameter, which is equal to the diameter of the projection area of the particle. Figure 3 shows a diagram of the software.

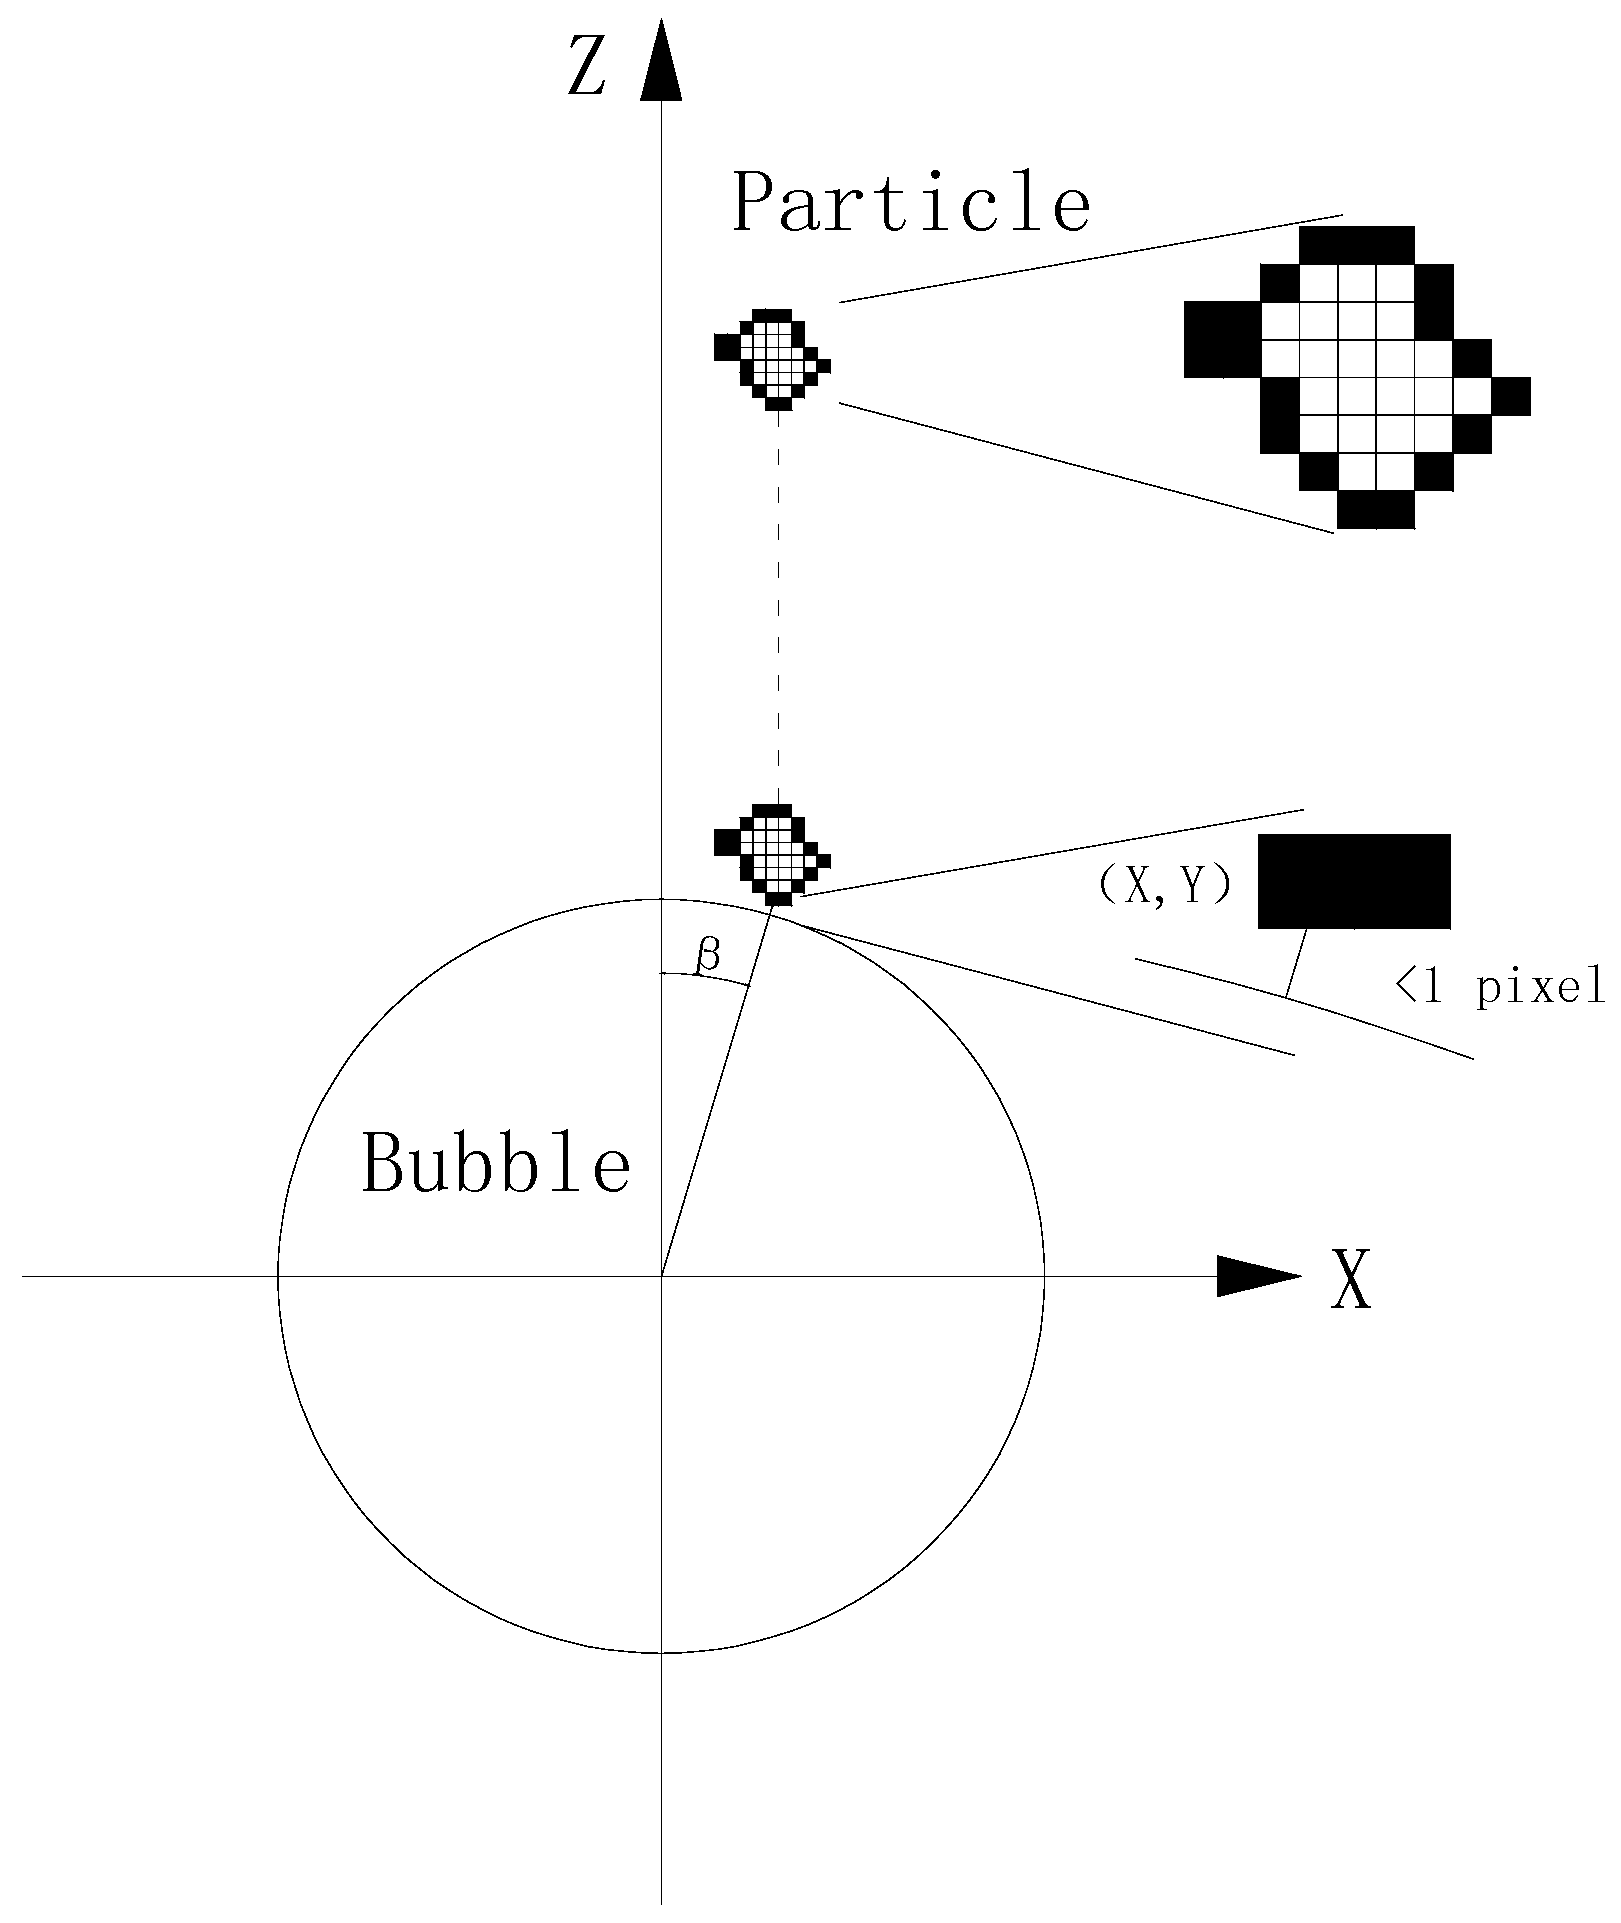
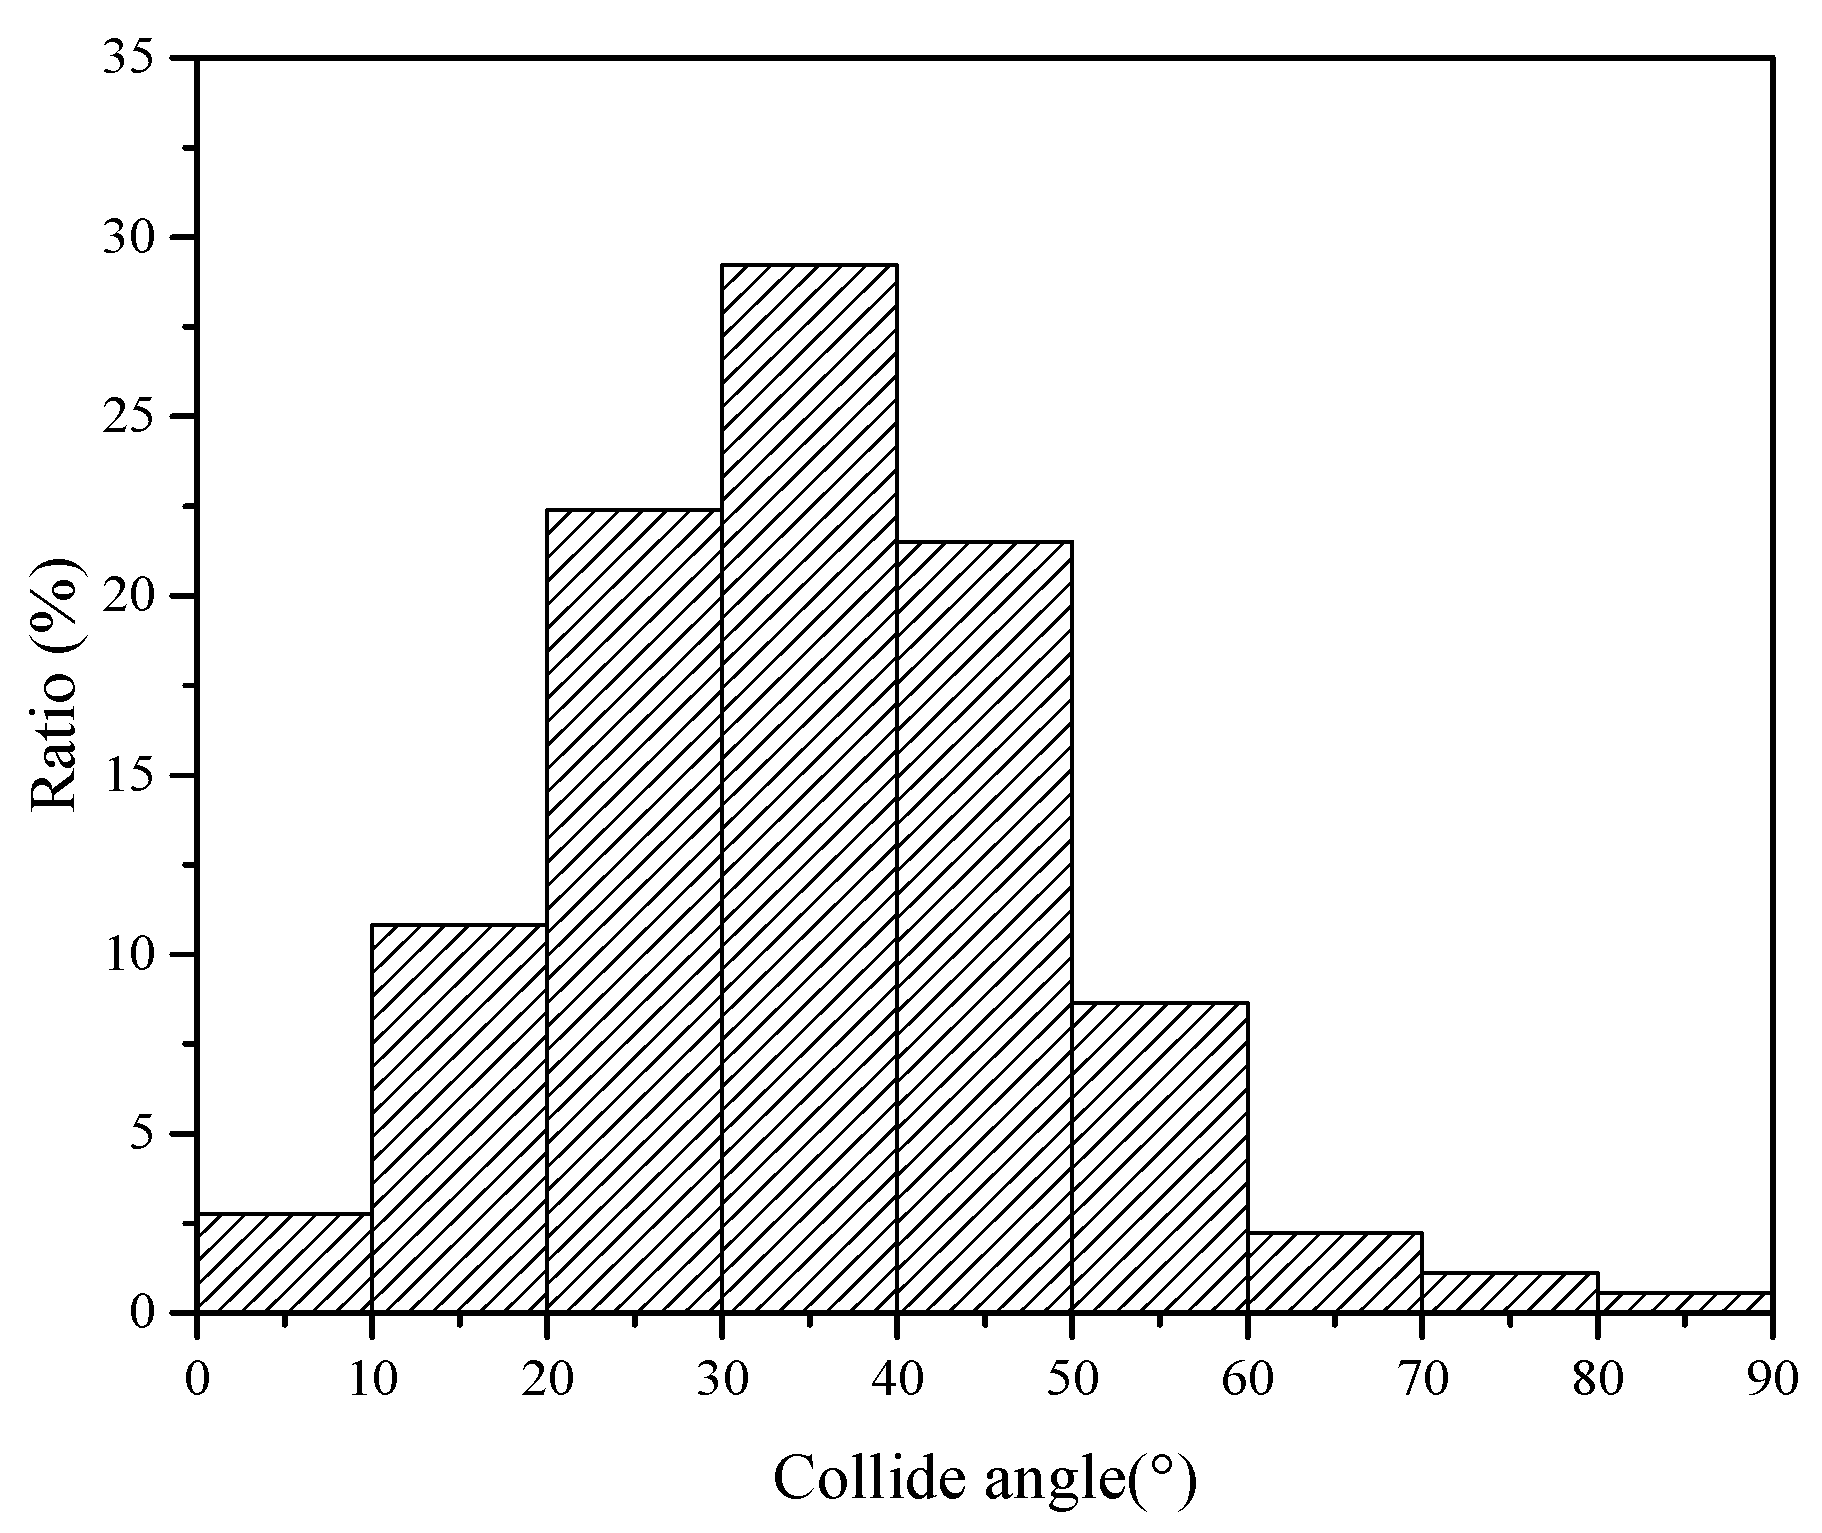
2.3.2. Collision Angle

The collision angle is the angle between the connection of the collision point to the bubble center and the vertical direction. Because the actual shape of coal particles is irregular, it is difficult to get the collision angle by using the particle centroid coordinate. To accurately represent the relative position of particle and bubble, the center of the bubble is defined as the coordinate origin, the horizontal direction is the x-axis, and the vertical direction is the z-axis.
A schematic of the collision angle solving method is shown in Figure 4. The first step is to find the edge pixel coordinates of particle and bubble to calculate the distance between the particle’s edge pixels (the solid point in Figure 4) to the bubble’s edge pixels and find the minimum value. Then the coordinates corresponding to the minimum distance values of the first time less than 1 pixel are obtained, which is the collision point. This method is verified by the velocity of the particle. When the particle collides with the bubble, the velocity will drop to the minimum. The angle between the centroid point of the particle velocity minimum to the central point of the bubble and the z-axis is compared with the collision angle. It was found that the difference between the two angles was ±3°.

2.4. Materials

The test coal samples were bituminous coal from Gongwusu ore district, which is located in the northwest edge of Ordos basin and belong to Zhuozishan coalfield. The coal-bearing stratum in Zhuozishan coalfields are mainly composed of delta facies, tidal-flat facies and meandering river facies. The main coal-bearing stratum in the coalfield are located in the Permo-Carboniferous Taiyuan formation and Shanxi formation. The coalfield contains 18 coal seams which are sequentially numbered No. 1–No. 18 from top to bottom. The main coal seam is No. 9 coal seam of Shanxi formation and No. 16 coal seam of Taiyuan formation and the coal-bearing sedimentary sequence from Gongwusu mine is shown in Figure 5 [21,22].
In this experiment, the coal sample was taken from No. 16 coal seam and the coal sample was pre-treated before the experiment. First, the coal samples were wet-screened to obtain samples of particle size 0.15–0.10 mm. Subsequently, float-and-sink tests were carried out to obtain coal samples with density of −1.3 g/cm3, 1.4–1.5 g/cm3, and +1.7 g/cm3. The air dry basis ash (Aad) of the 3 samples was 3.62%, 18.12%, and 42.96% and the static contact angles were 100.5°, 87.1°, and 65.6°, respectively.
The experimental liquid environment was deionized water with conductivity of 0.25 µs/cm. We added 600 mL deionized water to the water tank, ensuring that the liquid surface completely submerged the funnel inlet. In each test, 5 mg coal particles and 200 mL deionized water were mixed evenly with a magnetic stirrer. The video resolution was 1280 × 720, the ISO was 100, the FPS was 50, the value of the aperture was 5.6, the shutter speed was 1/500, and the test environment temperature was 25 ± 1 °C.

3. Results and Discussion

3.1. Collision Angle versus Initial Settlement Position

Due to the influence of water flow disturbance, fine particles coming out from the funnel outlet will have a radial oscillation. To ensure the verticality of particle trajectory, the initial settlement position was set at 2 mm from the origin of the coordinates.
During the statistical process, it was found that the particle number distributions in different collision angle ranges were quite different. Taking the coal samples with density 1.4–1.5 g/cm3 as an example, Figure 6 shows the ratio of number of particles in each collision angle to total number of particles.
As shown in Figure 6, the number of particles in the middle collision angle range had more than two sides. At a collision angle of 20–50°, the number of particles accounted for 73.10% of the total particles. When the collision angle was less than 10° or greater than 60°, the number of particles was very small; when the collision angle was greater than 60°, the ratio was only 3.88%.
Particle flow around the bubble in the process of approaching was analyzed, resulting in the trajectory of particles deviating from the z-axis. If the initial settlement position was far from the z-axis, it was difficult for particles to collide with the bubble due to the influence of the flow around the bubble, resulting in a smaller number of particles at a collision angle greater than 60°.
To study the relationship between the initial settlement position and the collision angle, first, the distance between the initial settlement position and the z-axis of the particles in the range of the collision angles was calculated with an interval of 10°. Then the particle ratio in each interval was calculated with an interval of 0.05 mm.
Figure 7 shows the distribution of the initial settlement position corresponding to each collision angle. To visually reflect the ratio of particles in the initial settlement position, a change in color is used to indicate a change in the ratio of particle numbers. When the collision angle was greater than 60°, there were few particles that could collide with bubbles, and they had no statistical meaning.
It can be seen from Figure 7 that the initial settlement position of the particles shows two change rules as collision angle increased. First, the initial settlement position range continued to expand outward. Second, the central distribution interval of the particles in the initial settlement position also expanded outward.
When the collision angle increased from 0–10° to 20–30°, the initial settlement position extended from 0.15 mm to 0.30 mm from the z-axis. When the collision angle increased to 30–40°, a hollow interval appeared. That means that no particle collided with the bubble in the interval near the z-axis. As the collision angle increased, the area of the hollow interval expanded continuously. When the collision angle increased to 50–60°, the interval between 0–0.20 mm was hollow. At collision angles of 0–20°, the particle central distribution interval was 0–0.10 mm, and the ratio of particles in this interval was over 70%. With the increase of collision angle, the central distribution interval of particles expanded outward. When the collision angle increased to 20–30° and 30–40°, the main distribution intervals of particles were 0.05–0.25 mm and 0.10–0.30 mm, respectively. The ratio of particles in these two intervals was 79.95% and 70.78%. When the collision angle increased to 40–50°, the particles were mainly distributed in the interval of 0.20–0.40 mm. The ratio of particles in the interval reached 78.07%.

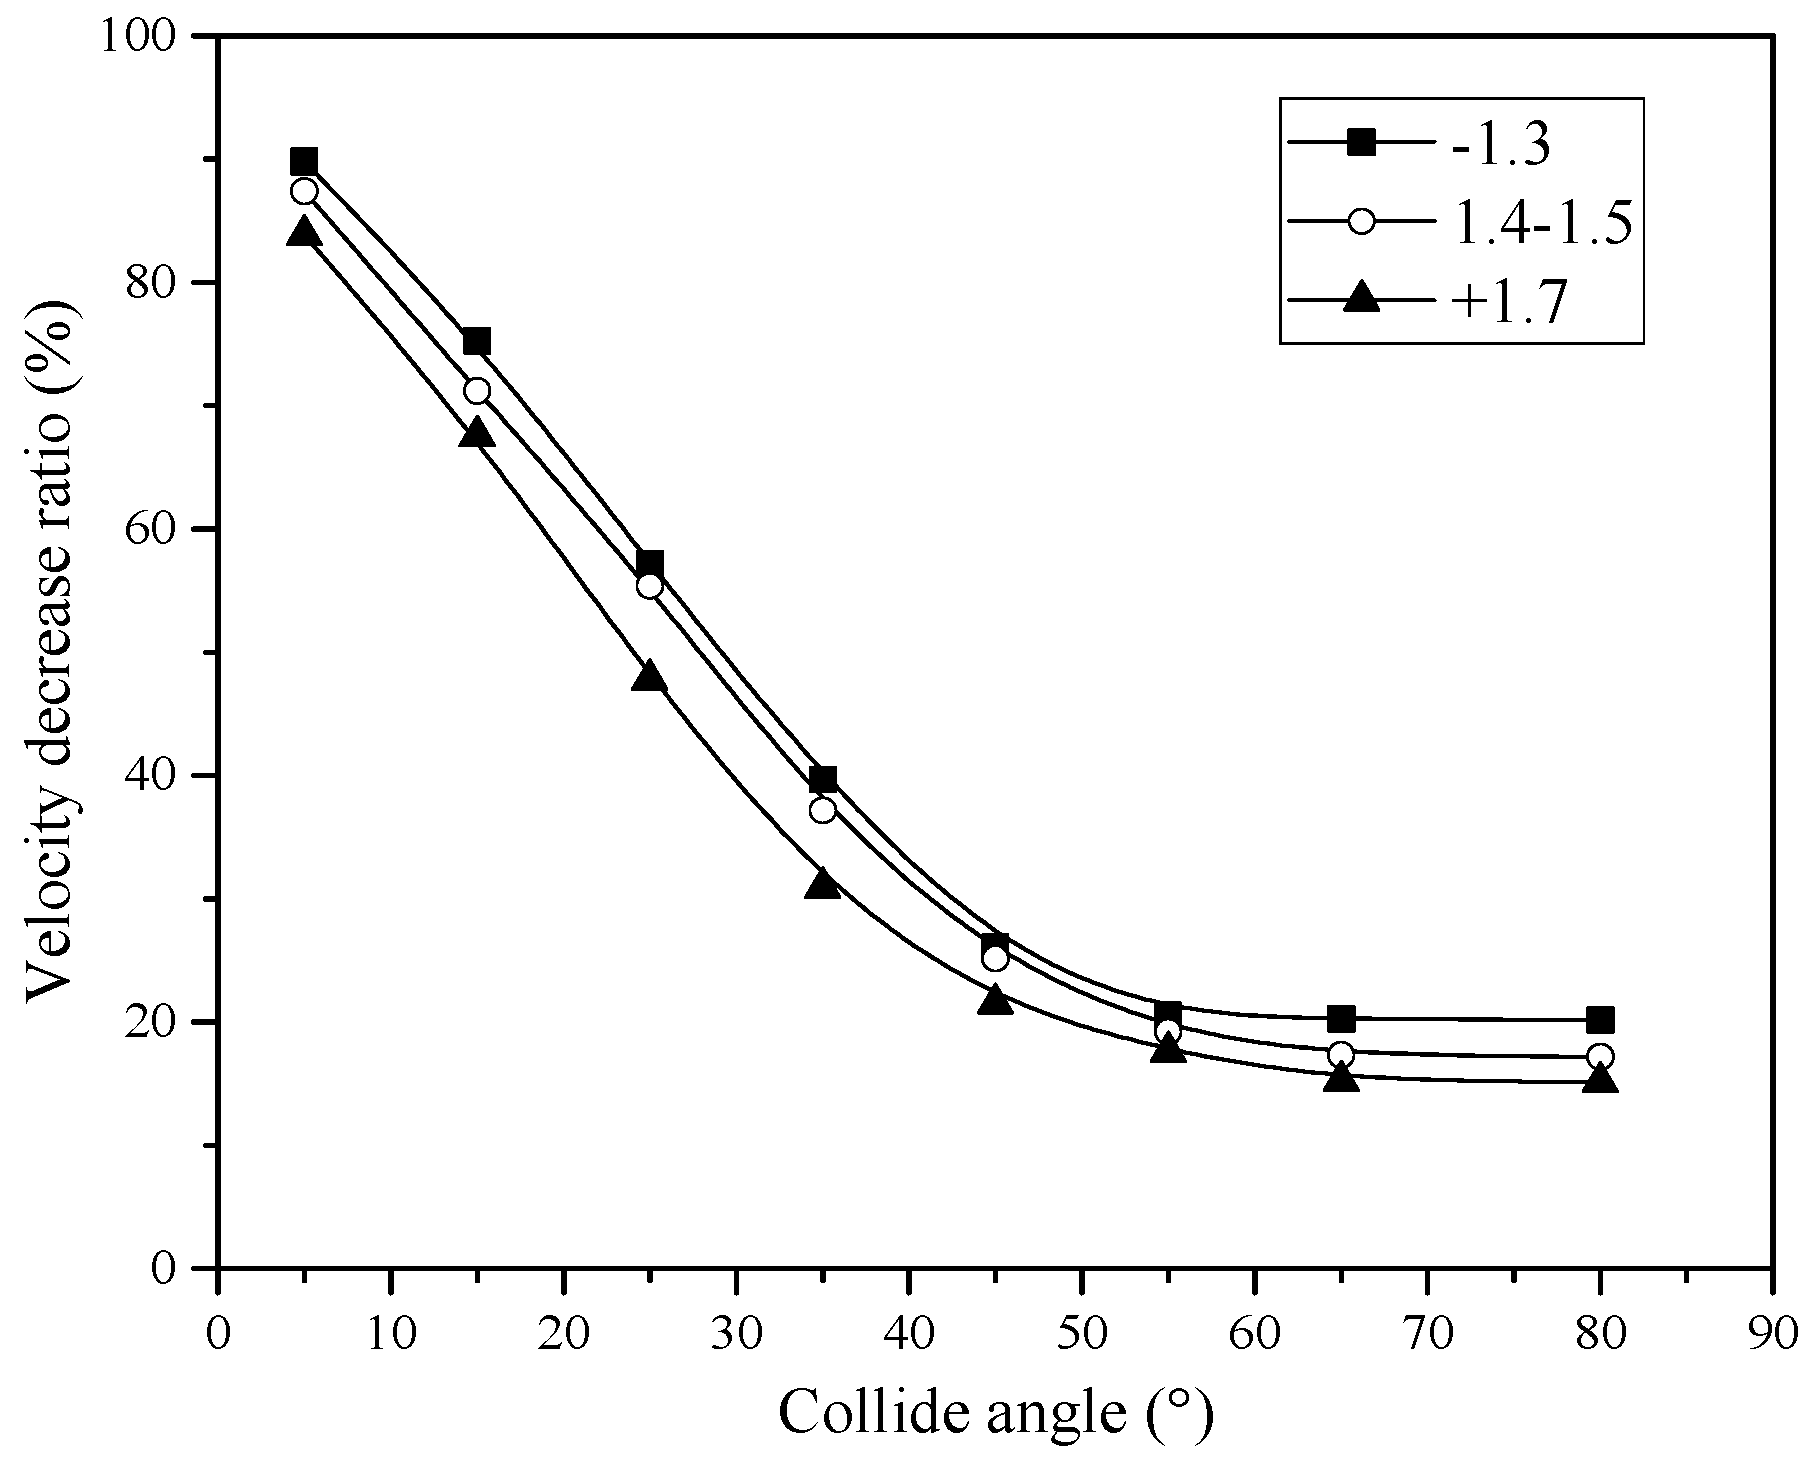
3.2. Collision Angle versus Particle Velocity

During the sedimentation process, the velocity of particles is affected by the relative position of particles and bubbles. Figure 8 shows the actual trajectory of six particles; the density of these particles was between 1.4 and 1.5 g/cm3, and these particles were obtained by float-and-sink experiment. The collision angles were 5.86°, 15.03°, 21.33°, 36.99°, 41.95°, and 50.91°, in ascending order.
Figure 9 shows a diagram of particle velocity corresponding to the particles in Figure 8. The particle velocity was very stable when the particle was far from the bubble, and the velocity was the terminal velocity. When the distance between particles and bubbles decreased to a certain distance, the velocity of particles decreased sharply and achieved the minimum at the collision point.
As the particles began to slide on the surface of the bubble, the particle velocity gradually increased. When the particles slid to the equator of the bubble, the particle velocity increased to the maximum. At this time, the particle velocity was similar to the terminal velocity. As the particles crossed the bubble equator, the particle velocity began to decrease, eventually reducing to 0, and finally the particle adhered to the bottom of the bubble.
As shown in Figure 9, the particle velocity began to decrease before collision, and this process is related to the collision angle. The idea of resistance layer was introduced when exploring the effect of bubbles on particle velocity. Once the particle enters the resistance layer, the velocity decreases until it collides with the bubble. To quantify the range of resistance layer, the position where the particle velocity decreases by 10% is defined as the boundary of the resistance layer. Figure 10 shows the resistance layer boundary of the three coal samples. Figure 11 shows the distance from the resistance layer boundary to the bubble center at different collision angles.
It is known from Figure 11 that the thickness of the resistance layer around the bubble is not constant, but is related to the collision angle and the properties of particles. The thickness of the resistance layer gradually thins as the collision angle increases. When the collision angle increases to 50–60°, the thickness of the resistance layer is reduced to 0.24 mm. As the particle density increases, the thickness of the resistance layer is compressed. When the particle density increases from −1.3 g/cm3 to +1.7 g/cm3, the resistance layer thickness of the three coal samples is 0.39 mm, 0.36 mm, and 0.29 mm at a collision angle of 0–20°, and the resistance layer thickness of low-density particles at each collision angle is larger than that of high-density particles.
In addition, when the particle collides with the bubble at different collision angles, the particle velocity changes with the collision angle. The terminal velocity of the six particles in Figure 8 is around 3 ± 0.5 mm/s. The particle velocity at the collision point increases with the increase of collision angle. Figure 12 shows the relationship between particle velocity at the collision point and collision angle. The relationship between the decreased ratio of particle velocity at the collision point and the collision angle is shown in Figure 13.
When the collision angle is less than 50°, the particle velocity at the collision point increases approximately linearly with the increase of collision angle. When the collision angle is greater than 50°, the particle velocity at the collision point tends to be stable and the decreased particle velocity ratio accounts for about 20% of the terminal velocity. The reduction of particle velocity at the collision point is related to the particle density, and the velocity reduction of low-density particles is larger than that of high-density particles, but the difference is not obvious. When the collision angle is 0–10°, the decreased velocity ratio of three coal samples is 89.78%, 87.39%, and 83.84%, respectively. When the collision angle increases to 50–60°, the decreased velocity ratio is 20.54%, 19.20%, and 17.20%.

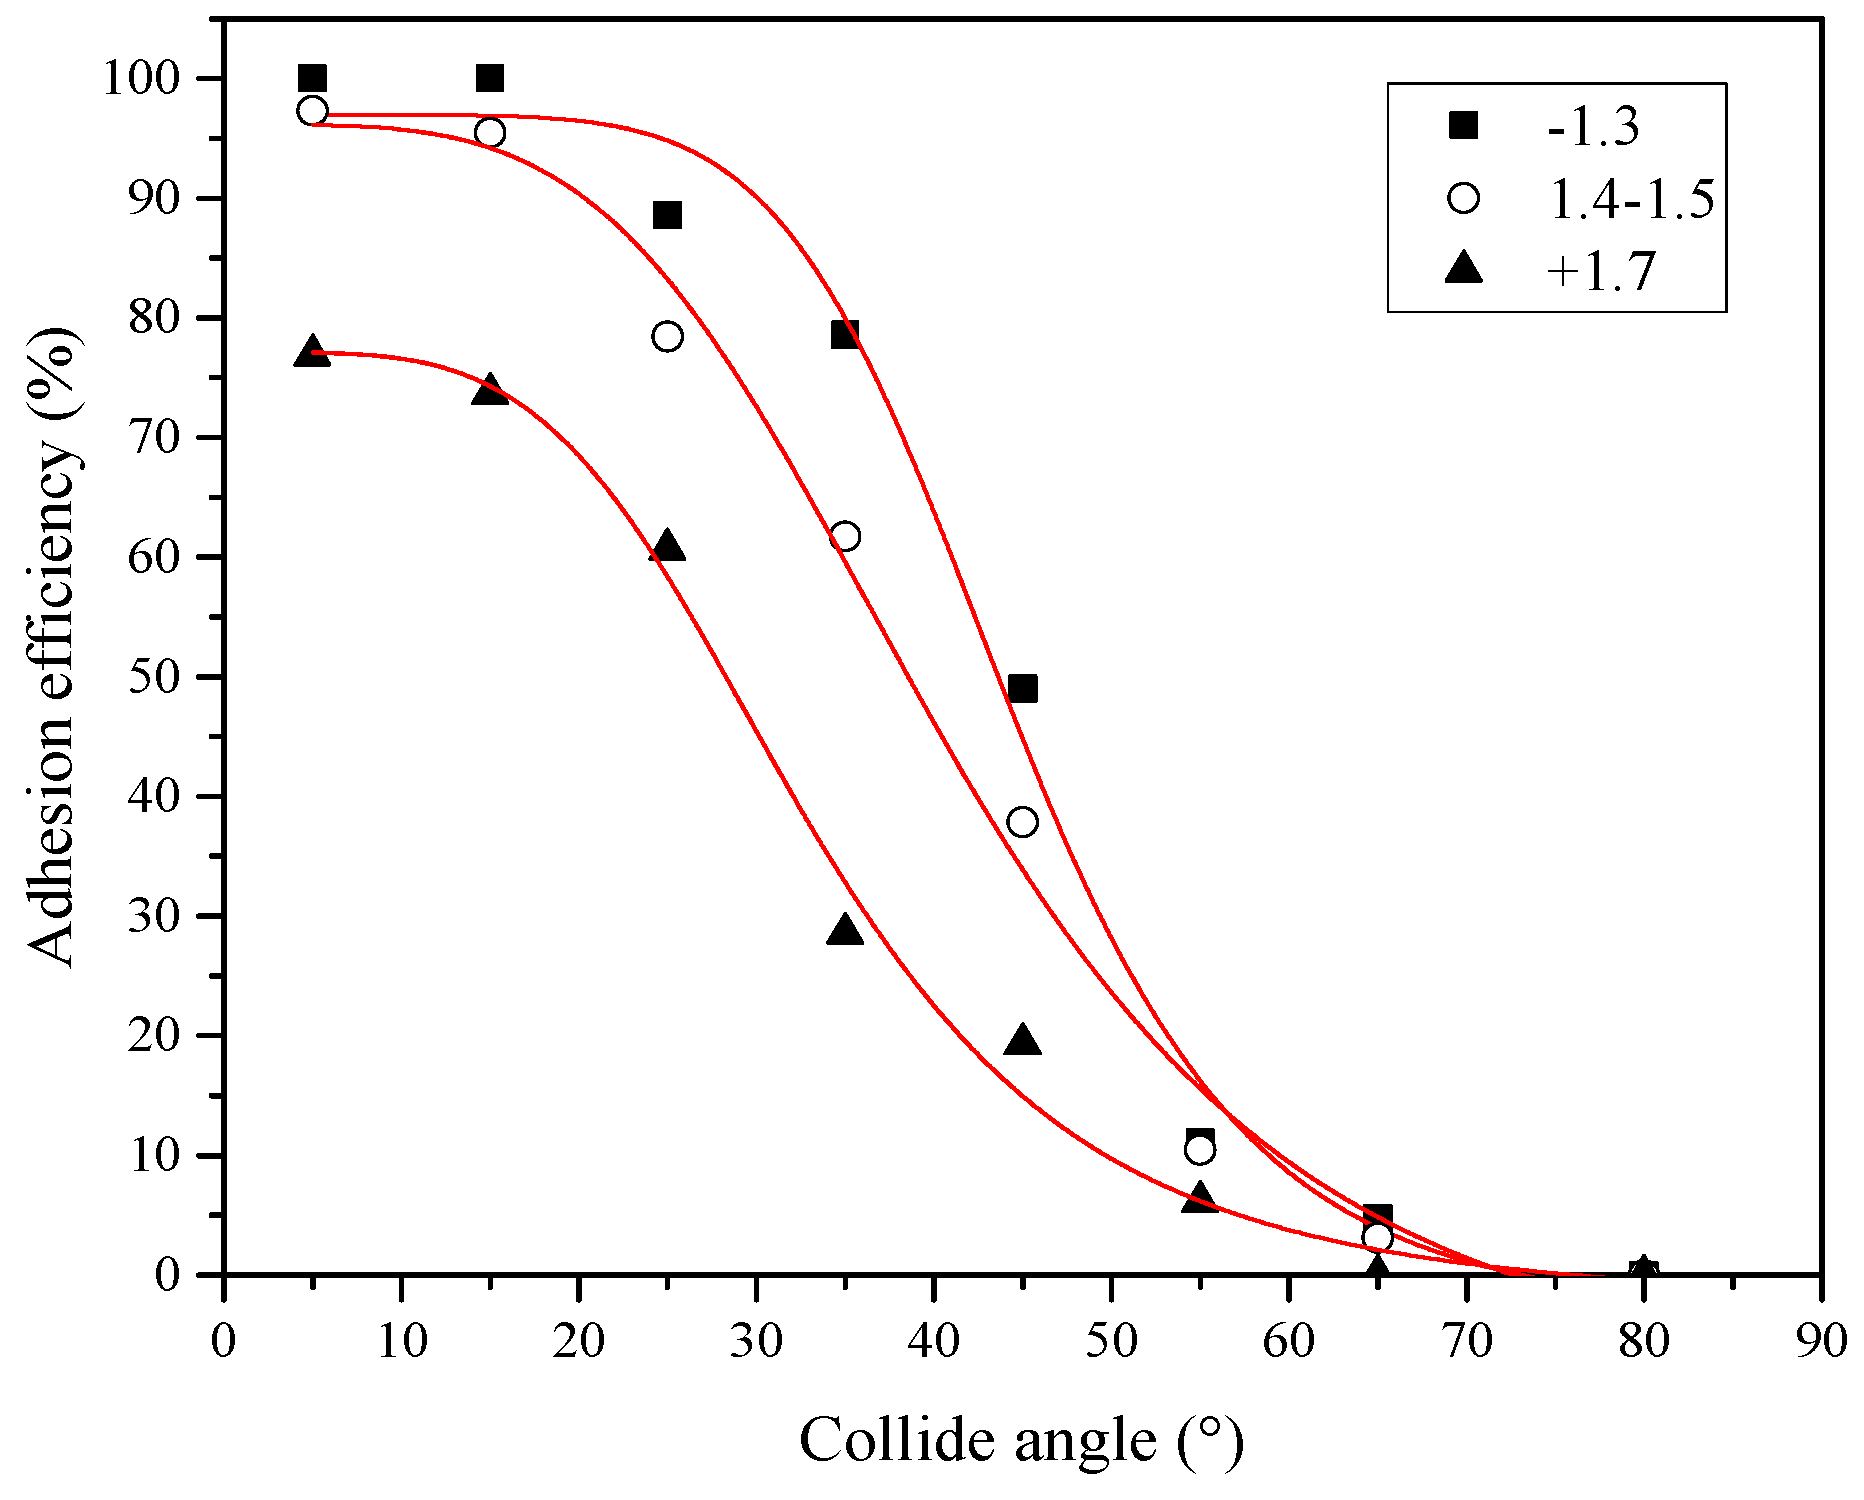
3.3. Collision Angle versus Adhesion Efficiency

The particle will slide along the surface of the bubble after colliding with the bubble. If the particle–bubble interaction force can puncture the thin liquid film during the sliding period, a three-phase contact will be formed, and the particle will adhere to the bubble. Conversely, the particle will slide from the surface of the bubble.
Adhesion efficiency is the ratio of the number of particles adhering to the bubble at a certain position to the total number of particles at that position. The adhesion efficiency of the three coal samples was fitted by logistic model, and the adjusted R-square is above 0.95. This means that the fitting equation can reflect the change of adhesion efficiency with the collision angle (Figure 14). Taking the 1.4–1.5 g/cm3 coal samples as an example to analyze, when the collision angle is less than 20°, the adhesion efficiency is over 90%; as the collision angle increases, the adhesion efficiency decreases rapidly. When the collision angle increases to 40–50°, the adhesion efficiency drops to 37.82%. At this collision angle, it is hard for the particle to adhere to the bubble. When the collision angle is greater than 60°, the adhesion efficiency is almost 0.
Analysis shows that the differences of the particles in the same coal sample are not huge. According to the experimental results of Section 3.2, if the particle collides with the bubble at a small collision angle, the particle velocity at the collision point is very small, which means there is a big loss of the particle’s kinetic energy. This kinetic energy is used to drain the thin liquid film. As the collision angle increases, the particle velocity at the collision point increases gradually, which means the particle’s ability to puncture the thin liquid film decreases, so the adhesion efficiency decreases with the increase of collision angle. The adhesion efficiency of the three coal samples decreases with the increase of coal sample density under the same collision angle.
To quantify adhesion efficiency, the area enclosed by the adhesion efficiency curve is calculated by the Gauss–Legendre numerical integration method, which is used to indicate the level of the coal sample’s adhesion efficiency. This value is defined as the static water adhesion angle. The static water adhesion angles of the three coal samples were 38.35°, 33.62°, and 22.70°. This means that the static water adhesion angle decreases with the increase of coal sample density.
Analysis shows that adhesion behavior is affected by the hydrophobicity of the particle. Nguyen used AFM (Atomic Force Microscope, Veeco, Santa Barbara, CA, USA) to determine the interaction force between hydrophobic glass beads and bubbles, and found that there was a strong attraction force between them. This force will break the thin liquid film and make the glass beads adhere to the bubbles, but the interaction force between hydrophilic glass beads and bubbles is expressed as repulsion [23]. Xie [24] confirmed the results by measuring the interaction force between sphalerite and bubbles.
The static contact angles of the three coal samples were 100.5°, 87.1°, and 65.6°. This means that the hydrophobicity of particles decreased with the increase of particle density. As the particle density increases, the proportion of hydrophilic part in the coal increases. The probability of contacting the bubble increases, thereby causing the adhesion efficiency of the coal sample to decrease.

4. Conclusions

The study of the relative motion between particles and bubbles is very important for the understanding of flotation mechanism. A device was used to study the collision and attachment processes between particles and bubbles. A large number of coal particles were tracked and the relationship between the collision angle and the particle initial settling position, the particle velocity and the adhesion efficiency was studied.
1. The number of particles in different collision angles varies greatly. The particles are mainly distributed in the range of 20–50°. With the increase of collision angle, both the initial settlement range and the central distribution interval of the particles expand outward gradually.
2. Particle velocity is affected by the distance between the particles and the bubbles. After the particles enter the resistance layer, the velocity decreases immediately. The thickness of the resistance layer keeps constant and then slowly thins as the collision angle increases. The thickness of the resistance layer of low-density particles is larger than that of high-density particles at all positions. With the increase of collision angle, the particle velocity at the collision point decreases. The proportion is reduced.
3. Adhesion efficiency decreases with the increase of collision angle, and the adhesion efficiency of low-density particles is higher than that of high-density particles.

Author Contributions

All authors contributed equally to this study. Q.Z., W.L., and H.X. conceived of and designed the study. Q.Z. developed the experimental apparatus. Q.Z. and W.L. developed the software. Q.Z., H.Z., and P.X. performed the experiments. Q.Z., W.L., and H.X. wrote and modified the paper.

Funding

This research was funded by the National Natural Science Foundation of China (NO. 51604280).

Conflicts of Interest

The authors declare no conflict of interest.

References

  1. Mouat, J. The development of the flotation process: Technological change and the genesis of modern mining, 1898–1911. Aust. Econ. Hist. Rev. 1996, 36, 3–31. [Google Scholar] [CrossRef]
  2. Ejtemaei, M.; Gharabaghi, M.; Irannajad, M. A review of zinc oxide mineral beneficiation using flotation method. Adv. Colloid Interface Sci. 2014, 206, 68–78. [Google Scholar] [CrossRef] [PubMed]
  3. Aghazadeh, S.; Mousavinezhad, S.K.; Gharabaghi, M. Chemical and colloidal aspects of collector less flotation behavior of sulfide and non-sulfide minerals. Adv. Colloid Interface Sci. 2015, 225, 203–217. [Google Scholar] [CrossRef] [PubMed]
  4. Dai, Z.; Fornasiero, D.; Ralston, J. Particle-bubble collision models—A review. Adv. Colloid Interface Sci. 2000, 85, 231–256. [Google Scholar] [CrossRef]
  5. Mao, M.; Zhang, J.; Yoon, R.H. Is There a Thin Film of Air at the Interface between Water and Smooth Hydrophobic Solids? Langmuir 2004, 20, 1843–1849. [Google Scholar] [CrossRef]
  6. Albijanic, B.; Ozdemir, O.; Nguyen, A.V. A review of induction and attachment times of wetting thin films between air bubbles and particles and its relevance in the separation of particles by flotation. Adv. Colloid Interface Sci. 2010, 159, 1–21. [Google Scholar] [CrossRef] [PubMed]
  7. Verrelli, D.I.; Koh, P.T.L.; Nguyen, A.V. Particle–bubble interaction and attachment in flotation. Chem. Eng. Sci. 2011, 66, 5910–5921. [Google Scholar] [CrossRef]
  8. Wang, W.; Zhou, Z.; Nandakumar, K. Attachment of individual particles to a stationary air bubble in model systems. Int. J. Miner. Process. 2003, 68, 47–69. [Google Scholar] [CrossRef]
  9. Xing, Y.; Gui, X.; Pan, L. Recent experimental advances for understanding bubble-particle attachment in flotation. Adv. Colloid Interface Sci. 2017, 246, 105–132. [Google Scholar] [CrossRef] [PubMed]
  10. Chi, M.P.; Nguyen, A.V.; Miller, J.D. Investigations of bubble–particle interactions. Int. J. Miner. Process. 2003, 72, 239–254. [Google Scholar]
  11. Verrelli, D.I.; Koh, P.T.L.; Bruckard, W.J. Variations in the induction period for particle–bubble attachment. Miner. Eng. 2012, 36–38, 219–230. [Google Scholar] [CrossRef]
  12. Wang, W.; Zhou, Z.; Nandakumar, K. Effect of surface mobility on the particle sliding along a bubble or a solid sphere. J. Colloid Interface Sci. 2003, 259, 81–88. [Google Scholar] [CrossRef]
  13. Nguyen, A.V.; Evans, G.M. Movement of fine particles on an air bubble surface studied using high-speed video microscopy. J. Colloid Interface Sci. 2004, 273, 271–277. [Google Scholar] [CrossRef] [PubMed]
  14. Verrelli, D.I.; Bruckard, W.J.; Koh, P.T.L. Particle shape effects in flotation. Part 1: Microscale experimental observations. Miner. Eng. 2014, 58, 80–89. [Google Scholar] [CrossRef]
  15. Hassas, B.V.; Caliskan, H.; Guven, O. Effect of roughness and shape factor on flotation characteristics of glass beads. Colloids Surf. A Physicochem. Eng. Asp. 2016, 492, 88–99. [Google Scholar] [CrossRef]
  16. Lecrivain, G.; Petrucci, G.; Rudolph, M. Attachment of solid elongated particles on the surface of a stationary gas bubble. Int. J. Multiphase Flow 2015, 71, 83–93. [Google Scholar] [CrossRef] [Green Version]
  17. Yoni, I.; Simon, E. Impact of grain size and rock composition on simulated rock weathering. Earth Surf. Dyn. 2018, 6, 319–327. [Google Scholar] [CrossRef]
  18. Nezhad, M.M.; Fisher, Q.J.; Gironacci, E.; Rezania, M. Experimental study and numerical modeling of fracture propagation in shale rocks during brazilian disk test. Rock Mech. Rock Eng. 2018, 51, 1755–1775. [Google Scholar] [CrossRef]
  19. Jun, P.; Louis, N.Y.W.; Cee, I. T. Influence of grain size heterogeneity on strength and microcracking behavior of crystalline rocks. J. Geophys. Res. 2017, 122, 1054–1073. [Google Scholar] [CrossRef]
  20. Zhuo, Q.; Liu, W.; Liu, W.; Kai, P. Experimental study on the attachment behavior of coal particles and bubbles. J. China Coal Soc. 2018, 43, 2029–2035. [Google Scholar] [CrossRef]
  21. Kang, J. Distribution of Elements and Enrichment Mechanism of Mineral Matter in the Wuhai C-P Coals; China University of Mining & Technology: Beijing, China, 2015; pp. 17–23. [Google Scholar]
  22. Shifeng, D.; Deyi, R.; Yuegang, T.; Longyi, S. Distribution, isotopic variation and origin of sulfur in coals in the Wuda coalfield, Inner Mongolia, China. Int. J. Coal Geol. 2002, 51, 237–250. [Google Scholar] [CrossRef]
  23. Nguyen, A.V.; Evans, G.M.; Nalaskowski, J. Hydrodynamic interaction between an air bubble and a particle: Atomic force microscopy measurements. Exp. Therm. Fluid Sci. 2004, 28, 387–394. [Google Scholar] [CrossRef]
  24. Xie, L.; Shi, C.; Wang, J. Probing the interaction between air bubble and sphalerite mineral surface using atomic force microscope. Langmuir 2015, 31, 24–38. [Google Scholar] [CrossRef] [PubMed]
Figure 1. Three-dimensional (3D) diagram of experimental apparatus: 1: funnel micromoving device; 2: light-emitting diode (LED) array light source; 3: feeding funnel; 4: water tank; 5: bubble micromoving device; 6: camera; 7: bubble-generating device.
Processes 06 00218 g001
Figure 2. Diagram of relative position between feeding funnel and bubble.
Processes 06 00218 g002
Figure 3. Diagram of software.
Processes 06 00218 g003
Figure 4. Schematic of collision angle solving method.
Processes 06 00218 g004
Figure 5. The coal-bearing sedimentary sequence from Gongwusu mine.
Processes 06 00218 g005
Figure 6. Ratio of particles in each collision angle.
Processes 06 00218 g006
Figure 7. Distribution of initial settlement position of each collision angle.
Processes 06 00218 g007
Figure 8. Trajectory of coal particles.
Processes 06 00218 g008
Figure 9. Diagram of particle velocity.
Processes 06 00218 g009
Figure 10. Boundary of coal sample resistance layer.
Processes 06 00218 g010
Figure 11. Boundary of coal sample resistance layer to center of bubble.
Processes 06 00218 g011
Figure 12. Particle velocity at collision point.
Processes 06 00218 g012
Figure 13. Reduction ratio of particle velocity at collision point.
Processes 06 00218 g013
Figure 14. Adhesion efficiency of coal samples.
Processes 06 00218 g014

