Modeling the Circular Economy Processes at the EU Level Using an Evaluation Algorithm Based on Shannon Entropy


Faculty of Management, The Bucharest University of Economic Studies, 6 Piata Romana, 1st District, 010374 Bucharest, Romania
*
Author to whom correspondence should be addressed.
Processes 2018, 6(11), 225; https://doi.org/10.3390/pr6110225
Submission received: 23 October 2018
/
Revised: 6 November 2018
/
Accepted: 13 November 2018
/
Published: 16 November 2018
(This article belongs to the Special Issue Energy, Economic and Environment for Industrial Production Processes)
Abstract
:In this paper we propose a methodology to study circular economy processes based on mathematical modelling. In open-ended systems, waste could be converted back to recycling, transforming the economy from linear to circular. The concept of entropy and the second law of thermodynamics give the argument for a scale reduction of material circulation. As humans extract more and more energy and matter for the economy, the degree of entropy is likely to increase. Based on the findings of economic studies on the implications of industrialization in the case of growing economies, this study aims at evaluating circular economy processes at the European Union (EU) level using a Shannon-Entropy-based algorithm. An entropy-based analysis was conducted for the 28 European Union countries during the time frame 2007–2016. The modelling process consists of constructing a composite indicator which is composed of a weighted sum of all indicators developed by an algorithm based on Shannon Entropy. The weights assigned to each indicator in our analysis measure the significance of each indicator involved in the development of the composite indicator. The results are similar to the international rakings, consolidating and confirming the accuracy and reliability of this approach.
1. Introduction
The use of limited-space resources generates multiple concerns for governments as well as for academics in terms of finding the optimal solution to respond to the challenges of climate change or of the growing demand in consumerist economies. Ratifying the Kyoto Protocol and enforcing it in as many countries as possible creates the premise for combating pollution from industrial processes.
Turning linear economies, based on the production–consumption–waste model, into circular economies, regenerative by definition and based on production–consumption–reuse of resources, seems to be the puzzle piece missing from the current structure of the consumption pattern [1,2,3,4,5]. Investing in innovative equipment for environmental protection plays an essential role in circular economy.
Beyond the evolution of the classical model of economic growth [6], Andersen conceptualized an economic growth model to determine the main impact factors, then capitalized on empirical data in an attempt to determine the economic factors that stimulate or inhibit the transition to a circular pattern.
The economic literature of the last ten years abounds in econometric presentations to determine the impact of waste management processes on economic activities in the context of the general equilibrium model [7,8,9,10].
By way of example, in Sweden, Ljunggren Söderman et al. [11] analyzed the interconnection of solid waste program management in the context of a general equilibrium model in order to find the right answer to the request of the Swedish Parliament for a percent reduction in the amount of waste in relation to the growth indicator [12]. It should be mentioned here that Sweden is among those countries with a high degree of waste reuse, being top-ranking among the Member States of the European Union.
The economists Xie and Saltzman [13] studied the influence on Gross Domestic Product (GDP) of dangerous waste fees for waste resulting from mining activities in South Africa. It should be noted that the two continents Africa and Asia are ranked last in terms of their waste reuse rate, while North America and Europe are at the top of the ranking and amongst the most highly industrialized countries.
The impact of environmental policy on growth prospects has been studied by international organizations such as The Statistical Office of the European Union (OECD) [14] and by European institutions, for example, the European Commission (EC) [15]. Strongly industrialized, developed agriculture states are inevitably facing environmental challenges. Keeping the ecosystem is or should be a policy priority, worldwide. The United Nations Environment Program reflects these concerns. A prestigious organization with an invaluable contribution to the evaluation of European environmental policies is the Ellen MacArthur Foundation, created in 2010 to accelerate the transition to a circular economy process. Ellen MacArthur Foundation’s report “Economic Growth—Circular Economy, A Vision on European Competitiveness” [16] shows that an advanced technology-based circular economy will allow Europe to raise productivity by up to 3 percentage points annually. According to the study, this generates a primary resource benefit of up to €0.6 trillion per year by 2030 compared to Europe’s current economies, resulting in a GDP growth of 7 percentage points over the current scenario development and a positive impact on employment.
The concept of “cradle to cradle” (C2C) was introduced by Mc Donough and Braungart and is specific to a regenerative circular economy [17]. This concept applies to the process of generating sustainable energy and involves the transformation of waste into new products, the use of natural energy sources, and the diversity of ecosystems [18]. In contrast to this, Morrison [19] criticizes the “cradle to grave” formula used in the industrial process, wherein products are transferred to waste, often without the possibility of being reused.
The extent of Chinese economic development over the past two decades is well known. Environmental degradation inevitably resulted in the wake of the economic miracle. Circular economy is thus a strategy for sustainable development and was proposed by the government based in Beijing to improve energy efficiency and material use. This strategy, officially accepted in 2002, was put into practice and developed in pilot areas in China [20]. National laws and regulations have been adopted to facilitate the implementation of circular economy projects. China has become the first country in the world to provide objective, credible information on the state of implementation of circular economy processes, based on a unique system of indicators for political decision-making. The work of Chinese economists [21] critically analyzes the applicative model of the circular Chinese economy. Indicators conceived by the Chinese state can be widely used by other states, also aware of the danger of environmental degradation, as a reference point for knowing the stage of development of the circular economy.
The circular economy could be also linked to the sharing economy paradigm [7]. This approach could be viewed as a closed loop of the flow of materials, instead of the linear “produce–use–dispose” view. Closing the loop through energy recovery or recycling is just a part of the solution to mend the linear economy model. In fact, repair, reuse, or remanufacturing loops are preferred over energy recovery, recycling, or landfilling [8].
Rapid development of digital technology is the main key that is enabling organizations to profitably scale the business models of a circular economy [9]. At the point at which a value chain is moving toward circular economy practices, the dynamics of power and competitiveness transform through disruptive technologies such as mobile, analytics, and recycling technology [10].
The research question addressed here is whether there is a direct and positive relationship between the R&D expenditures for circular economy processes of European Union (EU) countries and their economic efficiencies; we measure this using a composite index.
This paper is structured as follows. In the first part, we present the composite indicator built on Shannon entropy. The resulting weights assigned to each indicator in our analysis measure the significance of each indicator involved in the development of the composite indicator. Then, an entropy-based analysis was conducted for the 28 European Union countries based on an algorithm developed using the composite indicator. A ranking of the EU countries is further revealed, and results are analyzed in the Discussion section.
2. Theory and Methods
2.1. Circular Economy Processes
The economic system is conventionally perceived as an open-ended model [22]. Production, P, produces capital goods, K, and consumer goods, C. Conversely, capital goods produce consumption in the future. The aim of consumption is to create welfare or utility, U. Sometimes, this linear perspective also includes natural resources, R (see Figure 1).
The linear economy process is converting to a circular economy when the source use and waste residuals relationship is considered. The result is that the total amount of waste generated in one cycle must be equal to the depleted amount of resources. Capital goods could be used as a temporary output of resources, but after consumption they are transformed to waste in the environment system. Energy cannot be wasted, but it could be dissipated or converted. However, the relationship between natural resource use and waste in any cycle period is a little more complicated due to the stocks of resources incorporated in capital goods [23]. In the linear process, the box r is for recycling. Waste could be partially converted back to resources and make the economy process circular. Unfortunately, not all waste can be recycled [24,25,26,27], partially because of basic physical laws and partly due to missed opportunities (see Figure 2). While this cycle is most evident for fossil fuels which end up in the atmosphere as carbon dioxide molecules, growing entropy applies to most metals as well [28]. In his thesis, Georgescu-Roegen [22] considers that as humans are extracting more and more energy and matter for the economy, the level of entropy is likely to increase. Circulating energy and matter would help delay the increase of entropy and end up reducing the need for new inputs into the economic process.
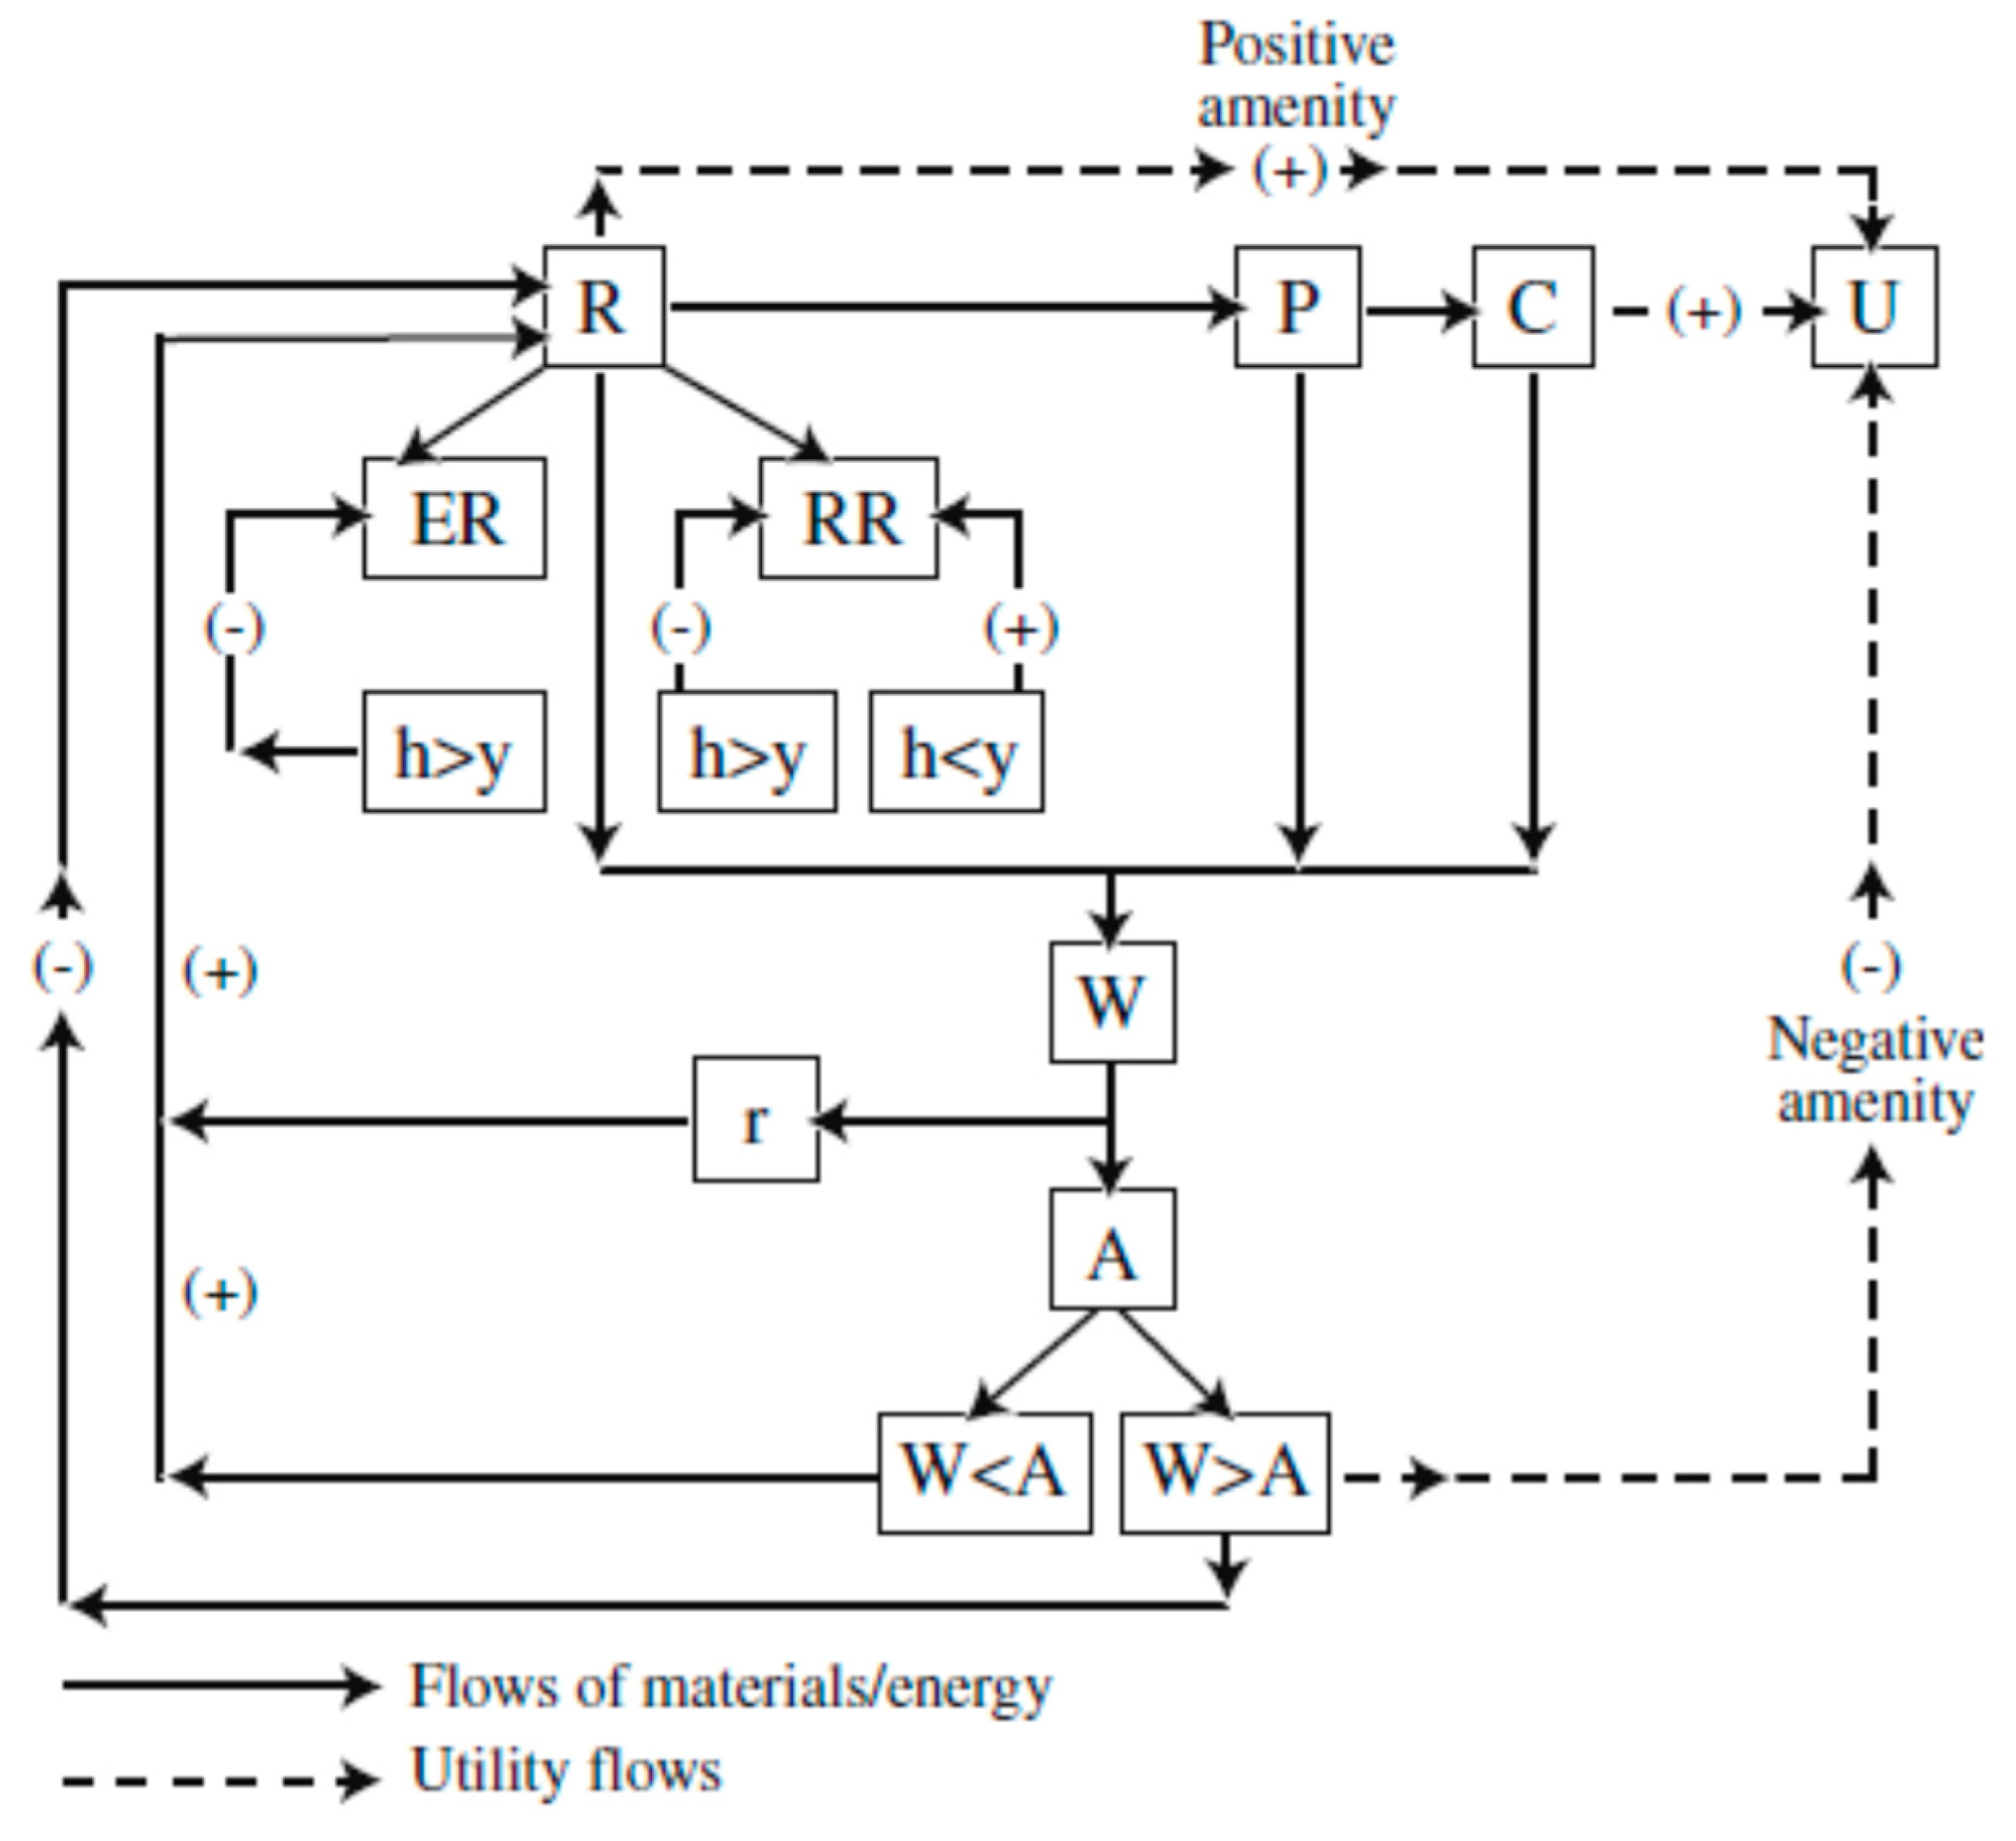
The environment can be assumed to be accomplishing four main welfare economic functions: (1) a base resource for the economy; (2) amenity values; (3) a residual flow sink; and (4) a system for life support [30]. In Figure 3, we can see the linkages between the environment and its four basic economic functions. Residuals, which are released into the environment, have great potential for causing harm by affecting the life support function and amenity values, and have also been lost from the economic process perspective. In a circular economy where reusing and recycling is instituted, the loss of the residuals coming from the economic process could be postponed for resources which are not renewable [31]. However, there might be some additional problems when minimizing the residual output. Some economists consider that the resources for the economy and the material input should be limited and that a minimization process should be a necessary prerequisite to the residual cycle.
A circular economy built through efficient recycling and resource reuse processes has the potential to create jobs, drives entrepreneurs to invest in the context of their support programs, and, last but not least, contributes to sustainable economic growth based on investment and resource efficiency [7].
The use of entropy in environmental and biological processes was firstly introduced by Shannon and Boltzman [33] who proposed entropy to quantify the amount of information provided by a random variable or a probabilistic experiment. This use of entropy then underwent a fast evolution, and its application was extended to other fields like biology, physics, economics, culture, and sociology.
Development of the theory at the basis of information utility and information measurement was founded on the work of famous researchers, among whom are D.K. Fadeev, J. Von Neumann, A.N. Kolmogorov, C. Tsallis, and A. Renyi [34,35,36,37].
The level of uncertainty can be measured using the entropy concept and may be interpreted as fuzziness or randomness. In order to analyze randomness in decision-making problems applied to different fields, various techniques which use risk measures or information measures have been developed [38,39].
2.2. Shannon Entropy Composite Index
The entropy can be defined using several metrics (Rényi Entropy, Tsallis Entropy, Shannon Entropy). It is a measure of uncertainty based on the explanatory content of a continuous or discrete variable [40]. The most used entropy measure is Shannon Entropy, which quantifies the expected value of a discrete random variable [41].
Definition.
The Shannon Entropy [42] of a discrete random variablewith corresponding probability vector,, is given by the formula.
The Shannon definition of entropy has two interpretations. First, it can be regarded as a measure of information given by the random variable or the experiment under consideration [43]; second, it can be viewed as a measure of uncertainty of a random variable or experiment [44]. When it is considered before conducting the experiment, then entropy measures the uncertainty related to the results of the analysis. If positioned after the end of the experiment, entropy then measures the outcome of the results.
Proposition 1.
Suppose we have a state system X = (x1, x2, …,xn) … with corresponding probability vector p = (p1, p2, …,pn),. If H(X), as defined above, is the Shannon entropy of the system X, then the following statements hold:
- (i).
- H(X) ≥ 0. Equality holds if, and only if,∃such that pi = 1 and pj = 1,∀/{i};
- (ii).
- H(X) ≤ ln(n). Equality holds if, and only if, pi = 1/n,., ∀.
In system theory, in a general way, entropy is used to measure the degree of disorder of the internal system [45]. When the state of a system is quantified by a particular indicator, big differences observed in the values of that indicator correspond to small entropy values; conversely, small differences indicate big entropy values [46]. If the indicator is of large importance for describing the state of the system, its corresponding weight is large, but if provides less information, its weight is small [47]. Ideally, the value of entropy is at its peak when indicator values used to estimate the status of the system are equal.
Now let us assume that there are n evaluation indicators and m evaluation objects. The matrix of the original data is hence created. For any indicator j, the larger the difference of the value of the index, the more significant the indicator in the overall evaluation is.
In our analysis we will start with the Shannon entropy measure as it was defined above, which will be normalized by using the formula
in order to get output values between 0 and 1.
Shannon entropy could help us derive the composite indicator. In the indicator-based information entropy, the weights of the indicator were calculated, and evaluation indicators were calculated by multiplying these weights with the indicators’ standardized values. The computation of entropy production and flow mainly uses year-based information entropy. The entropy composite index is described in Appendix A.
The weights and the indicators which were described above will be used in the algorithm presented in the next section, and are part of the evaluation processes used for evaluating Circular Economy use at the European Union level.
Some authors [48] used Shannon entropy to present a fault-tolerant control scheme for a class of stochastic distribution collaborative systems, which were composed of three subsystems connected in series to complete the control target. Other economists [49] proposed a new minimum entropy controller-based method of linear non-Gaussian systems to describe the characteristics and uncertainty of random variables. A grouping methodology based on the characterization of the Sardinian community system was applied to detect productive basins composed by municipalities with degree cohesiveness in terms of commuter flows [50].
Starting from the Shannon entropy measure, we produced a composite index, described in Appendix A, which was used to make a ranking of the European Union countries based on an efficiency index computed as the ratio between the composite index outcome and an investment index.
3. Results
In the EU, there are 28 Member States which joined the EU at different times. In our analysis, we will take as a basis the year 2007, which corresponds to the accession of Romania to the European Union.
The modelling of Circular Economy processes has been analyzed in a number of research articles. It was demonstrated that there is a close link between the use of a cyclical economy and economic growth [51,52,53]. Other authors [54,55,56,57] concluded that human capital and innovation for environmental benefits have a positive impact on economic growth.
Now, we will use entropy measures to evaluate the circular economy output for the 28 EU countries. The data were collected from The Statistical Office of the European Union (EUROSTAT) and are displayed in Table 1. For circular economy, we have used the recycling percentage of municipality waste as a proxy, while economic growth was defined as percentage increase in GDP per capita in the member States.
The weights were determined after computing the following steps.
Step 1:
(a) Standardizing the data. The original matrix was standardized by the formula
(b) Formula
was used to finalize the standardization, where and represent the standard deviation and the mean value of the jth index.
(c) The entropy formula contains a natural logarithm, so the value of the index cannot be negative.
We set
where d is a number which is greater than the value of .
This way, we get d = 0.789623.
Table 2 displays the results after performing Step 1.
Step 2:
At this stage, we compute the values of the indices’ weights.
(a) The probabilities of the jth index of the ith sample are calculated with the formula
where , and .
The final results after applying Step 2 can be seen in Table 3.
(b) Now, we compute the entropy , which corresponds to the index j, by using the formula
Hence, we got the results and .
(c) The utility function which corresponds to the jth index can be calculated with the formula .
This gives us the results and .
(d) Now, we standardize the weights of the jth indices by using the transformation
Hence, we have obtained the results and .
Step 3:
At this stage, we will evaluate the samples. The value of the jth indices in the ith sample are given by the formula
Hence, the total value corresponding to the ith sample is given by the formula
In Table 4 are displayed the results obtained by performing Step 3.
Now, by running the data through the four steps of the above algorithm, we get the ranking of the countries. The results are displayed in decreasing order in Table 5. The first ranked country has the highest score.
An investment indicator is computed as the government 10-year average investment in R&D for Circular Economy. The Efficiency Index is calculated for all EU countries as the ratio between the outcome we presented in Table 5 and the Investment Index [58,59,60]. The results can be seen in Table 6.
The rankings above display interesting results: countries with higher expenditures on R&D for Circular Economy have higher efficiency scores. At the same time, countries with a higher level of Circular Economy percentage use have a higher efficiency index.
4. Discussion and Conclusions
The European Commission Report on environmental policy indicates some reuse of resources in EU countries. Implementation of circular economy processes requires significant investments in environmental infrastructure in order for member states to develop smoothly towards meeting their environmental objectives [61,62].
Shortcomings are observed in the productivity of resources and labor employed in the field of environmental protection. Beyond inventory of the current situation of the circular economy, the paper presents the advantages of using the conceptual model in terms of sustainable economic growth based on the efficient and responsible consumption of resources.
Studies on developed economies have shown multiple benefits based on educating the civil society on environmental protection while making investments in infrastructure for collection, sorting, and recycling [63]. The positive effects of circular economy processes commensurately increase the level of municipal revenues, labor employed, and the profit earned by entrepreneurs providing environmental infrastructure [8].
Probably the most important benefit of using a circular economy process is felt individually. Forming an analogy between the lives of products (through reuse or extending the product’s life) and the human life, one can observe how environmental factors are propagated in the quality of our daily life.
The results which were obtained from our analysis confirm those in the economic literature [64,65] that the processes associated with the circular economy have positive effects on economic growth and resource productivity and are in line with the European target of increasing resource productivity by 30% before 2030, which may lead to a GDP growth of almost 1 percentage point [13]. This study may also be important for regional, local, and national public authorities which are involved in writing the legislative background, as well as for enterprises that can establish their business plans according to what the circular economy’s expected effects may be on implementation for every member state.
In addition, the present study highlights a straightforward, reliable, and practical instrument for assessing an efficiency index for circular economy output using a composite index. It should be noted that when the ratio of the outcome value obtained using an entropy measure and the mean value for the corresponding ten years’ time span of Research & Development expenditure for Circular Economy processes for every country is computed, the results indicate that countries with higher levels of investment in circular economy processes are more efficient.
As was mentioned in the introductory part, the research direction was prompted by the increased interest in research evaluation of the circular economy and processes at the EU level. The rankings based on entropy analysis displayed in Table 6 are similar to the rankings available at the international level, which validates our entropy analysis as an efficient tool. The findings are in line with those of other studies in this area [66,67], showing significant and consistent results when different sets of data are analyzed.
Since the macroeconomic indicators from the analysis concerned a period of ten years, one of the main limitations of this research is related to the time database used for the factor analysis. Another limitation is related to the availability of the data and the time frame.
Future research will be conducted for longer periods of time which may provide a more accurate picture of the circular economy processes at the EU level. Besides adding to the data sets to be analyzed using information measures, further research also needs to investigate what types of entropy measures are more liable to result in more well-rounded and dependable findings. This study was based on a composite index modeled by Shannon entropy; hence, future studies could try to model the circular economy processes using other entropy measures. Last, but not least, future analysis could extend this research to countries elsewhere in Europe or worldwide.
Author Contributions
C.B. and M.B. drafted the initial manuscript and revised the final manuscript. M.B. contributed the data acquisition and estimated the composite index; C.B. contributed by developing the algorithm and putting together all the numerical results; M.B. contributed the conclusions and recommendations as well as the limitations of the study and further research; M.B. and C.B. contributed the literature review; M.B. was responsible for the overall writing process.
Funding
This research received no external funding.
Conflicts of Interest
The authors declare no conflict of interest.
Appendix A
Shannon Composite Index
Here, the index “i” represents an indicator, while “j” represents an evaluation event; the number of evaluation events is “m”, and the number of indicators is “n”. To evaluate the “n” indicators over “m” years, the reliability of the evaluation is improved by standardizing each indicator to drop the effects of its units of measurement (dimensions) on the evaluation results. This method converts the raw data to get standardized values from 0 to 1 for each indicator.
This could be defined as follows:
where is the value of the indicator “i” for event “j”, and is the standardized value computed from the raw data.
The early-based information entropy could be expressed by the Shannon entropy formula above to get
where
The weight of each indicator could be determined by using the following formula:
where Ei is the indicator-based information entropy, which is computed with the formula
where
References
- Cobo, S.; Dominguez-Ramos, A.; Irabien, A. From linear to circular integrated waste management systems: A review of methodological approaches. Resour. Conserv. Recycl. 2018, 135, 279–295. [Google Scholar] [CrossRef]
- Rada, E.C.; Ragazzi, M.; Torretta, V.; Castagana, G.; Adami, L.; Cioca, L.I. Circular economy and waste to energy. In AIP Conference Proceedings; AIP Publishing: Melville, NY, USA, 2018; Volume 1968, p. 030050. [Google Scholar]
- Romero-Hernández, O.; Romero, S. Maximizing the value of waste: From waste management to the circular economy. Thunderbird Int. Bus. Rev. 2018, 60, 757–764. [Google Scholar] [CrossRef]
- Ragazzi, M.; Fedrizzi, S.; Rada, E.C.; Ionescu, G.; Ciudin, R.; Cioca, L.I. Experiencing Urban Mining in an Italian Municipality towards a Circular Economy vision. Energy Procedia 2017, 119, 192–200. [Google Scholar] [CrossRef]
- Stahel, W.R. Analysis of the structure and values of the European Commission’s Circular Economy Package. Proceedings of Institution of Civil Engineers: Waste and Resource Management; Thomas Telford Ltd.: London, UK, 2017; Volume 170, pp. 41–44. [Google Scholar]
- Andersen, M.S. An introductory note on the environmental economics of the circular economy. Sustain. Sci. 2007, 2, 133–140. [Google Scholar] [CrossRef]
- Kronborg, M.T. Optimal Consumption and Investment with Labor Income and European/American Capital Guarantee. Risks 2014, 2, 171–194. [Google Scholar] [CrossRef] [Green Version]
- Núñez-Cacho, P.; Molina-Moreno, V.; Corpas-Iglesias, F.A.; Cortés-García, F.J. Family Businesses Transitioning to a Circular Economy Model: The Case of “Mercadona”. Sustainability 2018, 10, 538. [Google Scholar] [CrossRef]
- Shaheen, S.A.; Mallery, M.A.; Kingsley, K.J. Personal vehicle sharing services in North America. Res. Transp. Bus. Manag. 2012, 3, 71–81. [Google Scholar] [CrossRef]
- Molina-Sánchez, E.; Leyva-Díaz, J.C.; Cortés-García, F.J.; Molina-Moreno, V. Proposal of Sustainability Indicators for the Waste Management from the Paper Industry within the Circular Economy Model. Water 2018, 10, 1014. [Google Scholar] [CrossRef]
- Ljunggren Söderman, M.; Eriksson, O.; Björklund, A.; Östblom, G.; Ekvall, T.; Finnveden, G.; Sundqvist, J.O. Integrated economic and environmental assessment of waste policy instruments. Sustainability 2016, 8, 411. [Google Scholar] [CrossRef]
- Sjöström, M.; Östblom, G. Future Waste Scenarios for Sweden Based on a CGEmodle; Working Paper 109; National Institute of Economic Research: Stockholm, Sweden, 2009; Available online: https://econpapers.repec.org/paper/hhsnierwp/0109.htm (accessed on 11 October 2017).
- Xie, J.; Saltzman, S. Environmental policy analysis: An environmental computable general-equilibrium approach for developing countries. J. Policy Model. 2000, 22, 453–489. [Google Scholar] [CrossRef]
- OECD. Environmental Quality Objectives—A Shared Responsibility, Summary of Government Bill 2004/05:150: OECD Environmental Outlook to 2030; OECD: Paris, France, 2001; ISBN 978-92-64-04048-9. [Google Scholar]
- EU. Regulation (EC) No 2150/2002 of the European Parliament and the Council on Waste Statistics. 2002. Available online: http://www.kluwerlawonline.com/abstract.php?id=EELR2003019 (accessed on 23 August 2018).
- MacArthur, E. Towards the circular economy. J. Ind. Ecol. 2013, 23–44. Available online: https://mvonederland.nl/system/files/media/towards-the-circular-economy.pdf (accessed on 21 October 2017).
- Kopnina, H. Sustainability: New strategic thinking for business. Environ. Dev. Sustain. 2017, 19, 27–43. [Google Scholar] [CrossRef]
- Hussain, M.E.; Haque, M. Impact of Economic Freedom on the Growth Rate: A Panel Data Analysis. Economies 2016, 4, 5. [Google Scholar] [CrossRef]
- Morrison, P.M. Meeting the Environmental Challenge with Technology. In Proceedings of the SPE Digital Energy Conference and Exhibition, The Woodlands, TX, USA, 19–21 April 2011. [Google Scholar]
- Zhao, H.; Guo, S.; Zhao, H. Impacts of GDP, Fossil Fuel Energy Consumption, Energy Consumption Intensity, and Economic Structure on SO2 Emissions: A Multi-Variate Panel Data Model Analysis on Selected Chinese Provinces. Sustainability 2018, 10, 657. [Google Scholar] [CrossRef]
- Liu, Y. Energy Production and Regional Economic Growth in China: A More Comprehensive Analysis Using a Panel Model. Energies 2013, 6, 1409–1420. [Google Scholar] [CrossRef] [Green Version]
- Georgescu-Roegen, N. The Entropy Law and Economic Processes; Harvard University Press: Cambridge, MA, USA, 1971. [Google Scholar]
- Lahti, T.; Wincent, J.; Parida, V. A Definition and Theoretical Review of the Circular Economy, Value Creation, and Sustainable Business Models: Where Are We Now and Where Should Research Move in the Future? Sustainability 2018, 10, 2799. [Google Scholar] [CrossRef]
- De Almeida, S.T.; Borsato, M. Assessing the efficiency of End of Life technology in waste treatment—A bibliometric literature review. Resour. Conserv. Recycl. 2019, 140, 189–208. [Google Scholar] [CrossRef]
- Bernstad Saraiva, A.; Souza, R.G.; Mahler, C.F.; Valle, R.A.B. Consequential lifecycle modelling of solid waste management systems—Reviewing choices and exploring their consequences. J. Clean. Prod. 2018, 202, 488–496. [Google Scholar] [CrossRef]
- Tseng, M.L.; Wong, W.P.; Soh, K.L. An overview of the substance of Resource, Conservation and Recycling. Resour. Conserv. Recycl. 2018, 136, 367–375. [Google Scholar] [CrossRef]
- Xiao, S.; Dong, H.; Geng, Y.; Brander, M. An overview of China’s recyclable waste recycling and recommendations for integrated solutions. Resour. Conserv. Recycl. 2018, 134, 112–120. [Google Scholar] [CrossRef]
- Nuñez-Cacho, P.; Górecki, J.; Molina-Moreno, V.; Corpas-Iglesias, F.A. What Gets Measured, Gets Done: Development of a Circular Economy Measurement Scale for Building Industry. Sustainability 2018, 10, 2340. [Google Scholar] [CrossRef]
- Andersen, P. What Is Web 2.0?: Ideas, Technologies and Implications for Education; JISC: Bristol, UK, 2007; Volume 1, pp. 1–64. [Google Scholar]
- Perman, R.; Ma, Y.; McGilvray, J.; Common, M. Natural Resource and Environmental Economics; Pearson Education: London, UK, 2003. [Google Scholar]
- Cleary, J. Life cycle assessments of municipal solid waste management systems: A comparative analysis of selected peer-reviewed literature. Environ. Int. 2009, 35, 1256–1266. [Google Scholar] [CrossRef] [PubMed]
- Pearce, D.; Turner, R.K. Economics of Natural Resources and the Environment; Harvester Wheatsheaf: London, UK, 1990. [Google Scholar]
- Shannon, C.E. A mathematical theory of communication. Bell Syst. Tech. J. 1948, 27, 379–423. [Google Scholar] [CrossRef]
- Von Neumann, J.; Morgenstern, O. Theory of Games and Economic Behavior; Commemorative Edition; Princeton University Press: Princeton, NJ, USA, 2007. [Google Scholar]
- Rényi, A. On Measures of Entropy and Information; Hungarian Academy of Sciences: Budapest, Hungary, 1961. [Google Scholar]
- Tsallis, C. Possible generalization of Boltzmann-Gibbs statistics. J. Stat. Phys. 1988, 52, 479–487. [Google Scholar] [CrossRef]
- Kolmogorov, A.N.; Tikhomirov, V.M. ε-entropy and ε-capacity of sets in function spaces. Uspekhi Mat. Nauk. 1959, 14, 3–86. [Google Scholar]
- Cannon, W.R.; Zucker, J.D.; Baxter, D.J.; Kumar, N.; Baker, S.E.; Hurley, J.M.; Dunlap, J.C. Prediction of Metabolite Concentrations, Rate Constants and Post-Translational Regulation Using Maximum Entropy-Based Simulations with Application to Central Metabolism of Neurospora crassa. Processes 2018, 6, 63. [Google Scholar] [CrossRef]
- Sherwin, W.B. Entropy, or Information, Unifies Ecology and Evolution and Beyond. Entropy 2018, 20, 727. [Google Scholar] [CrossRef]
- Baravalle, R.; Rosso, O.; Montani, F. Causal Shannon–Fisher Characterization of Motor/Imagery Movements in EEG. Entropy 2018, 20, 660. [Google Scholar] [CrossRef]
- Luo, Z.; Xie, F.; Zhang, B.; Qiu, D. Quantifying the Nonlinear Dynamic Behavior of the DC-DC Converter via Permutation Entropy. Energies 2018, 11, 2747. [Google Scholar] [CrossRef]
- Dai, S.; Niu, D. Comprehensive Evaluation of the Sustainable Development of Power Grid Enterprises Based on the Model of Fuzzy Group Ideal Point Method and Combination Weighting Method with Improved Group Order Relation Method and Entropy Weight Method. Sustainability 2017, 9, 1900. [Google Scholar] [Green Version]
- Huo, W.; Huang, Y.; Pei, J.; Zhang, Q.; Gu, Q.; Yang, J. Ship Detection from Ocean SAR Image Based on Local Contrast Variance Weighted Information Entropy. Sensors 2018, 18, 1196. [Google Scholar] [CrossRef] [PubMed]
- Brock, W.A.; Taylor, M.S. Economic growth and the environment: A review of theory and empirics. In Handbook of Economic Growth; Atlanta, GA, USA, 2005; Volume 1, pp. 1749–1821. Available online: http://www.sciencedirect.com/science/article/pii/S1574068405010282 (accessed on 14 June 2018).
- Lyasnikov, N.V.; Dudin, M.N.; Sekerin, V.D.; Veselovsky, M.Y.; Aleksakhina, V.G. The national innovation system: The conditions of its making and factors in its development. Life Sci. J. 2014, 11, 535–538. [Google Scholar]
- Mankiw, N.G.; Romer, D.; Weil, D.N. A contribution to the empirics of economic growth. Q. J. Econ. 1992, 107, 407–437. [Google Scholar] [CrossRef]
- Schmidheiny, K. Panel Data: Fixed and Random Effects; Basel Universität: Basel, Switzerland, 2016; Available online: http://www.schmidheiny.name/teaching/panel2up.pdf (accessed on 18 May 2018).
- Barro, R.J. Health and economic growth. Ann. Econ. Financ. 2013, 14, 329–366. [Google Scholar]
- Solow, R.M. A Contribution to the Theory of Economic Growth. Q. J. Econ. 1956, 70, 65–94. [Google Scholar] [CrossRef]
- Swan, T.W. Economic growth and capital accumulation. Econ. Rec. 1956, 32, 334–361. [Google Scholar] [CrossRef]
- Busu, M.; Gyorgy, A. Real Convergence, Steps from Adherence to Integration of the Countries from Central and Eastern Europe. Amfiteatru Econ. J. 2016, 18, 303–316. [Google Scholar]
- Pett, M.A.; Lackey, N.R.; Sullivan, J.J. Making Sense of Factor Analysis: The Use of Factor Analysis for Instrument Development in Health Care Research; Sage: Newcastle upon Tyne, UK, 2003. [Google Scholar]
- Weinberg, D.; Carmeli, A. Exploring the antecedents of relationship commitment in an import–export dyad. In New Perspectives in International Business Research; Feldman, M.P., Santangelo, G.D., Eds.; Emerald: Bingley, UK, 2008; pp. 113–136. [Google Scholar]
- Urban, M. The Influence of Blockholders on Agency Costs and Firm Value an Empirical Examination of Blockholder Characteristics and Interrelationships for German Listed Firms; Springer: Berlin, Germany, 2015. [Google Scholar]
- Block, J. Long-Term Orientation of Family Firms: An Investigation of R&D Investments, Downsizing Practices, and Executive Pay; Gabler: Wiesbaden, Germany, 2009. [Google Scholar]
- Puigcerver-Peñalver, M.C. The impact of structural funds policy on European regions’ growth. A theoretical and empirical approach. Eur. J. Comp. Econ. 2007, 4, 179. [Google Scholar]
- Monge, M.A.S.; Vidal, J.M.; Villalba, L.J.G. Entropy-Based Economic Denial of Sustainability Detection. Entropy 2017, 19, 649. [Google Scholar] [CrossRef]
- Ranjbari, M.; Morales-Alonso, G.; Carrasco-Gallego, R. Conceptualizing the Sharing Economy through Presenting a Comprehensive Framework. Sustainability 2018, 10, 2336. [Google Scholar] [CrossRef]
- Su, B.; Heshmati, A.; Geng, Y.; Yu, X. A review of the circular economy in China: Moving from rhetoric to implementation. J. Clean. Prod. 2013, 42, 215–227. [Google Scholar] [CrossRef]
- Ghisellini, P.; Cialani, C.; Ulgiati, S. A review on circular economy: The expected transition to a balanced interplay of environmental and economic systems. J. Clean. Prod. 2016, 114, 11–32. [Google Scholar] [CrossRef]
- Yao, L.; Wu, W.; Kang, Y.; Li, L. Fault Diagnosis and Minimum Rational Entropy Fault Tolerant Control of Stochastic Distribution Collaborative Systems. Entropy 2018, 20, 820. [Google Scholar] [CrossRef]
- Zhou, J.; Jia, Y.; Jiang, H.; Fan, S. Non-Gaussian Systems Control Performance Assessment Based on Rational Entropy. Entropy 2018, 20, 331. [Google Scholar] [CrossRef]
- De Montis, A.; Caschili, S.; Chessa, A. Commuter networks and community detection: A method for planning sub-regional areas. Eur. Phys. J. Spéc. Top. 2013, 215, 75–91. [Google Scholar] [CrossRef]
- Vuţă, M.; Vuţă, M.; Enciu, A.; Cioacă, S.I. Assessment of the Circular Economy's Impact in the EU Economic Growth. Amfiteatru Econ. 2018, 20, 248–261. [Google Scholar]
- Preston, F. A Global Redesign?: Shaping the Circular Economy; Chatham House: London, UK, 2012; Available online: https://www.bitcni.org.uk/wp-content/uploads/2014/11/bp0312_preston.pdf (accessed on 11 October 2017).
- Malecki, E.; Moriset, B. The Digital Economy; Routledge: London, UK, 2008. [Google Scholar]
- World Bank. World Development Report 2017: Governance and the Law; World Bank: Washington, DC, USA, 2017. [Google Scholar]
Figure 1.
The conventional linear economy processes. R—natural resources, P—production, C—consumption, U—utility, and K—capital goods.
Figure 1.
The conventional linear economy processes. R—natural resources, P—production, C—consumption, U—utility, and K—capital goods.
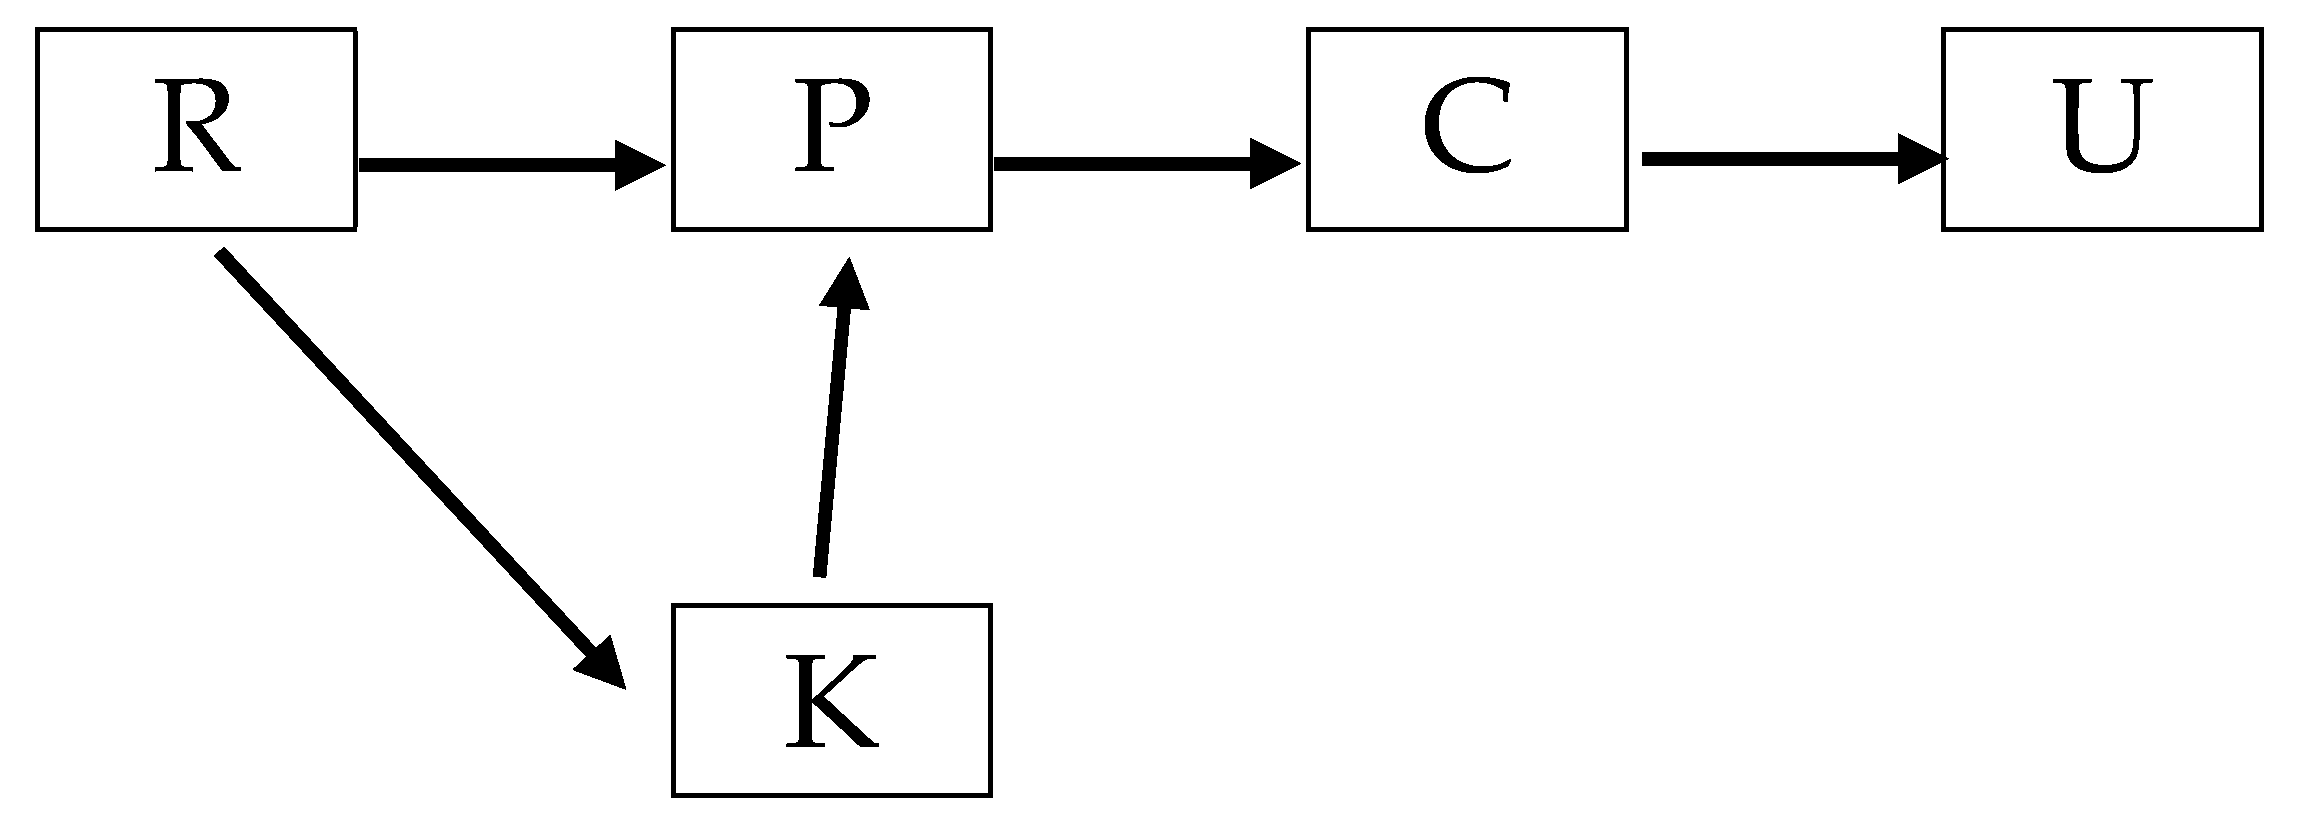
Figure 2.
Circular economy processes. r—Recycling, W—waste. Source: Andersen, M.S. [29].
Figure 2.
Circular economy processes. r—Recycling, W—waste. Source: Andersen, M.S. [29].
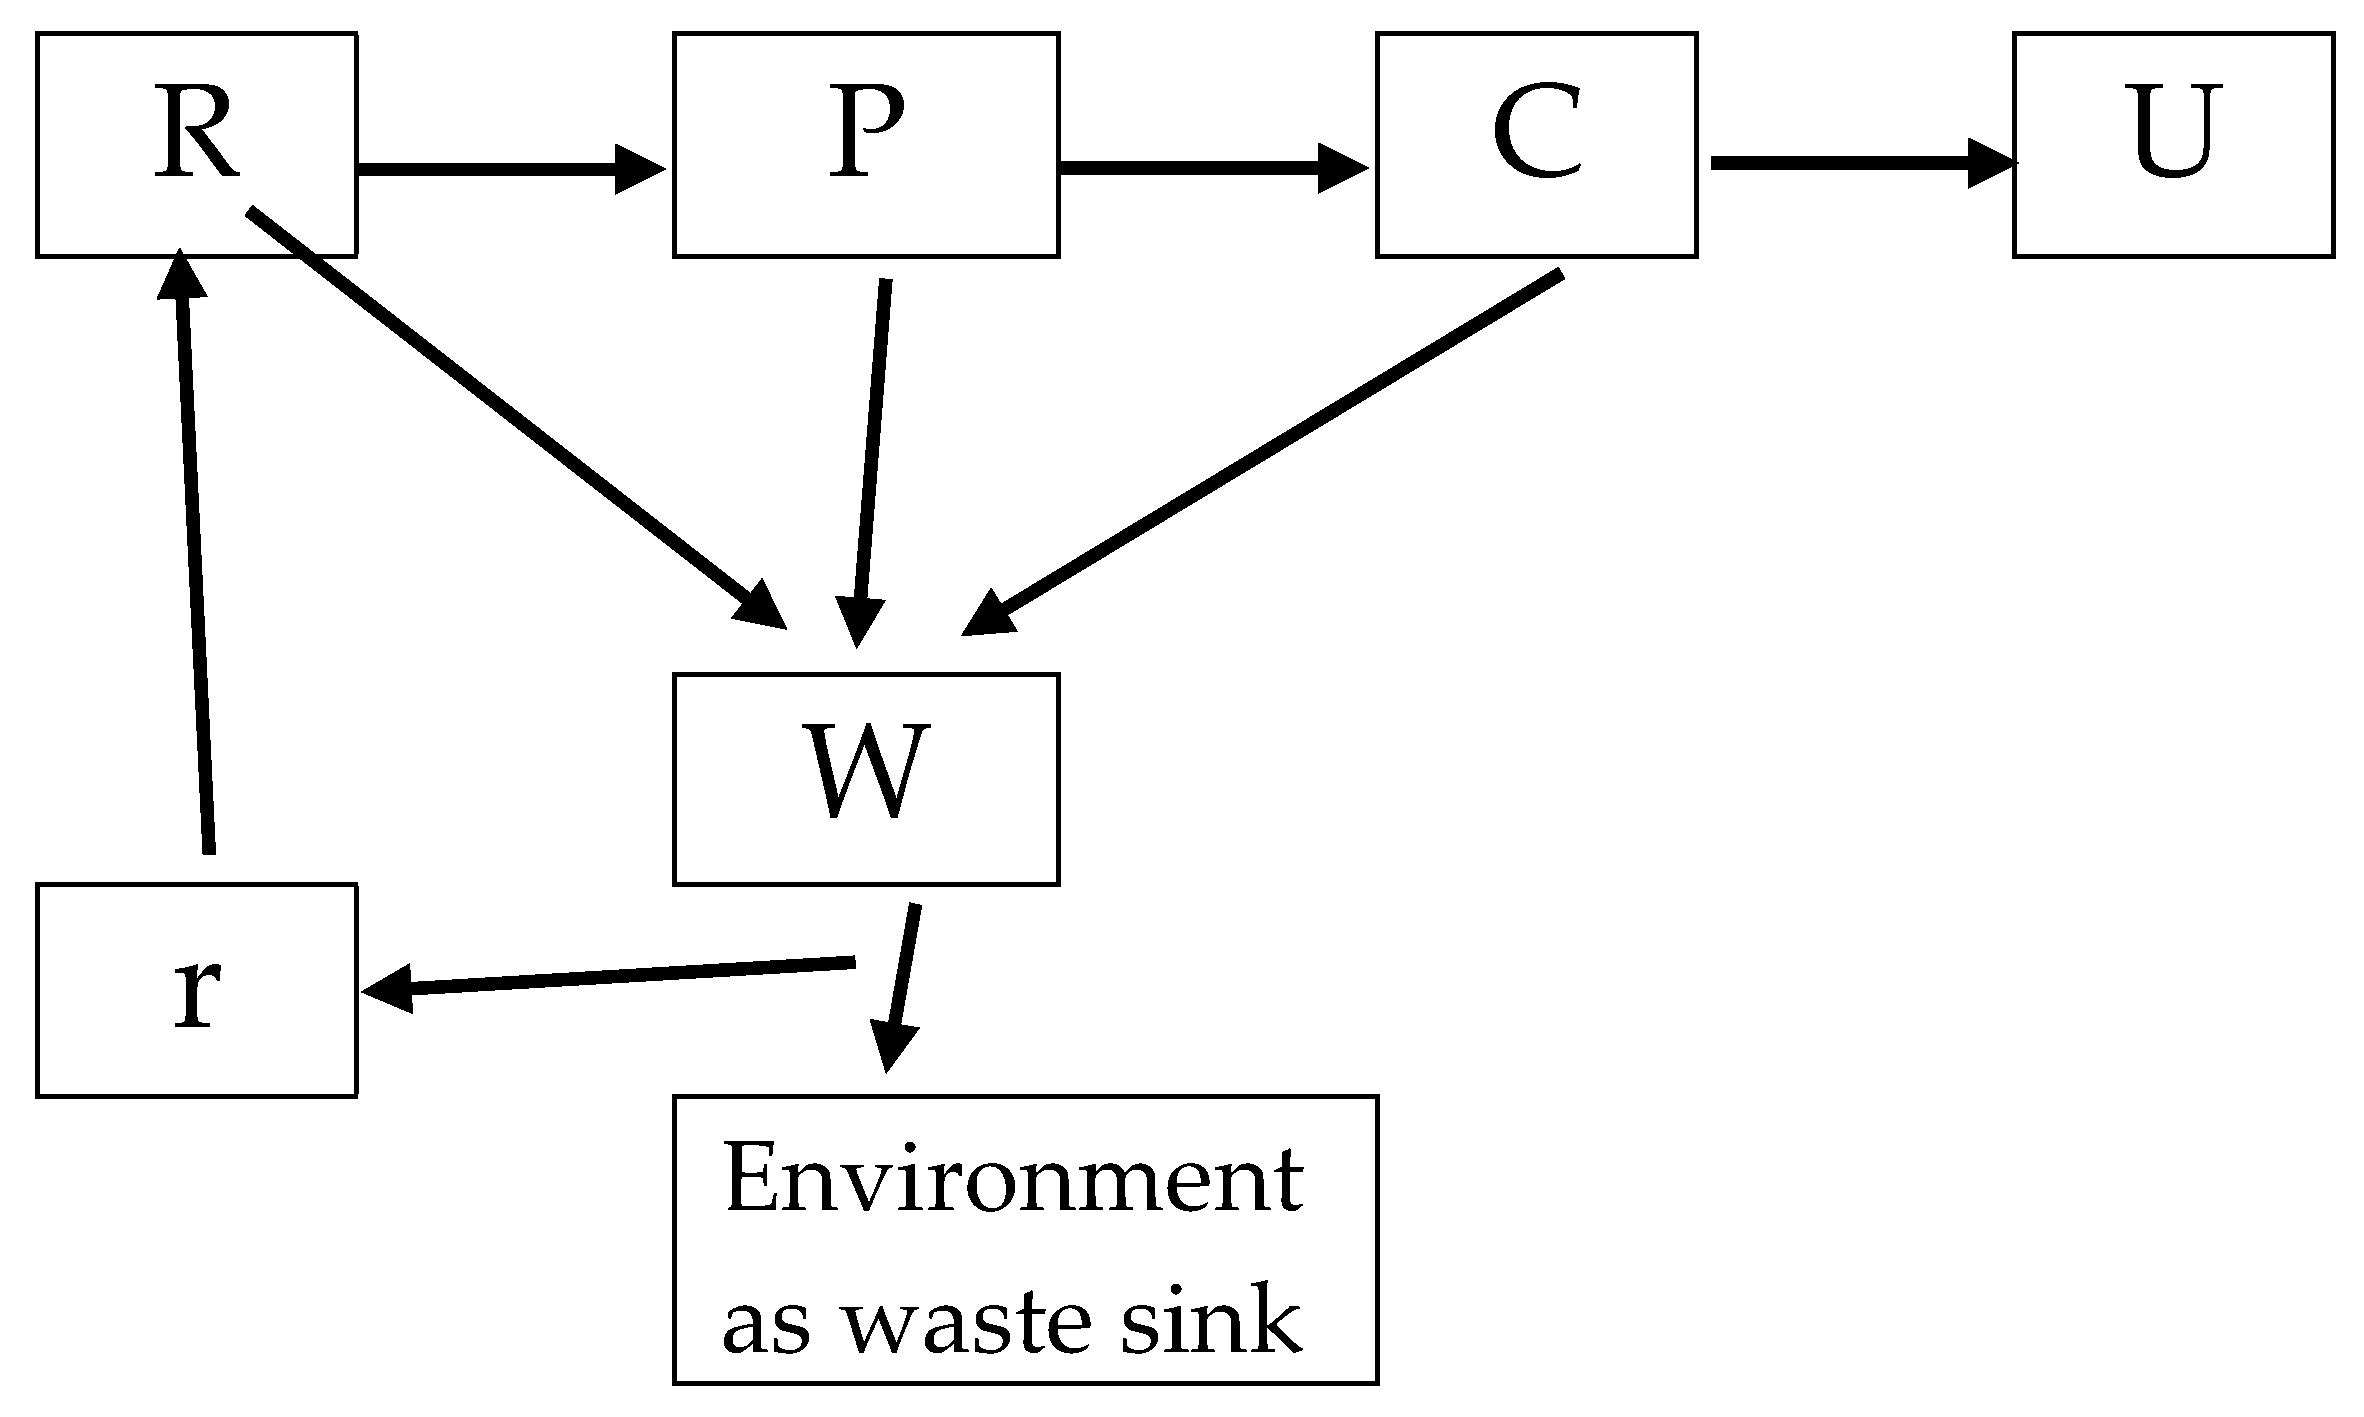
Figure 3.
Circular economy processes. Source: Pearce and Turner [32]. r—Recycling, P—Production, C—Consumption, U—Utility, K—Capital goods, R—Natural resources, ER—Exhaustible resources, RR—Recyclable resources, A—Assimilative capacity, W—Waste, h—Harvest, y—Yield.
Figure 3.
Circular economy processes. Source: Pearce and Turner [32]. r—Recycling, P—Production, C—Consumption, U—Utility, K—Capital goods, R—Natural resources, ER—Exhaustible resources, RR—Recyclable resources, A—Assimilative capacity, W—Waste, h—Harvest, y—Yield.


Table 1.
Recycling rate and economic growth of the EU countries.
| Country | Recycling (%) | GDP Per Capita ($) |
|---|---|---|
| Austria | 59.2 | 47,291 |
| Belgium | 54.6 | 43,324 |
| Bulgaria | 19.1 | 8032 |
| Cyprus | 4.2 | 25,234 |
| Czech Republic | 7.4 | 20,368 |
| Denmark | 41.8 | 56,308 |
| Estonia | 17.4 | 19,705 |
| Finland | 33.6 | 45,703 |
| France | 30.6 | 38,477 |
| Germany | 62.1 | 44,470 |
| Greece | 12.8 | 18,613 |
| Hungary | 10.4 | 14,225 |
| Ireland | 33.1 | 69,331 |
| Italy | 19.2 | 31,953 |
| Latvia | 4.5 | 15,594 |
| Lithuania | 1.9 | 16,681 |
| Luxembourg | 43.7 | 104,103 |
| Malta | 13.4 | 26,946 |
| Netherlands | 46.8 | 48,223 |
| Poland | 15.9 | 13,812 |
| Portugal | 15.9 | 21,136 |
| Romania | 1.8 | 10,814 |
| Slovakia | 4.1 | 17,605 |
| Slovenia | 15.4 | 23,597 |
| Spain | 31.2 | 28,157 |
| Sweden | 47.9 | 53,442 |
| UK | 30.3 | 39,720 |
Source: own processing of the data from Eurostat.
Table 2.
The results obtained by performing Step 1.
| Country | Y1 | Y2 | Z1 | Z2 | U1 | U2 |
|---|---|---|---|---|---|---|
| Austria | 0.12849 | 0.12849 | 0.12849 | 0.12849 | 0.12849 | 0.12849 |
| Belgium | 0.57259 | 0.65302 | 131.667 | 176.780 | 213.332 | 258.445 |
| Bulgaria | 0.49847 | 0.44311 | 105.081 | 0.93704 | 186.746 | 175.369 |
| Croatia | 0.11464 | 0.10399 | −0.32592 | −0.40509 | 0.49073 | 0.41156 |
| Czech Republic | 0.09085 | 0.08407 | −0.41127 | −0.48393 | 0.40538 | 0.33272 |
| Cyprus | 0.02292 | 0.03152 | −0.65491 | −0.69191 | 0.16174 | 0.12474 |
| Denmark | 0.18883 | 0.16218 | −0.05981 | −0.17479 | 0.75684 | 0.64186 |
| Estonia | 0.12849 | 0.12849 | 0.12849 | 0.12849 | 0.12849 | 0.12849 |
| Finland | 0.57259 | 0.65302 | 78.495 | 176.780 | 160.160 | 92.293 |
| France | 0.49847 | 0.44311 | 51.909 | 0.93705 | 133.574 | 9.217 |
| Germany | 0.11464 | 0.10399 | −0.32592 | −0.40509 | 0.49073 | 0.41156 |
| Greece | 0.09085 | 0.08407 | −0.41127 | −0.48393 | 0.40538 | 0.33272 |
| Hungary | 0.02292 | 0.03152 | −0.65491 | −0.69191 | 0.16174 | 0.12474 |
| Ireland | 0.18883 | 0.16218 | −0.05981 | −0.17479 | 0.75684 | 0.64186 |
| Italy | 0.12849 | 0.12849 | 0.12849 | 0.12849 | 0.12849 | 0.12849 |
| Latvia | 0.57259 | 0.65302 | 25.323 | 176.780 | 106.988 | −73.859 |
| Lithuania | 0.49847 | 0.44311 | −1.263 | 0.93706 | 80.402 | −156.935 |
| Luxembourg | 0.11464 | 0.10399 | −0.32592 | −0.40509 | 0.49073 | 0.41156 |
| Malta | 0.09085 | 0.08407 | −0.41127 | −0.48393 | 0.40538 | 0.33272 |
| Netherlands | 0.02292 | 0.03152 | −0.65491 | −0.69191 | 0.16174 | 0.12474 |
| Poland | 0.18883 | 0.16218 | −0.05981 | −0.17479 | 0.75684 | 0.64186 |
| Portugal | 0.12849 | 0.12849 | 0.12849 | 0.12849 | 0.12849 | 0.12849 |
| Romania | 0.57259 | 0.65302 | 0.21495 | 176.780 | 160.160 | 92.293 |
| Slovakia | 0.49847 | 0.103654 | 0.93705 | 51.909 | 133.574 | 9.217 |
| Slovenia | 0.11464 | 0.10399 | −0.32592 | −0.40509 | 0.49073 | 0.41156 |
| Spain | 0.09085 | 0.08407 | −0.41127 | −0.48393 | 0.40538 | 0.33272 |
| Sweden | 0.02292 | 0.03152 | −0.65491 | −0.69191 | 0.16174 | 0.12474 |
| UK | 0.18883 | 0.16218 | −0.05981 | −0.17479 | 0.75684 | 0.64186 |
Source: own processing of the data from Eurostat.
Table 3.
Computation of weights of the indices.
| Country | P1 | P2 |
|---|---|---|
| Austria | 0.11464 | 0.10399 |
| Belgium | 0.09085 | 0.08407 |
| Bulgaria | 0.02292 | 0.03152 |
| Croatia | 0.18883 | 0.16218 |
| Czech Republic | 0.12849 | 0.12849 |
| Cyprus | 0.57259 | 0.65302 |
| Denmark | 0.49847 | 0.44311 |
| Estonia | 0.11464 | 0.10399 |
| Finland | 0.09085 | 0.08407 |
| France | 0.09085 | 0.08407 |
| Germany | 0.02292 | 0.03152 |
| Greece | 0.18883 | 0.16218 |
| Hungary | 0.12849 | 0.12849 |
| Ireland | 0.57259 | 0.65302 |
| Italy | 0.49847 | 0.44311 |
| Latvia | 0.11464 | 0.10399 |
| Lithuania | 0.09085 | 0.08407 |
| Luxembourg | 0.02292 | 0.03152 |
| Malta | 0.18883 | 0.16218 |
| Netherlands | 0.49847 | 0.44311 |
| Poland | 0.11464 | 0.10399 |
| Portugal | 0.09085 | 0.08407 |
| Romania | 0.23498 | 0.23587 |
| Slovakia | 0.02292 | 0.03152 |
| Slovenia | 0.45678 | 0.12305 |
| Spain | 0.32976 | 0.21387 |
| Sweden | 0.87142 | 0.16540 |
| UK | 0.01245 | 0.01276 |
Source: own processing of the data from Eurostat.
Table 4.
The results obtained by performing Step 3.
| Country | F1 | F2 | Score |
|---|---|---|---|
| Austria | 0.09085 | 0.08407 | 0.17492 |
| Belgium | 0.02292 | 0.03152 | 0.05444 |
| Bulgaria | 0.18883 | 0.16218 | 0.35101 |
| Croatia | 0.11464 | 0.10399 | 0.21863 |
| Czech Republic | 0.09085 | 0.08407 | 0.17492 |
| Cyprus | 0.02292 | 0.03152 | 0.05444 |
| Denmark | 0.18883 | 0.16218 | 0.35101 |
| Estonia | 0.49847 | 0.44311 | 0.94158 |
| Finland | 0.09085 | 0.08407 | 0.17492 |
| France | 0.02292 | 0.03152 | 0.05444 |
| Germany | 0.18883 | 0.16218 | 0.35101 |
| Greece | 0.12849 | 0.12849 | 0.25698 |
| Hungary | 0.57259 | 0.65302 | 122.561 |
| Ireland | 0.09085 | 0.08407 | 0.17492 |
| Italy | 0.02292 | 0.03152 | 0.05444 |
| Latvia | 0.18883 | 0.16218 | 0.35101 |
| Lithuania | 0.12849 | 0.12849 | 0.25698 |
| Luxembourg | 0.57259 | 0.65302 | 122.561 |
| Malta | 0.49847 | 0.44311 | 0.94158 |
| Netherlands | 0.11464 | 0.10399 | 0.21863 |
| Poland | 0.2376 | 0.06534 | 0.30294 |
| Portugal | 0.12765 | 0.54398 | 0.67163 |
| Romania | 0.12673 | 0.07653 | 0.20326 |
| Slovakia | 0.09834 | 0.23476 | 0.33313 |
| Slovenia | 0.10987 | 0.09876 | 0.20863 |
| Spain | 0.1765 | 0.23463 | 0.41113 |
| Sweden | 0.87523 | 0.09823 | 0.97346 |
| UK | 0.10754 | 0.06543 | 0.17297 |
Source: own processing of the data from Eurostat.
Table 5.
Ranking of the countries after applying the algorithm.
| Country | Outcome |
|---|---|
| Luxembourg | 1 |
| Ireland | 0.77952 |
| Denmark | 0.71611 |
| Sweden | 0.61038 |
| Netherlands | 0.47246 |
| Austria | 0.29624 |
| Finland | 0.24549 |
| Germany | 0.19605 |
| Belgium | 0.15337 |
| UK | 0.13882 |
| France | 0.12903 |
| Italy | 0.12544 |
| Spain | 0.11092 |
| Malta | 0.10964 |
| Cyprus | 0.08766 |
| Slovenia | 0.06607 |
| Portugal | 0.04724 |
| Czech Republic | 0.04724 |
| Estonia | 0.03048 |
| Greece | 0.03558 |
| Slovakia | 0.02696 |
| Lithuania | 0.01522 |
| Latvia | 0.00354 |
| Hungary | 0.00287 |
| Poland | 0.00201 |
| Romania | 0.00132 |
| Bulgaria | 0.00076 |
Source: own processing of the data from Eurostat.
Table 6.
Circular economy efficiency index.
| Country | Outcome | R&D Investment | Efficiency Index |
|---|---|---|---|
| Austria | 0.2962 | 0.9876 | 0.3000 |
| Belgium | 0.1534 | 0.8112 | 0.1891 |
| Bulgaria | 0.0008 | 0.0089 | 0.0854 |
| Cyprus | 0.0877 | 0.0193 | 4.5420 |
| Czech Republic | 0.0472 | 0.2726 | 0.1733 |
| Denmark | 0.7161 | 1.0365 | 0.6909 |
| Estonia | 0.0305 | 0.0523 | 0.5828 |
| Finland | 0.2455 | 0.6324 | 0.3882 |
| France | 0.1290 | 4.2567 | 0.0303 |
| Germany | 0.1961 | 5.9453 | 0.0330 |
| Greece | 0.0356 | 0.2754 | 0.1292 |
| Hungary | 0.0029 | 0.1126 | 0.0255 |
| Ireland | 0.7795 | 0.3312 | 2.3536 |
| Italy | 0.1254 | 2.7216 | 0.0461 |
| Latvia | 0.0035 | 0.0319 | 0.1110 |
| Lithuania | 0.0152 | 0.0712 | 0.2138 |
| Luxembourg | 1.0000 | 0.1319 | 7.5815 |
| Malta | 0.1096 | 0.0483 | 2.2700 |
| Netherlands | 0.4725 | 1.8995 | 0.2487 |
| Poland | 0.0020 | 0.4312 | 0.0047 |
| Portugal | 0.0472 | 0.4321 | 0.1093 |
| Romania | 0.0013 | 0.0698 | 0.0189 |
| Slovakia | 0.0270 | 0.0812 | 0.3320 |
| Slovenia | 0.0661 | 0.0533 | 1.2396 |
| Spain | 0.1109 | 1.7832 | 0.0622 |
| Sweden | 0.6104 | 1.5282 | 0.3994 |
| UK | 0.1388 | 4.2674 | 0.0325 |
Source: own processing of the data from Eurostat.
© 2018 by the authors. Licensee MDPI, Basel, Switzerland. This article is an open access article distributed under the terms and conditions of the Creative Commons Attribution (CC BY) license (http://creativecommons.org/licenses/by/4.0/).
Share and Cite
MDPI and ACS Style
Busu, C.; Busu, M. Modeling the Circular Economy Processes at the EU Level Using an Evaluation Algorithm Based on Shannon Entropy. Processes 2018, 6, 225. https://doi.org/10.3390/pr6110225
AMA Style
Busu C, Busu M. Modeling the Circular Economy Processes at the EU Level Using an Evaluation Algorithm Based on Shannon Entropy. Processes. 2018; 6(11):225. https://doi.org/10.3390/pr6110225
Chicago/Turabian StyleBusu, Cristian, and Mihail Busu. 2018. "Modeling the Circular Economy Processes at the EU Level Using an Evaluation Algorithm Based on Shannon Entropy" Processes 6, no. 11: 225. https://doi.org/10.3390/pr6110225
Note that from the first issue of 2016, this journal uses article numbers instead of page numbers. See further details here.