Article

Impact of Filled Materials on the Heating Uniformity and Safety of Microwave Heating Solid Stack Materials

1
College of Electronics and Information Engineering, Sichuan University, Chengdu 610065, China
2
School of Electronic Information Engineering, China West Normal University, Nanchong 637002, China
3
State Key Laboratory of Efficient Utilization for Low Grade Phosphate Rock and Its Associated Resources, Wengfu Group, Guiyang 550014, China
*
Author to whom correspondence should be addressed.
Processes 2018, 6(11), 220; https://doi.org/10.3390/pr6110220
Submission received: 16 October 2018 / Revised: 27 October 2018 / Accepted: 29 October 2018 / Published: 7 November 2018
(This article belongs to the Special Issue Microwave Applications in Chemical Engineering)

Abstract

:
Microwave heating of solid stack materials is common but bothered by problems of uneven heating and electric discharge phenomena. In this paper, a method introducing fluid materials with different relative permittivity is proposed to improve the heating uniformity and safety of solid stack materials. Simulations have been computed based on the finite element method (FEM) and validated by experiments. Simulation results show that the introducing of fluid materials with proper relative permittivity does improve the heating uniformity and safety. Fluid materials with the larger real part of relative permittivity could obviously lower the maximum modulus value of the electric field for about 23 times, and will lower the coefficient of variation (COV) in general, although in small ranges that it has fluctuated. Fluid materials with the larger imaginary part of relative permittivity, in a range from 0 to 0.3, can make a more efficient heating and it could lower the maximum modulus value of the electric field by 34 to 55% on the whole studied range. However, the larger imaginary part of relative permittivity will cause worse heating uniformity as the COV rises by 246.9% in the same process. The computed results are discussed and methods to reach uniform and safe heating through introducing fluid materials with proper relative permittivity are proposed.

1. Introduction

Unlike traditional heating methods that heat materials by radiation, convection and conduction, microwaves heat materials through the direct interaction with the inner polar molecules and charged particles of materials [1]. Thus, characterized as efficient heating, volumetric heating and selective heating [2,3,4,5,6], microwave heating has been rapidly developed and applied in various areas.
However, there are also some natural drawbacks of microwave heating: (a) When heating materials by microwave, there exist “hot spots” and thermal runaway problems in the system temperature [7], which will cause degradation of the processing materials [8,9,10,11] and even cause burning and explosion of the microwave reactor and reactants [12,13]. (b) When dealing with numerous solid materials, their stacking in the heating cavity can easily result in some sharp edges, tips or submicroscopic irregularities, which may lead to electric sparks or electric arcs [14,15]. These electric discharges will affect the heating process and the product composition, and lead to safety problems when dealing with materials that have a low flashing point or in high temperature conditions [16,17].
For studies on microwave heating uniformity improvement, the common methods could be categorized into two aspects [18]: (1) To improve the uniformity of the electromagnetic field in the microwave cavity, such as optimization of microwave power feeding situations [19,20,21,22], introducing of mode stirrers [23,24], application of conductive matter [25,26] and optimization of heating chamber structure [27,28]; (2) to improve the uniformity of microwave energy absorption, such as introducing of a rotating turntable or conveyor belt [29,30], optimization of the shapes and sizes of processing materials [26,31,32]. For studies on the electric discharge phenomena, related research has focused on microwave discharges in sintering of powdered metals. Attention is mainly paid to factors that influence the intensity and frequency of microwave discharges, such as the magnetron output power [14,33], the size, amount, conductivity, morphology and surface conditions of the metal [14,33,34,35] and the dielectric properties of the surrounding medium [15,35,36,37]. The lack of comprehensive consideration of the heating uniformity and safety of microwave heating solid stack materials has hindered the further application of microwave heating.
In this paper, a method to improve the heating uniformity and safety of microwave heating solid stack materials by introducing fluid materials with different dielectric properties is proposed. In Section two, a general model is built and computed with coupled physics of electromagnetic and heat transfer in solid and liquid. Based on simulation conditions, corresponding physical experiments are designed to complete the validation work. In Section three, comparisons between experimental results and computational ones are performed. Following the analysis of the influence of fluid materials’ complex relative permittivity on the heating process, solutions to uniformity and unsafety issues are discussed.

2. Methodology

2.1. Multiphysics Simulation
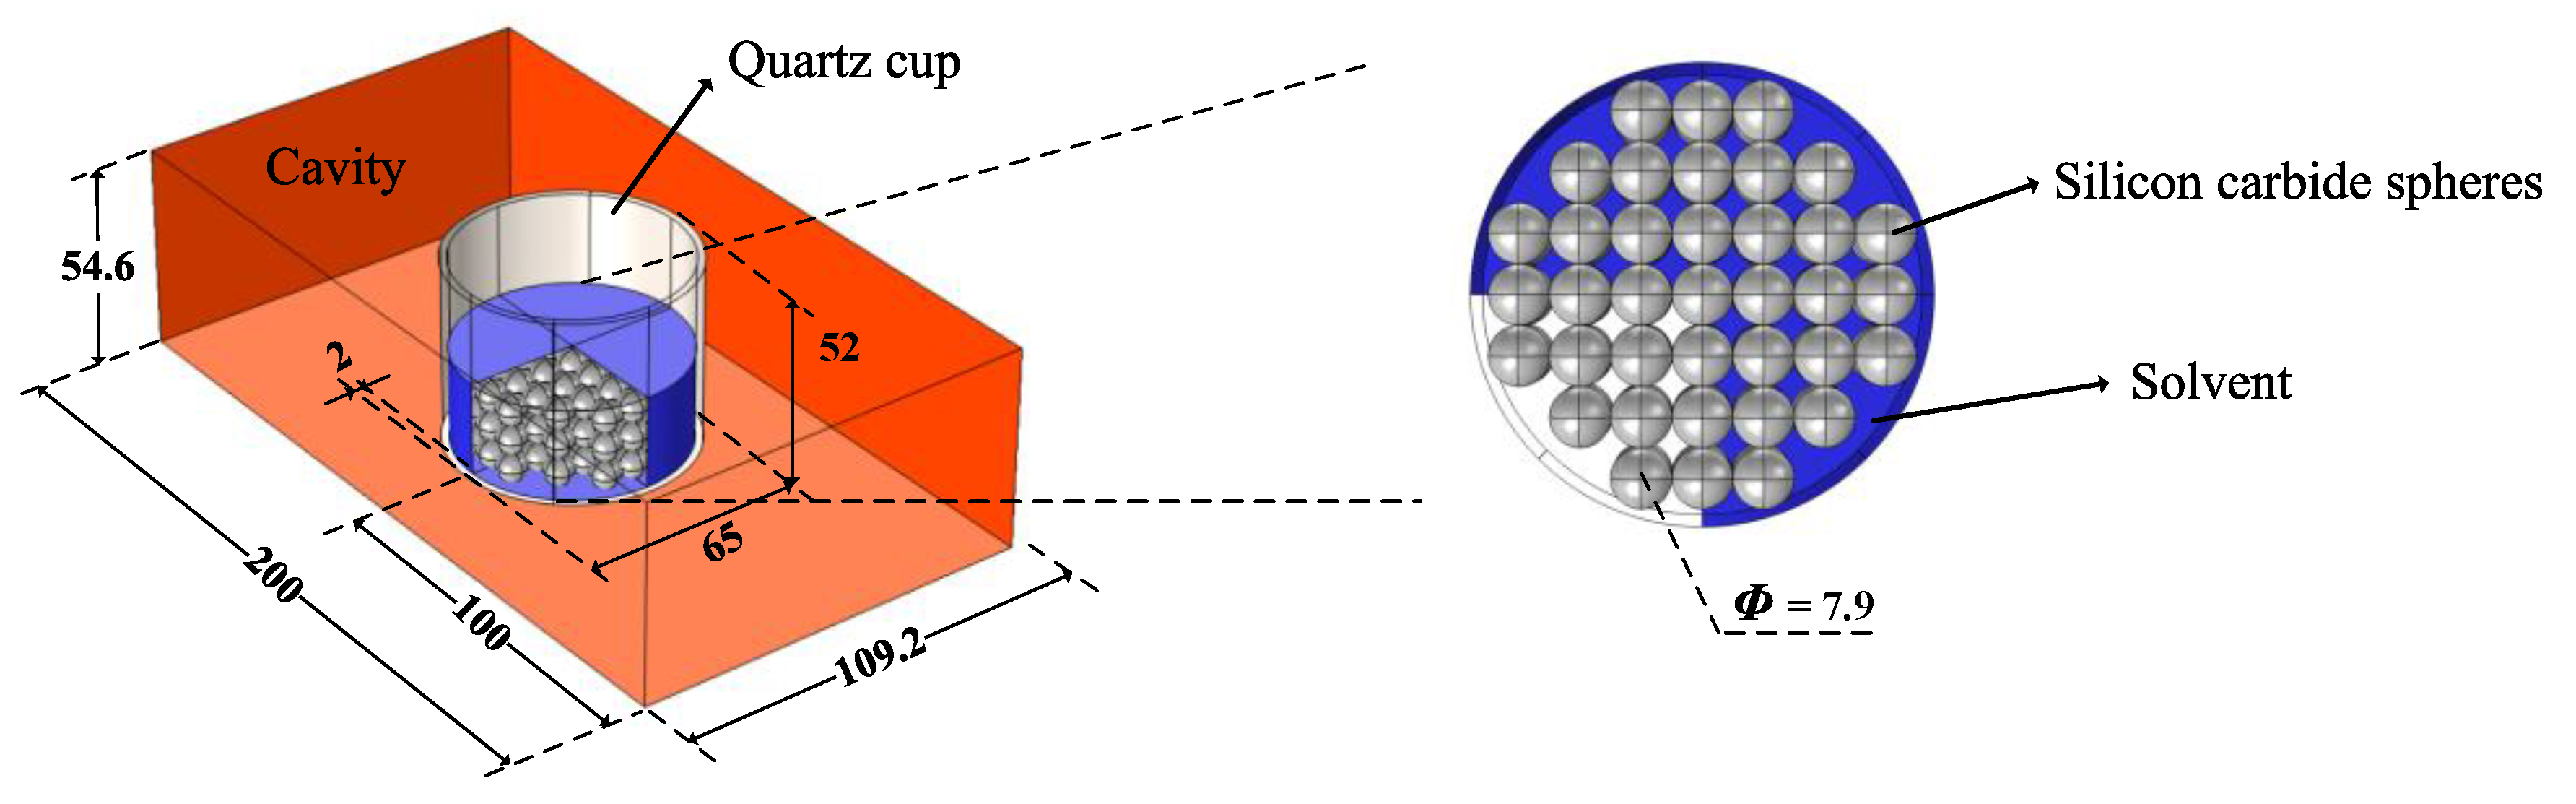
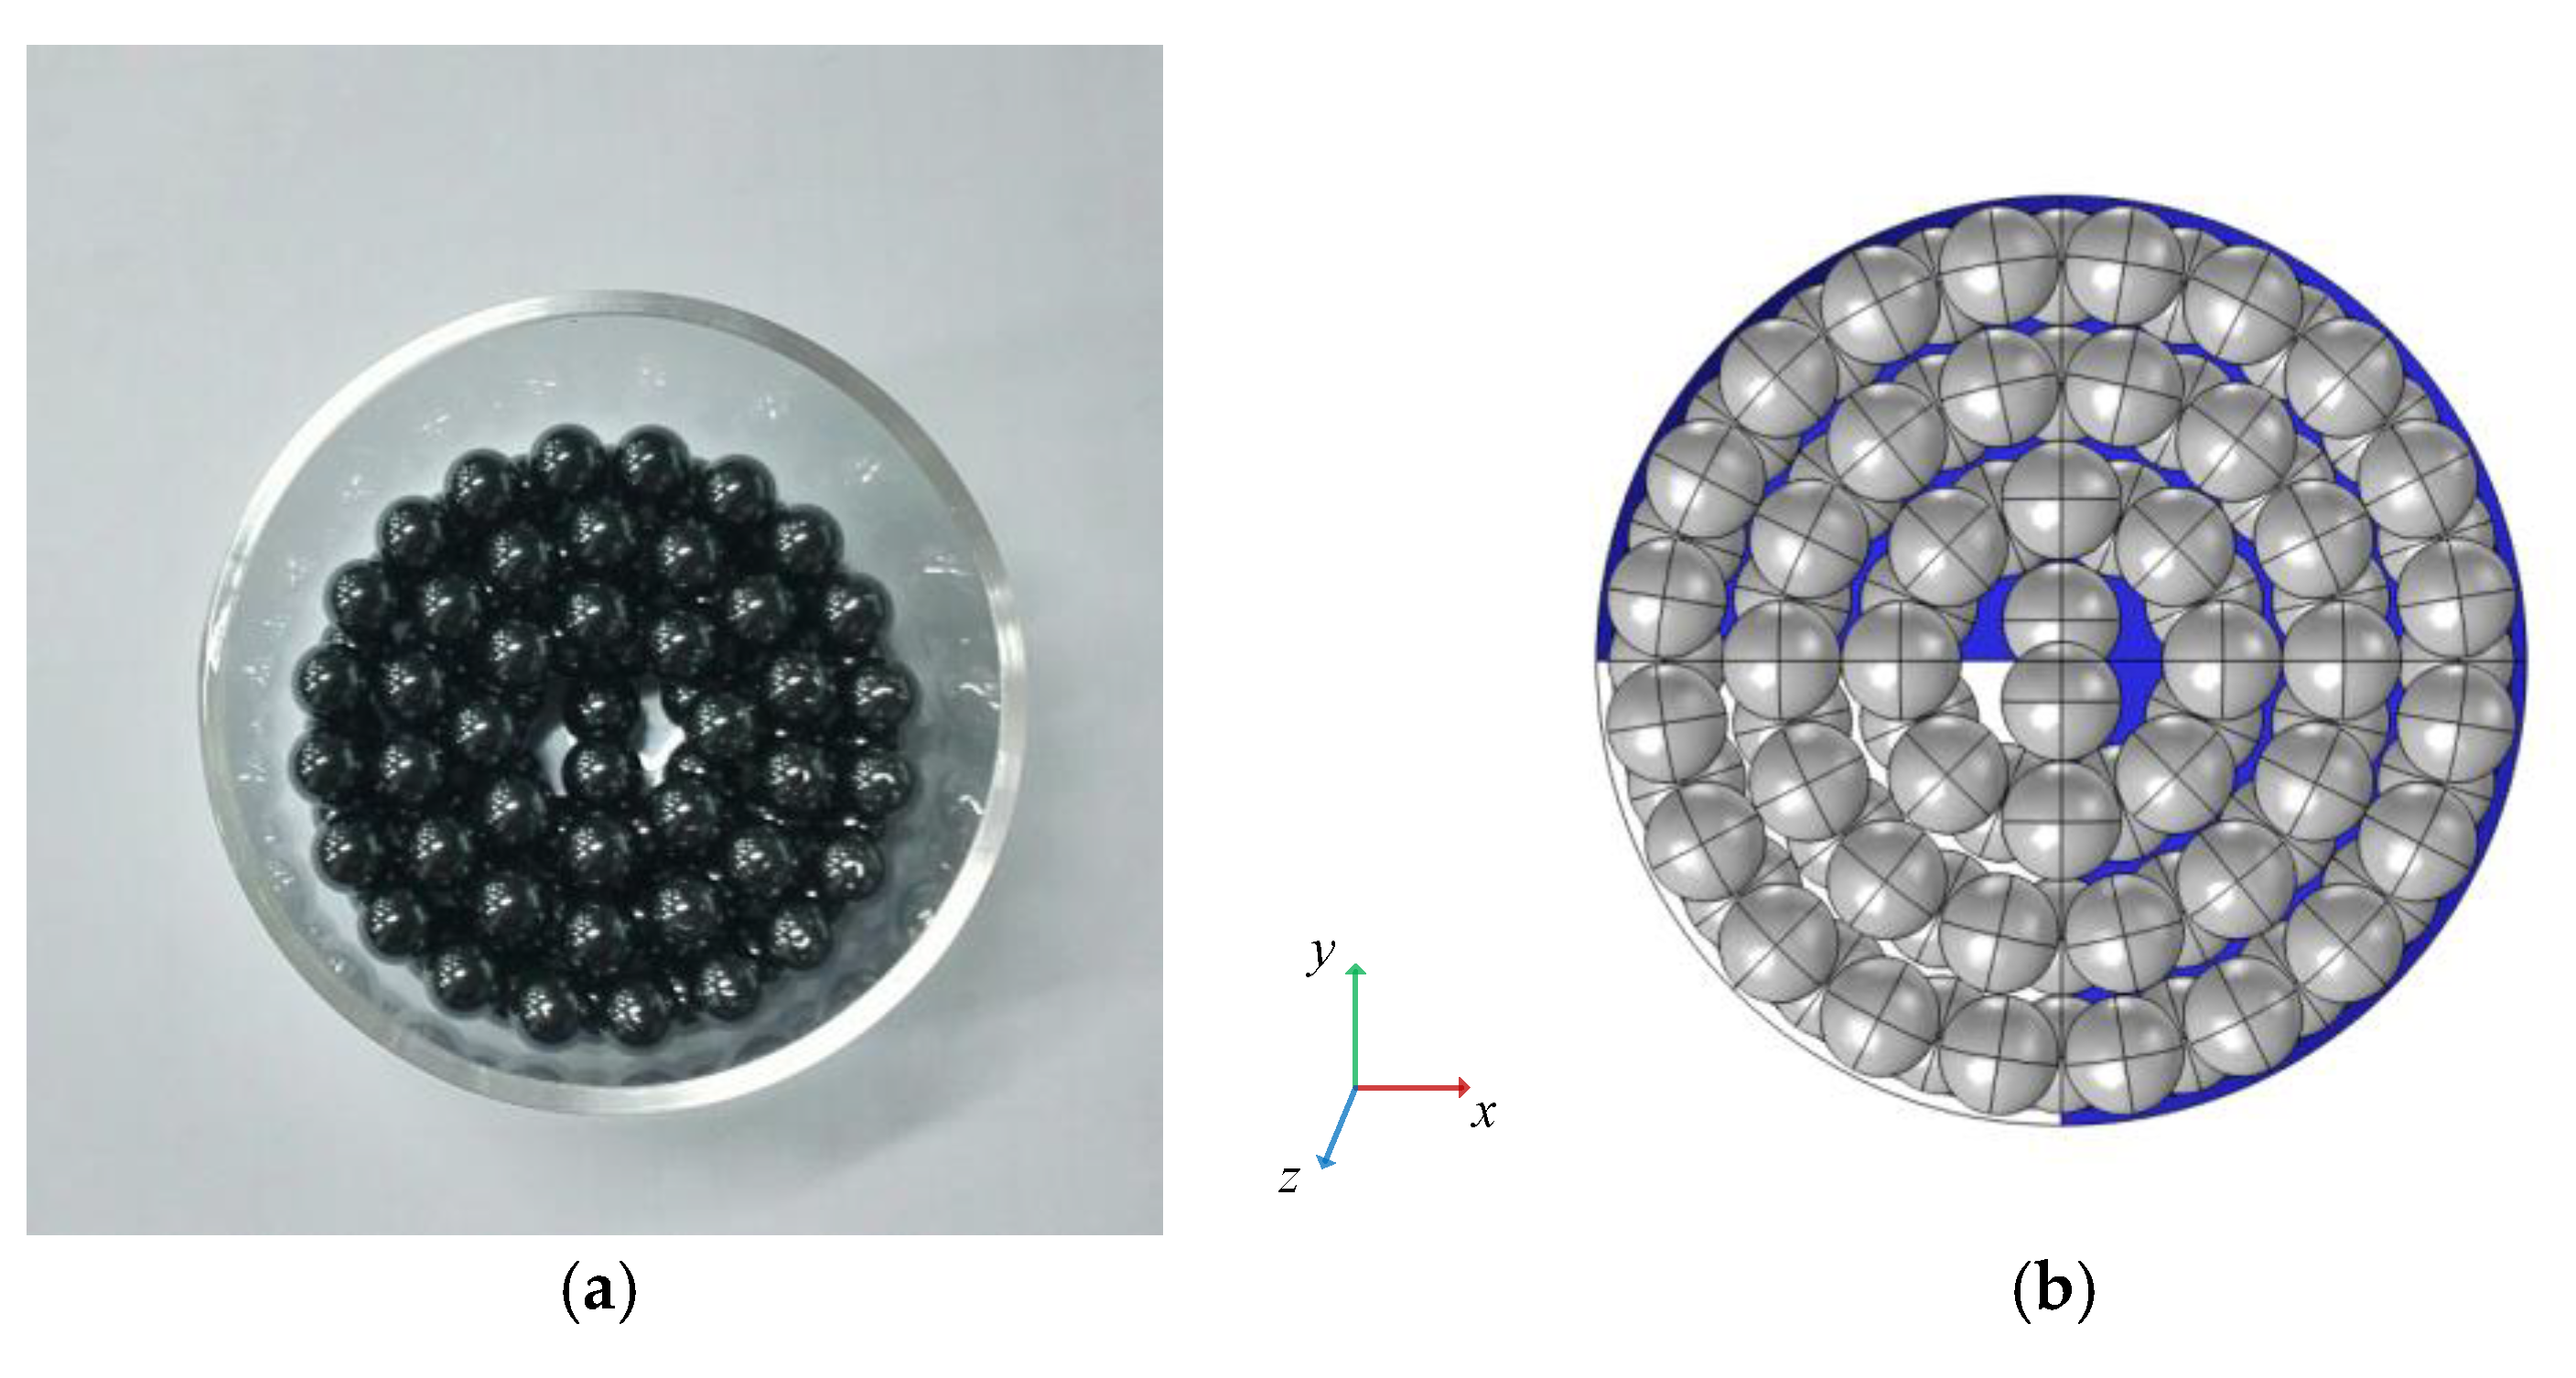
2.1.1. Geometry

To build the general model for analyzing, the simulation model should be characterized with a simple structure and be intuitive to show the difference of heating results. Hence, a standard BJ22 waveguide with one end shortened is used as the heating cavity. The processing materials, silicon carbide spheres, and the fluid materials are placed in the cavity in a quartz cup. The model structure is built in a multi-physics software, COMSOL Multiphysics (5.3, COMSOL Inc., Stockholm, Sweden), which is shown in Figure 1.

2.1.2. Governing Equations

The whole simulation is coupled of two physical processes: The microwave propagation process and heat transfer in solid and liquid process.
For the microwave propagation process, Maxwell’s equations are used to solve the distribution of the electric field. The governing equations here are given as:
× H = J + ε E t × E = B t B = 0 D = ρ e
where H is the magnetic field intensity, J is the ampere density, E is the electric field intensity, t is the time, B is the magnetic induction intensity, D is the electric displacement vector and ρe is the electric charge density. Equation (1) in the time harmonic field can be then written as the Helmholtz equation [38]
× μ r 1 ( × E ) k 0 2 ( ε r ε 0 j σ ω ) E = 0 k 0 = ω ε 0 μ 0
where μr is the relative permeability, k0 is the wave number in free space, εr is the relative permittivity, ε0 is the permittivity of vacuum, ω is the angular frequency, σ is the electrical conductivity and μ0 is the permeability of vacuum.
Then, the electromagnetic power loss Qe of the processing materials can be gained from the computed electric field by the following equation [39,40]
Q e = 1 2 ω ε 0 ε tan δ | E | 2 = 1 2 ω ε 0 ε | E | 2  
where ε is the real part of the relative permittivity, ε is the imaginary part of the relative permittivity and tan δ is the loss tangent of the processing materials.
For the heat transfer process, only the processing materials are involved to reduce the computation cost. The governing equation for heat transfer in solid and fluid is given as [41,42,43]
ρ C p T t k 2 T = Q = Q e  
where ρ is the material density, Cp is the material heat capacity under atmospheric pressure, T is the temperature, Q is the heat source and k is the thermal conductivity.

2.1.3. Input Parameters and Boundary Conditions
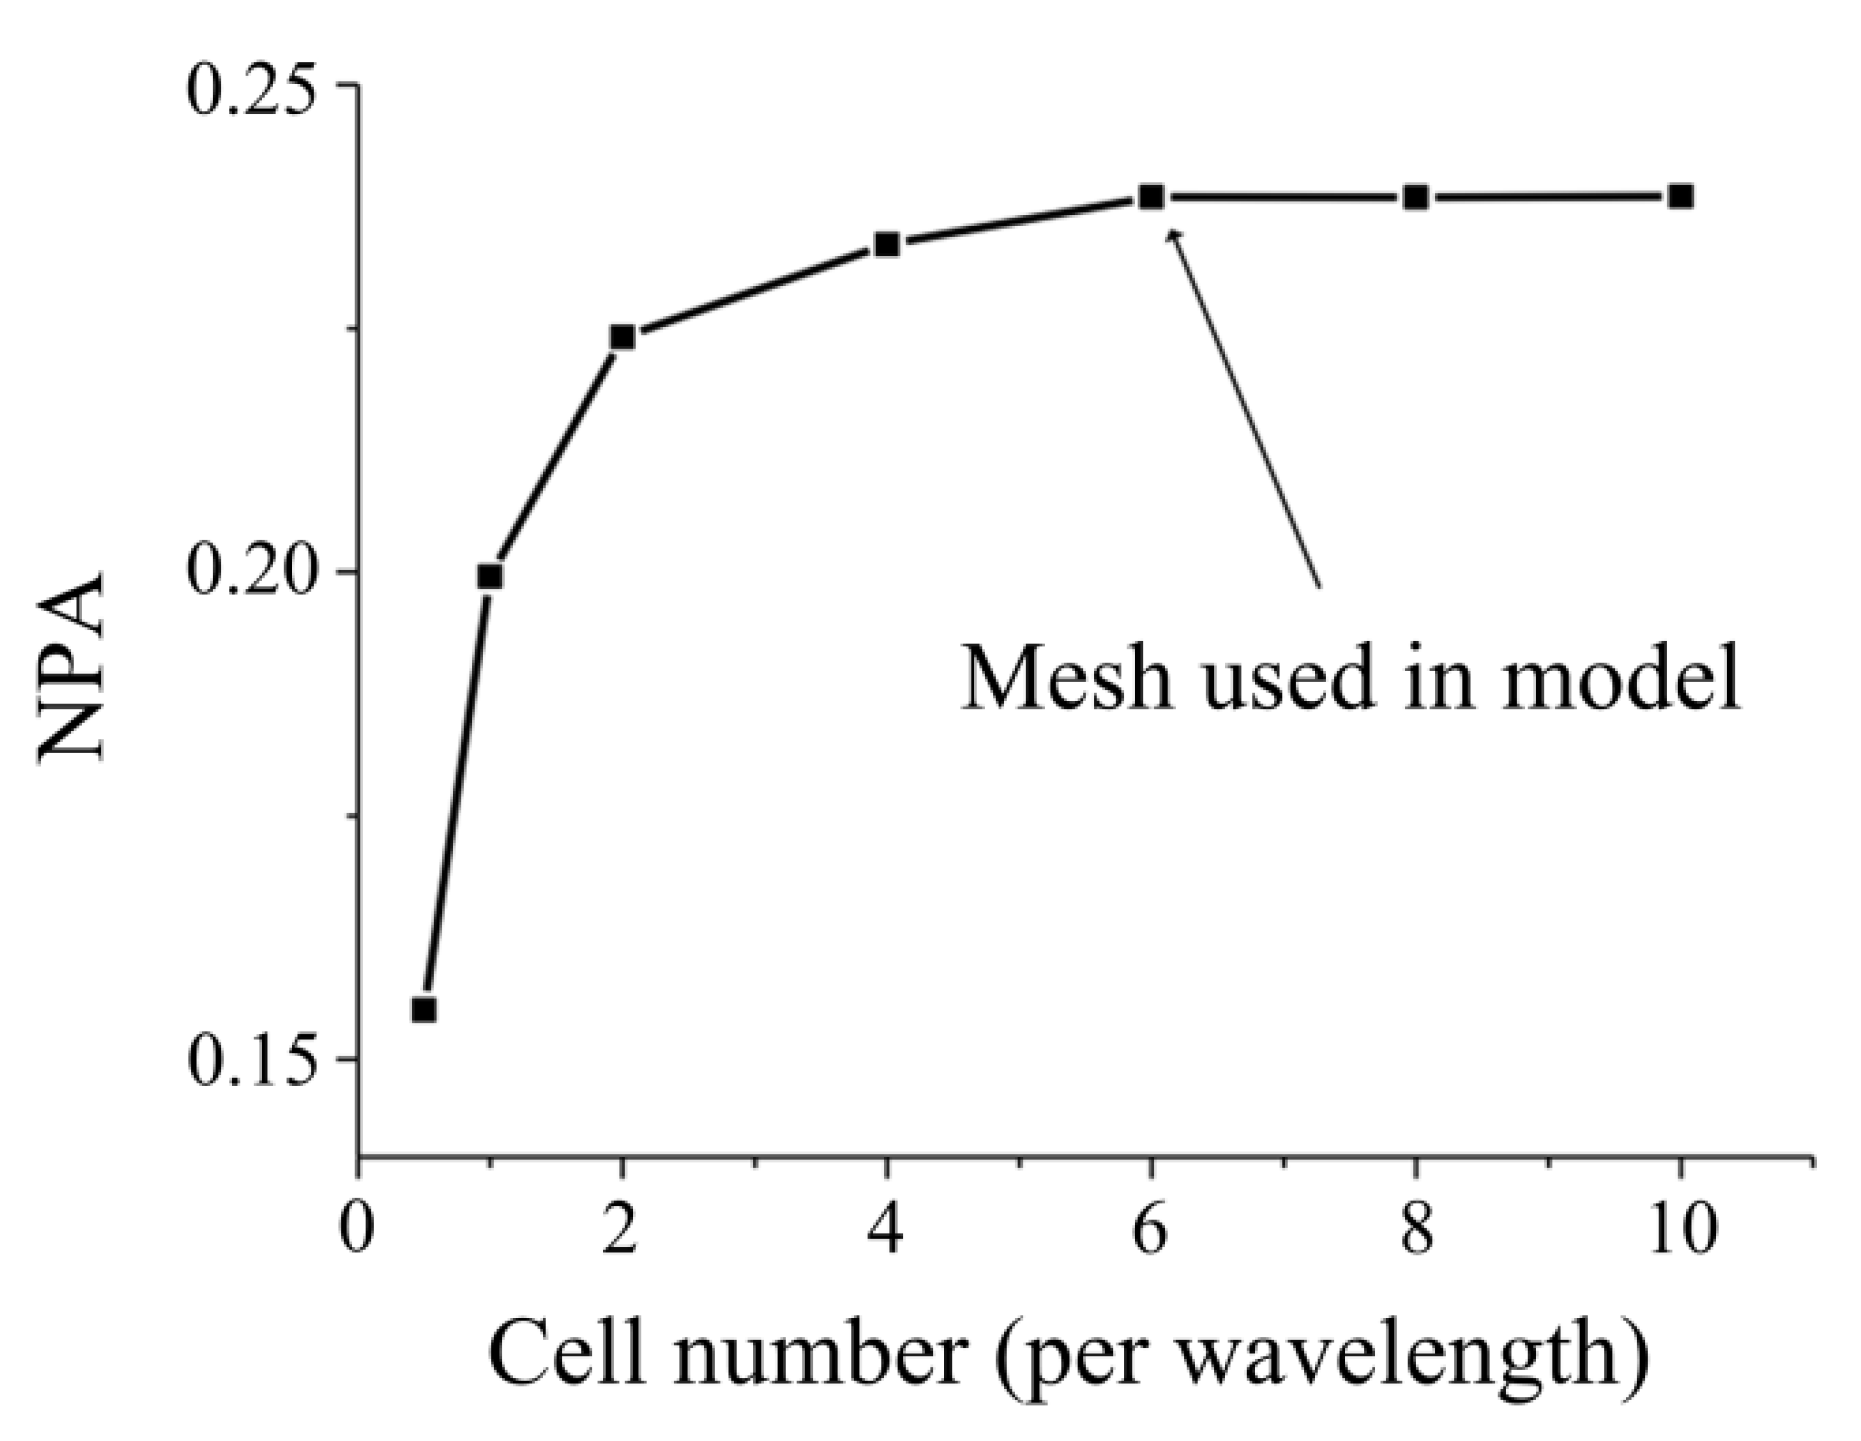
To complete the simulation, necessary property parameters and boundary conditions are needed. Related input parameters are shown in Table 1. The thermal and dielectric properties of the processing materials are obtained from related literature [44,45,46,47] and modified by comparisons between experimental results and simulation results. The loss tangent of water (deionized), glycerol (analytical reagent, Yangzhou Feiyang chemical industry Co., Ltd, Yangzhou, China) and silicon carbide (99% purity, Hai Ning Zhijie pottery bearing Co., Ltd, Haining, China) is compared through the references [44,45,46] and the experiments at different temperatures, and the optimized data is chosen. It should be noted that the conductivity of silicon carbide is included by the loss tangent. The complex relative permittivity is defined as the processing materials to give a near-actual model, which is expressed as [48].
ε r = ε ε = ε ( 1 j tan δ )  
For the microwave propagation process, one surface of the cavity is selected as the port where it feeds the electromagnetic energy at 2450 MHz in TE10 mode. Other surfaces are all defined as a perfect electric conductor, which can be expressed as the equation:
n × E = 0  
where n is the unit normal vector of the corresponding surface.
For the heat transfer process, as only the processing materials are involved, all boundaries of the processing materials are defined as the thermal insulation boundary condition. The governing equation is given as
n q = 0  
where q is the heat flux.

2.1.4. Mesh Size

Appropriate mesh size in the model simulation can provide accurate simulation results with higher computation efficiency. The space discretization errors could be down to a quarter when mesh size is halved, while the computation time will increase by almost 16 times [49].
To determine the appropriate mesh size in our model, normalized power absorption (NPA) of the processing materials has been employed to complete the mesh independent study [37]. Here, the variation of NPA with mesh sizes is shown in Figure 2. The manual of software QuickWave (QWED, Warsaw, Poland) suggests there to be 12 cells per wavelength for mesh independent results while other researchers [50] suggest 10 cells per wavelength is enough. The mesh size used in this paper is defined as
m m e s h s i z e c 6 f ε r  

2.1.5. Simulation Process

In the simulation, the electromagnetic field distribution is firstly calculated in the frequency domain, and then the dissipated power is calculated. Finally, the temperature rise of the material is updated through the heat transfer equation in the time domain. Since the electrical properties of samples do not vary with temperature, the electromagnetic field distribution will not change and is only calculated once. The whole heating process lasts 120 s, and the computation time of the model depends on the mesh size and the memory of the computer. In this simulation, the mesh sizes of the model with water and model with glycerol are 808,998 and 455,672, respectively. The computation time of each model is 7317 s and 3354 s in a computer with a memory of 128 GB.

2.2. Experimental Setup

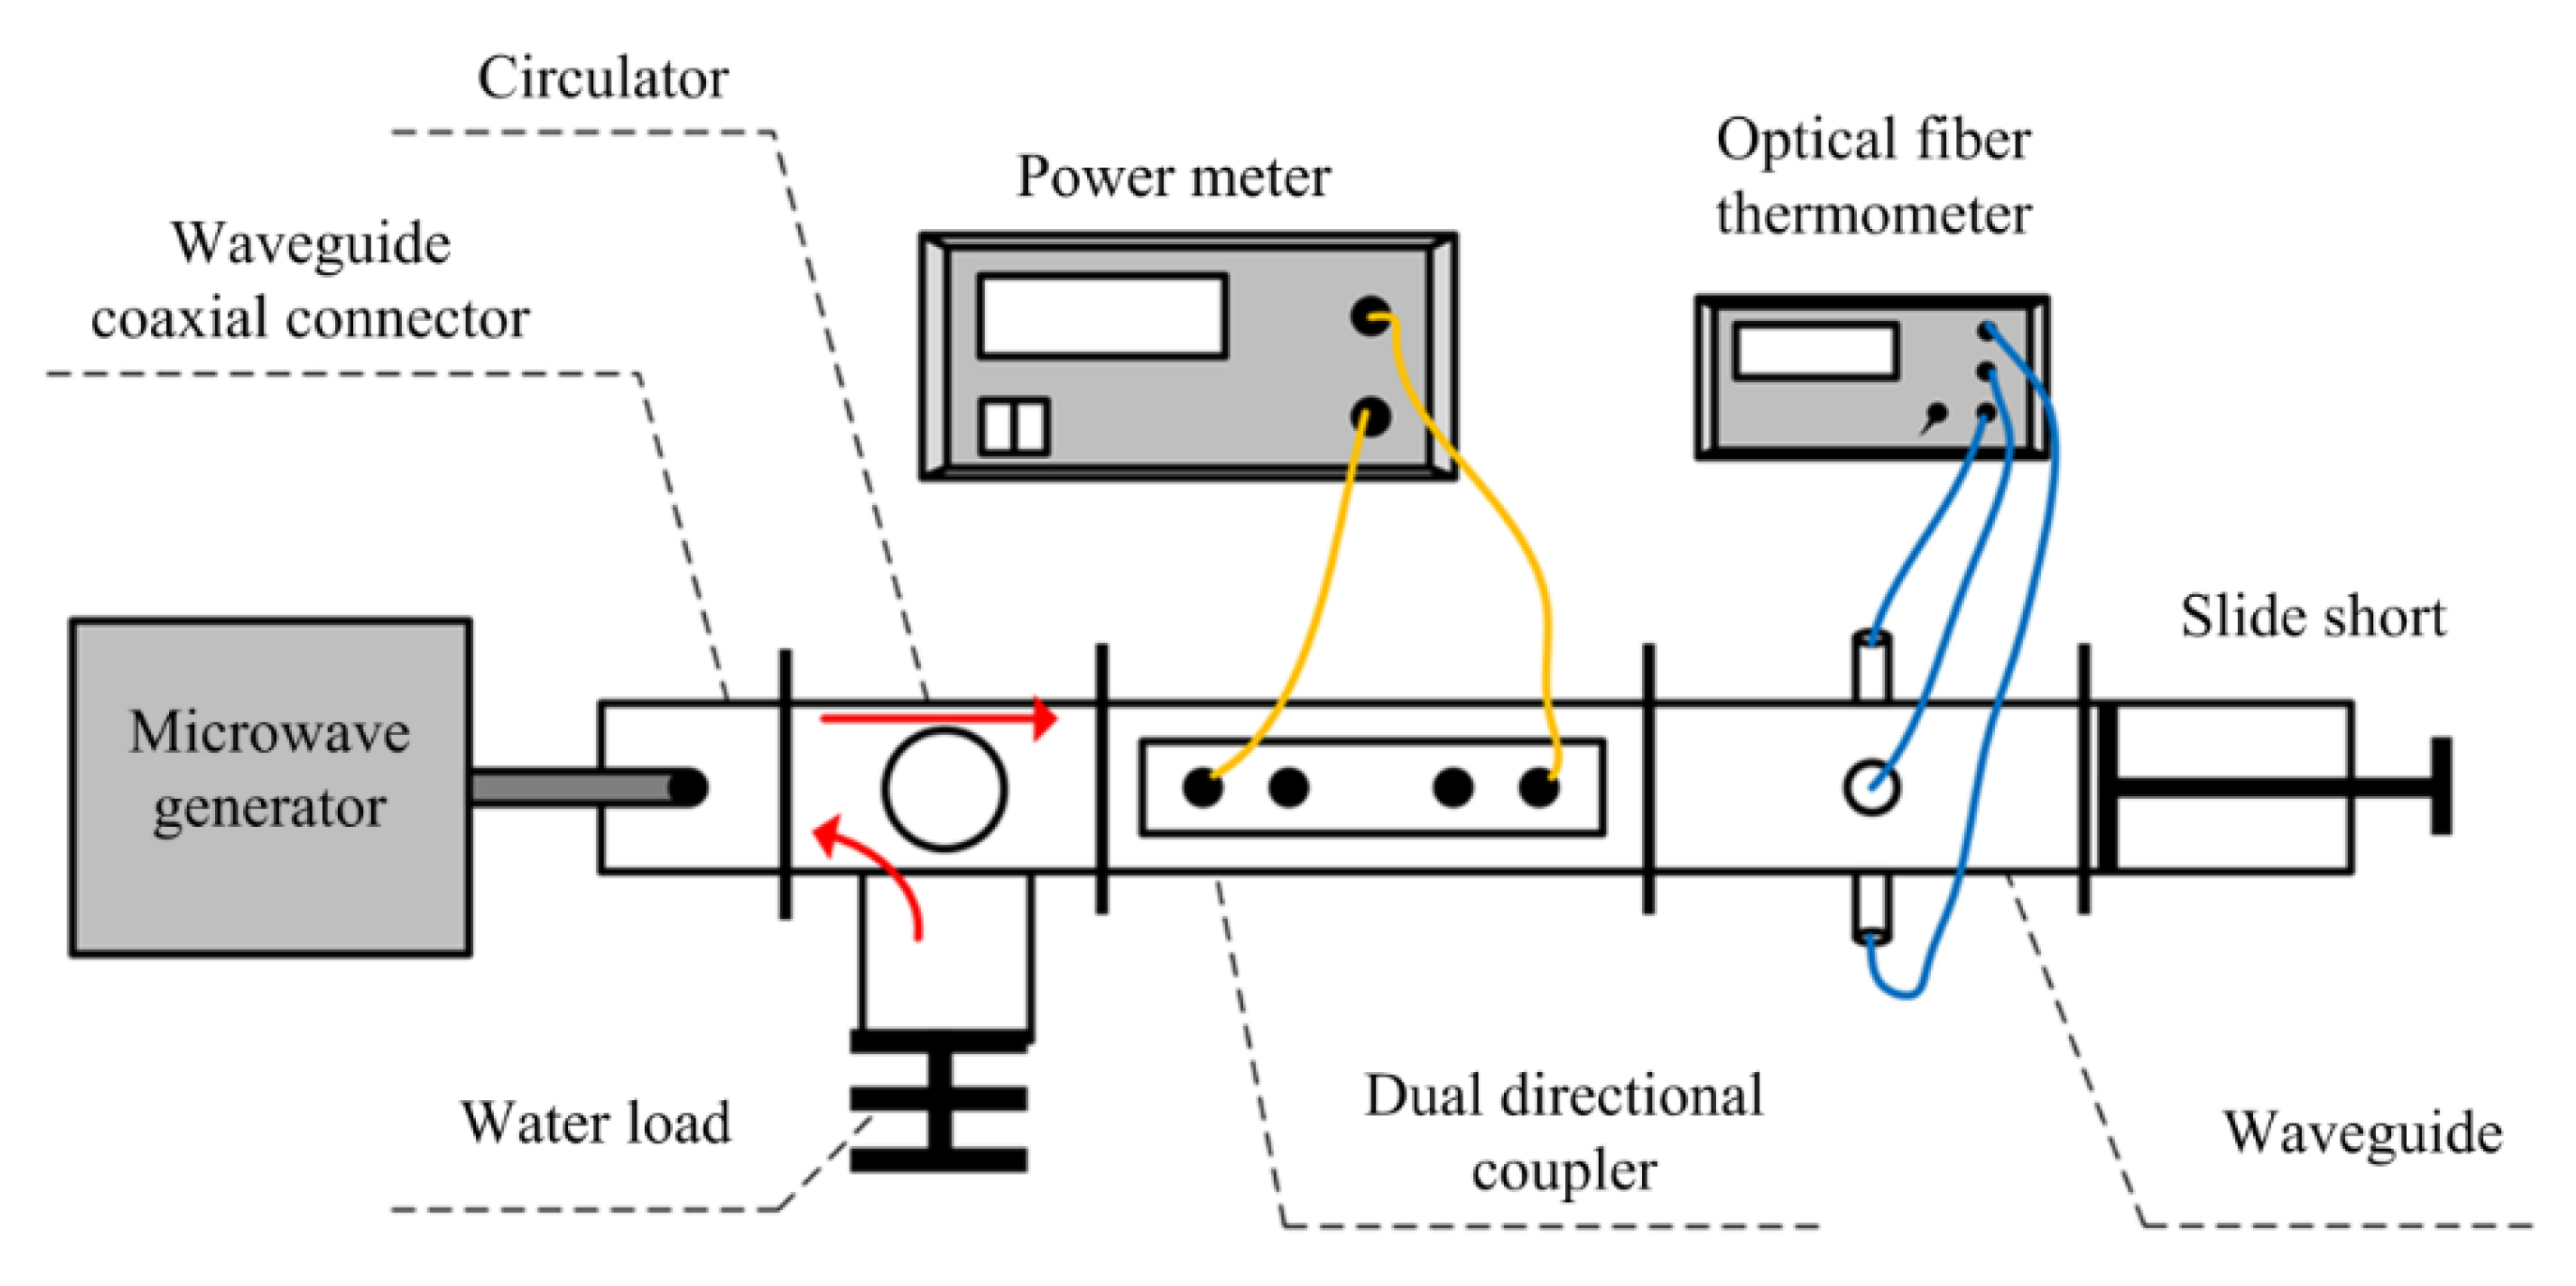
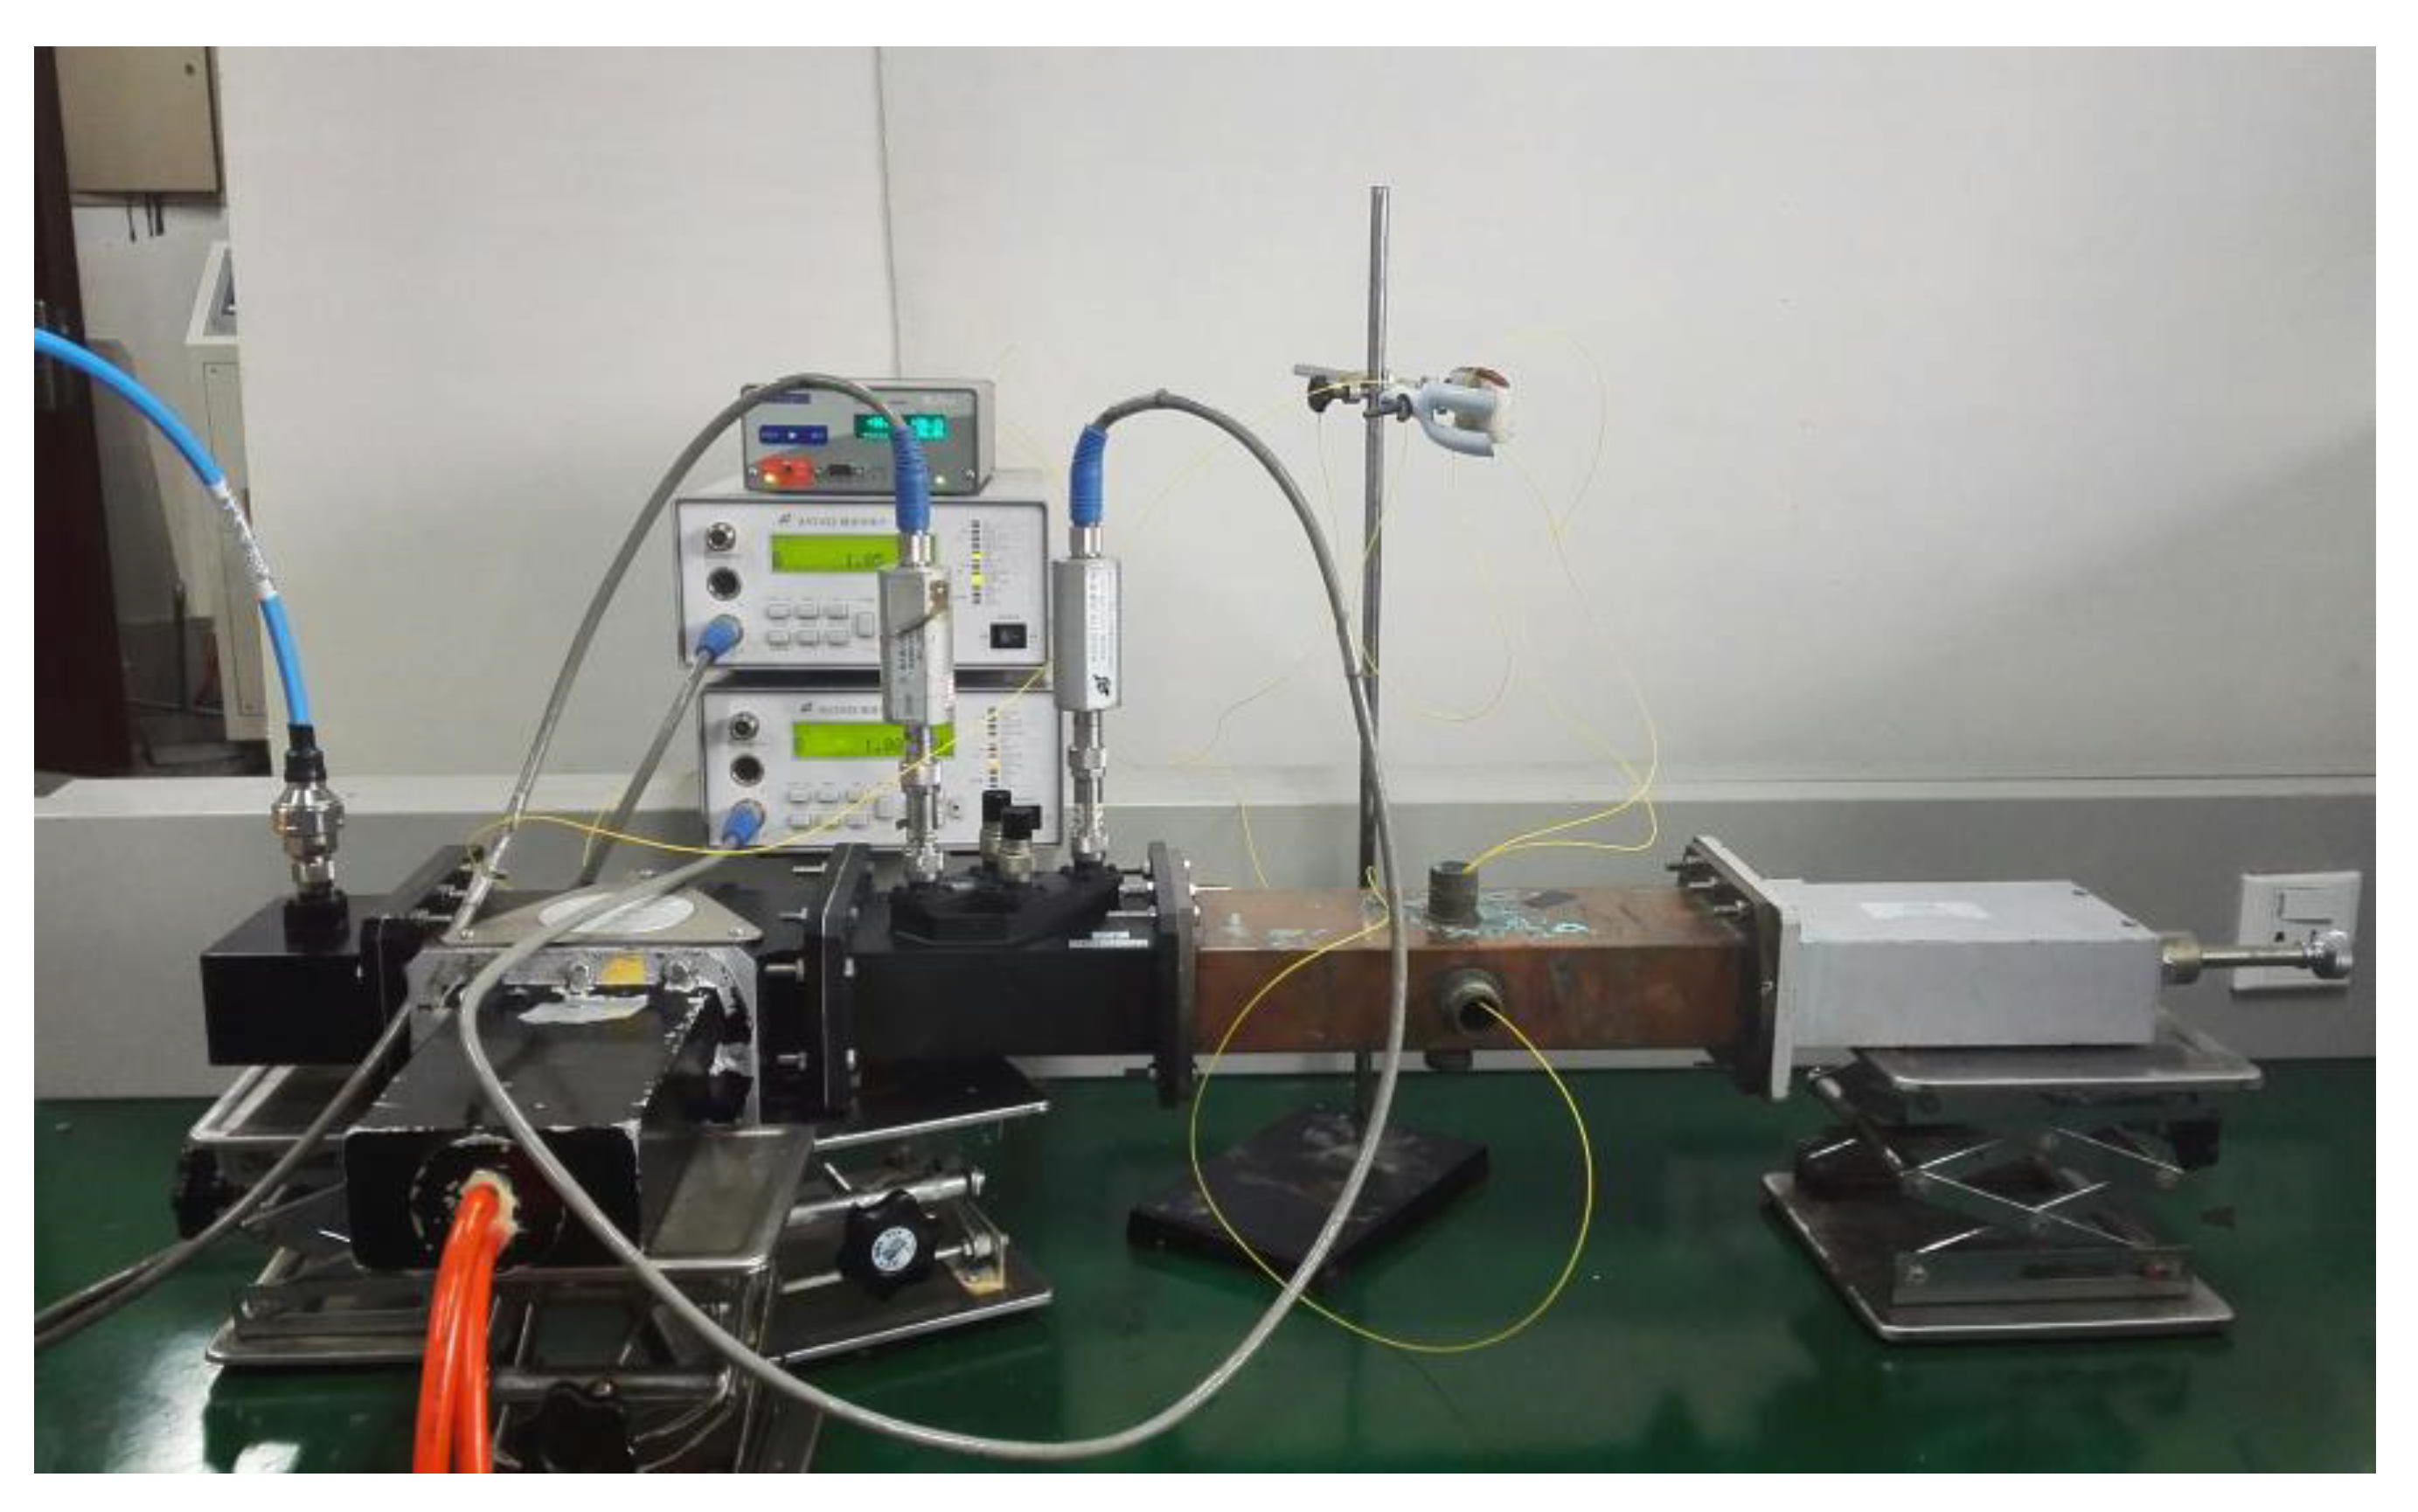
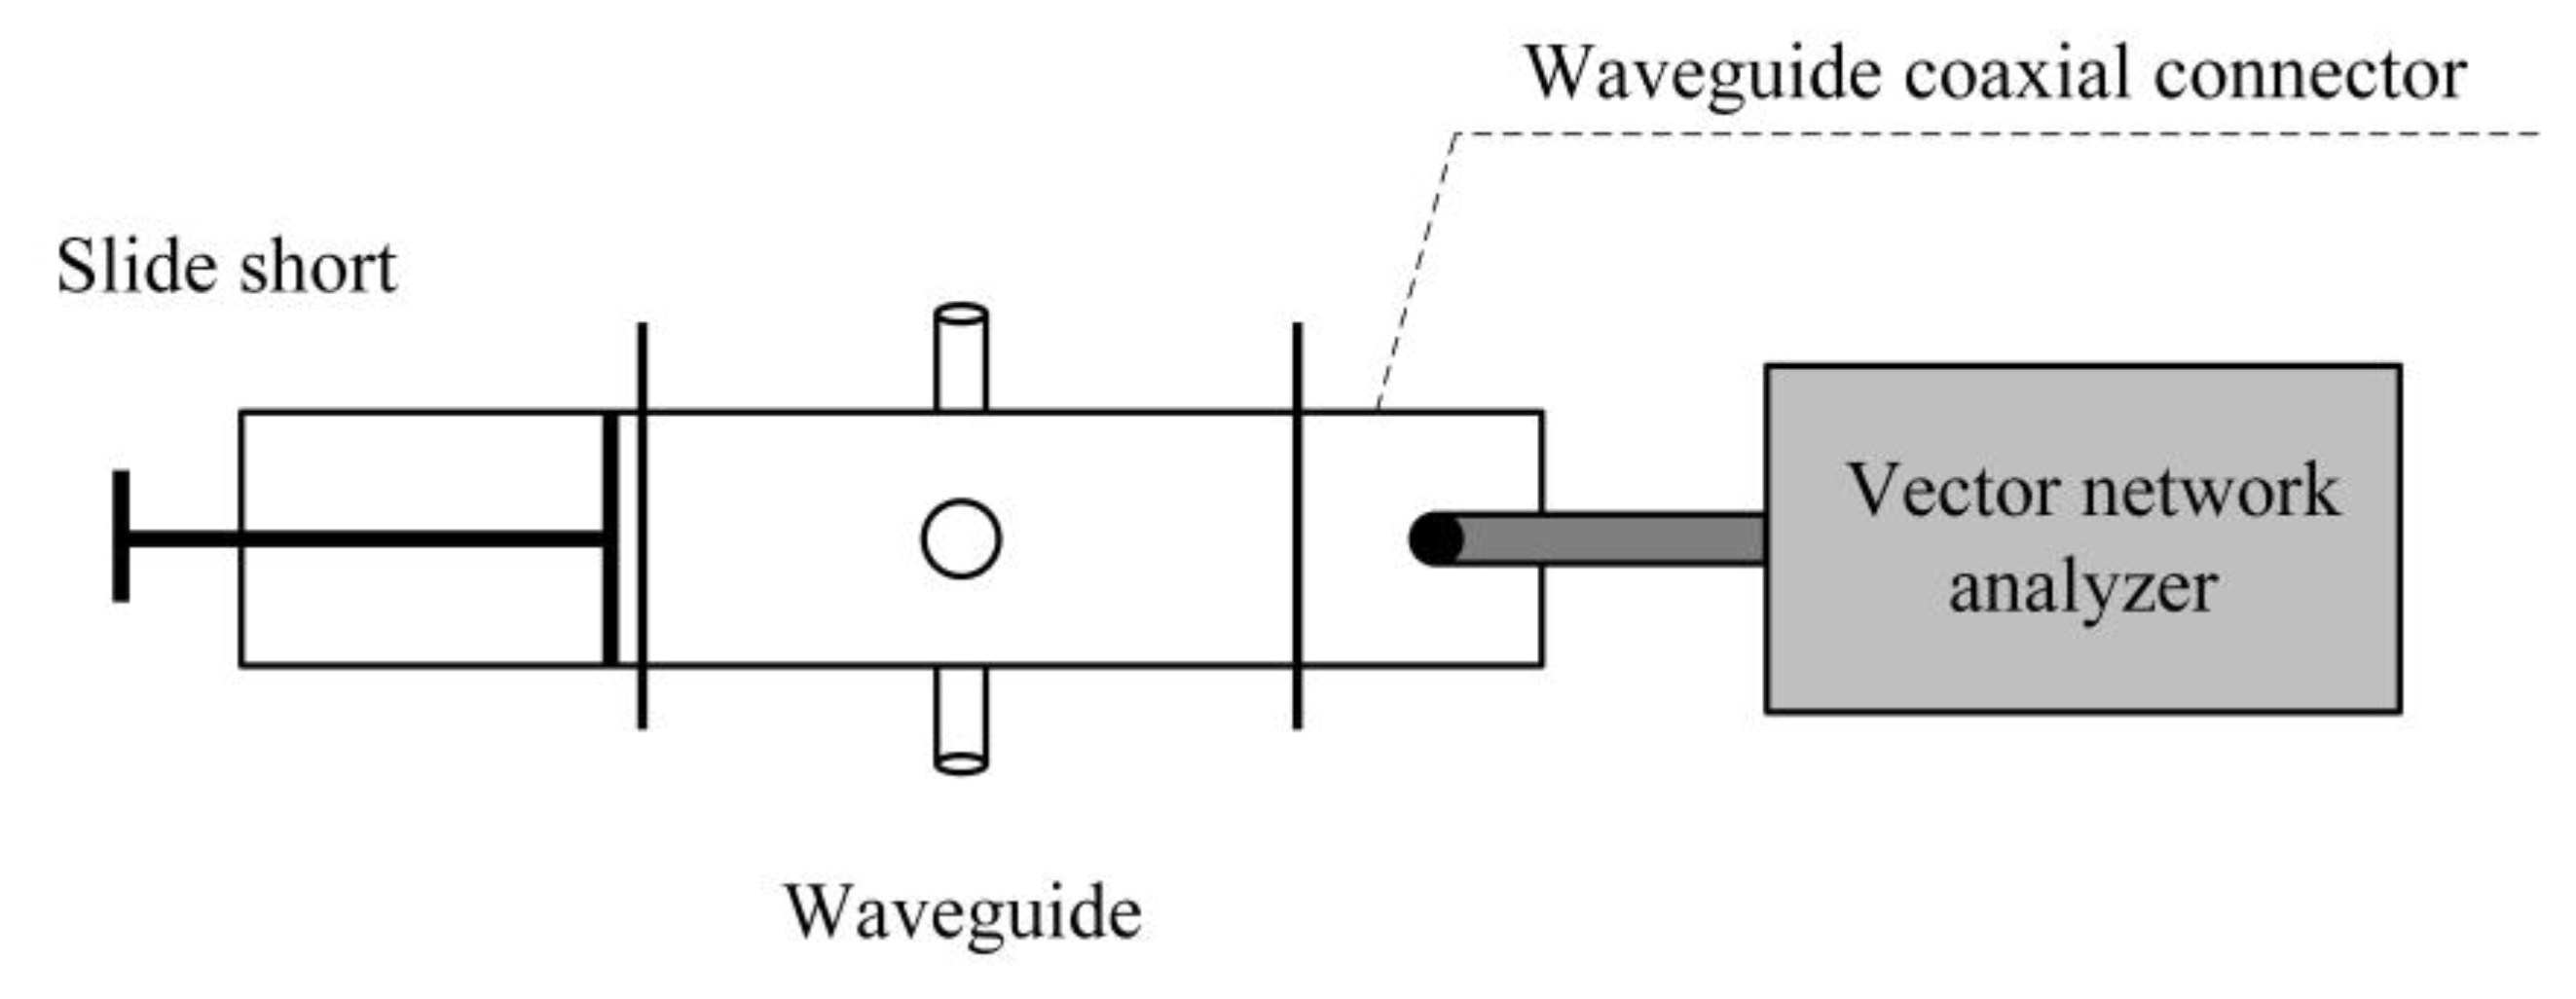
2.2.1. Experiment System

To validate the computation results, physical experiments need to be completed. The whole experimental system is shown in Figure 3 and Figure 4. Microwave power is generated from a microwave generator (WSPS-2450-1000M, Wattsine, Chengdu, China) to a waveguide coaxial connector (CAWG-26-N, Euler, Nanjing, China). A circulator connected with water load is employed to protect the source from the reflection power. With a dual directional coupler and a power meter (AV2433, the 41st Institute of CETC, Tsingtao, China) as power monitoring, microwave power is finally fed into the BJ22 waveguide connected with a slide short. Final heating temperature is gained by a fiber optic thermometer (FISO FOT-NS-967A, FISO Technologies, Quebec, QC, Canada).

2.2.2. Experimental Procedures

Physical experiments are carried out with 55 W microwave power at 2.45 GHz. For temperature measurements, several fibers of the fiber optic thermometer have been used and connected to the processing materials through the cut-off waveguide on the BJ22 waveguide. For power measurements, a power meter is employed to verify the incidence and reflection situation of the microwave power. To give more evident temperature rise and make the experiment easier, the length between the quartz cup and the slide short is set as λe, which is defined as
λ e = 3 2 λ 1 ( f c f ) 2 , λ = c f  
where λ is the wavelength of the microwave in vacuum, fc is the cut-off frequency of the BJ22 waveguide, f is the frequency of the microwave. The corresponding modification of the experimental length of the BJ22 waveguide is realized by the slide short. A simple test system, shown in Figure 5, is performed to adjust the position of the slide short. By combining the S11 gained from the vector network analyzer (N5230A, Agilent Technologies Inc., Santa Clara, CA, USA), the position of the slide short is confirmed to match the simulation.

3. Results and Discussion

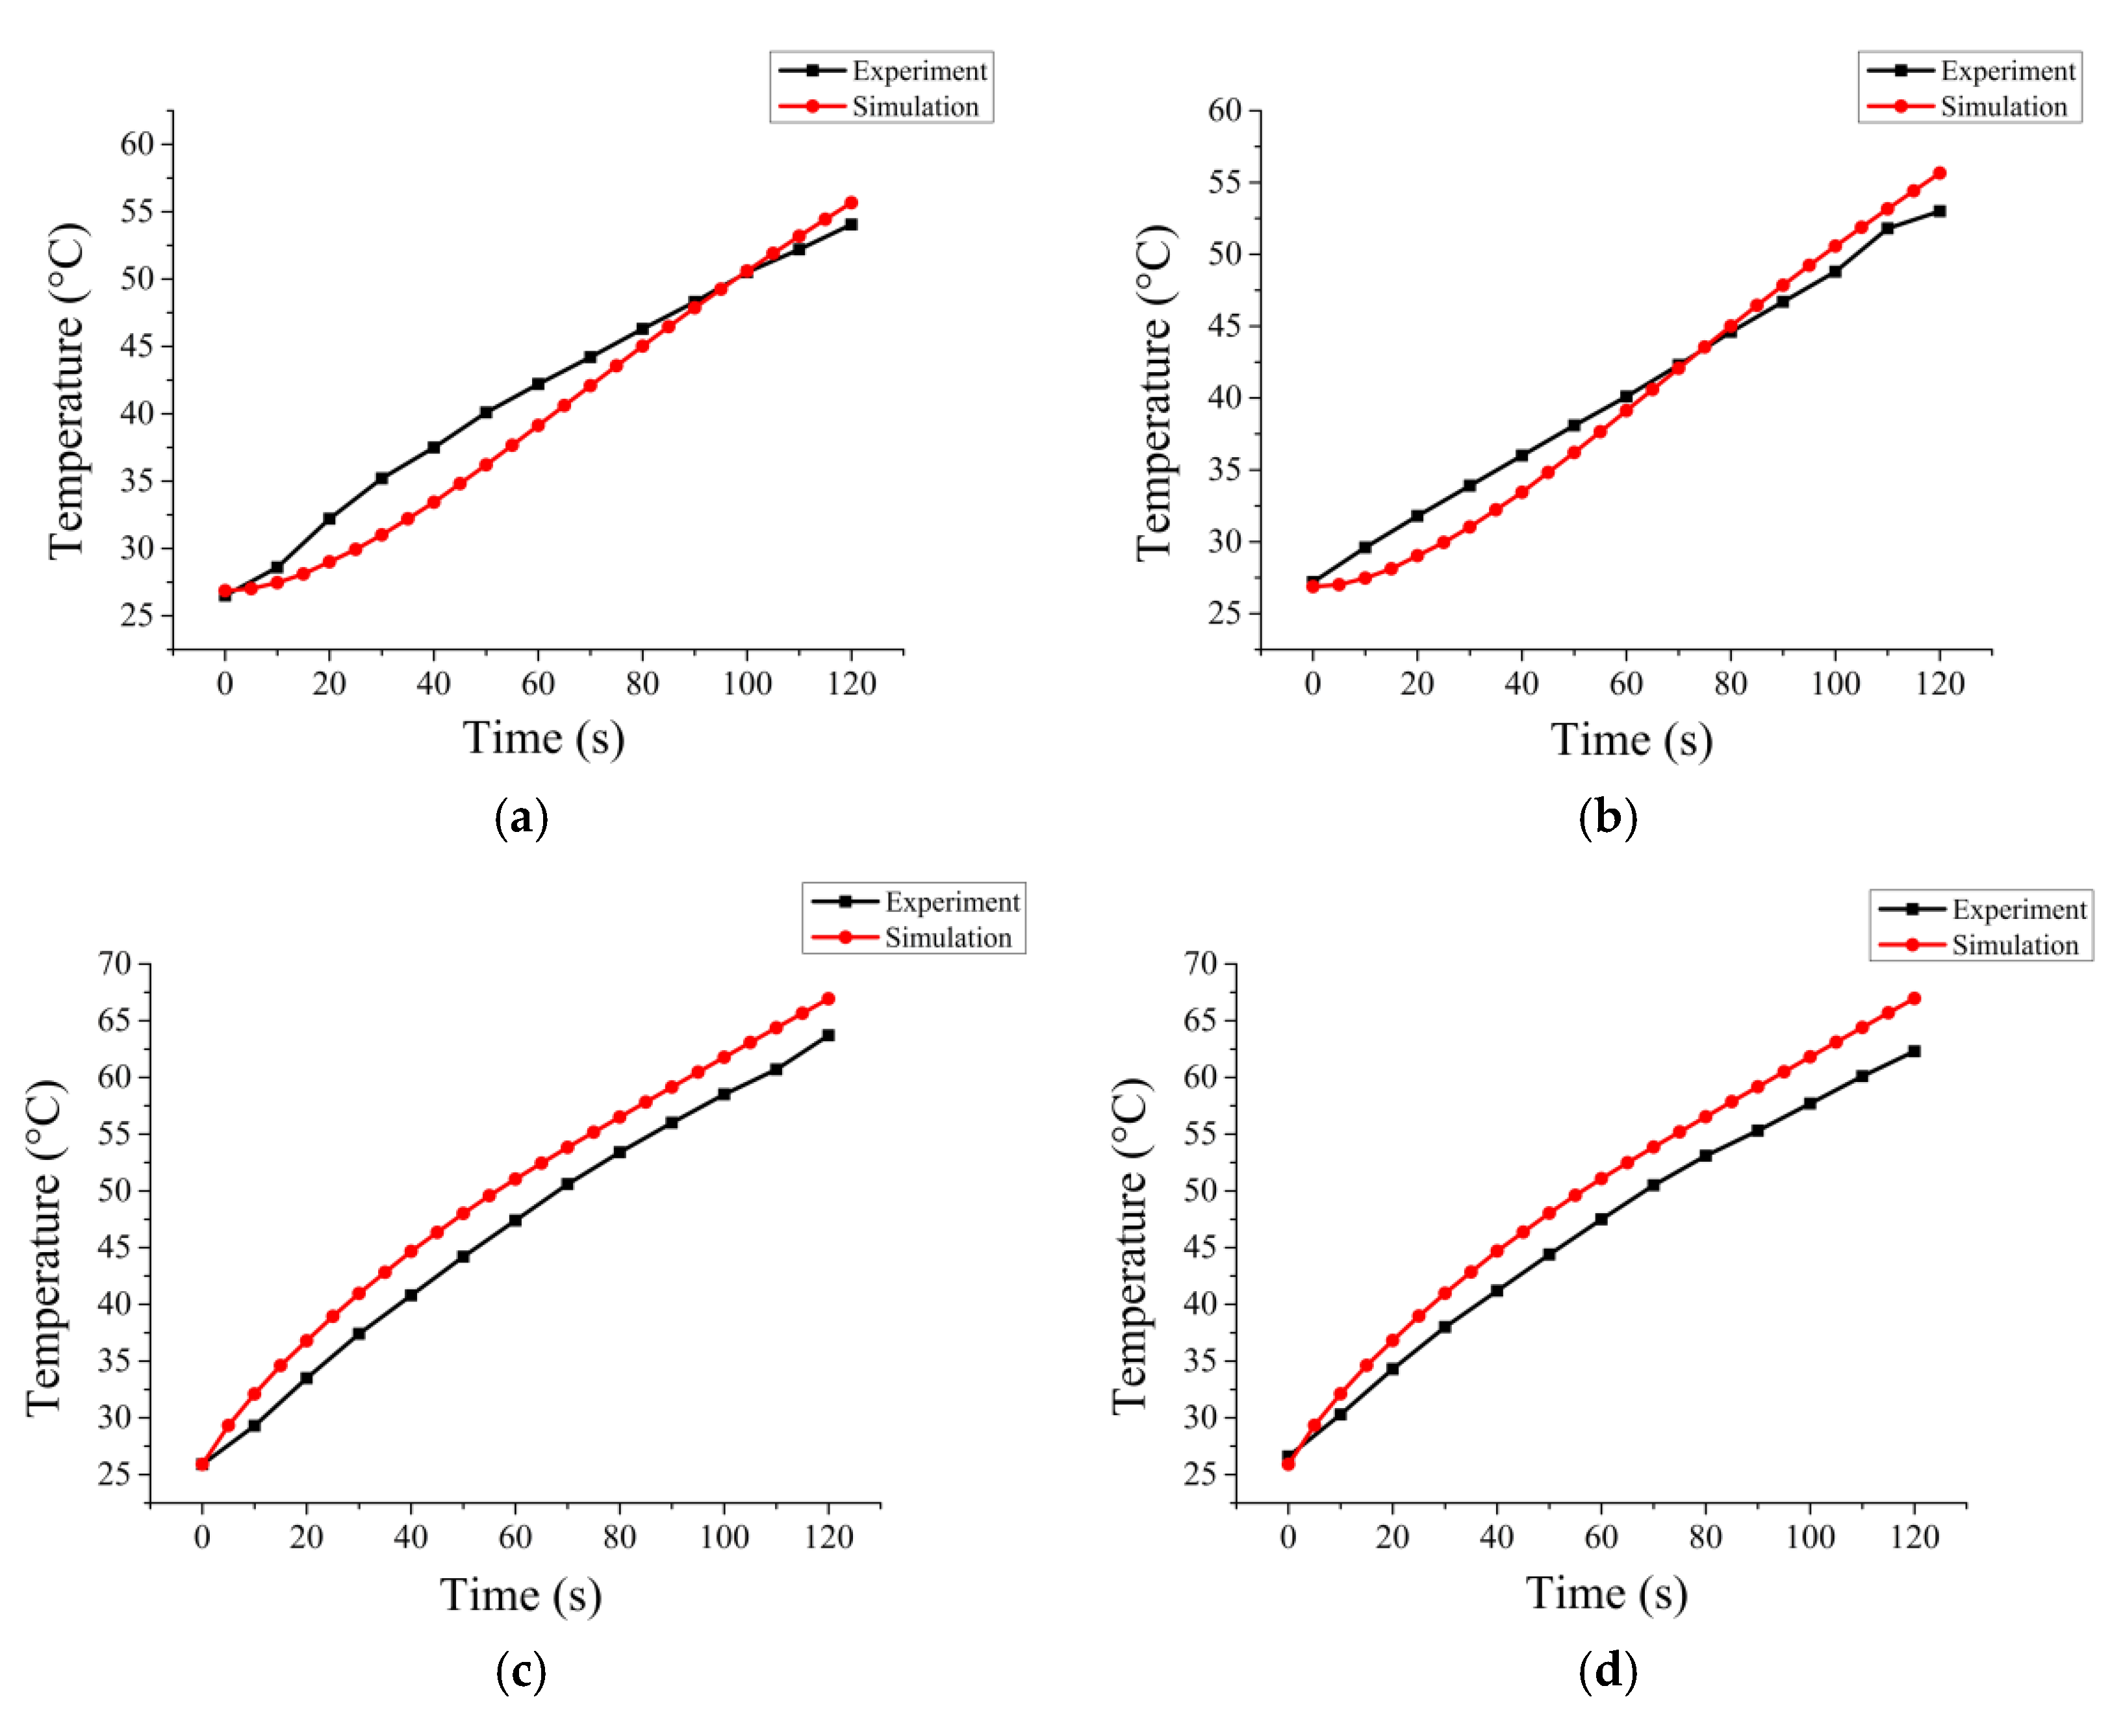
3.1. Experiment Validation

To validate the simulation results, one experiment group with water as the polar solvent while another with glycerol as the non-polar solvent is employed. In the experiments, the silicon carbide spheres are actually placed in a two-layer structure as shown in Figure 6. The same adjustment has been done to the corresponding simulation model.
Two points of the processing materials have been chosen to perform the temperature variation comparisons between the experiment and the simulation (shown in Figure 7). The center bottom of the quartz cup is selected as the origin of the axes and directions of the axes are shown in Figure 6b. Comparisons show that simulation results match the experiential results well.

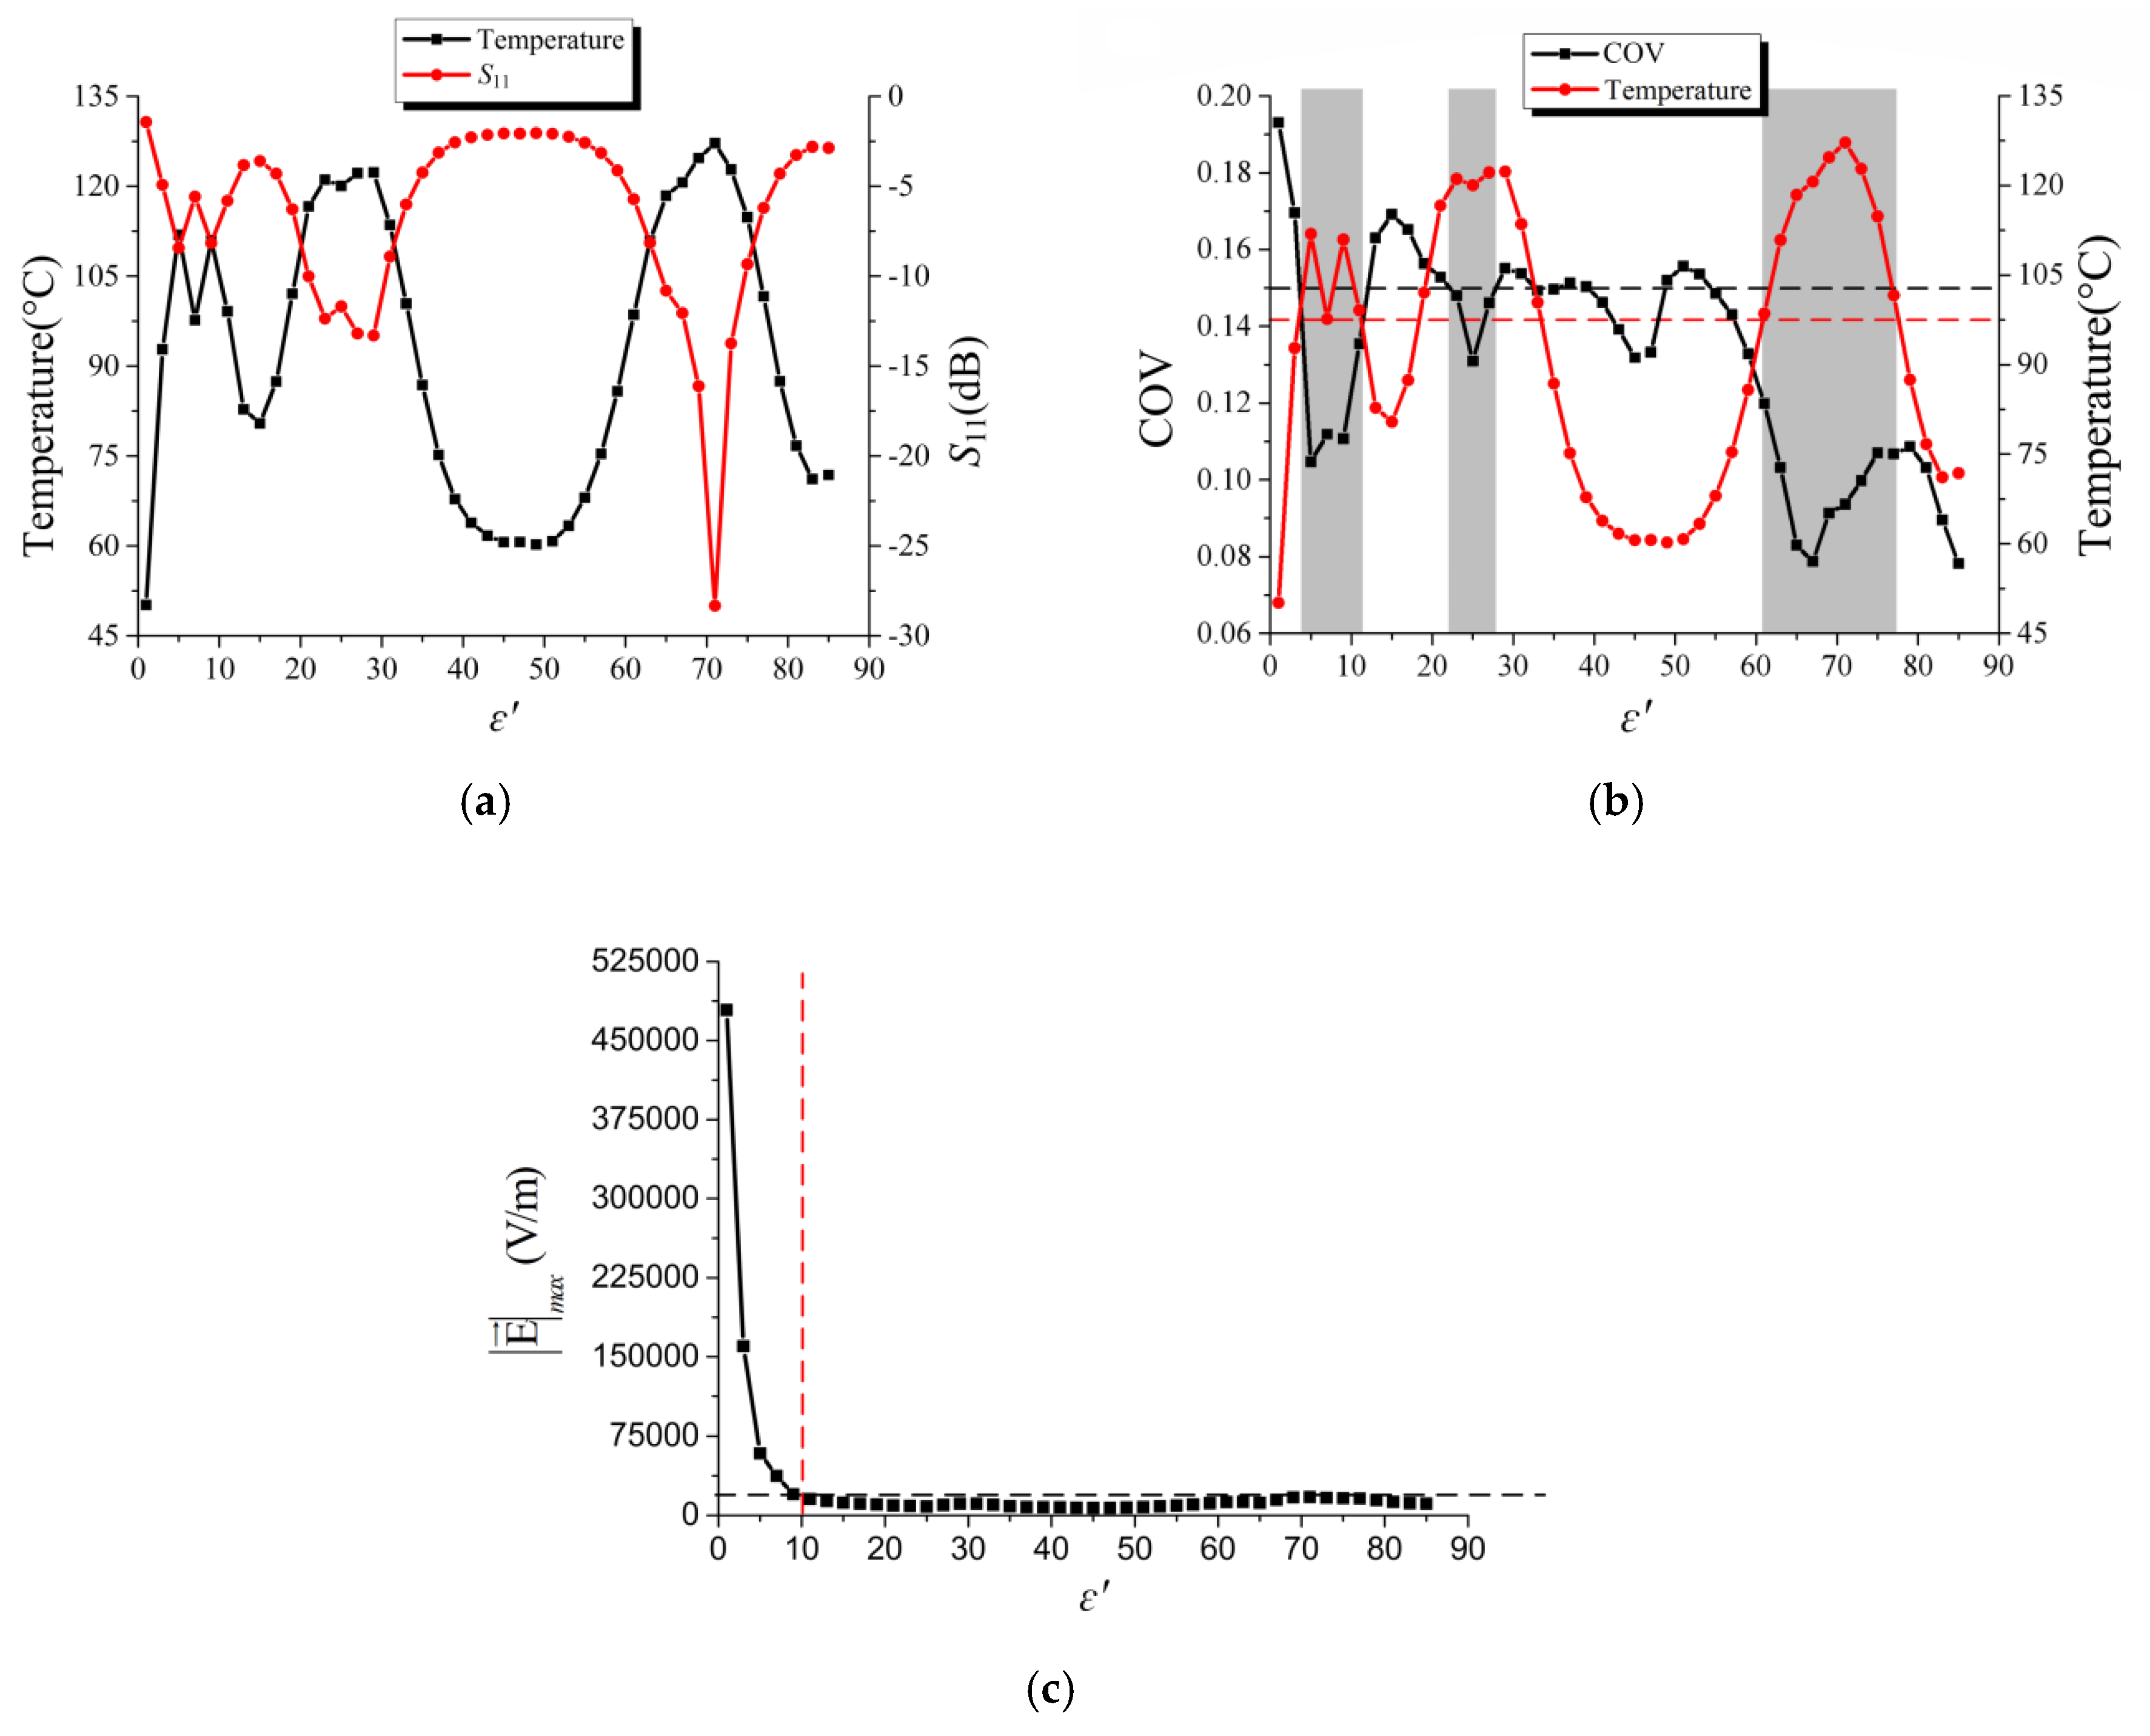
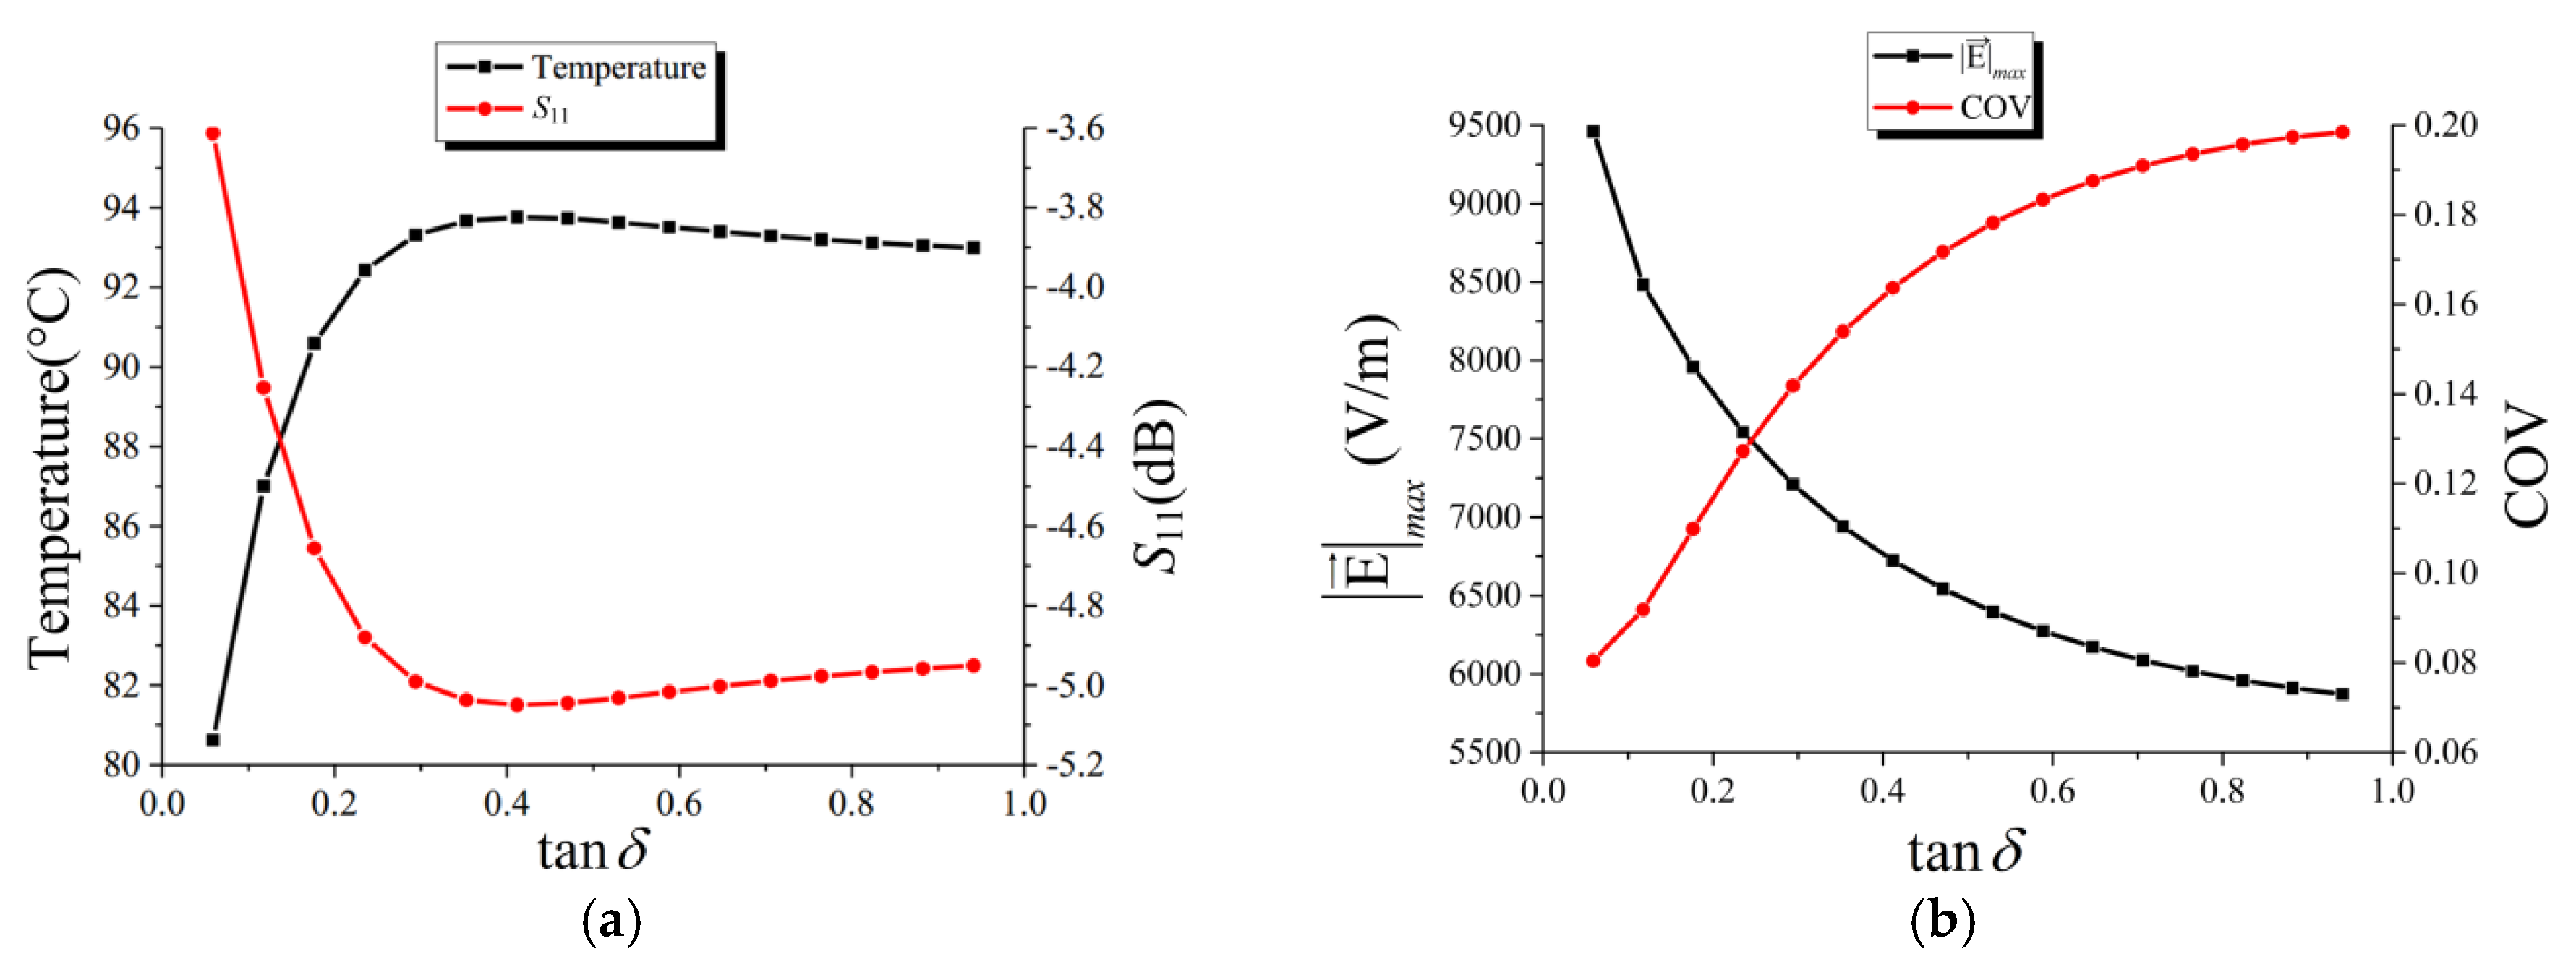
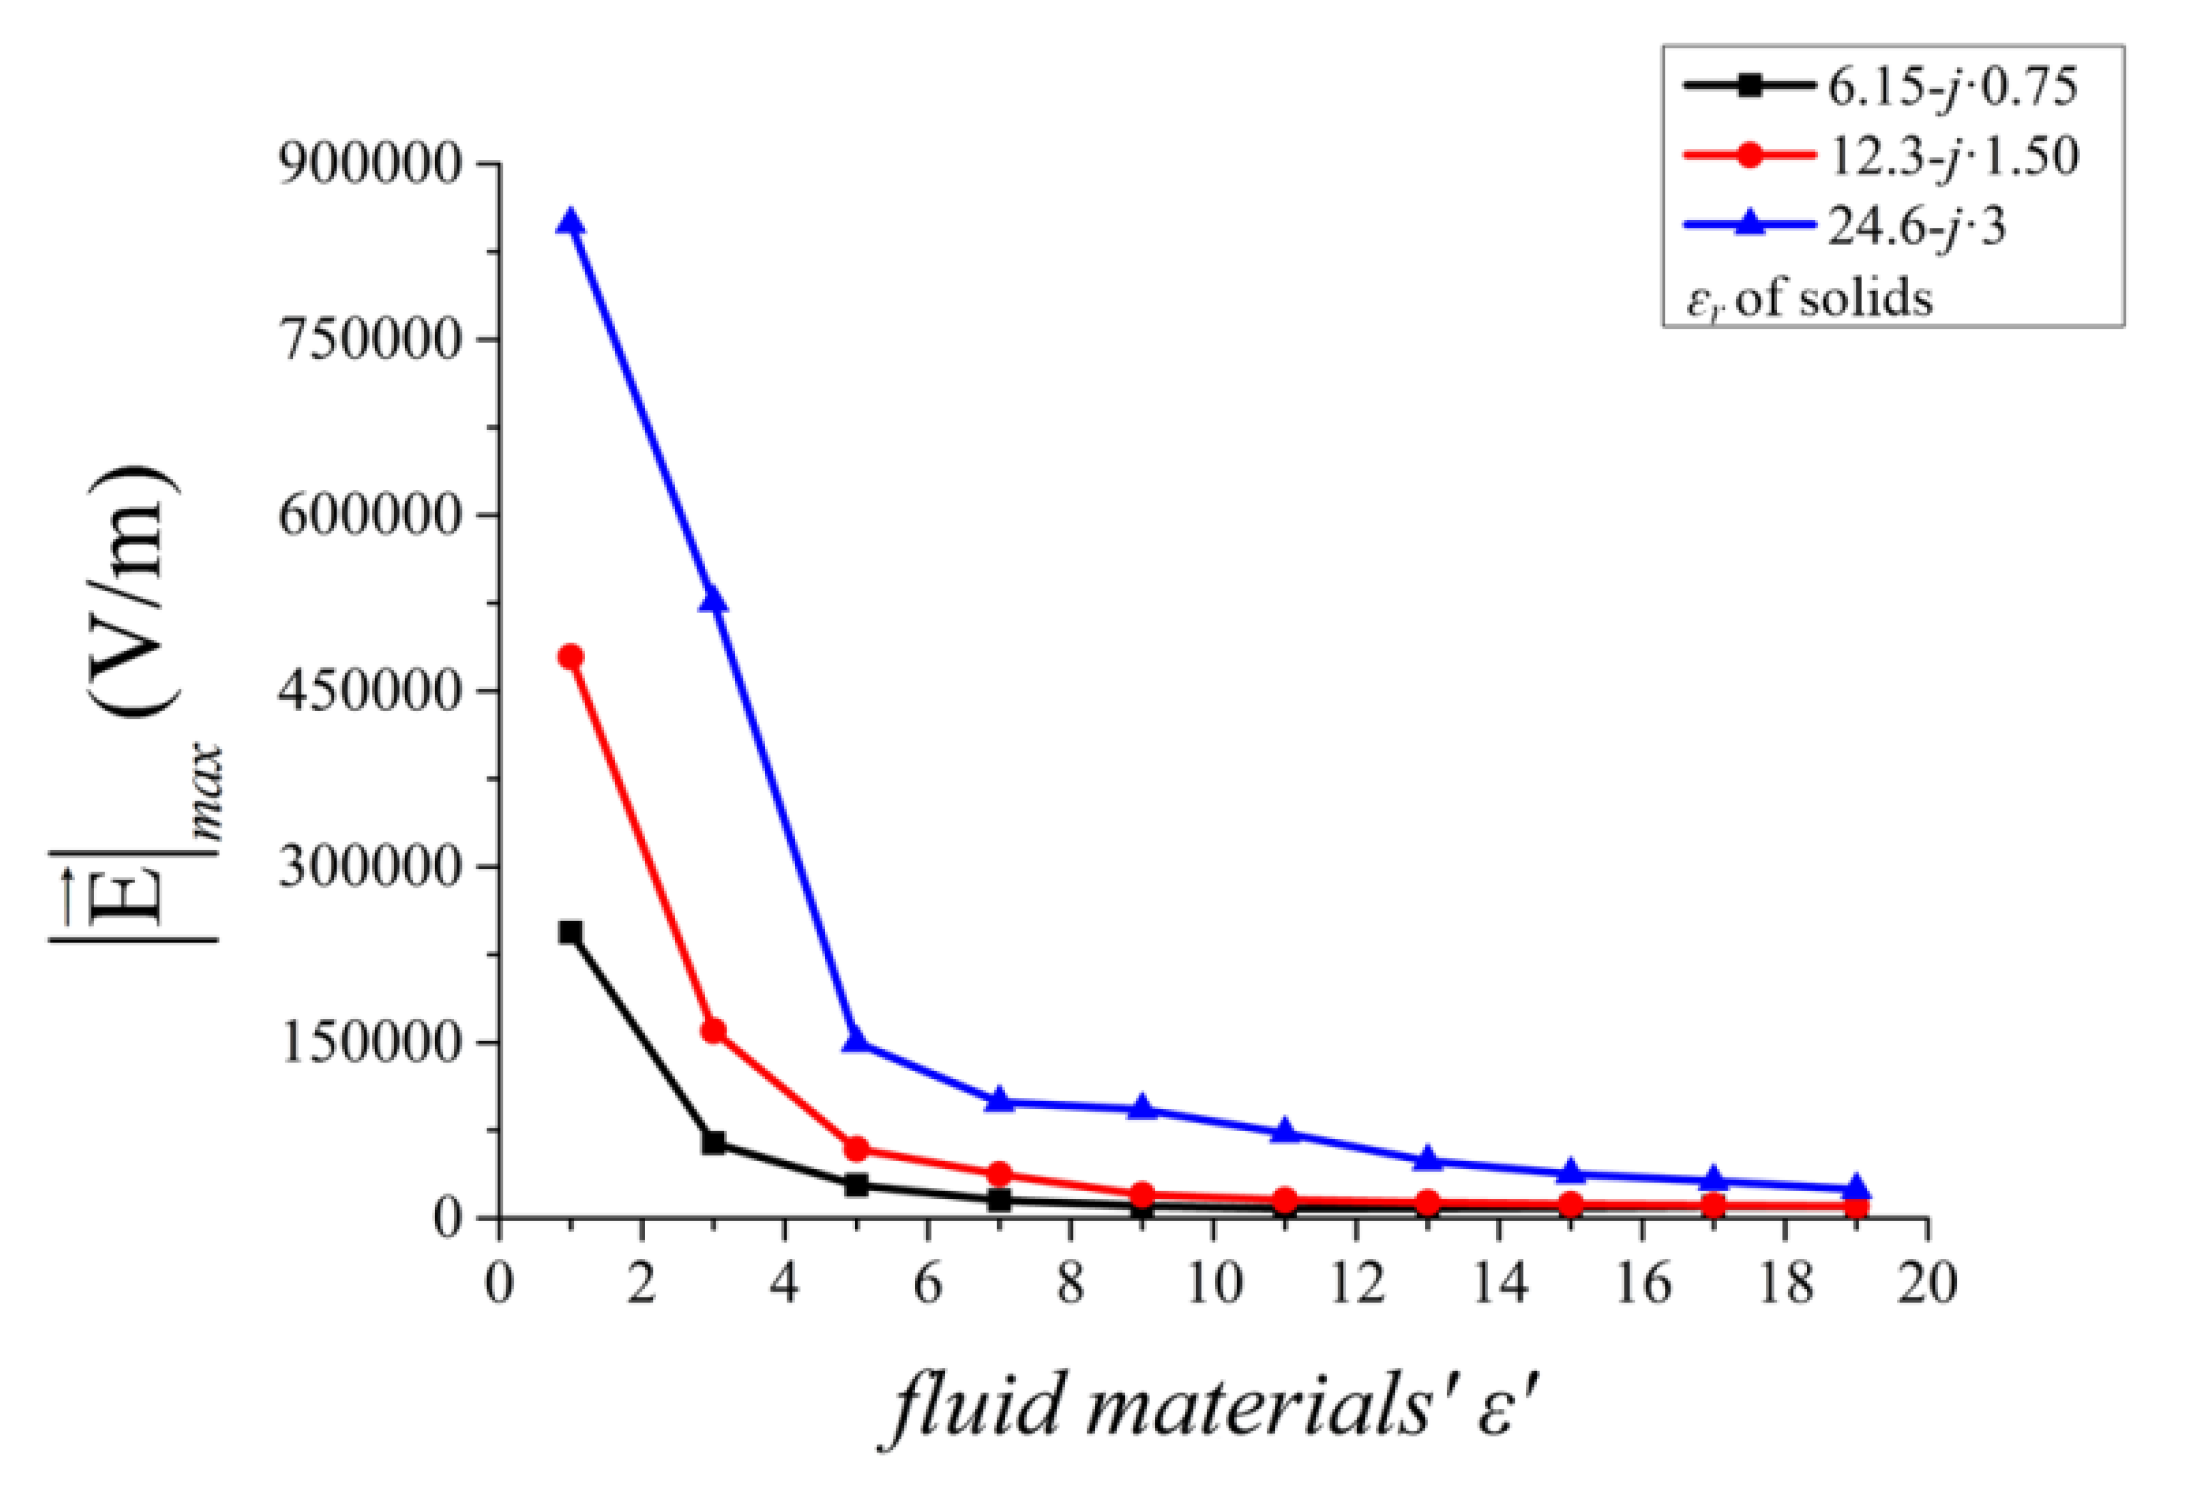
3.2. Effect of Introducing Fluid Materials with Different Dielectric Properties

To give intuitive and convictive results of the influence of the fluid materials on the heating uniformity and safety, a more compact three-layer structure is applied to the simulated silicon carbide spheres and the computations are divided into two situations, where only ε′ of fluid materials is computed and where both ε′ and ε″ are taken into consideration, respectively. Since properties of other related materials stay the same, the other physical properties of the fluid materials have all been defined to be the same with water to avoid their distractions. Meanwhile, the microwave power is set as 100 W and the density of water is set as 1 kg/m3 in order to get a higher temperature rise, and the initial temperature is set as 20 degrees centigrade. The whole heating process lasts 120 s. In the computation results, the reflection parameters S11 of the heating system, the average body temperature T ¯ of the solids, the coefficient of variation (COV) value of the solids’ final temperature and the maximum modulus value of the electric field | E |max in the whole processing materials are analyzed. The COV of temperature can be expressed by
C O V = 1 N i = 1 N ( T i T ¯ ) 2 T ¯ T 0  
where N is the total number of the temperature points, T i is the temperature at a point, T ¯ is the average temperature and T 0 is the initial temperature. Generally speaking, the smaller the COV of the temperature, the smaller the dispersion degree of the temperature distribution, which means the better heating uniformity.
For the first situation, S11, T ¯ , COV and | E |max along with ε′ are shown in Figure 8. It is worthy to note that the reflection parameter is calculated by the rate of reflection power and incident power. Computation results of the system are firstly characterized by the reflection coefficient S11, namely the power absorbed by the processing materials. As shown in Figure 8a, the increasing of ε′ has obvious but nonlinear effects on the S11 and will thus decide the corresponding T ¯ through its impact on the microwave feeding condition.
To the heating uniformity of the processing solids, the COV variation shows that it will mainly decrease with the rise of ε′, e.g., it decreases from 0.1931 with ε′ = 1 to 0.0782 with ε′ = 85. However, in small ranges, it should be analyzed more precisely as the COV has fluctuated. Combined with the analyzed T ¯ condition, areas where uniform heating with high efficiency could be gained just like the marked areas in Figure 8b.
For the heating safety of the processing materials, the increase of ε′ in a certain region (from ε′ = 1 to ε′ = 10 as marked in Figure 8c) has a remarkable effect on lowering the | E |max as it changes from 478,870 V/m to 19,982 V/m, which is reduced by about 24 times. Out of this range, the influence of the increasing ε′ stays weak. The differences could be further described by the mean square error as it is 191,152.0 V/m in the former range while it is 3109.9 V/m in the latter, which is reduced by about 60.5 times. Compared with normal heating solids with air surroundings, namely ε′ = 1, the introduction of fluid materials with proper ε′ shows a more convenient way to achieve uniform and safe microwave heating.
After computations of ε′ only, the influences of ε″ have also been studied. The related computation results shown in Table 2 and Figure 9, and the increasing of ε″ from 0 to 0.3 will lower the S11 and thus bring more efficient heating. While the S11 and T ¯ almost stay the same out of this range.
To the heating uniformity and safety, introducing fluid materials with higher ε″ could reduce the | E |max, as the increasing of ε″ from 0.1 to 0.9 has reduced the | E |max by about 34% to 55%. However, higher ε″ will cause worse heating uniformity as shown in Figure 9b.
As the computation results analyzed above, the introduction of fluid materials with proper relative permittivity does improve the heating uniformity and safety of microwave heating of common stack solid materials. For the real part of relative permittivity of fluid materials, the computed | E |max in simulation models is always gained in the interface between the solids and the fluid materials. Combined with the cure trend shown Figure 8b and the relative permittivity of the solids shown in Table 1, it is deduced that the maximum modulus value of the electric field | E |max stays huge when the ε′ of fluid materials is much different with the one of solids. A comparison of the variation of | E |max on fluid materials’ ε′ with solids of different relative permittivity is performed in Figure 10 and the simulation results have agreed with our deduction.
When dealing with certain solids, introducing fluid materials with higher ε′ can efficiently lower the maximum modulus value of the electric field in order to make a safer heating process. The higher ε′ is also good for improving heating uniformity. On the other hand, the increasing of ε″ in a certain range could obviously improve the heating efficiency and in the whole range its increase will lower the maximum modulus value of the electric field, but bring worse heating uniformity. Since the involved factors are complicated, a proper choice of ε″ to balance the requirements between heating uniformity and safety should be made in the practical situation.

4. Conclusions

In this work, a general model has been built to study the influence of introducing fluid materials in the heating uniformity and safety of microwave heating solid stack materials. Simulations are computed by COMSOL Multiphysics based on the finite element method. With the mesh independence study and adjustment corresponding to physical experiments, the model has been verified and its simulation results agree well with validation experiments.
The real part of relative permittivity of the introduced fluid materials could significantly lower the maximum modulus value of the electric field in a range of ε′ = 1 to ε′ = 10, but out of this range its influence stays low. The increase of ε′ on the whole studied range will improve the heating uniformity, but in small ranges it has fluctuated. The increase of the imaginary part of relative permittivity from 0 to 0.3 could obviously improve the heating efficiency. On the whole studied range, higher ε″ could lower the maximum modulus value of the electric field and give a safer heating, but it will make the heating uniformity worse. Combined with computational results, the general rules of the influence of fluid materials’ relative permittivity on the heating uniformity and safety may be useful for the practical heating process.

Author Contributions

T.H. and H.Z. conceived and designed the experiments; J.W. performed the experiments; J.W. and Y.H. developed the model, analyzed the data and wrote the initial draft of the manuscript; T.X. and F.Y. assisted the experiment procedures; T.H. reviewed and contributed to the final manuscript.

Funding

This work was funded by Sichuan Science and Technology Program (Grant No. 2018FZ0008), Guizhou Science and Technology Program (Grant No. Qiankehezhicheng [2018]2004) and State Key Laboratory of Efficient Utilization for Low Grade Phosphate Rock and Its Associated Resources (Grant No. WFKF2017-05).

Conflicts of Interest

The authors declare no conflict of interest.

References

  1. Demirskyi, D.; Agrawal, D.; Ragulya, A. Neck formation between copper spherical particles under single-mode and multimode microwave sintering. Mater. Sci. Eng. A 2010, 527, 2142–2145. [Google Scholar] [CrossRef]
  2. Ozkoc, S.O.; Sumnu, G.; Sahin, S. Recent Developments in Microwave Heating. In Emerging Technologies for Food Processing, 2nd ed.; Elsevier Ltd.: Amsterdam, The Netherlands, 2015; Chapter 20; pp. 361–383. [Google Scholar]
  3. Ferrera-Lorenzo, N.; Fuente, E.; Suárez-Ruiz, I.; Ruiz, B. KOH activated carbon from conventional and microwave heating system of a macroalgae waste from the Agar–Agar industry. Fuel Process. Technol. 2014, 121, 25–31. [Google Scholar] [CrossRef]
  4. Monteiro, R.L.; Carciofi, B.A.M.; Marsaioli, A., Jr.; Laurindo, J.B. How to make a microwave vacuum dryer with turntable. J. Food Eng. 2015, 166, 276–284. [Google Scholar] [CrossRef]
  5. Wu, Y.; Hong, T.; Tang, Z.; Zhang, C. Dynamic Model for a Uniform Microwave-Assisted Continuous Flow Process of Ethyl Acetate Production. Entropy 2018, 20, 241. [Google Scholar] [CrossRef]
  6. Adam, D. Microwave chemistry: Out of the kitchen. Nature 2003, 421, 571–572. [Google Scholar] [CrossRef] [PubMed]
  7. Vadivambal, R.; Jayas, D.S. Non-uniform temperature distribution during microwave heating of food materials—A review. Food Bioprocess Technol. 2010, 3, 161–171. [Google Scholar] [CrossRef]
  8. Kubota, M.; Hanada, T.; Yabe, S.; Kuchar, D.; Matsuda, H. Water desorption behavior of desiccant rotor under microwave irradiation. Appl. Therm. Eng. 2011, 31, 1482–1486. [Google Scholar] [CrossRef]
  9. Lopez-Avila, V.; Benedicto, J.; Bauer, K.M. Stability of organochlorine and organophosphorus pesticides when extracted from solid matrixes with microwave energy. J. AOAC Int. 1998, 81, 1224–1232. [Google Scholar]
  10. Sebera, V.; Nasswettrová, A.; Nikl, K. Finite element analysis of mode stirrer impact on electric field uniformity in a microwave applicator. Dry. Technol. 2012, 30, 1388–1396. [Google Scholar] [CrossRef]
  11. Hong, T.; Tang, Z.; Zhu, H. Anomalous dielectric relaxation with linear reaction dynamics in space-dependent force fields. J. Chem. Phys. 2016, 145, 244105. [Google Scholar] [CrossRef] [PubMed]
  12. Stadler, A.; Yousefi, B.H.; Dallinger, D.; Walla, P.; Van der Eycken, E.; Kaval, N.; Kappe, C.O. Scalability of microwave-assisted organic synthesis. From single-mode to multimode parallel batch reactors. Org. Process Res. Dev. 2003, 7, 707–716. [Google Scholar] [CrossRef]
  13. Wu, X. Experimental and Theoretical Study of Microwave Heating of Thermal Runaway Materials. Ph.D. Thesis, Virginia Tech, Virginia Polytechnic Institute and State University, Blacksburg, VA, USA, 18 December 2002. [Google Scholar]
  14. Wang, W.; Liu, Z.; Sun, J.; Ma, Q.; Ma, C.; Zhang, Y. Experimental study on the heating effects of microwave discharge caused by metals. AIChE J. 2012, 58, 3852–3857. [Google Scholar] [CrossRef]
  15. Sun, J.; Wang, W.; Zhao, C.; Zhang, Y.; Ma, C.; Yue, Q. Study on the coupled effect of wave absorption and metal discharge generation under microwave irradiation. Ind. Eng. Chem. Res. 2014, 53, 2042–2051. [Google Scholar] [CrossRef]
  16. Sun, J.; Wang, W.; Liu, Z.; Ma, C. Recycling of waste printed circuit boards by microwave-induced pyrolysis and featured mechanical processing. Ind. Eng. Chem. Res. 2011, 50, 11763–11769. [Google Scholar] [CrossRef]
  17. Sun, J.; Wang, W.; Liu, Z.; Ma, Q.; Zhao, C.; Ma, C. Kinetic study of the pyrolysis of waste printed circuit boards subject to conventional and microwave heating. Energies 2012, 5, 3295–3306. [Google Scholar] [CrossRef]
  18. Li, Z.Y.; Wang, R.F.; Kudra, T. Uniformity issue in microwave drying. Dry. Technol. 2011, 29, 652–660. [Google Scholar] [CrossRef]
  19. Campañone, L.A.; Bava, J.A.; Mascheroni, R.H. Modeling and process simulation of controlled microwave heating of foods by using of the resonance phenomenon. Appl. Therm. Eng. 2014, 73, 914–923. [Google Scholar] [CrossRef]
  20. Luan, D.; Tang, J.; Pedrow, P.D.; Liu, F.; Tang, Z. Analysis of electric field distribution within a microwave assisted thermal sterilization (MATS) system by computer simulation. J. Food Eng. 2016, 188, 87–97. [Google Scholar] [CrossRef] [Green Version]
  21. Lin, B.Q.; Li, H.; Dai, H.M.; Zhu, C.J.; Yao, H. Three-dimensional simulation of microwave heating coal sample with varying parameters. Appl. Therm. Eng. 2016, 93, 1145–1154. [Google Scholar]
  22. Bae, S.H.; Jeong, M.G.; Kim, J.H.; Lee, W.S. A continuous power-controlled microwave belt drier improving heating uniformity. IEEE Microw. Wirel. Compon. Lett. 2017, 27, 527–529. [Google Scholar] [CrossRef]
  23. Plaza-González, P.; Monzó-Cabrera, J.; Catalá-Civera, J.M.; Sánchez-Hernández, D. New approach for the prediction of the electric field distribution in multimode microwave-heating applicators with mode stirrers. IEEE Trans. Magn. 2004, 40, 1672–1678. [Google Scholar] [CrossRef]
  24. Plaza-González, P.; Monzó-Cabrera, J.; Catalá-Civera, J.M.; Sánchez-Hernández, D. Effect of mode-stirrer configurations on dielectric heating performance in multimode microwave applicators. IEEE Trans. Microw. Theory Tech. 2005, 53, 1699–1706. [Google Scholar] [CrossRef] [Green Version]
  25. Wang, R.; Huo, H.; Dou, R.; Li, Z.; Mujumdar, A.S. Effect of the inside placement of electrically conductive beads on electric field uniformity in a microwave applicator. Dry. Technol. 2014, 32, 1997–2004. [Google Scholar] [CrossRef]
  26. Meng, Q.; Lan, J.; Hong, T.; Zhu, H. Effect of the rotating metal patch on microwave heating uniformity. J. Microw. Power Electromagn. Energy 2018, 52, 94–108. [Google Scholar] [CrossRef]
  27. Zhou, R.; Yang, X.; Sun, D.; Jia, G. Multiple tube structure for heating uniformity and efficiency optimization of microwave ovens. Eur. Phys. J. Appl. Phys. 2015, 69, 20201. [Google Scholar] [CrossRef]
  28. Raaholt, B.W.; Isaksson, S.; Hamberg, L.; Fhager, A.; Hamnerius, Y. Continuous tubular microwave heating of homogeneous foods: evaluation of heating uniformity. J. Microw. Power Electromagn. Energy 2016, 50, 43–65. [Google Scholar] [CrossRef]
  29. Ryynänen, S.; Ohlsson, T. Microwave heating uniformity of ready meals as affected by placement, composition, and geometry. J. Food Sci. 1996, 61, 620–624. [Google Scholar] [CrossRef]
  30. Geedipalli, S.S.R.; Rakesh, V.; Datta, A.K. Modeling the heating uniformity contributed by a rotating turntable in microwave ovens. J. Food Eng. 2007, 82, 359–368. [Google Scholar] [CrossRef]
  31. Salema, A.A.; Afzal, M.T. Numerical simulation of heating behaviour in biomass bed and pellets under multimode microwave system. Int. J. Therm. Sci. 2015, 91, 12–24. [Google Scholar] [CrossRef]
  32. Soto-Reyes, N.; Temis-Pérez, A.L.; López-Malo, A.; Rojas-Laguna, R.; Sosa-Morales, M.E. Effects of shape and size of agar gels on heating uniformity during pulsed microwave treatment. J. Food Sci. 2015, 80, E1021–E1025. [Google Scholar] [CrossRef] [PubMed]
  33. Chen, W.; Gutmann, B.; Kappe, C.O. Characterization of Microwave-Induced Electric Discharge Phenomena in Metal–Solvent Mixtures. ChemistryOpen 2012, 1, 39–48. [Google Scholar] [CrossRef] [PubMed]
  34. Hu, C.; Xi, X.; Huang, Z.; Zhan, Z. Simple Analysis of Mechanism of Microware Sintering of Metal Powder. Mater. Rev. 2008, S2, 329–332. (In Chinese) [Google Scholar]
  35. Whittaker, A.G.; Mingos, D.M.P. Arcing and other microwave characteristics of metal powders in liquid systems. J. Chem. Soc. Dalton Trans. 2000, 9, 1521–1526. [Google Scholar] [CrossRef]
  36. Lide, D.R. CRC Handbook of Chemistry and Physic, 90th ed.; CRC Press: Boca Raton, FL, USA, 2012; pp. 15–46. [Google Scholar]
  37. Perreux, L.; Loupy, A.; Petit, A. Nonthermal effects of microwaves in organic synthesis. In Microwaves in Organic Synthesis, 3rd ed.; De la Hoz, A., Loupy, A., Eds.; Wiley—VCH Verlag GmbH & Co. KGaA: Weinheim, Germany, 2012; Chapter 4; pp. 127–207. [Google Scholar]
  38. Torres, F.; Jecko, B. Complete FDTD analysis of microwave heating processes in frequency-dependent and temperature-dependent media. IEEE Trans. Microw. Theory 1997, 45, 108–117. [Google Scholar] [CrossRef]
  39. Goldblith, S.A.; Wang, D.I. Effect of microwaves on Escherichia coli and Bacillus subtilis. Appl. Microbiol. 1967, 15, 1371–1375. [Google Scholar] [PubMed]
  40. Huang, K.M.; Liao, Y.H. Transient power loss density of electromagnetic pulse in debye media. IEEE Trans. Microw. Theory 2015, 63, 135–140. [Google Scholar] [CrossRef]
  41. Pandit, R.B.; Prasad, S. Finite element analysis of microwave heating of potato—Transient temperature profiles. J. Food Eng. 2003, 60, 193–202. [Google Scholar] [CrossRef]
  42. Pitchai, K.; Birla, S.L.; Subbiah, J.; Jones, D.; Thippareddi, H. Coupled electromagnetic and heat transfer model for microwave heating in domestic ovens. J. Food Eng. 2012, 112, 100–111. [Google Scholar] [CrossRef] [Green Version]
  43. Pitchai, K.; Chen, J.; Birla, S.; Gonzalez, R.; Jones, D.; Subbiah, J. A microwave heat transfer model for a rotating multi-component meal in a domestic oven: development and validation. J. Food Eng. 2014, 128, 60–71. [Google Scholar] [CrossRef]
  44. Zhu, H.; Ye, J.; Gulati, T.; Yang, Y.; Liao, Y.; Yang, Y.; Huang, K. Dynamic analysis of continuous-flow microwave reactor with a screw propeller. Appl. Therm. Eng. 2017, 123, 1456–1461. [Google Scholar] [CrossRef]
  45. Grant, E.; Halstead, B.J. Dielectric parameters relevant to microwave dielectric heating. Chem. Soc. Rev. 1998, 27, 213–224. [Google Scholar]
  46. Kuang, J.; Cao, W. Silicon carbide whiskers: Preparation and high dielectric permittivity. J. Am. Ceram. Soc. 2013, 96, 2877–2880. [Google Scholar] [CrossRef]
  47. Ye, J.; Hong, T.; Wu, Y.; Wu, L.; Liao, Y.; Zhu, H.; Yang, Y.; Huang, K. Model stirrer based on a multi-material turntable for microwave processing materials. Materials 2017, 10, 95. [Google Scholar] [CrossRef] [PubMed]
  48. Böttcher, C.J.F.; van Belle, O.C.; Bordewijk, P.; Rip, A.; Yue, D.D. Theory of electric polarization. J. Electrochem. Soc. 1974, 121, 211C. [Google Scholar] [CrossRef]
  49. QuickWave EM simulator, QWED s.c., Zwyciezcow 34/2, 03-938 Warsaw, Poland. Available online: http://www.qwed.com.pl/ (accessed on 6 November 2018).
  50. Pathak, S.K.; Liu, F.; Tang, J. Finite difference time domain (FDTD) characterization of a single mode applicator. J. Microw. Power Electromagn. Energy 2003, 38, 37–48. [Google Scholar] [CrossRef]
Figure 1. Geometry of the 3-D simulation model (unit: mm).
Processes 06 00220 g001
Figure 2. Normalized power absorption (NPA) variation of heating computations with different mesh sizes.
Processes 06 00220 g002
Figure 3. Schematic of the laboratory microwave heating system.
Processes 06 00220 g003
Figure 4. The laboratory microwave heating system.
Processes 06 00220 g004
Figure 5. Schematic of the simple system for the slide short position confirmation.
Processes 06 00220 g005
Figure 6. Structure of the silicon carbide spheres: (a) Experimental structure; (b) simulation structure.
Processes 06 00220 g006
Figure 7. Temperature variation comparisons between the experiment and simulation: (a) Temperature of point (5,0,0) with water as the fluid material; (b) temperature of point (−5,0,0) with water as the fluid material; (c) temperature of point (5,0,0) with glycerol as the fluid material; (d) temperature of point (−5,0,0) with glycerol as the fluid material.
Processes 06 00220 g007
Figure 8. Influence of ε′ on the final parameters at time 120 s: (a) Variations of the S11 and the T ¯ ; (b) variations of the coefficient of variation (COV) and T ¯ ; (c) variations of the | E |max.
Processes 06 00220 g008
Figure 9. Influence of ε″ on the final parameters with ε′ = 85 at time 120 s: (a) Variations of the S11 and the T ¯ ; (b) variations of the COV and the | E |max.
Processes 06 00220 g009
Figure 10. The influence of ε′ on the | E |max.
Processes 06 00220 g010
Table 1. Summary of material properties applied in the model.
ε   tan δ   μrσ (S/m)k (W/m·K)ρ (kg/m3)Cp (J/kg·K)
Air10102.524 × 1021.2051005
Silicon carbide12.30.121045032001600
Quartz4.2011 × 10−14102600260
Water79.40.1215.5 × 10−60.5910004187
Glycerol6.330.1816.4 × 10−80.2712642735
Table 2. Comparisons of the COV and | E |max while ε″ is considered.
ε tan δ S 11 ( dB ) T ¯ ( ° C ) COV | E | m a x ( V / m )
150−3.599480.480.16085677212,105
0.1−5.034593.660.14573702910,183
0.5−7.3592107.610.2024858554558.9
0.9−7.6533108.90.2296779994136.1
500−2.043560.280.1541546137525.2
0.1−3.806682.650.1224002656047.8
0.5−5.939299.980.1706298794484.6
0.9−5.870999.540.1930532444136.1
850−2.867771.880.07314443310,796
0.1−4.086285.440.0881552888663.5
0.5−5.038993.680.1769755056465.7
0.9−4.955993.030.1983454045898

