Article

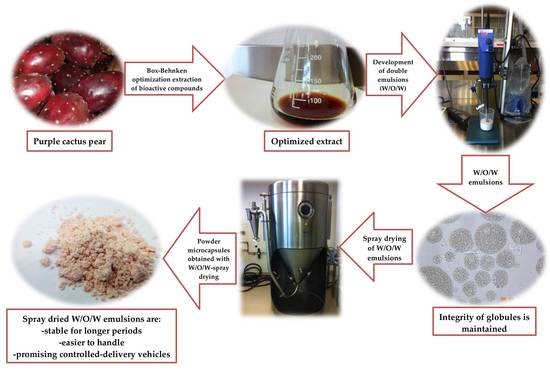
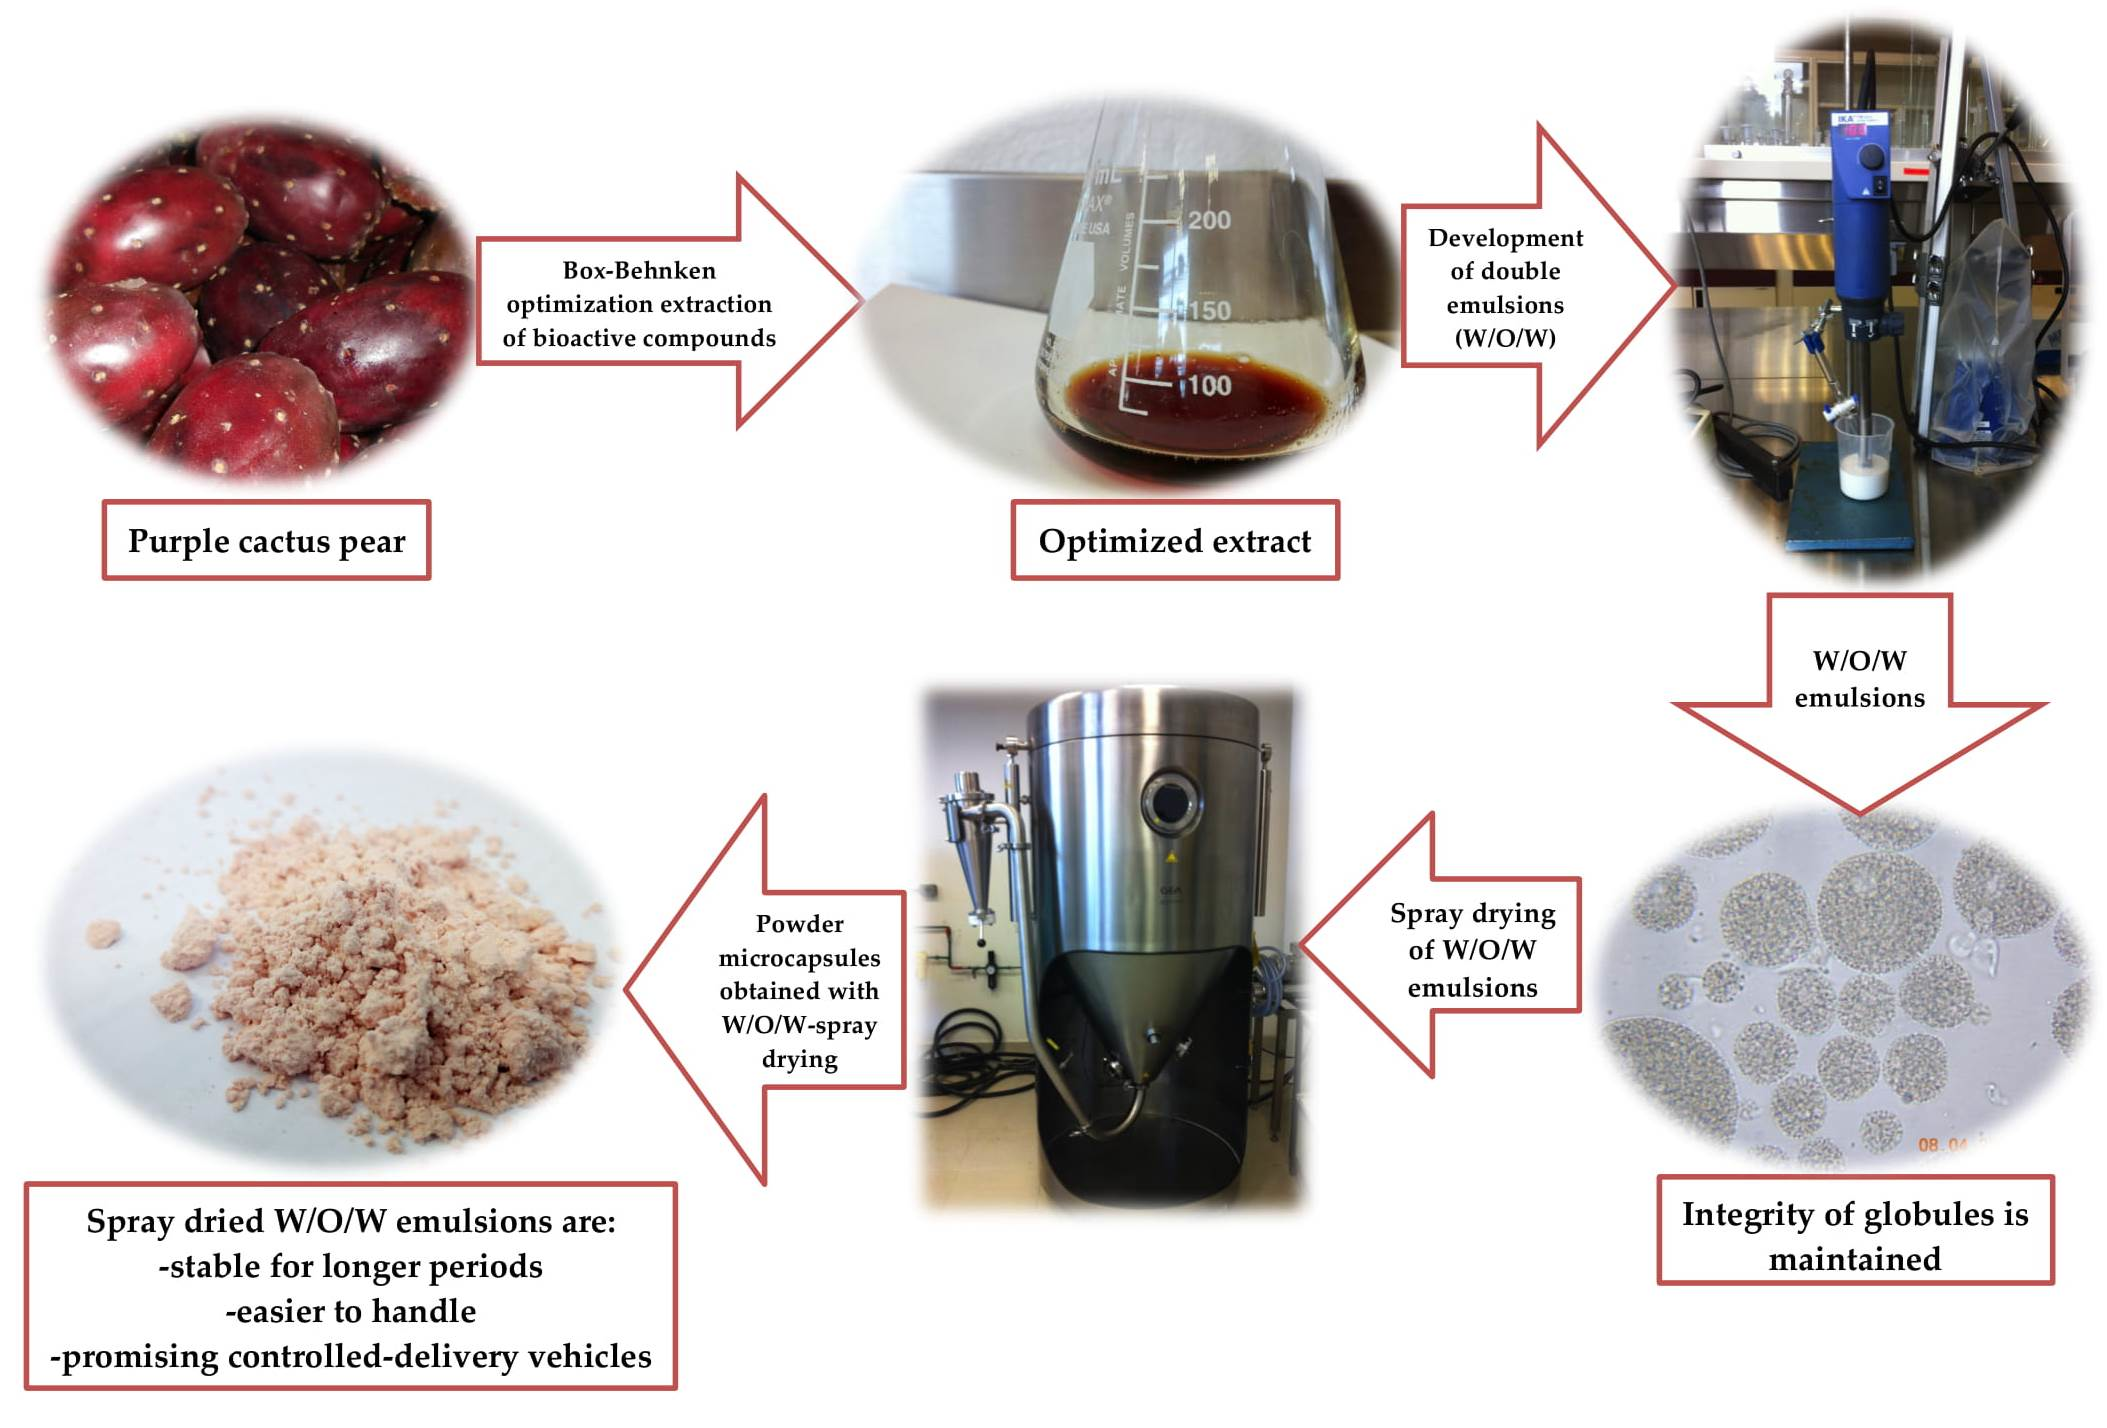
Microencapsulation of Purple Cactus Pear Fruit (Opuntia ficus indica) Extract by the Combined Method W/O/W Double Emulsion-Spray Drying and Conventional Spray Drying: A Comparative Study

by
Keren Toledo-Madrid
1,
Tzayhrí Gallardo-Velázquez
2 and
Guillermo Osorio-Revilla
1,*
1
Departamento de Ingeniería Bioquímica, Escuela Nacional de Ciencias Biológicas, Instituto Politécnico Nacional, Mexico City 07738, Mexico
2
Departamento de Biofísica, Escuela Nacional de Ciencias Biológicas, Instituto Politécnico Nacional, Mexico City 11340, Mexico
*
Author to whom correspondence should be addressed.
Processes 2018, 6(10), 189; https://doi.org/10.3390/pr6100189
Submission received: 6 September 2018 / Revised: 7 October 2018 / Accepted: 8 October 2018 / Published: 12 October 2018
(This article belongs to the Section Biological Processes and Systems)

Abstract

:
The aim of this study was to microencapsulate an optimized extract of purple cactus pear fruit (Opuntia ficus indica), rich in phenolic compounds (PC), betacyanins (BC), and betaxanthins (BX), with antioxidant capacity (AC), by two methodologies: combined water-in-oil-in-water double emulsions-spray drying (W/O/W-SP) and conventional spray drying, studying the effect of spray drying (SP) on PC and AC. Optimal extraction conditions for bioactive compounds were: 52 °C, for 30 min, using aqueous ethanol (40%w/w) as the solvent, with a 0.85 desirability function, obtaining 17.39 ± 0.11 mg GAE/gdw (gallic acid equivalents per gram of dry weight) for PC, 0.35 mg BE/gdw (betanin equivalents per gram of dry weight) for BC, and 0.26 mg IE/gdw (indicaxanthin equivalents per gram of dry weight) for BX. The best combination of temperatures for conventional SP and W/O/W-SP was 160–80 °C obtaining the highest retention and encapsulation efficiencies for PC. For conventional SP, results were: 107% and 100% PC and AC retention efficiencies (RE-PC and RE-AC), respectively, with 97% of PC encapsulation efficiency (EE-PC), meanwhile for the W/O/W-SP results were: 78% and 103% RE-PC and RE-AC, respectively, with 70% of EE-PC. Microcapsules obtained with W/O/W-SP maintained their structure and integrity and showed a considerable reduction in globule size in the reconstituted W/O/W emulsions due to the spray drying stress. Despite having lower EE-PC than conventional SP, spray dried W/O/W emulsions seem as a promising controlled-delivery vehicle for antioxidant compounds.

Graphical Abstract

1. Introduction

Consumers currently demand food products that have high quality, long shelf-life, and added functional value, therefore the food industry must constantly search for new alternative ingredients that can help meet consumer demands. Plant foods including fruits and vegetables have demonstrated many health benefits due to high contents of bioactive compounds (like phenolic compounds (PC), betalainic pigments, carotenoids, and others) with antioxidant capacity (AC) [1].
A fruit that has AC due to the presence of betalainic pigments (red-colored betacyanins (BC) and yellow-colored betaxanthins (BX)) and PC (like kaempferol, isoharmnetin, and quercetin) is cactus pear fruit (Opuntia ficus indica), a member of the Cactaceae family [2]. Mexico is the worldwide leading producer of cactus pear fruit (470,000 t/year), however it grows in many other countries without much effort. This fruit has a juicy pulp that has many small seeds and a thick peel; it can have a variety of colors like purple, red, yellow, and white [3]. Purple cactus pear fruit is a variety that is harvested the whole year around and it is mainly consumed fresh, but due to the overabundance, many fruits get rot, generating waste that could be exploited due to its functional value [4].
The importance of natural antioxidants has led the food industry to extract them from their natural sources (fruits and by-products) in order to develop functional food products. Bioactive compounds can be extracted using techniques like solid-liquid extraction [5] and employing response surface methodology (RSM) in order to optimize the extraction process [6].
Bioactive compounds can have a limited use due to factors such as vulnerability to oxidative breakdown, poor thermal stability, poor taste, and sensitivity to light. This leads to the application of microencapsulation technology, which aids in this problems, extending the shelf life, giving protection during processing steps and also giving the opportunity of bioactive compounds to have a controlled release [7]. Gharsallaoui et al., 2007 [8], define microencapsulation as a process in which tiny droplets are surrounded by a coating or embedded in a matrix, to obtain microparticles in which the active material or core is protected from the surrounding environment. The coating is made of a suitable wall material or encapsulating agent, since it can affect the microparticles’ stability, the process efficiency and the degree of protection of the active core [9]. Many encapsulating agents can be used, for example, maltodextrins (MDX), starches, gums, and proteins such as whey protein isolates (WPI) [8].
Spray drying (SP) is one of the most common techniques used for the microencapsulation of bioactive compounds due to its low cost and availability. During SP, the evaporation of solvent is so fast that the droplet remains practically cool until it is completely dry, being one of the main reasons why SP is such a successful technique to protect bioactive compounds during the microencapsulation process. Encapsulating agents used in conventional SP are important since they have an effect on the protection of bioactive compounds. Maltodextrin is a popular material used in microencapsulation by conventional SP [10,11,12] since it has good solubility in aqueous solutions, it is inexpensive and it is a safe food additive. Microencapsulation of hydrophilic compounds (like PC) with maltodextrin result in microcapsules with good retention efficiencies, obtaining a powdered product with extended shelf life. Nevertheless, conventional spray dried powders made from water-soluble polymers, like maltodextrin, are known to have a rapid release of bioactive compounds once incorporated to water-based food products [13], being a disadvantage when controlled-delivery of bioactive compounds is desired.
Another type of microencapsulation is the use of double emulsion technology. Lamba et al., 2015 [14], indicate that double emulsions are emulsions in which the dispersed phase is itself an emulsion present as fine droplets. There are two types of double emulsions: water-in-oil-in-water (W/O/W) and oil-in-water-in-oil emulsions (O/W/O). For W/O/W emulsions, a water phase is dispersed in oil, which is then dispersed in another water phase. W/O/W emulsions are used as a carrier for hydrophilic bioactive compounds by loading them in the inner water phase [15]. It has been demonstrated that microcapsules obtained with W/O/W emulsions, due to their structure, have a delayed or controlled release behavior and encapsulated compounds can be protected from exposure to gastric juices during digestion [16]. W/O/W emulsions system exhibits this controlled release through the establishment of a protective outer oil-water interface, using protein-based compounds [17,18]. For this reason, W/O/W emulsions have potential applications in food industry as vehicles for encapsulation and delivery of nutrients and sensitive food materials during eating and digestion; they can also be used in the formulation of low calorie food products with functional activities [19]. However, the use of W/O/W emulsions has not been widespread due to their low stability during storage. The application of SP is an interesting proposal to provide a longer stability of W/O/W emulsions since they are immobilized in a continuous solid matrix, avoiding problems like droplet coalescence and premature release of the entrapped compounds; besides, the convenience of obtaining a powder, which is much easier to handle in food industry [15]. Kaimainen et al., 2015 [20] mention that W/O/W emulsions have high potential for food applications, and even for drug and cosmetic applications.
The aim of this study was to microencapsulate purple cactus pear fruit (Opuntia ficus indica) extract with the combined method W/O/W emulsions-spray drying (W/O/W-SP) and compare this with conventional SP microencapsulation, using MDX as encapsulating agent. For SP process in both techniques, the following combination of temperatures were studied: 160–70, 160–80, 180–70, and 180–80 °C (inlet-outlet temperatures). The characteristics of the microcapsules obtained were determined in terms of retention efficiency of PC (RE-PC), retention efficiency of AC (RE-AC), and encapsulation efficiency of PC (EE-PC), as well as particle size distribution and surface morphology. Moreover, an RSM study was implemented in order to optimize extraction conditions for the microencapsulated purple cactus pear fruit extract.

2. Materials and Methods

2.1. Preparation of Purple Cactus Pear Fruit for Extraction of Bioactive Compounds

Frozen cactus pear fruits (Central de Abastos, Mexico City, CMDX, Mexico) were thawed at ambient temperature and cut into cubes in order to be dried at 50 °C in a conventional oven for 48 h until moisture content was 10% or lower. Seeds were manually separated from peel and pulp and these two were pulverized in a food processor. The obtained powder was stored in amber glass bottles with hermetic seal and stored in Ziploc bags, at −20 °C until use. The obtained cactus pear fruit peel and pulp powder was used for optimization of extraction parameters and microencapsulation processes. In addition, each separate part (peel, pulp and seeds) of the cactus pear fruit and whole cactus pear fruit, were subjected to the same process.

2.2. Extraction of Bioactive Compounds for the Characterization of Purple Cactus Pear Fruit

The extraction of bioactive compounds in the fresh and dry cactus pear fruit as well as for each dry part of the fruit, was carried out with aqueous methanol (50%w/w) (REASOL, Mexico City, CDMX, Mexico), in a 1:10 (sample:solvent) ratio. A double extraction was carried out, for 1 h each, at 40 °C. Extracts were combined and centrifuged at 1900 g for 15 min. Supernatants were filtered on Whatman paper No. 6 (Whatman Ltd., Maidstoine, UK). The experimental conditions were selected based on results obtained from previous studies.

2.3. Optimization of Extraction Parameters of Bioactive Compounds from Purple Cactus Pear Fruit Peel and Pulp

A Box-Behnken experimental design (BBD) was used, studying 3 factors at 3 levels: solvent concentration (aqueous ethanol: 30, 50, and 70%w/w) (REASOL, Mexico City, CMDX, Mexico), extraction temperature (40, 50, and 60 °C) and extraction time (30, 75 and 120 min). In total, 15 experiments were carried out in this work to assess the effects of the independent variables on the yield of PC, BC and BX content.

2.4. W/O/W Emulsion Preparation

In order to prepare W/O/W emulsions, a primary or simple water-in-oil emulsion (W/O) was prepared, consisting of a 40%w/w internal aqueous phase and a 60%w/w oil phase (87% canola oil and 13% polyglycerol poliricineoleate, as lipophilic emulsifier (Danisco Grinsted PGPR, Kosher, Denmark)). The internal aqueous phase was prepared mixing 85%w/w of concentrated purple cactus pear fruit extract and 15%w/w of glycerol, the latter being used because it favors the reduction of the globule size and ensures a better stability of the emulsion [21]. The internal aqueous phase was added dropwise to the oil phase, homogenizing in an Ultra Turrax (IKA, Model T 18 D S1, Staufen, Germany), for 5 min at 10,000 rpm. W/O/W emulsion was prepared by re-emulsifying the W/O emulsion in a 10%w/w WPI (Stern Ingredients, Tlalnepantla, Estado de Mexico, Mexico) solution (external aqueous phase) at 10,000 rpm for 1 min, using an Ultra Turrax homogenizer, at room temperature (22 °C). The mass ratio used of W/O emulsion to WPI dry basis was 1:1. A mass balance was used in order to obtain a final PC concentration of 0.5 mg GAE/gdw (gallic acid equivalents per gram of dry weight) in the spray dried W/O/W emulsions.

2.5. Spray Drying

SP of the W/O/W emulsions was accomplished with a semipilot spray dryer (GEA, Mobile Minor MM, Gladsaxe, Denmark) equipped with a pneumatic atomizer wheel. SP experiments were performed at 160–70, 160–80, 180–70 and 180–80 °C (inlet-outlet temperatures); these temperatures were selected based on previous results. Response variables were: EE-PC, RE-PC and RE-AC, expressed in percentage. BC and BX were only determined for the characterization and optimization of the extracts because after microencapsulation of such compounds the final concentration was lower than the detection limit of the technique employed.
Conventional SP microencapsulation of the concentrated purple cactus pear fruit extract was carried out using the same operating dryer conditions as in W/O/W emulsions. For this, a 30%w/w solution of MDX was prepared and left to stand overnight to eliminate air bubbles. Just as with W/O/W emulsions, a mass balance was applied to obtain the same concentration of PC (0.5 mg GAE/gdw) in the microcapsules. The resulting solutions were homogenized with a magnetic stirrer at 25 °C and dried in the spray dryer. Powders for both types of microcapsules were stored in sealed amber glass bottles and kept at −20 °C until analysis.

2.6. Preparation of Microcapsules for Analysis

2.6.1. W/O/W Emulsion before and after SP

Theoretically and ideally, PC should be confined in the inner part of the microcapsule, once the W/O/W emulsion is prepared. In order to determine the EE, the total PC content in the W/O/W emulsion before SP was analyzed, which includes PC in the inner aqueous phase of the microcapsule and on the outer aqueous phase, which becomes superficial PC after drying. For this, 3 g of W/O/W emulsion before SP were brought to a final volume of 10 mL with acetonitrile and shaken during 3 min with a vortex, to break the W/O/W emulsion and extract the internal aqueous phase. Subsequently, the mixture was centrifuged at 1900 g for 30 min. The supernatant was recovered with a pasteur pipette and was subject to determine total PC and AC. The blank for all evaluations consisted of a W/O/W emulsion, which in its internal aqueous phase contained a 4% NaCl aqueous solution (REASOL, Mexico City, CDMX, Mexico) [22], being dried under the same operating conditions. This blank W/O/W emulsion was subject to the same treatment explained above. PC were also determined in spray dried W/O/W emulsions, so they were reconstituted with phosphate buffer pH 7 (HYCEL DE MEXICO, S.A. DE C.V., Mexico City, CDMX, Mexico) at the same solids content of the initial W/O/W emulsion (before SP) by gently stirring for 30 min until complete rehydration [22]. In this case, the same procedure used for WO/W emulsions before SP was applied.
Superficial PC were also quantified separately, to determine the effectiveness of encapsulation before and after SP. In order to determine superficial PC in W/O/W emulsions, for EE determination, the method reported by Hemar et al., 2010 [23] was followed. 10 g of W/O/W emulsion before SP were subject to centrifugation at 1900 g for 20 min. This resulted in a thick cream layer and an aqueous subnatant. The subnatant was collected using a syringe and weighed. 3 g of the subnatant were taken to a final volume of 10 mL with acetonitrile and shaken for 10 s. Then it was subjected to centrifugation for 30 min at 1900 g. The supernatant was analyzed to determine PC. Superficial PC were also determined in W/O/W emulsion after SP in order to determine the effect of SP in PC encapsulation. In this case, 10 g of rehydrated W/O/W emulsion were subjected to the same process described before. A W/O/W emulsion blank was also used for this determination.

2.6.2. Conventional SP

For all determinations, microcapsules obtained by conventional SP were reconstituted in water at the same solids content as in the initial solutions (before SP), taking into account moisture content in the powders. From such dissolution, aliquots were taken to determine total PC and AC. The blank used for analysis was a MDX solution with no added extract, dried under the same drying conditions and subject to the same treatment explained above.
Superficial PC in microcapsules was determined in order to determine EE-PC in the powder obtained. 5 mL of an ethanol:methanol mix (1:1) (REASOL, Mexico City, CMDX, Mexico) were added to 0.5 g of powder, shaken for 1 min at room temperature, and filtered through a glass microfiber filter paper 0.6 µm pore size (ADVANTEC, Tokyo, Japan) [24]. The filtrate was analyzed to determine PC.

2.7. Total Phenolic Compounds Determination

Total phenolic compounds were determined according to Singleton and Rossi, 1965 [25]. For the analysis, specific aliquots (1 mL for example) of each sample were placed in separate test tubes, adding 7 mL of distilled water and 500 µL of Folin-Ciocalteu reagent; after 8 min, 1.5 mL of sodium carbonate (20%w/w) were added and left to stand for 60 min in the dark. Absorbance was measured at 750 nm in a spectrophotometer (Jenway 6320D, Staffordshire, UK). Results were expressed as milligrams of gallic acid equivalents per gram of dry weight (mg GAE/gdw), using a standard calibration curve.

2.8. Antioxidant Capacity Determination

AC was determined using the ABTS (2,2′-azino-bis-3-ethylbenzothiazoline-6-sulphonic acid) radical (Sigma-Aldrich, Moscow, Russia) [26]. Trolox (6-hydroxy-2,5,7,8-tetramethylchroman-2-carboxylic acid) (Sigma-Aldrich, Buchs, Switzerland) was used as standard. The ABTS radical was generated combining 7 mM stock solution of ABTS and 140 mM of potassium persulfate and keeping it in the dark for 16 h, at room temperature. Then the radical was diluted with ethanol in order to obtain an absorbance of 0.7 (±0.05) at 734 nm. Specific aliquots of each sample were mixed with 3 mL ABTS solution; absorbance was monitored after 6 min. For the solutions before SP and reconstituted powders obtained with conventional SP, a previous precipitation of the encapsulating agent was made with ethanol because it is insoluble in this solvent. Then the solution was filtered through a glass microfiber filter paper 0.6 µm pore size (ADVANTEC, Tokyo, Japan). Aliquots of the filtrate were taken for analysis. The inhibition percentage (%) was determined with Equation (1), against a standard calibration curve of inhibition % vs. µmol TE/gdw (Trolox equivalents micromoles per gram of dry weight).
% = ( C o n t r o l   A b s S a m p l e   A b s C o n t r o l   A b s ) × 100
where Abs: absorbance. Results were expressed as µmol TE/gdw.

2.9. Betalain Determination

Betalain content was quantified by determining the absorbance at 535 (BC) and 480 nm (BX), according to Castellanos and Yahia, 2008 [27]. Equation (2) was used to determine the results:
B ( m g g ) = ( ( A b s × D F × M × V ) ( ε × W × L ) ) × 100
where B: betacyanin or betaxanthin, Abs: absorbance at 535 (BC) or at 480 nm (BX); DF: dilution factor; M: molecular weight (Betanin: 550 g/mol or Indicaxanthin: 308 g/mol); V: extract volume; ε: molar extinction coefficient (Betanin: 60,000 L/mol·cm or Indicaxanthin: 48,000 L/mol·cm); W: sample quantity (g) and L: cuvette length (1 cm). Results were expressed, for BC as milligrams of betanin equivalents per gram of dry weight (mg BE/gdw) and for BX as milligrams of indicaxanthin equivalents per gram of dry weight (mg IE/gdw).

2.10. Ascorbic Acid Determination

5 g of fresh ground cactus pear fruit were mixed with 3%w/w metaphosphoric acid in a 10 mL volumetric flask; the solution was then filtered with Whatman paper No. 1 (Whatman Ltd., Maidstoine, UK). 2 mL of the filtrate were continuously and quickly mixed with 2 mL of an acetate buffer solution pH 4 (HYCEL DE MEXICO, S.A. DE C.V., Mexico City, CDMX, Mexico), 3 mL of 2,6-dichlorophenolindophenol (Fisher Chemicals, Mumbai, India) and 15 mL of xylene (REASOL, Mexico City, CDMX, Mexico), in a glass tube, mixing vigorously for 15 s. The xylene phase was separated and anhydrous sodium sulfate was added to eliminate any trace of water. Ascorbic acid was determined at 520 nm, using xylene (REASOL, Mexico City, CDMX, Mexico) as blank, against a standard calibration curve [28].
Calculation of AA to determine concentration, was performed with Equation (3):
m g   A A g = ( A a × V f ) ( V i × W )
where: Aa: ascorbic acid in aliquot, Vf: final volumen, Vi: mL of filtrate used for the analysis, and W: sample weight. Results were expressed as milligrams of ascorbic acid per gram of dry weight (mg AA/gdw).
It is important to mention that ascorbic acid was degraded during freezing and drying processes of cactus pear fruit, so the residual amount in extracts was not detected and therefore it was not considered for the subsequent processes.

2.11. Determination of Moisture Content and Total Solids

Moisture content was determined using a thermobalance (OHAUS MB200, Parsippany, NJ, USA), placing 0.5 g of the sample at 100 °C until there was no change in weight greater than 0.01 g in 90 s [22]. Duplicated analyses were made. Total solids were determined by difference.

2.12. Retention and Encapsulation Efficiency Determination

Retention efficiency (RE) was calculated by determining the PC or AC content in solutions before and after SP, expressing the result in percentage. The following equation (Equation (4)) was used:
R E   ( % ) = ( P C   o r   A C   c o n t e n t   o b t a i n e d   i n   p o w d e r / g d w P C   o r   A C   c o n t e n t   o b t a i n e d   i n   s o l u t i o n   b e f o r e   S P / g d w ) × 100
EE-PC was calculated according to Equation (5):
E E P C   ( % ) = ( T o t a l   P C   c o n t e n t s u p e r f i c i a l   P C   c o n t e n t T o t a l   P C   c o n t e n t ) × 100

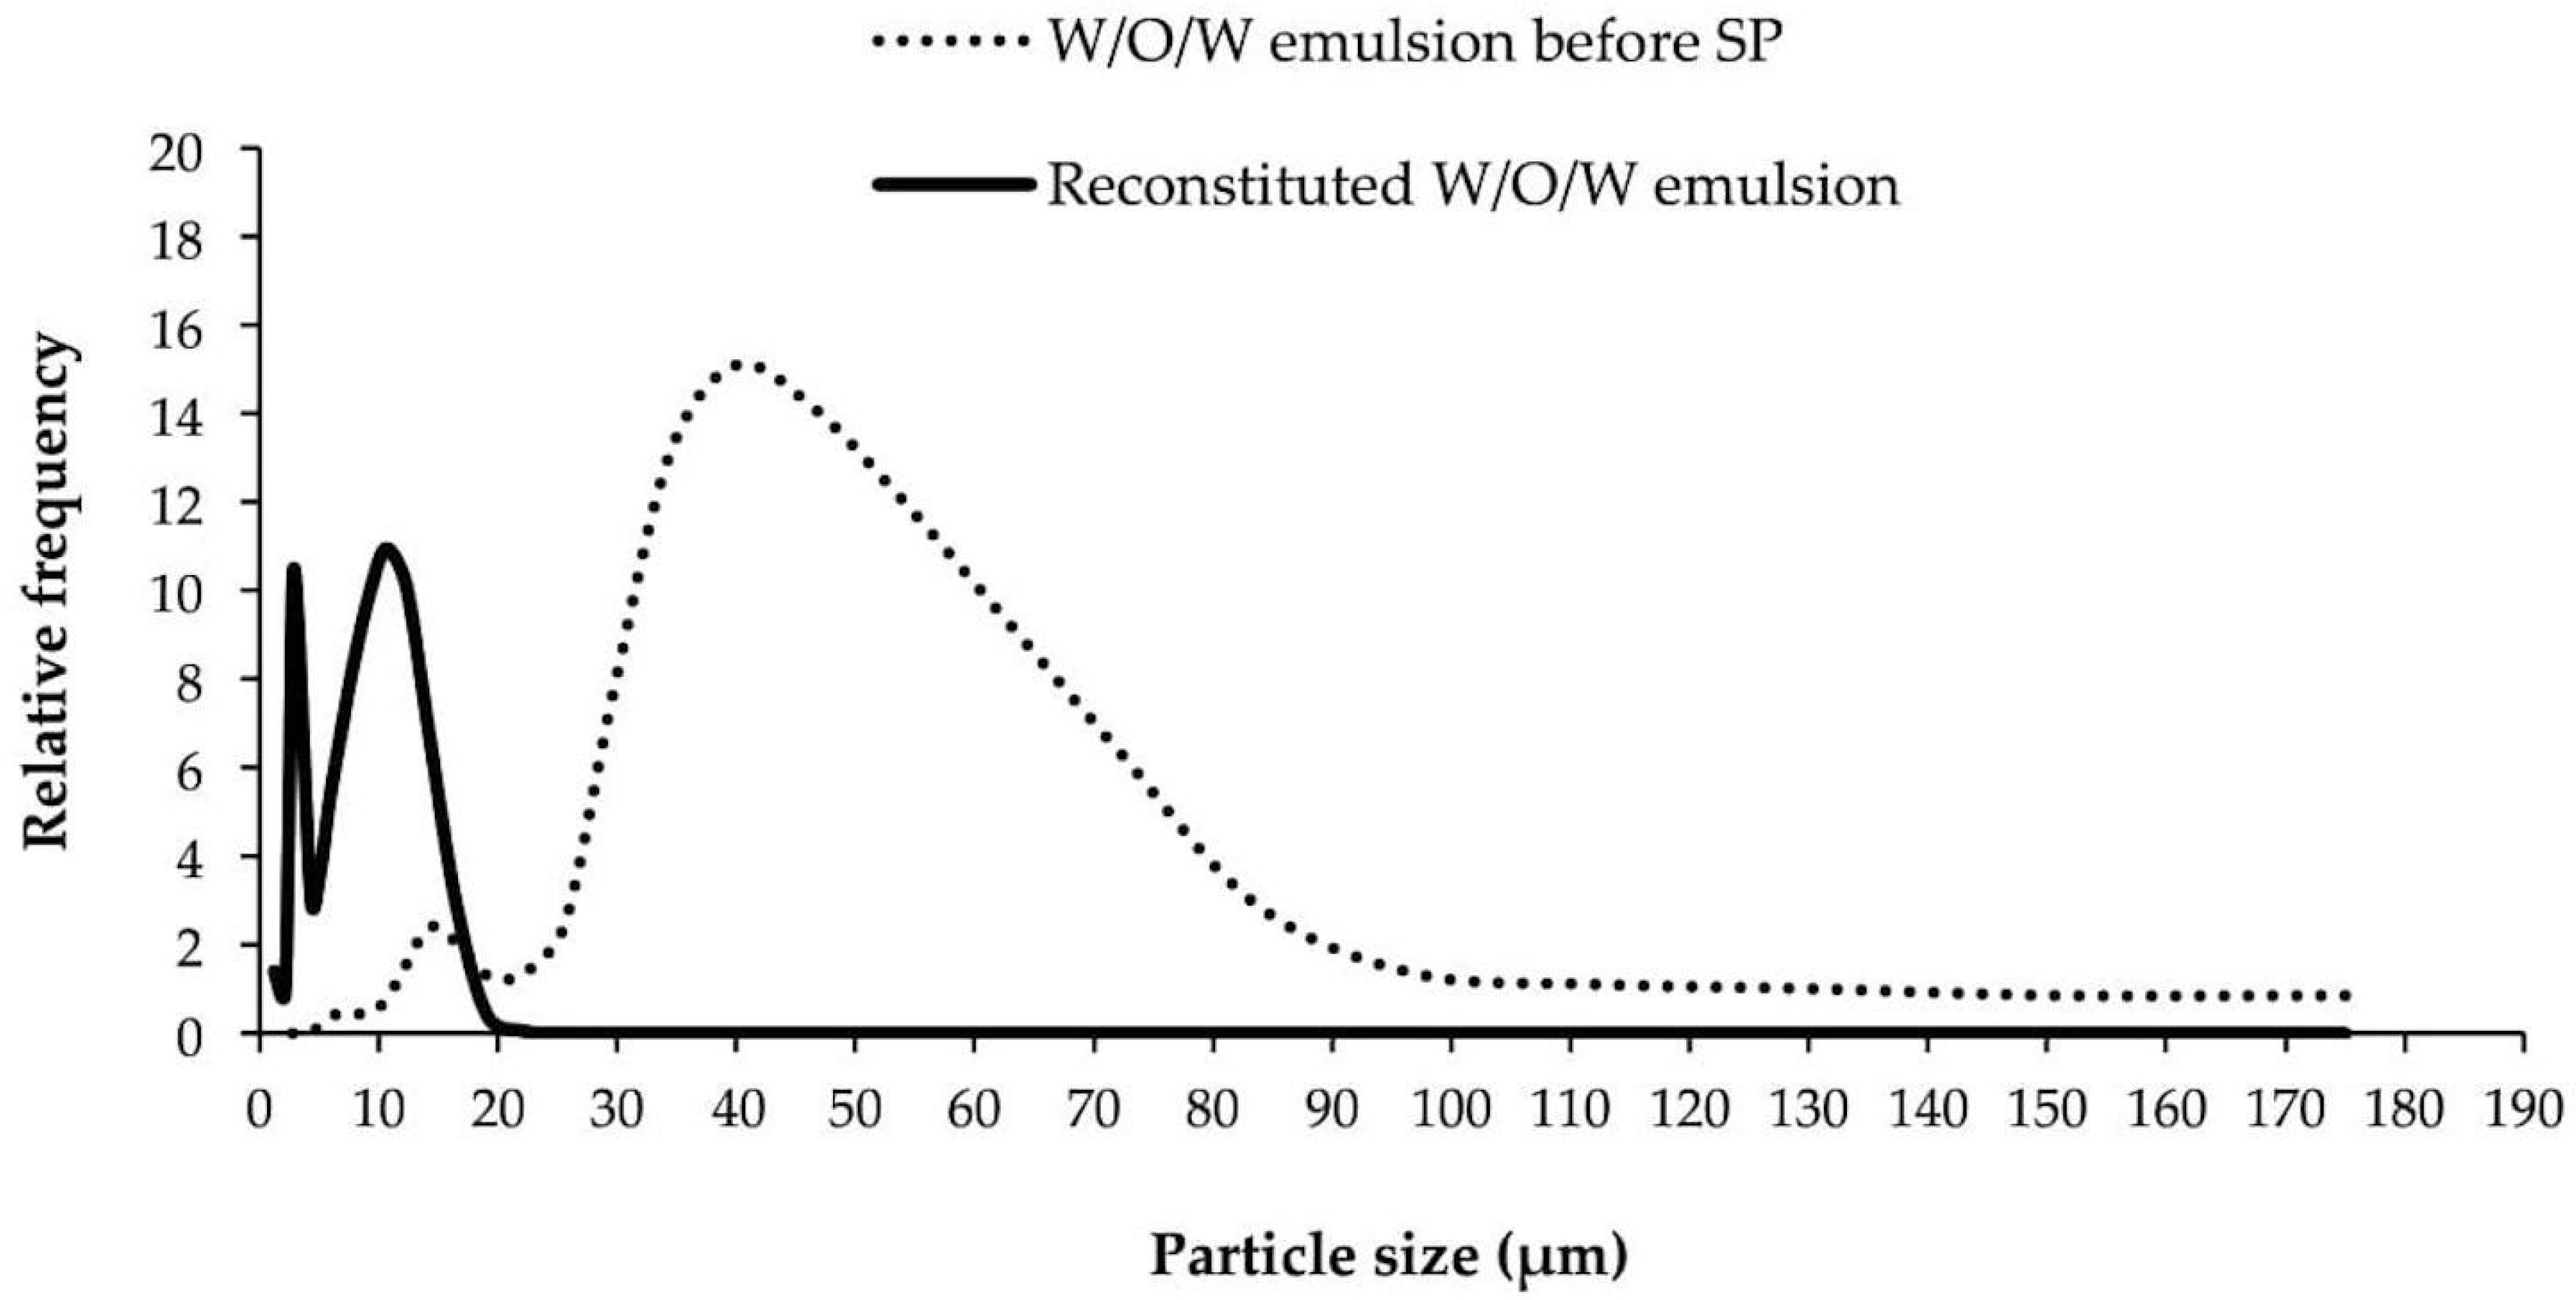
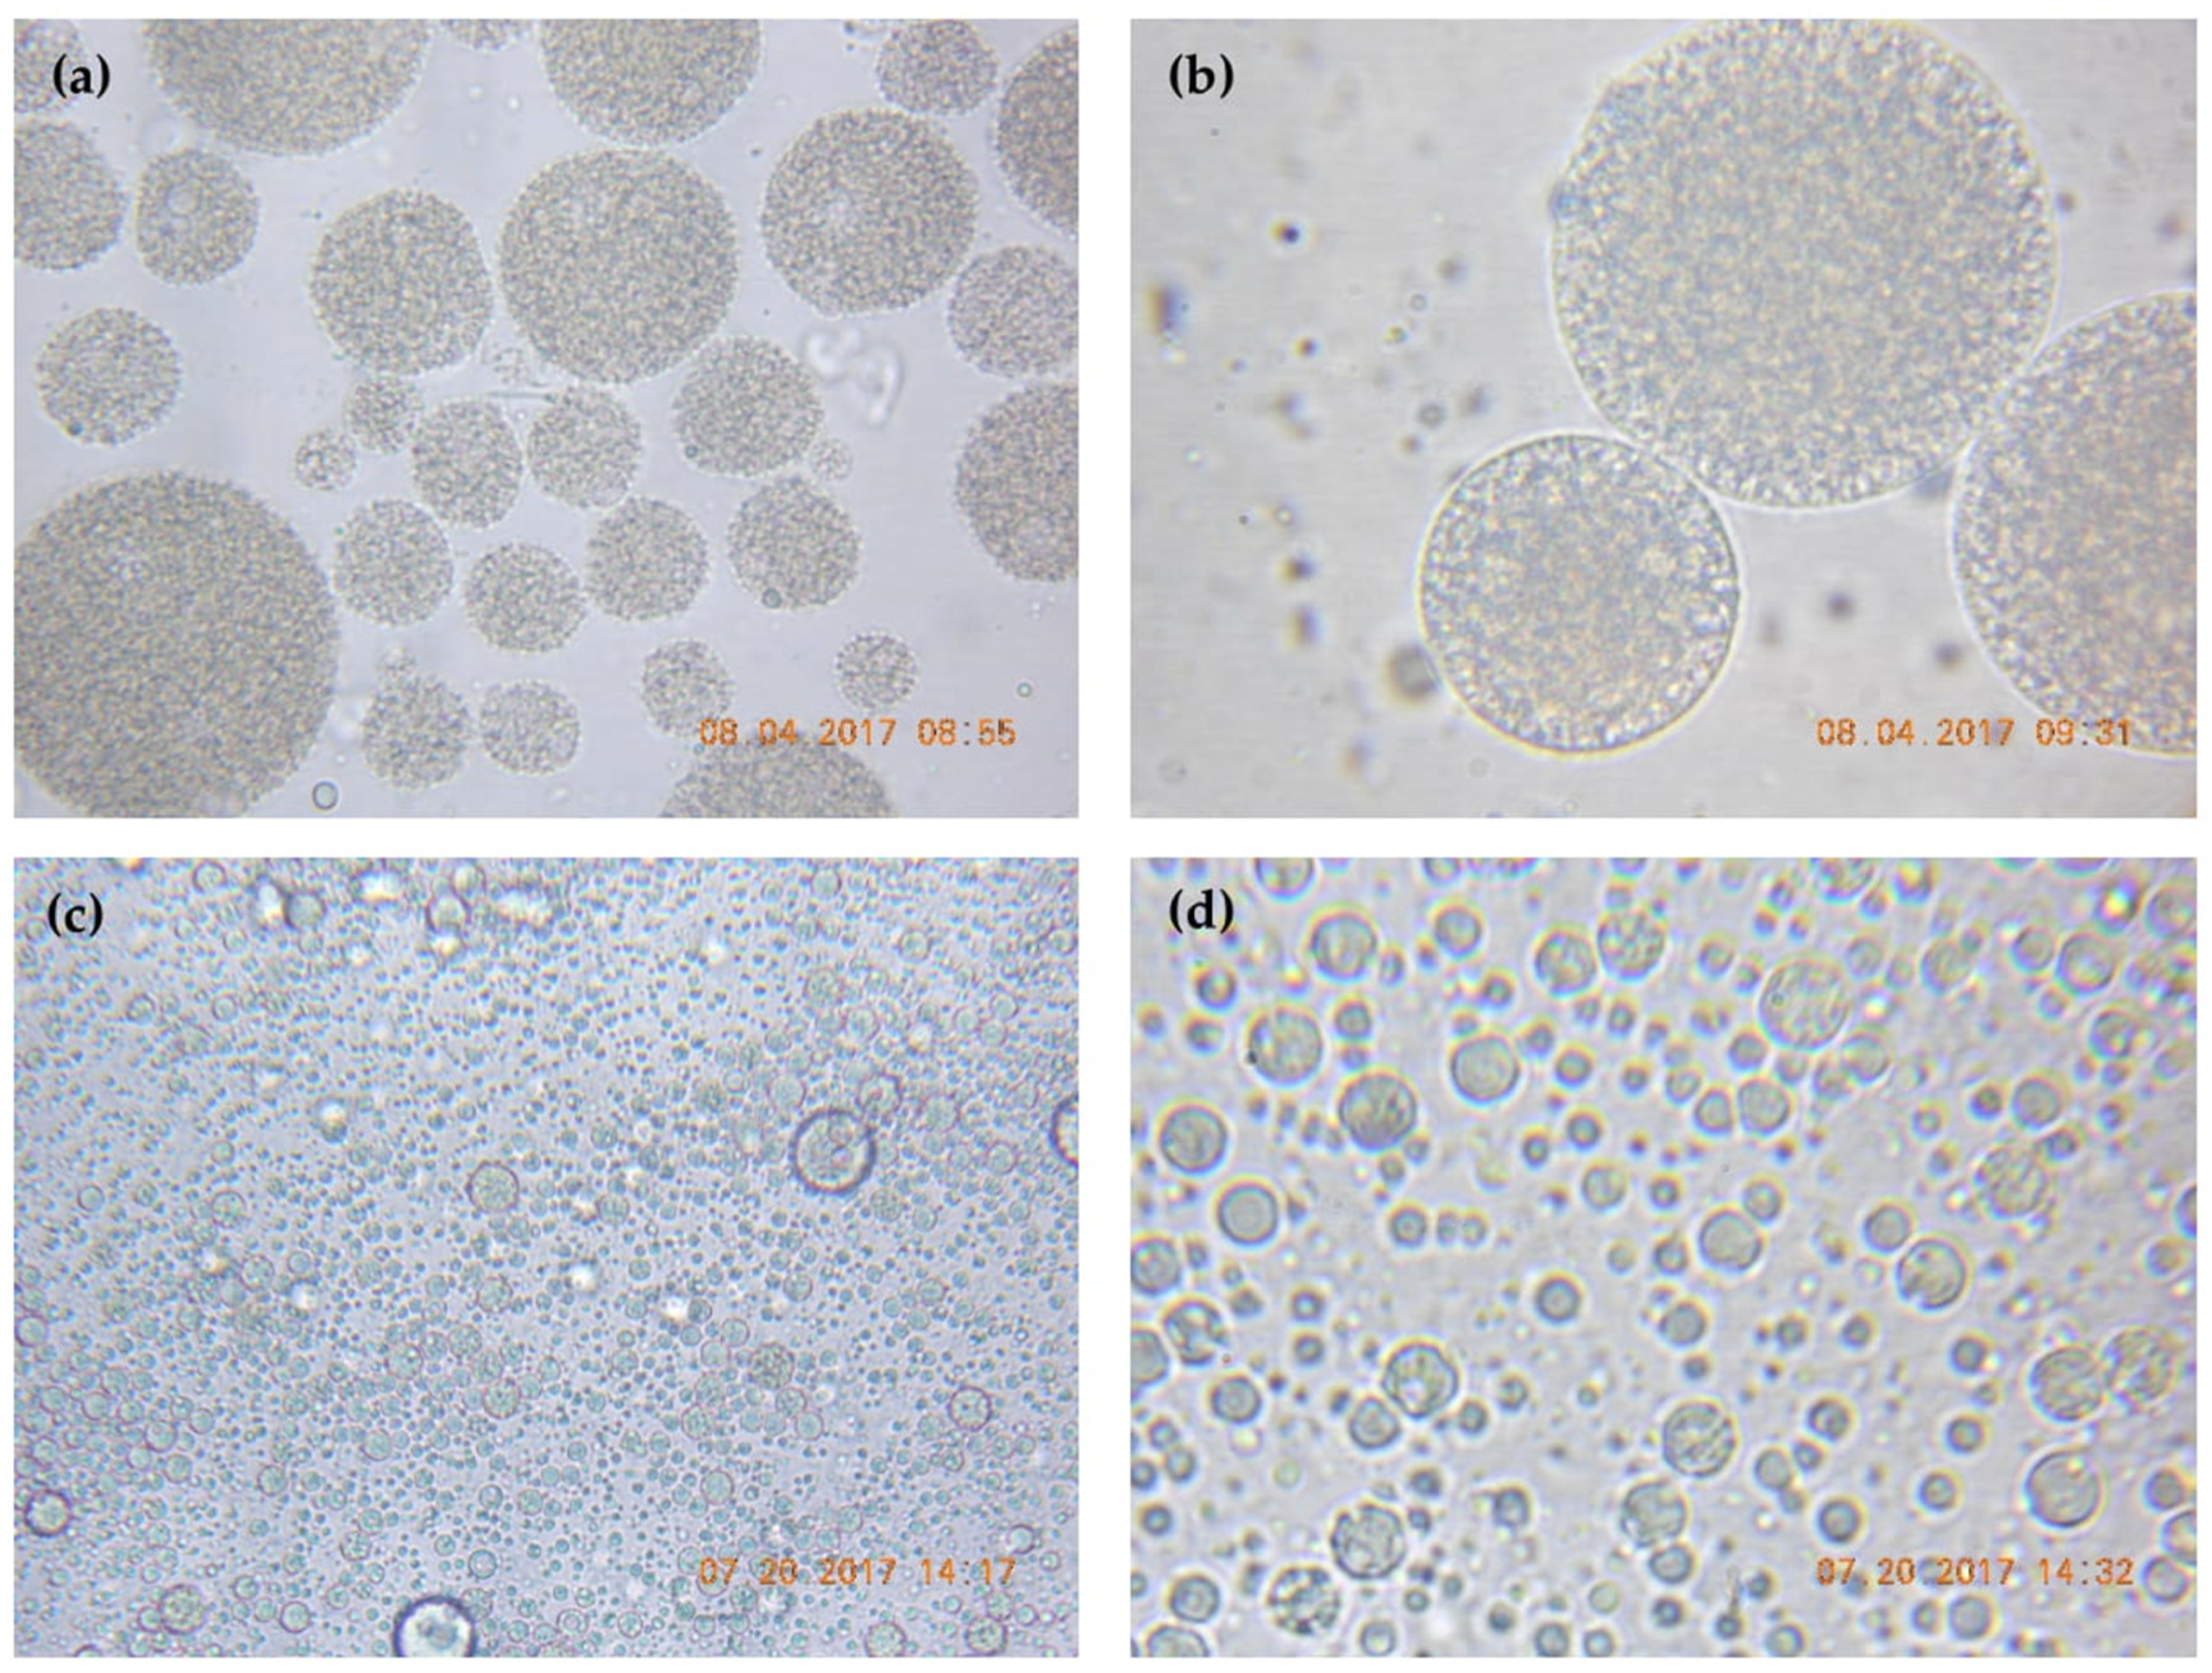
2.13. Integrity of W/O/W before and after Spray Drying

Recently prepared W/O/W emulsion was placed on a microscope slide and then covered with a cover slip. The microstructure of the W/O/W emulsion was then observed using a Velab optical microscope (Velab Co., McAllen, TX, USA) at a magnification of 100×, 400× and 1000×. The integrity of the W/O/W emulsion after SP was also determined to confirm that it remained intact after the process. 0.2 g of the dried microcapsules were rehydrated in 10 mL of phosphate buffer pH 7.0, stirring for 30 min for complete rehydration [22]. A drop of the solution was placed on a microscope slide and covered with a cover slip. A Nikon Coolpix Digital Camera (16 megapixels) (Nikon Corp., Shangai, China) was adapted to capture the images.

2.14. Particle Size Distribution Determination

Particle size distribution was determined in a laser diffraction particle size analyzer (Malvern IM 026, 2006 series, Malvern, UK). Spray dried samples were dispersed in hexane (REASOL, Mexico City, CDMX, Mexico); W/O/W emulsions before SP and reconstituted emulsions were dispersed in water, under constant stirring. For the samples mentioned above, a 100 mm lens was used to determine particle size. Particle size was also determined in primary emulsions (W/O), dispersing in canola oil and using a 63 mm lens. Equivalent spherical diameter (D[4,3]) and Sauter diameter (D[3,2]) were determined with the same equipment.

2.15. Surface Morphology Determinaton

Scanning electron microscopy images were taken for microcapsules obtained with the drying conditions 160–80 °C for both methodologies. Microcapsules were put in double-faced adhesive tape stubs and coated with gold and observed in a scanning electron microscope using a 500 and 1000× magnification (Jeol, JSM-5800LV, Peabody, MA, USA).

2.16. Statistical Analysis

Results were expressed as the average ± standard deviation of 2 or 3 determinations, according to the case. Analysis of variance (ANOVA) was performed with Minitab statistical software, version 17 (Minitab Inc., State College, PA, USA). Mean comparisons were performed using Tukey’s test at a 95% confidence interval (p < 0.05).

3. Results and Discussion

3.1. Characterization of Fresh Whole Purple Cactus Pear Fruit

Table 1 summarizes the results obtained of the characterization of fresh purple cactus pear fruit. Albano et al., 2015 [29], reports PC, BC, AA, and AC for Italian purple cactus pear fruit pulp extract. Higher PC and AC values were obtained in the present investigation, probably because the whole fruit´s content was determined and cactus pear fruit peel normally presents higher PC content than pulp. In the case of BC and AA, values were lower than the results for Albano et al., 2015 [29], indicating that these compounds are mainly found in the pulp. Fernández et al., 2010 [30], reported similar results on PC, BC, BX, and AA content of whole red cactus pear fruit (taking in consideration an 85% moisture content). AC was higher in the present work than the previous mentioned report. The higher AC found in purple cactus pear fruit may occur because of a possible combination of the individual antioxidants that may produce synergistic effects [31].

3.2. Characterization of Dry Whole Purple Cactus Pear Fruit and Each of Its Separate Parts (Peel, Pulp, and Seeds)

Results of the characterization of dry whole purple cactus pear fruit and each of its separate parts are shown in Table 2, indicating that seeds were not worth considering since their PC input was very low and they ¨diluted¨ the rest of bioactive compounds in the dry product. For this reason, seeds were not used for extractions in the experiments. On the other hand, peel was worth considering since PC and AC content was higher than in pulp.

3.3. Optimization of Extraction Parameters of Bioactive Compounds from Purple Cactus Pear Fruit Peel and Pulp

Experiments corresponding to the BBD were carried out in order to optimize the extraction of PC and betalains from peel and pulp of purple cactus pear fruit. In order to obtain regression equations, experimental data was analyzed and adjusted to linear and quadratic models. The values of the determination coefficient (R2), adjusted determination coefficient (R2 adj), and lack of fit were taken into account to check the model adequacy. Results are shown in Table 3, indicating that the linear model was statistically significant (p < 0.05) for PC and BC but in the case of BX, no model had a good adjustment, revealing that the studied variables had no significant effect on the extraction of these pigments.
R2 indicates, in the case of PC for example, that 90.84% of the experimental data were compatible [32] but for BX less experimental data was compatible, leading to a poor adjustment of the studied models. The final equation obtained in terms of uncoded factors is given below:
PC = 11.00 + 0.329 TEMP − 0.0552 SOLVENT − 0.0310 TIME − 0.00332 TEMP × TEMP + 0.000026 SOLVENT × SOLVENT + 0.000021 TIME × TIME + 0.000125 TEMP × SOLVENT + 0.000428 TEMP × TIME + 0.000233 SOLVENT × TIME
BC = −0.113 + 0.02103 TEMP − 0.00217 SOLVENT + 0.00156 TIME − 0.000199 TEMP × TEMP + 0.000019 SOLVENT × SOLVENT + 0.000003 TIME × TIME − 0.000005 TEMP × SOLVENT − 0.000044 TEMP × TIME − 0.000006 SOLVENT × TIME
BX = 0.2013 + 0.00335 TEMP − 0.00210 SOLVENT + 0.000923 TIME − 0.000047 TEMP × TEMP + 0.000010 SOLVENT × SOLVENT − 0.000002 TIME × TIME + 0.000034 TEMP × SOLVENT − 0.000006 TEMP × TIME − 0.000007 SOLVENT × TIME

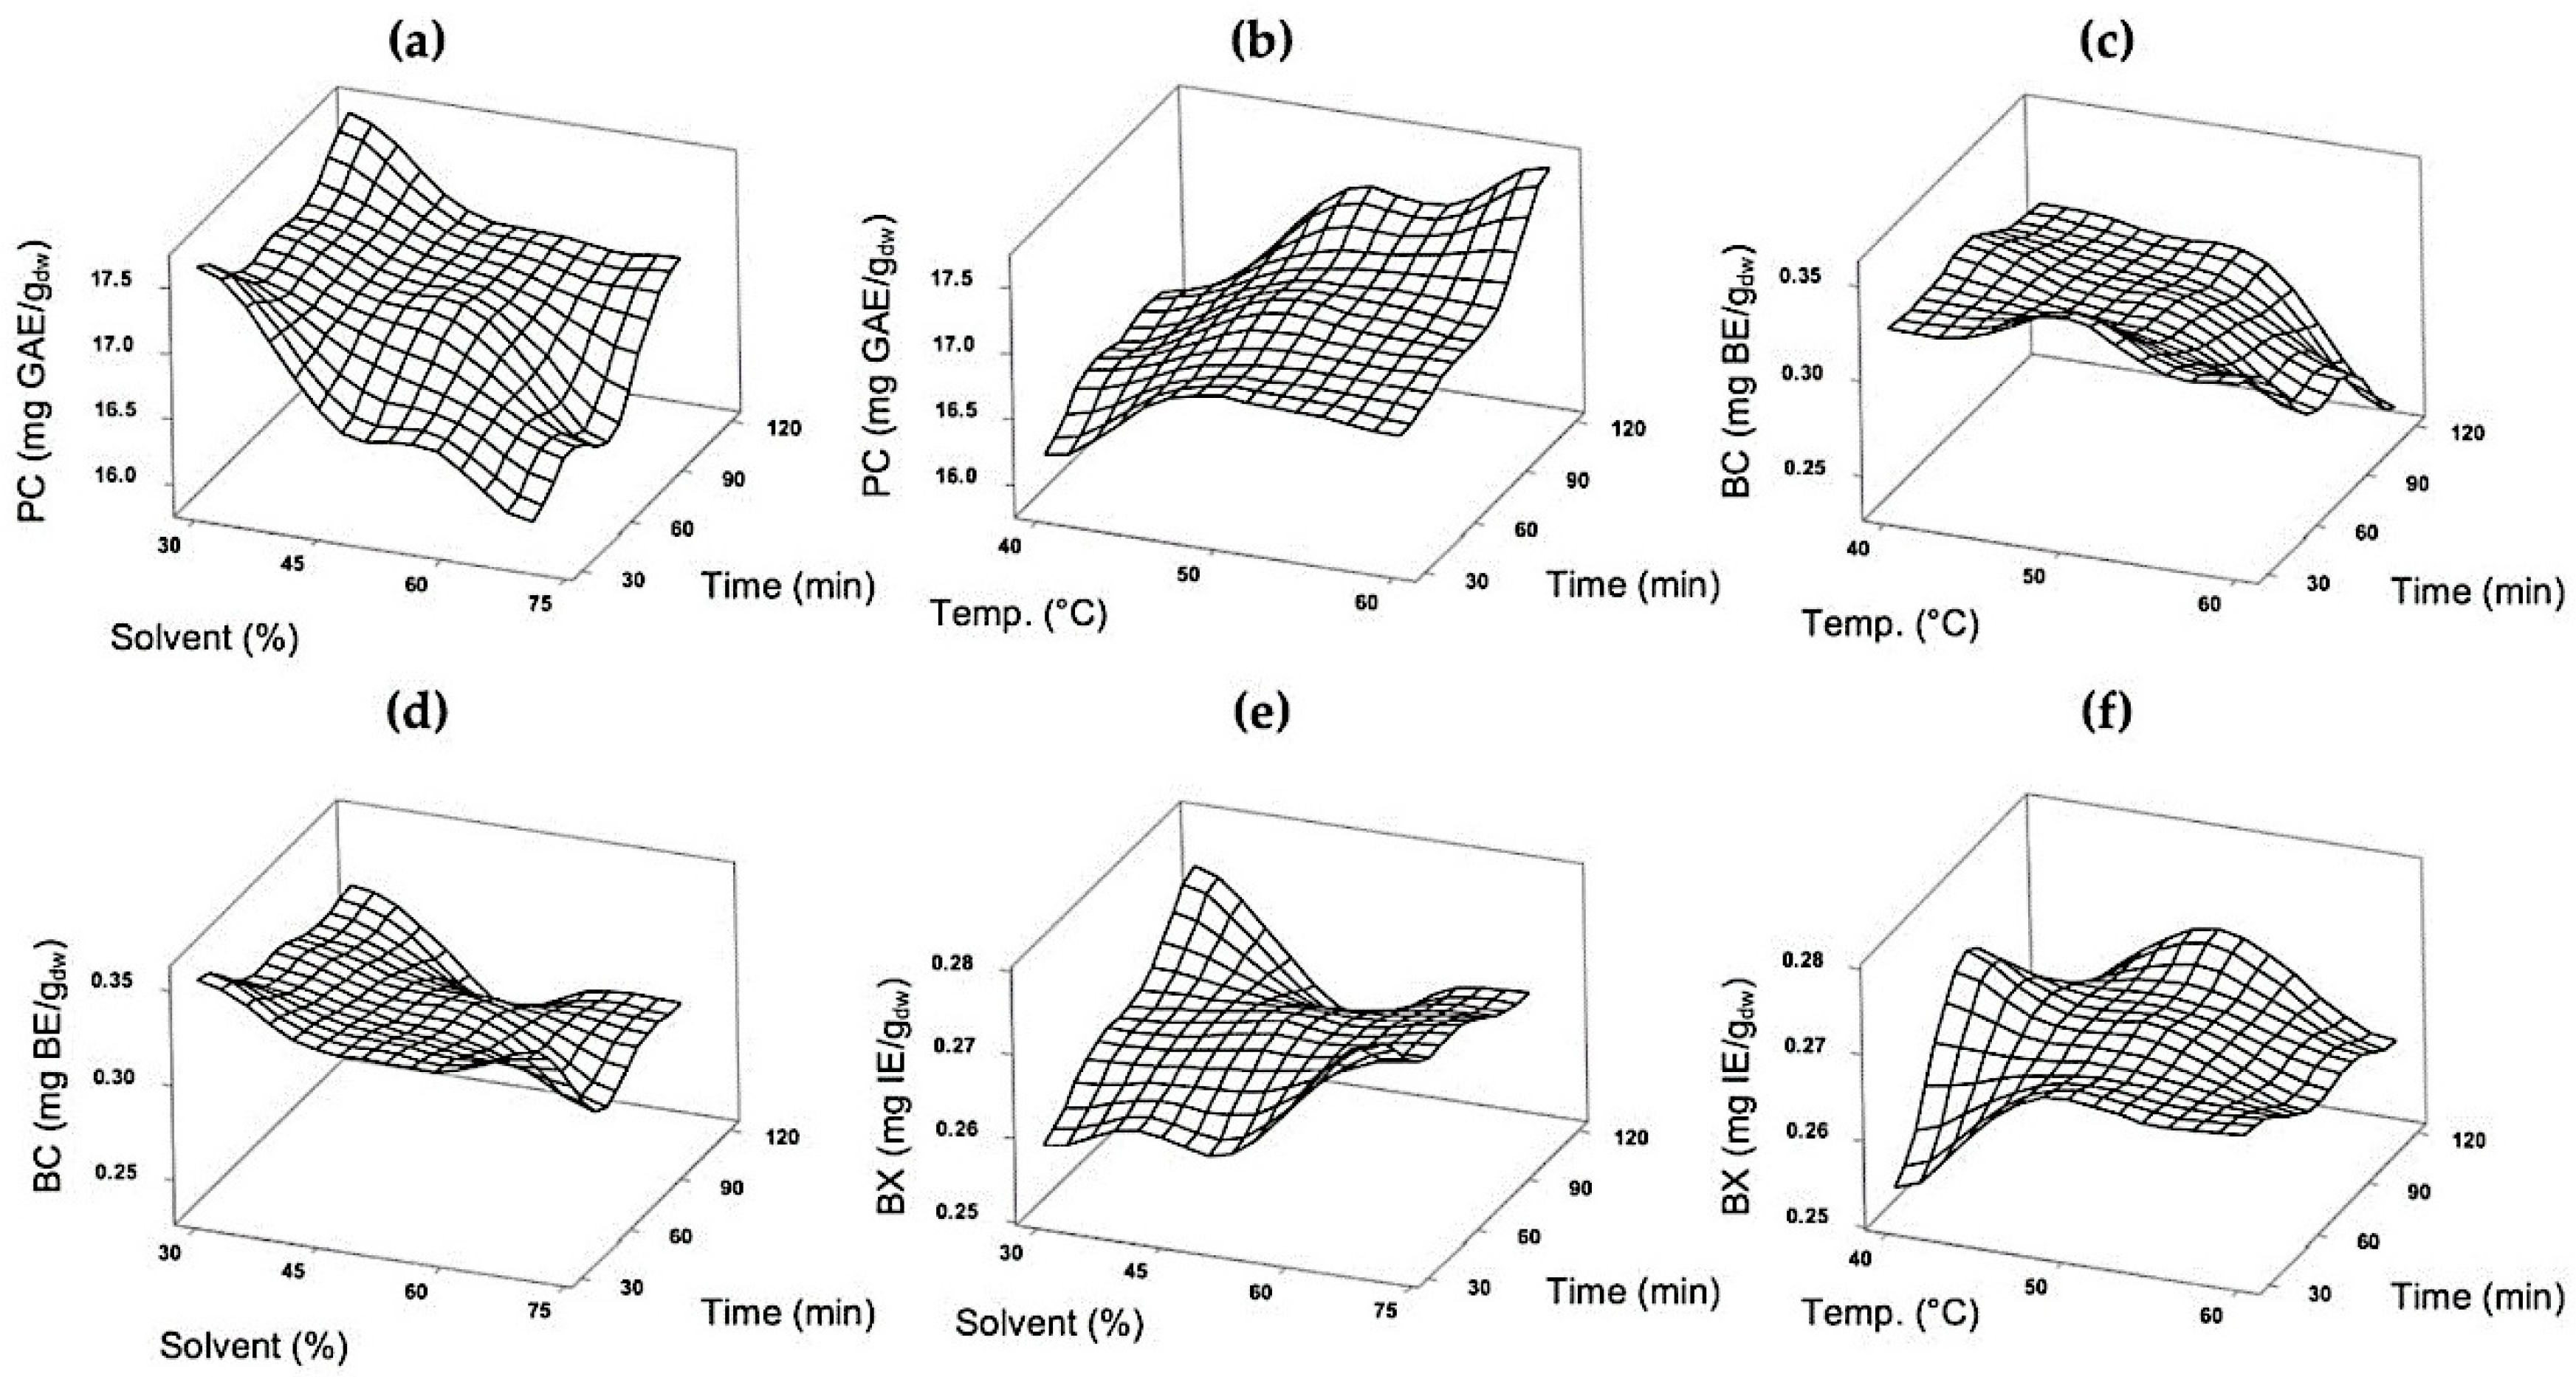
3.3.1. Effect of Process Variables in Phenolic Compounds and Betalain Extraction

The effect of process variables on PC extraction was studied through analysis of variance, which indicated that solvent concentration and temperature had a significant effect (p < 0.05) on the extraction of PC while the variable time had no effect. Figure 1a,b presents the surface plots that indicate that low ethanol concentration (30–35%w/w) and an intermediate-high temperature (50–55 °C) favors PC extraction.
In the case of BC, analysis of variance demonstrated that all process variables had a significant effect (p < 0.05) on their extraction; an interaction between temperature and time was also significant. Figure 1c shows that at lower temperatures (40–50 °C) and less time, BC extraction is higher. Figure 1d shows that with lower ethanol concentration, a higher yield of BC was obtained, however the solvent interval was quite broad (up to 45%w/w).
For BX, as mentioned before, the analysis of variance indicated that no factor had a significant effect on yield of extraction (Figure 1e,f); in general, regardless of time, temperature, and solvent concentration used, BX extraction was not altered. These results indicate that BX are more resistant, regarding time and temperature, than BC, which agrees with other reports [33].

3.3.2. Determination of Optimum Extraction Conditions

Optimum extraction conditions for PC and BC were determined, without including BX since no process variables affected its extraction. The Derringer’s desirability function (D) method was employed to optimize the process variables. This function searches a combination of process variable levels that jointly optimize a set of responses studied in the experimental design [32]. Optimum conditions were: extraction at 52 °C, for 30 min and using 30% aqueous ethanol as the solvent. With these conditions, it was expected to obtain 17.64 mg GAE/gdw (PC) and 0.36 mg BE/gdw (BC) with a D value of 0.9963, indicating that an excellent optimization was achieved, since the optimization was intended to maximize all responses and the value of 1 and 0 were set as the maximum and minimum desirability, respectively. An experimental test was made in order to prove the predicted values. Results obtained were: 18.12 ± 0.04 mg GAE/gdw and 0.38 mg BE/gdw. BX content was also determined, obtaining 0.29 mg IE/gdw. The experimental values were very close to the predicted ones.
Taking into account the experience gained while working with the extracts of the raw material (peel and pulp powder), a second optimization test was carried out, using 40%w/w instead of 30%w/w aqueous ethanol as solvent. This was attempted because while using 30%w/w aqueous ethanol, since it has more water, when extracting, it drags hydrocolloids or mucilaginous compounds that make the subsequent processes difficult and impractical. It must be also taken into consideration that the extract has to be concentrated in order to be used for microencapsulation, therefore the presence of more water and mucilaginous material makes concentration of the extract to become slower.
The optimized conditions for the second optimization test were: 52 °C, for 30 min, using 40%w/w aqueous ethanol as solvent. Predicted values were: 17.24 mg GAE/gdw (PC) and 0.35 mg BE/gdw (BC) with a D value of 0.8520, which was also a good value for optimization. Triplicate experiments were carried out to validate the predicted values and the obtained results were: 17.39 ± 0.11 mg GAE/gdw (PC) and 0.35 mg BE/gdw (BC). As before, BX content was also determined, obtaining 0.26 mg IE/gdw. Experimental results were again very similar to predicted values. A Tukey test was made to determine whether the results (PC, BC, and BX was also included) for both optimization tests were significantly different. Tukey’s test indicated all results were different (p < 0.05), having higher yields with the first set of conditions (52 °C, for 30 min and using 30%w/w aqueous ethanol as solvent). Despite this result, it was decided to use the following extraction conditions: 52 °C, for 30 min, using 40%w/w aqueous ethanol as solvent, since in a practical basis, these conditions would facilitate other processes and represent a lower processing time and cost.
The extract obtained under the selected conditions, which in wet base had approximately 0.7 mg GAE/g extract, was concentrated in a rotavapor at 40 °C until a PC concentration of 2.9 mg GAE/g of extract (15 mg GAE/gdw extract) was achieved.

3.4. Microencapsulation with W/O/W Emulsion

It was mentioned in Section 2.4 that the target concentration of PC in spray-dried microcapsules was 0.5 mg GAE/gdw. The reason why this concentration was selected is related to the amount of concentrated extract required to give a particle size in the primary W/O emulsion lower than 1 µm, since such size ensures a higher stability to W/O/W emulsion [34]. During the process of developing W/O/W emulsion, it was found that concentrations of PC higher than 0.5 mg GAE/gdw in the final spray dried double emulsions, affected the primary W/O emulsion particle size, obtaining values higher than 1 µm. With 0.5 mg GAE/gdw as the final concentration of PC in spray dried W/O/W emulsions, the particle size in W/O was 0.87 ± 0.03 µm. The blank emulsion (using 4% NaCl (REASOL, Mexico City, CDMX, Mexico) as aqueous internal phase) had a particle size of 0.63 ± 0.01 µm. As can be seen, particle size obtained of the W/O emulsion in this investigation was below 1 µm, and therefore it was adequate to be used in the microencapsulation process. These values are comparable with Cárdenas-Bailón et al., 2015 [22], who reported a particle size of 0.77 µm for W/O emulsion, using insulin solutions as aqueous internal phase. Particle size was also determined in W/O/W emulsion before SP and the results are shown in Section 3.6.

3.5. Spray Drying

Both microencapsulation methodologies (conventional SP and the combination of double emulsions-spray drying (W/O/W-SP)) were carried out, and results for retention and encapsulation efficiencies are shown in Figure 2. The effect of each set of operating temperatures (inlet and outlet temperature) on response variables (EE-PC, RE-PC, and RE-AC) was studied through a one-way analysis of variance and Tukey’s test.

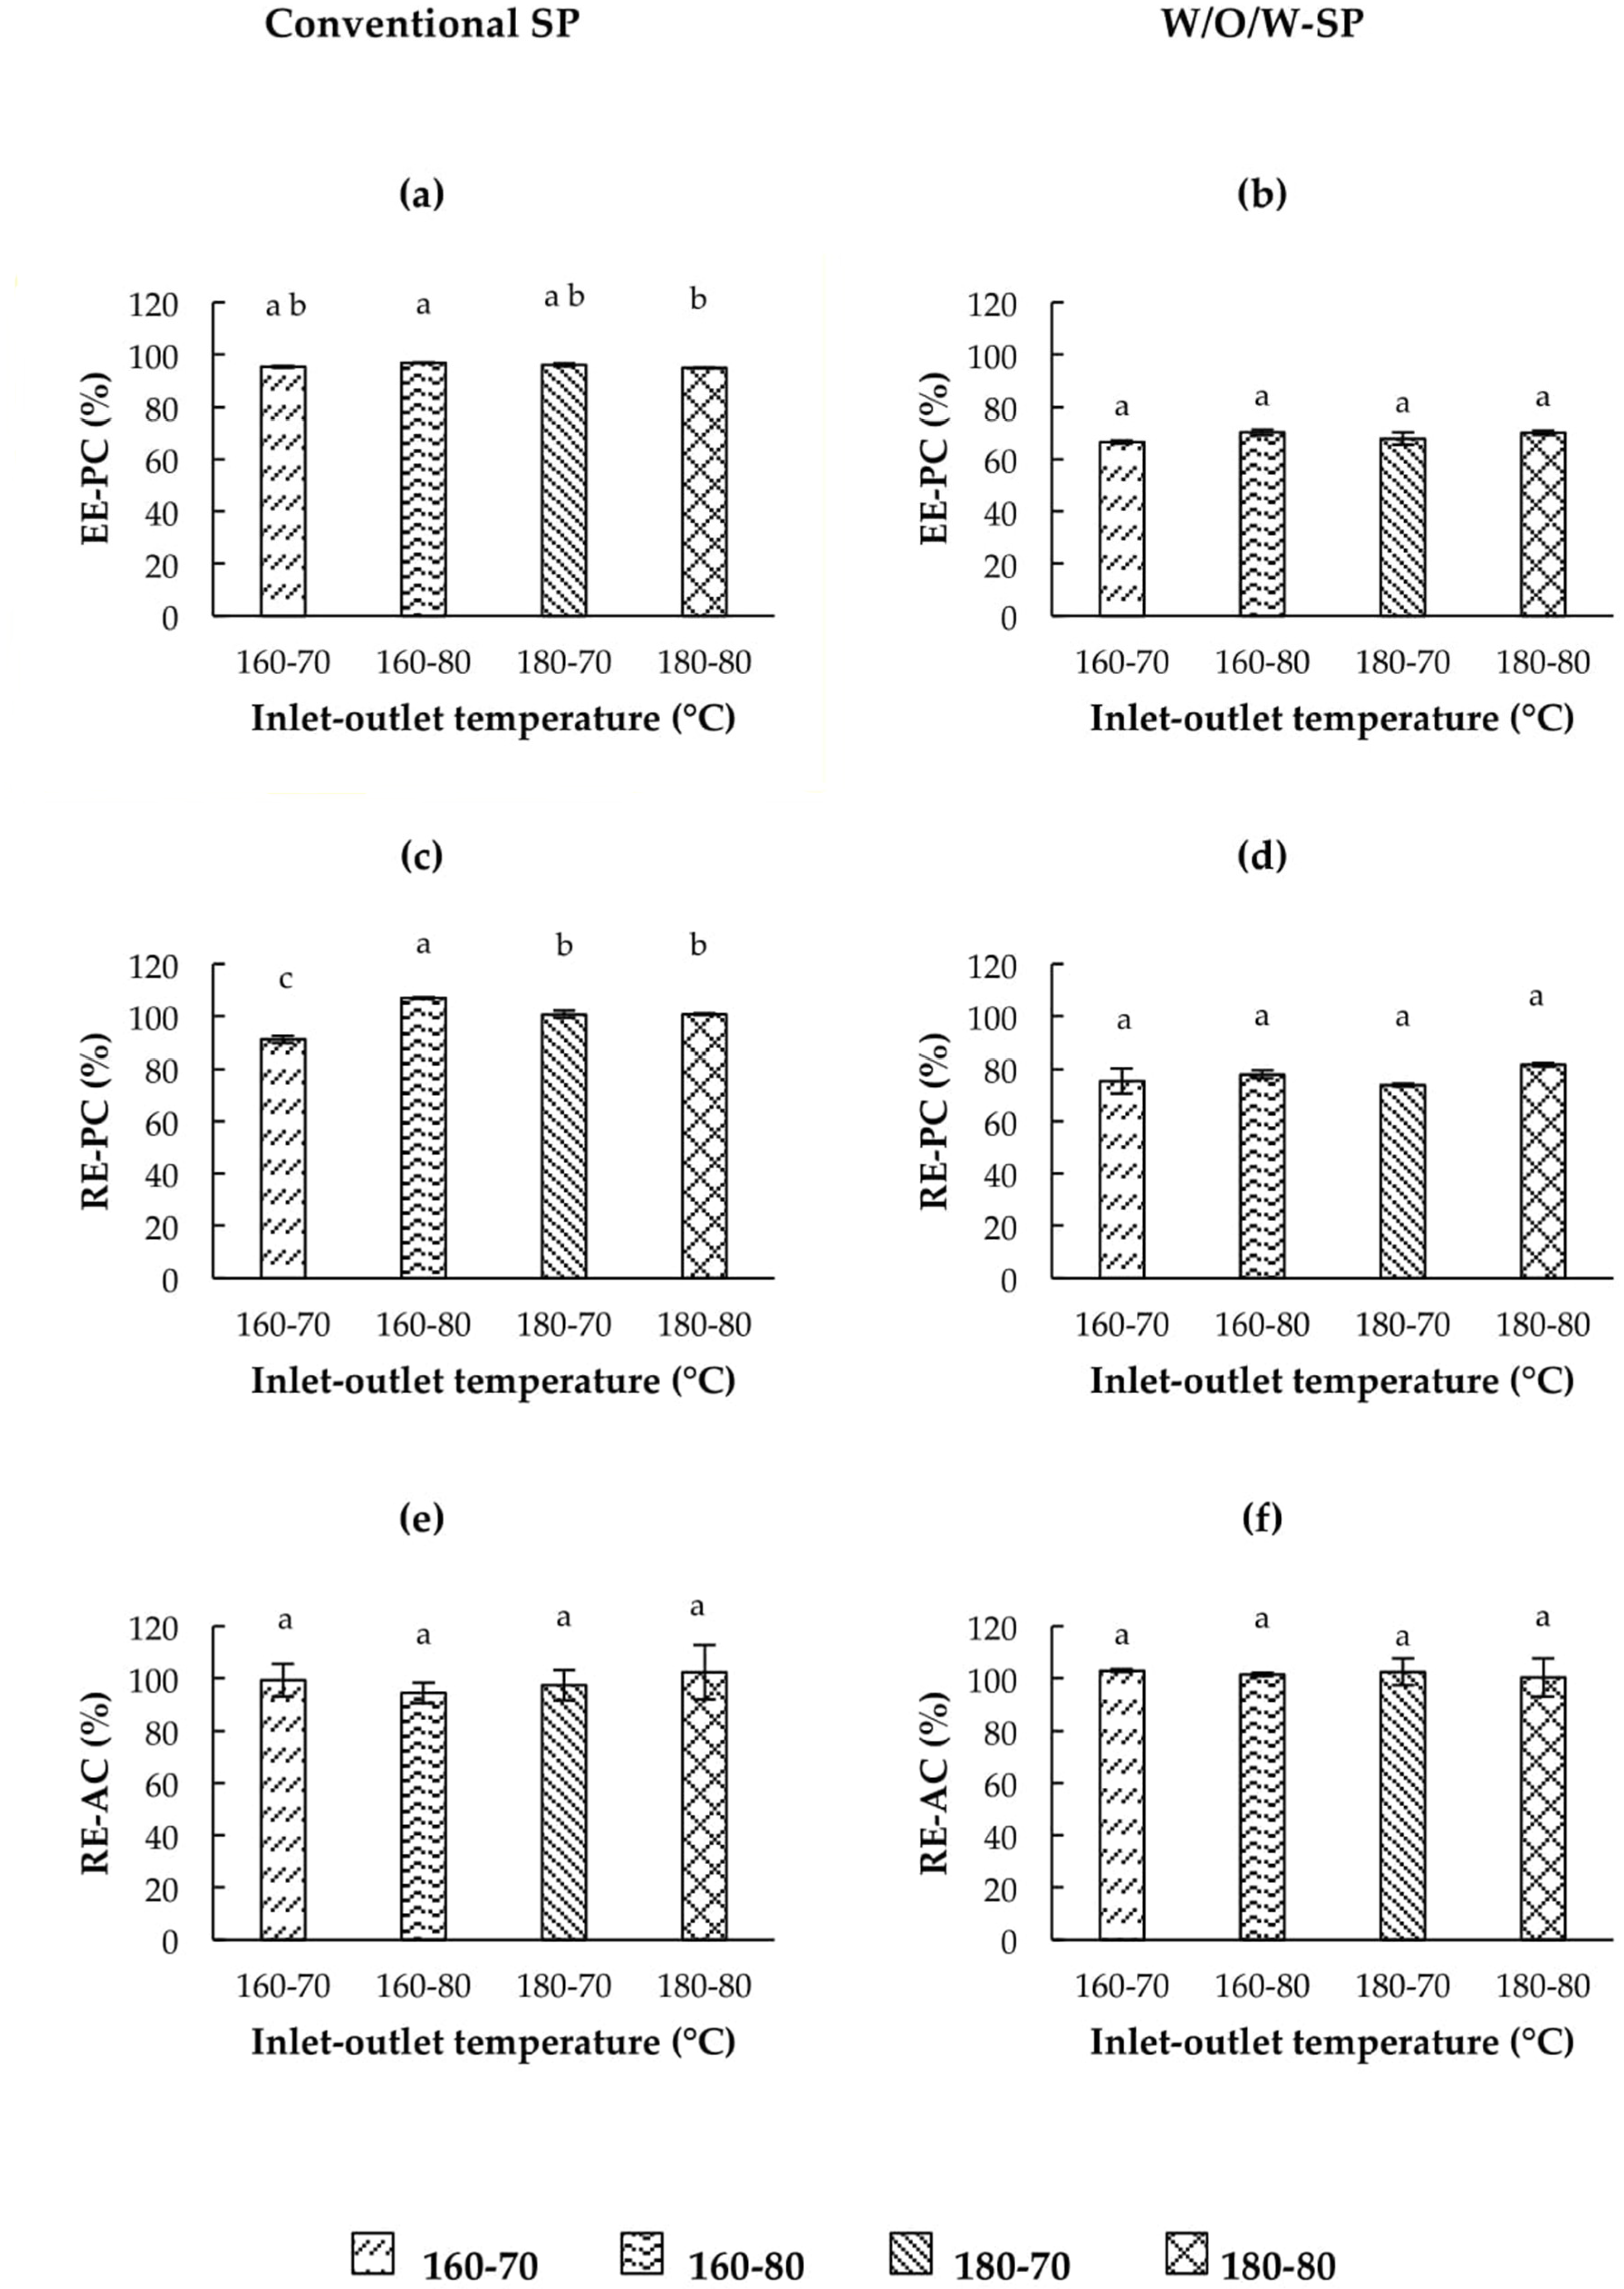
3.5.1. Encapsulation Efficiency of Phenolic Compounds (EE-PC)

EE-PC results for conventional SP are presented in Figure 2a, showing that in general, 95% of PC were successfully encapsulated. Analysis of variance indicated that the highest value of EE-PC (97%) was obtained with the combination 160–80 °C (p < 0.05), however, since variability was very low, differences are minimum with the lowest value obtained (95% for 180–80 °C), therefore, it can be assured that with any combination of inlet-outlet temperatures studied, EE-PC is excellent.
In the case of W/O/W-SP, EE-PC ranged from 67–70% (Figure 2b). Just like with conventional SP results, the highest value (70%) was obtained with 160–80 °C, but no significant differences were found among all temperature combinations studied. Results of EE-PC with W/O/W-SP are definitely lower than conventional SP microencapsulation. In order to explain the results obtained, it is necessary to consider the EE-PC in W/O/W emulsions before SP, which was almost 100% in every case (results not shown). After SP, concentration decreased, thus obtaining the EE-PC shown in Figure 2b. The decrease in its value could be due to the stress during atomization process to which W/O/W emulsions were subjected. During the atomization process, a reduction of particle size also took place. It is possible that when W/O/W emulsion was atomized, a rupture of the emulsion particles was provoked and some of the encapsulated PC may have been released and exposed to degradation. McClements, 2010 [35], has explained that the stability of W/O/W emulsions is very low since they are highly susceptible to breakdown when exposed to certain stresses. Despite obtaining lower EE-PC with W/O/W-SP, encapsulated PC with this methodology can have a longer shelf life.

3.5.2. Phenolic Compounds Retention

In the case of RE-PC with conventional SP, analysis of variance indicated that a significant difference was obtained among results for the different drying conditions studied (p < 0.05). Figure 2c shows that with the combination of temperatures 160–80 °C, the highest RE-PC was obtained (107%); nevertheless, the lowest PC retention was 91% (with 160–70 °C), indicating that even though there are differences among the different drying conditions, RE-PC was very good with all of them.
When using W/O/W-SP, RE-PC obtained ranged from 74–82% (Figure 2d). In this case, analysis of variance indicated that no significant differences were found among the studied drying conditions (p < 0.05). The lower PC retention values obtained with this methodology, compared to conventional SP, indicated that SP process did affect retention yield on microencapsulated PC in the W/O/W emulsion.
Even though RE-PC results with W/O/W-SP were lower than the ones obtained with conventional SP, an acceptable value was obtained (values above 73%), this increases the shelf life of W/O/W emulsions for a more adequate use in food and pharmaceutical industry.

3.5.3. Antioxidant Capacity Retention

Results for RE-AC with conventional SP are shown in Figure 2e, showing that retention values were above 94% for all conditions. Analysis of variance indicated no significant difference was found among all the drying conditions (p < 0.05), so any combination of temperatures studied can be used, obtaining good RE-AC.
Similar results were obtained for W/O/W-SP (Figure 2f), since with all drying conditions 100% RE-AC was obtained, with no significant differences among samples (p < 0.05). Even though PC retention was lower with this methodology, it is probable that remaining PC or the presence of other not analyzed compounds still showed similar AC after spray drying. It is important to keep in mind that AC does not necessarily depend on PC content [36]. It is necessary to amplify specifically on this topic to have a major understanding of the behavior of PC over AC in the purple cactus pear fruit extracts.
Taking into account the results previously shown for EE-PC, RE-PC, and RE-AC, it can be concluded that 160–80 °C (inlet-outlet temperature) was the best drying condition for conventional SP, since the best results were obtained with such combination. In the case of W/O/W-SP, any combination of temperatures delivered equal results for the response variables, therefore for further experiments, the combination 160–80 °C was selected for both encapsulating methods.

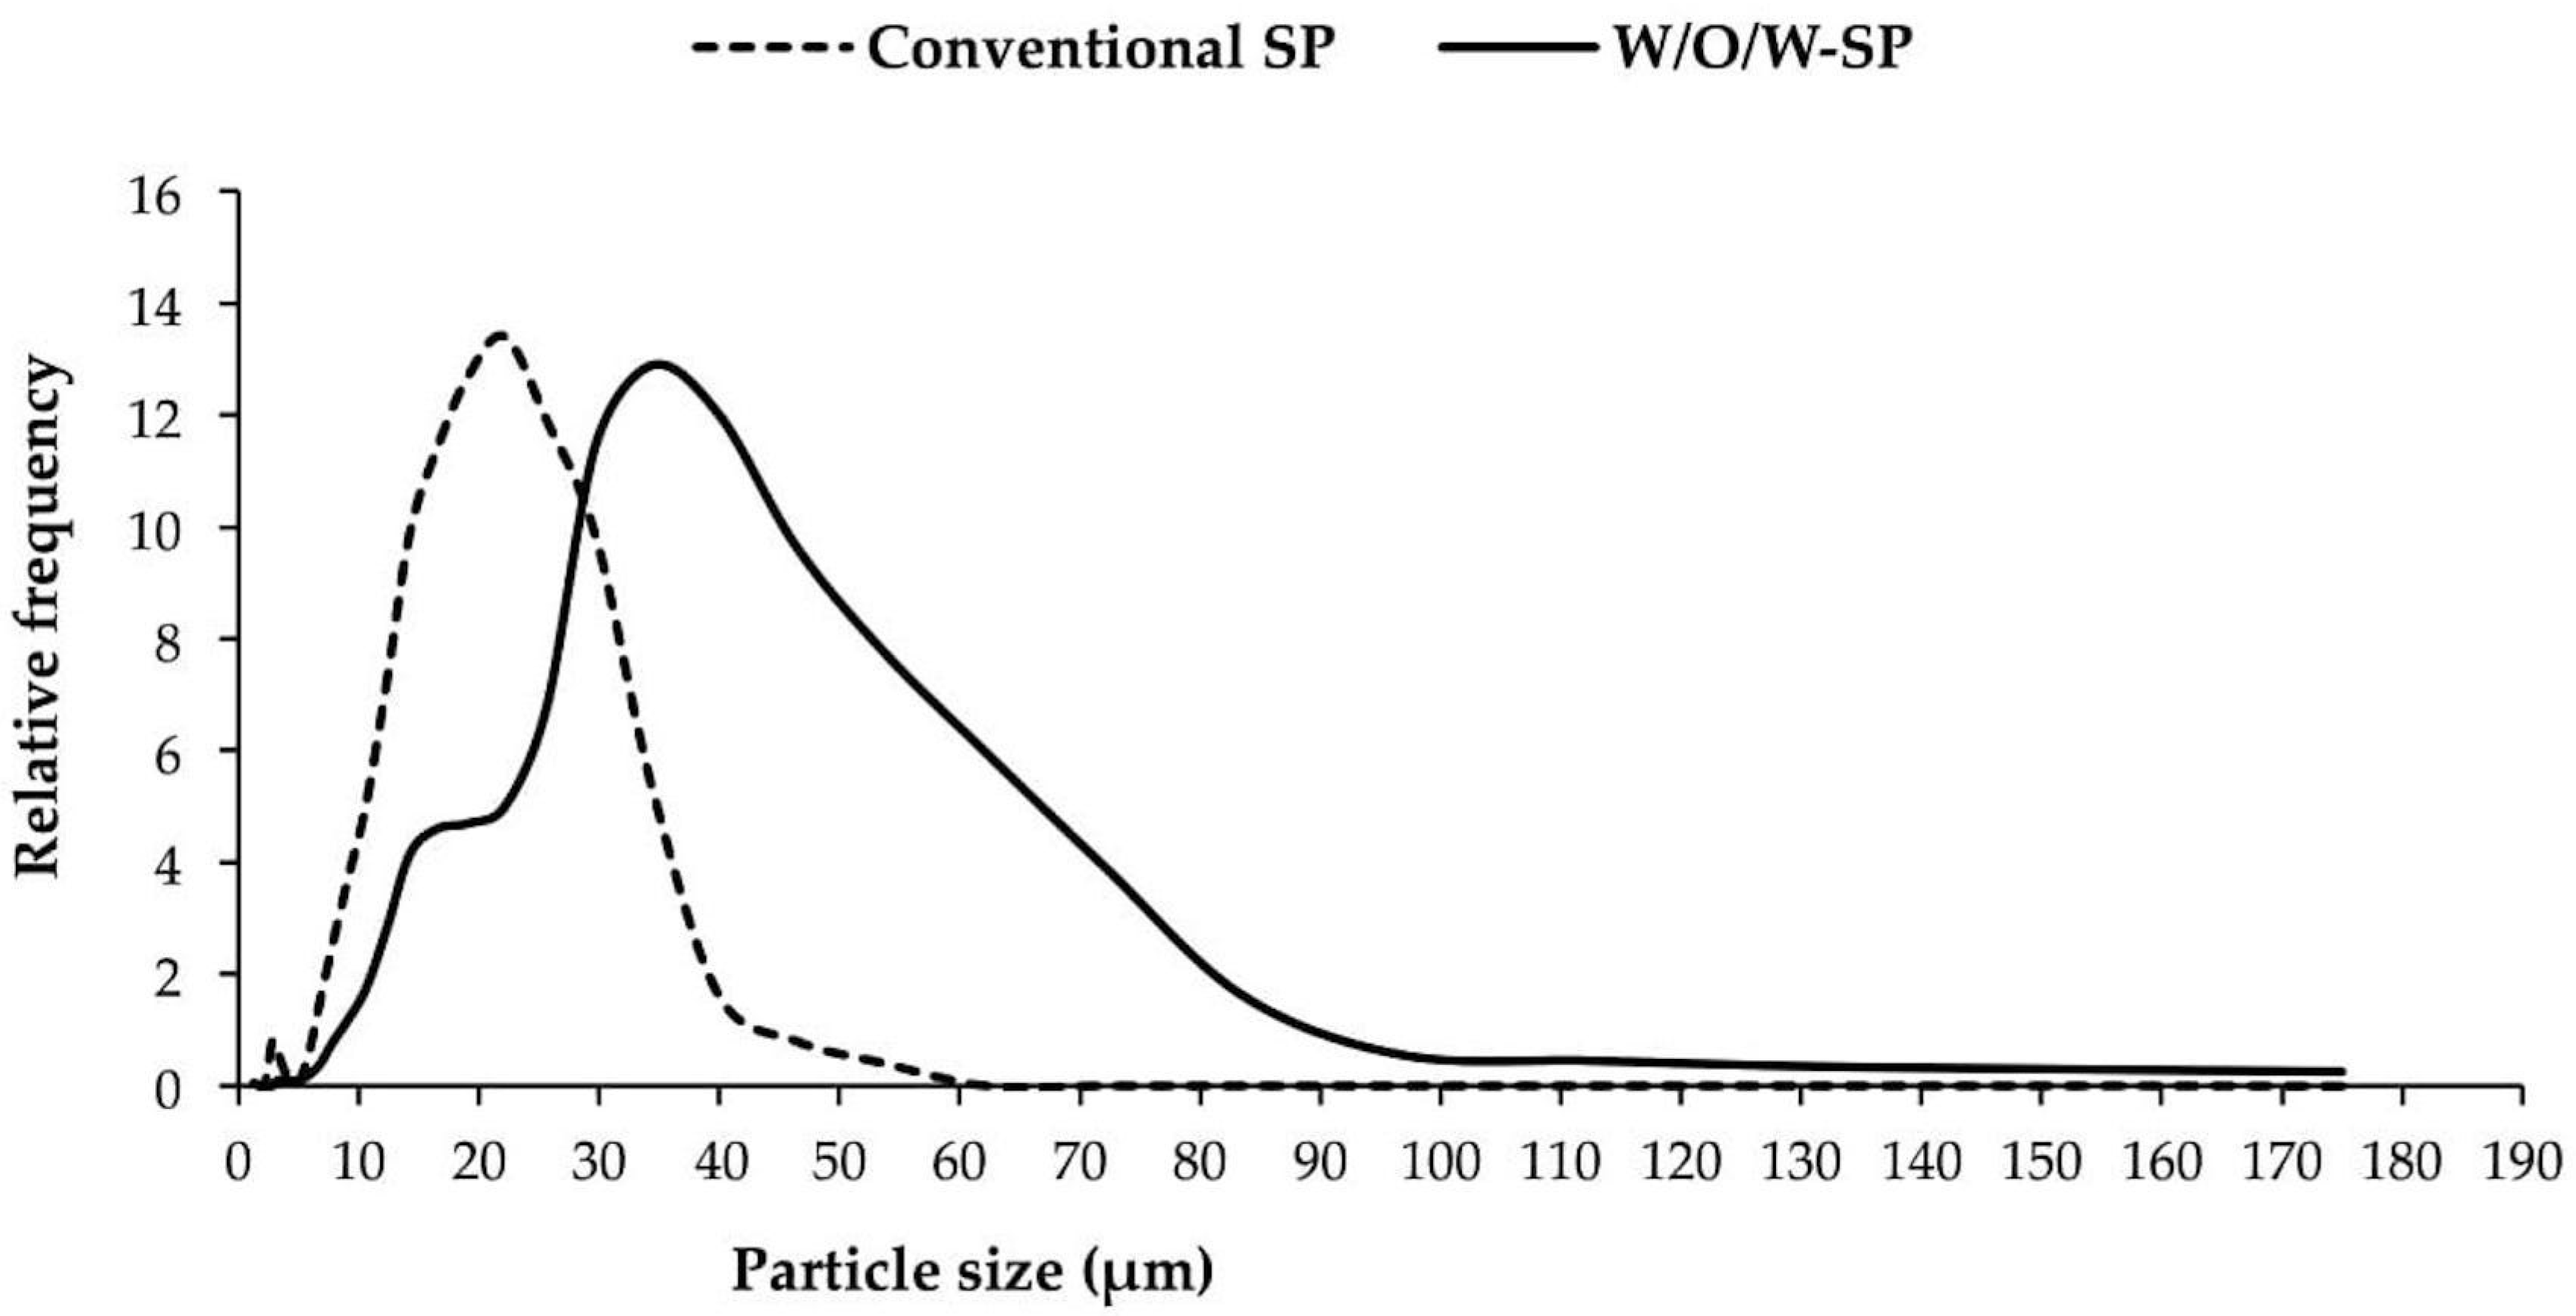
3.6. Particle Size and Particle Size Distribution

Particle size was determined in different samples, primary W/O emulsion (presented in Section 3.4), W/O/W emulsions before and after SP and also in reconstituted W/O/W emulsion, and in microcapsules obtained with conventional SP. For comparative purposes particle size distribution of W/O/W emulsion before SP and reconstituted W/O/W emulsion is shown in Figure 3.
It can be observed in Figure 3 that particle size distribution was wider for W/O/W emulsion before SP (5–175 µm, bimodal distribution) than for reconstituted W/O/W emulsion (1–22 µm, narrower bimodal distribution). This could be due to the effect of the atomization stress that W/O/W emulsion suffered when it was spray dried, decreasing its globule size, as it was mentioned before.
Equivalent spherical diameter (D[4,3]) and Sauter diameter (D[3,2]) were determined for W/O/W emulsion before SP, obtaining 47.72 ± 2.34 and 34.94 ± 0.95 µm, respectively. In the case of reconstituted W/O/W emulsion, results were: 7.51 ± 0.63 (D[4,3]) and 5.14 ± 0.35 µm (D[3,2]). These values clearly indicate that reconstituted W/O/W emulsion is formed by smaller particles. It is important to mention that particle size was determined in reconstituted W/O/W obtained with all studied drying conditions and no significant difference (p < 0.05) was found among the samples, indicating that drying temperature had no influence in particle size of reconstituted W/O/W emulsion.
In order to visualize in a better way the difference obtained in particle size between W/O/W emulsion before SP and reconstituted W/O/W emulsion, Figure 4 shows images of the samples mentioned before. Besides the particle size reduction in W/O/W emulsion after SP, it is important to notice that the integrity of the globules was maintained.
Particle size distribution of powders obtained for both microencapsulation methodologies is presented in Figure 5. It can be seen that for conventional SP, particle size ranges from 2–58 µm and for W/O/W-SP, size ranges from 3–175 µm. The difference between these methodologies was expected, since they are different type of processes with diverse materials that are used to develop the solutions before SP. Such materials influence particle in size, for example, the oil employed to develop the primary W/O emulsion in W/O/W emulsion, may increase the viscosity in the mix and therefore the size of the sprayed droplets and the recovered powder.
D[4,3] and D[3,2] were also determined for powders produced with both microencapsulation methodologies, obtaining for conventional SP: 19.8 ± 1.65 and 15.26 ± 0.90, respectively, and for W/O/W-SP: 37.33 ± 0.71 and 26.32 ± 0.33, respectively. Clearly, mean diameters are larger for W/O/W-SP, for the reasons explained before.

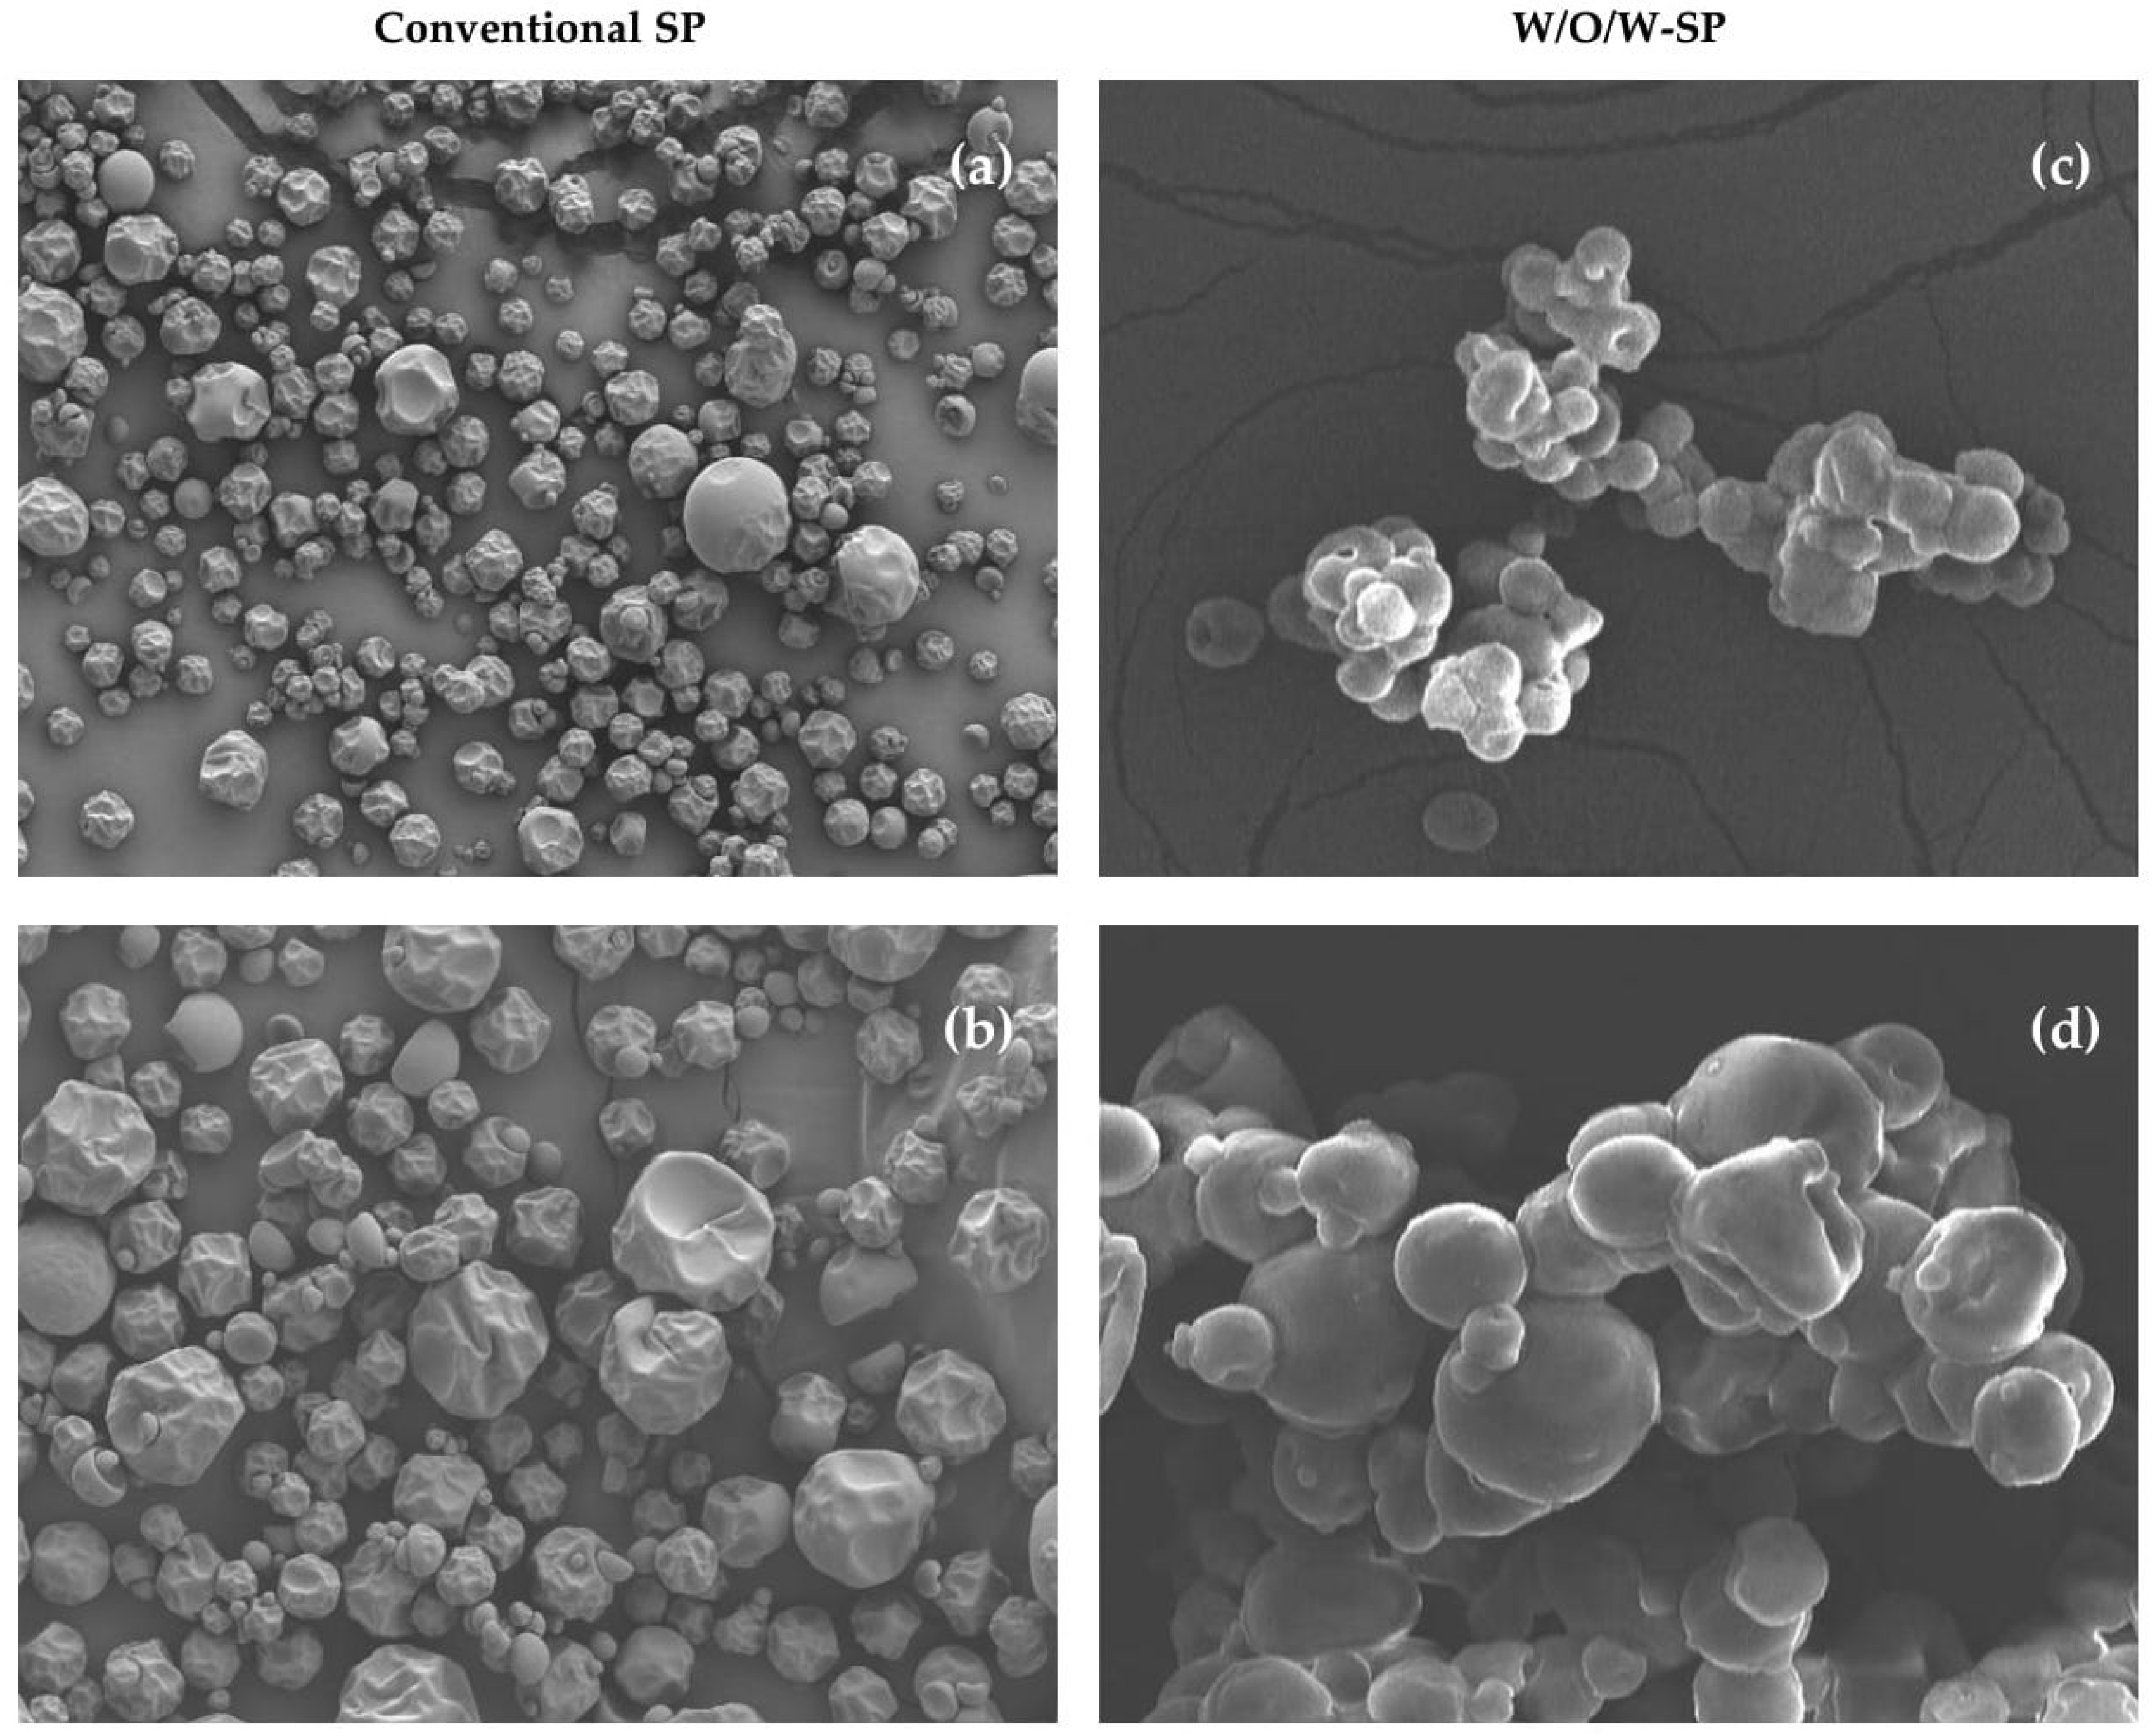
3.7. Surface Morphology of Microcapsules

Figure 6 presents images of surface morphology obtained through SEM of powder microcapsules. The majority of microcapsules obtained with conventional SP (Figure 6a,b) presented a shrunken spherical form (dented surface). This morphology is formed during the drying process when a contraction of the particles takes place, due to the fast evaporation of solvent [37]. The wide particle size distribution discussed before can also be seen in the images.
Regarding microcapsules obtained with W/O/W-SP (Figure 6c,d), a greater agglomeration can be observed, compared to conventional SP, caused probably by the nature of the components that form the W/O/W emulsion since they are like sachets of oil that are softer and deformable. Contrasting with conventional SP, these microcapsules have mainly spherical form with a smoother surface.

4. Conclusions

W/O/W emulsions were used to encapsulate an optimized purple cactus pear fruit (peel and pulp) extract with subsequent spray drying to be obtained in a powder form. Selected spray-drying conditions (160–80 °C) allowed 70% of PC to be encapsulated after the drying process without affecting the structure and integrity of the W/O/W emulsion. A considerable reduction in W/O/W emulsions globule size (about seven times smaller) was observed in the reconstituted W/O/W emulsion, probably caused by the spray-drying stress. Although W/O/W emulsions in a powder showed approximately 20–28% less encapsulation and retention efficiencies of PC compared with conventional SP microcapsules, they show the same AC retention, and apart from stabilizing W/O/W emulsions for a longer period of time and allowing an easier and practical handling, they seem as a promising controlled-delivery vehicle for antioxidant compounds like PC, compared to microcapsules obtained with conventional SP. Further comparative studies have to be done for W/O/W-SP and conventional SP methodologies, in order to observe protection during storage, digestion and release of the functional compounds present in the encapsulated purple cactus pear fruit extract.

Author Contributions

Conceptualization, K.T.-M., T.G.-V., and G.O.-R.; Formal analysis, K.T.-M.; Investigation, K.T.-M. and G.O.-R.; Methodology, K.T.-M. and G.O.-R.; Project administration, T.G.-V. and G.O.-R.; Resources, T.G.-V. and G.O.-R.; Supervision, T.G.-V. and G.O.-R.; Writing—original draft, K.T.-M.; Writing—review & editing, G.O.-R.

Funding

This research was funded by Instituto Politécnico Nacional. K.T.-M. wishes to express her gratitude to Consejo Nacional de Ciencia y Tecnología (CONACyT) for the scholarship provided with number 294672.

Conflicts of Interest

The authors declare no conflict of interest.

References

  1. Carbonell-Capela, J.M.; Buniowska, M.; Barba, F.J.; Esteve, M.J.; Frígola, A. Analytical Methods for Determining Bioavailability and Bioaccesibility of Bioactive Compounds from Fruits and Vegetables: A Review. Compr. Rev. Food Sci. Food Saf. 2014, 13, 155–171. [Google Scholar] [CrossRef]
  2. Sumaya-Martínez, M.T.; Cruz-Jaime, S.; Madrigal-Santillán, E.; García-Paredes, J.D.; Cariño-Cortés, R.; Cruz-Cansino, N.; Valadez-Vega, C.; Martinez-Cardenas, L.; Alanís-García, E. Betalain, Acid Acorbic, Phenolic Contents and Antioxidant Properties of Purple, Red, Yellow and White Cactus Pears. Int. J. Mol. Sci. 2011, 12, 6452–6468. [Google Scholar] [CrossRef] [PubMed]
  3. En 2017, La Producción Nacional de Tuna y Xoconostle Fue Superior a 470 mil Toneladas. Financiero Rural, 2018. Available online: https://www.gob.mx/siap/articulos/en-2017-la-produccion-nacional-de-tuna-y-xoconostle-fue-superior-a-470-mil-toneladas (accessed on 18 June 2018).
  4. LA TUNA, Una Fruta Muy Mexicana. Financiero Rural, 6 September 2017. Available online: https://www.gob.mx/firco/articulos/la-tuna-una-fruta-muy-mexicana?idiom=es (accessed on 18 June 2018).
  5. Saikia, S.; Mahnot, N.K.; Mahanta, C.L. Optimisation of phenolic extraction from Averrhoa carambola pomace by response surface methodology and its microencapsulation by spray and freeze drying. Food Chem. 2015, 171, 144–152. [Google Scholar] [CrossRef] [PubMed]
  6. Aguirre-Joya, J.; De la Garza-Toledo, H.; Zugasti-Cruz, A.; Belmares-Cerda, R.; Aguilar-Cristóbal, N. The optimization of phenolic compounds extraction from cactus pear (Opuntia ficus-indica) skin in a reflux system using response surface methodology. Asia Pac. J. Biomed. 2013, 3, 436–442. [Google Scholar] [CrossRef]
  7. Quek, S.Y.; Chen, Q.; Shi, J. Microencapsulation of Food Ingredients for Functional Foods. In Functional Food Ingredients and Nutraceuticals: Processing Technologies, 2nd ed.; Shi, J., Ed.; CRC Press: Boca Raton, FL, USA, 2015; p. 268. ISBN 9781482240641. [Google Scholar]
  8. Gharsallaoui, A.; Roudaut, G.; Chambin, O.; Voilley, A.; Saurel, R. Applications of spray-drying in microencapsulation of food ingredients: An overview. Food Res. Int. 2007, 40, 1107–1121. [Google Scholar] [CrossRef]
  9. Nesterenko, A.; Alric, I.; Silvestre, F.; Durrieu, V. Vegetable proteins in microencapsulation: A review of recent interventions and their effectiveness. Ind. Crops Prod. 2013, 42, 469–479. [Google Scholar] [CrossRef] [Green Version]
  10. Bicudo, M.O.P.; Jó, J.; Oliveira, G.A.; Chaimsohn, F.P.; Sierakowski, M.R.; Freitas, R.A. Microencapsulation of juçara (Euterpe edulis M.) pulp by spray drying using different carriers and drying temperatures. Dry. Technol. 2015, 33, 153–161. [Google Scholar] [CrossRef]
  11. Tan, S.P.; Kha, T.C.; Parks, S.; Stathopoulos, C.; Roach, P.D. Optimising the Encapsulation of an Aqueous Bitter Melon Extract by Spray-Drying. Foods 2015, 4, 400–419. [Google Scholar] [CrossRef] [PubMed] [Green Version]
  12. Silva, P.I.; Stringheta, P.C.; Teófilo, R.F.; Oliveira, I.R.N. Parameter optimization for spray-drying microencapsulation of jaboticaba (Myrciaria jaboticaba) peel extracts using simultaneous analysis of responses. J. Food Eng. 2013, 117, 538–544. [Google Scholar] [CrossRef]
  13. Đorđević, V.; Balanč, B.; Belščak-Cvitanović, A.; Lević, S.; Trifković, K.; Kalušević, A.; Kostić, I.; Komes, D.; Bugarski, B.; Nedović, V. Trends in Encapsulation Technologies for Delivery of Food Bioactive Compounds. Food Eng. Rev. 2015, 7, 452–490. [Google Scholar] [CrossRef]
  14. Lamba, H.; Sathish, K.; Sabikhi, L. Double Emulsions: Emerging Delivery System for Plant Bioactives. Food Bioprocess Technol. 2015, 8, 709–728. [Google Scholar] [CrossRef]
  15. Berendsen, R.; Güell, C.; Ferrando, M. Spray dried double emulsions containing procyanidin-rich extracts produced by premix membrane emulsification: Effect of interfacial composition. Food Chem. 2015, 178, 251–258. [Google Scholar] [CrossRef] [PubMed]
  16. Muschiolik, G.; Dickinson, E. Double Emulsions Relevant to Food Systems: Preparation, Stability, and Applications. Compr. Rev. Food Sci. Food Saf. 2017, 16, 532–555. [Google Scholar] [CrossRef]
  17. Giroux, H.; Constantineau, S.; Fustier, P.; Champagne, C.; St-Gelais, D.; Lacroix, M.; Britten, M. Cheese fortification using water-in-oil-in-water double emulsions as carrier for water soluble nutrients. Int. Dairy J. 2013, 29, 107–114. [Google Scholar] [CrossRef]
  18. Andrade, J.; Corredig, M. Vitamin D3 and phytosterols affect the properties of polyglicerol polyricinoleate (PGPR) and protein interfaces. Food Hydrocoll. 2015, 54, 278–283. [Google Scholar] [CrossRef]
  19. Dickinson, E. Double Emulsions Stabilized by Food Polymers. Food Biophys. 2011, 6, 1–11. [Google Scholar] [CrossRef]
  20. Kaimainen, M.; Marze, S.; Järvenpää, E.; Anton, M.; Huopalahti, R. Encapsulation of betalain into w/o/w double emulsion and release during in vitro intestinal lipid digestion. LWT-Food Sci. Technol. 2015, 60, 899–904. [Google Scholar] [CrossRef]
  21. Benichou, A.; Aserin, A.; Garti, N. Polyols, High Pressure, and Refractive Indices Equalization for Improved Stability of W/O Emulsions for Food Applications. J. Dispers. Sci. Technol. 2001, 22, 269–280. [Google Scholar] [CrossRef]
  22. Cárdenas-Bailón, F.; Osorio-Revilla, G.; Gallardo-Velázquez, T. Microencapulation of insulin using a W/O/W double emulsion followed by complex coacervation to provide protection against gastrointestinal tract. J. Microencapsul. 2015, 32, 308–316. [Google Scholar] [CrossRef] [PubMed]
  23. Hemar, Y.; Cheng, L.; Oliver, C.; Sanguansri, L.; Augustin, M. Encapsulation of Resveratrol using Water-in-oil-in-water Double Emulsion. Food Biophys. 2010, 5, 120–127. [Google Scholar] [CrossRef]
  24. Robert, P.; Gorena, T.; Romero, N.; Sepúlveda, E.; Chavez, J.; Saenz, C. Encapsulation of polyphenols and anthocyanins from pomegranate (Punica granatum) by spay drying. Int. J. Food Sci. Technol. 2010, 45, 1386–1394. [Google Scholar] [CrossRef]
  25. Singleton, V.; Rossi, J. Colorimetry of total phenolics with phosphomolybdic-phosphotungstic acid reagents. Am. J. Enol. Viticult. 1965, 16, 144–158. [Google Scholar]
  26. Rufino, M.S.; Alves, R.; Brito, E.; Morais, S.; Sampaio, C.; Pérez, J.; Saura, F. Metodología Científica: Determinação da Atividade Antioxidante Total em Frutas pela Captura do Radical Livre ABTS. Comunicado Técnico 2007, 128, 1–4. [Google Scholar]
  27. Castellanos, E.; Yahia, E. Identification and Quantification of Betalains from the Fruits of 10 Mexican Prickly Pear Cultivars by High-Performance Liquid Chromatography and Electrospray Ionization Mass Spectrometry. J. Agric. Food Chem. 2008, 56, 5758–5764. [Google Scholar] [CrossRef] [PubMed]
  28. Ranganna, S. Handbook of Analysis and Quality Control for Fruit and Vegetable Products, 2nd ed.; Mc Graw Hill Publishing Co.: New Dehli, India, 1986; pp. 107–108. ISBN 978-0-07-451851-9. [Google Scholar]
  29. Albano, C.; Negro, C.; Tommasi, N.; Gerardi, C.; Mita, G.; Miceli, A.; De Bellis, L.; Blando, F. Betalains, Phenols and Antioxidant Capacity in Cactus Pear [Opuntia ficus-indica (L.) Mill.] Fruits from Apulia (South Italy) Genotypes. Antioxidants 2015, 4, 269–280. [Google Scholar] [CrossRef] [PubMed]
  30. Fernández, J.; Almela, L.; Obón, J.; Castellar, R. Determination of antioxidant constituents in cactus pear fruit. Plants Foods Hum. Nutr. 2010, 65, 253–259. [Google Scholar] [CrossRef] [PubMed]
  31. Kuti, J. Antioxidant compounds from four Opuntia cactus pear fruits varieties. Food Chem. 2004, 85, 527–533. [Google Scholar] [CrossRef]
  32. Prakash, J.; Manikandan, S.; Mekala, V. Modeling and optimization of betalain extraction from Opuntia ficus-indica using Box-Behnken design with desirability function. Ind. Crops Prod. 2013, 49, 304–311. [Google Scholar] [CrossRef]
  33. Laqui-Vilca, C.; Aguilar-Tuesta, S.; Mamani-Navarro, W.; Montaño-Bustamante, J.; Condezo-Hoyos, L. Ultrasound-assisted optimal extraction and thermal stability of betalains from colored quinoa (Chenopodium quinoa Willd) hulls. Ind. Crops Prod. 2018, 111, 606–614. [Google Scholar] [CrossRef]
  34. Muschiolik, G. Multiple emulsions for food use. Curr. Opin. Colloid Interface Sci. 2007, 12, 213–220. [Google Scholar] [CrossRef]
  35. McClements, D.J. Emulsion design to improve the delivery of functional lipophilic components. Annu. Rev. Food Sci. Technol. 2010, 1, 241–269. [Google Scholar] [CrossRef] [PubMed]
  36. Velioglu, Y.S.; Mazz, G.; Gao, L.; Oomah, B.D. Antioxidant Activity and Total Phenolics in Selected Fruits, Vegetables, and Grain Products. J. Agric. Food Chem. 1998, 46, 4113–4117. [Google Scholar] [CrossRef]
  37. Saénz, C.; Tapia, S.; Chávez, J.; Robert, P. Microencapsulation by spray drying of bioactive compounds from cactus pear (Opuntia ficus-indica). Food Chem. 2009, 114, 616–622. [Google Scholar] [CrossRef]
Figure 1. 3D response surface plots showing the effect of process variables on the extraction of PC (a,b), BC (c,d), and BX (e,f). (PC: phenolic compounds; BC: betacyanins; BX: betaxanthins; Temp.: Temperature).
Processes 06 00189 g001
Figure 2. Conventional spray drying (SP) and double emulsions-spray drying (W/O/W-SP) microencapsulation histogram graphs of: (a,b) encapsulation efficiency of PC (EE-PC, %); (c,d) retention efficiency of PC (RE-PC, %); and (e,f) retention efficiency of AC (RE-AC %), respectively. Results are expressed as the mean ± standard deviation, n = 2. Identical vertical scales are used for comparison. Different letters indicate significant difference (p < 0.05).
Processes 06 00189 g002
Figure 3. Particle size distribution of W/O/W emulsion before SP and reconstituted W/O/W emulsion. Drying conditions for W/O/W emulsion: 160–80 °C.
Processes 06 00189 g003
Figure 4. Images of W/O/W emulsion before SP: (a) 400× and (b) 1000× and reconstituted W/O/W emulsion: (c) 400× and (d) 1000×. Drying conditions for W/O/W emulsion: 160–80 °C.
Processes 06 00189 g004
Figure 5. Particle size distribution of powder microcapsules obtained with conventional SP and W/O/W-SP. Drying condition: 160–80 °C.
Processes 06 00189 g005
Figure 6. Surface morphology images of powder microcapsules obtained with conventional SP and W/O/W-SP at 160–80 °C as drying conditions: (a,c) 500× magnification, (b,d) 1000× magnification, all at 2 kV.
Processes 06 00189 g006
Table 1. Characterization of fresh whole purple cactus pear fruit.
Result
Moisture content (%)84.60 ± 1.09
Total soluble solids (°Brix)13 ± 0.00
PC (mg GAE/gdw)11.47 ± 0.14
BC (mg BE/gdw)0.89 ± 0.00
BX (mg IX/gdw)0.42 ± 0.00
AA (mg AA/gdw)1.07 ± 0.06
AC (µmol TE/gdw)73.95 ± 2.44
PC: phenolic compounds, BC: betacyanins, BX: betaxanthins, AA: ascorbic acid, AC: antioxidant capacity. Results are expressed as the mean ± standard deviation, n = 3.
Table 2. Characterization of dry whole purple cactus pear fruit and its separate parts (peel, pulp, and seeds).
Part of the FruitPC (mg GAE/gdw)BC (mg BE/gdw)BX (mg IE/gdw)AC (µmol TE/gdw)
Whole fruit13.90 ± 0.170.410.3296.11 ± 2.61
Peel9.60 ± 0.140.170.1548.25 ± 1.68
Pulp2.99 ± 0.040.270.2332.48 ± 0.23
Seeds0.17----1.34 ± 0.06
Results are expressed as the mean ± standard deviation, n = 3.
Table 3. Analysis of variance of the models for all responses of Box Behnken experimental design (BBD) for extraction of bioactive compounds from purple cactus pear fruit peel and pulp.
Analysis of Variance
PCBCBX
Sourcep-Valuep-Valuep-Value
Model0.0370.0150.259
Linear0.0070.0030.773
Square0.3300.1250.287
2-Way Interaction0.4250.1550.106
Lack-of-Fit0.8340.4460.180
Model summaryR2: 90.84%
R2 adj: 74.34%
R2: 93.84%
R2 adj: 82.74%
R2: 76.87%
R2 adj: 35.23%

