Article

Aqueous Free-Radical Polymerization of Non-Ionized and Fully Ionized Methacrylic Acid

Institute for Chemical and Bioengineering, ETH Zurich, Vladimir-Prelog-Weg 1, 8093 Zurich, Switzerland
*
Author to whom correspondence should be addressed.
Processes 2017, 5(2), 23; https://doi.org/10.3390/pr5020023
Submission received: 16 February 2017 / Revised: 21 April 2017 / Accepted: 24 April 2017 / Published: 27 April 2017
(This article belongs to the Special Issue Water Soluble Polymers)

Abstract

:
Water-soluble, carboxylic acid monomers are known to exhibit peculiar kinetics when polymerized in aqueous solution. Namely, their free-radical polymerization rate is affected by several parameters such as monomer concentration, ionic strength, and pH. Focusing on methacrylic acid (MAA), even though this monomer has been largely addressed, a systematic investigation of the effects of the above-mentioned parameters on its polymerization rate is missing, in particular in the fully ionized case. In this work, the kinetics of non-ionized and fully ionized MAA are characterized by in-situ nuclear magnetic resonance (NMR). Such accurate monitoring of the reaction rate enables the identification of relevant but substantially different effects of the monomer and electrolyte concentration on polymerization rate in the two ionization cases. For non-ionized MAA, the development of a kinetic model based on literature rate coefficients allows us to nicely simulate the experimental data of conversion versus time at a high monomer concentration. For fully ionized MAA, a novel propagation rate law accounting for the electrostatic interactions is proposed: the corresponding model is capable of predicting reasonably well the electrolyte concentration effect on polymerization rate. Nevertheless, further kinetic information in a wider range of monomer concentrations would be welcome to increase the reliability of the model predictions.

Graphical Abstract

1. Introduction

Water soluble polymers are very attractive materials which have applications in many different fields: they are particularly employed in the manufacturing of pharmaceuticals and cosmetics, in enhanced oil separation and water purification processes, and as additives for thickening, flocculation, coating, etc. [1,2,3]. The peculiar properties of such polymers come from their building blocks, namely water soluble vinyl monomers exhibiting polarizable, ionizable, or charged moieties. Typical examples of such monomers are acrylic and methacrylic acid as well as their esters, acrylamides and vinyl amides, and ammonium salts. The presence of charges and polarized groups in such monomers makes the corresponding polymers suitable for establishing electrostatic interactions between the polymer chains as well as between the polymer and its environment. As a consequence, the solution and surface properties of the polymer as well as the viscoelastic behavior of the material are affected by such interactions, determining the peculiar features of water-soluble polymers which make them so interesting and versatile [4,5].
In addition to the effect on the material properties, these interactions involving monomer and polymer moieties have an impact on the reaction kinetics during aqueous radical polymerization, which is the usual method of synthesis of water-soluble polymers. The presence of charges or dipoles can induce interactions of various nature between the reacting species, and they can in turn substantially affect the observed reaction order of some relevant kinetic steps with respect to the reactants [6]. Monomer-monomer association [7], hindrance of the internal motions of reaction complexes due to intermolecular interactions [8], and electrostatic forces producing diffusion limitations [9,10,11] are some of the relevant phenomena which may affect the kinetic behavior of water-soluble, ionized, or ionizable monomers, especially with respect to propagation reactions.
A general effect of reduction of the propagation rate coefficient upon increasing monomer concentration has been detailed by studies on various water-soluble monomers, and it has been explained in terms of “fluidization” of the transition state structure due to its interactions with the surrounding species, in particular hydrogen bonding involving water molecules [8,12,13]. The electrostatic effects on the propagation kinetics of ionized or ionizable monomers have been discussed in terms of a reduced diffusion of the monomer to the radical site of an active chain when both are similarly charged, as a result of the repulsion forces. In this view, the sensitivity of the propagation kinetics to the initial monomer concentration is explained by the phenomenon of electrostatic screening. Increasing the concentration of electrolyte in a solution containing charged species reduces the strength of the electrostatic interactions among the charges by screening of the repulsive forces. In the case of polymerization of ionized monomers, the monomer itself acts as an electrolyte in solution: accordingly, increasing the concentration of ionized monomer enhances its propagation kinetics [6,11,14]. The most recent studies on the effect of charge interactions on the kinetics of water-soluble, ionized, or ionizable monomers have been largely focused on copolymer composition: in this way, it is possible to isolate the contribution of propagation reactions and specifically address the sensitivity of propagation reactivity ratios upon changes in ionic strength, monomer concentration and ionization, pH, etc. [10,11,15,16]. On the other hand, the investigation of such effects on the polymerization rate is of great interest due to its implications on the final polymer properties (e.g., molar masses).
In this context, methacrylic compounds offer the advantage of not involving secondary reactions, i.e., backbiting, which can strongly affect the polymerization rate and make it difficult to focus on the effect of charge interactions only [17,18,19]. The kinetics of methacrylic acid (MAA) has been the subject of several studies by pulsed-laser polymerization (PLP), which have been focused especially on the estimation of propagation [12,20] and termination [21,22] rate coefficients. In addition, some attempts of characterizing and modeling the polymerization kinetics of MAA have been carried out recently, in some cases together with the analysis of the molar masses and of the effect of chain transfer reactions [23,24,25]. Nevertheless, the majority of the existing studies are focused on non-ionized MAA and limited to medium-large monomer concentrations. Experimental and modeling studies on fully ionized MAA are missing in the literature, with the notable exception of PLP analysis [20]. Moreover, specific studies on the influence of non-monomeric electrolyte addition on the polymerization kinetics cannot be found.
For all these reasons, in this work we focus on MAA with the aim of elucidating the effects of monomer concentration and ionization on the rate of polymerization. Namely, the time evolution of conversion is characterized by in-situ NMR for both non-ionized and fully ionized acids, with focus on the impact of the monomer concentration and ionic strength on the kinetic behavior. Experimental reactions are carried out in the medium-low monomer concentration range (i.e., 1 to 10 wt % of initial monomer). In combination with fundamental kinetic modeling, substantial differences between the polymerization behaviors of the two ionization forms of MAA are revealed. Finally, the addition of NaCl to the fully ionized system is applied to shed light on the effect of the electrostatic interactions on the reaction kinetics.

2. Materials and Methods

The polymerization reactions are carried out in deuterium oxide (D2O, D, 99%, 99.5% chemical purity, Cambridge Isotope Laboratories, Inc., Tewksbury, MA, USA) using NMR tubes (5 mm NMR tube, Type 5UP (Ultra Precision), 178 mm, ARMAR AG, 5312 Döttingen, Switzerland) as reactors, which are directly inserted in an operating NMR spectrometer (UltraShield 500 MHz/54 mm magnet system, Bruker Inc., Billerica, MA, USA). For each experiment, the monomer MAA (99.5%, extra pure, stabilized with ca. 250 ppm 4-methoxyphenol (MEHQ), Acros Organics, 2440 Geel, Belgium) is dissolved in D2O. If the reaction is to be carried out at full monomer ionization, i.e., at the initial degree of acid dissociation α = 1 , a solution of NaOH (pellets, analytical reagent grade, Fisher Scientific Ltd., Loughborough, LE11 5RG, UK) is added. If the ionic strength is to be altered, pure NaCl (EMSURE, ACS, ISO, Reag. Ph Eur, for analysis, Merck KGaA, 64271 Darmstadt, Germany) is added. As the last step, a solution of the radical initiator 2,2′-azobis(2-methylpropionamidine) dihydrochloride (V-50, 98%, Acros Organics, 2440 Geel, Belgium) in D2O is added. All the reagents are used as received, and the V-50 solution is renewed once a week to avoid any degradation. The reaction mixture is degassed with N2 for 5 min at room temperature, as cooling with ice water leads to partial monomer precipitation. About 0.6 mL of the reaction mixture is transferred into the NMR tube, which is purged with N2 during and after the transfer in order to avoid any contamination with oxygen. Once closed, the NMR tube is immediately put into the magnet at room temperature, where the reaction is monitored by in-situ NMR. It takes about 10 min to reach a constant reaction temperature of 50 °C. During this relatively short time of temperature adjustment, the inhibitor and possible impurities associated to the monomer are consumed, as no polymer formation is detected by NMR. The monomer conversion is measured as a function of the polymerization time by a series of 1H NMR acquisitions. Since the relaxation time T1 of MAA is ca. 5 s, the instrument is set to wait ca. 25 s between each scan. As each data point consists of an average of 4 scans and considering the acquisition time, a data point is generated every 2.5 min. This resolution is enough to follow the evolution of the reaction. The conversion is evaluated as
χ ( t ) = 1 A ( t ) A 0
where A ( t ) is the sum of the areas of the two hydrogen atoms at the double-bond carbon (sp2 hybridized) and A 0 is the area of the same hydrogens at time zero, as detailed in the Supporting Information (cf. Figures S1 and S2). More details about the in-situ NMR procedure adopted are given elsewhere [11].
In the experiments, the initial monomer concentration is varied from low to medium values (1 to 10 wt %). In order to mimic the ionic strength of higher monomer concentration, sodium chloride (NaCl) is added. For example, to obtain the ionic strength of the 10 wt % MAA reference (1.16 mol/kg), the reaction mixture contains 1 wt % MAA and 6.1 wt % NaCl. MAA concentrations in D2O higher than 10 wt % are avoided due to solubility limitations at room temperature, which hinders an accurate transfer of the mixture into the NMR tube. The initial V-50 concentration is kept constant at a level high enough to ensure adequate kinetic rates, i.e., 0.02 wt % for the reactions at α = 0 and 0.10 wt % for the reactions at α = 1 (which are considerably slower). In each reaction, a certain inhibition time is observed, which is due to the presence of MEHQ in the monomer. During this time, polymer formation is instead detected by NMR, contrary to what was observed throughout the temperature adjustment. The rate of polymer formation is very slow at the beginning of the reaction and then increases with time as the inhibitor is consumed. As a consequence, the derivative of the conversion-time curve reaches its maximum value only with some delay, when the inhibitor is completely depleted. Therefore, the time axis of the conversion versus time plots is adjusted to remove this effect: a delay time is considered for each experiment so that the tangent to the conversion-time curve at its maximum slope runs through the origin. It is worth noting that the observed inhibition time increases with monomer content (e.g., from ca. 20 min at 1 wt % MAA to ca. 70 min at 10 wt % MAA), in agreement with a larger inhibitor content.

3. Results

3.1. Non-Ionized System

Reactions are carried out at 50 °C with 1, 5, and 10 wt % of initial monomer content ( w M , 0 
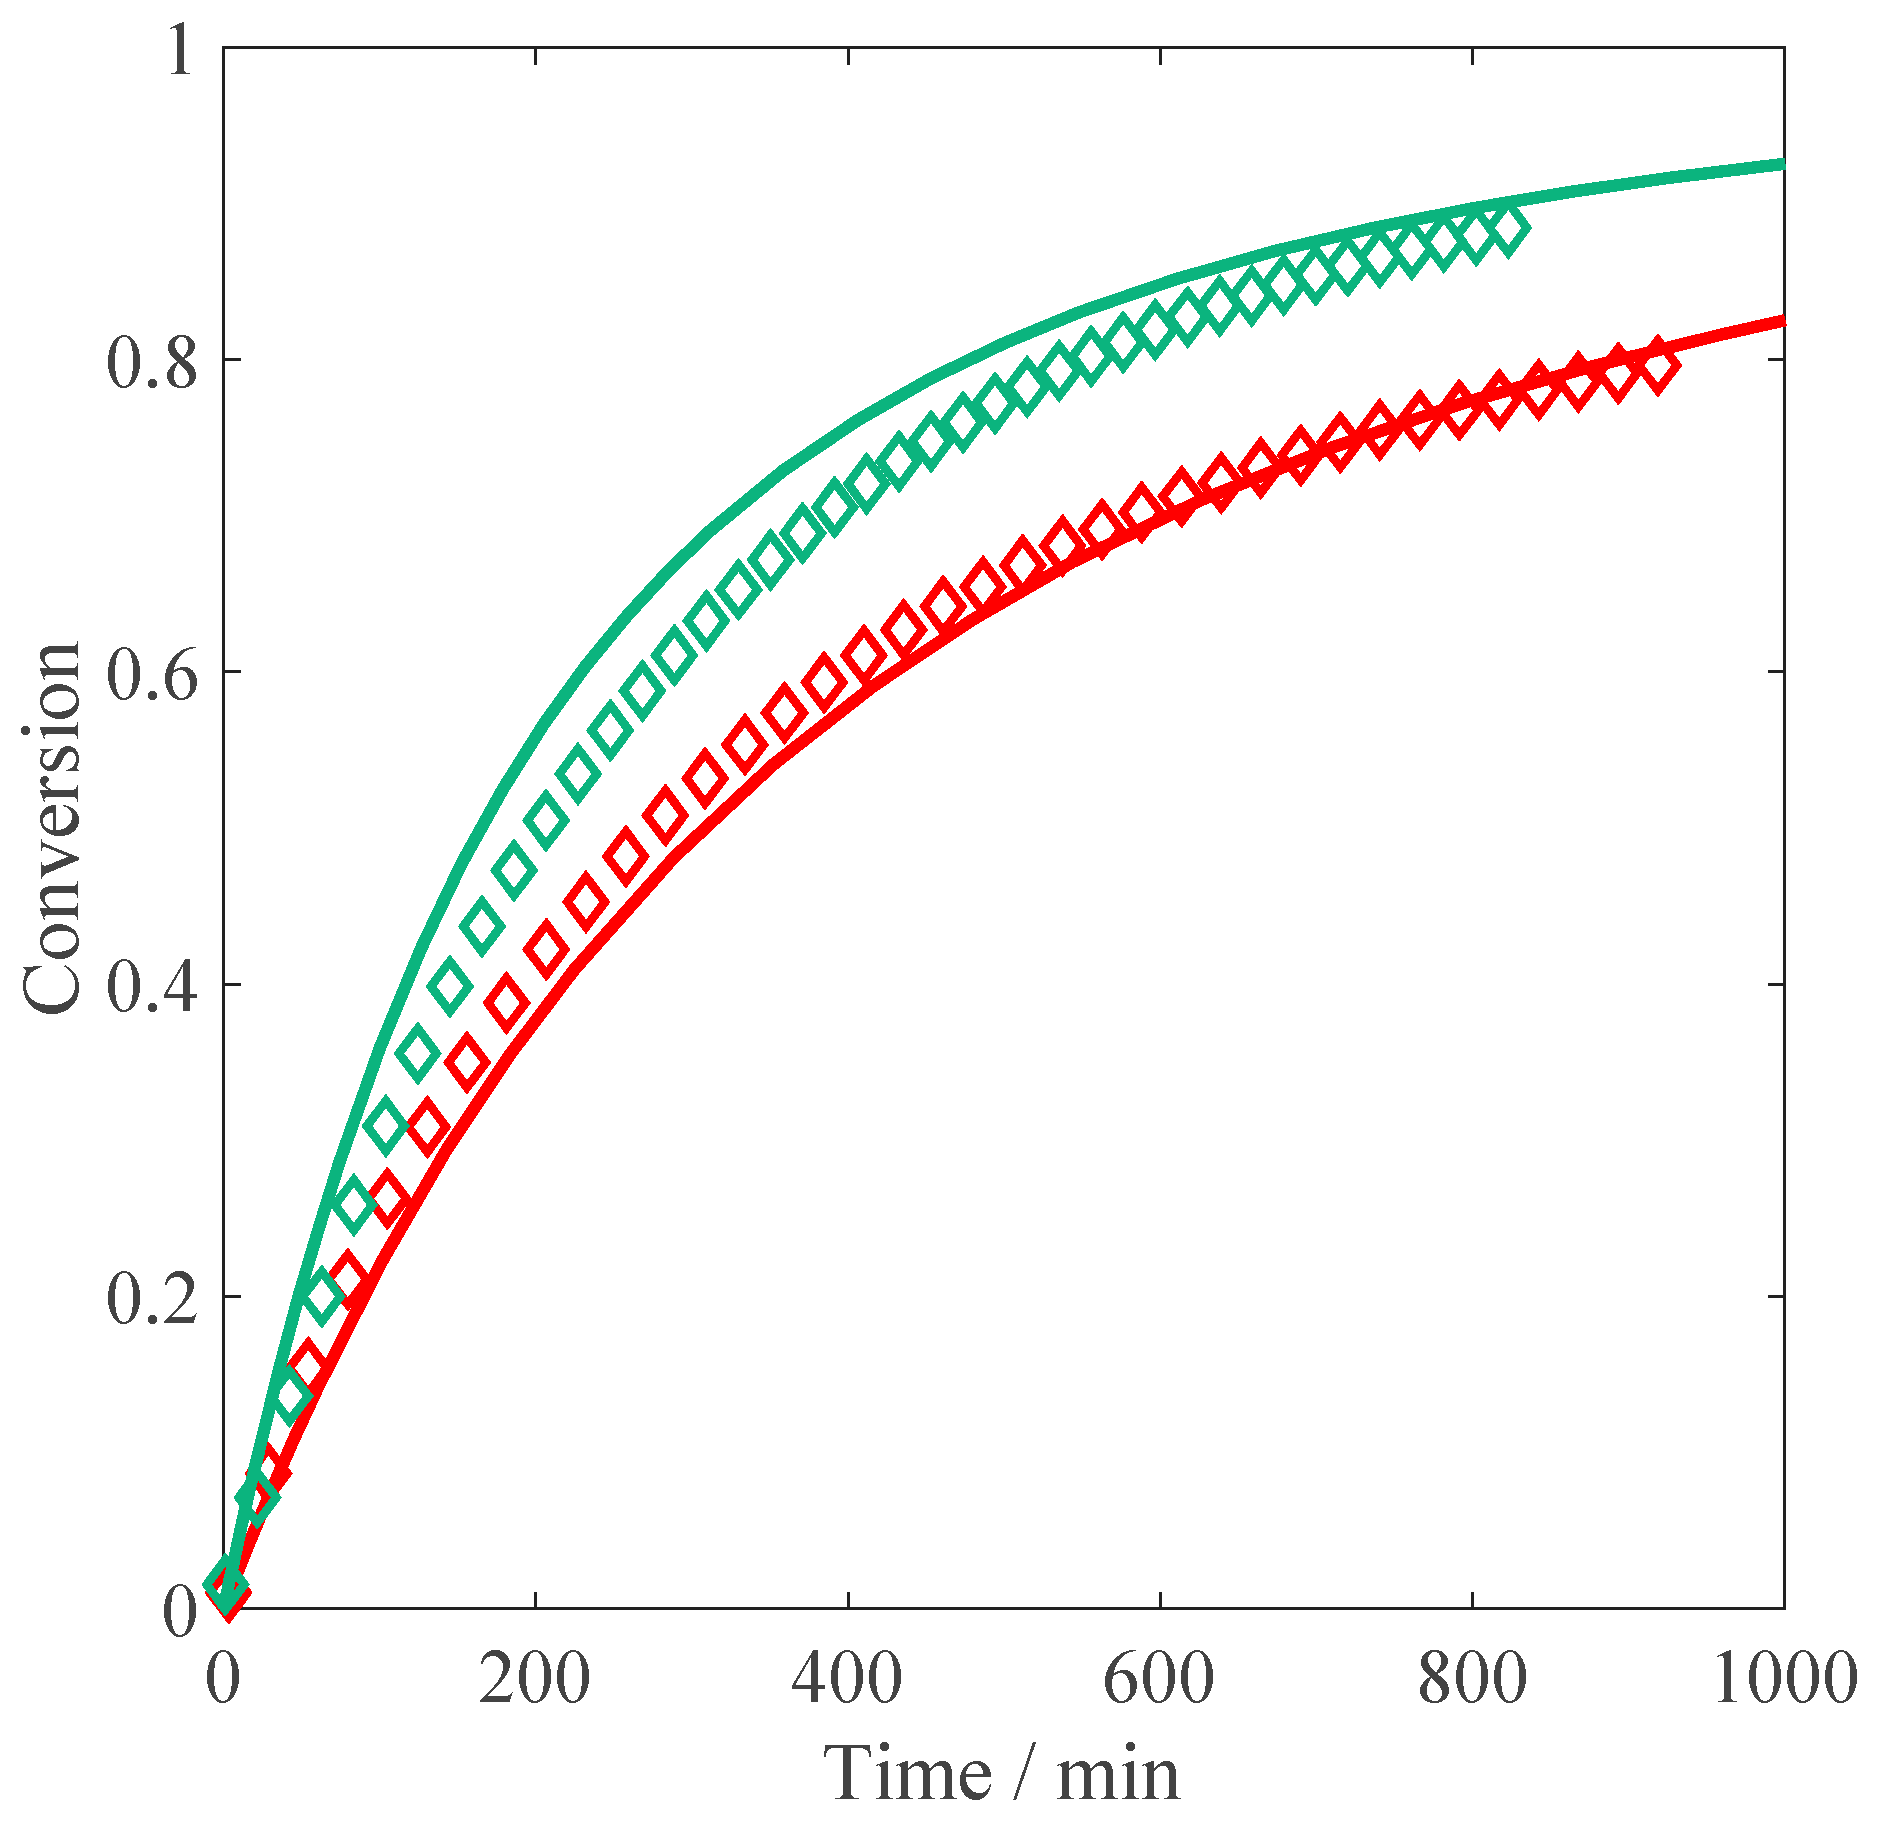
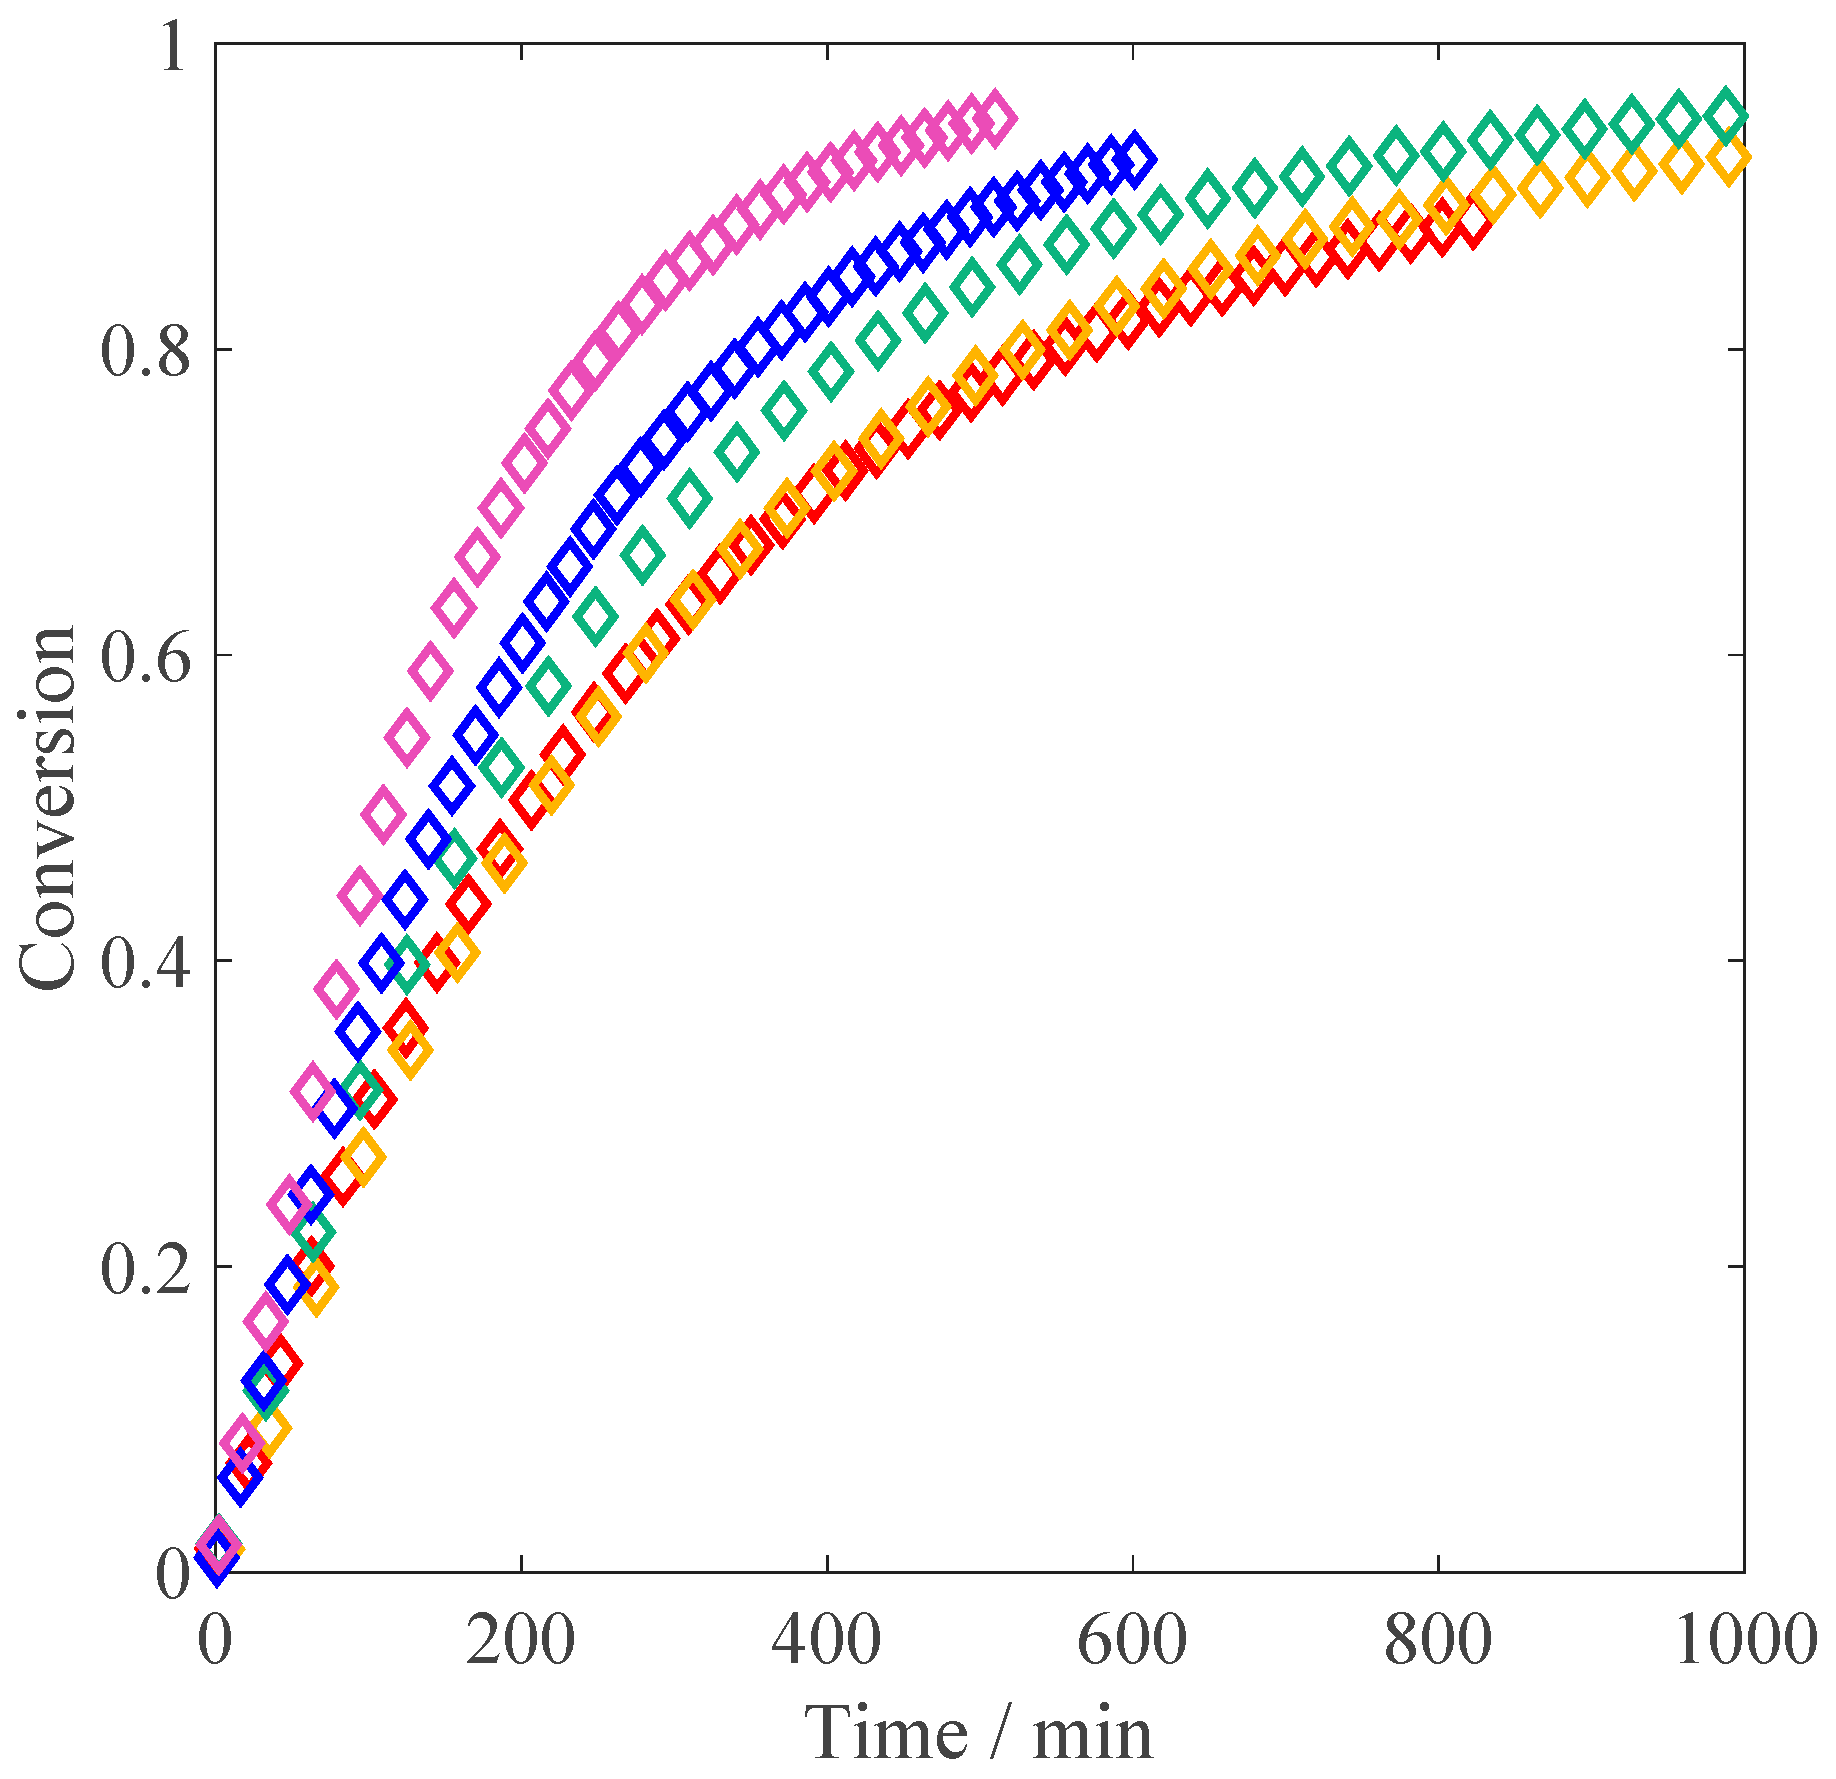
, weight fraction) and a constant amount of V-50 (0.02 wt %). With “non-ionized MAA” we mean the situation of natural dissociation of the monomer in the absence of any added base. The conversion versus time plots are shown in 
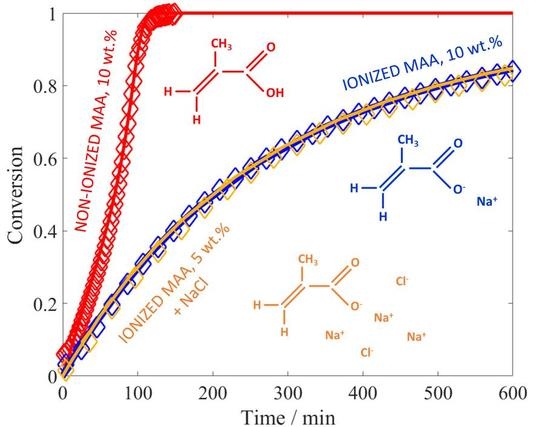
Figure 1. At 10 wt % of initial monomer, the slope of the conversion-time curve has reached its maximum value (i.e., the inhibitor is completely consumed) and remains constant until ca. 40% of conversion. After about 60 min, an increase of the slope is noticeable, which is a sign of diffusion limitations to termination (gel effect). This is fully consistent with the experimental results of Buback et al. [23], who ran their reactions at larger initiator concentrations (5 mmol/L, equivalent to ca. 0.12 wt %). At lower monomer concentrations, the initial polymerization rate is faster than at 10 wt %, in agreement with the increase in the propagation rate coefficient as a function of w M , 0 , revealed by PLP studies [12]. It is also worth noting that at 5 wt % and 1 wt % of MAA, the autoacceleration of the reaction due to gel effect is less relevant: this behavior is consistent with the lower viscosity of the reacted solution observed in the NMR tube in the low monomer concentration cases compared to the situation at 10 wt % of initial MAA. Furthermore, it appears that at high conversion, the polymerization rate is slowing down: such an effect is particularly pronounced at 1 wt % of MAA, where full conversion is reached only hours later. The reproducibility of the obtained conversion versus time curves has been tested for the reaction at 1 wt % and 10 wt % of initial monomer. As shown in Figure S3 in the Supporting Information, at 1 wt %, the repeated experiment exhibits a slightly smoother behavior at conversions above 60%, i.e., showing a slightly less pronounced autoacceleration behavior. For the repetition of the reaction with 10 wt % MAA (Figure S4), the difference in the slope above 40% conversion is a bit larger. Since this discrepancy (of similar size) at the same reaction conditions has already been reported in the literature [23], we consider this accuracy to be sufficient.
A kinetic model suitable for evaluating the reaction rate and number average molecular weight of the active chains has been developed. The most conventional free-radical kinetic scheme is considered, with all the reactions listed in Table 1. The initiator I 2 decomposes to form two radicals I · with rate coefficient k d . Assuming that all terminations are accounted for by an initiator efficiency factor f , and applying the quasi-steady-state assumption for the radical fragments I · , the rate of propagation of I · is equal to the rate of initiation (i.e., the first term in the monomer balance equation in Table 2). The radicals of any chain length R n · undergo propagation with a monomer unit M (rate coefficient k p ), and termination by combination ( k t c ) and by disproportionation ( k t d ). Chain transfer to the monomer is also considered ( k c t m ). The population balance equations (PBEs) are given in Table 2, where the definitions of the zero- and first-order moments of the chain length distribution of the active chains ( λ 0 and λ 1 , respectively) and of their number average molecular weight ( M n R ) are as follows:
λ 0 = n = 1 R n ·
λ 1 = n = 1 n R n ·
M n R = M W M A A λ 1 λ 0
where M W M A A is the molar mass of MAA, thus the average chain length is defined in g mol−1. The reaction rate coefficients are defined in Table 3, where χ is the conversion and P and T are set to 1.013 bar and 323 K, respectively. In the definition of the composite model for the termination rate coefficient, a critical average chain length M n , C R = 68   M W M A A is considered, according to Wittenberg et al. [25]. Since we do not include the population balance equations for the dead chains, we cannot compute the weight-average molecular weight required to calculate the viscosity parameter C η as detailed by Wittenberg et al. [25]; nevertheless, we obtained a satisfactory overlap of our model with the k t versus conversion profiles at 30 wt % of MAA reported in the reference by setting C η to 9. In the model equations, a constant density of 1.1 g mL−1 is assumed for D2O solutions.
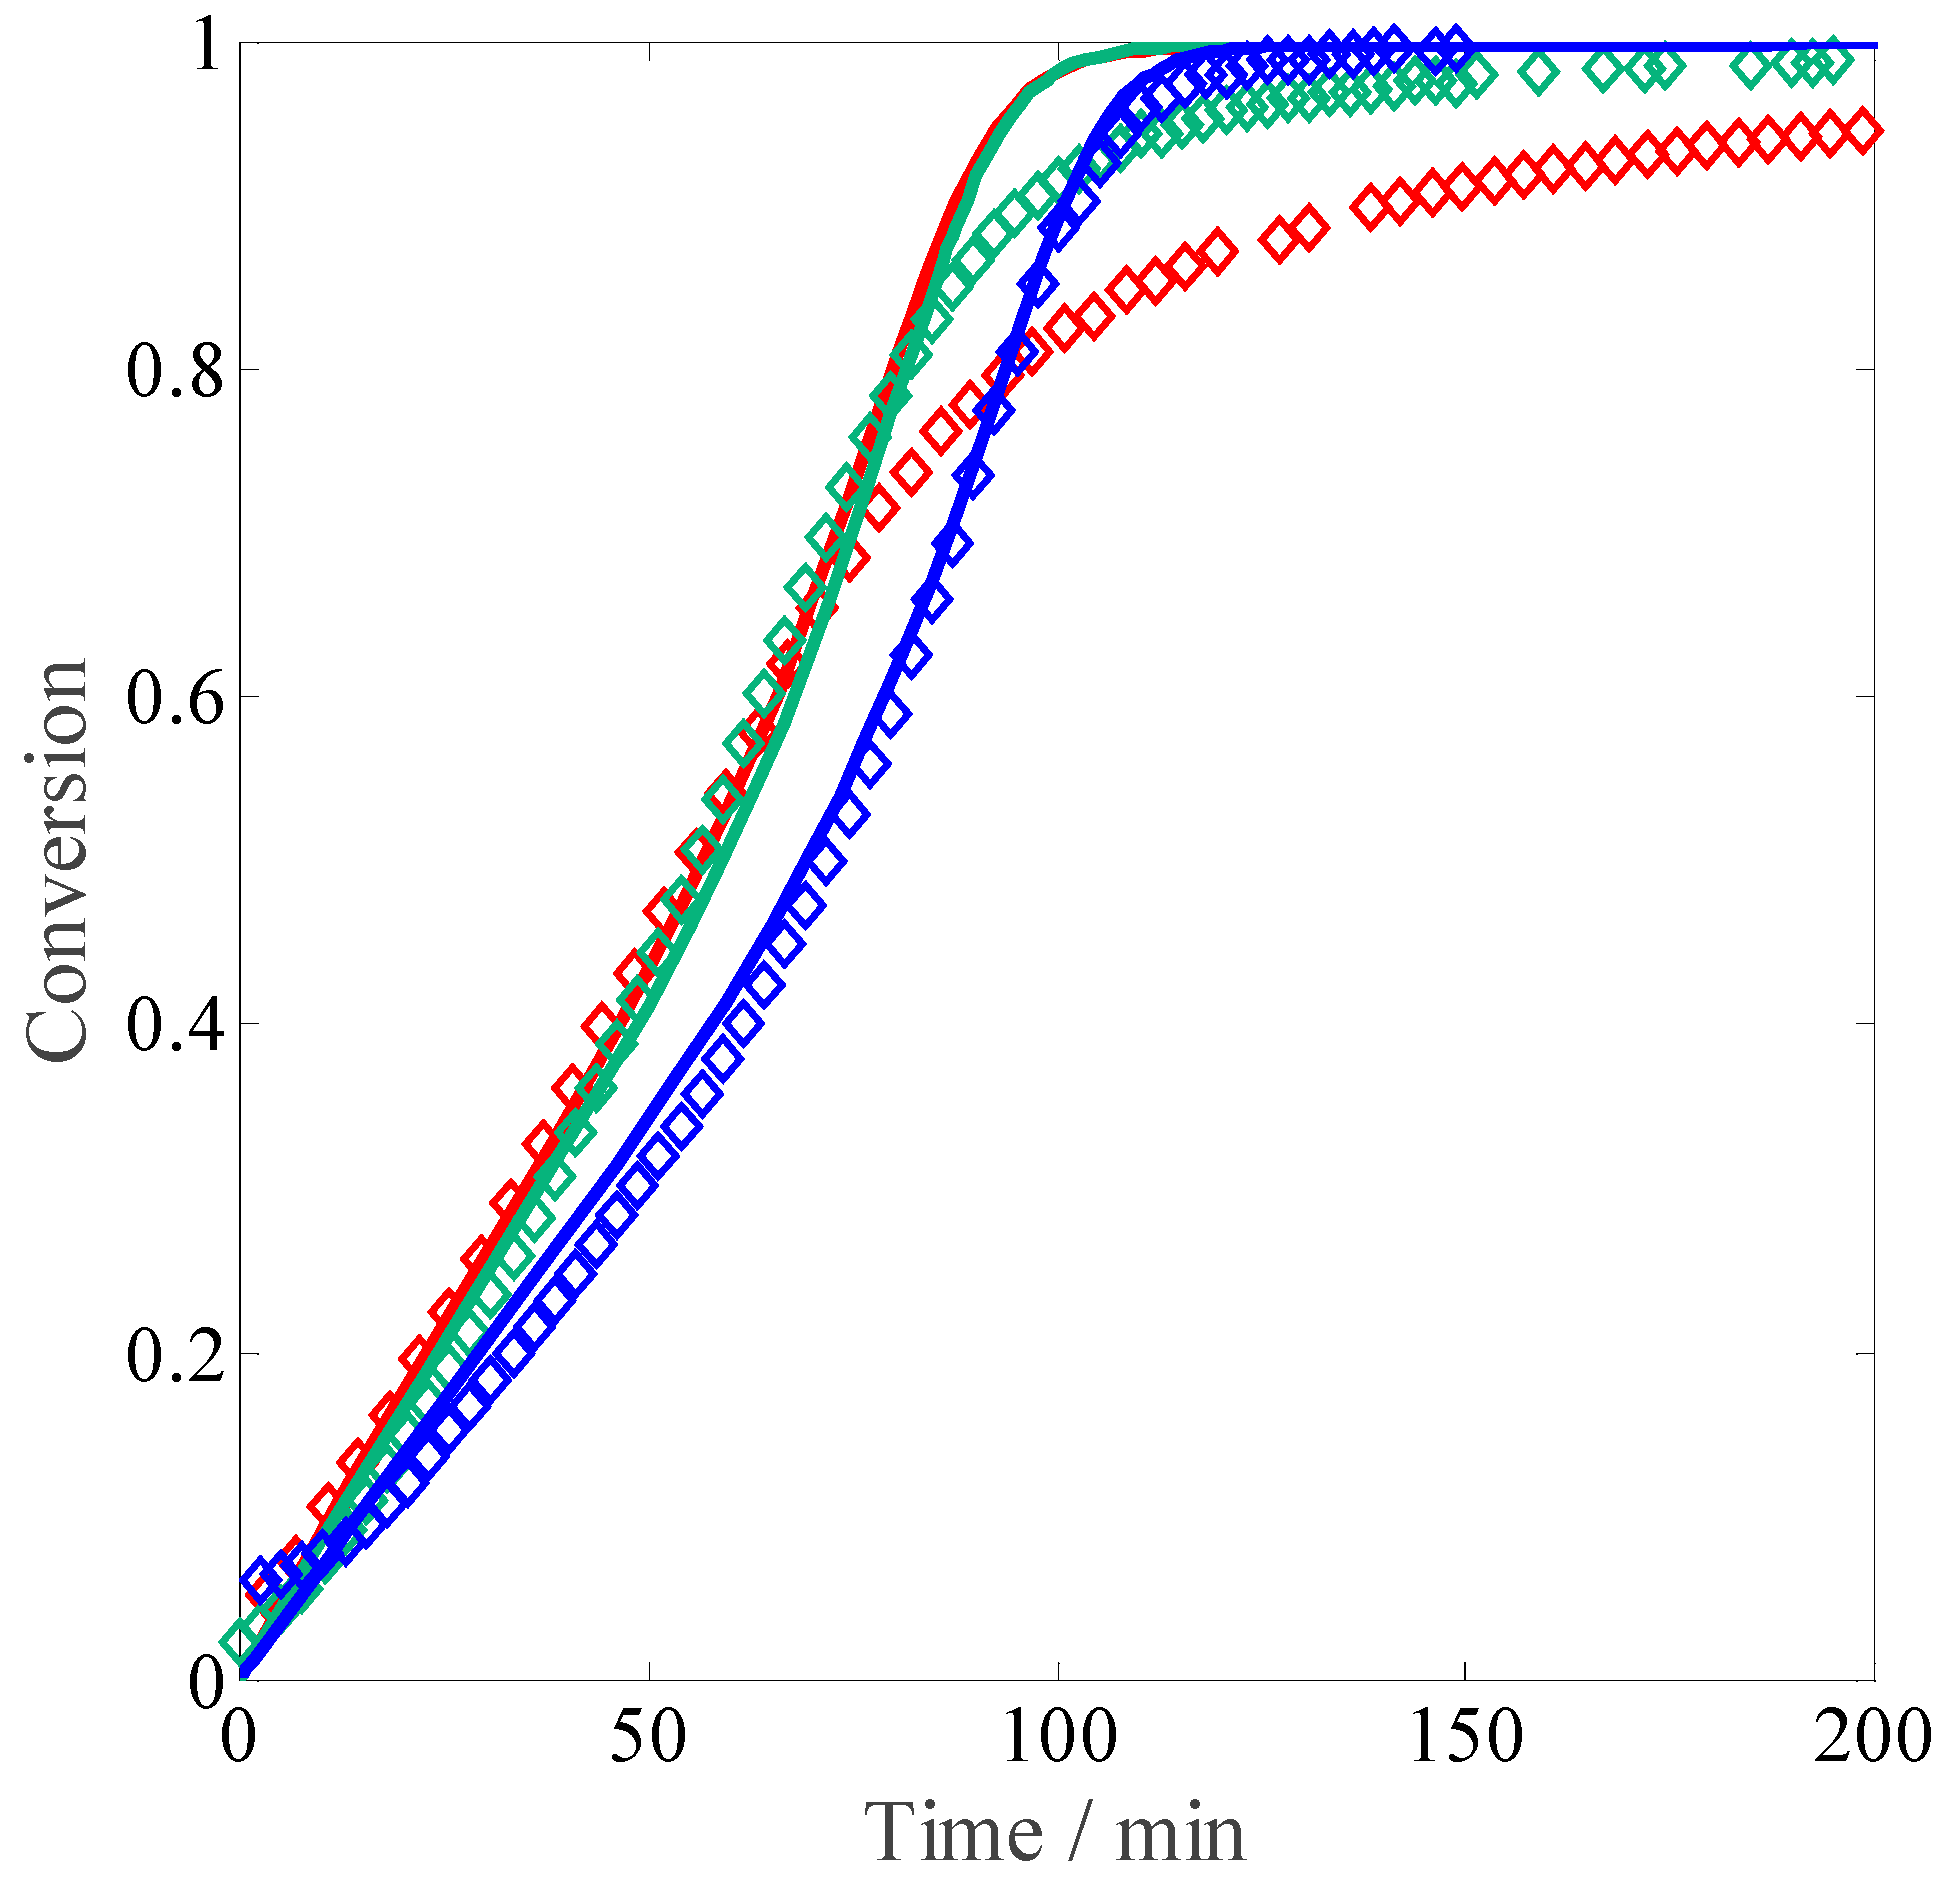
Once all parameter values are set, the model is used to predict the kinetic profiles for our experiments at 1 wt %, 5 wt %, and 10 wt % of MAA. The resulting curves are shown in Figure 1: a good agreement between the experimental data and the model predictions is found, with the initial slope perfectly reproduced at all the concentrations. At 10 wt % of initial monomer, both the simulated curve and the experimental data show an increase in polymerization rate due to the gel effect; moreover, they are nicely superimposed. On the other hand, at 1 wt % and 5 wt % the model predicts a slight increase in reaction rate, which is not observed experimentally. This discrepancy could reflect an increase in termination or a decrease in the propagation rate not accounted for by the model.
To better elucidate the possible reason for this disagreement, the experimental data have been processed as follows: (i) the local slope Δ χ / Δ t is calculated at each time step; (ii) the product between the propagation rate coefficient and the actual radical concentration, λ 0 , is evaluated as:
k p λ 0 = Δ χ / Δ t 1 χ
(iii) using the k p value defined as in 
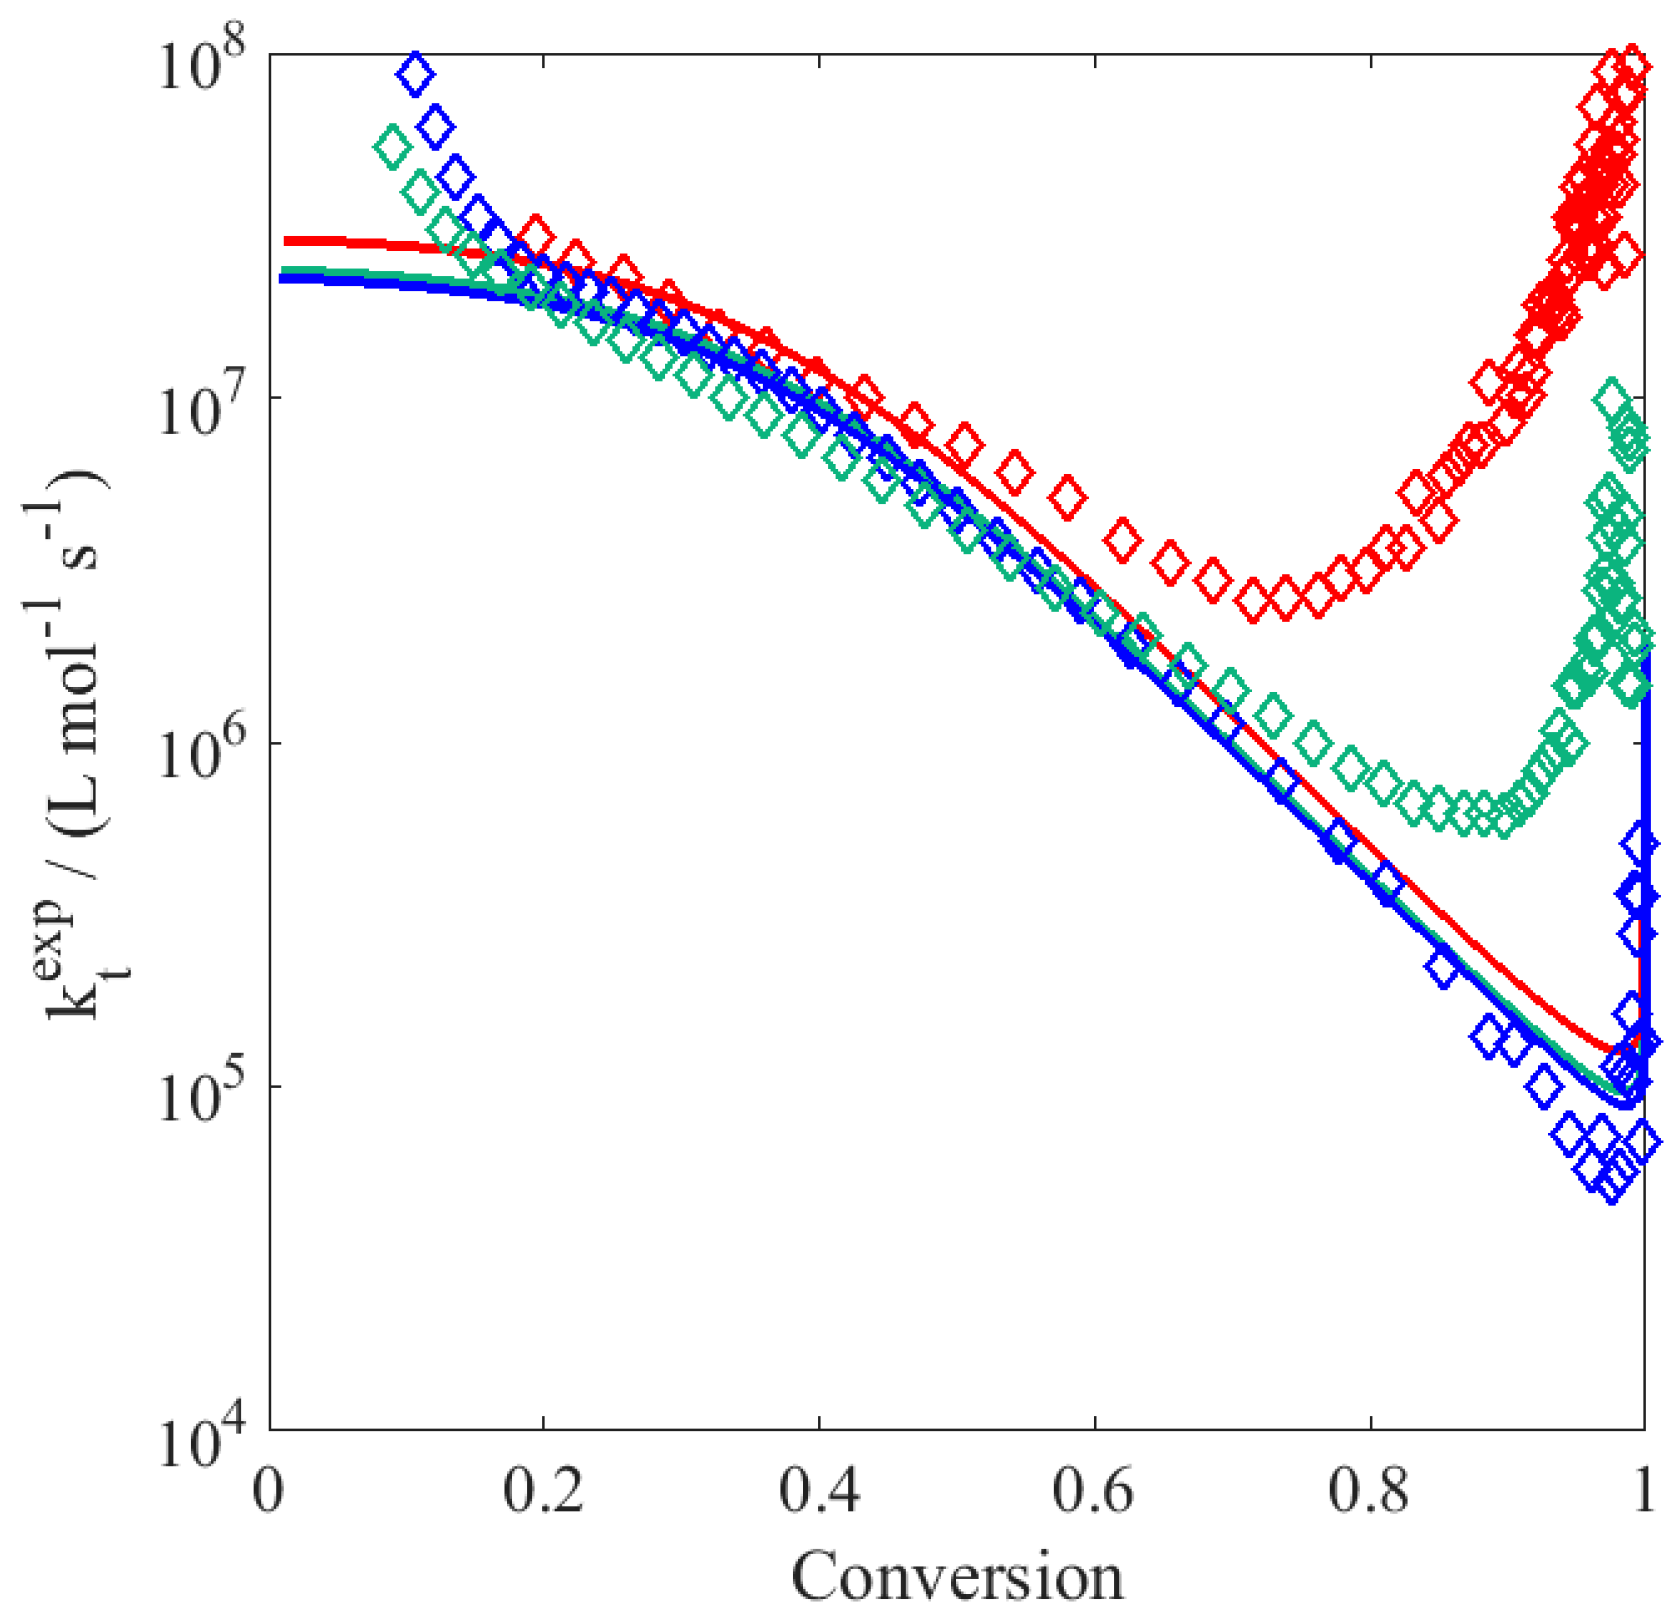
Table 3, the radical concentration is then obtained; and (iv) the apparent rate coefficient of termination is finally estimated as:
k t e x p = f k d I 2 λ 0 2
These resulting k t e x p values are depicted in Figure 2: the increase in k t reflecting the slowdown mentioned above becomes relevant at residual monomer concentrations below 0.5 wt %, i.e., at large polymer contents. Generally, a decrease (instead of an increase) in termination rate towards higher conversion is expected, thus the observed deceleration in the conversion versus time profiles should be imputed to a decrease in the propagation rate coefficient. Since k t is chain-length dependent (cf. Table 3), there is also the possibility that at high monomer conversion, the termination rate coefficient increases due to reduced monomer concentration leading to the production of shorter chains. However, from Figure 2 such an increase in the literature k t is observed only at very large conversion (i.e., above 95%): before that point, the termination rate coefficient decreases monotonously with conversion.
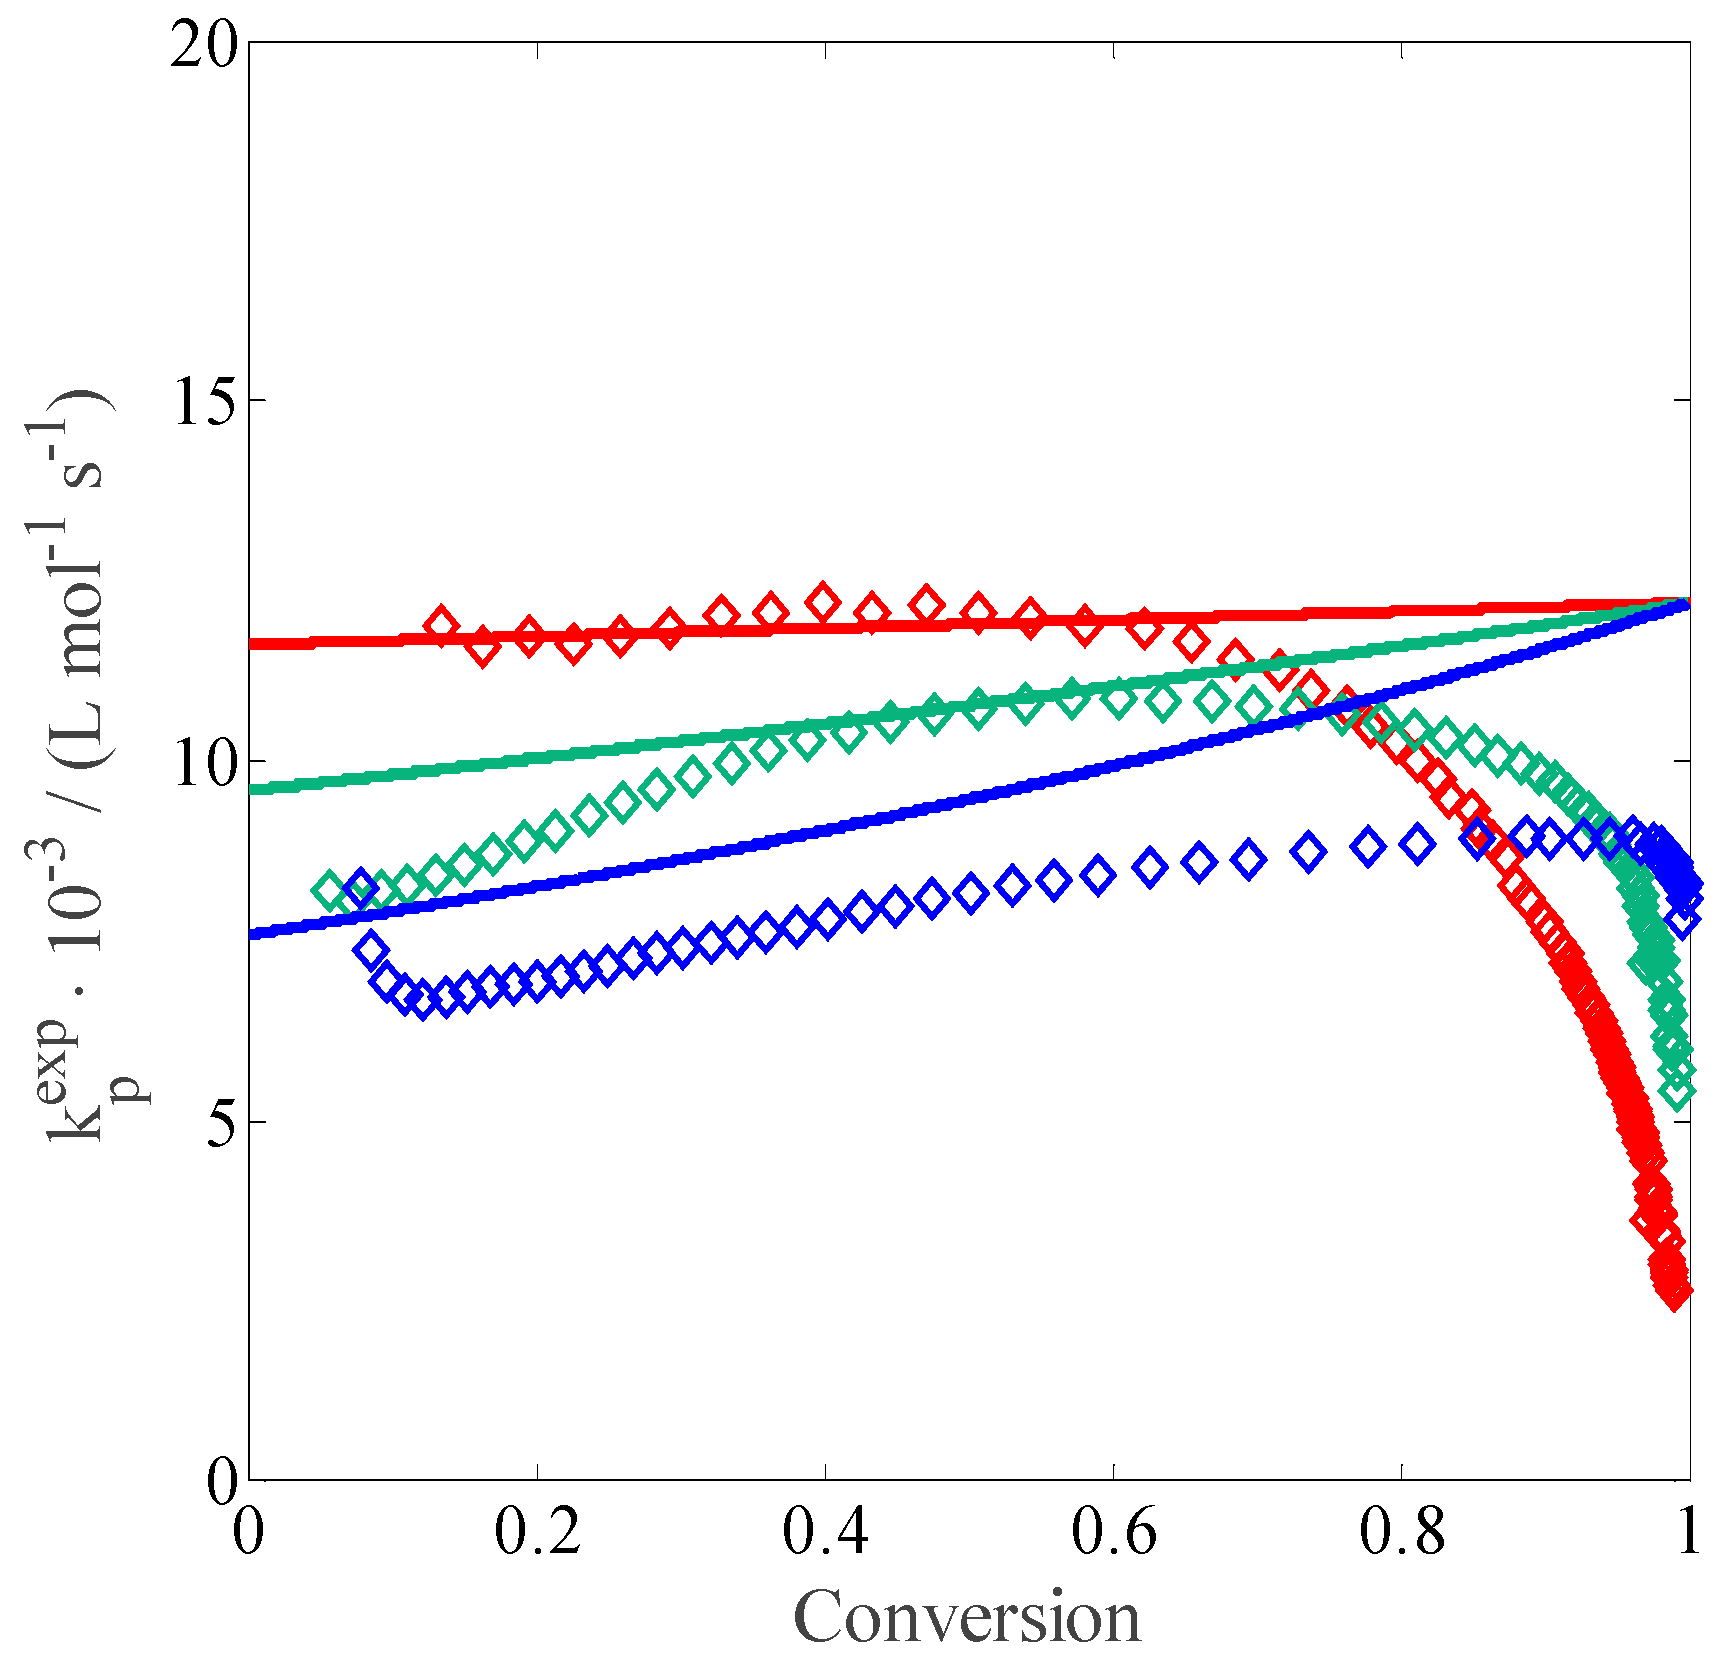
Therefore, a similar procedure as above has been applied to calculate the propagation rate coefficient deduced from experiments, this time by using the termination rate coefficient as in Table 3. Since k t is function of k p , the procedure is not as straightforward: at each ( t , χ ) step, the set of PBEs in Table 2 is solved for different values of k p while minimizing the error between the experimental and calculated conversion. 
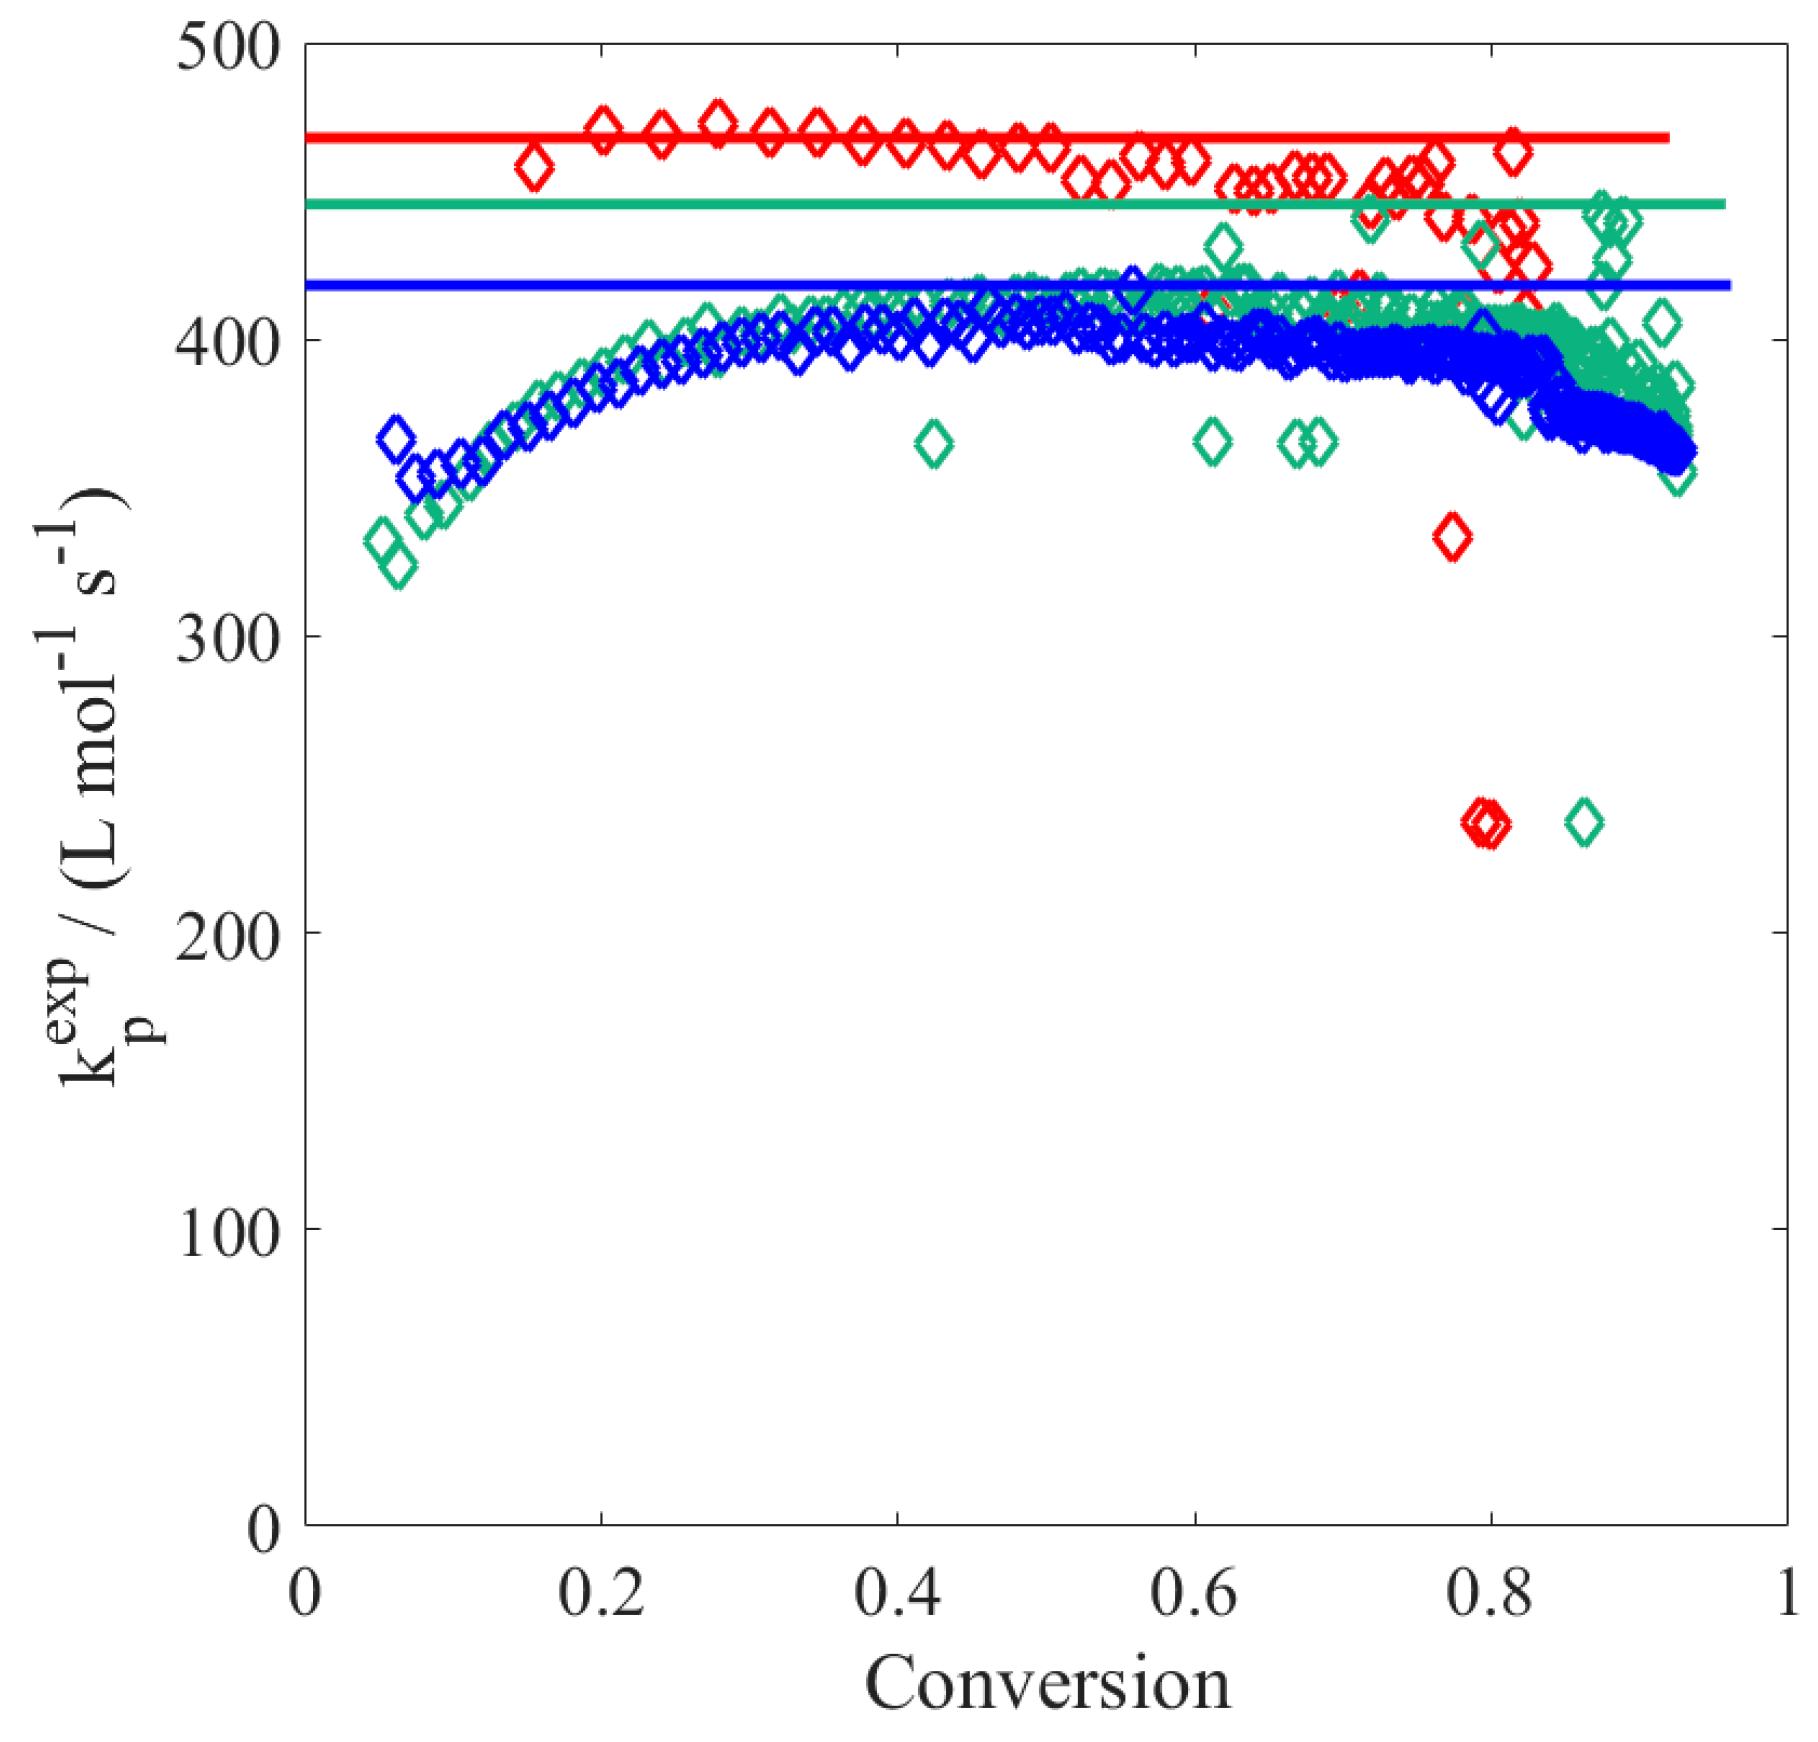
Figure 3 shows the resulting k p e x p curves as a function of conversion: all the curves exhibit a strong decrease at high conversion, more or less when the residual MAA concentration falls below 0.5 wt %. A similar behavior has been previously reported for the polymerization of acrylic acid (AA): a decrease of the apparent k p at concentrations below 3 wt % has been noticed and imputed to differences in the local and overall monomer concentrations in solution, which may be a result of preferential solvation [26]. This decrease explains the decreasing reaction rate at high conversion shown in Figure 1. Apart from this discrepancy, the k p predicted by the model equations provides a reasonable description of k p e x p as shown by Figure 3. Therefore, we can conclude that the developed model is suitable for reproducing the experimental behavior of the system at medium-high monomer concentration and to qualitatively capture the trends of the propagation and termination rate coefficients as a function of conversion. The residual weakness in predicting the polymerization rate at lower monomer concentration is imputed to inaccurate k p evaluation at high conversion.

3.2. Fully Ionized System

Three different sets of experiments are carried out for the polymerization of fully ionized MAA at 50 °C and 0.10 wt % V-50: the first set at different values of initial monomer concentration; the second set at different values of initial monomer concentration while keeping the ionic strength constant at an ionic strength equivalent to a monomer concentration of 10 wt %; and the third set at different values of ionic strength while keeping w M , 0 constant at 5 wt %. In the second and third cases, the ionic strength is adjusted by the addition of NaCl. An overview over all these polymerization reactions is provided in Table 4. A remarkably good reproducibility of the experiments in the fully ionized case has been observed for the reactions at 1 wt % and 10 wt % initial MAA, as reported in Figures S5 and S6 of the Supporting Information.
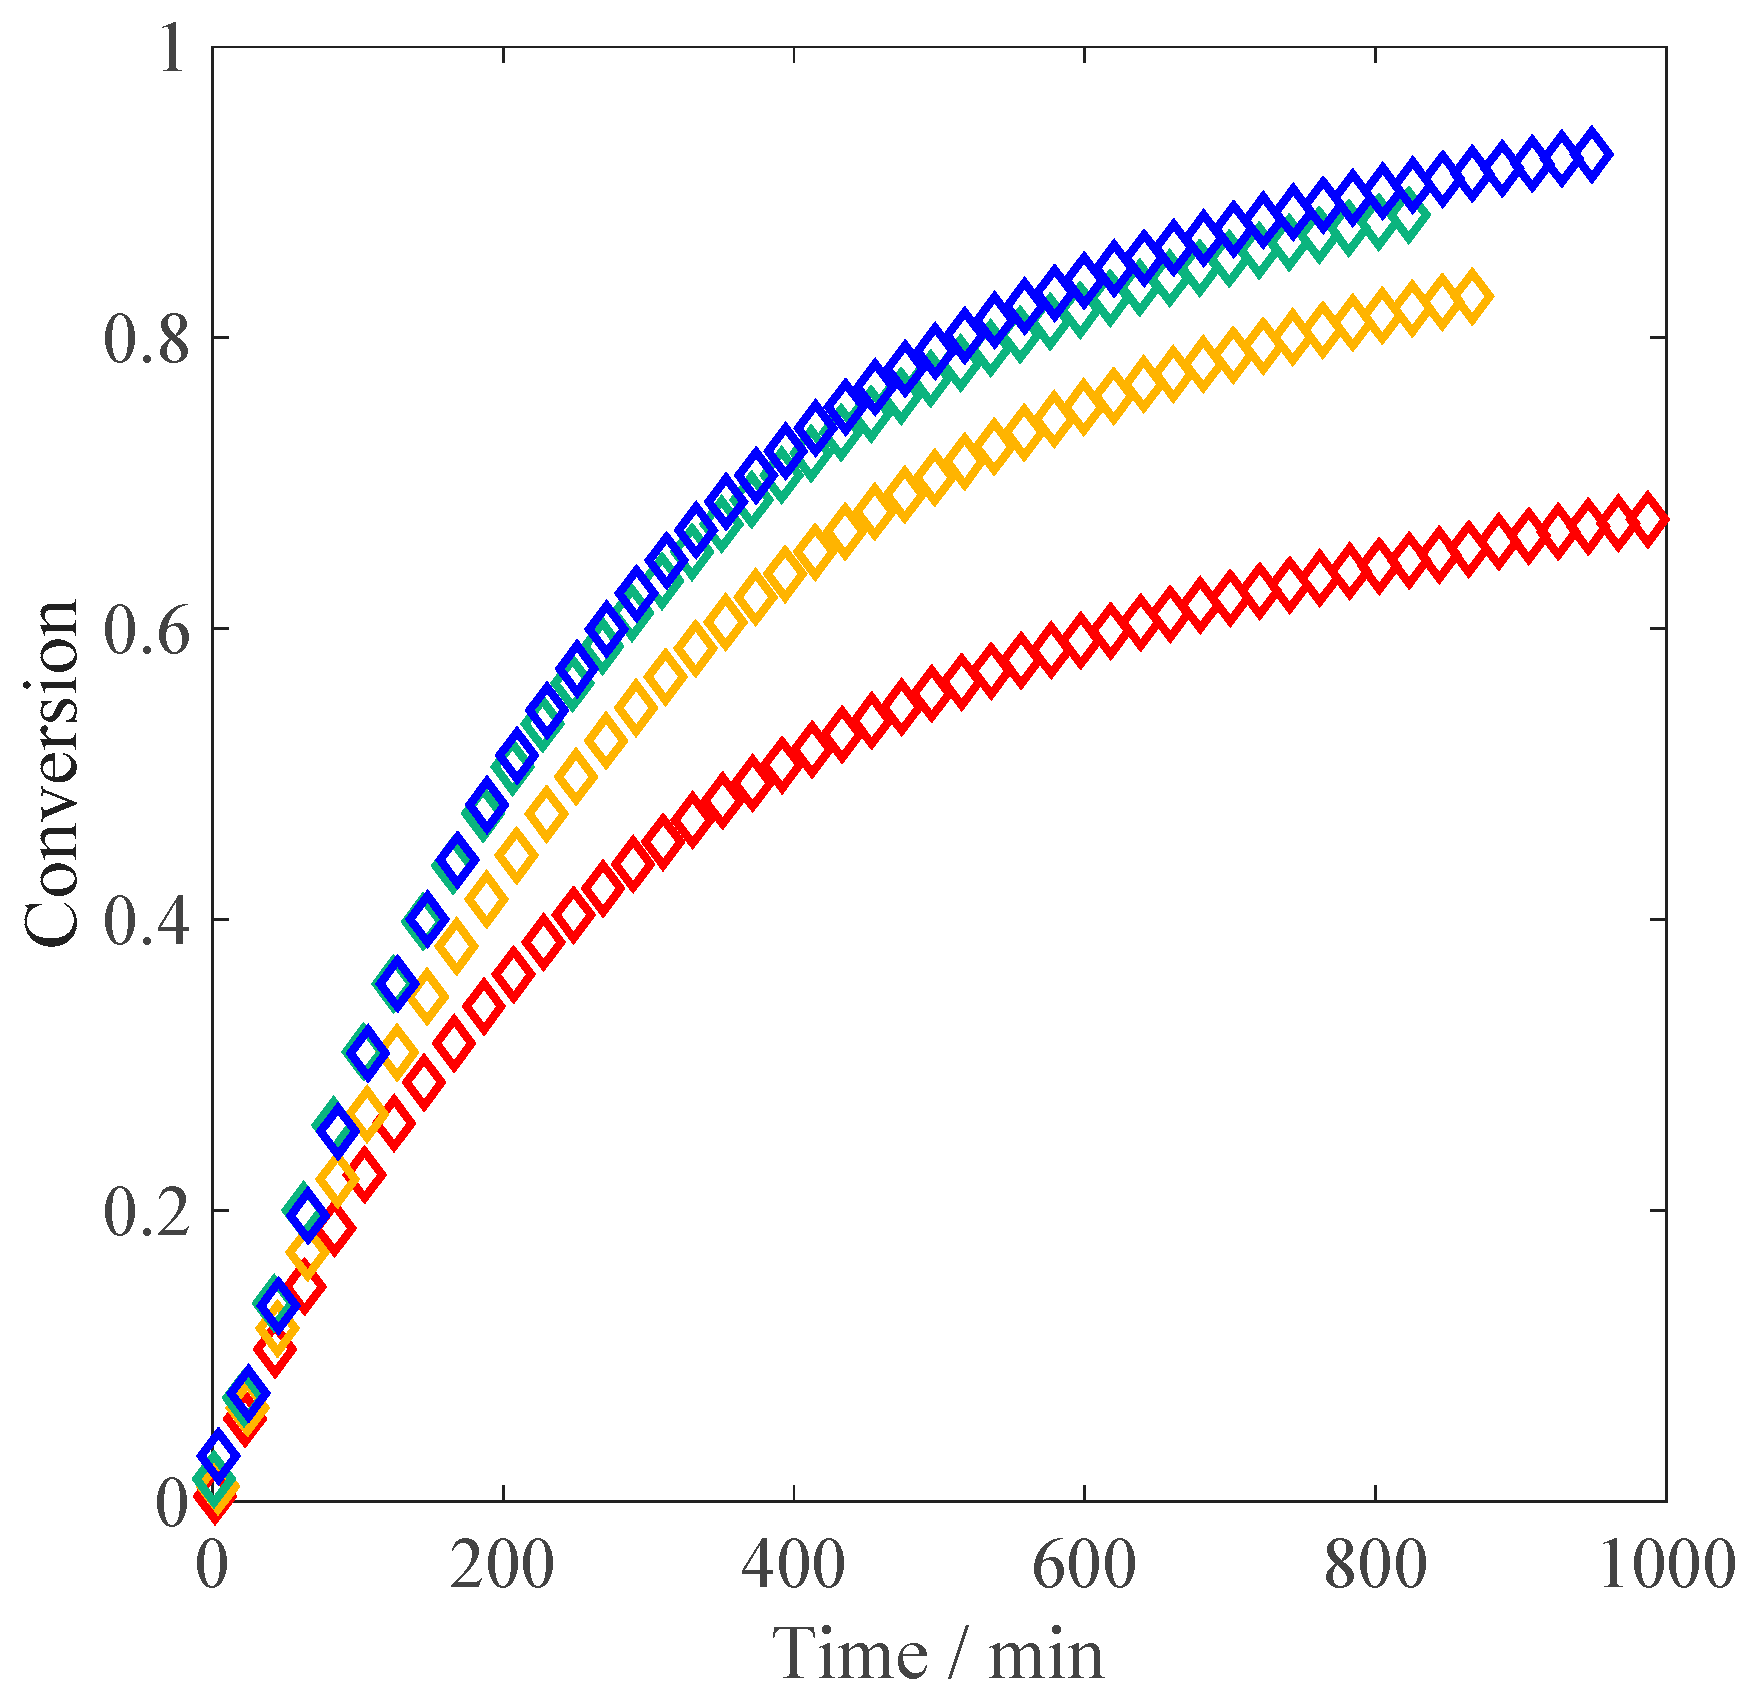
Let us consider the experiments at different monomer concentrations. When comparing the resulting conversion versus time curves shown in Figure 4 to those reported above for the non-ionized case (Figure 1), the initial reaction rates are much slower at full MAA ionization: this feature can be explained by the electrostatic repulsion between the charges of the ionized reactants in solution. An increase in the polymerization rate is observed when moving from 1 wt % of MAA to the higher concentrations, whereas between 2.5 wt % and 10 wt % the kinetics appears to be unaffected by the monomer concentration. The former effect corresponds to an increase in the propagation kinetics due to an increase in the solution ionic strength, in agreement with the so-called phenomenon of electrostatic screening: namely, higher initial concentration of the monomer corresponds to higher concentration of the electrolyte in the system [6,11]. The latter effect is more surprising, and reveals either a saturation of the electrostatic screening already at 2.5 wt % of MAA or a competition between electrostatic and non-electrostatic effects of monomer concentration on propagation kinetics. Another counterbalancing effect to the electrostatic-driven increase in k p could be represented by the known dependence of termination kinetics of fully ionized MAA on monomer concentration [27].
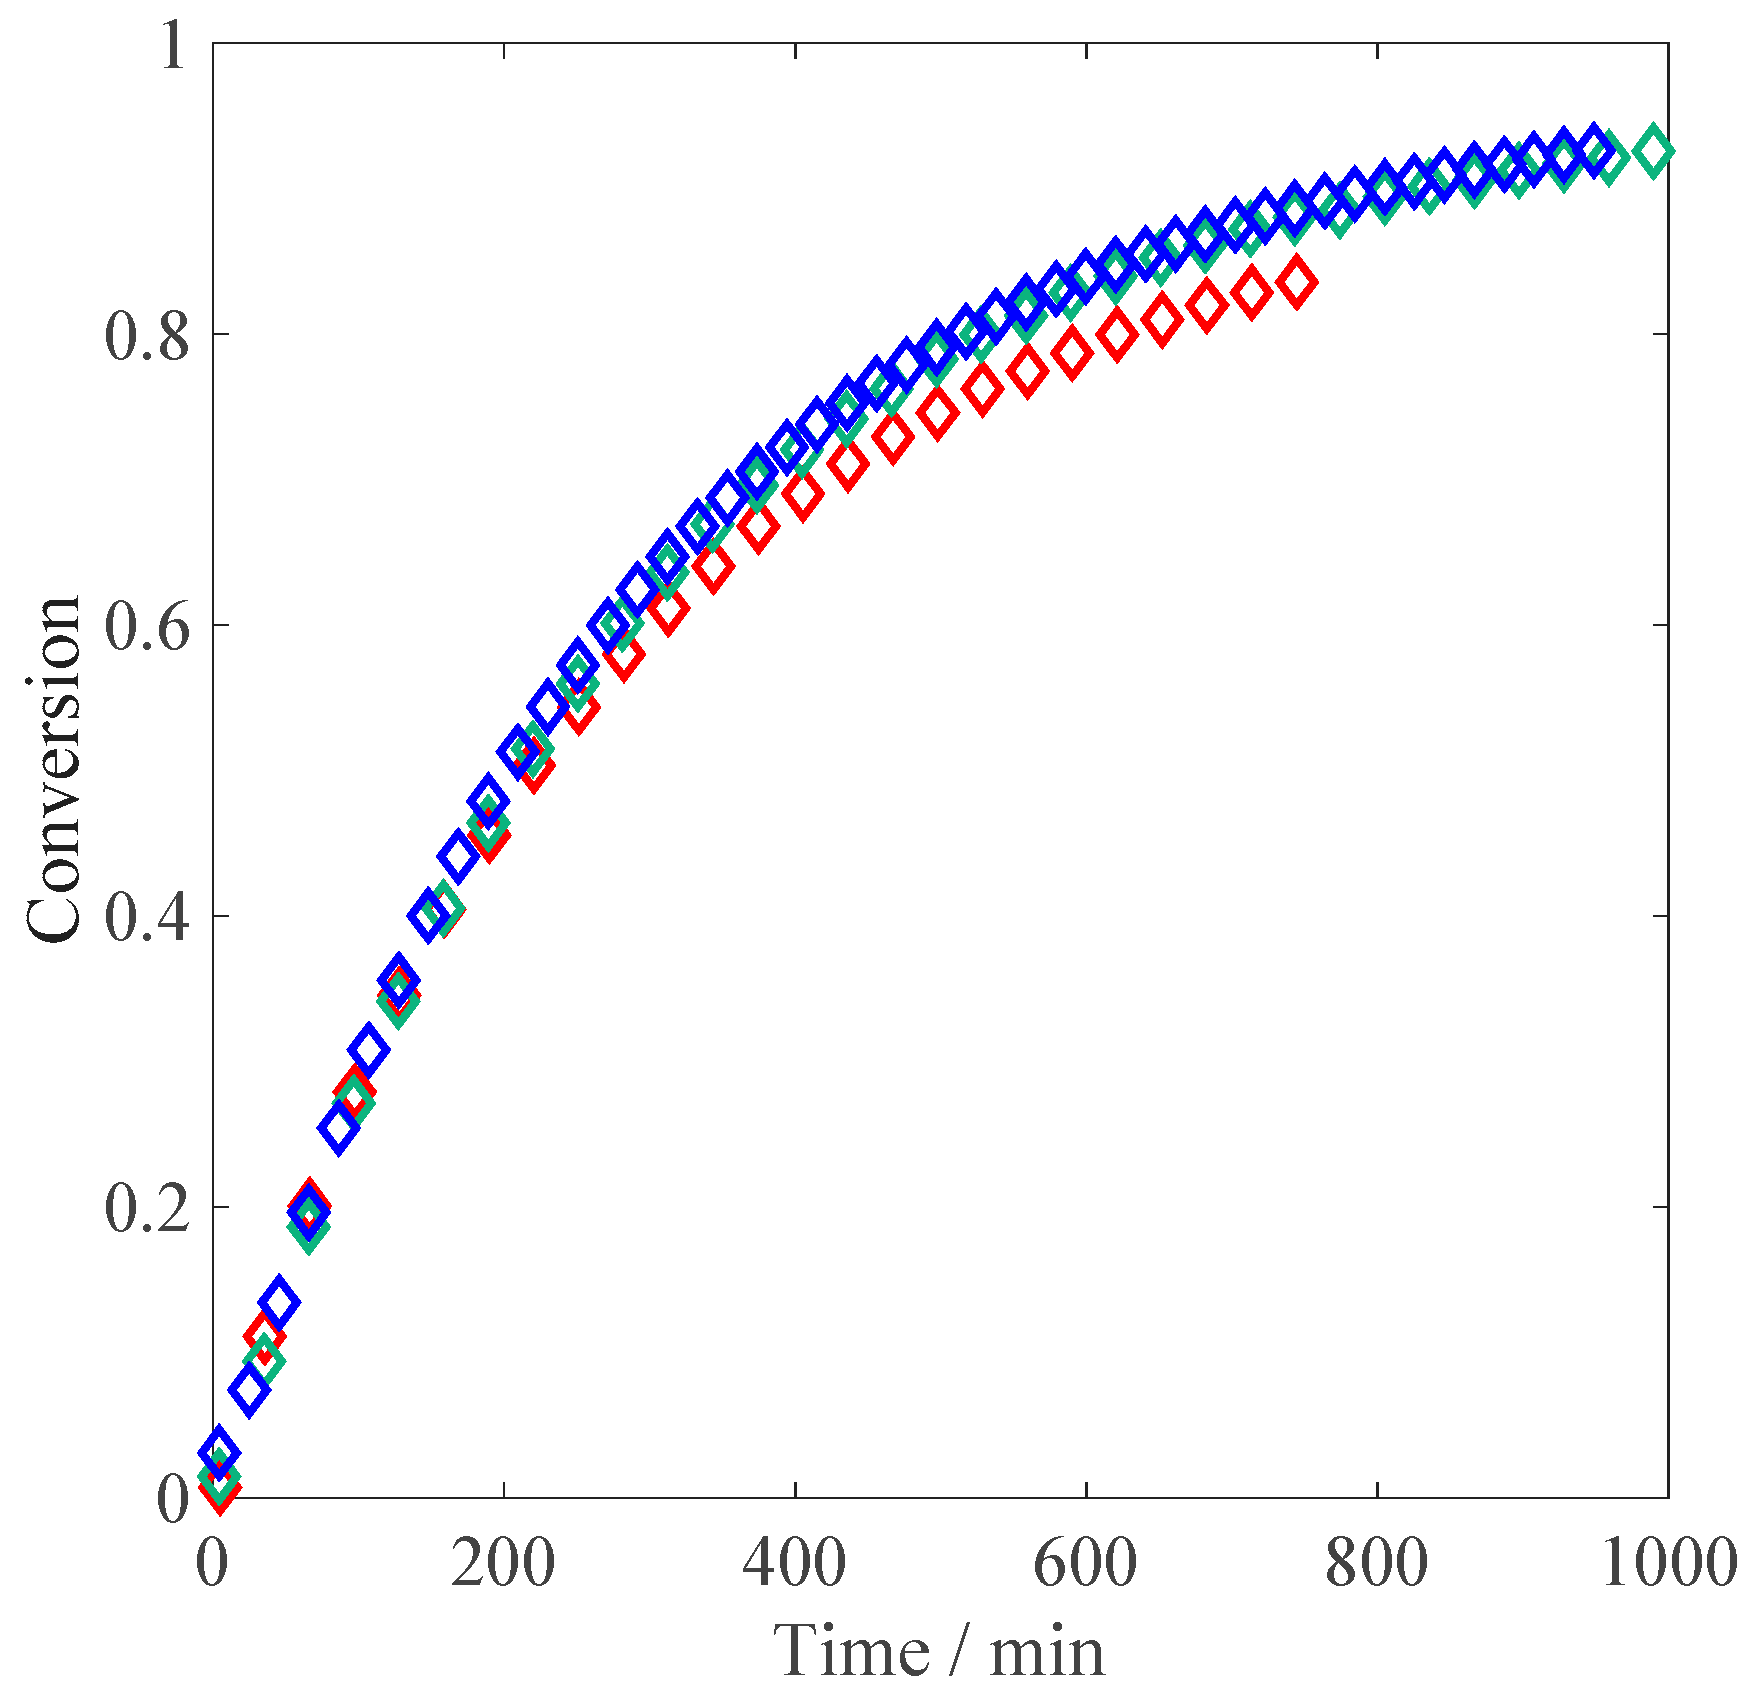
The impact of monomer concentration on the reacting system at constant ionic strength (equivalent to 10 wt % MAA) and 0.10 wt % of initiator is shown in Figure 5. The idea behind this set of experiments is to reproduce the non-electrostatic influence of the monomer concentration, keeping the ionic strength constant. As shown in the figure, the initial reaction rate does not change with the monomer concentration. Only at a conversion higher than 50% does the curve at low monomer concentration seem to become slower than those at higher monomer concentration, where the propagation rate seems to be fully independent of the non-electrostatic (i.e., intrinsic) reactivity.
The impact of NaCl addition on the reacting system at constant monomer concentration is shown in Figure 6. The aim is to reproduce the ionic strength of higher monomer concentrations while keeping constant the initial monomer concentration, in order to separate the effect of the charges from the mixed effects associated to an increase in monomer content (i.e., electrostatic and non-electrostatic ones). As shown in the figure, the initial reaction rate increases continuously with increasing amounts of added salt. Additionally, there is no visible effect of autoacceleration on the rate of polymerization in this case.
Since the propagation reaction seems to be affected by the electrolyte concentration in the entire explored range (i.e., up to 30 wt % of equivalent MAA), this same reaction is expected to never become fully kinetically-controlled: namely, the effects of electrostatic interactions and electrostatic screening on the propagation kinetics are likely to play a role at all explored values of initial monomer concentration, and some kind of “electrostatic saturation” at higher monomer content (i.e., above 2.5 wt % of MAA) cannot be assumed.
Aiming to develop a kinetic model for the polymerization of fully ionized MAA, the reaction scheme and population balances in Table 1 and Table 2 are again considered, whereas the validity of the reaction rate coefficients in Table 3 is critically discussed hereinafter.
The propagation rate coefficient proposed by Beuermann et al. [21] has been improved by Lacik et al. to take into account the effect of acid ionization [20]. However, as this equation has been proposed for the specific range of initial monomer concentration 5   wt   % w M , 0 40   wt   % , it cannot be used for our experiments at 1 wt % and 2.5 wt % of initial monomer content, where the calculated k p would be negative. Furthermore, this equation cannot be used to simulate the effect of ionic strength on the propagation kinetics coming from NaCl addition. For these reasons, we propose a rate law of propagation of fully ionized MAA composed of an intrinsic kinetics term and a diffusion term, the latter being driven by electrostatic interactions and thus a function of the electrolyte concentration, similar to the equation developed in a previous work [11]:
k p = ( 1 k p , i 0 exp ( B w M , 0 ) + 1 k D , 0 C E β ) 1
where k p , i 0 , k D , 0 , β , and B are fitting parameters, while C E is the electrolyte concentration in mol kg−1, which is a function of w M , 0 :
C E = 2 ( w S , 0 M W N a C l + w M , 0 α M W M A A )
where w S , 0 and M W N a C l are the initial weight fraction and molar mass of NaCl, respectively.
The first part of Equation (7) introduces the non-electrostatic dependence on the monomer concentration, similar to what has been done by Beuermann et al. for non-ionized MAA [21]. However, it should be noted that such dependence can be in principle different for the fully ionized case: for this reason, the parameter B is estimated as well. For simplicity, the conversion-dependent term of the exponent ( 1 χ ) / ( 1 w M , 0 χ ) has been omitted. The parameter k p , i 0 identifies the intrinsic kinetics rate coefficient of fully ionized MAA, thus without any electrostatic interaction effect. The electrostatic and non-electrostatic dependence of k p on w M , 0 for the fully ionized case, defining respectively an increase and a decrease of the rate coefficient as the initial monomer concentration increases, are expected to compensate each other at higher monomer concentrations, thus reproducing the experimental behavior observed in Figure 4.
In order to verify if the proposed rate law for k p is reasonable, the propagation rate coefficient is evaluated as a function of conversion using the same procedure described for the non-ionized case, namely using the experimental data reported in Figure 4 and Figure 5. As for k t , the rate coefficient from a recent publication by Kattner et al. [27] has been adopted: the authors proposed an expression for the termination rate coefficient at monomer concentrations of 5 and 10 wt % as shown in Table 5.
Similar to the propagation rate, it can be assumed that the termination reaction is also made of two contributions, one related to an intrinsic kinetics and the other driven by electrostatic interactions. Due to the limited amount of available data, we need to assume that only one of these two contributions majorly affects the termination rate. Since bimolecular termination of growing radicals is a reaction with a low activation energy barrier (mostly controlled by diffusion), we assume that the change in ionic strength upon change in monomer concentration is principally responsible for the k t variation as a function of w M , 0 . This is considered more realistic than an effect of monomer concentration on the fluidity of the transition state, as previously considered in the non-electrostatic effect of monomer concentration on the propagation kinetics of other water soluble compounds [8]. Therefore, we will focus on those experiments with an ionic strength (obtained by a certain amount of monomer concentration or addition of NaCl) equivalent to a monomer concentration of 5 wt % or 10 wt % when considering the k t expressions reported in Table 5.
Equivalent to the procedure for the non-ionized case (cf. Figure 3), the experimental propagation rates are shown in Figure 7 and Figure 8 for ionic strengths equal to 5 wt % and 10 wt %, respectively. The propagation rate coefficient of 5 wt % MAA without addition of NaCl can be compared with the experimental results of Lacik et al. [20]: at our reaction temperature (50 °C), the Lacik equation predicts a propagation rate of about 770 L mol−1 s−1, whereas our experimentally deduced propagation rate is about five times smaller. At monomer concentrations of 5 wt % and 10 wt %, the propagation rate increases at low conversion, which is probably due to the competition between propagation and radical scavenging by the inhibitor. Above 50% conversion, a general decrease is visible. Apart from these minor variations with conversion, the results reveal that the reaction rate increases with ionic strength. In fact, for any monomer concentration, the propagation rate at an ionic strength of 10 wt % monomer concentration is 2–3 times faster than at 5 wt %. At constant ionic strength, a reduction of monomer concentration leads to a slight increase of the propagation rate coefficient. However, this effect is less relevant than the change in ionic strength. The observed competition between the influence of monomer concentration and ionic strength confirms the suitability of the propagation rate law in Equation (7) to describe at least qualitatively the kinetic behavior of the system.
The four parameters k p , i 0 , k D , 0 , β , and B are estimated by fitting the model equations to the experimental data of conversion versus time for the fully ionized case. The ratio of the parameters k p , i 0 exp ( B w M , 0 ) and k D , 0 C E β is expected to be close to unity: this way, the diffusion limitation to k p due to the electrostatic interactions should be effective inside the entire range of ionic strength values explored, as deduced from the experimental results. It should be noted that k D , 0 must be expressed in L mol−1 s−1 (kg mol−1)β in agreement with the definition of C E in the model. The exponent β is dimensionless and it is expected to range between 0.1 and 10, while B is a measure of the influence of initial monomer concentration on the kinetics. As the value for non-ionized MAA has been determined as 5.3 [21], a similar value (between 1 and 10) is expected.
The parameters are estimated by minimizing the square of the error between experimental and simulated conversion versus time data. This minimization is carried out by a genetic algorithm which is implemented using Matlab. An optimization run was conducted to evaluate the four mentioned adjustable parameters and leads to the results and parameter values reported in Figure 9, Figure 10 and Figure 11 and Table 6, respectively. 
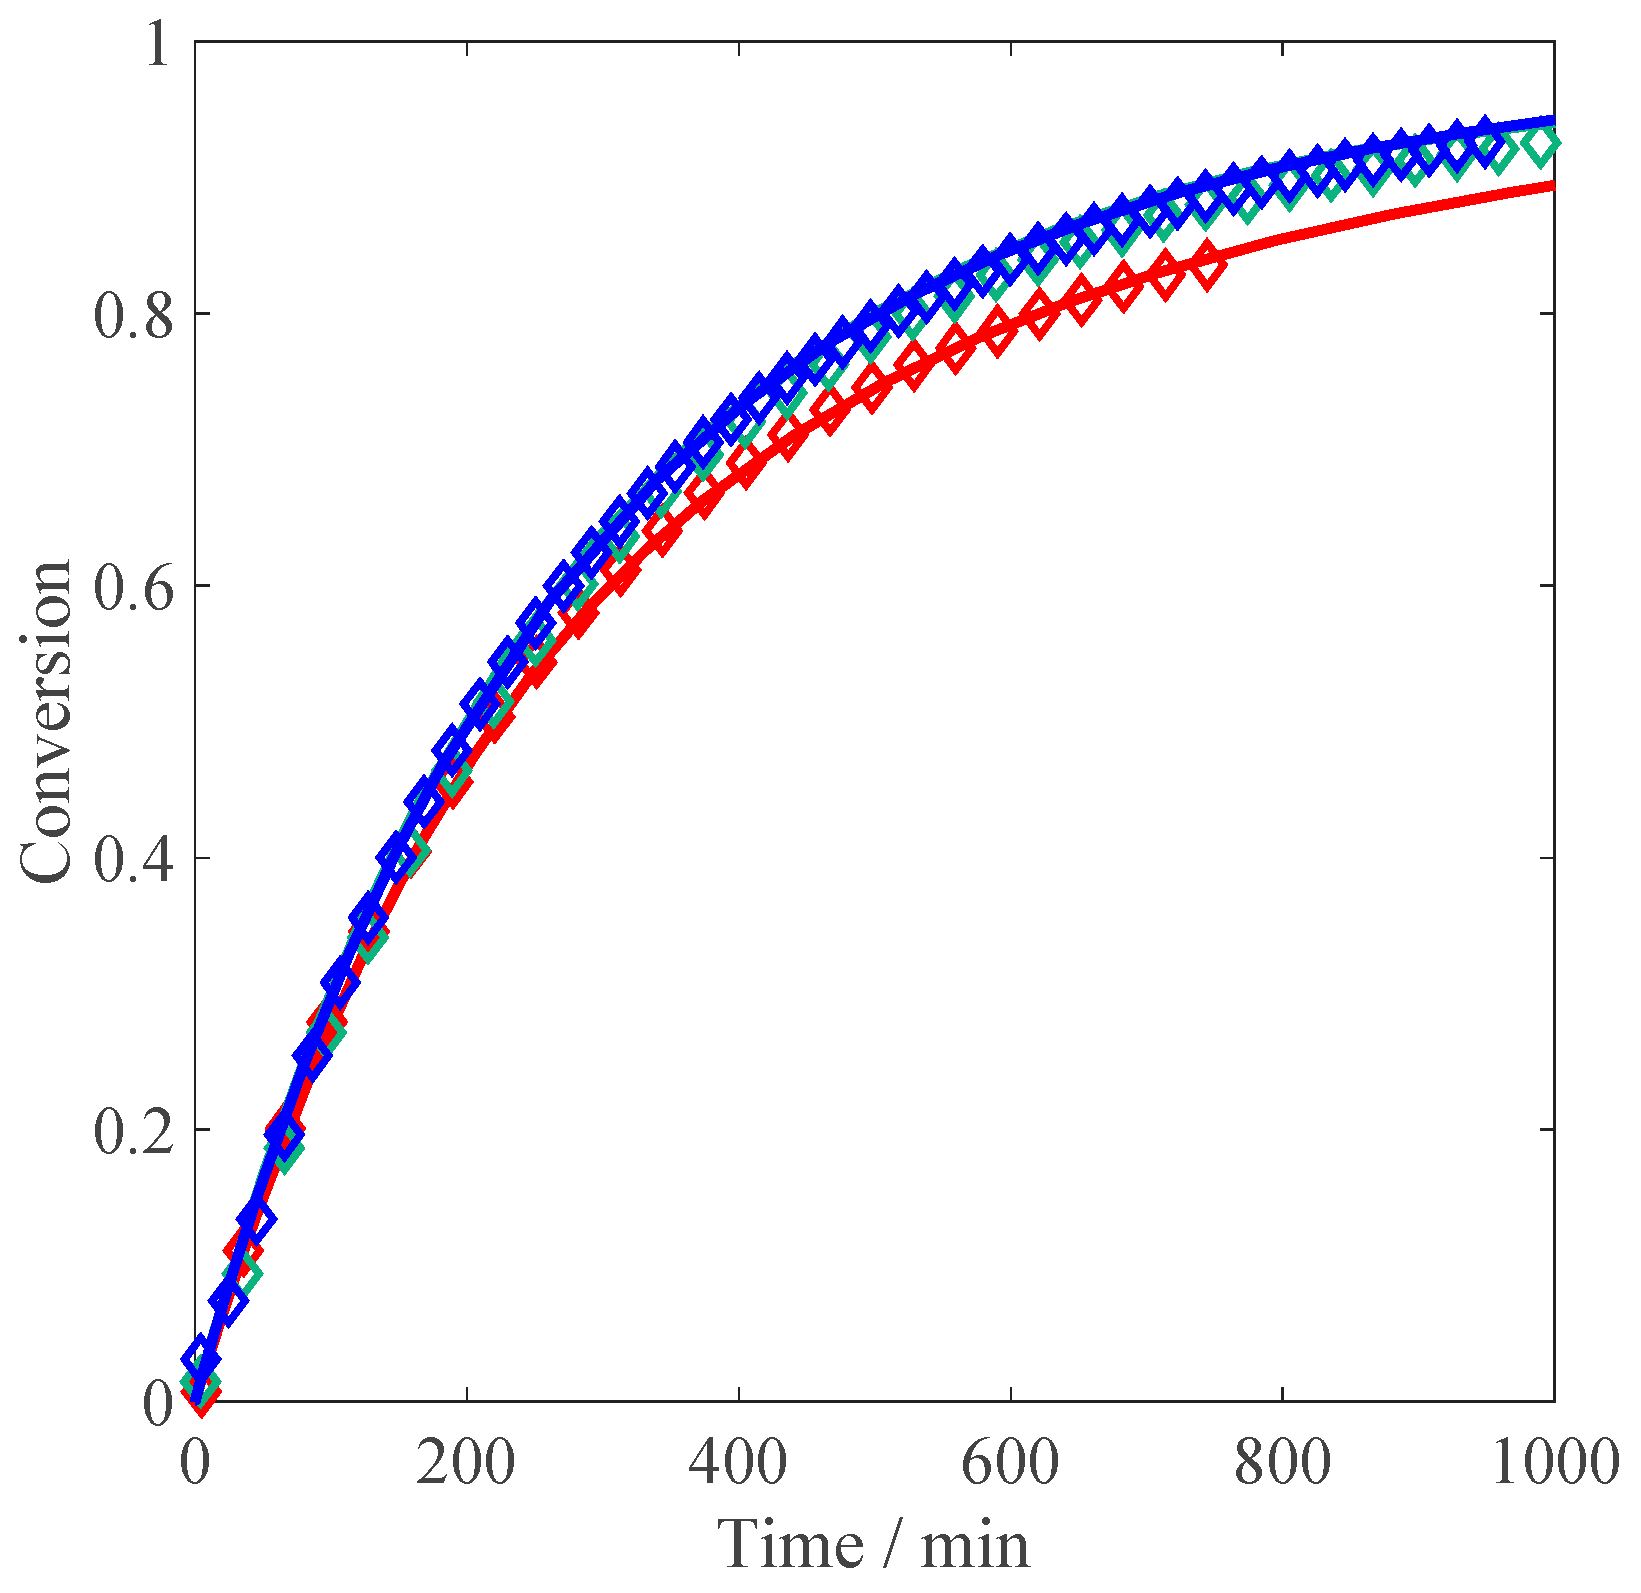
Figure 9 compares the influence of monomer concentration without salt on conversion: while the curve at 10 wt % is perfectly reproduced, at 5 wt % monomer, the model predicts a reaction rate which is slightly faster than that at 10 wt %, but while looking at the experimental data the rates should be exactly the same (i.e., the electrostatic and intrinsic kinetics effects on the propagation and termination rate coefficients should be perfectly balanced). Towards higher conversion, the model correctly predicts a decrease of the reaction rate at 5 wt %.
The influence of monomer concentration at an ionic strength equivalent to 5 wt % is shown in Figure 10. Qualitatively, the initial slopes at varying amounts of MAA are well reproduced, although the impact of monomer concentration on the initial rate is slightly too strong. The decrease in the reaction rate at conversions above 50% is very well described for both monomer concentrations.
A similar comparison is shown in Figure 11, where the ionic strength is set equivalent to 10 wt % MAA. As already mentioned in the discussion of Figure 5, the initial slope is the same for all MAA concentrations, which is well reproduced by the model, as well as the behavior at higher conversion. Since the model is able to correctly simulate the reduction at 1 wt %, this decrease of the reaction rate cannot be imputed to smaller local concentrations around the polymer chain. It is rather due to a conversion-dependent increase of the termination rate coefficient (caused by a decrease of   M n R ). Note that an effect of local concentration can still be present when considering the reaction at 1 wt % without salt addition, but since we lack an appropriate description of the termination rate at this ionic strength, we are unable to predict this situation.
The parameter values are provided in Table 6: the kinetic rates k p , i 0 and k D , 0 are in the same order of magnitude and similar to the kinetic parameter obtained by Lacik et al. [20], whereas B is slightly smaller than two. It is therefore clearly smaller than the 5.3 obtained by Beuermann et al. [21], but since the reactivity of the ionized MAA is much smaller, it might be reasonable to assume that the effect of monomer concentration is also reduced. The parameter β is slightly larger than two, which is large enough to alter k D , 0 c E β in a way to qualitatively reproduce the experimental behavior at increasing ionic strength. The overall good balance between k p , i 0 exp ( B w M , 0 ) and k D , 0 c E β leads to a good description of the system: at low ionic strength, the propagation reaction is diffusion limited, whereas at ionic strengths larger than 5 wt % (either by addition of NaCl or MAA), the propagation seems to become more reaction controlled, although never completely (as shown by the experimental results in Figure 6). A comparison between the intrinsic kinetics and electrostatic contributions to the propagation rate coefficient for the considered reactions involving fully ionized MAA is given by Figure S7 and Table S2 in the Supporting Information. Moreover, the sensitivity of the model performances upon limited variations of the model parameter values is reported in Table S3 of the Supporting Information, indicating that small variations of each parameter (i.e., within 10 wt %) induce a very large change in the total error between experiments and simulations.
Eventually, in order to better describe what happens at ionic strengths below 5 wt % and above 10 wt %, a more generalized description of the termination rate is required. This knowledge is especially needed to elucidate the reason for the drastically reduced reaction rate at 1 wt % MAA without salt addition.
As a final remark, the knowledge of molecular weights would allow us to improve the reliability of the developed kinetic models, especially for the fully ionized case. Nevertheless, our choice of focusing on time-conversion data only in the analysis and modeling of the system kinetics was motivated by the following reasons: (i) the estimation of accurate MWD for MAA and generally for aqueous polymers is not trivial and requires ad hoc experimental setup and procedures; (ii) the accuracy and reliability of the kinetic data obtained by in-situ NMR is much higher compared to our current capability of measuring MWD; (iii) the availability of independent values of the termination rate coefficients from PLP of non-ionized MAA and, for specific reaction conditions, also for fully ionized MAA makes our approach reasonable for determining the propagation kinetics by focusing only on the measured polymerization rates.

4. Conclusions

Free radical aqueous polymerization reactions of non-ionized and fully ionized MAA were carried out in D2O by in-situ NMR, with a focus on the effect of the monomer concentration (varied between 1 wt % and 10 wt %) on the polymerization rate. The experimental results revealed substantial differences in the behavior of the two systems. The degree of ionization of the monomer plays a major role in determining the overall reaction rate as well as its sensitivity to changes in monomer and electrolyte concentration.
In the non-ionized case, we were able to develop a kinetic model based on literature rate coefficients which is capable of nicely predicting the experimental data at the initial monomer concentration of 10 wt %. At lower monomer concentration and high conversion (ca. 0.5 wt % residual monomer concentration), a decrease in the reaction rate is observed, which cannot be explained by the current version of the model. Similar to what has also been previously highlighted for AA polymerization, interactions between MAA monomer molecules and their environment at high dilution are assumed to be responsible for this kinetic feature not contemplated by the currently developed polymerization models.
In the case of the fully ionized monomer, we improved the model for the non-ionized case by introducing a new rate law for propagation: namely, both electrostatic and non-electrostatic effects of monomer concentration on the reaction kinetics are explicitly considered. Due to the limited amount of termination data, we focused this development on the cases with an ionic strength relative to MAA concentrations 5 wt % and 10 wt %. The modeling of higher and lower monomer concentrations (or equivalent ionic strengths) would require the knowledge of either molecular weights or termination rate coefficients—both of which are very hard to determine. A reasonable agreement between model simulations and experimental results was obtained by considering together the effects of monomer concentration and salt addition on the polymerization kinetics. In particular, the model is capable of reproducing the effect of increasing reaction rate upon increasing the initial ionic strength.
A better characterization of the rate coefficients of propagation and termination of fully ionized MAA is supposed to substantially improve the elucidation of their combined impact on the polymerization rate, especially in view of the investigation of the effects of monomer and electrolyte concentration. With this respect, a promising method to access on-line the propagation and termination rate is represented by in-situ diffusion-ordered spectroscopy (DOSY) NMR [28], which might allow for measuring at the same time the residual monomer concentration and molecular weight. Furthermore, relevant information about the solution behavior of polar and ionizable molecules such as the MAA monomer and polymer as well as their interactions with the reaction environment (i.e., water and electrolytes) could be obtained by the application of computational chemistry, namely molecular dynamics simulations. Both strategies are currently under development in our research group.

Supplementary Materials

The following are available online at at www.mdpi.com/2227-9717/5/2/23/s1, Figure S1: Details about the monomer peak area selected for the calculation of the monomer conversion from the 1H NMR analysis for the polymerization of non-ionized MAA. Figure S2: Details about the monomer peak area selected for the calculation of the monomer conversion from the 1H NMR analysis for the polymerization of fully ionized MAA. Figure S3: Reproducibility of the monomer conversion versus time profiles of the radical batch polymerization of non-ionized MAA in aqueous solution at 50 °C, 0.02 wt % of V-50 initiator and 1 wt % MAA. Figure S4: Reproducibility of the monomer conversion versus time profiles of the radical batch polymerization of non-ionized MAA in aqueous solution at 50 °C, 0.02 wt % of V-50 initiator and 10 wt % MAA. Figure S5: Reproducibility of the monomer conversion versus time profiles of the radical batch polymerization of fully ionized MAA in aqueous solution at 50 °C, 0.1 wt % of V-50 initiator and 10 wt % MAA. Figure S6: Reproducibility of the monomer conversion versus time profiles of the radical batch polymerization of fully ionized MAA in aqueous solution at 50 °C, 0.1 wt % of V-50 initiator and 1 wt % MAA. Figure S7: Representation of the intrinsic and electrostatic contributions to the overall propagation reaction rate, based on the parameter set provided in Table 6. Table S1: Full list of reactions with non-ionized (0.02 wt % initiator V-50) and fully ionized MAA (0.1 wt % initiator V-50) including repeated experiments. Table S2: Comparison of intrinsic vs. electrostatic contributions to the propagation rate. Table S3: Sensitivity analysis on the parameter values. The total error (mean-square error) between the experiments at α = 1 and simulations is calculated upon a 10% increase of each model parameter with respect to its optimized value reported in Table 6. The error corresponding to the set of unchanged parameters is reported as a reference (bottom line in the table).

Acknowledgments

The financial support from the Swiss National Science Foundation with Grant Number 200021.153403/1 is gratefully acknowledged.

Author Contributions

All three coauthors E.J.F., G.S. and D.C. designed and conceived the experiments, which were performed by E.J.F., whereas the resulting data was analyzed by E.J.F. and D.C. The paper was written by E.J.F. and D.C.

Conflicts of Interest

The authors declare no conflict of interest.

References

  1. Nemec, J.W.; Bauer, J.W. Encyclopaedia of Polymer Science and Engineering; Wiley: New York, NY, USA; Volume I, 1988. [Google Scholar]
  2. Goin, J. Water Soluble Polymers. In CEH Marketing Research Report 582.0000 D-E; SRI International: Menlo Park, CA, USA, 1991. [Google Scholar]
  3. Kumar, J.; Nalwa, H.S.; MacDiarmid, A.G. Handbook of Polyelectrolytes and Their Applications; Tripathy, S.K., Ed.; ASP: Stevenson Ranch, CA, USA, 2002. [Google Scholar]
  4. Oosawa, F. Polyelectrolytes; Marcel Dekker: New York, NY, USA, 1971. [Google Scholar]
  5. Dobrynin, A.V.; Rubinstein, M. Theory of Polyelectrolytes in Solutions and at Surfaces. Prog. Polym. Sci. 2005, 30, 1049–1118. [Google Scholar] [CrossRef]
  6. Losada, R.; Wandrey, C. Non-Ideal Polymerization Kinetics of a Cationic Double Charged Acryl Monomer and Solution Behavior of the Resulting Polyelectrolytes. Macromol. Rapid Commun. 2008, 29, 252–257. [Google Scholar] [CrossRef]
  7. Hahn, M.; Jaeger, W.; Wandrey, C.; Reinisch, G. Zur Kinetik der Radikalischen Polymerisation von Dimethyl-diallyl-ammoniumchlorid. IV. Mechanismus von Start-und Abbruchreaktion mit Persulfat als Initiator. Acta Polym. 1984, 35, 350–358. [Google Scholar] [CrossRef]
  8. Buback, M. Solvent Effects on Acrylate kp in Organic Media: A Response. Macromol. Rapid Commun. 2015, 36, 1979–1983. [Google Scholar] [CrossRef] [PubMed]
  9. Kurenkov, V.F.; Nadezhdin, I.N.; Antonovich, O.A.; Lobanov, F.I. Phase Separation in Aqueous Solutions of Binary Copolymers of Acrylamide with Sodium 2-Acrylamido-2-Methylpropanesulfonate and Sodium Acrylate. Russ. J. Appl. Chem. 2004, 29, 804–808. [Google Scholar] [CrossRef]
  10. Riahinezhad, M.; Kazemi, N.; McManus, N.; Penlidis, A. Effect of Ionic Strength on the Reactivity Ratios of Acrylamide/Acrylic Acid (sodium acrylate) Copolymerization. J. Appl. Polym. Sci. 2014, 131, 40949. [Google Scholar] [CrossRef]
  11. Cuccato, D.; Storti, G.; Morbidelli, M. Experimental and Modeling Study of Acrylamide Copolymerization with Quaternary Ammonium Salt in Aqueous Solution. Macromolecules 2015, 48, 5076–5087. [Google Scholar] [CrossRef]
  12. Beuermann, S.; Buback, M.; Hesse, P.; Lacik, I. Free-Radical Propagation Rate Coefficient of Nonionized Methacrylic Acid in Aqueous Solution from low Monomer Concentrations to Bulk Polymerization. Macromolecules 2006, 39, 184–193. [Google Scholar] [CrossRef]
  13. Lacík, I.; Chovancova, A.; Uhelska, L.; Preusser, C.; Hutchinson, R.A.; Buback, M. PLP-SEC Studies into the Propagation Rate Coefficient of Acrylamide Radical Polymerization in Aqueous Solution. Macromolecules 2016, 49, 3244–3253. [Google Scholar] [CrossRef]
  14. Drawe, P.; Buback, M.; Lacik, I. Radical Polymerization of Alkali Acrylates in Aqueous Solution. Macromol. Chem. Phys. 2015, 216, 1333–1340. [Google Scholar] [CrossRef]
  15. Rintoul, I.; Wandrey, C. Polymerization of Ionic Monomers in Polar Solvents: Kinetics and Mechanism of the Free Radical Copolymerization of Acrylamide/Acrylic Acid. Polymer 2005, 46, 4525–4532. [Google Scholar] [CrossRef]
  16. Preusser, C.; Ezenwajiaku, I.H.; Hutchinson, R.A. The Combined Influence of Monomer Concentration and Ionization on Acrylamide/Acrylic Acid Composition in Aqueous Solution Radical Batch Copolymerization. Macromolecules 2016, 49, 4746–4756. [Google Scholar] [CrossRef]
  17. Junkers, T.; Barner-Kowollik, C. The Role of Mid-Chain Radicals in Acrylate Free Radical Polymerization: Branching and Scission. J. Polym. Sci. A 2008, 46, 7585–7605. [Google Scholar] [CrossRef]
  18. Preusser, C.; Chovancova, A.; Lacik, I.; Hutchinson, R.A. Modeling the Radical Batch Homopolymerization of Acrylamide in Aqueous Solution. Macromol. React. Eng. 2016, 10, 490–501. [Google Scholar] [CrossRef]
  19. Wittenberg, N.F.G.; Preusser, C.; Kattner, H.; Stach, M.; Lacik, I.; Hutchinson, R.A.; Buback, M. Modeling Acrylic Acid Radical Polymerization in Aqueous Solution. Macromol. React. Eng. 2016, 10, 95–107. [Google Scholar] [CrossRef]
  20. Lacik, I.; Ucnova, L.; Kukuckova, S.; Buback, M.; Hesse, P.; Beuermann, S. Propagation Rate Coefficient of Free-Radical Polymerization of Partially and Fully Ionized Methacrylic Acid in Aqueous Solution. Macromolecules 2009, 42, 7753–7761. [Google Scholar] [CrossRef]
  21. Beuermann, S.; Buback, M.; Hesse, P.; Hutchinson, R.A.; Kukucova, S.; Lacik, I. Termination Kinetics of the Free-Radical Polymerization of Nonionized Methacrylic Acid in Aqueous Solution. Macromolecules 2008, 41, 3513–3520. [Google Scholar] [CrossRef]
  22. Barth, J.; Buback, M. SP-PLP-EPR Study into the Termination Kinetics of Methacrylic Acid Radical Polymerization in Aqueous Solution. Macromolecules 2011, 44, 1292–1297. [Google Scholar] [CrossRef]
  23. Buback, M.; Hesse, P.; Hutchinson, R.A.; Kasak, P.; Lacik, I.; Stach, M.; Utz, I. Kinetics and Modeling of Free-Radical Batch Polymerization of Nonionized Methacrylic Acid in Aqueous Solution. Ind. Eng. Chem. Res. 2008, 47, 8197–8204. [Google Scholar] [CrossRef]
  24. Wittenberg, N.F.G.; Buback, M.; Stach, M.; Lacik, I. Chain Transfer to 2-Mercaptoethanol in Methacrylic Acid Polymerization in Aqueous Solution. Macromol. Chem. Phys. 2012, 213, 2653–2658. [Google Scholar] [CrossRef]
  25. Wittenberg, N.F.G.; Buback, M.; Hutchinson, R.A. Kinetics and Modeling of Methacrylic Acid Radical Polymerization in Aqueous Solution. Macromol. React. Eng. 2013, 7, 267–276. [Google Scholar] [CrossRef]
  26. Lacik, I.; Beuermann, S.; Buback, M. PLP-SEC Study into Free-Radical Propagation Rate of Nonionized Acrylic Acid in Aqueous Solution. Macromolecules 2003, 36, 9355–9363. [Google Scholar] [CrossRef]
  27. Kattner, H.; Drawe, P.; Buback, M. Chain-Length-Dependent Termination of Sodium Methacrylate Polymerization in Aqueous Solution Studied by SP-PLP-EPR. Macromolecules 2017, 50, 1386–1393. [Google Scholar] [CrossRef]
  28. Rosenboom, J.-G.; Roo, J.D.; Storti, G.; Morbidelli, M. Diffusion (DOSY) 1H NMR as an Alternative Method for Molecular Weight Determination of Poly(ethylene furanoate) (PEF) Polyesters. Macromol. Chem. Phys. 2017, 218, 1600436. [Google Scholar] [CrossRef]
Figure 1. Monomer conversion versus time profiles of the radical batch polymerization of non-ionized methacrylic acid (MAA) in aqueous solution at 50 °C, 0.02 wt % of 2,2′-azobis(2-methylpropionamidine) dihydrochloride (V-50) initiator, and initial monomer concentration equal to 1 wt % (red), 5 wt % (green), and 10 wt % (blue): comparison between experimental data by in-situ nuclear magnetic resonance (NMR) (diamonds) and simulated curves (lines).
Processes 05 00023 g001
Figure 2. Termination rate coefficient as a function of the monomer conversion calculated from the propagation rate coefficient reported in Table 3 and the experimental data of conversion versus time of non-ionized MAA polymerization (diamonds) at an initial monomer concentration equal to 1 wt % (red), 5 wt % (green), and 10 wt % (blue): comparison with the simulated k t using the model equations (lines).
Processes 05 00023 g002
Figure 3. Propagation rate coefficient as a function of the monomer conversion calculated from the termination rate coefficient reported in Table 3 and the experimental data of conversion versus time of non-ionized MAA polymerization (diamonds) at an initial monomer concentration equal to 1 wt % (red), 5 wt % (green), and 10 wt % (blue): comparison with the simulated k p using the model equations (lines).
Processes 05 00023 g003
Figure 4. Monomer conversion versus time profiles of the radical batch polymerization of fully ionized MAA in aqueous solution at 50 °C, 0.1 wt % of V-50 initiator, and initial monomer concentration equal to 1 wt % (red), 2.5 wt % (yellow), 5 wt % (green), and 10 wt % (blue).
Processes 05 00023 g004
Figure 5. Monomer conversion versus time profiles of the radical batch polymerization of fully ionized MAA in aqueous solution at 50 °C, 0.1 wt % of V-50 initiator and constant ionic strength equivalent to 10 wt % MAA by addition of NaCl. Variation of monomer concentration: 1 wt % (red), 5 wt % (green), and 10 wt % (blue, no NaCl addition).
Processes 05 00023 g005
Figure 6. Monomer conversion versus time profiles of the radical batch polymerization of fully ionized MAA in aqueous solution at 50 °C, 0.1 wt % of V-50 initiator, initial monomer concentration equal to 5 wt %, without addition of salt (red), salt addition to obtain an ionic strength equivalent to a monomer concentration of 10 wt % (yellow), 15 wt % (green), 20 wt % (blue), and 30 wt % (purple).
Processes 05 00023 g006
Figure 7. Propagation rate coefficient as a function of the monomer conversion calculated from the termination rate coefficient in Table 5 and the experimental data of conversion versus time of fully ionized MAA polymerization at constant ionic strength equivalent to 5 wt % MAA by addition of NaCl. Variation of monomer concentration 1 wt % (red) and 5 wt % (green, no NaCl addition): comparison with the simulated k p using the model equations (lines).
Processes 05 00023 g007
Figure 8. Propagation rate coefficient as a function of the monomer conversion calculated from the termination rate coefficient in Table 5 and the experimental data of conversion versus time of fully ionized MAA polymerization at constant ionic strength equivalent to 10 wt % MAA by addition of NaCl. Variation of monomer concentration 1 wt % (red), 5 wt % (green), and 10 wt % (blue, no NaCl addition): comparison with the simulated k p using the model equations (lines).
Processes 05 00023 g008
Figure 9. Monomer conversion versus time profiles of the radical batch polymerization of fully ionized MAA in aqueous solution at 50 °C, 0.1 wt % of V-50 initiator, and initial monomer concentration equal to 5 wt % (green) and 10 wt % (blue): comparison between experimental data by in-situ NMR (diamonds) and simulated curves (lines, using the parameter values of Table 6).
Processes 05 00023 g009
Figure 10. Monomer conversion versus time profiles of the radical batch polymerization of fully ionized MAA in aqueous solution at 50 °C, 0.1 wt % of V-50 initiator and constant ionic strength equivalent to 5 wt % MAA by the addition of NaCl. Variation of monomer concentration 1 wt % (red) and 5 wt % (green, no NaCl addition): comparison between experimental data by in-situ NMR (diamonds) and simulated curves (lines, using parameter values of Table 6).
Processes 05 00023 g010
Figure 11. Monomer conversion versus time profiles of the radical batch polymerization of fully ionized MAA in aqueous solution at 50 °C, 0.1 wt % of V-50 initiator and constant ionic strength equivalent to 10 wt % MAA by addition of NaCl. Variation of monomer concentration 1 wt % (red), 5 wt % (green), and 10 wt % (blue, no NaCl addition): comparison between experimental data by in-situ NMR (diamonds) and simulated curves (lines, using the parameter values of Table 6).
Processes 05 00023 g011
Table 1. Reaction scheme used in the modeling of non-ionized methacrylic acid (MAA) polymerization.
ReactionScheme
Initiator decomposition I 2 k d 2 I ·
Propagation of initiator fragment I · + M k p R 1 ·
Propagation of active chain R n · + M k p R n + 1 ·
Chain transfer to monomer R n · + M k c t m P n + R 1 ·
Termination by combination R n · + R m · k t c P n + m
Termination by disproportionation R n · + R m · k t d P n + P m
Table 2. Population balance equations on the involved species I 2 , M and the zero and first order moments of the active chain distribution, λ 0 and λ 1 .
Reaction
   d I 2 d t = k d I 2
   d M d t = 2 f k d I 2 k p M m = 1 R m · k c t m M m = 1 R m ·
   d λ 0 d t = 2 f k d I 2 2 ( k t d + k t c ) λ 0 2
   d λ 1 d t = 2 f k d I 2 + k p M λ 0 k c t m M ( λ 1 λ 0 ) 2 ( k t d + k t c ) λ 1 λ 0
Table 3. Reaction rate coefficients used in the modeling of non-ionized MAA polymerization.
Reaction
Initiation [23,25]
   k d / s 1 = 2.24 · 10 15 e x p ( 1.52 10 4 T )
   f = 0.8
Propagation [21]
   k p / ( L   m o l 1 s 1 ) = 4.1 10 6 e x p ( 1.88 10 3 T ) { 0.08 + 0.92 e x p [ 5.3 w M , 0 ( 1 χ ) 1 χ w M , 0 ] } e x p { P T [ 0.096 + 0.11 w M , 0 ( 1 χ ) 1 χ w M , 0 ] }
Termination [22,23,25]
   k t 1 , 1 / ( L   m o l 1 s 1 ) = 2.29 · 10 12 e x p ( 2.64 · 10 3 T )
   k t C L D / ( L   m o l 1 s 1 ) = { k t 1 , 1 ( M n R ) 0.61 @   M n R M n , c R k t 1 , 1 ( M n , c R ) 0.444 ( M n R ) 0.166 @   M n R > M n , c R
   k t / ( L   m o l 1 s 1 ) = k t C L D [ 0.96 + 0.04 e x p ( χ C η ) ] 1 + C R D w M , 0 ( 1 χ ) k p
   k t c / ( L   m o l 1 s 1 ) = 0.2 k t
   k t d / ( L   m o l 1 s 1 ) = 0.8 k t
Chain transfer to monomer [23]
   k c t m / ( L   m o l 1 s 1 ) = 5.37 · 10 5 k p
Table 4. List of all polymerization reactions of fully ionized MAA (alpha = 1) in aqueous solution at 50 °C and 0.1 wt % of 2,2′-azobis(2-methylpropionamidine) dihydrochloride (V-50) initiator.
Reaction No.Initial Monomer Concentration w M , 0 (wt %)Ionic Strength Corresponding to (wt %)Ionic Strength (kg mol−1)
1110.12
22.52.50.29
3550.58
410101.16
5150.58
61101.16
75101.16
85151.74
95202.32
105303.48
Table 5. Termination rate coefficients for the fully ionized MAA [27]. For 10 wt %, M n , C R is equal to 80 M W M A A .
Ionic Strength Equivalent to w M , 0 /wt % k t 1 , 1 / ( L   mol 1 s 1 ) k t / ( L   mol 1 s 1 )
5 1.97 · 10 8 exp ( 999 T ) k t 1 , 1 M n R 0.59
10 7.24 · 10 8 exp ( 1049 T ) { k t 1 , 1 M n R 0.59 @   M n R M n , C R k t 1 , 1 M n , C R 0.41 M n R 0.18 @   M n R > M n , C R
Table 6. Estimated parameter values of the parameter optimization carried out by fitting the model equations to the experimental data of conversion versus time (cf. Figure 9, Figure 10 and Figure 11) for the fully ionized MAA case.
ParameterValue
k p , i 0 / ( L   mol 1   s 1 ) 758
k D , 0 / ( L   mol 1   s 1   ( kg   mol 1 ) β ) 201
β 2.18
B 1.92

