
Characterization of Whey Protein Oil-In-Water Emulsions with Different Oil Concentrations Stabilized by Ultra-High Pressure Homogenization


Abstract
:
1. Introduction
2. Materials and Methods
2.1. Materials
2.2. Preparation of Emulsions
2.2.1. Experimental Design
2.2.2. Preparation of Protein Dispersions
2.2.3. Homogenization Treatments
2.3. Emulsion Measurements and Analyses
2.3.1. Droplet Size Distribution
2.3.2. Surface Protein Concentration
2.3.3. Rheological Measurements
2.3.4. Physical Stability
2.3.5. Emulsion Microstructure
2.3.6. Stability of Emulsions to Photo-Oxidation
2.4. Statistical Analyses
3. Results and Discussion
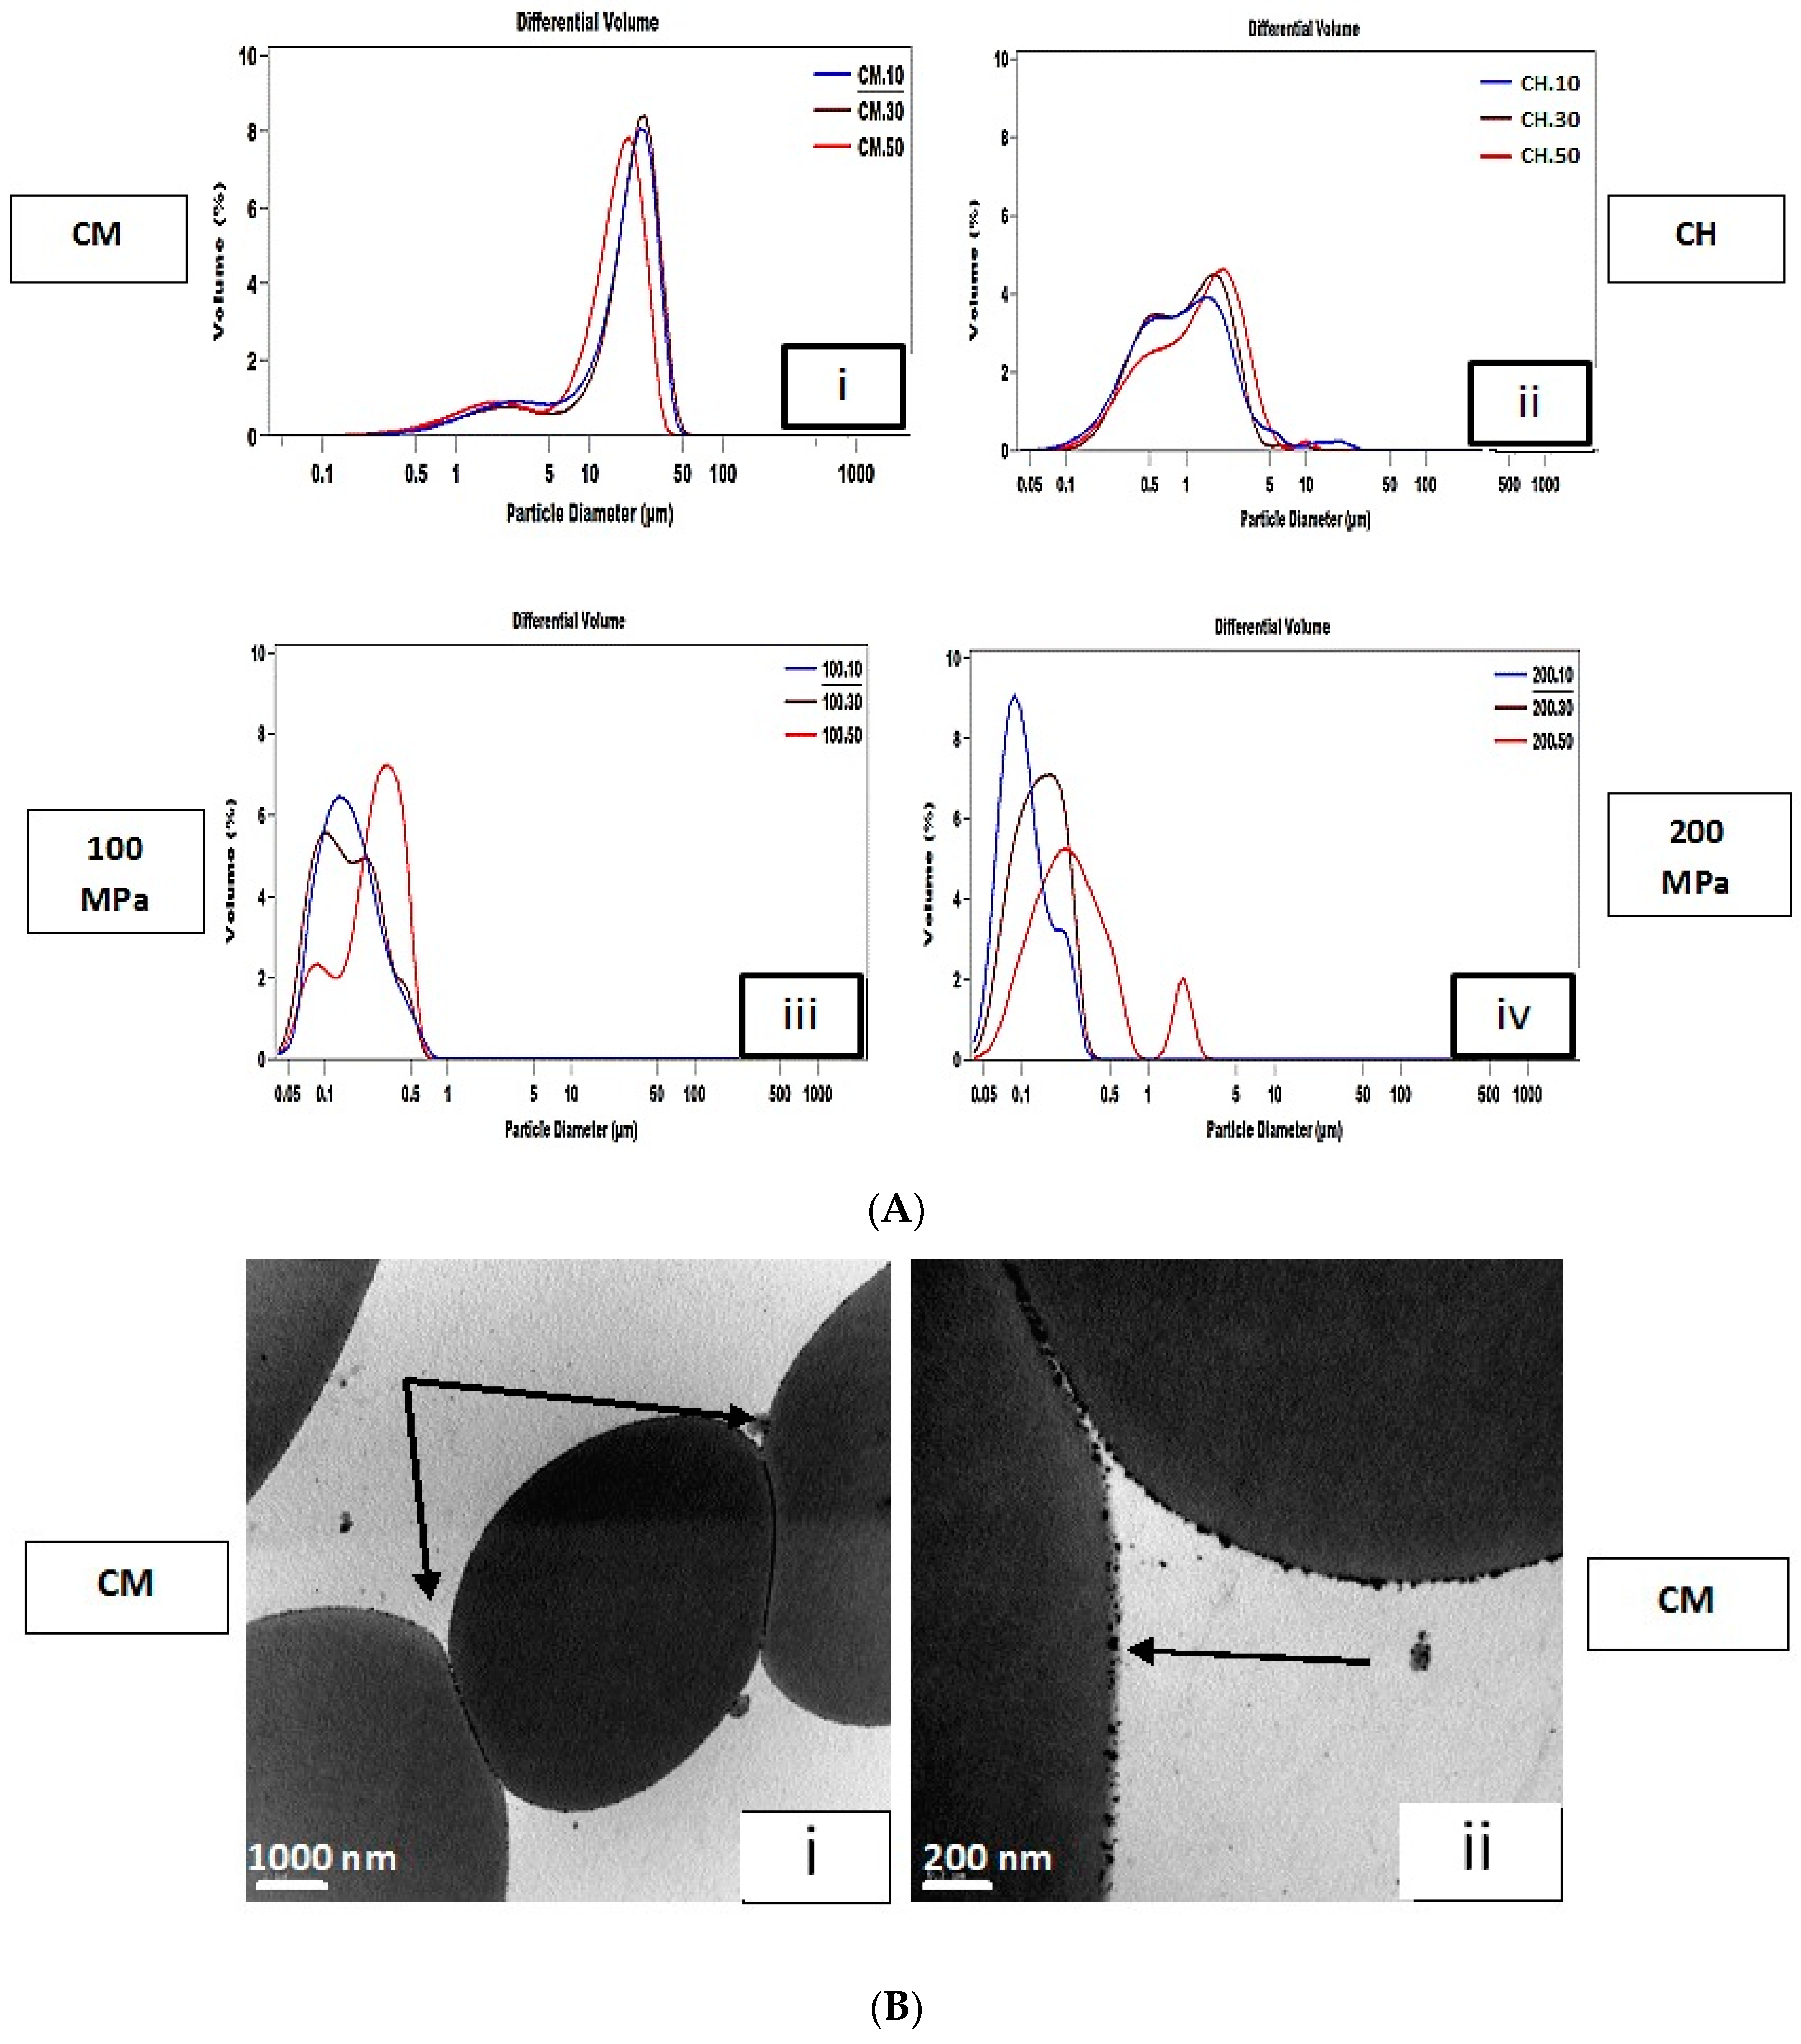
3.1. Droplet Size Distribution
3.2. Surface Protein Concentration
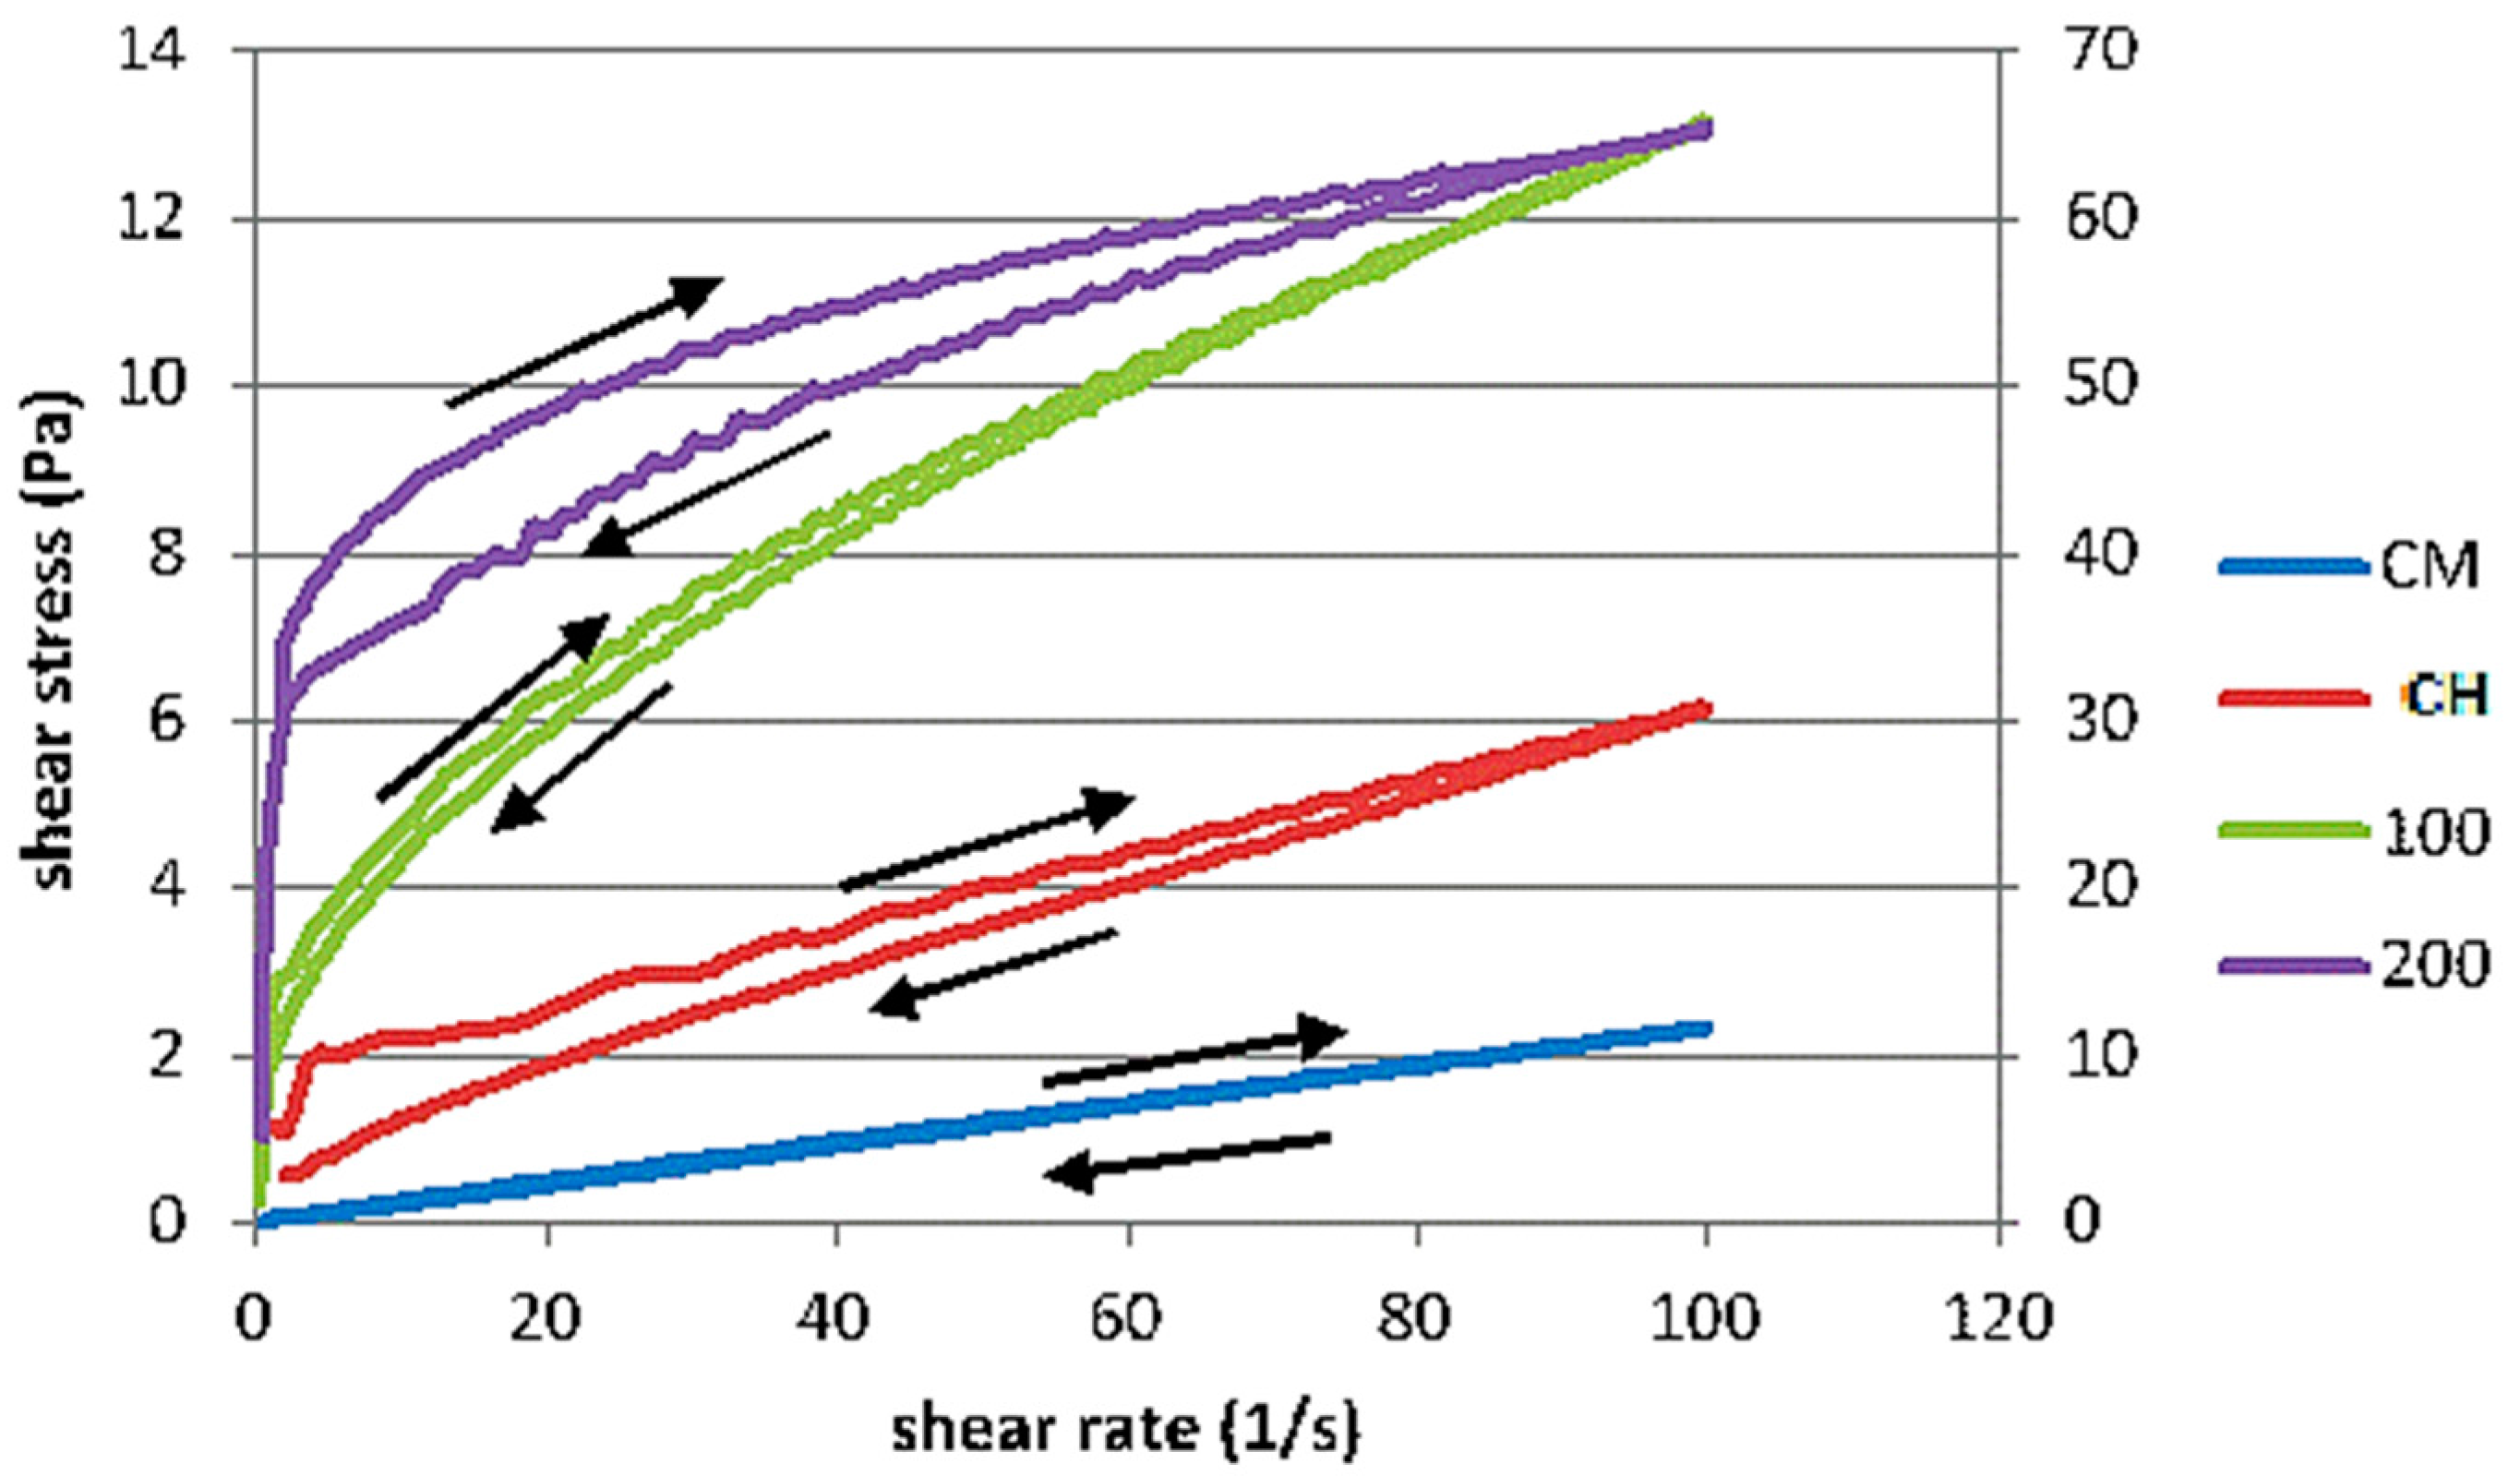
3.3. Rheological Behaviour
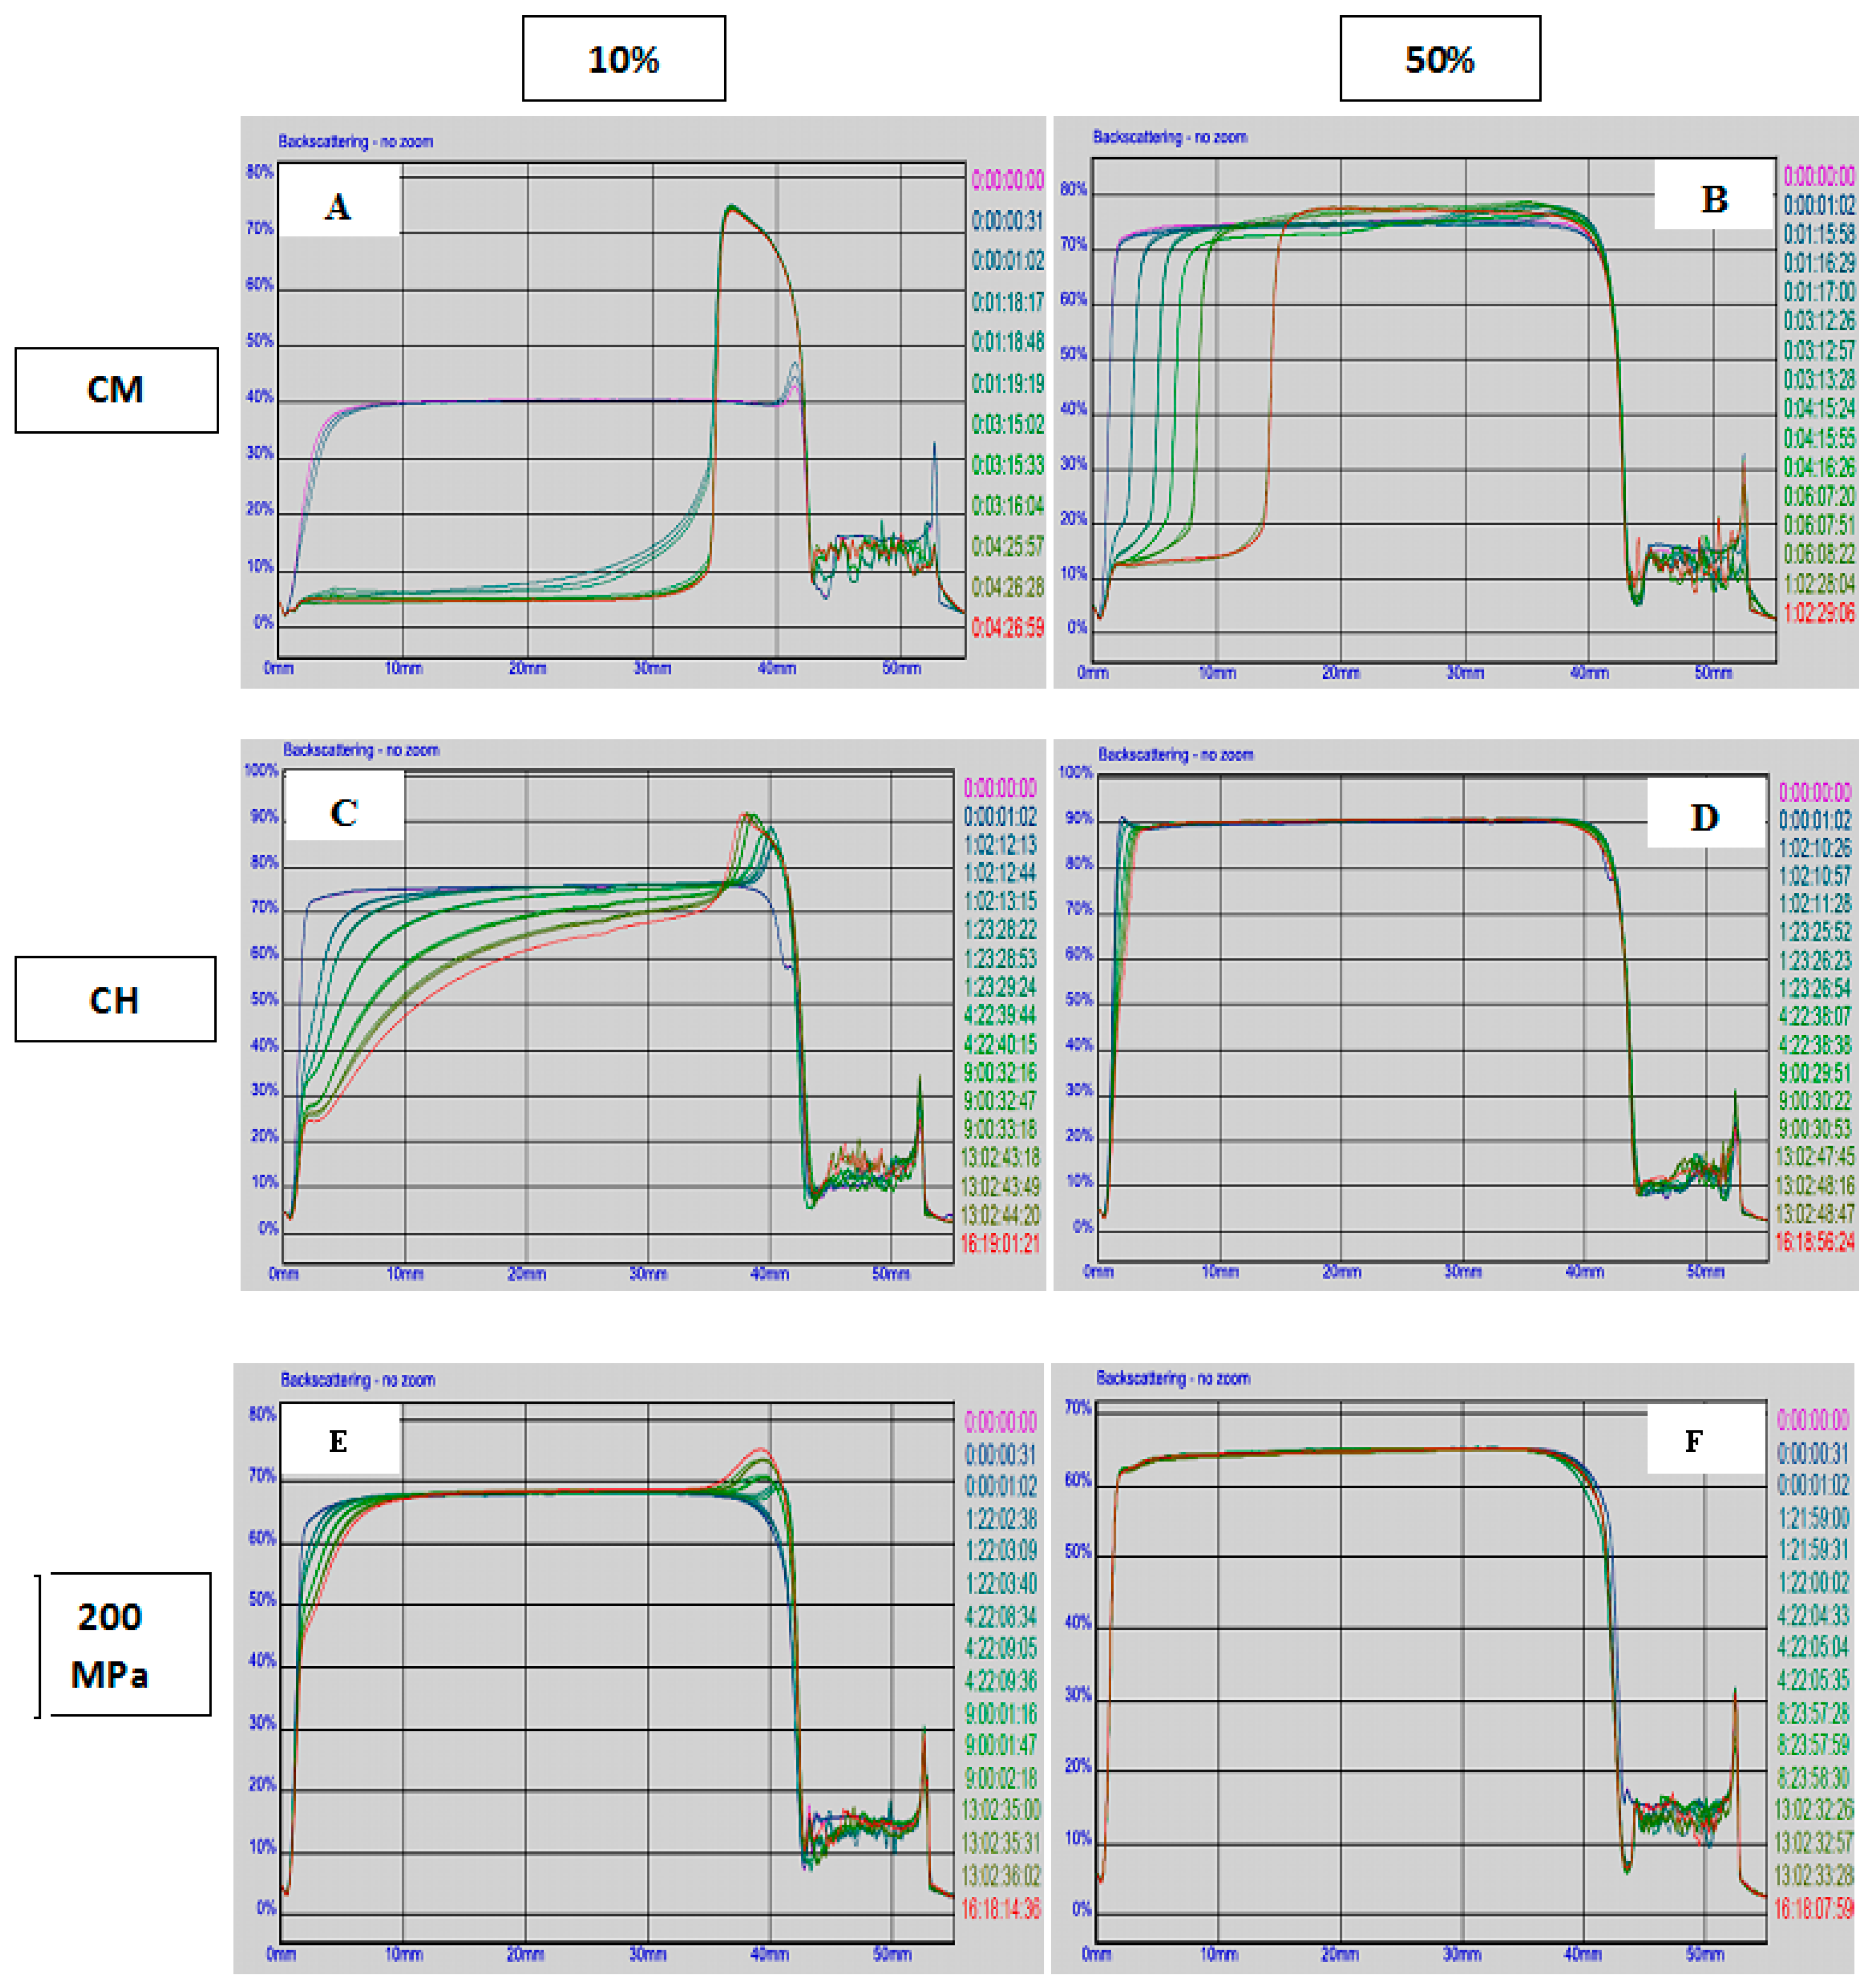
3.4. Stability of Emulsions to Creaming
3.5. Oxidative Stability
4. Conclusions
Acknowledgments
Author Contributions
Conflicts of Interest
References
- Tonon, R.V.; Grosso, C.R.F.; Hubinger, M.D. Influence of emulsion composition and inlet air temperature on the microencapsulation of flaxseed oil by spray drying. Food Res. Int. 2011, 44, 282–289. [Google Scholar] [CrossRef]
- Gunstone, F.D.; Martini, S. Chemical and physical deterioration of bulk oils and shortenings, spreads and frying oils. In Chemical Deterioration and Physical Instability of Food and Beverages; Skibsted, L.H., Risbo, J., Andersen, M.L., Eds.; Woodhead Publishing Limited: Woodhead Publishing Limited, UK, 2010; pp. 413–438. [Google Scholar]
- Cornacchia, L.; Roos, Y.H. State of dispersed lipid carrier and interface composition as determinants of beta-carotene stability in oil-in-water emulsions. J. Food Sci. 2011, 76, 1211–1218. [Google Scholar] [CrossRef] [PubMed]
- Troncoso, E.; Aguilera, J.M.; McClements, D.J. Fabrication, characterization and lipase digestibility of food-grade nanoemulsions. Food Hydrocoll. 2012, 27, 355–363. [Google Scholar] [CrossRef]
- Becher, P. Emulsions: Theory and Practice; Oxford University Press, Inc.: New York, NY, USA, 2001. [Google Scholar]
- Mason, T.G.; Wilking, J.N.; Meleson, K.; Chang, C.B.; Graves, S.M. Nanoemulsions: Formation, structure, and physical properties. J. Phys. Condens. Matter 2006, 18, 635–666. [Google Scholar] [CrossRef]
- Jafari, S.M.; Assadpoor, E.; Bhandari, B.; He, Y. Recoalescence of emulsion droplets during high-energy emulsification. Food Hydrocoll. 2008, 22, 1191–1202. [Google Scholar] [CrossRef]
- Gutierrez, J.M.; Gonzalez, C.; Maestro, A.; Solè, I.; Pey, C.M.; Nolla, J. Nanoemulsions: New applications and optimization of their preparation. Curr. Opin. Colloid 2008, 13, 245–251. [Google Scholar] [CrossRef]
- Picart, L.; Thiebaud, M.; René, M.; Guiraud, J.P.; Cheftel, J.C.; Dumay, E. Effects of high pressure homogenisation of raw bovine milk on alkaline phosphatase and microbial inactivation. A comparison with continuous short time thermal treatments. J. Dairy Res. 2006, 73, 454–463. [Google Scholar] [CrossRef] [PubMed]
- Thiebaud, M.; Dumay, E.; Picart, L.; Guiraud, J.P.; Cheftel, J.C. High-pressure homogenisation of raw bovine milk. Effects on fat globule size distribution and microbial inactivation. Int. Dairy J. 2003, 13, 427–439. [Google Scholar] [CrossRef]
- Martínez-Monteagudo, S.I.; Kamat, S.; Patel, N.; Konuklar, G.; Rangavajla, N.; Balasubramaniam, V.M. Improvements in emulsion stability of dairy beverages treated by high pressure homogenization: A pilot-scale feasibility study. J. Food Eng. 2017, 193, 42–52. [Google Scholar]
- Fernández-Ávila, C.; Escriu, R.; Trujillo, A.J. Ultra-high pressure homogenization enhances physicochemical properties of soy protein isolate-stabilized emulsions. Food Res. Int. 2015, 75, 357–366. [Google Scholar] [CrossRef]
- Kuhn, K.R.; Cunha, R.L. Flaxseed oil—Whey protein isolate emulsions: Effect of high pressure homogenization. J. Food Eng. 2012, 111, 449–457. [Google Scholar] [CrossRef]
- McClements, D.J. Protein-stabilized emulsions. Curr. Opin. Colloid Interface Sci. 2004, 9, 305–313. [Google Scholar] [CrossRef]
- Livney, Y.D. Milk proteins as vehicles for bioactives. Curr. Opin. Colloid Interface Sci. 2010, 15, 73–83. [Google Scholar] [CrossRef]
- Paraskevopoulou, D.; Boskou, D.; Paraskevopoulou, A. Oxidative stability of olive oil-lemon juice salad dressings stabilized with polysaccharides. Food Chem. 2007, 101, 1197–1204. [Google Scholar] [CrossRef]
- McClements, D.J.; Decker, E.A. Lipid oxidation in oil-in-water emulsions: Impact of molecular environment on chemical reactions in heterogeneous food systems. J. Food Sci. 2000, 65, 1270–1282. [Google Scholar] [CrossRef]
- Soleimanpour, M.; Koocheki, A.; Kadkhodaee, R. Influence of main emulsion components on the physical properties of corn oil in water emulsion: Effect of oil volume fraction, whey protein concentrate and Lepidium perfoliatum seed gum. Food Res. Int. 2013, 50, 457–466. [Google Scholar] [CrossRef]
- Cortés-Muñoz, M.; Chevalier-Lucia, D.; Dumay, E. Characteristics of submicron emulsions prepared by ultra-high-pressure homogenization: Effect of chilled or frozen storage. Food Hydrocoll. 2009, 23, 640–654. [Google Scholar]
- Floury, J.; Desrumaux, A.; Lardieres, J. Effect of high-pressure homogenization on droplet size distributions and rheological properties of model oil-in-water emulsion. Innov. Food Sci. Emerg. Technol. 2000, 1, 127–134. [Google Scholar] [CrossRef]
- McClements, D.J.; Li, Y. Structured emulsion-based delivery systems: Controlling the digestion and release of lipophilic food components. Adv. Colloid Interface Sci. 2010, 159, 213–228. [Google Scholar] [CrossRef] [PubMed]
- Berton-Carabin, C.C.; Ropers, M.-H.; Genot, C. Lipid oxidation in oil-in-water emulsions: Involvement of the interfacial layer. Compr. Rev. Food Sci. Food Saf. 2014, 13, 945–977. [Google Scholar] [CrossRef]
- Hebishy, E.; Buffa, M.; Guamis, B.; Blasco-Moreno, A.; Trujillo, A.-J. Physical and oxidative stability of whey protein oil-in-water emulsions produced by conventional and ultra high-pressure homogenization: Effects of pressure and protein concentration on emulsion characteristics. Innov. Food Sci. Emerg. Technol. 2015, 32, 79–90. [Google Scholar] [CrossRef]
- Fernandez-Avila, C.; Trujillo, A.J. Ultra-High Pressure Homogenization improves oxidative stability and interfacial properties of soy protein isolate-stabilized emulsions. Food Chem. 2016, 209, 104–113. [Google Scholar] [CrossRef] [PubMed]
- Hemar, Y.; Tamehana, M.; Munro, P.A.; Singh, H. Influence of xanthan gum on the formation and stability of sodium caseinate oil-in-water emulsions. Food Hydrocoll. 2001, 15, 513–519. [Google Scholar] [CrossRef]
- Desrumaux, A.; Marcand, J. Formation of sunflower oil emulsions stabilized by whey proteins with high-pressure homogenization (up to 350 MPa): Effect of pressure on emulsion characteristics. Int. J. Food Sci. Technol. 2002, 37, 263–269. [Google Scholar] [CrossRef]
- Cruz, N.; Capellas, M.M.; Hernández, M.; Trujillo, A.J.; Guamis, B.; Ferragut, V. Ultra high pressure homogenization of soymilk: microbial, physicochemical and microstructural characteristics. Food Res. Int. 2007, 40, 725–732. [Google Scholar] [CrossRef]
- Shantha, N.C.; Decker, E.A. Rapid sensitive iron based spectrophotometric methods for the determination of peroxide values in food lipids. J. Assoc. Off. Anal. Chem. Int. 1994, 77, 421–424. [Google Scholar]
- McDonald, R.E.; Hultin, H.O. Some characteristics of the enzyme lipid peroxidation systems in the microsomal fraction of flounder muscle. J. Food Sci. 1987, 52, 15–21, 27. [Google Scholar] [CrossRef]
- Pereda, J.; Ferragut, V.; Quevedo, J.M.; Guamis, B.; Trujillo, A.J. Effects of ultra-high pressure homogenization on microbial and physicochemical shelf life of milk. J. Dairy Sci. 2007, 90, 1081–1093. [Google Scholar] [CrossRef]
- Jafari, S.M.; He, Y.; Bhandari, B. Optimization of nano-emulsions production by microfluidization. Eur. Food Res. Technol. 2009, 225, 733–741. [Google Scholar] [CrossRef]
- Seekkuarachchi, I.N.; Tanaka, K.; Kumazawa, H. Formation and charaterization of submicrometer oil-in-water (O/W) emulsions, using high-energy emulsification. Ind. Eng. Chem. Res. 2006, 45, 372–390. [Google Scholar] [CrossRef]
- Desrumaux, A.; Loisel, C.; Marcand, J. Performances of a new high pressure homogenizer to make fine food emulsions. In Proceedings of the 8th International Congress on Engineering and Food (ICEF), Puebla, Mexico, 9–13 April 2000.
- Sun, C.; Gunasekaran, S. Effects of protein concentration and oil-phase volume fraction on the stability and rheology of menhaden oil-in-water emulsions stabilized by whey protein isolate with xanthan gum. Food Hydrocoll. 2009, 23, 165–174. [Google Scholar] [CrossRef]
- McClements, D.J. Food Emulsions: Principles, Practices, and Techniques, 2nd ed.; CRC Press: Boca Raton, FL, USA, 2000. [Google Scholar]
- Dalgleish, D.G. Emulsion and Emulsion Stability; Sjöblom, J., Ed.; Marcel Dekker: New York, NY, USA, 1996. [Google Scholar]
- Dickinson, E. An Introduction to Food Colloids; Oxford University Press: Oxford, UK, 1992. [Google Scholar]
- Denda, A.; Hayashi, R. Emulsifying properties of pressure-treated proteins. In High Presure and Biotechnology; Balny, C., Hayashi, R., Heremans, K., Masson, P., Eds.; John Libbey Eurotext Ltd.: Montrouge, France; Volume 224, pp. 333–335.
- Bellaltaa, P.; Troncosob, E.; Zúñigac, R.N.; Aguilerab, J.M. Rheological and microstructural characterization of WPI-stabilized o/w emulsions exhibiting time-dependent flow behavior. LWT—Food Sci. Technol. 2012, 46, 375–381. [Google Scholar] [CrossRef]
- Kundu, P.; Kumar, V.; Mishra, I.M. Modelling the steady-shear rheological behavior of dilute to highly concentrated oil-in-water (o/w) emulsions: Effect of temperature, oil volume fraction and anionic surfactant concentration. J. Pet. Sci. Eng. 2015, 129, 189–204. [Google Scholar] [CrossRef]
- Petrovic, L.B.; Sovilj, V.J.; Katona, J.M.; Milanovic, J.L. Influence of polymer surfactant interactions on o/w emulsion properties and microcapsule formation. J. Colloid Interface Sci. 2010, 342, 333–339. [Google Scholar] [CrossRef] [PubMed]
- Perrechil, F.A.; Cunha, R.L. Oil-in-water emulsions stabilized by sodium caseinate: influence of pH, high-pressure homogenization and locust bean gum addition. J. Food Eng. 2010, 97, 441–448. [Google Scholar] [CrossRef]
- Friberg, S.E.; Larsson, K.; Sjobolom, J. Food Emulsions, 4th ed.; Marcel Dekker: New York, NY, USA, 2004. [Google Scholar]
- Sims, R.J.; Fioriti, J.A.; Trumbetas, J. Effect of sugars and sugar alcohols on autoxidation of safflower oil in emulsions. J. Am Oil Chem. Soci. 1979, 56, 742–745. [Google Scholar] [CrossRef]
- Tippetts, M.; Martini, S. Effect of cooling rate on the thermal behaviour and physicochemical stability of oil-in-water emulsions. Food Res. Int. 2009, 42, 847–855. [Google Scholar] [CrossRef]
- Rousseau, D. Fat crystals and emulsion stability—A review. Food Res. Int. 2000, 33, 3–14. [Google Scholar] [CrossRef]
- Hartel, R.W. Chapter 5: Nucleation. In Crystallisation in Foods; Aspen Publishers, Inc.: Gaithersburg, MD, USA, 2001; pp. 145–191. [Google Scholar]
- Atarés, L.; Marshall, L.J.; Akhtar, M.; Murray, B.S. Structure and oxidative stability of oil in water emulsions as affected by rutin and homogenization procedure. Food Chem. 2012, 134, 1418–1424. [Google Scholar] [CrossRef] [PubMed]
- Osborn, H.T.; Akoh, C.C. Effect of emulsifier type, droplet size, and oil concentration on lipid oxidation in structured lipid-based oil-in-water emulsions. Food Chem. 2004, 84, 451–456. [Google Scholar] [CrossRef]
- Gharibzahedi, S.M.T.; Mousavi, S.M.; Hamedi, M.; Khodaiyan, F.; Razavi, S.H. Development of an optimal formulation for oxidative stability of walnut beverage emulsions based on gum arabic and xanthan gum using response surface methodology. Carbohyd. Poly. 2012, 87, 1611–1619. [Google Scholar] [CrossRef]


| Treatments | (Homogenization Method) | Homogenization Level | (Oil Content %) | Inlet Temperature (°C) |
|---|---|---|---|---|
| 1 | CM | 5000 rpm | 10 | 20 |
| 2 | CM | 5000 rpm | 30 | 20 |
| 3 | CM | 5000 rpm | 50 | 20 |
| 4 | CH | 15 MPa | 10 | 60 |
| 5 | CH | 15 MPa | 30 | 60 |
| 6 | CH | 15 MPa | 50 | 60 |
| 7 | UHPH | 100 MPa | 10 | 25 |
| 8 | UHPH | 100 MPa | 30 | 25 |
| 9 | UHPH | 100 MPa | 50 | 25 |
| 10 | UHPH | 200 MPa | 10 | 25 |
| 11 | UHPH | 200 MPa | 30 | 25 |
| 12 | UHPH | 200 MPa | 50 | 25 |
| Pressure (MPa) | Oil Content (%) | Droplet Size | Rheological Behaviour | Surface Coverage | Creaming Stability | |||
|---|---|---|---|---|---|---|---|---|
| d3.2 (µm) | Specific Surface Area SSA (m2/mL) | Consistency Coefficient (K) mPa × s | Flow Behaviour Index (n) | Surface Protein Concentration (SPC) mg/m2 | Emulsion Stability after 9 Days (d4.3) | |||
| Top | Bottom | |||||||
| CM | 10 | 6.656 ± 0.654 A | 0.862 ± 0.061 B | 0.0016 ± 0.0001 h | 0.968 ± 0.020 | 27.04 ± 7.17 A | ND | |
| 30 | 6.132 ± 0.166 A | 0.979 ± 0.027 A,B | 0.0025 ± 0.0008 g,h | 1.105 ± 0.087 | 12.87 ± 0.17 B | ND | ||
| 50 | 5.151 ± 0.215 B | 1.193 ± 0.015 A | 0.0185 ± 0.0051 f | 1.045 ± 0.038 | 6.85 ± 0.95 C | ND | ||
| CH | 10 | 0.559 ± 0.055 b | 10.89 ± 1.139 e | 0.0017 ± 0.0001 h | 0.984 ± 0.012 | 2.37 ± 0.41 c | 0.907 ± 0.037 b | 0.487 ± 0.061 c,* |
| 30 | 0.746 ± 0.107 a | 8.853 ± 0.521 e | 0.0051 ± 0.0018 g | 0.973 ± 0.021 | 4.69 ± 0.44 a | 1.204 ± 0.053 a,b | 0.775 ± 0.046 b,* | |
| 50 | 0.699 ± 0.036 a | 8.537 ± 0.450 e | 0.5299 ± 0.0696 d | 0.596 ± 0.152 | 3.65 ± 0.13 b | 1.411 ± 0.194 a | 1.436 ± 0.191 a | |
| UHPH 100 MPa | 10 | 0.134 ± 0.006 e | 45.00 ± 2.072 b | 0.0017 ± 0.0001 h | 0.984 ± 0.013 | 0.92 ± 0.04 d | 0.175 ± 0.018 d | 0.145 ± 0.015 f,g,* |
| 30 | 0.141 ± 0.007 d,e | 43.52 ± 1.836 b,c | 0.4037 ± 0.0008 d,e | 0.973 ± 0.020 | 0.85 ± 0.01 d | 0.186 ± 0.016 d | 0.183 ± 0.014 e,f | |
| 50 | 0.188 ± 0.022 c,d | 34.24 ± 2.259 c,d | 2.8961 ± 0.7420 b | 0.437 ± 0.086 | 1.16 ± 0.02 d | 0.267 ± 0.021 c,d | 0.240 ± 0.039 d,e | |
| UHPH 200 MPa | 10 | 0.103 ± 0.006 e | 60.81 ± 1.903 a | 0.0020 ± 0.0003 h | 0.983 ± 0.016 | 0.88 ± 0.07 d | 0.117 ± 0.009 d | 0.121 ± 0.004 g |
| 30 | 0.123 ± 0.010 e | 51.38 ± 2.380 a,b | 1.1960 ± 0.0168 c | 0.882 ± 0.087 | 1.06 ± 0.14 d | 0.191 ± 0.069 d | 0.188 ± 0.068 e,f | |
| 50 | 0.214 ± 0.033 c | 31.55 ± 0.339 d | 8.3300 ± 1.108 a | 0.284 ± 0.076 | 1.18 ± 0.13 d | 0.422 ± 0.118 c | 0.531 ± 0.237 c | |
| Pressure (MPa) | Oil content (%) | Hydroperoxides (ABS 510 nm) | TBARS (µg/mL) | ||||
|---|---|---|---|---|---|---|---|
| Day 1 | Day 10 | Difference (Day 10-Day 1) | Day 1 | Day 10 | Difference (Day 10-Day 1) | ||
| CM | 10 | 0.017 ± 0.004 c | 0.326 ± 0.195 a,b | 0.309 ± 0.198 a,* | 0.097 ± 0.016 a | 0.143 ± 0.017 a,b | 0.046 ± 0.031 a,b* |
| 30 | 0.039 ± 0.005 a,b,c | 0.333 ± 0.026 a,b | 0.294 ± 0.022 a,* | 0.060 ± 0.003 b,c,d | 0.079 ± 0.003 c,d,e | 0.020 ± 0.004 a,b,c,d* | |
| 50 | 0.078 ± 0.003 a | 0.433 ± 0.063 a | 0.356 ± 0.063 a,* | 0.100 ± 0.007 a | 0.160 ± 0.022 a | 0.061 ± 0.017 a* | |
| CH | 10 | 0.039 ± 0.015 a,b,c | 0.252 ± 0.032 a,b | 0.213 ± 0.047 a,b* | 0.054 ± 0.002 b,c,d | 0.075 ± 0.007 c,d,e | 0.021 ± 0.007 a,b,c,d* |
| 30 | 0.041 ± 0.023 a,b,c | 0.178 ± 0.012 c | 0.137 ± 0.034 a,b* | 0.058 ± 0.004 b,c,d | 0.092 ± 0.009 c,d | 0.034 ± 0.006 a,b,c,d* | |
| 50 | 0.057 ± 0.029 a,b | 0.245 ± 0.048 a,b | 0.187 ± 0.074 a,b* | 0.068 ± 0.005 b,c | 0.110 ± 0.035 b,c | 0.041 ± 0.034 a,b,c* | |
| UHPH 100 MPa | 10 | 0.022 ± 0.004 b,c | 0.027 ± 0.004 c,d | 0.005 ± 0.004 b,c* | 0.052 ± 0.004 c,d | 0.044 ± 0.003 e | −0.08 ± 0.003 e* |
| 30 | 0.026 ± 0.006 b,c | 0.034 ± 0.0008 c,d | 0.009 ± 0.006b c* | 0.051 ± 0.004 c,d | 0.040 ± 0.008 e | −0.011 ± 0.008 e* | |
| 50 | 0.028 ± 0.009 b,c | 0.033 ± 0.009 c,d | 0.0049 ± 0.004b c* | 0.041 ± 0.009 d | 0.053 ± 0.008 d,e | 0.012 ± 0.006 b,c,d* | |
| UHPH 200 MPa | 10 | 0.025 ± 0.004 b,c | 0.024 ± 0.003 d | 0.00 ± 0.0016 c | 0.054 ± 0.008 b,c,d | 0.088 ± 0.006c,d | 0.034 ± 0.011 a,b,c,d* |
| 30 | 0.019 ± 0.006 b,c | 0.037 ± 0.003 c,d | 0.018 ± 0.004b * | 0.059 ± 0.008 b,c,d | 0.066 ± 0.013 d,e | 0.006 ± 0.017 b,c,d | |
| 50 | 0.032 ± 0.006 b,c | 0.038 ± 0.004 c | 0.006 ± 0.004 b,c* | 0.072 ± 0.007 b | 0.072 ± 0.004 c,d,e | 0.00 ± 0.009 c,d | |
© 2017 by the authors. Licensee MDPI, Basel, Switzerland. This article is an open access article distributed under the terms and conditions of the Creative Commons Attribution (CC BY) license ( http://creativecommons.org/licenses/by/4.0/).
Share and Cite
Hebishy, E.; Zamora, A.; Buffa, M.; Blasco-Moreno, A.; Trujillo, A.-J. Characterization of Whey Protein Oil-In-Water Emulsions with Different Oil Concentrations Stabilized by Ultra-High Pressure Homogenization. Processes 2017, 5, 6. https://doi.org/10.3390/pr5010006
Hebishy E, Zamora A, Buffa M, Blasco-Moreno A, Trujillo A-J. Characterization of Whey Protein Oil-In-Water Emulsions with Different Oil Concentrations Stabilized by Ultra-High Pressure Homogenization. Processes. 2017; 5(1):6. https://doi.org/10.3390/pr5010006
Chicago/Turabian StyleHebishy, Essam, Anna Zamora, Martin Buffa, Anabel Blasco-Moreno, and Antonio-José Trujillo. 2017. "Characterization of Whey Protein Oil-In-Water Emulsions with Different Oil Concentrations Stabilized by Ultra-High Pressure Homogenization" Processes 5, no. 1: 6. https://doi.org/10.3390/pr5010006
APA StyleHebishy, E., Zamora, A., Buffa, M., Blasco-Moreno, A., & Trujillo, A.-J. (2017). Characterization of Whey Protein Oil-In-Water Emulsions with Different Oil Concentrations Stabilized by Ultra-High Pressure Homogenization. Processes, 5(1), 6. https://doi.org/10.3390/pr5010006