
Optimum Conditions for Microwave Assisted Extraction for Recovery of Phenolic Compounds and Antioxidant Capacity from Macadamia (Macadamia tetraphylla) Skin Waste Using Water


Abstract
:1. Introduction

2. Materials and Methods
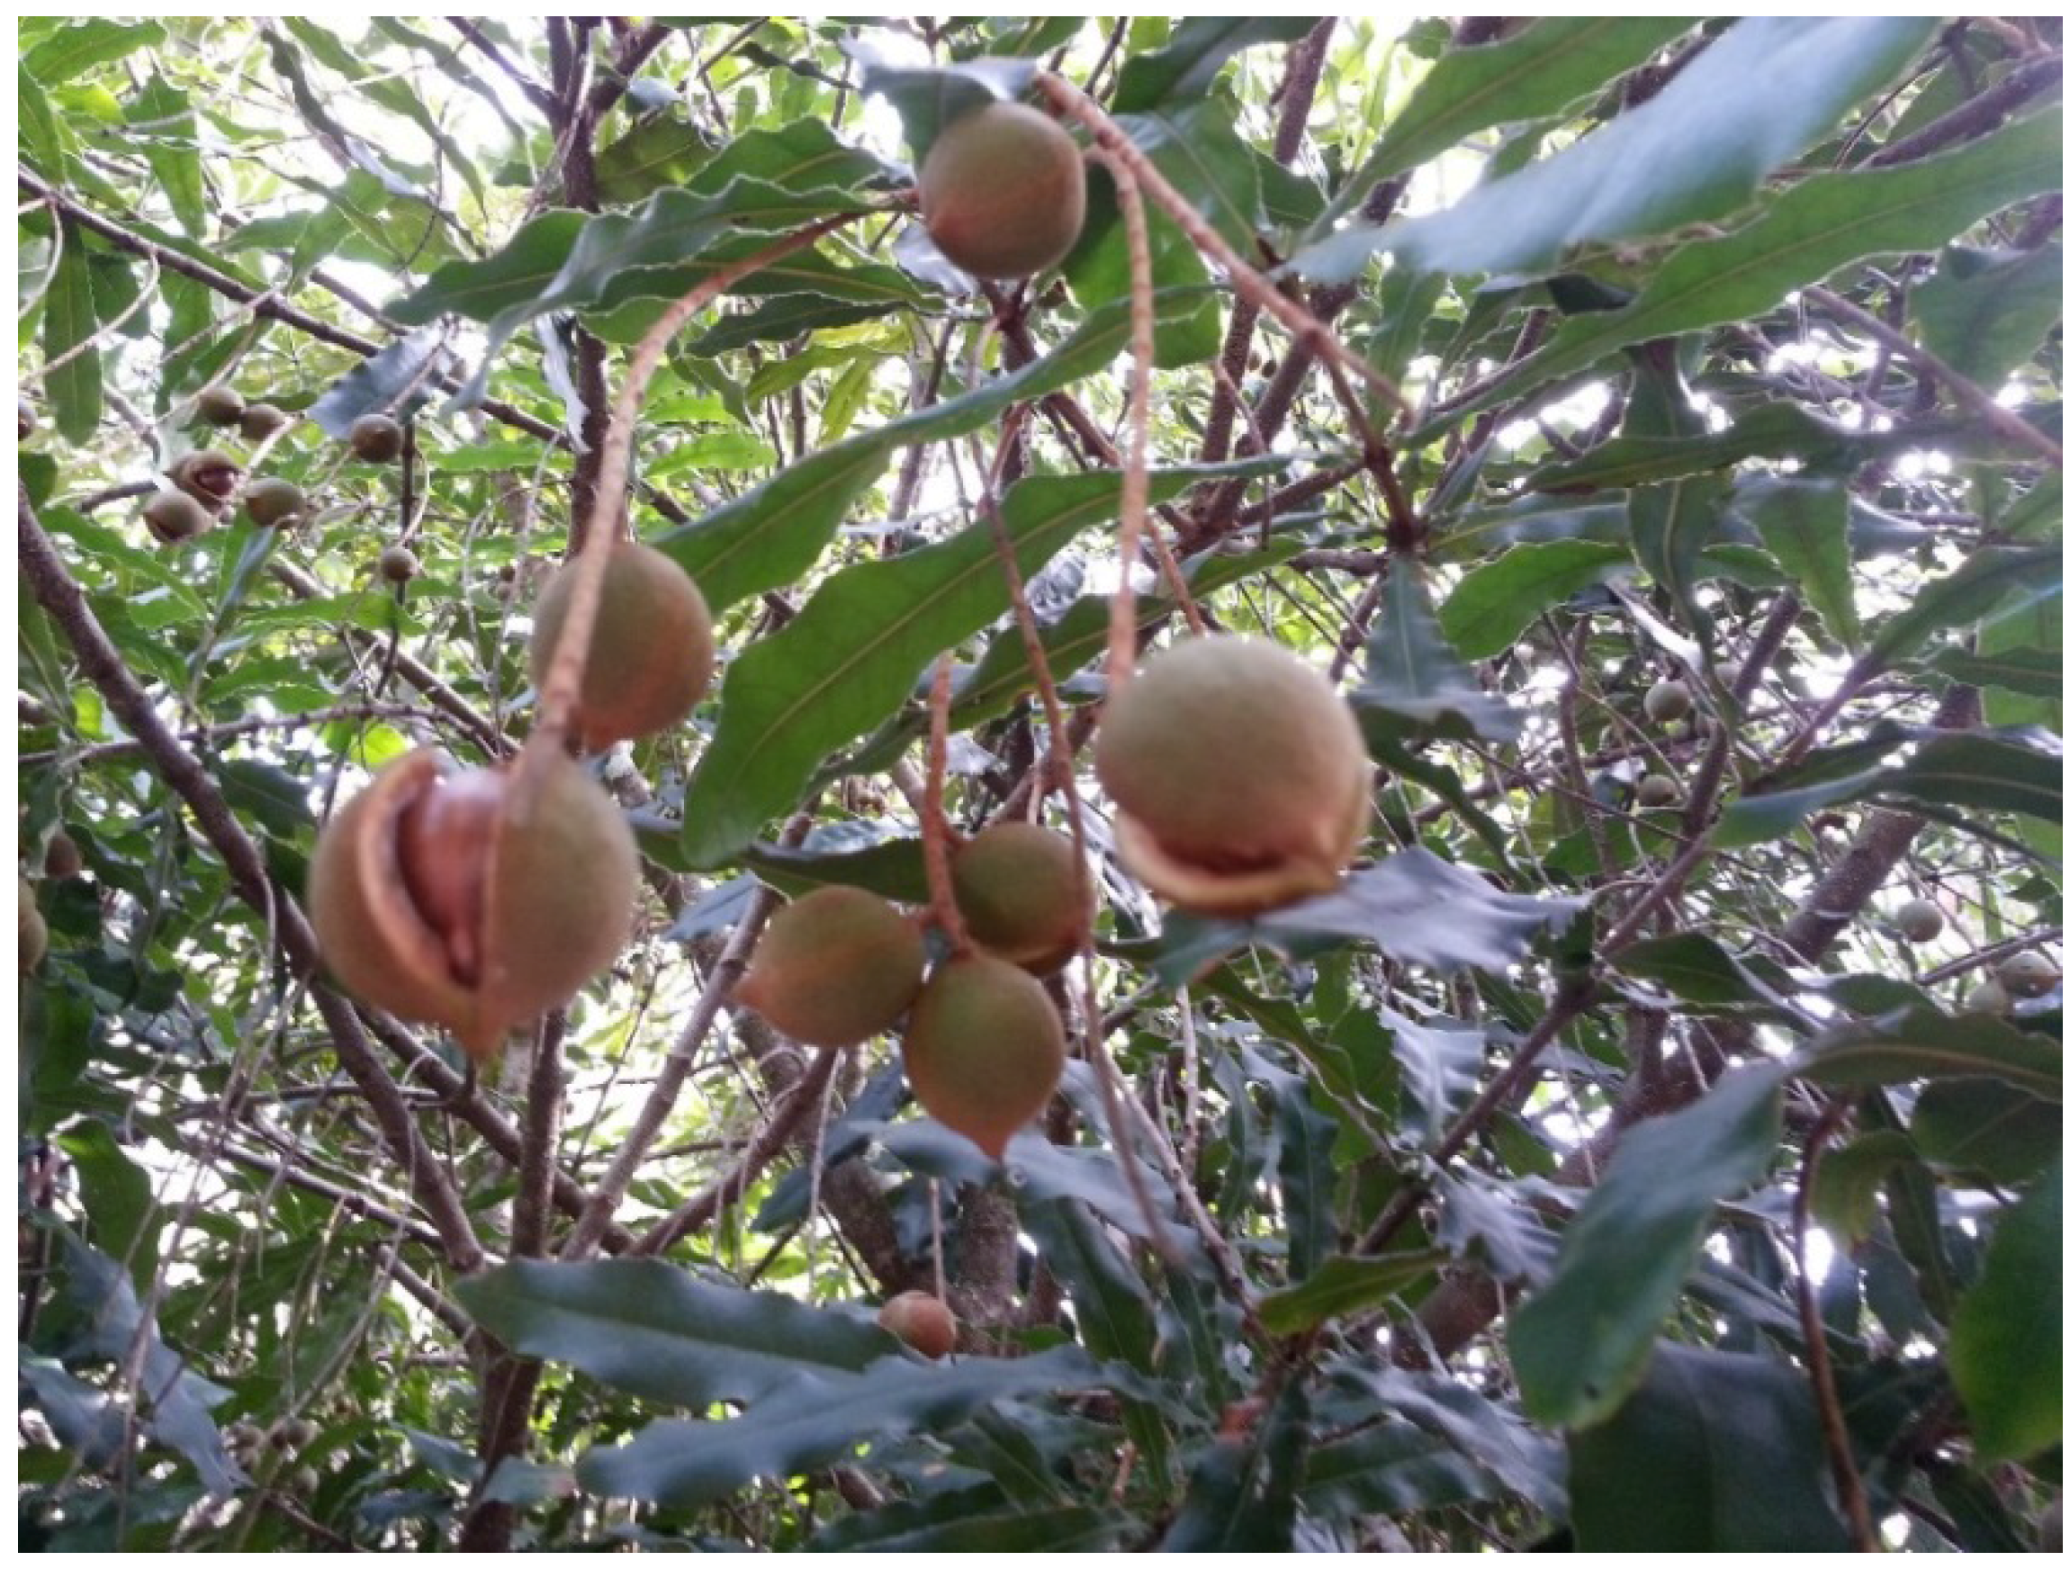
2.1. Materials
2.2. Chemicals
2.3. Microwave-Assisted Extraction (MAE)
2.4. Response Surface Methodology

| Run | Experimental Conditions | Experimental Results | ||||||||
|---|---|---|---|---|---|---|---|---|---|---|
| X1 | X2 | X3 | TPC | Flavon-oids | Proantho-cyanidins | ABTS | DPPH | CUPRAC | FRAP | |
| 1 | 2.5 | 50 | 2 | 63.71 | 13.07 | 16.34 | 172.56 | 200.21 | 426.42 | 58.39 |
| 2 | 4 | 30 | 2 | 111.43 | 21.10 | 37.63 | 544.67 | 479.79 | 726.33 | 119.07 |
| 3 | 4 | 70 | 2 | 69.43 | 19.88 | 10.38 | 343.02 | 396.25 | 683.01 | 64.89 |
| 4 | 5.5 | 50 | 2 | 68.35 | 23.31 | 17.09 | 289.65 | 348.96 | 606.29 | 91.89 |
| 5 | 2.5 | 30 | 5 | 35.76 | 6.22 | 11.18 | 147.32 | 143.60 | 287.39 | 48.04 |
| 6 | 2.5 | 70 | 5 | 48.20 | 16.28 | 9.42 | 308.87 | 216.62 | 360.86 | 47.49 |
| 7 | 4 | 50 | 5 | 32.88 | 26.22 | 22.18 | 352.19 | 331.00 | 583.11 | 91.22 |
| 8 | 4 | 50 | 5 | 40.46 | 35.09 | 17.59 | 319.28 | 283.93 | 475.93 | 86.21 |
| 9 | 4 | 50 | 5 | 32.40 | 36.62 | 17.03 | 298.35 | 340.53 | 718.12 | 71.35 |
| 10 | 5.5 | 30 | 5 | 44.10 | 26.41 | 18.35 | 390.75 | 287.67 | 459.83 | 86.24 |
| 11 | 5.5 | 70 | 5 | 18.23 | 3.65 | 7.98 | 46.60 | 43.33 | 99.88 | 17.99 |
| 12 | 2.5 | 50 | 8 | 30.21 | 13.17 | 17.43 | 123.23 | 138.00 | 320.20 | 42.74 |
| 13 | 4 | 30 | 8 | 33.25 | 16.74 | 22.32 | 254.67 | 240.19 | 472.72 | 68.69 |
| 14 | 4 | 70 | 8 | 43.06 | 15.14 | 34.97 | 217.87 | 258.69 | 544.95 | 75.21 |
| 15 | 5.5 | 50 | 8 | 33.36 | 17.02 | 23.52 | 190.58 | 193.72 | 526.64 | 101.28 |
2.5. Methods for the Determination of Chemical Properties
2.5.1. Total Phenolic Content (TPC)
2.5.2. Total Flavonoids
2.5.3. Proanthocyanidins
2.6. Methods for the Determination of Antioxidant Properties
2.6.1. ABTS Radical Scavenging Capacity
2.6.2. DPPH Radical Scavenging Activity
2.6.3. Cupric Reducing Antioxidant Capacity (CUPRAC)
2.6.4. Ferric Reducing Antioxidant Power (FRAP)
2.7. Statistical Analyses
3. Results and Discussion
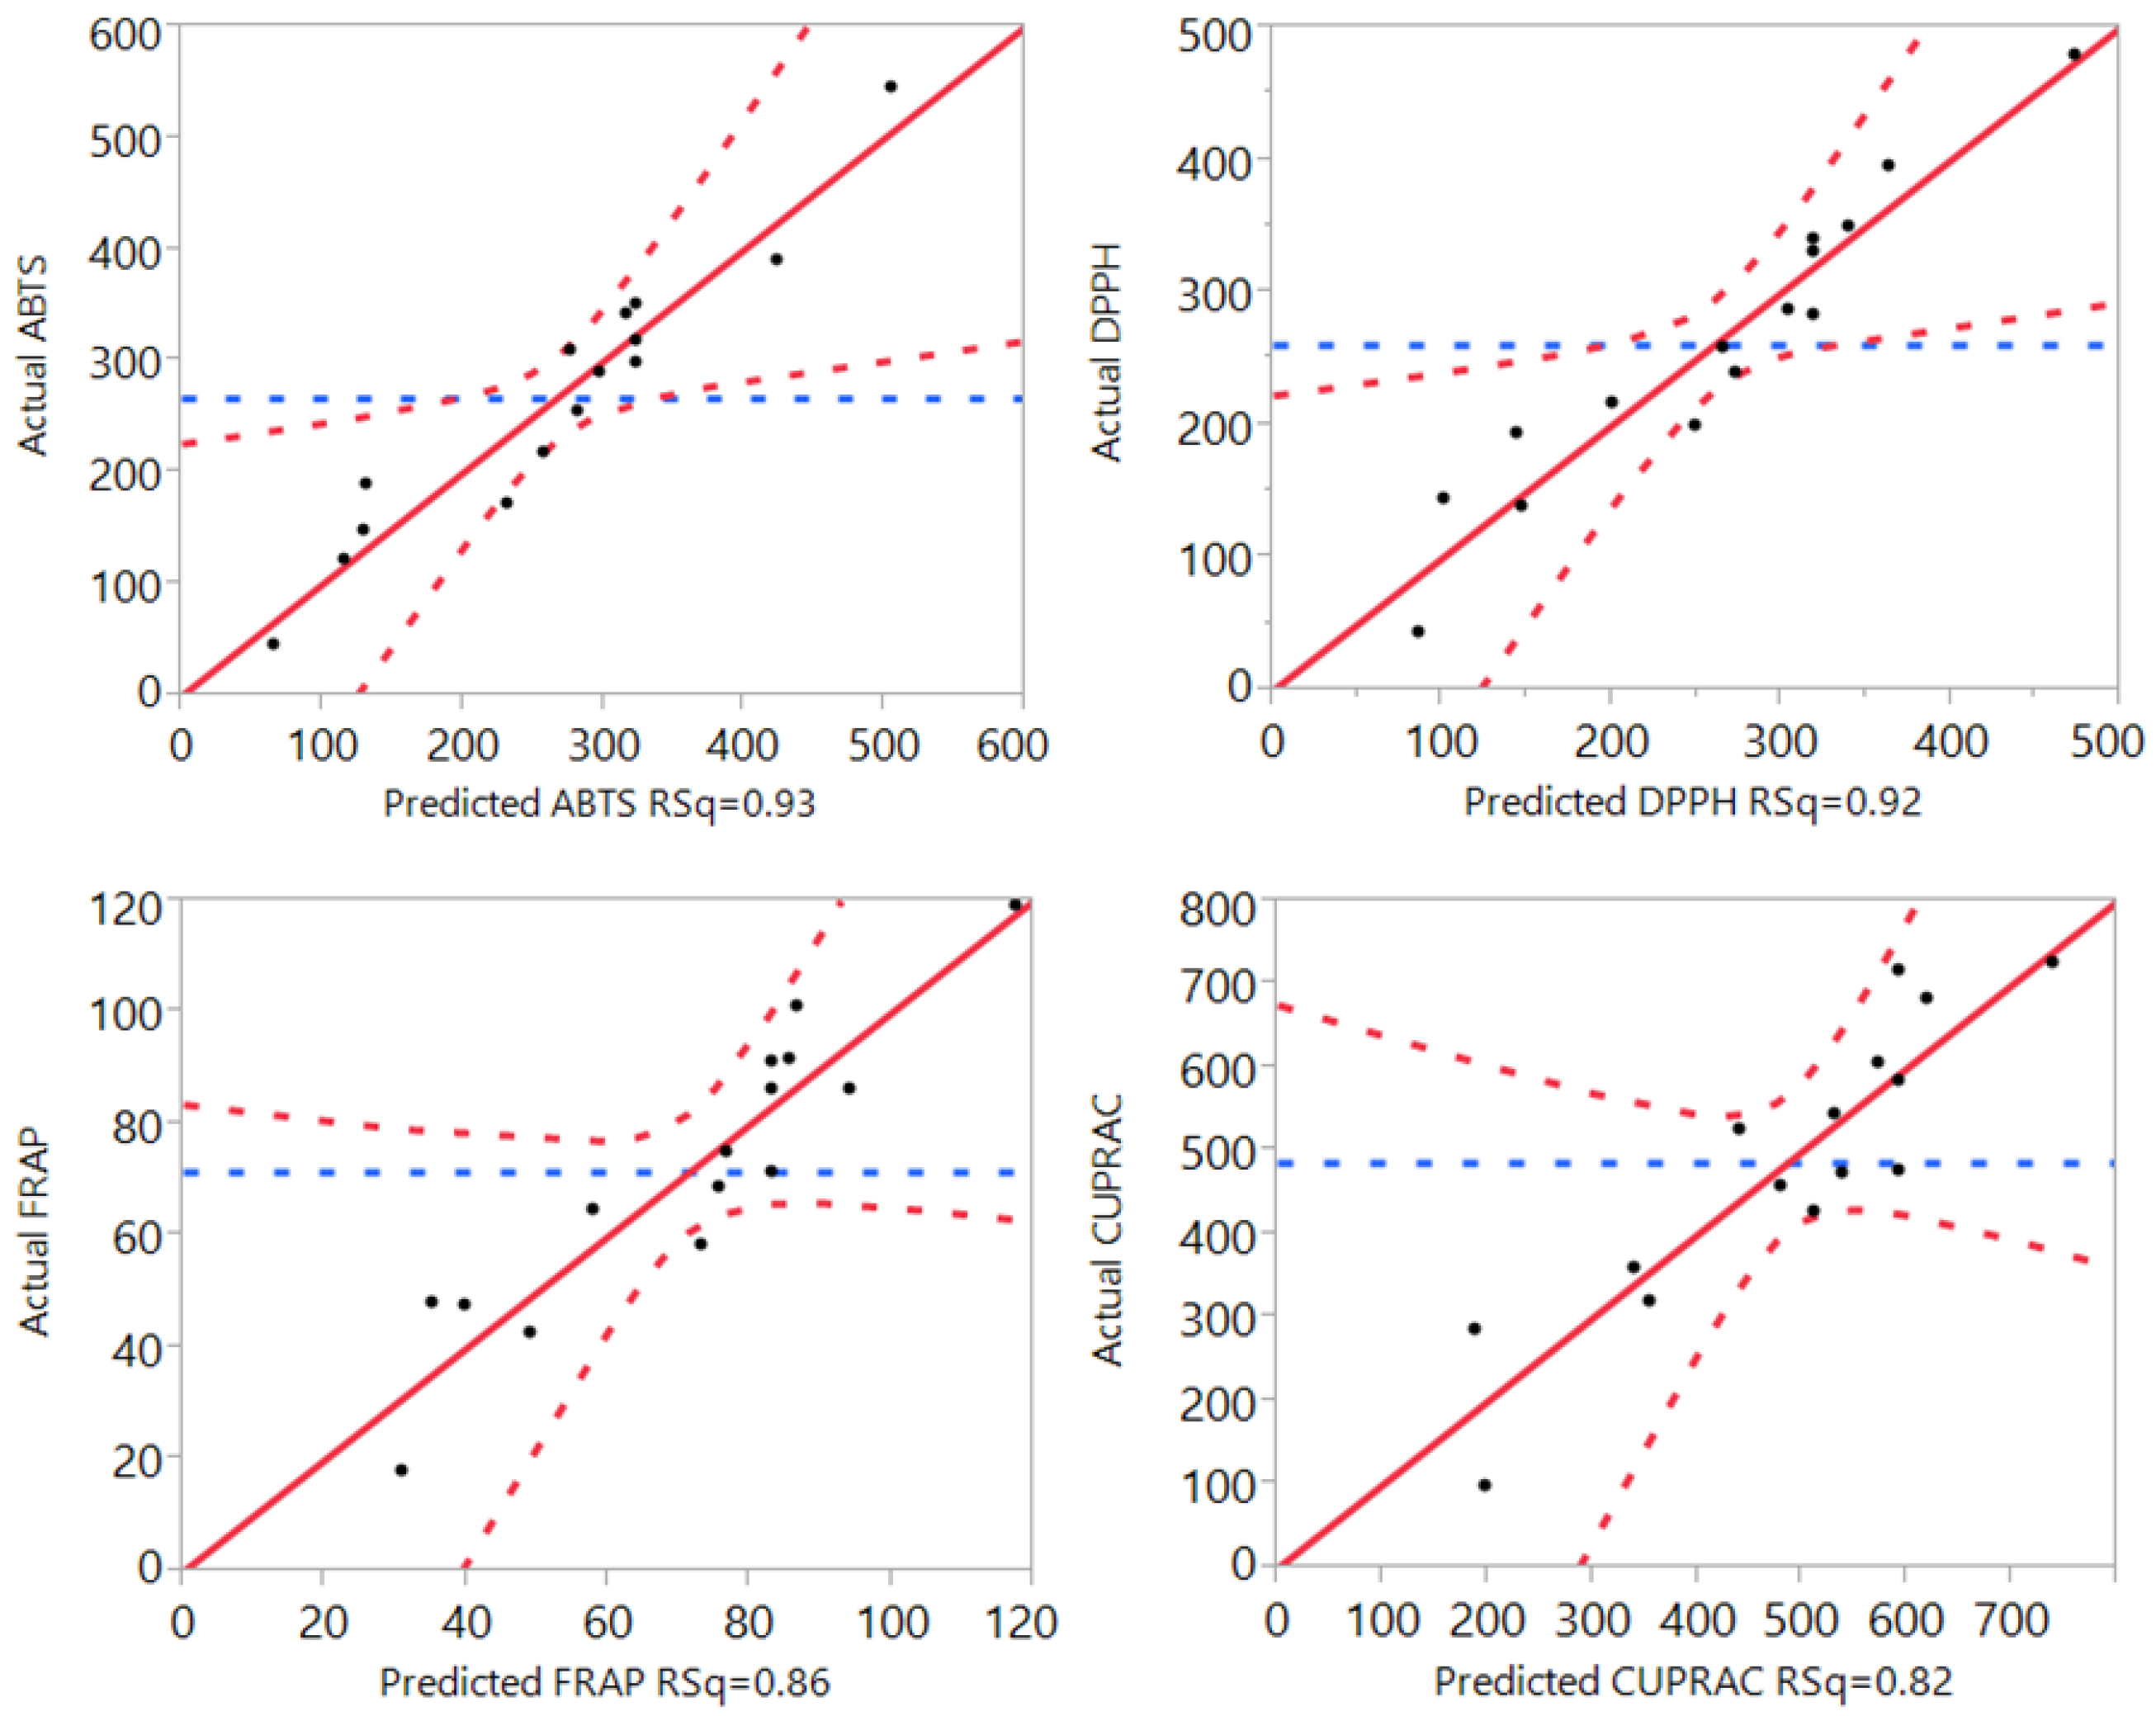
3.1. Statistical Analysis and Fitting of the Model
| TPC | Flavon-oids | Proantho-cyanidins | Antioxidant Capacity | ||||
|---|---|---|---|---|---|---|---|
| ABTS | DPPH | CUPRAC | FRAP | ||||
| Lack of fit | 0.167 | 0.892 | 0.979 | 0.136 | 0.989 | 0.525 | 0.239 |
| R2 | 0.95 | 0.93 | 0.98 | 0.93 | 0.92 | 0.82 | 0.86 |
| Adjusted R2 | 0.87 | 0.81 | 0.95 | 0.79 | 0.79 | 0.49 | 0.62 |
| PRESS | 5129 | 439 | 57 | 234,529 | 186,966 | 800,865 | 17,548 |
| F ratio of Model | 11.13 | 7.60 | 31.98 | 6.85 | 6.70 | 2.51 | 3.54 |
| Prob > F | 0.01 | 0.02 | 0.001 | 0.02 | 0.02 | 0.16 | 0.09 |

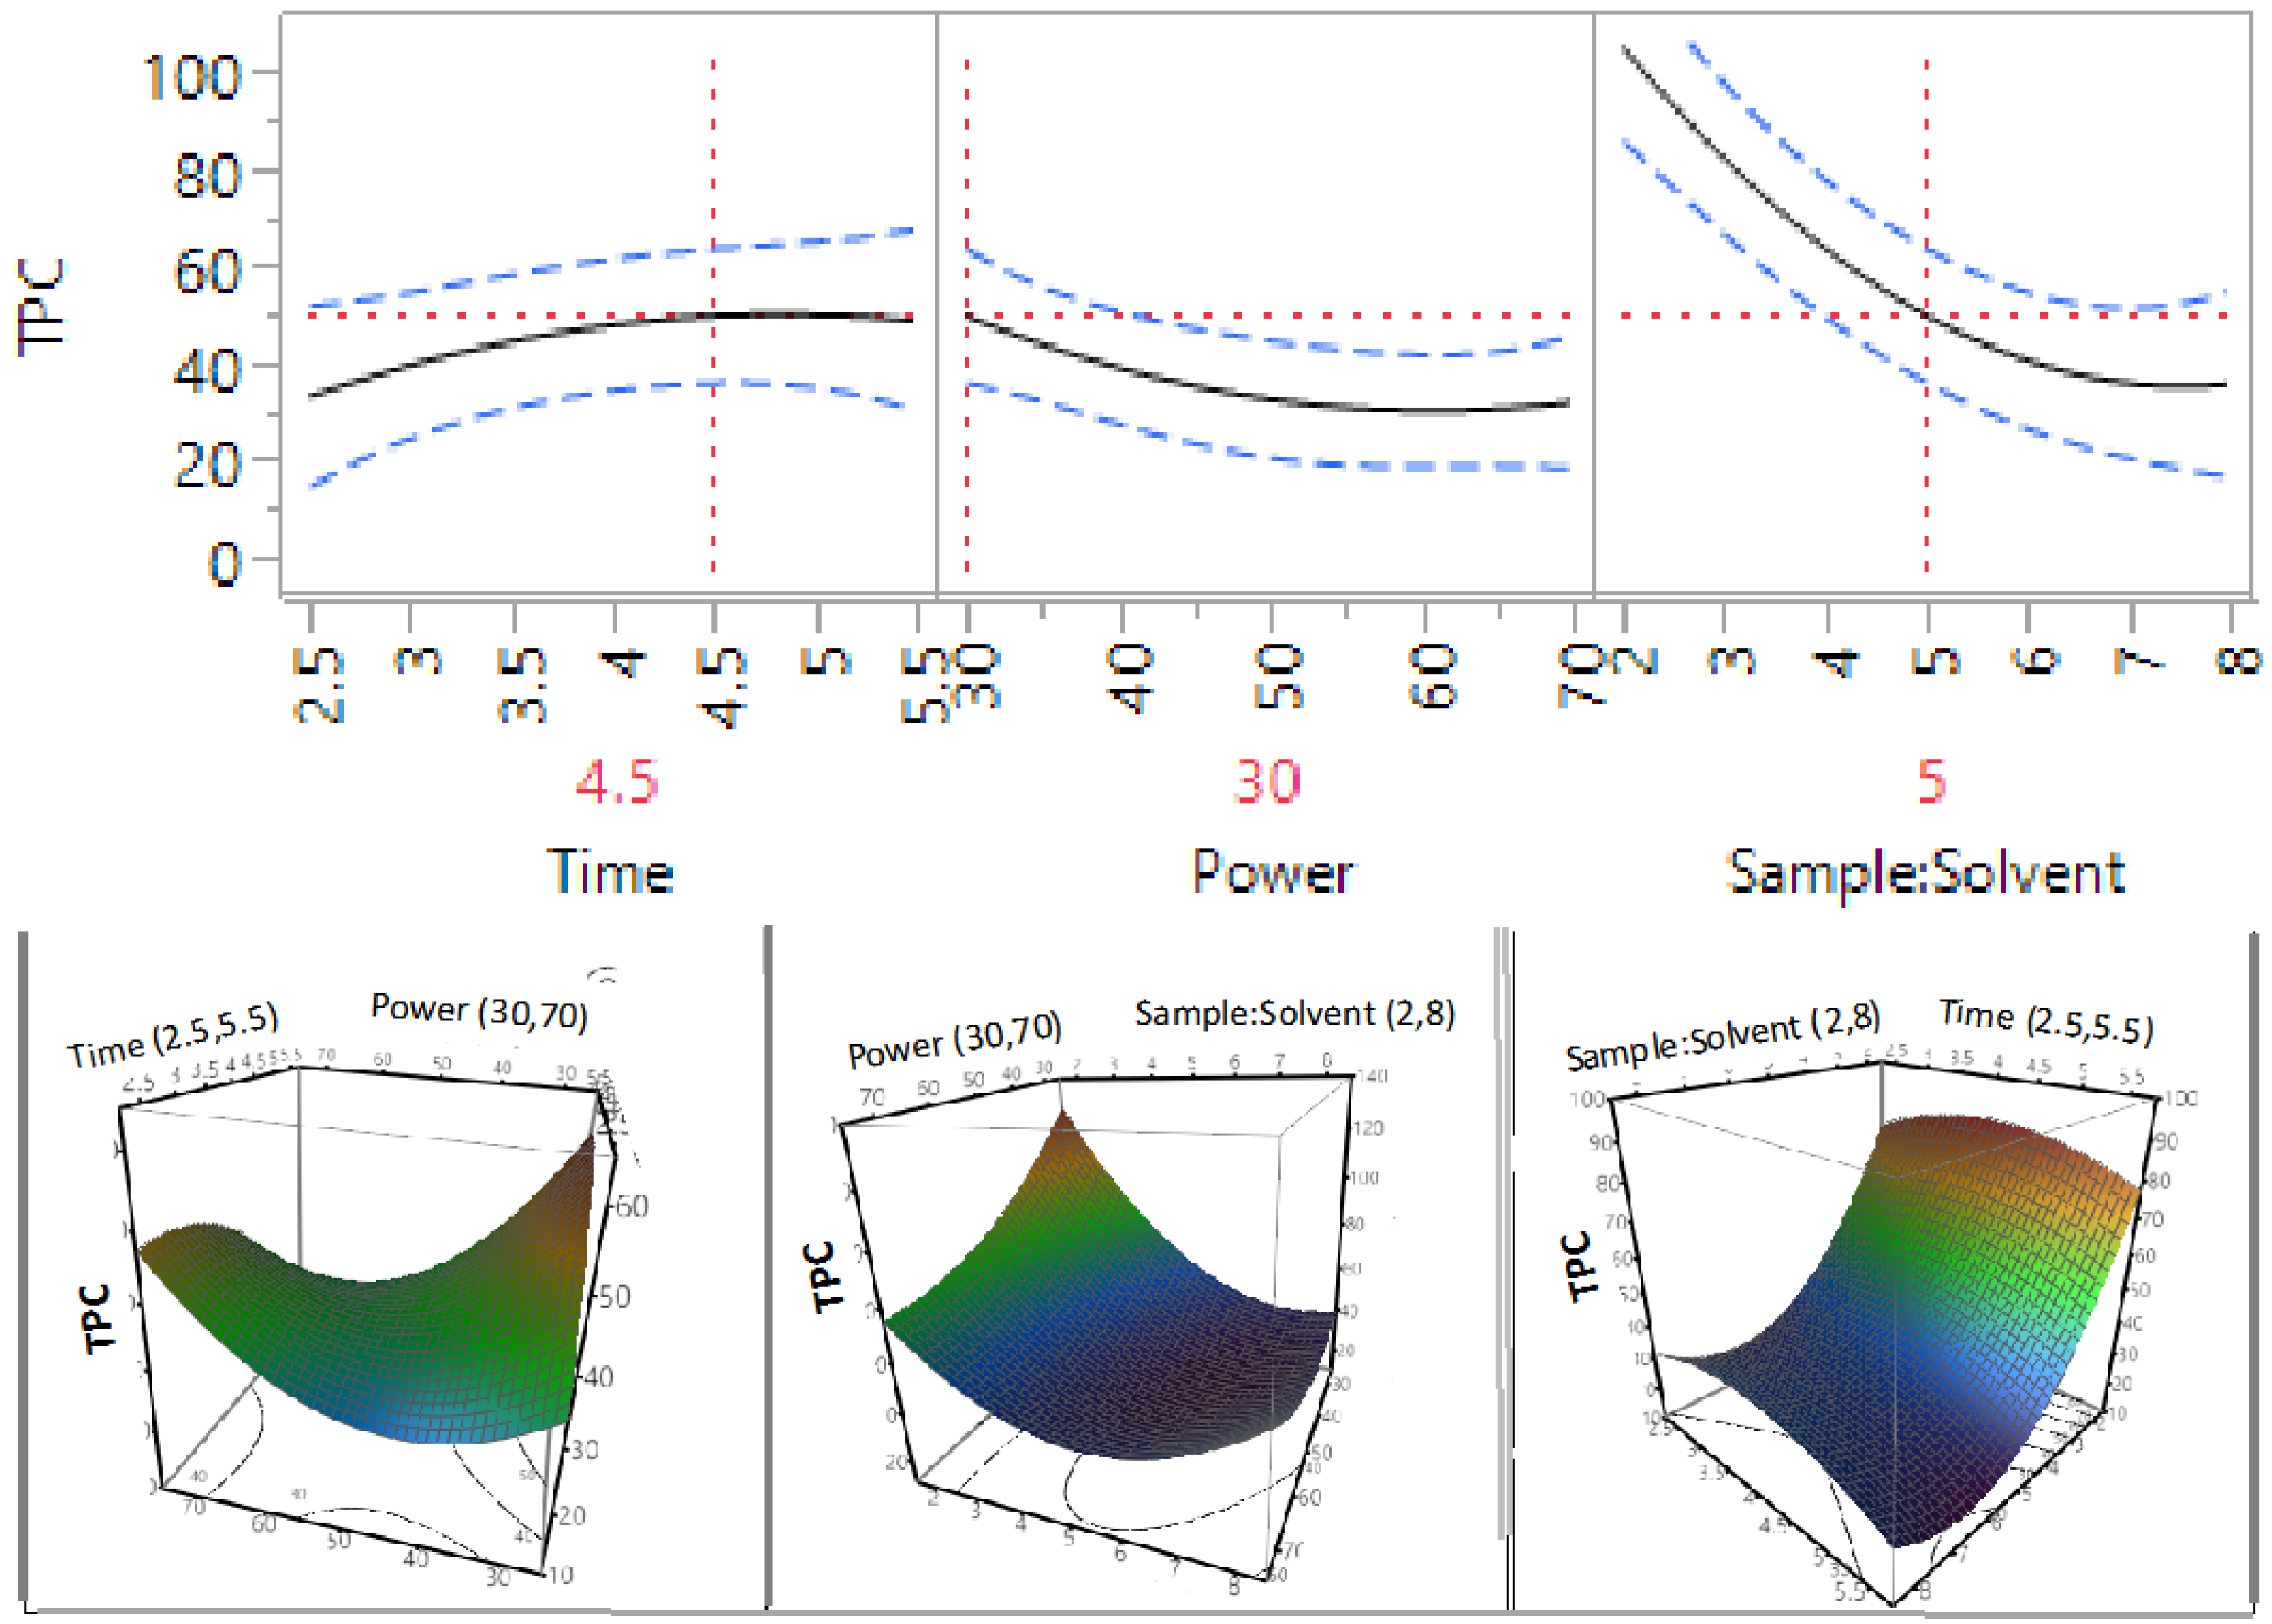
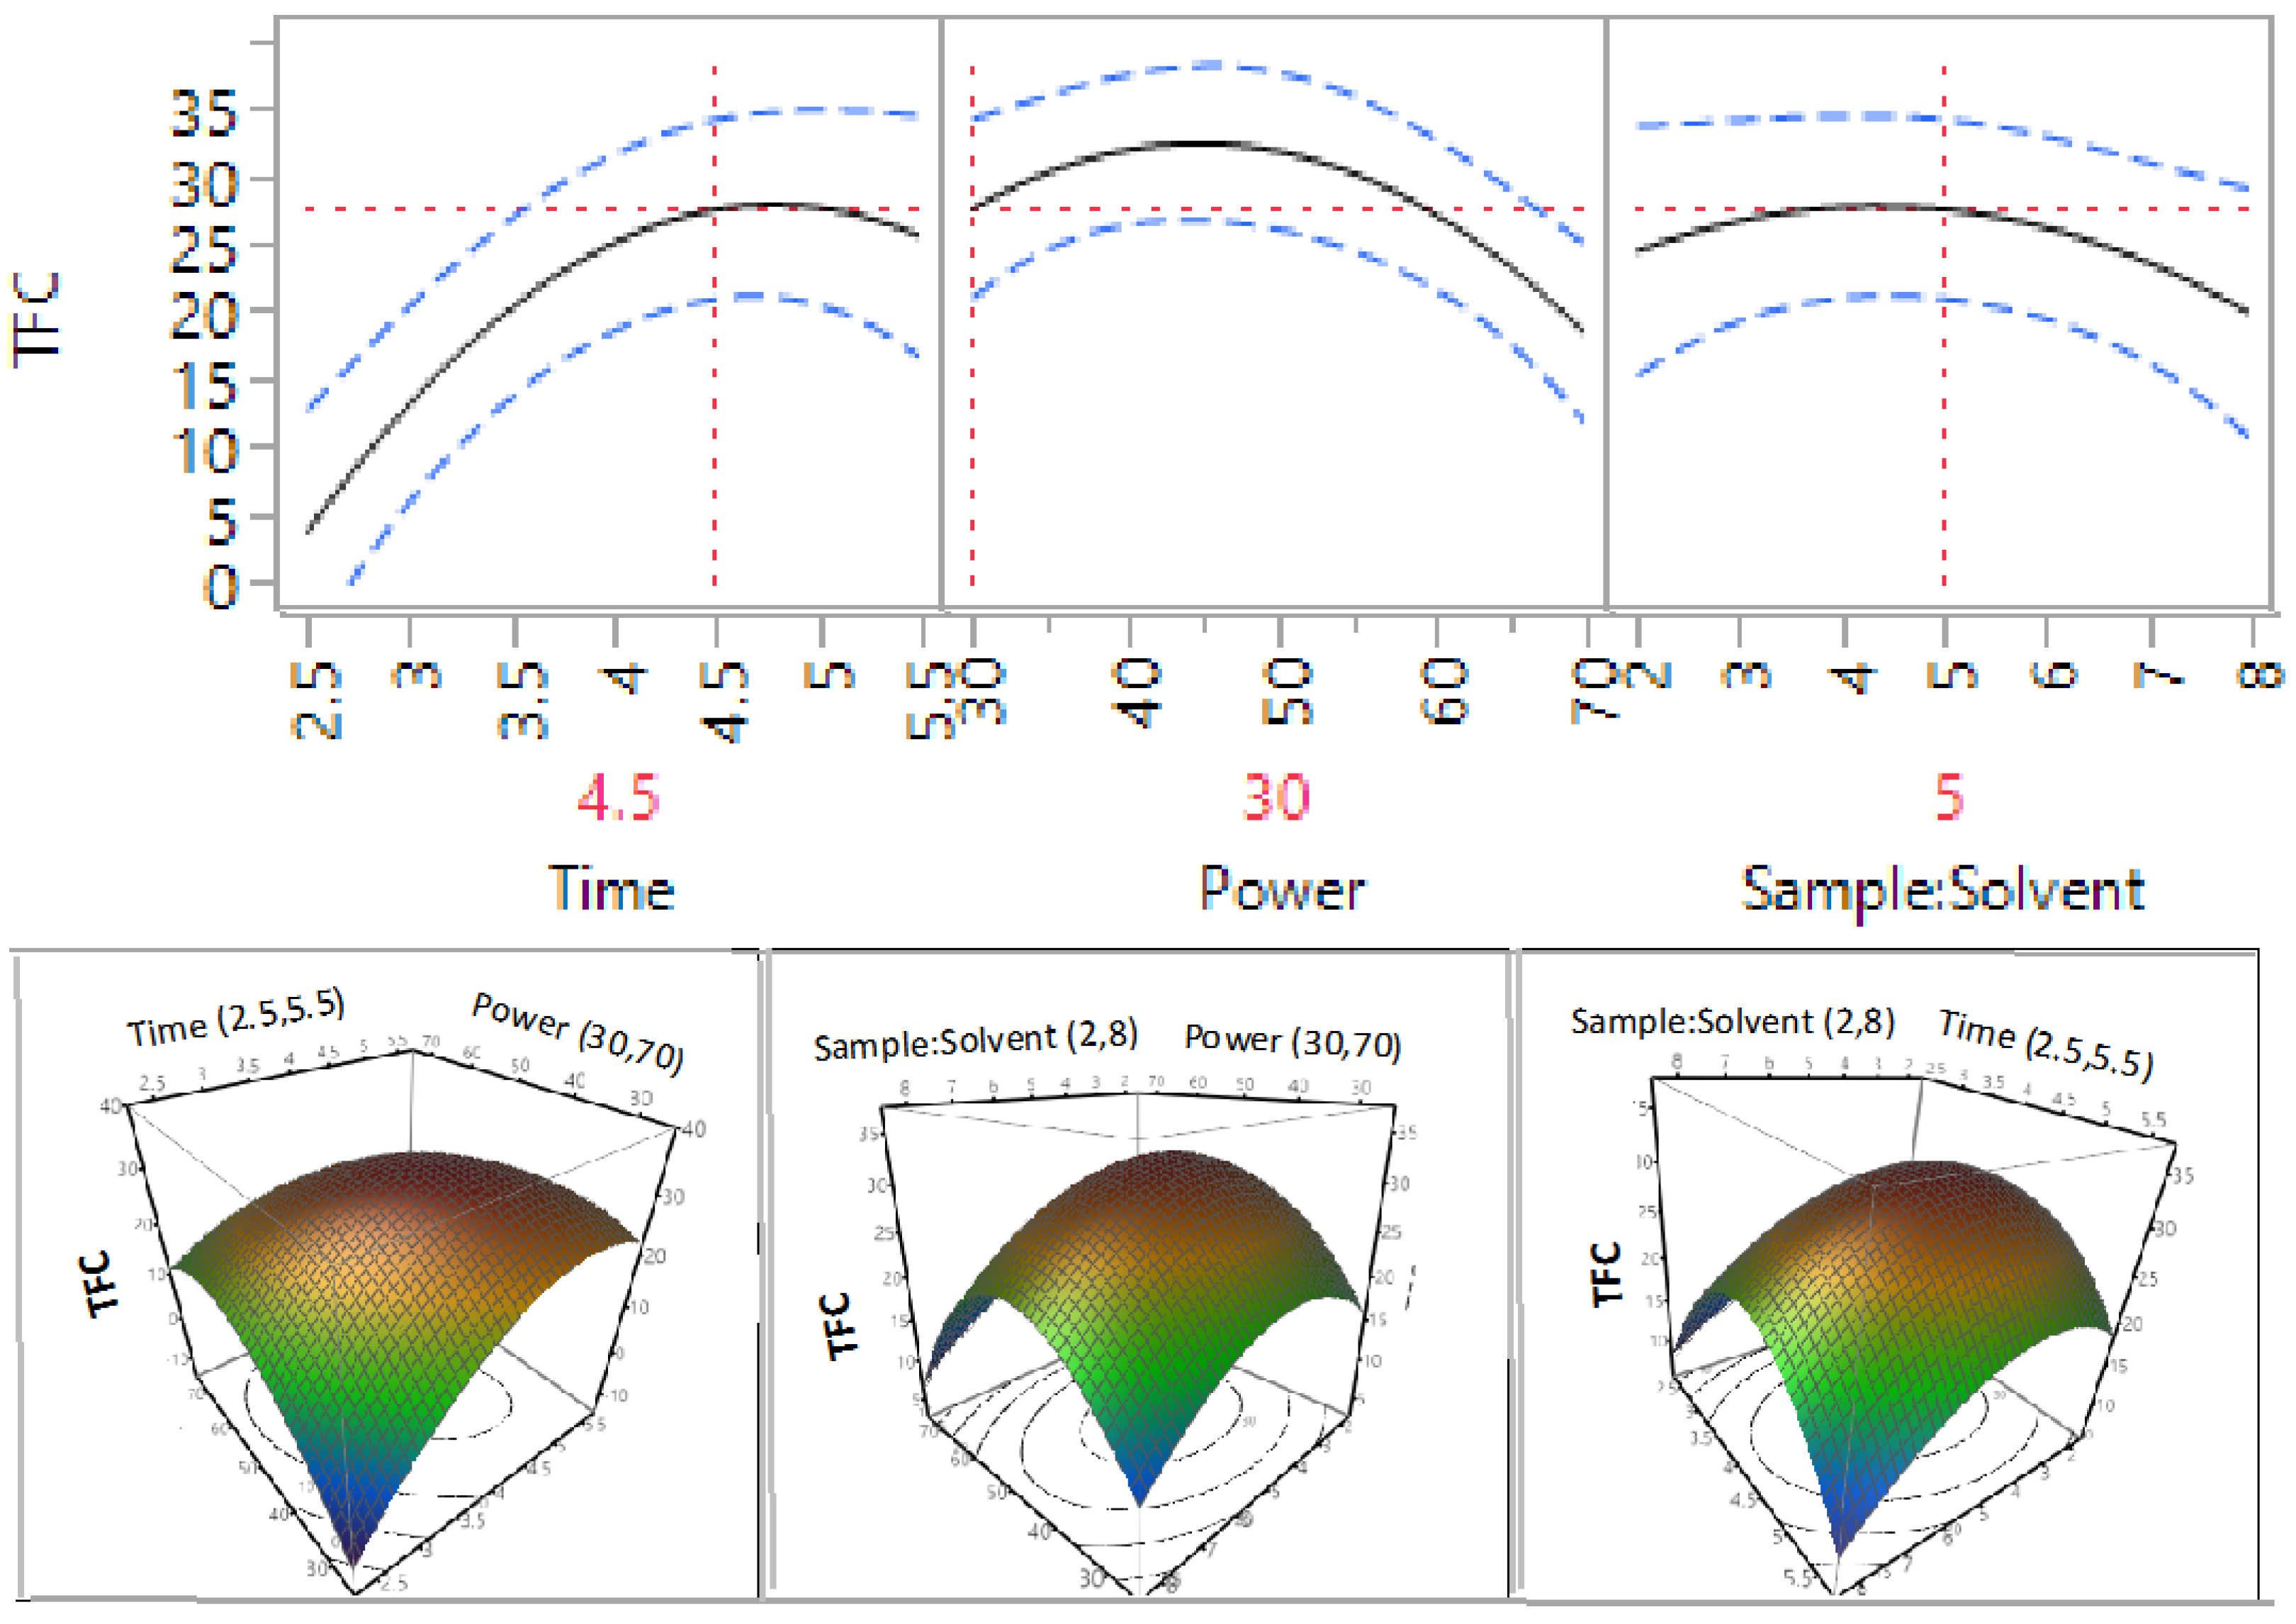
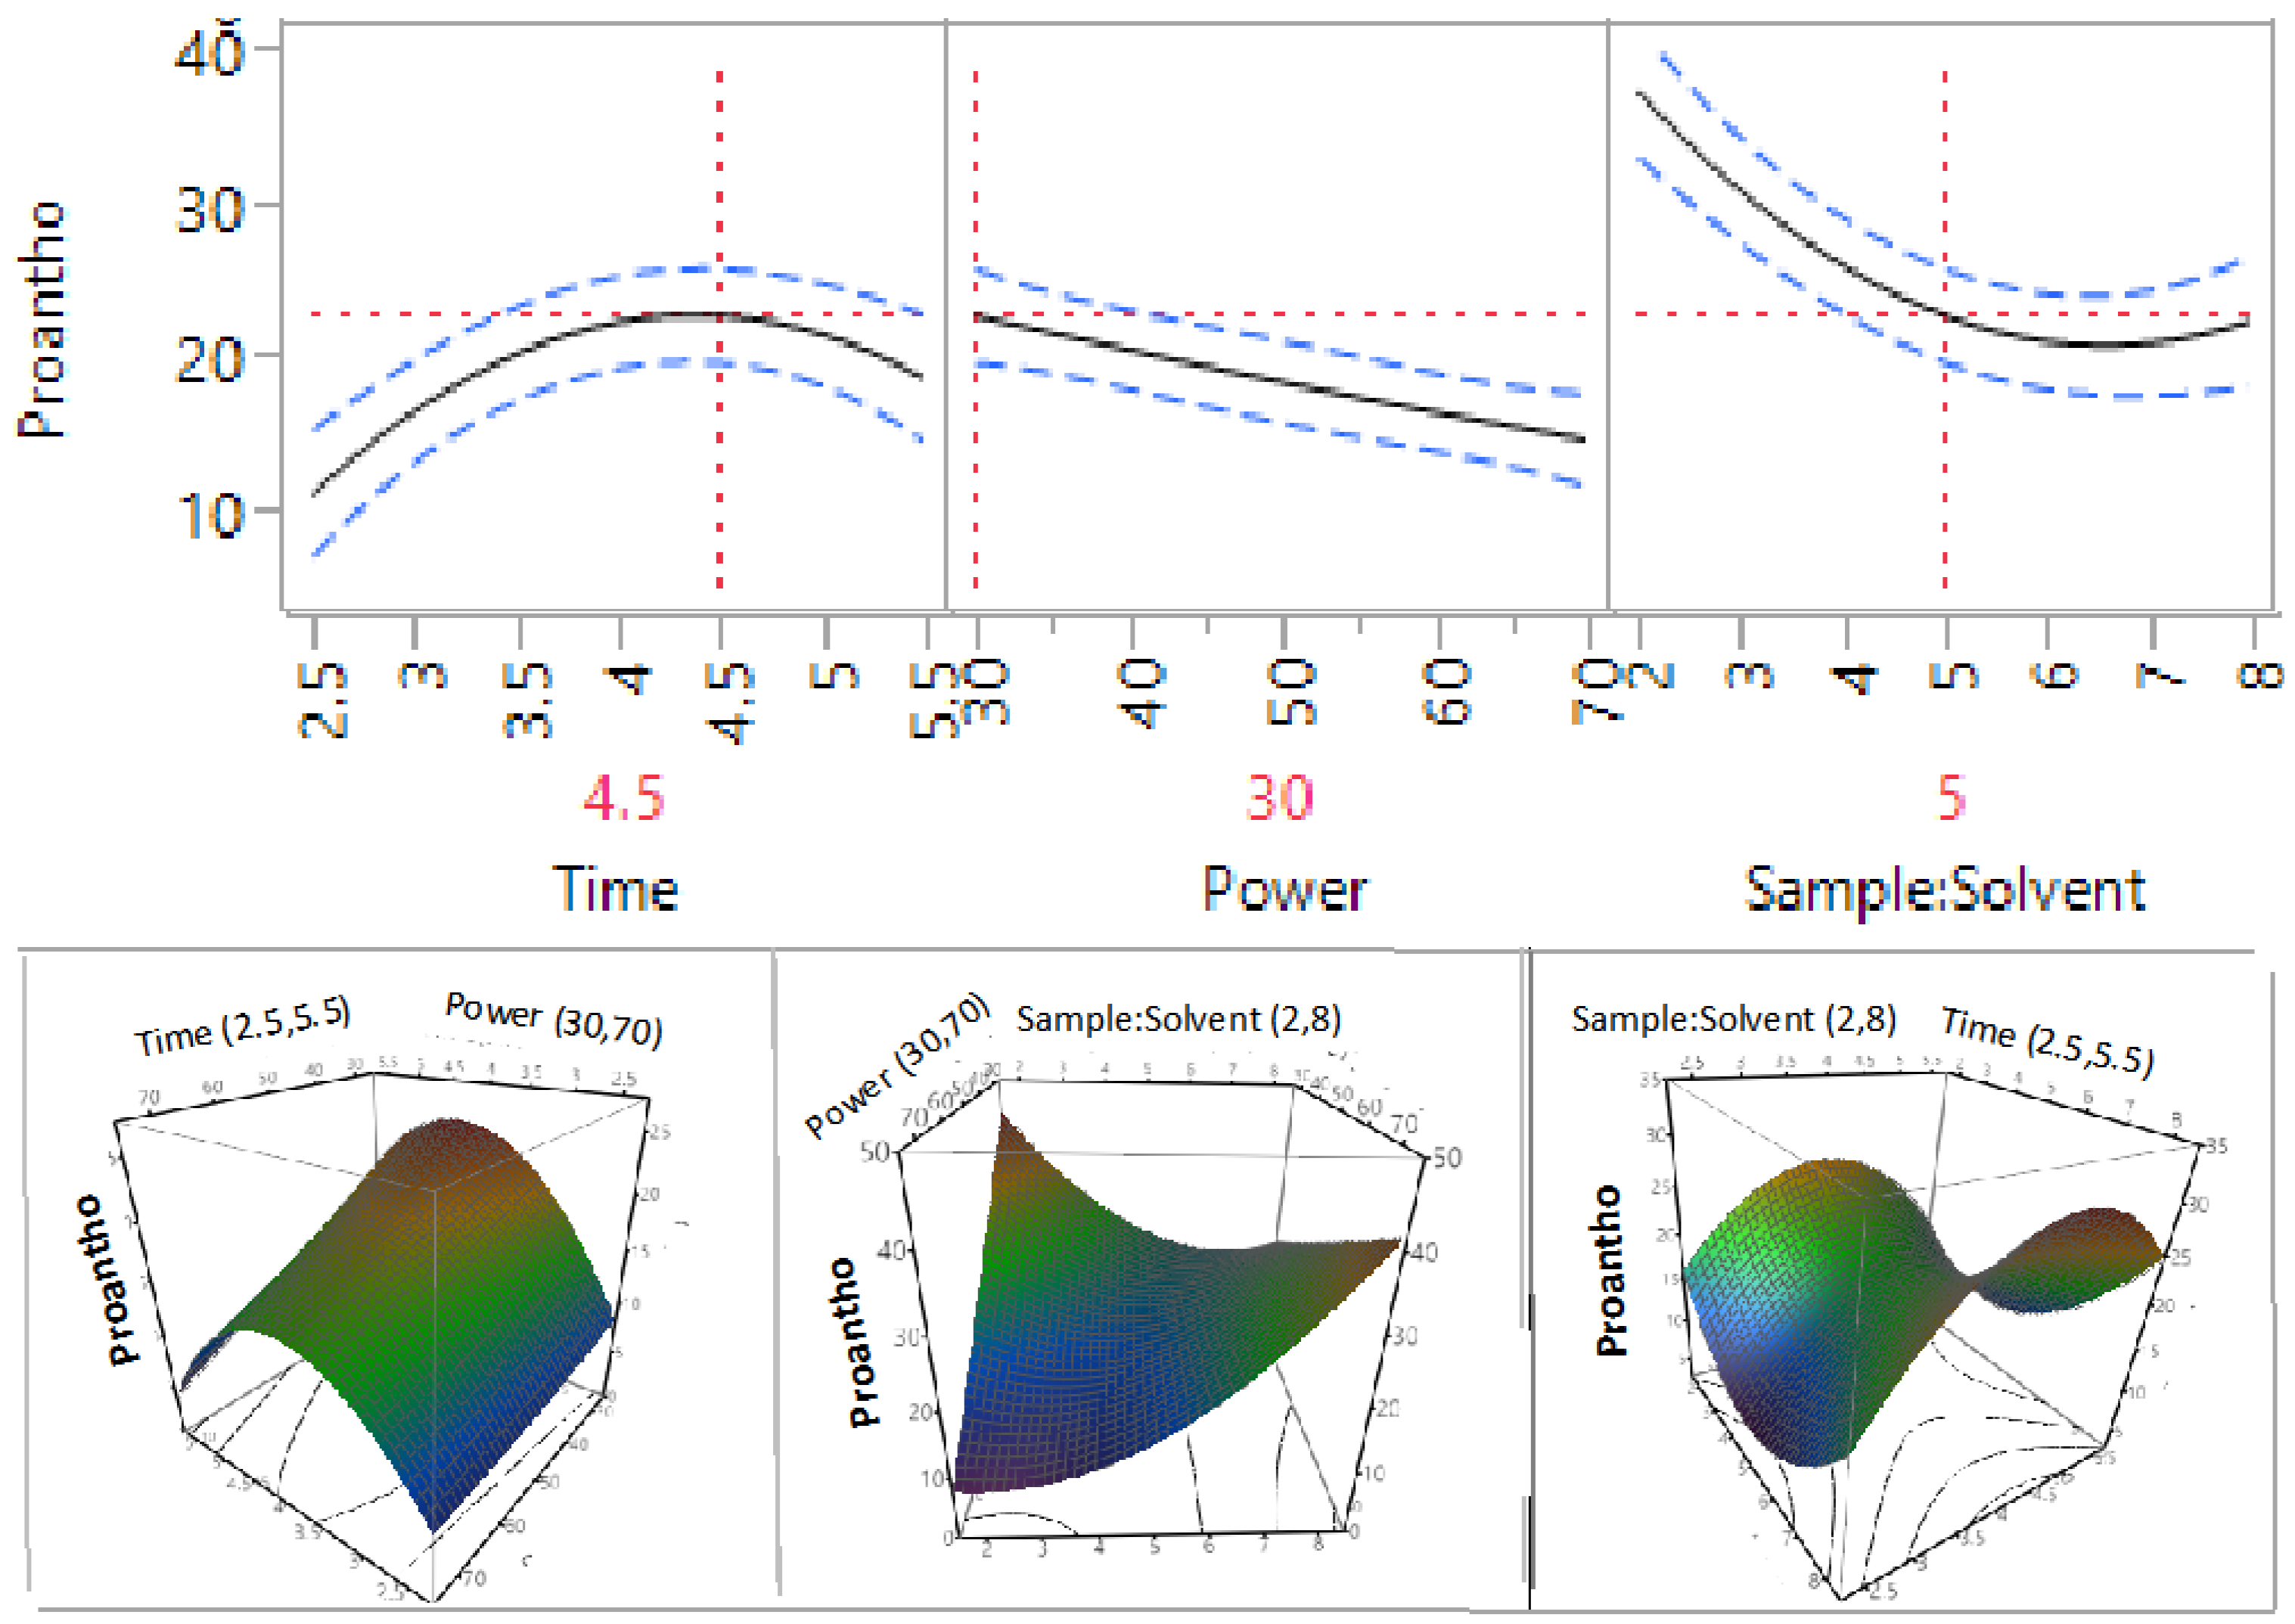
3.2. Effect of Extraction Independent Variables on Phenolic Compounds, Flavonoids, and Proanthocyanidins
| Parameter | DF | TPC | Flavonoids | Proanthocyanidins | |||
|---|---|---|---|---|---|---|---|
| Estimate | Prob > |t| | Estimate | Prob > |t| | Estimate | Prob > |t| | ||
| β0 | 1 | 35.24 | 0.0008 * | 32.64 | <0.0001 * | 18.93 | <0.0001 * |
| β1 | 1 | −1.73 | 0.5872 | 2.71 | 0.1168 | 1.57 | 0.0624 |
| β2 | 1 | −5.70 | 0.1141 | −1.94 | 0.2322 | −3.34 | 0.0038 * |
| β3 | 1 | −21.63 | 0.0008 * | −1.91 | 0.2383 | 2.10 | 0.0241 * |
| β12 | 1 | −9.58 | 0.0724 | −8.21 | 0.0097 * | −2.15 | 0.0683 |
| β13 | 1 | −0.37 | 0.9329 | −1.60 | 0.4648 | 1.34 | 0.2102 |
| β23 | 1 | 12.95 | 0.0278 | −0.09 | 0.9644 | 9.98 | 0.0001 * |
| β11 | 1 | −7.03 | 0.1702 | −10.54 | 0.0041 * | −7.47 | 0.0006 * |
| β22 | 1 | 8.35 | 0.1153 | −8.97 | 0.008 * | 0.27 | 0.7939 |
| β33 | 1 | 20.69 | 0.0053 * | −5.46 | 0.0484 * | 7.13 | 0.0007 * |


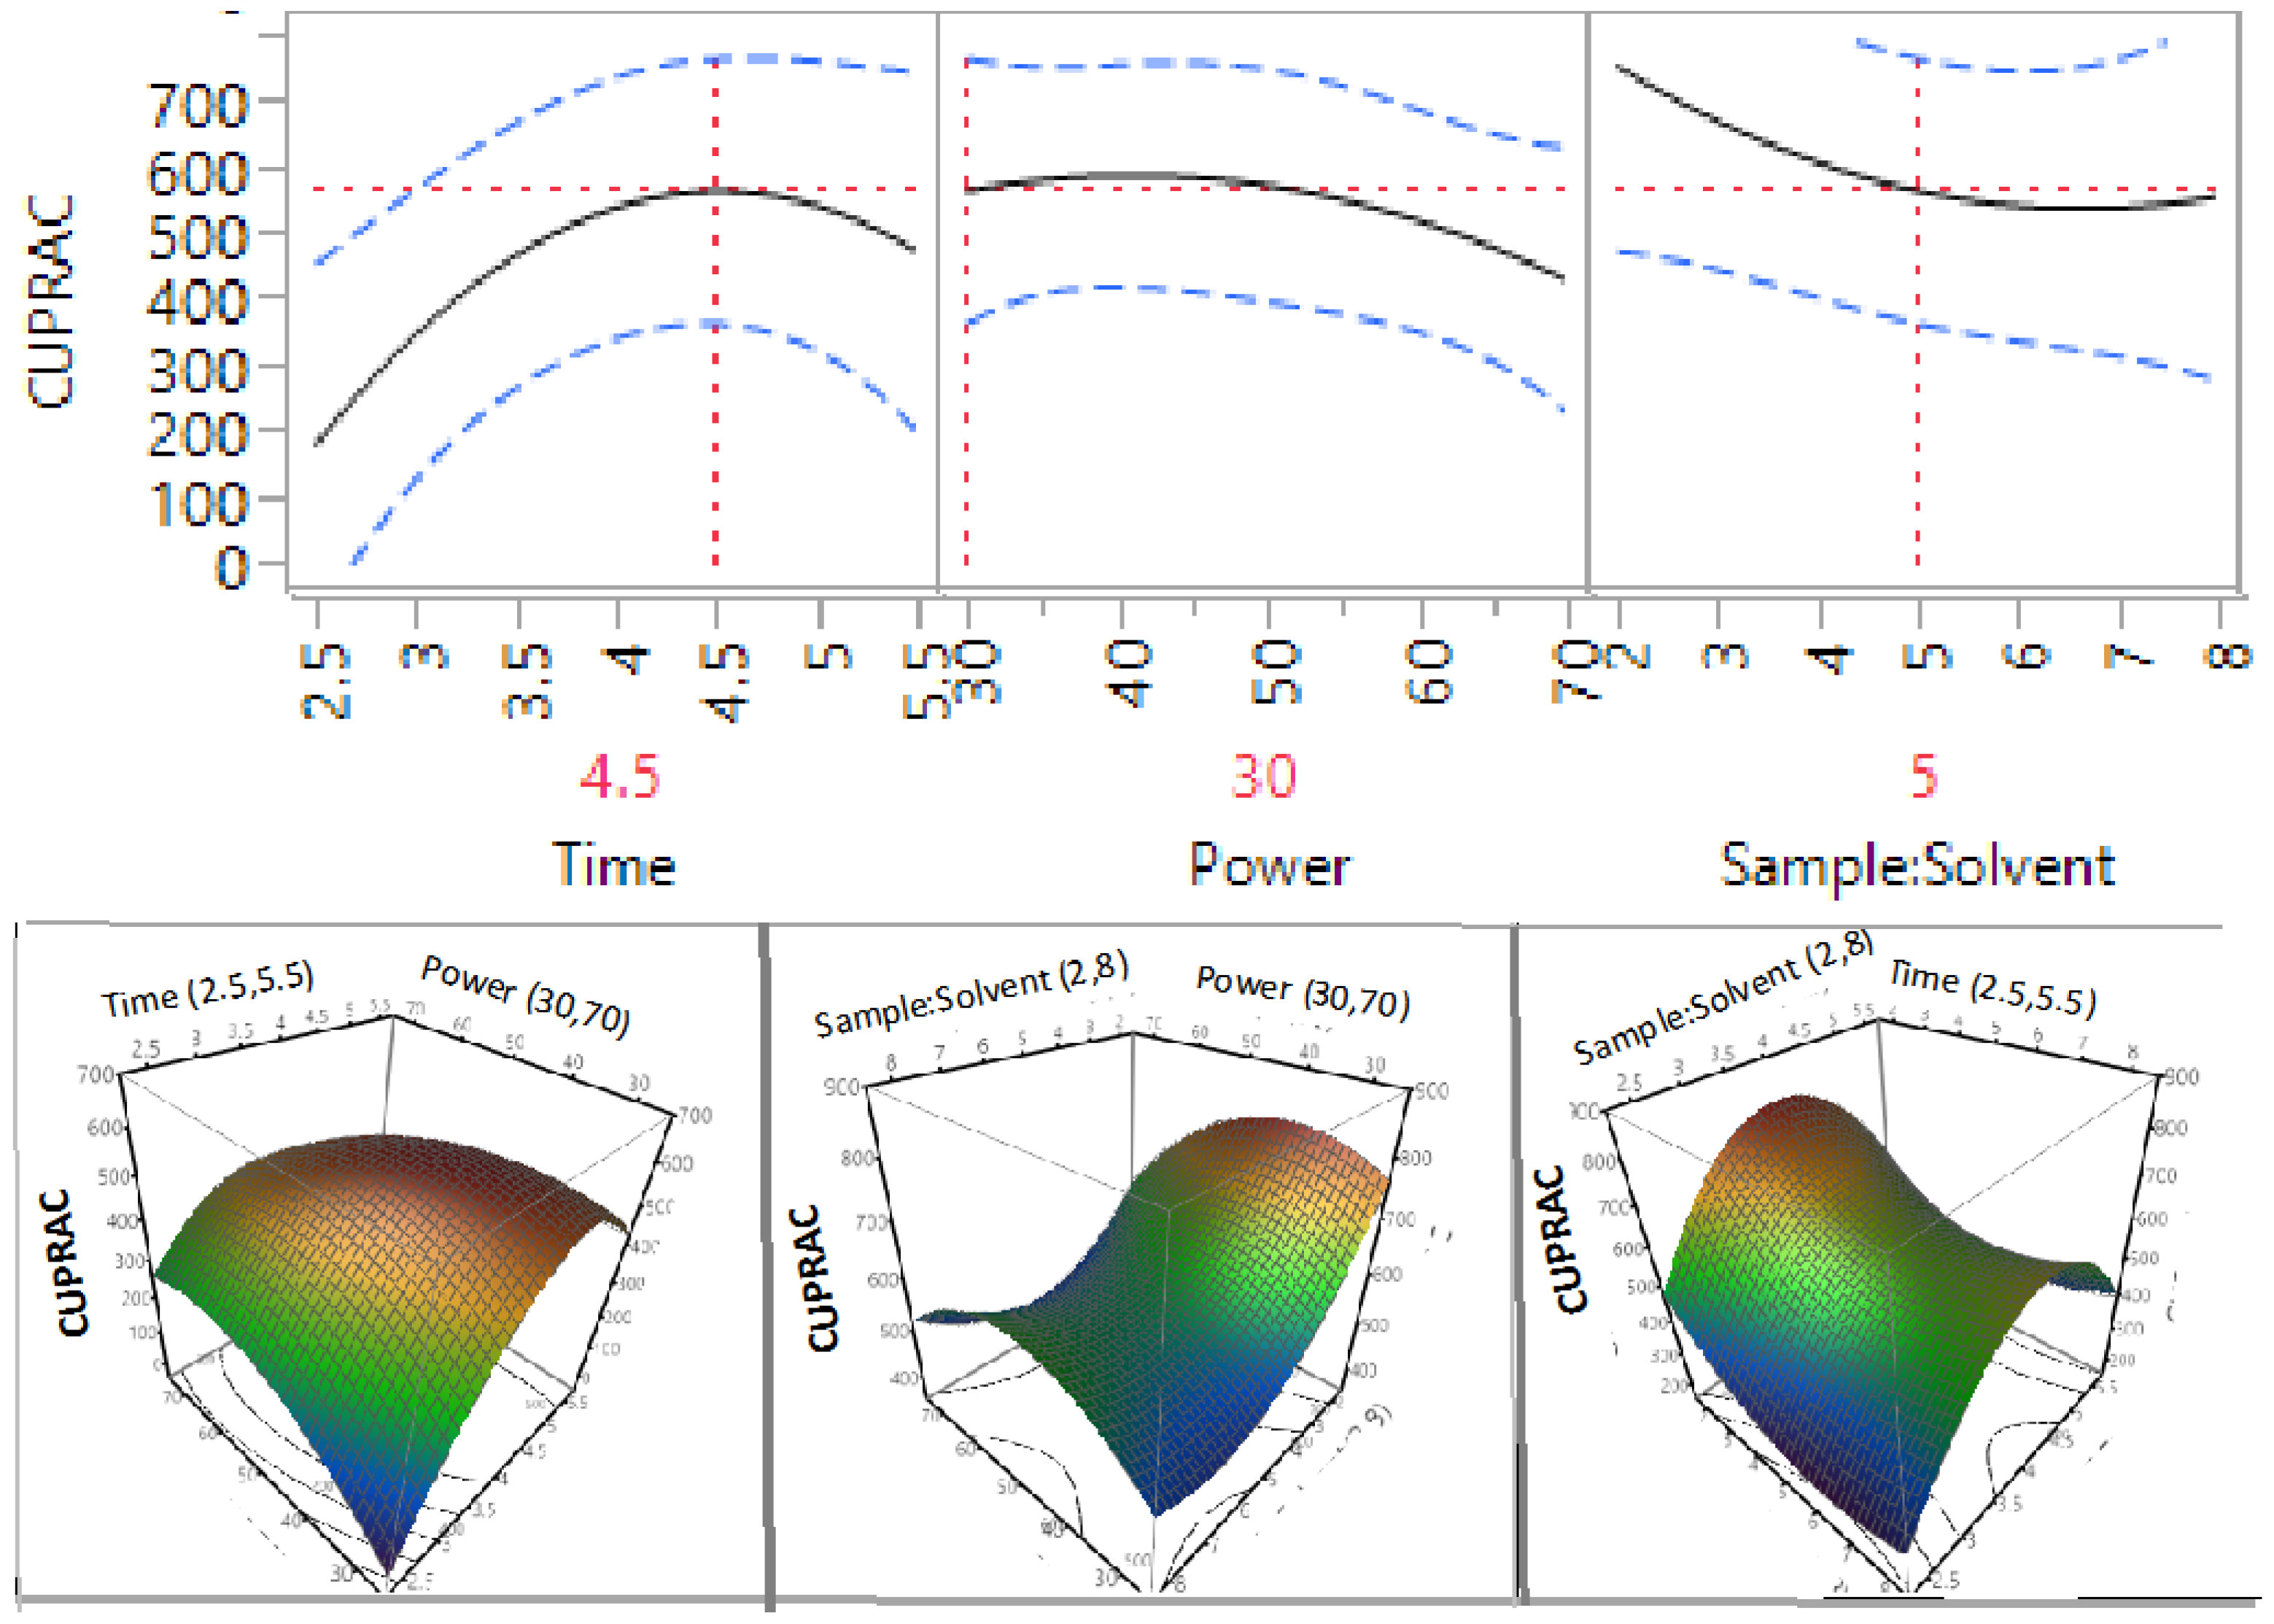
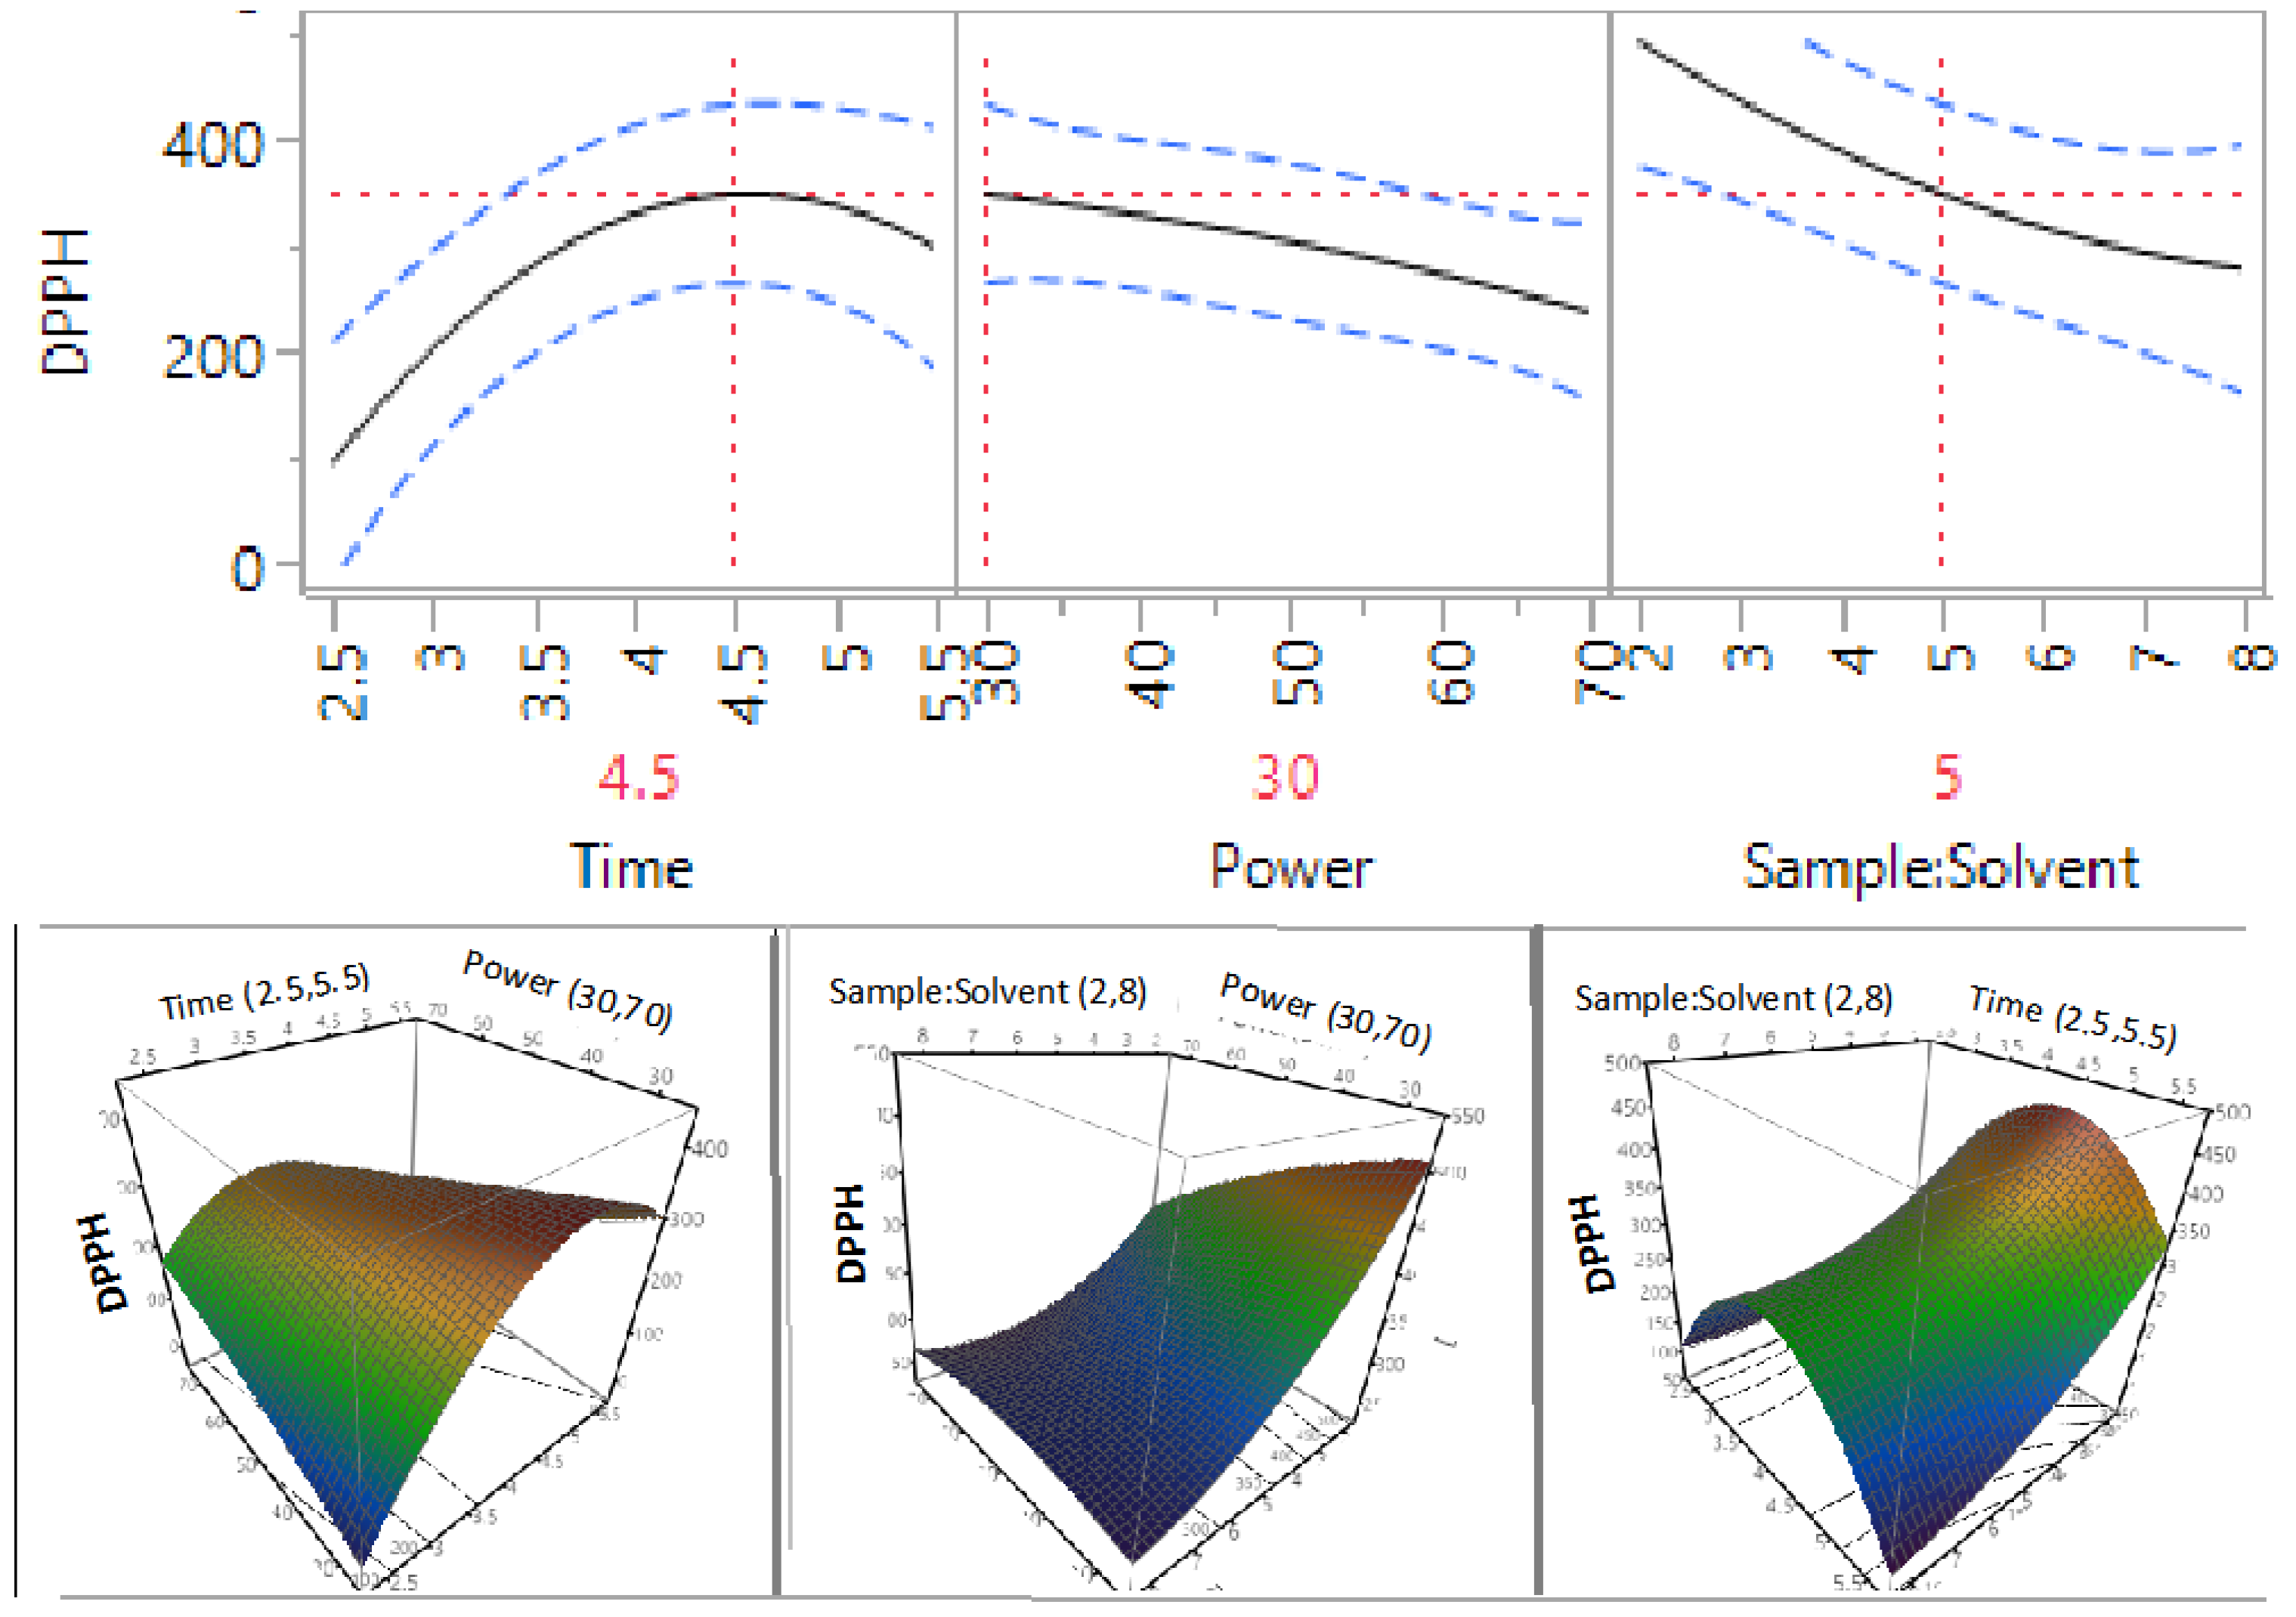
3.3. Effect of Extraction Independent Variables on the Antioxidant Capacity of Macadamia Tetraphylla Skin
| Parameter | DF | ABTS | DPPH | CUPRAC | FRAP | ||||
|---|---|---|---|---|---|---|---|---|---|
| Estimate | Prob > |t| | Estimate | Prob > |t| | Estimate | Prob > |t| | Estimate | Prob>|t| | ||
| β0 | 1 | 323.27 | 0.0002 * | 318.49 | 0.0001 * | 592.38 | 0.0004 * | 82.93 | 0.0003* |
| β1 | 1 | 20.70 | 0.3471 | 21.91 | 0.2828 | 37.22 | 0.4303 | 12.59 | 0.0765 |
| β2 | 1 | −52.63 | 0.0461 * | −29.54 | 0.1656 | −32.20 | 0.4916 | −14.56 | 0.0498 * |
| β3 | 1 | −70.44 | 0.0167 * | −74.33 | 0.0095 * | −72.19 | 0.1572 | −5.79 | 0.3531 |
| β12 | 1 | −126.42 | 0.0065 * | −79.34 | 0.0274 * | −108.36 | 0.1378 | −16.93 | 0.088 |
| β13 | 1 | −12.44 | 0.6778 | −23.26 | 0.4079 | 6.64 | 0.9181 | 6.26 | 0.4695 |
| β23 | 1 | 41.21 | 0.204 | 25.51 | 0.3673 | 28.89 | 0.6578 | 15.18 | 0.1163 |
| β11 | 1 | −122.97 | 0.0086 * | −134.60 | 0.004 * | −213.63 | 0.0205 * | −20.69 | 0.0555 |
| β22 | 1 | 23.08 | 0.4675 | −11.09 | 0.6963 | −76.77 | 0.2834 | −12.30 | 0.1997 |
| β33 | 1 | −6.30 | 0.8387 | 36.33 | 0.2333 | 91.13 | 0.2131 | 11.34 | 0.2316 |
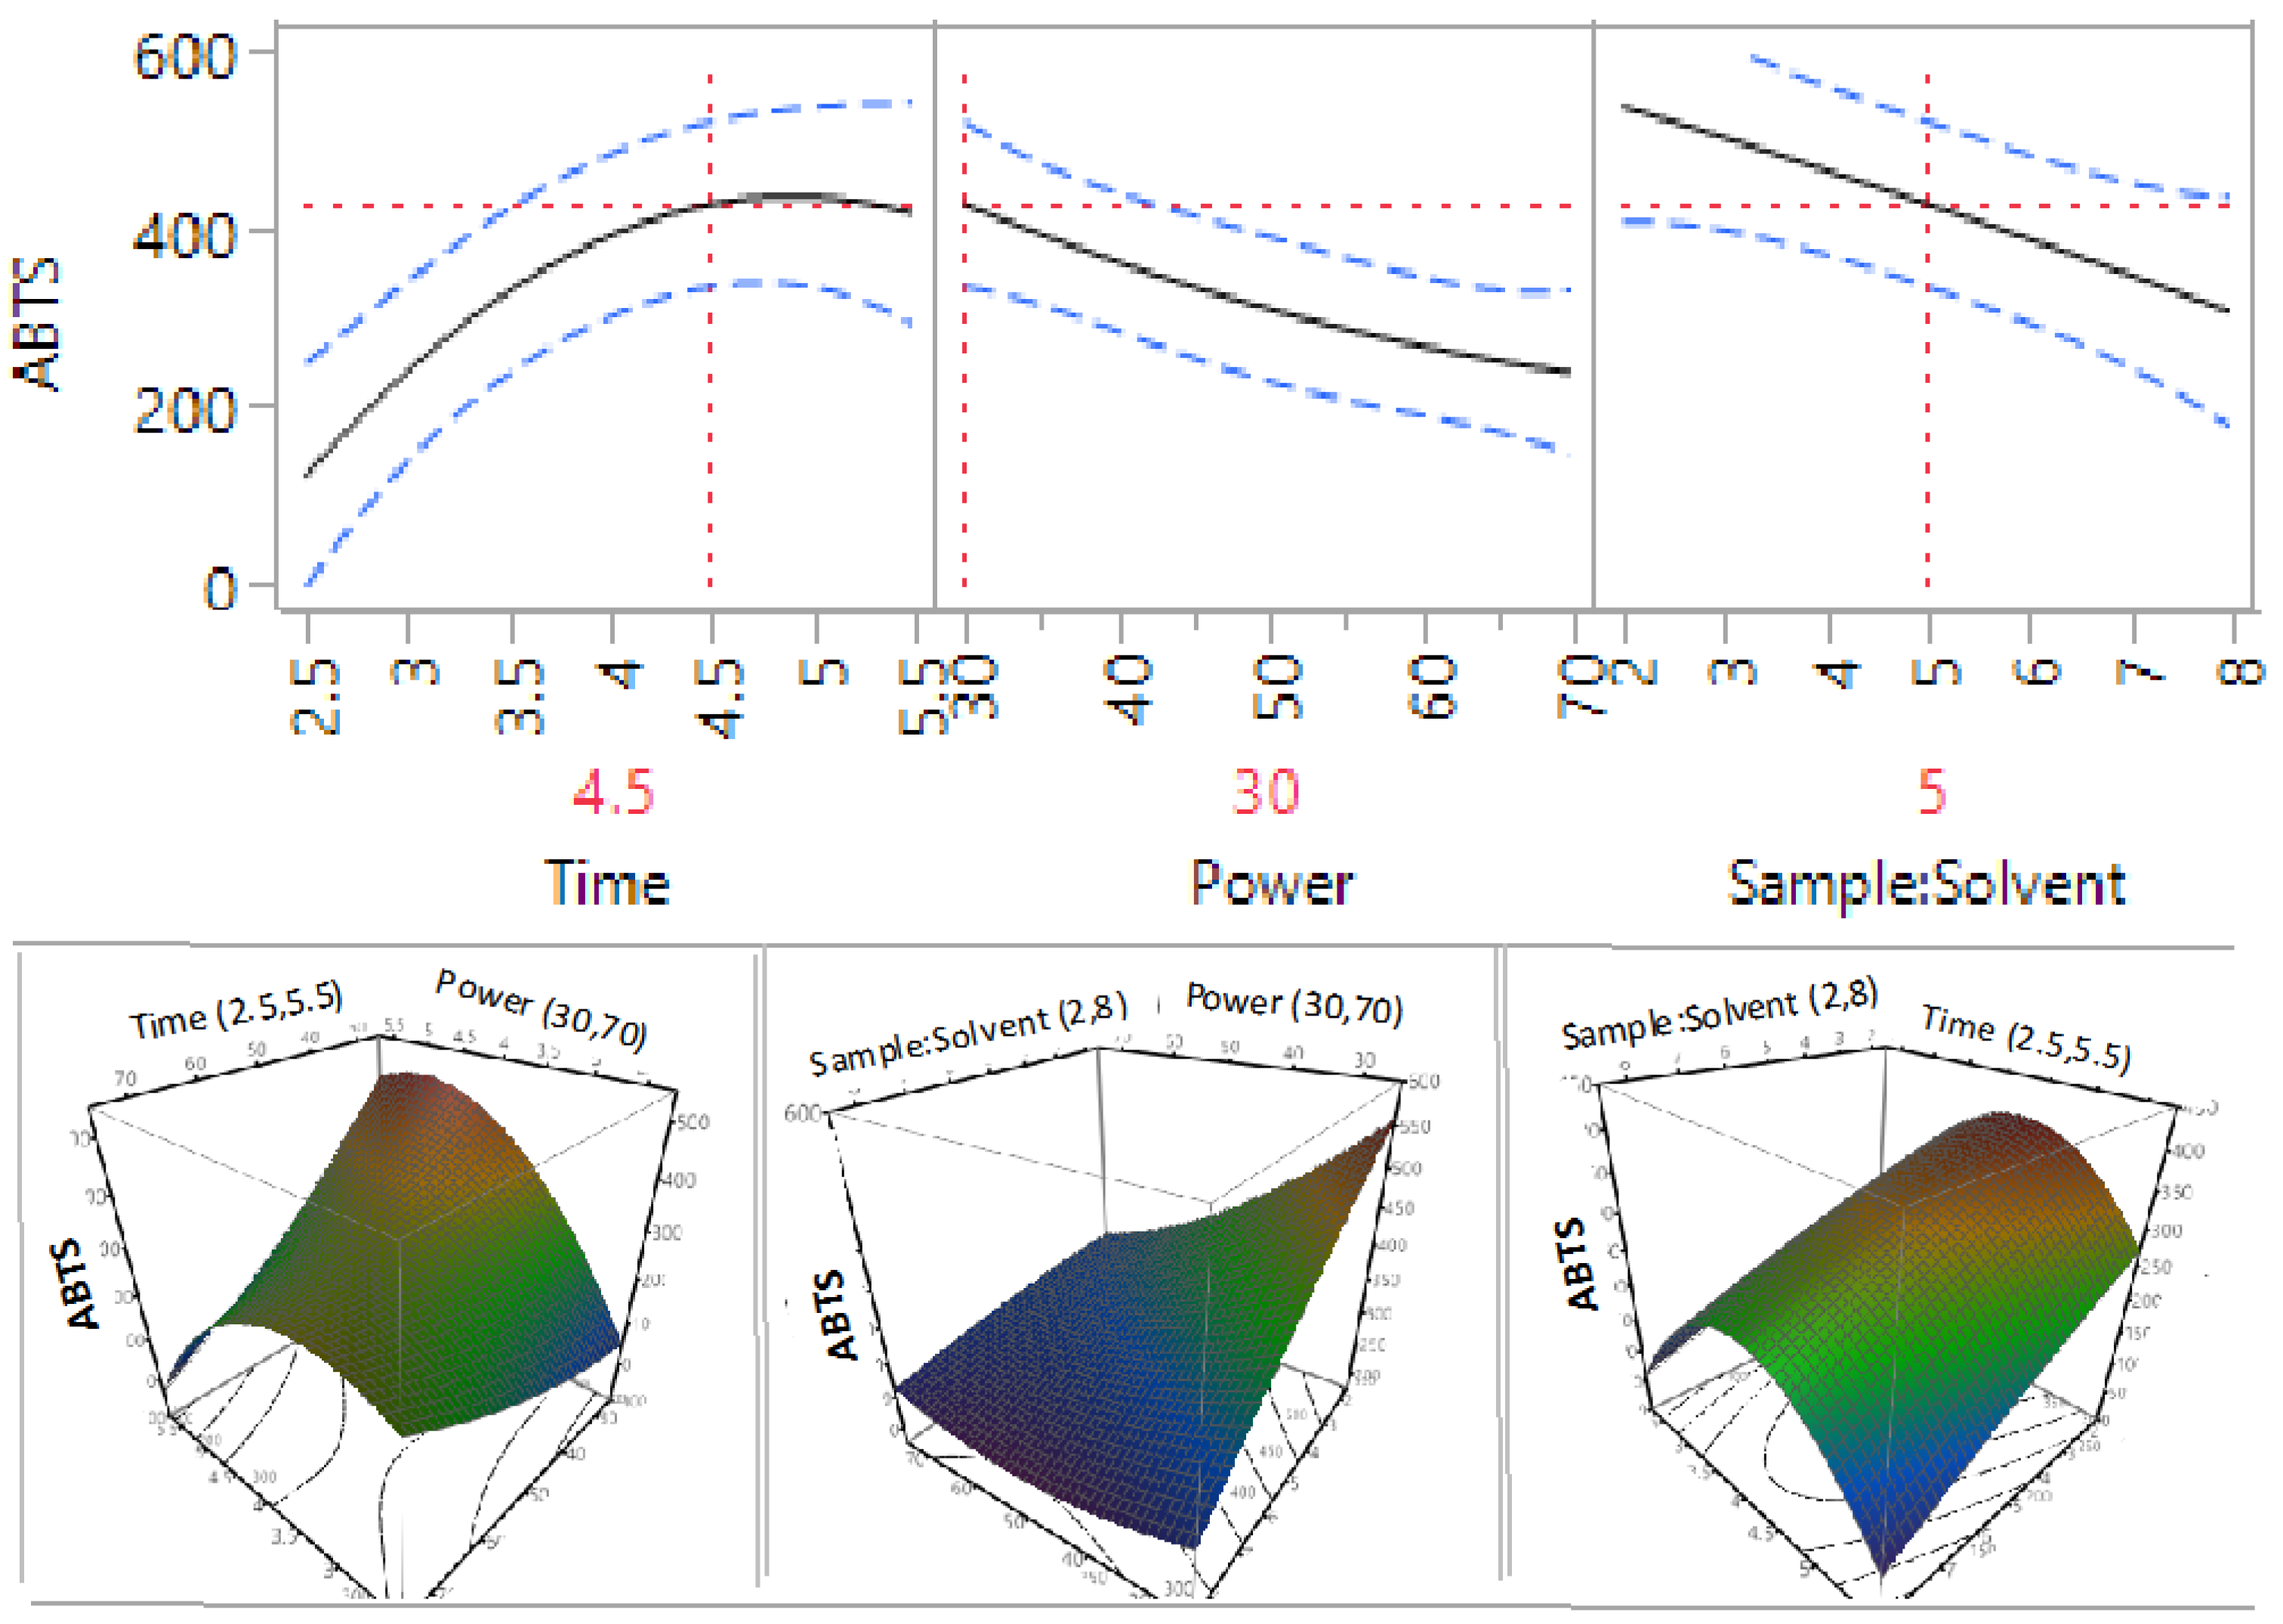

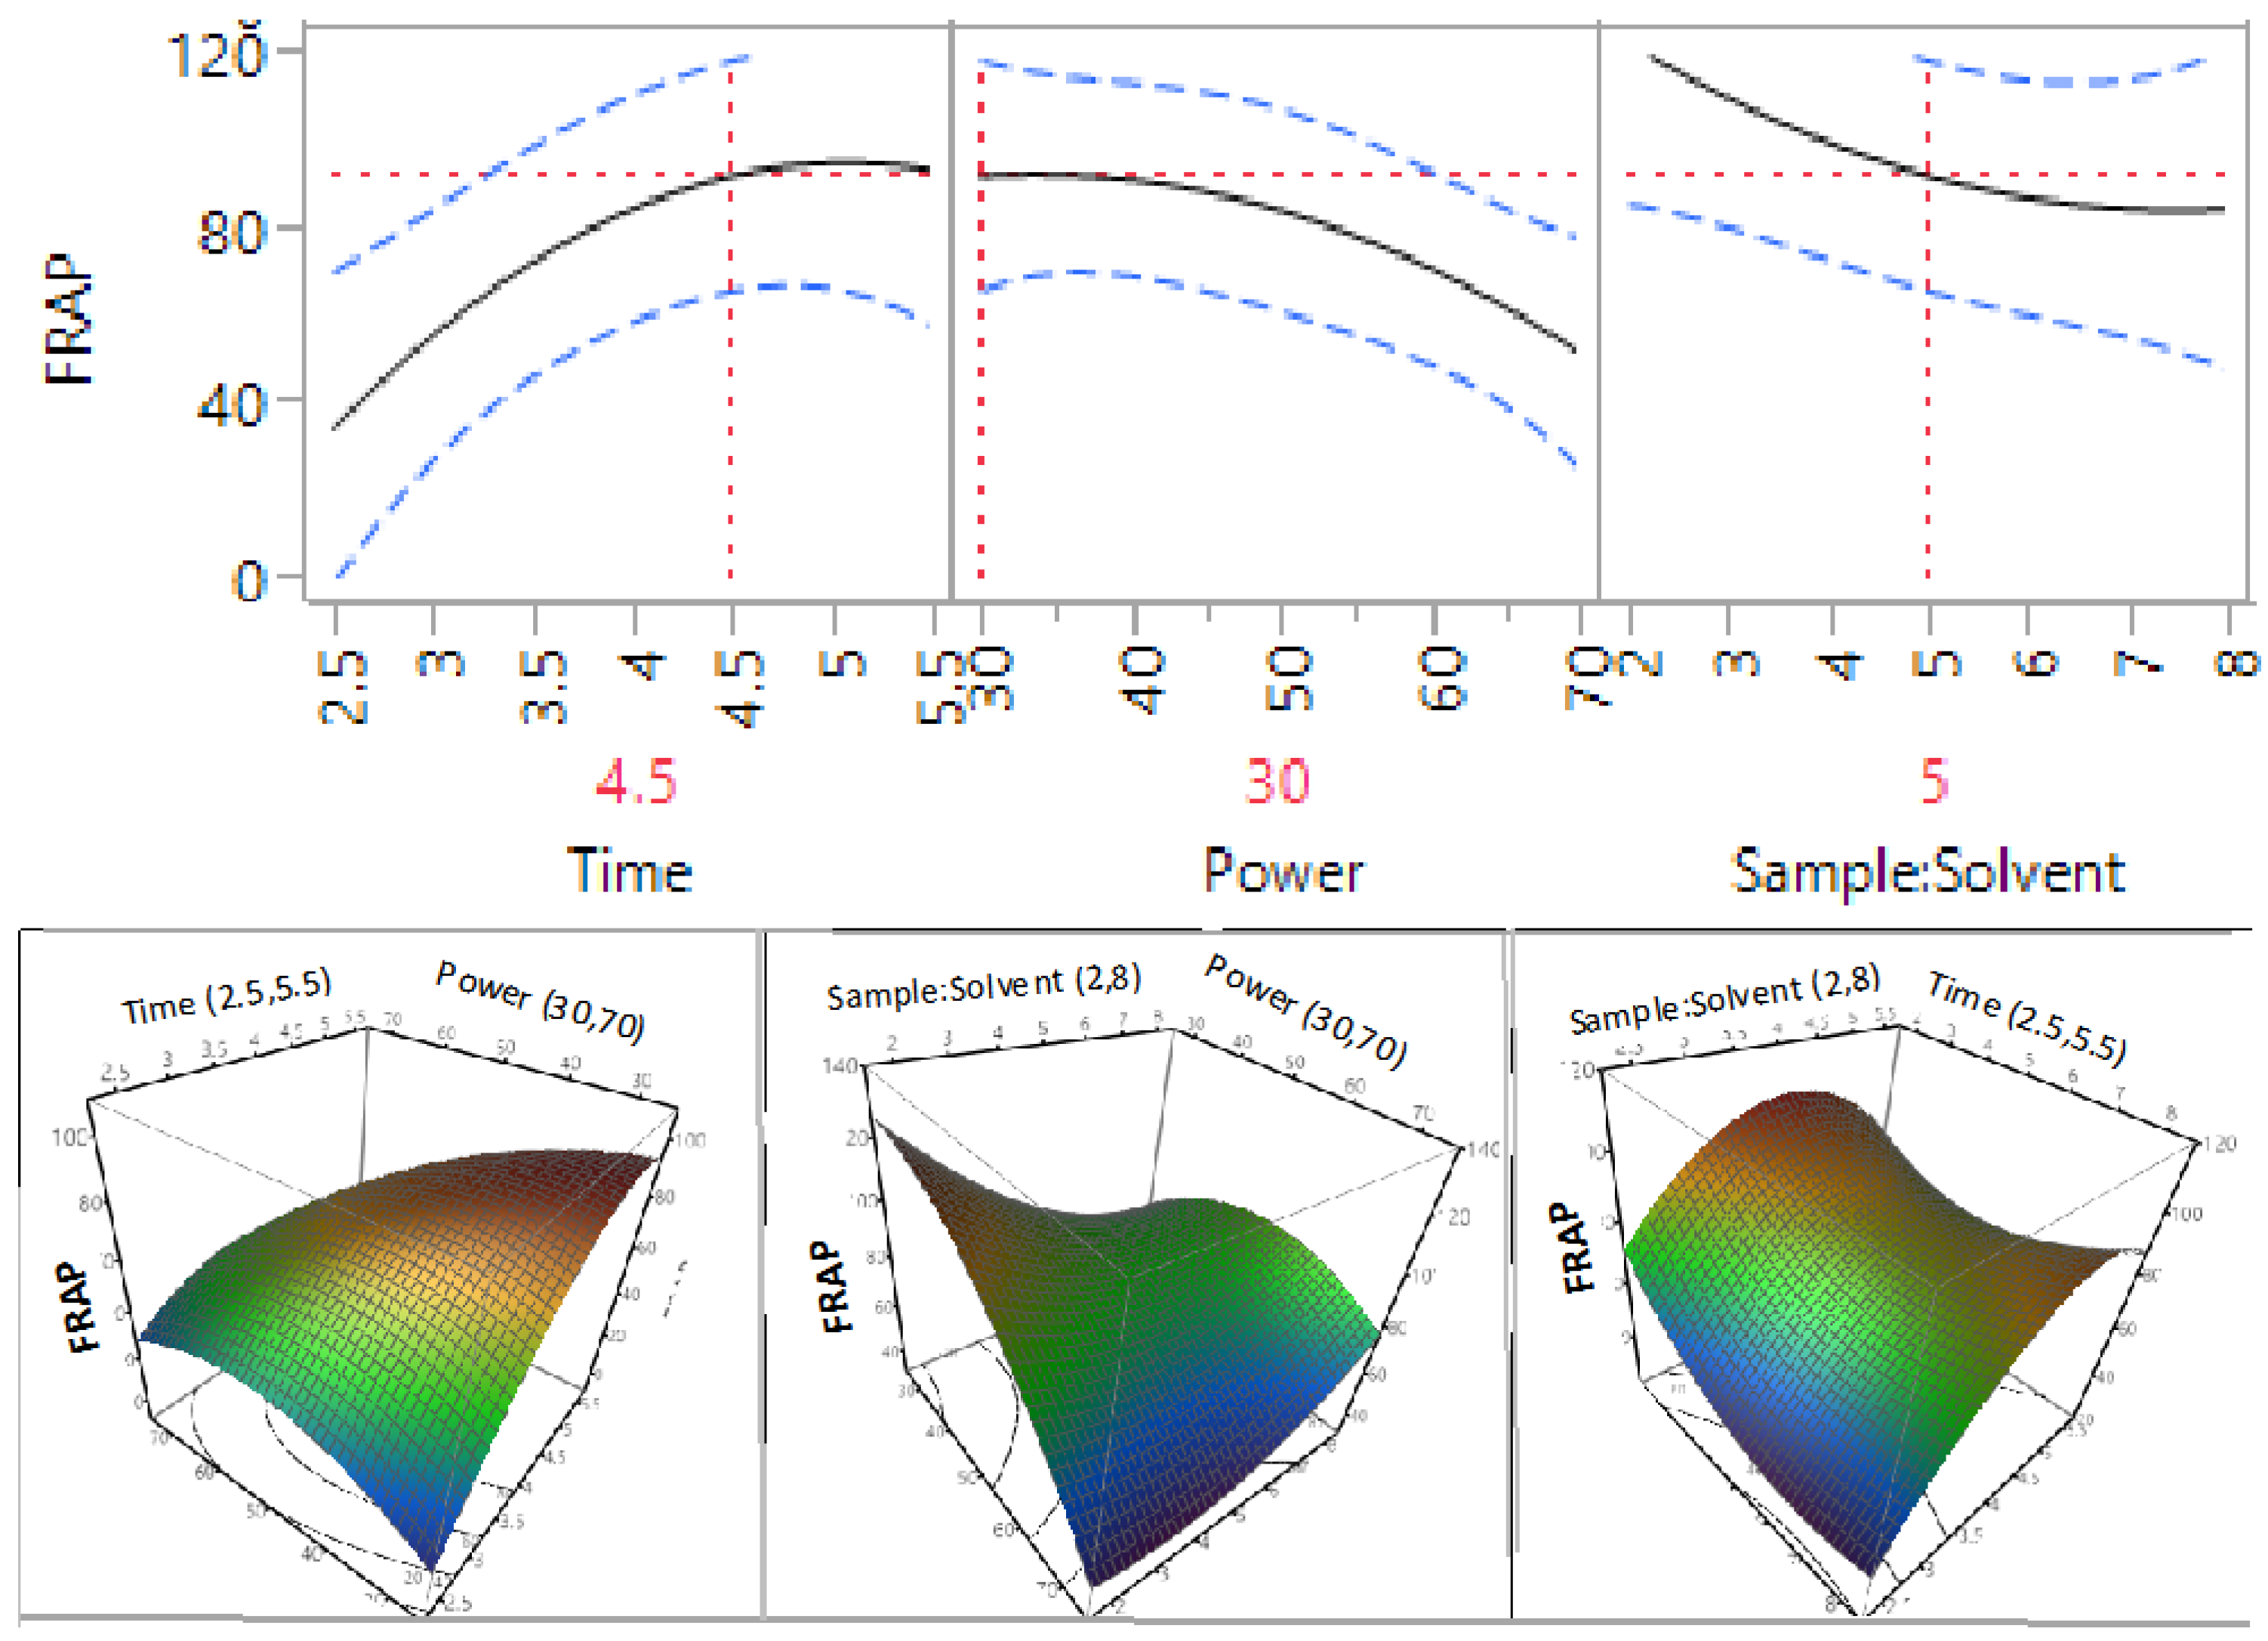
3.4. Optimisation and Validation of Microwave Extraction Conditions
| Values | ||
|---|---|---|
| Predicted | Experimental (n = 3) | |
| TPC (mg GAE/g) | 51.13 ± 13.86 a | 44.75 ± 2.34 a |
| Flavonoids (mg RE/g) | 28.08 ± 6.64 a | 29.10 ± 1.04 a |
| Proanthocyanidins (mg GAE/g) | 22.95 ± 3.05 a | 33.60 ± 0.48 b |
| ABTS (µM TE/g) | 434.36 ± 92.71 a | 361.60 ± 14.22 a |
| DPPH (µM TE/g) | 355.74 ± 84.61 a | 292.78 ± 17.63 a |
| CUPRAC (µM TE/g) | 572.60 ± 201.70 a | 459.80 ± 51.75 a |
| FRAP (µM TE/g) | 92.73 ± 26.29 b | 297.03 ± 24.74 b |
4. Conclusions
Acknowledgments
Author Contributions
Conflicts of Interest
References
- Baiano, A. Recovery of biomolecules from food wastes—A review. Molecules 2014, 19, 14821–14842. [Google Scholar] [CrossRef] [PubMed]
- Laufenberg, G.; Kunz, B.; Nystroem, M. Transformation of vegetable waste into value added products: (A) the upgrading concept; (B) practical implementations. Bioresour. Technol. 2003, 87, 167–198. [Google Scholar] [CrossRef]
- Munro, I.A.; Garg, M.L. Nutrient composition and health beneficial effects of macadamia nuts. In Tree Nuts; CRC Press: Boca Raton, FL, USA, 2008. [Google Scholar]
- Australian-Macadamia-Society. The Macadamia Industry. Available online: http://www.australian-macadamias.org/industry/about-aussie-macadamias/the-macadamia-industry?lang=en (accessed on 11 November 2015).
- Poinern, G.E.J.; Senanayake, G.; Shah, N.; Thi-Le, X.N.; Parkinson, G.M.; Fawcett, D. Adsorption of the aurocyanide, complex on granular activated carbons derived from macadamia nut shells—A preliminary study. Miner. Eng. 2011, 24, 1694–1702. [Google Scholar] [CrossRef]
- Wechsler, A.; Ramirez, M.; Crosky, A.; Zaharia, M.; Jones, H.; Ballerini, A.; Nunez, M.; Sahajwalla, V. Physcial properties of furniture panels from macadamia shells. In Proceedings of the 18th International Conferences on Composite Materials, Jeju Island, Korea, 21–26 August 2011.
- Apak, R.; Güçlü, K.; Demirata, B.; Özyürek, M.; Çelik, S.; Bektaşoğlu, B.; Berker, K.; Özyurt, D. Comparative evaluation of various total antioxidant capacity assays applied to phenolic compounds with the cuprac assay. Molecules 2007, 12, 1496–1547. [Google Scholar] [CrossRef] [PubMed]
- Bernal, J.; Mendiola, J.A.; Ibáñez, E.; Cifuentes, A. Advanced analysis of nutraceuticals. J. Pharm. Biomed. Anal. 2011, 55, 758–774. [Google Scholar] [CrossRef] [PubMed]
- Arcan, I.; Yemenicioğlu, A. Incorporating phenolic compounds opens a new perspective to use zein films as flexible bioactive packaging materials. Food Res. Int. 2011, 44, 550–556. [Google Scholar] [CrossRef]
- Huang, W.Y.; Cai, Y.Z.; Zhang, Y. Natural phenolic compounds from medicinal herbs and dietary plants: Potential use for cancer prevention. Nutr. Cancer 2009, 62, 1–20. [Google Scholar] [CrossRef] [PubMed]
- Kammerer, D.R.; Kammerer, J.; Valet, R.; Carle, R. Recovery of polyphenols from the by-products of plant food processing and application as valuable food ingredients. Food Res. Int. 2014, 65, 2–12. [Google Scholar] [CrossRef]
- Bhuyan, D.J.; van Vuong, Q.; Chalmers, A.C.; van Altena, I.A.; Bowyer, M.C.; Scarlett, C.J. Microwave-assisted extraction of eucalyptus robusta leaf for the optimal yield of total phenolic compounds. Ind. Crops Prod. 2015, 69, 290–299. [Google Scholar] [CrossRef]
- Santana, C.M.; Ferrera, Z.S.; Padrón, M.E.T.; Rodríguez, J.J.S. Methodologies for the extraction of phenolic compounds from environmental samples: New approaches. Molecules 2009, 14, 298–320. [Google Scholar] [CrossRef] [PubMed]
- Karabegović, I.T.; Stojičević, S.S.; Veličković, D.T.; Nikolić, N.Č.; Lazić, M.L. Optimization of microwave-assisted extraction and characterization of phenolic compounds in cherry laurel (Prunus laurocerasus) leaves. Sep. Purif. Technol. 2013, 120, 429–436. [Google Scholar] [CrossRef]
- Qu, W.; Shi, S.; Li, P.; Pan, Z.; Venkitasamy, C. Extraction kinetics and properties of proanthocyanidins from pomegranate peel. Int. J. Food Eng. 2014, 10, 683–695. [Google Scholar] [CrossRef]
- Meyers, R.H.; Montgomery, D.C. Response Surface Methodology: Process and Product Optimization Using Designed Experiments, 2nd ed.; Wiley: New York, NY, USA, 2002. [Google Scholar]
- Vuong, Q.V.; Stathopoulos, C.E.; Golding, J.B.; Nguyen, M.H.; Roach, P.D. Optimum conditions for the water extraction of l-theanine from green tea. J. Sep. Sci. 2011, 34, 2468–2474. [Google Scholar] [CrossRef] [PubMed]
- Vuong, Q.; Goldsmith, C.; Dang, T.; Nguyen, V.; Bhuyan, D.; Sadeqzadeh, E.; Scarlett, C.; Bowyer, M. Optimisation of ultrasound-assisted extraction conditions for phenolic content and antioxidant capacity from euphorbia tirucalli using response surface methodology. Antioxidants 2014, 3, 604–617. [Google Scholar] [CrossRef]
- Zhishen, J.; Mengcheng, T.; Jianming, W. The determination of flavonoid contents in mulberry and their scavenging effects on superoxide radicals. Food Chem. 1999, 64, 555–559. [Google Scholar] [CrossRef]
- Li, Y.; Guo, C.; Yang, J.; Wei, J.; Xu, J.; Cheng, S. Evaluation of antioxidant properties of pomegranate peel extract in comparison with pomegranate pulp extract. Food Chem. 2006, 96, 254–260. [Google Scholar] [CrossRef]
- Thaipong, K.; Boonprakob, U.; Crosby, K.; Cisneros-Zevallos, L.; Hawkins Byrne, D. Comparison of ABTS, DPPH, FRAP, and ORAC assays for estimating antioxidant activity from guava fruit extracts. J. Food Compos. Anal. 2006, 19, 669–675. [Google Scholar] [CrossRef]
- Kamonwannasit, S.; Nantapong, N.; Kumkrai, P.; Luecha, P.; Kupittayanant, S.; Chudapongse, N. Antibacterial activity of Aquilaria crassna leaf extract against Staphylococcus epidermidis by disruption of cell wall. Ann. Clin. Microbiol. Antimicrob. 2013, 12, 20. [Google Scholar] [CrossRef] [PubMed]
- Apak, R.; Güçlü, K.; Özyürek, M.; Karademir, S.E. Novel total antioxidant capacity index for dietary polyphenols and vitamins C and E, using their cupric ion reducing capability in the presence of neocuproine: CUPRAC method. J. Agric. Food Chem. 2004, 52, 7970–7981. [Google Scholar] [CrossRef] [PubMed]
- JMP. Regression Reports. Available online: http://www.jmp.com/support/help/Regression_Reports.shtml (accessed on 28 October 2015).
- Haddadi-Guemghar, H.; Janel, N.; Dairou, J.; Remini, H.; Madani, K. Optimisation of microwave-assisted extraction of prune (Prunus domestica) antioxidants by response surface methodology. Int. J. Food Sci. Technol. 2014, 49, 2158–2166. [Google Scholar] [CrossRef]
- Bai, X.-L.; Yue, T.-L.; Yuan, Y.-H.; Zhang, H.-W. Optimization of microwave-assisted extraction of polyphenols from apple pomace using response surface methodology and HPLC analysis. J. Sep. Sci. 2010, 33, 3751–3758. [Google Scholar] [CrossRef] [PubMed]
- Ince, A.E.; Şahin, S.; Şümnü, S.G. Extraction of phenolic compounds from melissa using microwave and ultrasound. Turk. J. Agric. For. 2013, 37, 69–75. [Google Scholar]
- Pisoschi, A.M.; Negulescu, G.P. Methods for total antioxidant activity determination: A review. Biochem. Anal. Biochem. 2011, 1, 1–5. [Google Scholar] [CrossRef]
- Prior, R.L.; Wu, X.; Schaich, K. Standardized methods for the determination of antioxidant capacity and phenolics in foods and dietary supplements. J. Agric. Food Chem. 2005, 53, 4290–4302. [Google Scholar] [CrossRef] [PubMed]
- Alasalvar, C.; Shahidi, F. Natural antioxidants in tree nuts. Eur. J. Lipid Sci. Technol. 2009, 111, 1056–1062. [Google Scholar] [CrossRef]
- Yang, J. Brazil nuts and associated health benefits: A review. LWT Food Sci. Technol. 2009, 42, 1573–1580. [Google Scholar] [CrossRef]
- Dailey, A.; Vuong, Q.V. Optimization of aqueous extraction conditions for recovery of phenolic content and antioxidant properties from macadamia (Macadamia tetraphylla) skin waste. Antioxidants 2015, 4, 699–718. [Google Scholar]
© 2015 by the authors; licensee MDPI, Basel, Switzerland. This article is an open access article distributed under the terms and conditions of the Creative Commons by Attribution (CC-BY) license (http://creativecommons.org/licenses/by/4.0/).
Share and Cite
Dailey, A.; Vuong, Q.V. Optimum Conditions for Microwave Assisted Extraction for Recovery of Phenolic Compounds and Antioxidant Capacity from Macadamia (Macadamia tetraphylla) Skin Waste Using Water. Processes 2016, 4, 2. https://doi.org/10.3390/pr4010002
Dailey A, Vuong QV. Optimum Conditions for Microwave Assisted Extraction for Recovery of Phenolic Compounds and Antioxidant Capacity from Macadamia (Macadamia tetraphylla) Skin Waste Using Water. Processes. 2016; 4(1):2. https://doi.org/10.3390/pr4010002
Chicago/Turabian StyleDailey, Adriana, and Quan V. Vuong. 2016. "Optimum Conditions for Microwave Assisted Extraction for Recovery of Phenolic Compounds and Antioxidant Capacity from Macadamia (Macadamia tetraphylla) Skin Waste Using Water" Processes 4, no. 1: 2. https://doi.org/10.3390/pr4010002
APA StyleDailey, A., & Vuong, Q. V. (2016). Optimum Conditions for Microwave Assisted Extraction for Recovery of Phenolic Compounds and Antioxidant Capacity from Macadamia (Macadamia tetraphylla) Skin Waste Using Water. Processes, 4(1), 2. https://doi.org/10.3390/pr4010002