1. Introduction
With the continuous expansion of hydrocarbon exploration toward deeper subsurface domains, deep and ultra-deep petroleum resources have become a strategic frontier for sustaining long-term energy supply [
1]. In recent years, several large-scale discoveries have been reported in major Chinese petroliferous basins, including the Tarim Basin, Sichuan Basin, and Junggar Basin, highlighting the considerable resource potential of deep petroleum systems. In petroleum engineering practice, wells with burial depths of 4500–6000 m are generally classified as deep wells, whereas those exceeding 6000 m are defined as ultra-deep wells [
2]. As burial depth increases, formation temperature, pore pressure, and in situ stress rise significantly, posing increasingly severe challenges to wellbore stability and well control safety during drilling operations.
Accurate prediction and real-time monitoring of formation pore pressure constitute a fundamental prerequisite for drilling design and well control management. Underestimation of formation pressure may result in kick events or even catastrophic blowouts, whereas overestimation typically requires excessively high drilling fluid densities, which may induce lost circulation and cause formation damage [
3,
4]. Consequently, reliable pore pressure prediction and monitoring play a critical role in maintaining drilling safety, improving operational efficiency, and minimizing economic risks during drilling operations [
5].
A variety of methods have been developed for subsurface pore pressure estimation, including the equivalent depth method, the Eaton method, the Bowers method, and acoustic velocity-based approaches. Most of these techniques are fundamentally derived from the shale undercompaction theory and have demonstrated satisfactory performance in clastic sedimentary successions [
6]. However, their applicability to carbonate reservoirs remains limited. Carbonate formations differ fundamentally from clastic systems in terms of rock fabric, pore architecture, and diagenetic evolution. They commonly exhibit high rock strength, low matrix porosity, complex pore structures, and heterogeneous development of fractures and dissolution cavities [
7]. These characteristics lead to compaction behaviors that differ significantly from those observed in shale-dominated strata. As a result, conventional pore pressure prediction methods often perform poorly in carbonate formations, leading to large uncertainties and reduced predictive accuracy.
Recent advances in integrated mud logging technologies have enabled the acquisition of large volumes of real-time geological and engineering data during drilling operations. Measurements such as gas logging responses, cuttings-based elemental logging, and drilling engineering parameters provide valuable insights into lithological variations [
8], formation fluid characteristics, and rock mechanical properties. These multi-source datasets offer new opportunities for identifying abnormal pressure conditions during drilling. By integrating multiple types of real-time information, early warning signals of overpressure can potentially be detected during drilling, thereby significantly improving well control capability and operational safety [
9].
To address the limitations of conventional pore pressure prediction methods in carbonate formations, this study focuses on Ordovician ultra-deep carbonate reservoirs in the Tarim Basin (a specific application scope). By integrating elemental logging data, gas logging responses, and drilling engineering parameters, a comprehensive while-drilling monitoring approach for formation pore pressure is developed. The objectives of this study are to (1) analyze the mechanisms and indicators of abnormal overpressure in ultra-deep carbonate formations; (2) establish an integrated real-time monitoring framework based on multi-source drilling data with statistically validated thresholds and objective weighting; (3) evaluate the effectiveness of the proposed method through field applications and analyze misjudgment cases [
10]; and (4) clarify the application scope and boundary conditions of the method. The results aim to provide a practical methodology for improving real-time pressure prediction and reducing well control risks in ultra-deep carbonate drilling operations.
2. Geological Setting and Mechanisms of Overpressure Formation
2.1. Geological Overview of the Tarim Basin
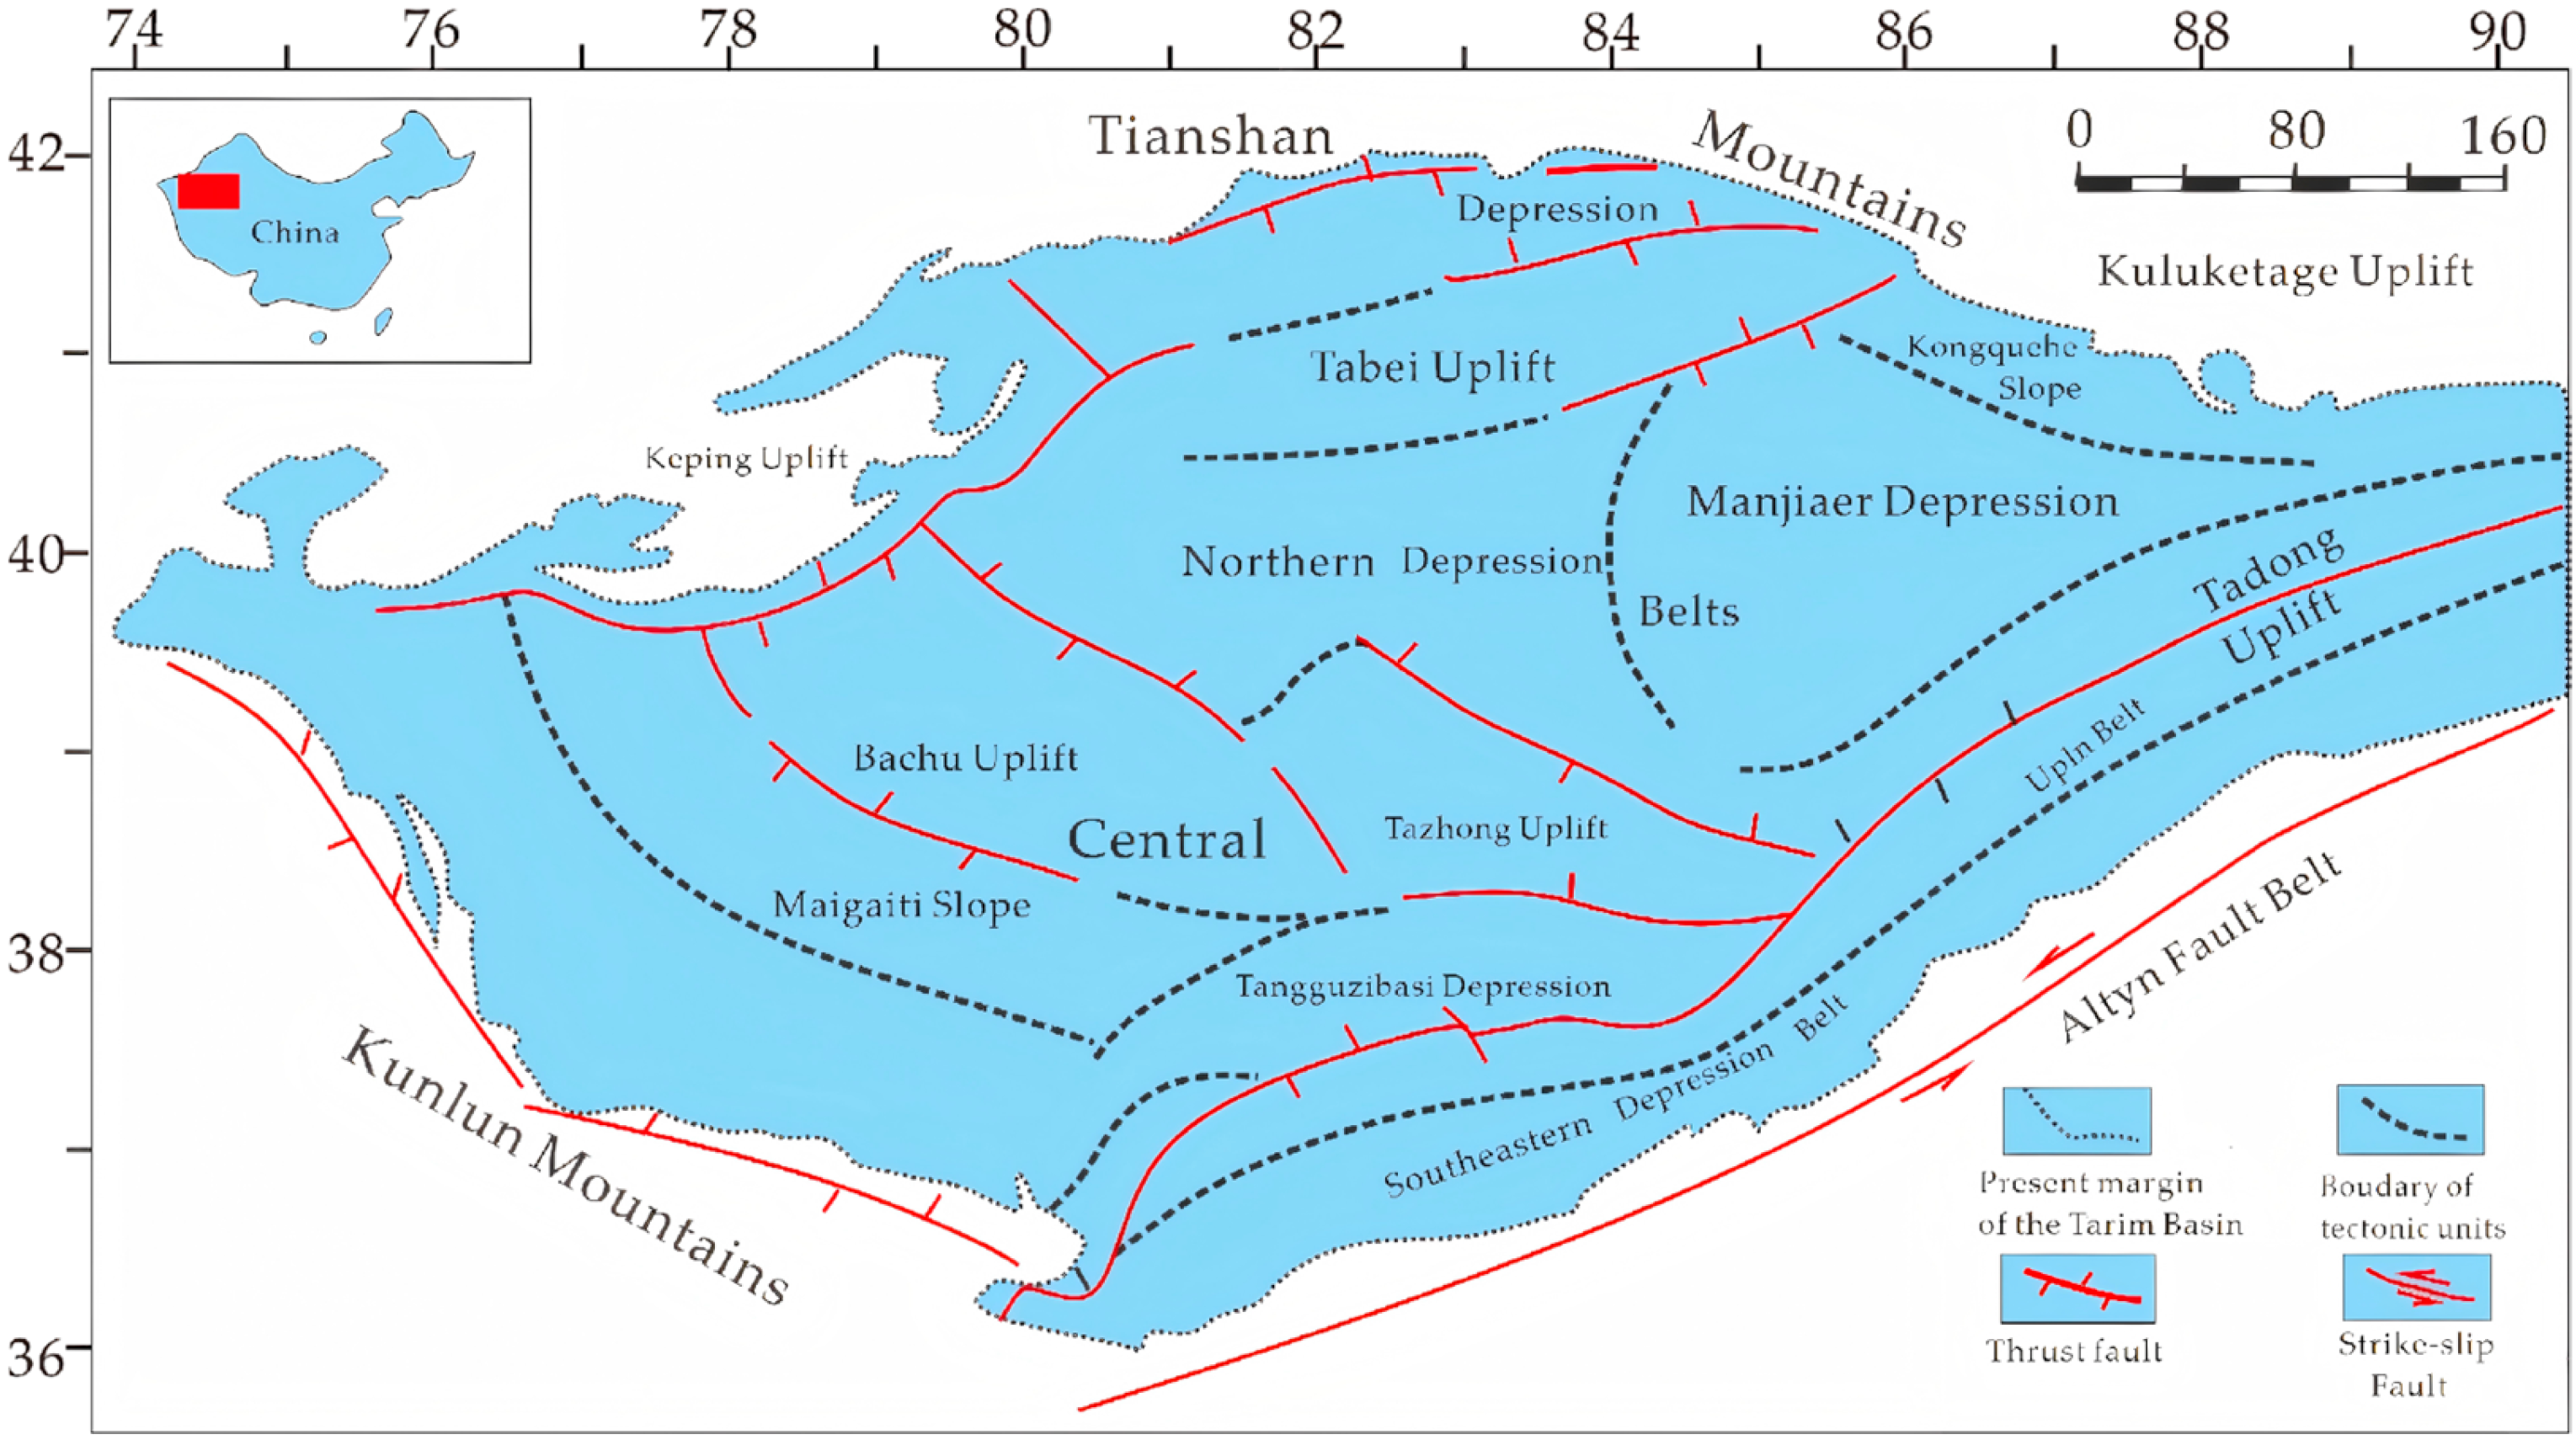
The Tarim Basin, located in Northwestern China, is the largest petroliferous basin in the country and represents one of the most important regions for deep and ultra-deep hydrocarbon exploration. Covering an area of approximately 560,000 km
2, the basin is characterized by a complex tectonic framework that has evolved through multiple tectonic stages since the Paleozoic [
11]. Structurally, the basin consists of several large-scale uplifts and depressions, including the Northern Depression, Central Uplift, and the Tabei Uplift, which together form the principal structural units controlling hydrocarbon generation, migration, and accumulation (
Figure 1).
The study area is dominated by the development of Ordovician carbonate strata that were deposited primarily in shallow marine carbonate platform environments. These carbonate successions are mainly composed of limestone and dolomite, with locally developed fracture systems and dissolution-related pores formed through long-term diagenetic modification and tectonic activity. The combined effects of fractures and karst-related dissolution significantly enhance the heterogeneity of the reservoir system and provide effective storage space for hydrocarbon accumulation [
12].
2.2. Characteristics of Carbonate Formations
The ultra-deep carbonate formations encountered in the Tarim Basin are predominantly of Ordovician age and constitute key exploration targets for deep hydrocarbon resources. These carbonate strata were mainly deposited in marine carbonate platform environments and are primarily composed of limestone and dolomite. Extensive development of fractures and dissolution cavities has resulted in the formation of typical fracture–vug carbonate reservoir systems [
13].
According to regional stratigraphic classification, several Ordovician stratigraphic units are recognized in the study area. From top to bottom, these include the Tierekeawati Formation, Sangtamu Formation, Lianglitage Formation, Qarbak Formation, Yijianfang Formation, Yingshan Formation, and Penglaiba Formation [
14]. These formations exhibit considerable variations in depositional environments, lithologic assemblages, and reservoir properties (
Table 1), reflecting the complex sedimentary evolution of the Ordovician carbonate platform.
Taking the Fuman area as an example, the Sangtamu and Qarbak formations were mainly deposited in shelf to deep-water environments and are dominated by limestone lithologies, locally showing characteristics associated with turbidite deposition. In contrast, the interval from the lower Yingshan Formation to the Penglaiba Formation underwent intensive diagenetic modification, particularly widespread dolomitization [
15]. This process promoted the development of extensive dolomite reservoirs that generally possess relatively higher porosity and improved storage capacity, thereby forming important reservoir spaces for deep hydrocarbon accumulation.
From a petrographic perspective, limestone is mainly composed of calcite and typically forms in shallow marine carbonate depositional settings [
16]. Dolomite, in contrast, is commonly generated through diagenetic dolomitization of precursor limestones, with mineral compositions dominated by dolomite and frequently accompanied by minor calcite, quartz, and clay minerals. Dolomite reservoirs commonly contain multiple types of storage space, including intercrystalline pores, dissolution pores, and fractures. The coexistence of these pore types results in pronounced reservoir heterogeneity and exerts an important control on fluid migration and hydrocarbon accumulation [
17].
2.3. Mechanisms of Abnormal Overpressure Formation
Abnormal overpressure in deep carbonate formations of the Tarim Basin is generally controlled by multiple geological processes. Among these, tectonic compression, caprock sealing, and fluid pressurization are considered the dominant mechanisms responsible for the generation and preservation of high formation pressures [
18].
- (1)
Tectonic Compression
In tectonically active regions, subsurface formations are subjected not only to the vertical stress generated by overburden loading but also to significant horizontal stresses induced by regional tectonic forces. When tectonic stress intensifies, the rock framework undergoes three-dimensional compression, resulting in progressive reduction of pore volume. Under normal compaction conditions, pore fluids can gradually escape through permeable pathways, thereby maintaining equilibrium between pore pressure and hydrostatic pressure. However, when the rate of tectonic compression or sedimentary loading exceeds the rate of fluid expulsion, pore fluids become trapped within the formation [
19]. This imbalance leads to the progressive accumulation of pore pressure and ultimately results in the development of abnormal overpressure. Compared with classical undercompaction mechanisms, tectonic compression involves the combined effects of vertical stress and two horizontal stress components. Consequently, the overpressure generated under strong tectonic compression can be significantly higher and may evolve into extreme overpressure systems.
Tectonic stress also influences the partitioning of stress between the rock framework and pore fluids. When fluid migration is restricted by effective sealing conditions, a greater proportion of external stress is transferred to pore fluids, further promoting pressure buildup. Therefore, the superposition of strong tectonic stress and efficient sealing systems constitutes a critical geological condition for the formation of intense overpressure. In carbonate formations, tectonic activity may also induce folding, faulting, and fracture development. These structural features exert a dual control on the distribution of formation pressure. On the one hand, faults may act as fluid migration pathways that facilitate pressure dissipation. On the other hand, where faults are sealed or where complex secondary fault zones develop, relatively closed fluid systems may form, favoring the accumulation and preservation of abnormal overpressure [
20].
- (2)
Caprock Sealing
Caprock sealing represents a critical condition for both the formation and long-term preservation of abnormal overpressure. In the Fuman area of the Tarim Basin, Ordovician carbonate reservoirs are commonly overlain by thick and dense limestone caprocks, particularly those associated with the Yingshan Formation. These rocks generally exhibit extremely low porosity and permeability, effectively inhibiting vertical fluid migration and forming relatively closed pressure systems.
The sealing capacity of these limestone caprocks is primarily controlled by several geological factors [
21]. First, the rocks display high lithologic compactness because they are predominantly composed of dense carbonate minerals such as calcite and dolomite, which produce a tight pore structure. Second, the caprock units typically possess very low porosity and permeability, resulting in strong resistance to fluid flow. Third, long-term burial diagenesis and carbonate cementation further reduce pore space and significantly enhance the sealing capacity of the rock. Finally, the limestone caprocks exhibit strong regional continuity and lateral persistence, which facilitates the development of stable regional sealing systems [
22].
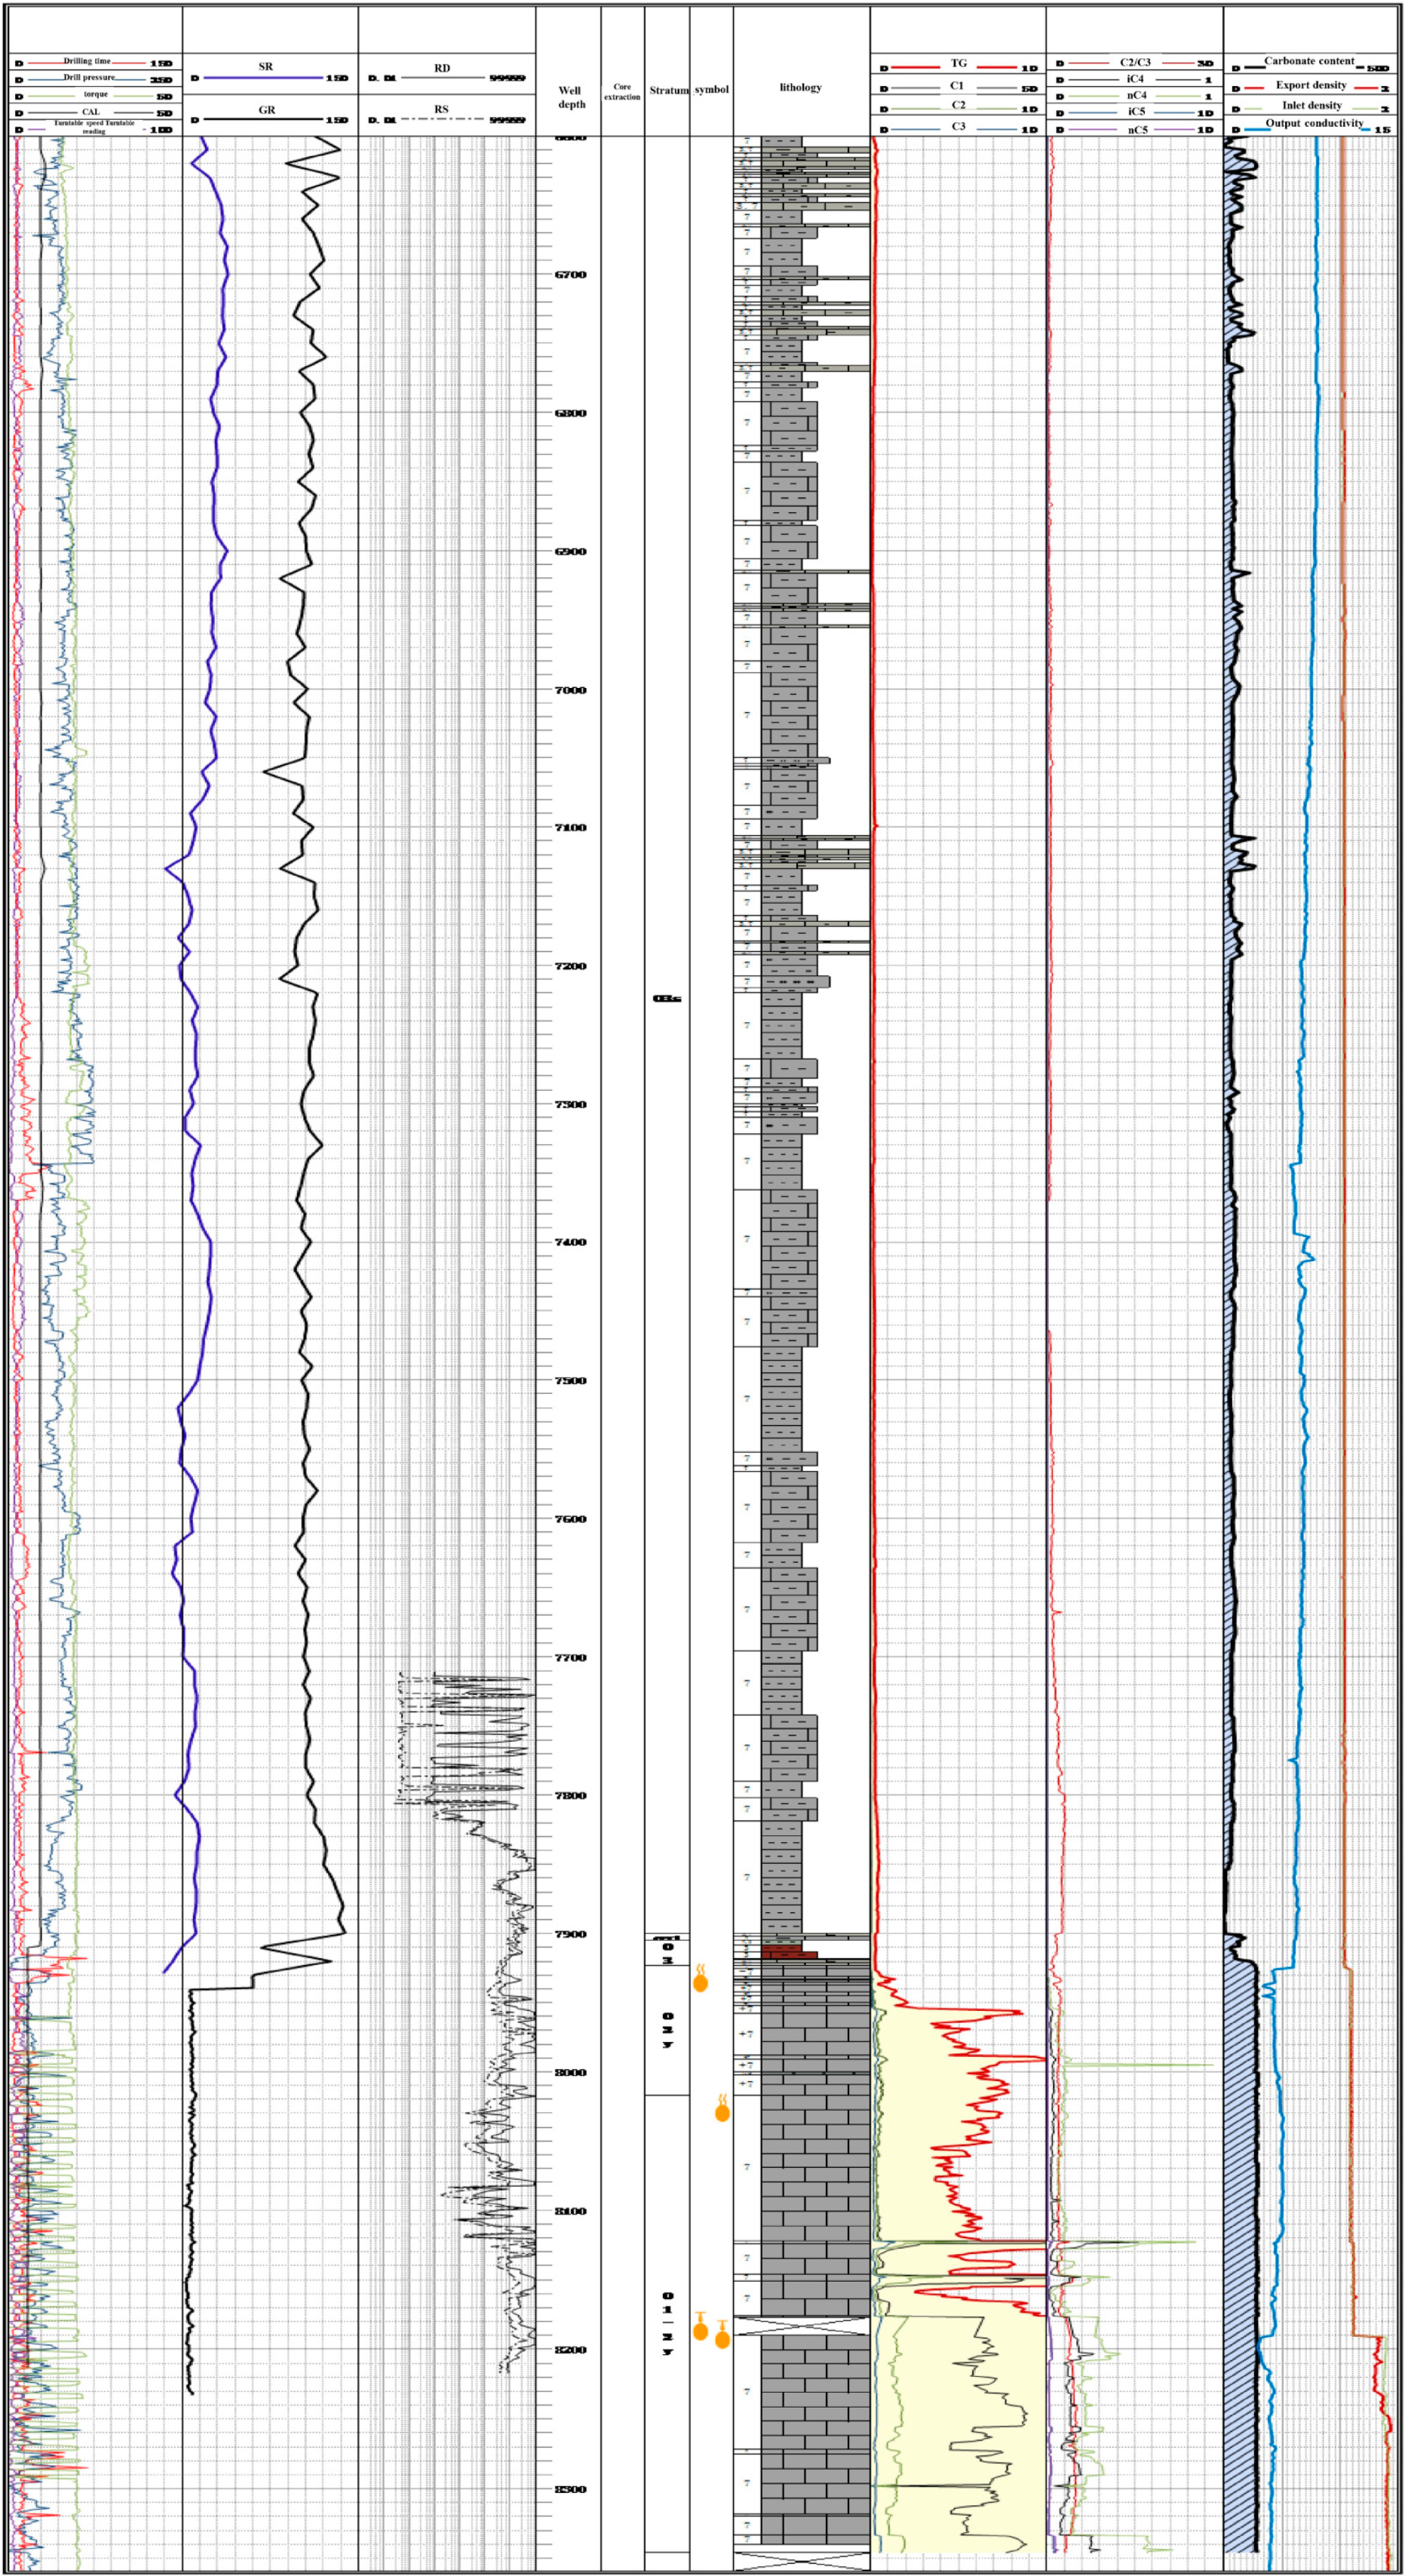
Drilling data provide direct evidence for the effectiveness of these thick carbonate caprocks. For instance, in Well Guole-1, drilling encountered a series of dense limestone intervals belonging to the Tumuxiuke, Yijianfang, and Yingshan formations, with a cumulative thickness exceeding 200 m. These dense carbonate layers exhibit typical geophysical logging responses, including low natural gamma values, low acoustic transit time, high density, and high resistivity, indicating strong lithologic compactness and excellent sealing capacity (
Figure 2) [
23].
An overflow event occurred when the well reached a depth of approximately 7500 m, further demonstrating that thick limestone caprocks play a crucial role in preserving abnormal formation pressure.
- (3)
Fluid Pressurization and Hydrothermal–Fracture Coupling
With increasing burial depth, formation temperature rises progressively, leading to thermal expansion of both the rock framework and pore fluids. Previous studies have shown that fractures in carbonate reservoirs may be filled with siliceous and argillaceous materials during hydrothermal activity and reservoir charging, forming relatively closed fluid systems [
24,
25]. Subsequent hydrothermal alteration and thermal cracking of hydrocarbons may further increase fluid volume and formation pressure, ultimately contributing to the development of high-pressure carbonate reservoirs at great burial depths [
17,
26]. Under closed or poorly connected hydraulic conditions, the thermally induced expansion of pore fluids cannot be effectively released, resulting in hydrothermal pressurization.
3. While-Drilling Indicators for Abnormal Pressure Identification
3.1. Elemental Logging Characteristics of Drill Cuttings
In ultra-deep carbonate formations, elemental logging is particularly useful for detecting lithological changes and geochemical anomalies related to abnormal pressure development. Based on published petrological and geochemical studies of carbonate reservoirs [
16,
17,
27,
28], silicon (Si), strontium (Sr), sulfur (S), aluminum (Al), magnesium (Mg), and calcium (Ca) were selected as diagnostic elements. Their geological significance and measurement units are summarized in
Table 2, which is supported by core geochemical analysis and logging calibration data [
25,
27,
28].
To improve interpretability, elemental indicators were converted into growth factors relative to background values. Specifically, Ks and Ki were used to represent the growth factors of S and Si, respectively.
Statistical validation of thresholds:
The thresholds for elemental growth factors were established using a calibration dataset of 12 historical wells drilled before the case study period. Strict sample independence was maintained: these 12 calibration wells do not overlap with the three case study wells (Fudong-101, Hade-18, and TKe-1) presented later in this paper. ROC curve analysis yielded the optimal thresholds of KS ≥ 2 and KSi > 2(AUC = 0.89, 95% CI: 0.82–0.95). These thresholds correctly identified 15 of 17 overpressure zones, corresponding to a sensitivity of 88.2%. In addition, two false alarms occurred in 16 normal-pressure zones, yielding a false positive rate of 12.5%, while two overpressure zones were missed, corresponding to a false negative rate of 11.8%.
Sensitivity analysis: When the thresholds were varied by ±10%, the prediction accuracy changed by less than 5%, indicating good robustness.
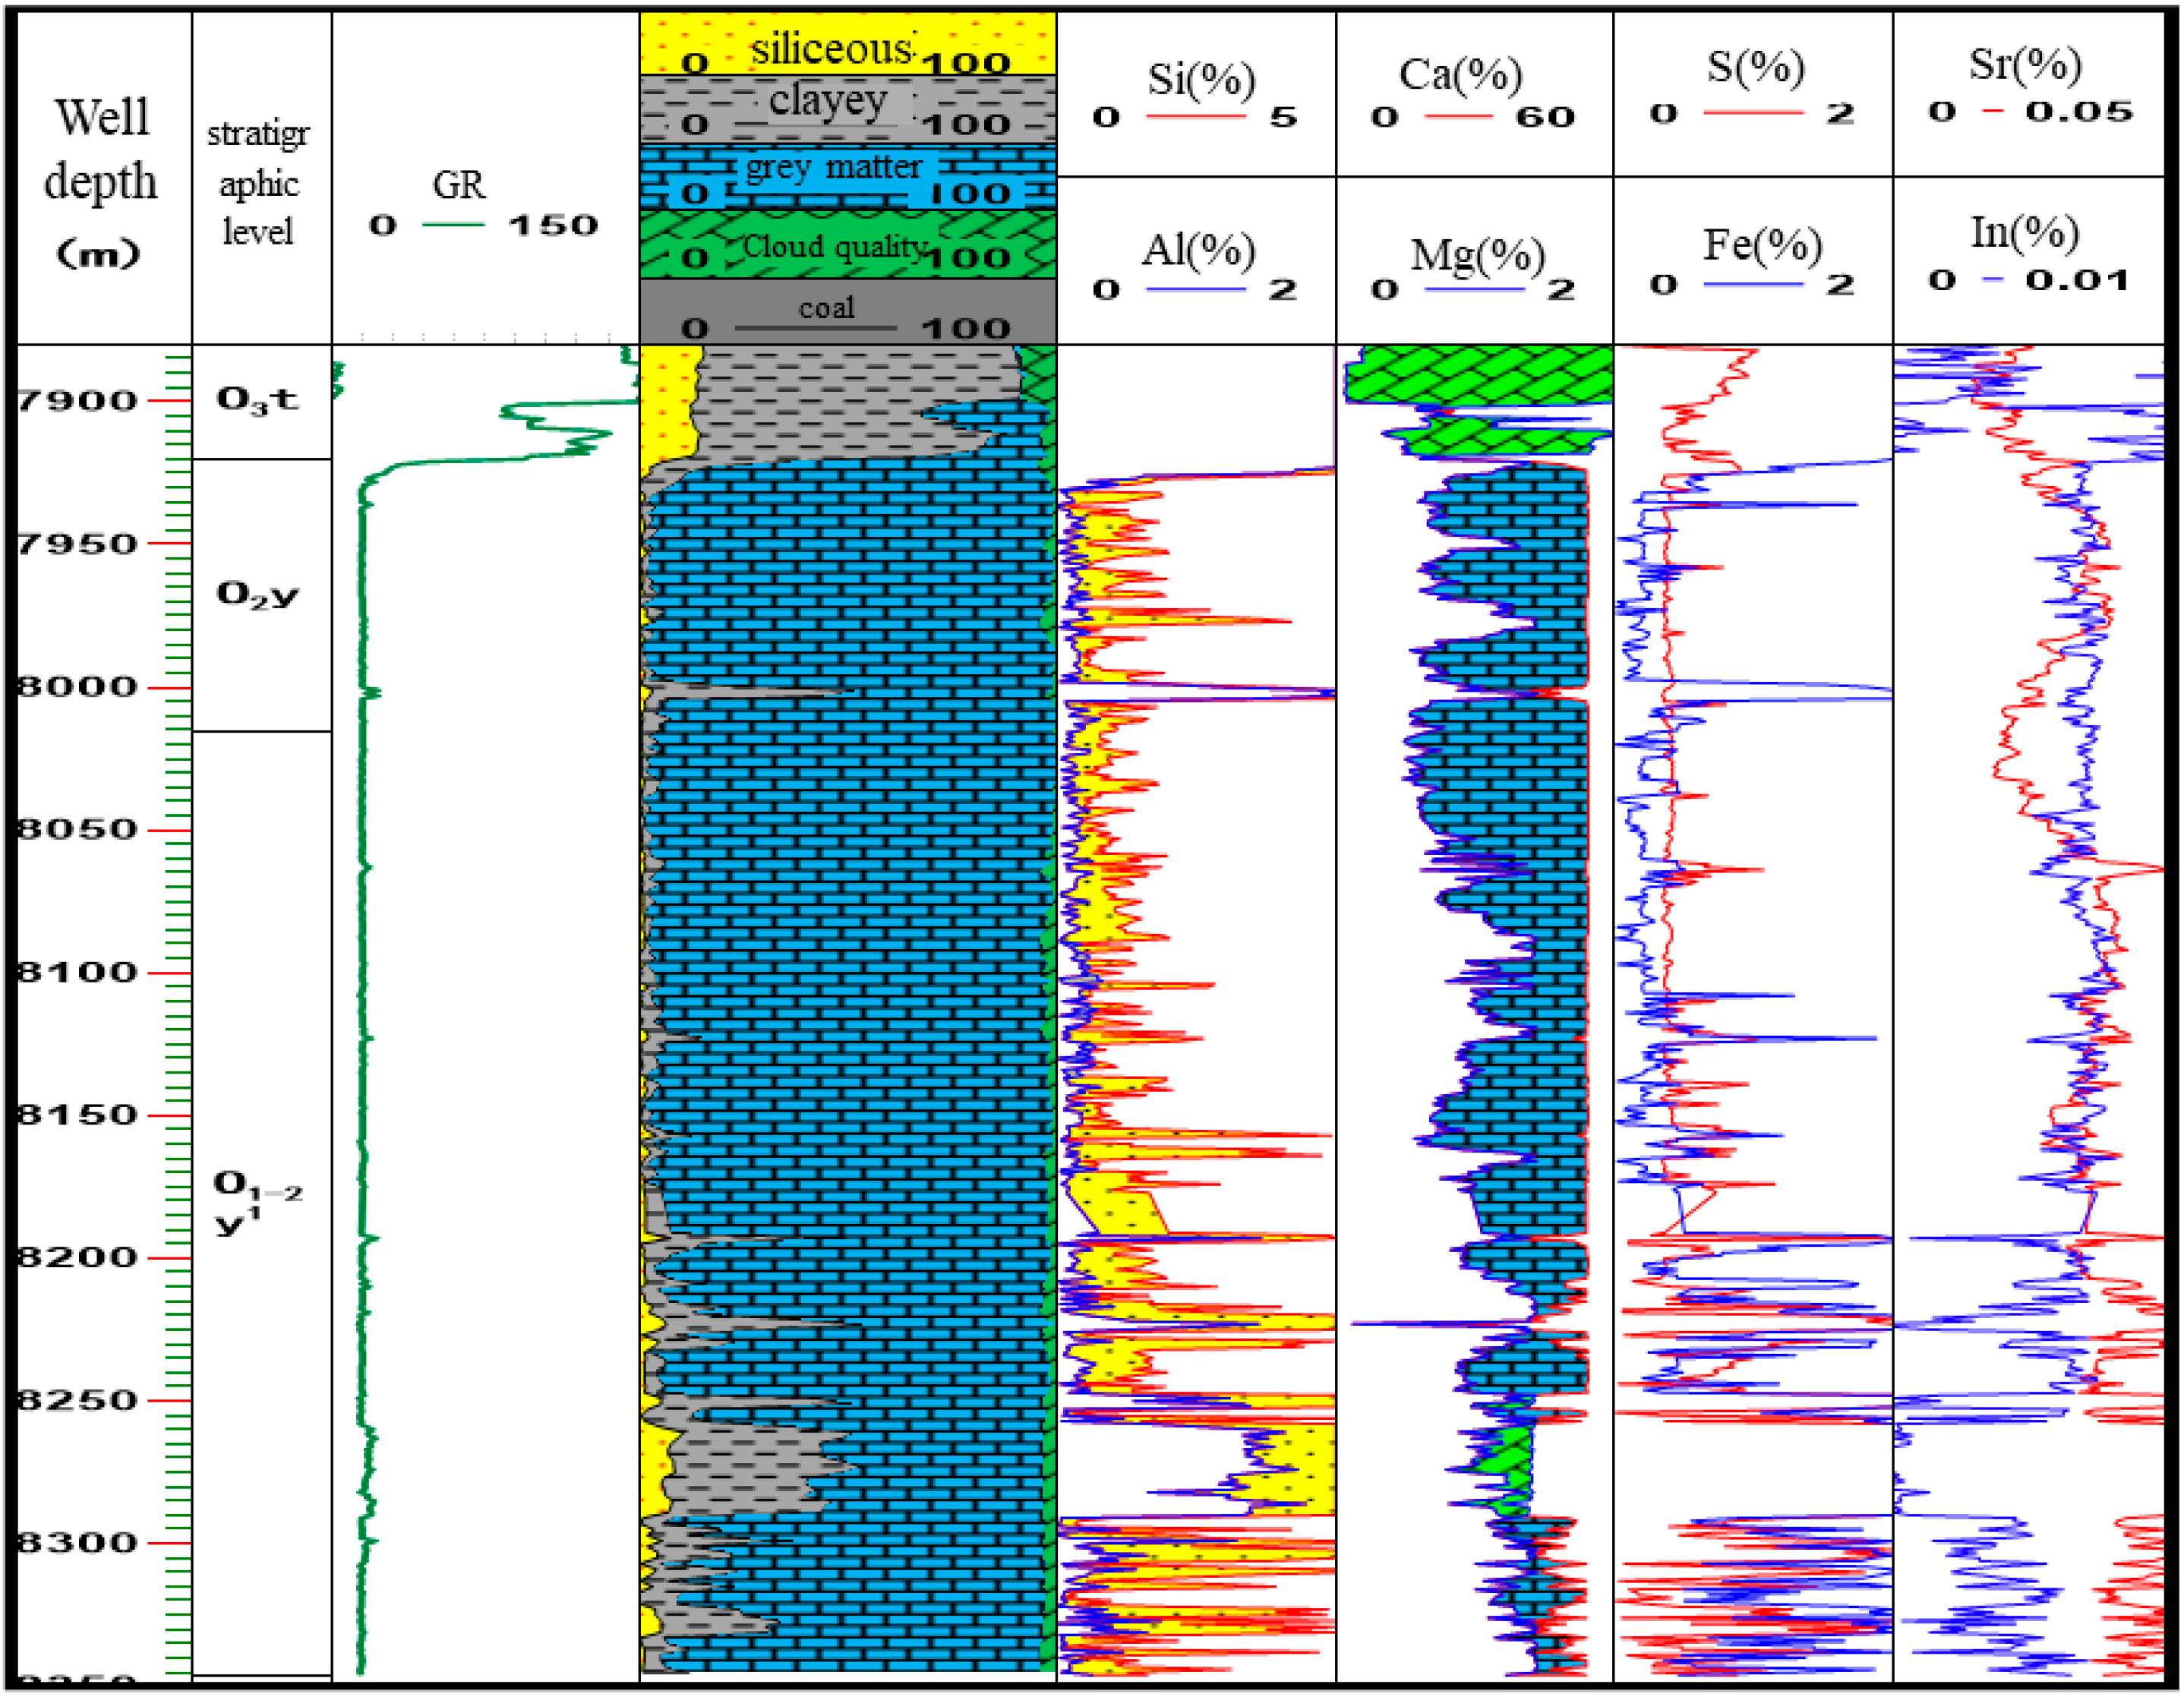
In Well Fudong-1, distinct Si anomalies were observed at depths of 8104 m, 8122 m, 8140 m, and 8156 m, where Si concentrations show sharp spike-like increases. These anomalous intervals correspond to zones where high-angle fractures associated with silicification were encountered during drilling. At the same depths, S concentrations exhibit modest but synchronous increases, indicating the possible influence of hydrothermal fluid activity (
Figure 3).
Figure 3 Comprehensive Logging Chart for Well Fudong 1
X-axis: Depth (m); Y-axis: element content (ppm);
Curve legend: Si content, S content, abnormal pressure interval;
Annotation: High-angle fracture zone, hydrothermal fluid anomaly interval.
Figure 3.
Comprehensive logging chart for Well Fudong 1.
Figure 3.
Comprehensive logging chart for Well Fudong 1.
To further improve transparency, the threshold selection was based on the observed separation between normal and abnormal intervals in the training wells and on post-drilling verification results. Future work will expand the sample size and apply statistical tools such as ROC analysis, bootstrap confidence intervals, and sensitivity analysis to quantify threshold uncertainty more rigorously.
Statistical Validation of Thresholds and Independence Statement:
The thresholds for elemental growth factors
and gas ratios
were established using a calibration dataset of 12 historical wells (including
) drilled prior to the case study period. Strict sample independence was maintained: these 12 calibration wells do not overlap with the three case study wells (Fudong-101, Hade-18, TKe-1) presented in
Section 5.
To evaluate the practical field early-warning performance, a confusion matrix analysis was conducted on the calibration dataset:
Confusion Matrix Performance:
True positive rate (Sensitivity): 88.2% (15/17 overpressure zones correctly identified).
False positive rate (Type I Error): 12.5% (2 false alarms out of 16 normal-pressure zones). These false alarms were primarily attributed to local chert stringers causing Si spikes without associated pressure increase.
False negative rate (Type II error): 11.8% (two missed overpressure zones where pressure buildup occurred in pure limestone without significant elemental or gas precursors).
The area under the curve (AUC) of the receiver operating characteristic (ROC) is 0.89 (95% CI: 0.82–0.95), confirming the robustness of the selected thresholds for operational early warning in the Tarim Basin.
3.2. Gas Logging Characteristics
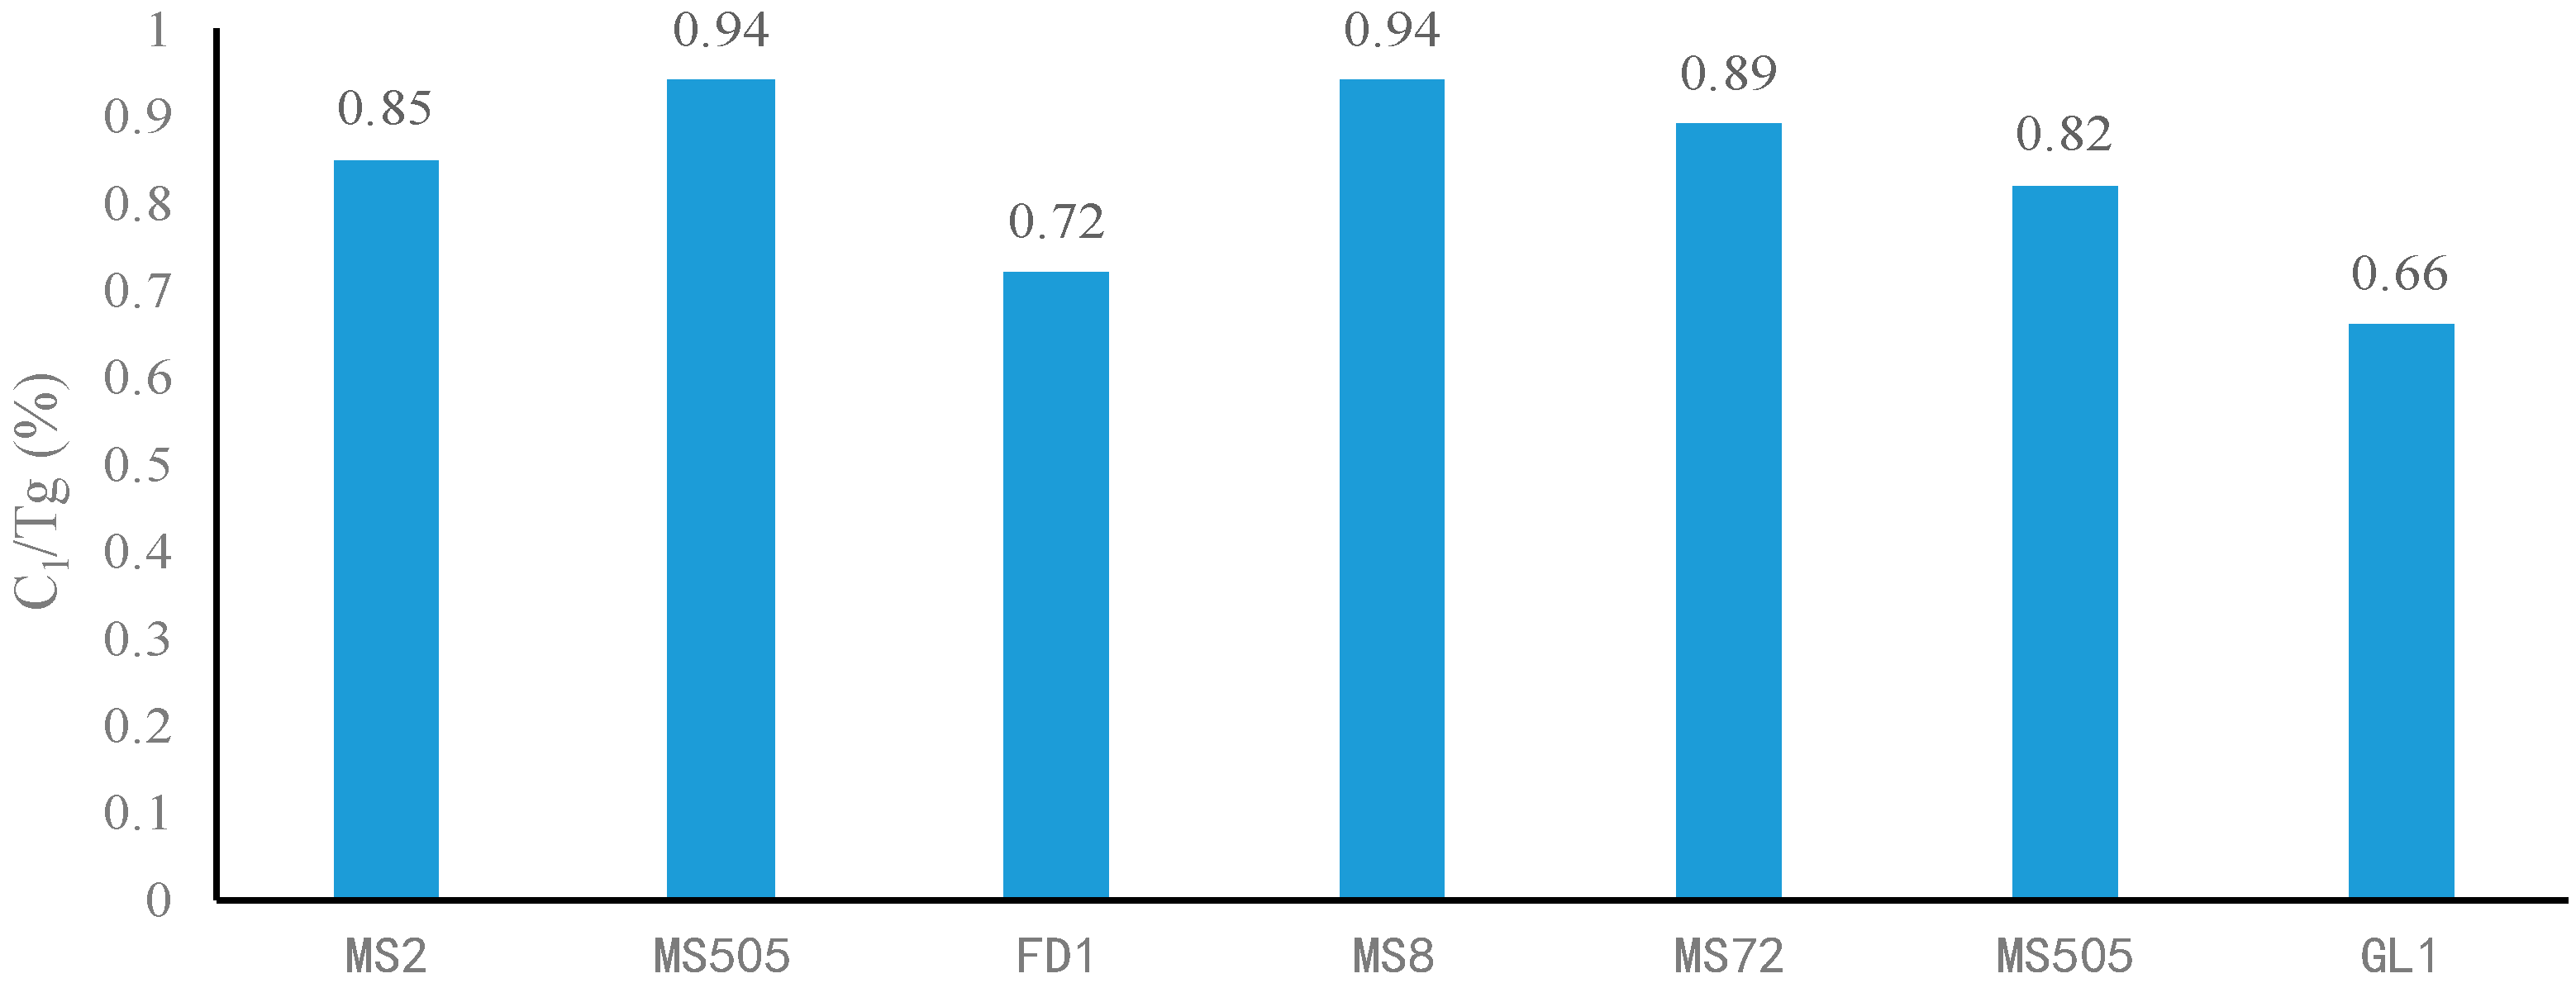
Gas logging data from overpressured and normally pressured wells were compared to identify diagnostic indicators of abnormal formation pressure. The analysis focused on gas measurements within the uppermost 20 m interval of the Yingshan Formation, where the maximum, average, and minimum gas concentrations were statistically compared.
To characterize gas composition variations, the ratio of methane (C
1) to total hydrocarbons (THCs), denoted as C
1/THC, was selected as the main diagnostic parameter. In the historical wells analyzed in this study, overpressured intervals generally showed lower C
1/THC values, whereas normally pressured intervals tended to exhibit higher values [
29].
Statistical validation of thresholds: Based on 15 calibration wells, the optimal threshold was determined as C1/THC < 0.8(AUC = 0.91, 95% CI: 0.85–0.96). A threshold perturbation of ±0.05 caused an accuracy change of less than 4%, confirming the stability of the criterion.
Sensitivity analysis: Threshold variation of ±0.05 causes accuracy change < 4%.
In addition, gas pressure difference parameters were introduced to reflect abnormal gas enrichment during drilling. For the integrated monitoring model, the total hydrocarbon pressure difference parameter (FTG) and methane pressure difference parameter (FC1) were used as key indices.
Statistical validation: The thresholds FTG ≥ 2 and FC
1 ≥ 3 were optimized via field calibration and ROC analysis (AUC > 0.88), with 95% confidence intervals supporting their rationality. Based on these comparisons, a practical cutoff of C
1/THC < 0.8 was adopted as an indicator of possible overpressure development (
Figure 4).
3.3. Engineering Parameter Characteristics
The DC index may be directly calculated via integrated logging and compared with the DC index trend line DCN to predict lower formation pressures. The formula for the DC index trend line is as follows:
Taking logarithms on both sides yields:
where:
DCN—DC index value under normal trend, dimensionless;
h—Well depth, m;
a, b—Equation coefficients fitted from normal-pressure wells.
When the DC index deviates downward from the trend line, the likelihood of high-pressure zones developing in the lower formations increases. The degree of deviation from the trend line is assessed by the ratio of DC index to DCN, expressed as:
where:
N—Ratio of DC index at a given well depth to the trend line, dimensionless;
DCN—DC index at a given well depth under normal trend conditions;
DC—DC index at a given well depth.
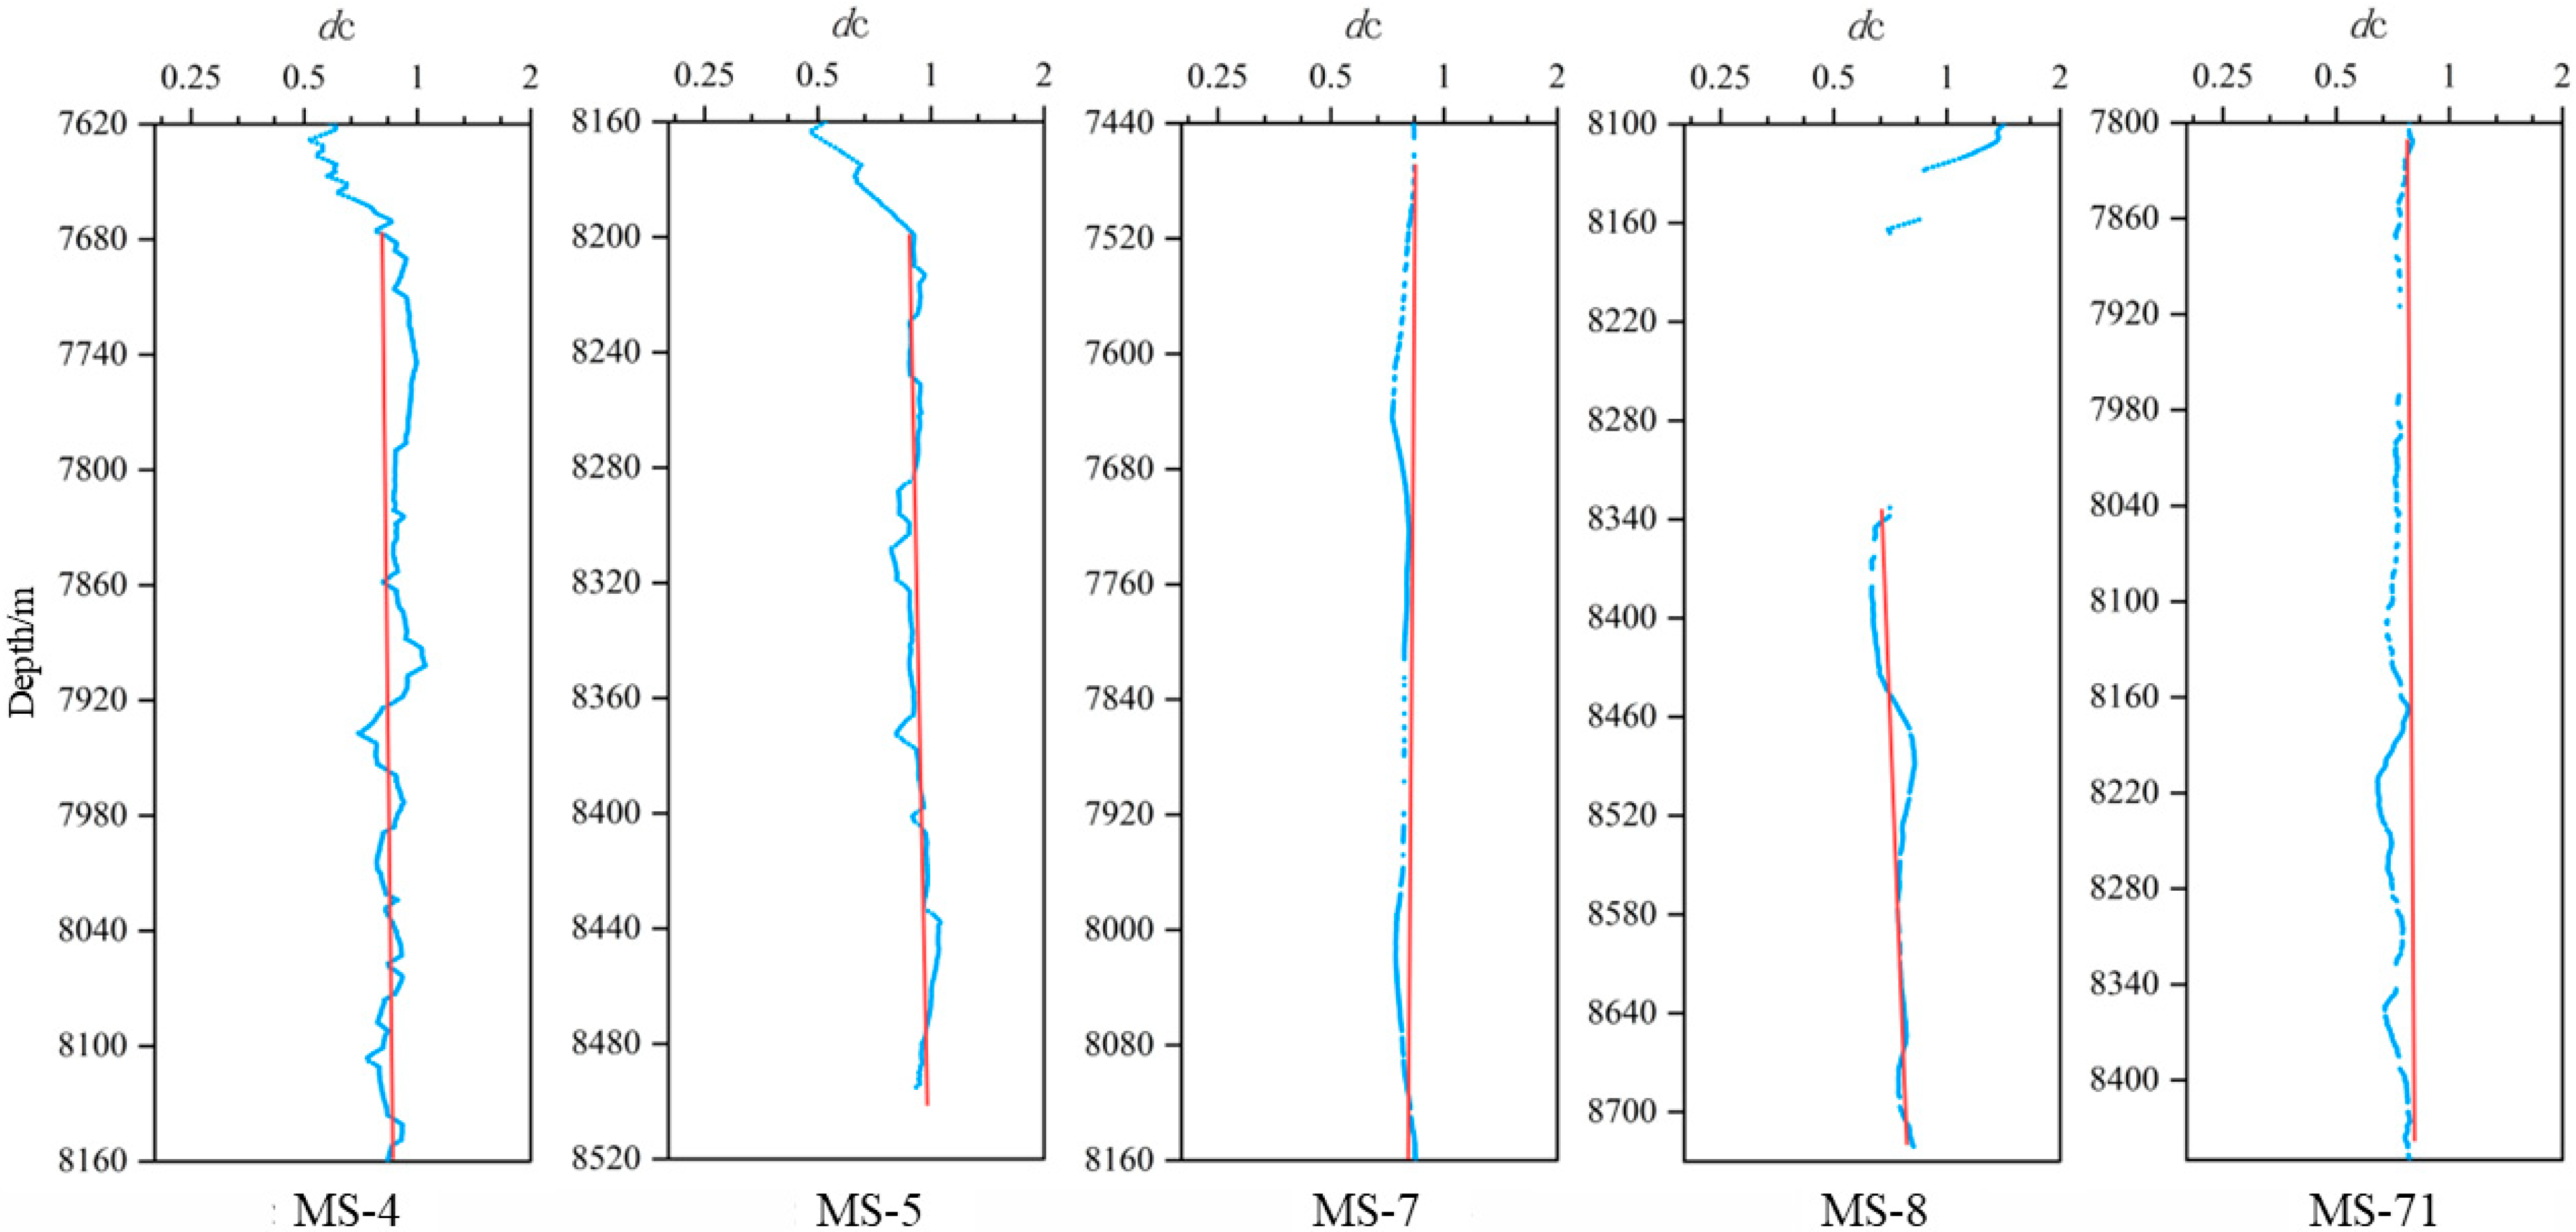
In previously drilled normally pressured wells, the DC index generally exhibits no significant deviation from the expected trend (
Figure 5).
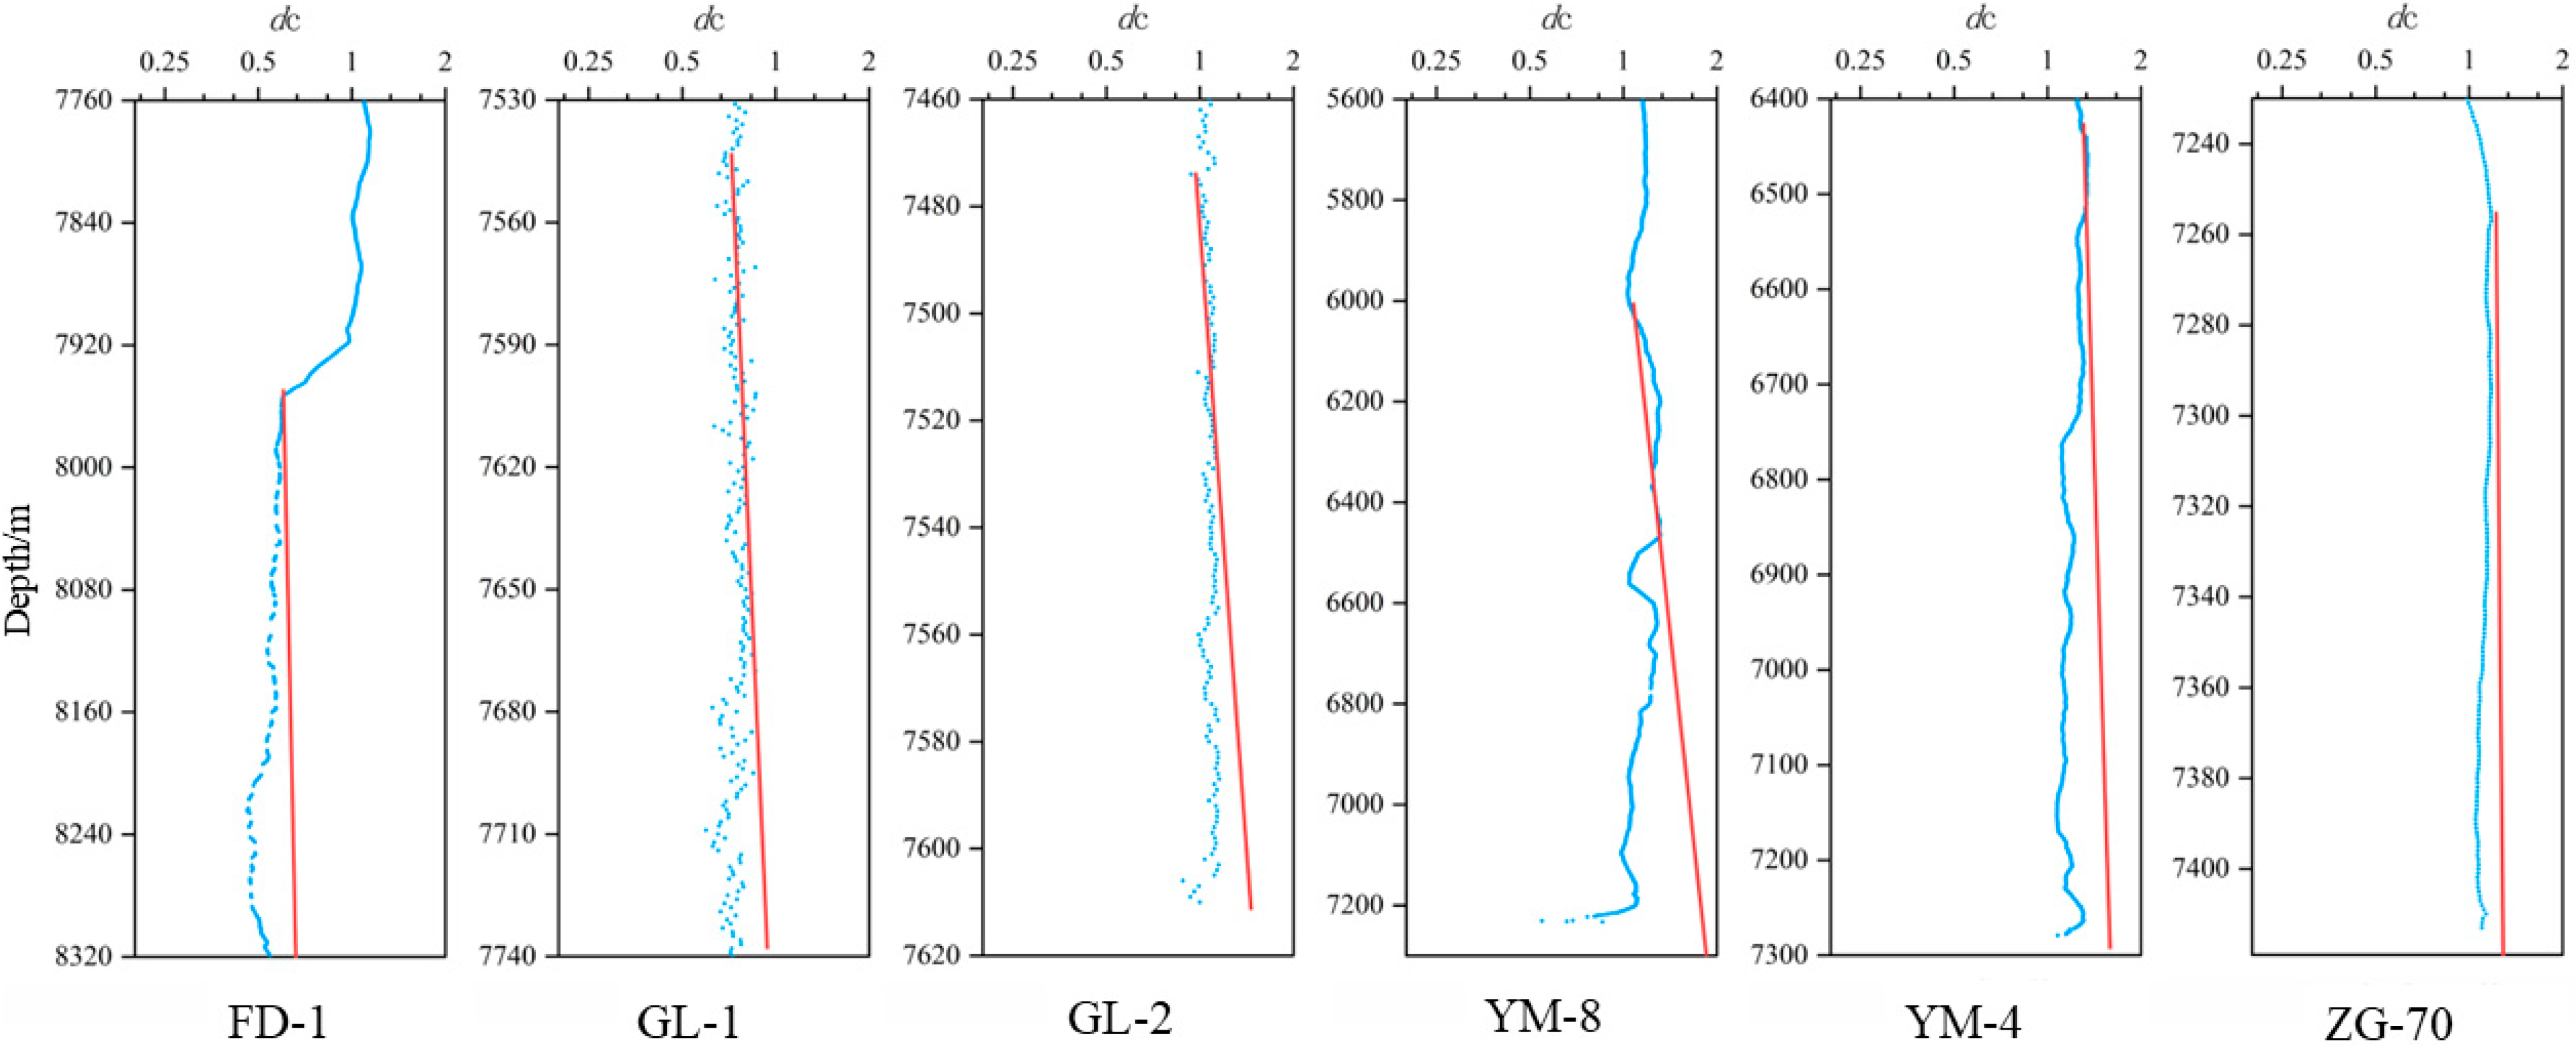
In contrast, in overpressured wells, the DC index shows a consistent pattern of deviation and overall decrease relative to the normal compaction trend line prior to encountering high-pressure intervals (
Figure 6,
Table 3).
In addition to the DC index, the sigma index was used as a supplementary engineering indicator. Sigma is a composite drilling response parameter generated by the logging-while-drilling interpretation system and reflects the combined effect of several real-time drilling variables, such as rate of penetration, torque, standpipe pressure, and other normalized engineering measurements. A decrease in sigma generally indicates increased formation resistance and may be associated with abnormal pore pressure development.
In the present study, the sigma index was treated as a directly interpreted output from the field while-drilling software. The exact computational algorithm is dependent on the service system used during drilling and is therefore proprietary in many field applications.
3.4. Definition and Calculation of Sigma Index
The sigma index (Σ) is a composite drilling response parameter designed to enhance the signal-to-noise ratio of formation drillability changes. To address the dimensional heterogeneity among different engineering parameters (ROP, torque, SPP, WOB), all input variables are first processed using min-max normalization relative to their respective background trends in adjacent normal-pressure shale or tight limestone sections.
Normalization Procedure:
where
represents the real-time measurement of ROP, T, SPP, or WOB, and the range
is dynamically established within a moving window of 50 m in normally compacted formations above the target zone.
The weight coefficients () were calibrated using a multivariate linear regression against post-drilling pore pressure gradient data from eight offset wells (exclusive of the case study wells). The calibration procedure was designed to maximize the agreement between sigma trend deviations and the post-drilling pressure response. The weight coefficients () were (ROP): 0.40; (torque): 0.25; (SPP): 0.10; (WOB): 0.25; .
Physical Interpretation: An increase in coupled with a decrease in or indicates enhanced formation drillability. A downward deviation of from its established trend line (sigma trend ratio ) is interpreted as a potential transition into an overpressured zone, provided that bt wear and lithology changes (monitored via elemental logging) have been ruled out.
This normalization step is essential because direct weighted summation of raw parameters with different units and magnitudes would otherwise distort the index response and reduce reproducibility.
3.5. Indicator Dominance and Contribution Analysis
To quantify the importance of each parameter in overpressure identification, indicator dominance analysis was conducted using the 9 validated warning events from 3 wells. Dominance is defined as the correct response rate of a single indicator in predicting true overpressure intervals.
- 2.
Dominance Ranking Results:
S element growth factor (Ks): 88.9% dominance (highest); total hydrocarbon pressure difference (FTG): 77.8%.DC index deviation ratio (N): 66.7%; Si element growth factor (KSi): 66.7%; methane pressure difference (FC1): 55.6%; sigma index trend ratio (M): 55.6%; caprock thickness: 33.3% (lowest).
- 3.
Implications for Accuracy Improvement:
Primary focus: Strengthen real-time monitoring of S element and total hydrocarbon logging; these two indicators contribute ~65% of correct predictions. Secondary focus: DC index and Si element anomalies provide reliable supplementary signals. Optimization direction: Dynamically weight indicators by dominance to raise overall accuracy from 88.89% to >95%.
4. Integrated Formation Pressure Monitoring Model
To improve the objectivity of the multi-parameter fusion model, the weights of the four indicator groups were determined using the analytic hierarchy p(AHP) combined with the entropy weight method for dual verification:
The weighting logic was based on the observed diagnostic dominance of the indicators in the calibration dataset. Elemental logging and gas logging showed the strongest direct sensitivity to abnormal overpressure, whereas rock drillability and caprock thickness acted as supplementary constraints. Accordingly, a pairwise comparison matrix was constructed for elemental logging parameters, gas logging pressure difference parameters, rock drillability parameters, and caprock thickness.
The initial weights obtained from AHP were 0.40, 0.30, 0.20, and 0.10, respectively. These values were then checked using the entropy weight method, which yielded 0.38, 0.31, 0.21, and 0.10. The consistency ratio was CR = 0.07, which is below the acceptable threshold of 0.10 and indicates good internal consistency.
Therefore, the final weights adopted in this study were elemental logging (0.4), gas logging (0.3), rock drillability (0.2), and caprock thickness (0.1). These weights are thus not purely subjective but are supported by both expert judgment and statistical verification.
The probability of abnormally high-pressure development was calculated as follows:
where
Pelement, Pgas,
Prock,
Pcaprock are the probability contributions of the corresponding indicator groups.
- (1)
Elemental Logging Parameters
Elemental logging parameters are obtained by scanning drill cuttings samples to detect the content of various elements. Because these measurements have relatively high reliability, a probability coefficient of 0.4 is assigned to this parameter. The calculation formula is as follows:
The specific assignments are as follows: if the sulfur element growth factor (KS) ≥ 2, the probability is assigned as 0.2; if KS < 2, the probability is assigned as 0. If the silicon element growth factor (KSi) > 2, the probability is assigned as 0.2; if KSi < 2, the probability is assigned as 0.
- (2)
Rock Drillability Parameters
Rock drillability parameters are significantly affected by drilling parameters, and their reliability is therefore slightly lower; however, they still have reference significance for predicting high-pressure formations. A probability coefficient of 0.2 is assigned to the rock drillability parameters. The calculation formula is as follows:
If N ≥ 1.15, pN = 0.1; else 0;
M—Sigma index trend ratio (dimensionless), if M > 1.2, pM = 0.1; else 0.
- (3)
Gas Logging Pressure Difference Parameters
The reliability of gas logging pressure difference parameters is relatively high, and therefore, a probability coefficient of 0.3 is assigned to this parameter. The calculation formula is as follows:
If the total hydrocarbon pressure difference parameter (FTG) ≥ 2, the probability is assigned as 0.15; if FTG ≤ 1, the probability is assigned as 0. If the methane pressure difference parameter (FC1) ≥ 3, the probability is assigned as 0.15; if FC1 < 3, the probability is assigned as 0.
- (4)
Caprock Thickness
Caprock thickness has a relatively small influence on the formation of abnormal overpressure. According to statistical data on the influence of caprock thickness on downhole pressure in ultra-deep Ordovician carbonate wells in the Tarim Oilfield, if the caprock thickness is greater than 250 m, then P(caprock thickness) = 0.1; if the caprock thickness is less than or equal to 250 m, then P(caprock thickness) = 0.
5. Case Study Analysis
5.1. Well Fudong-101
- (1)
First Warning:
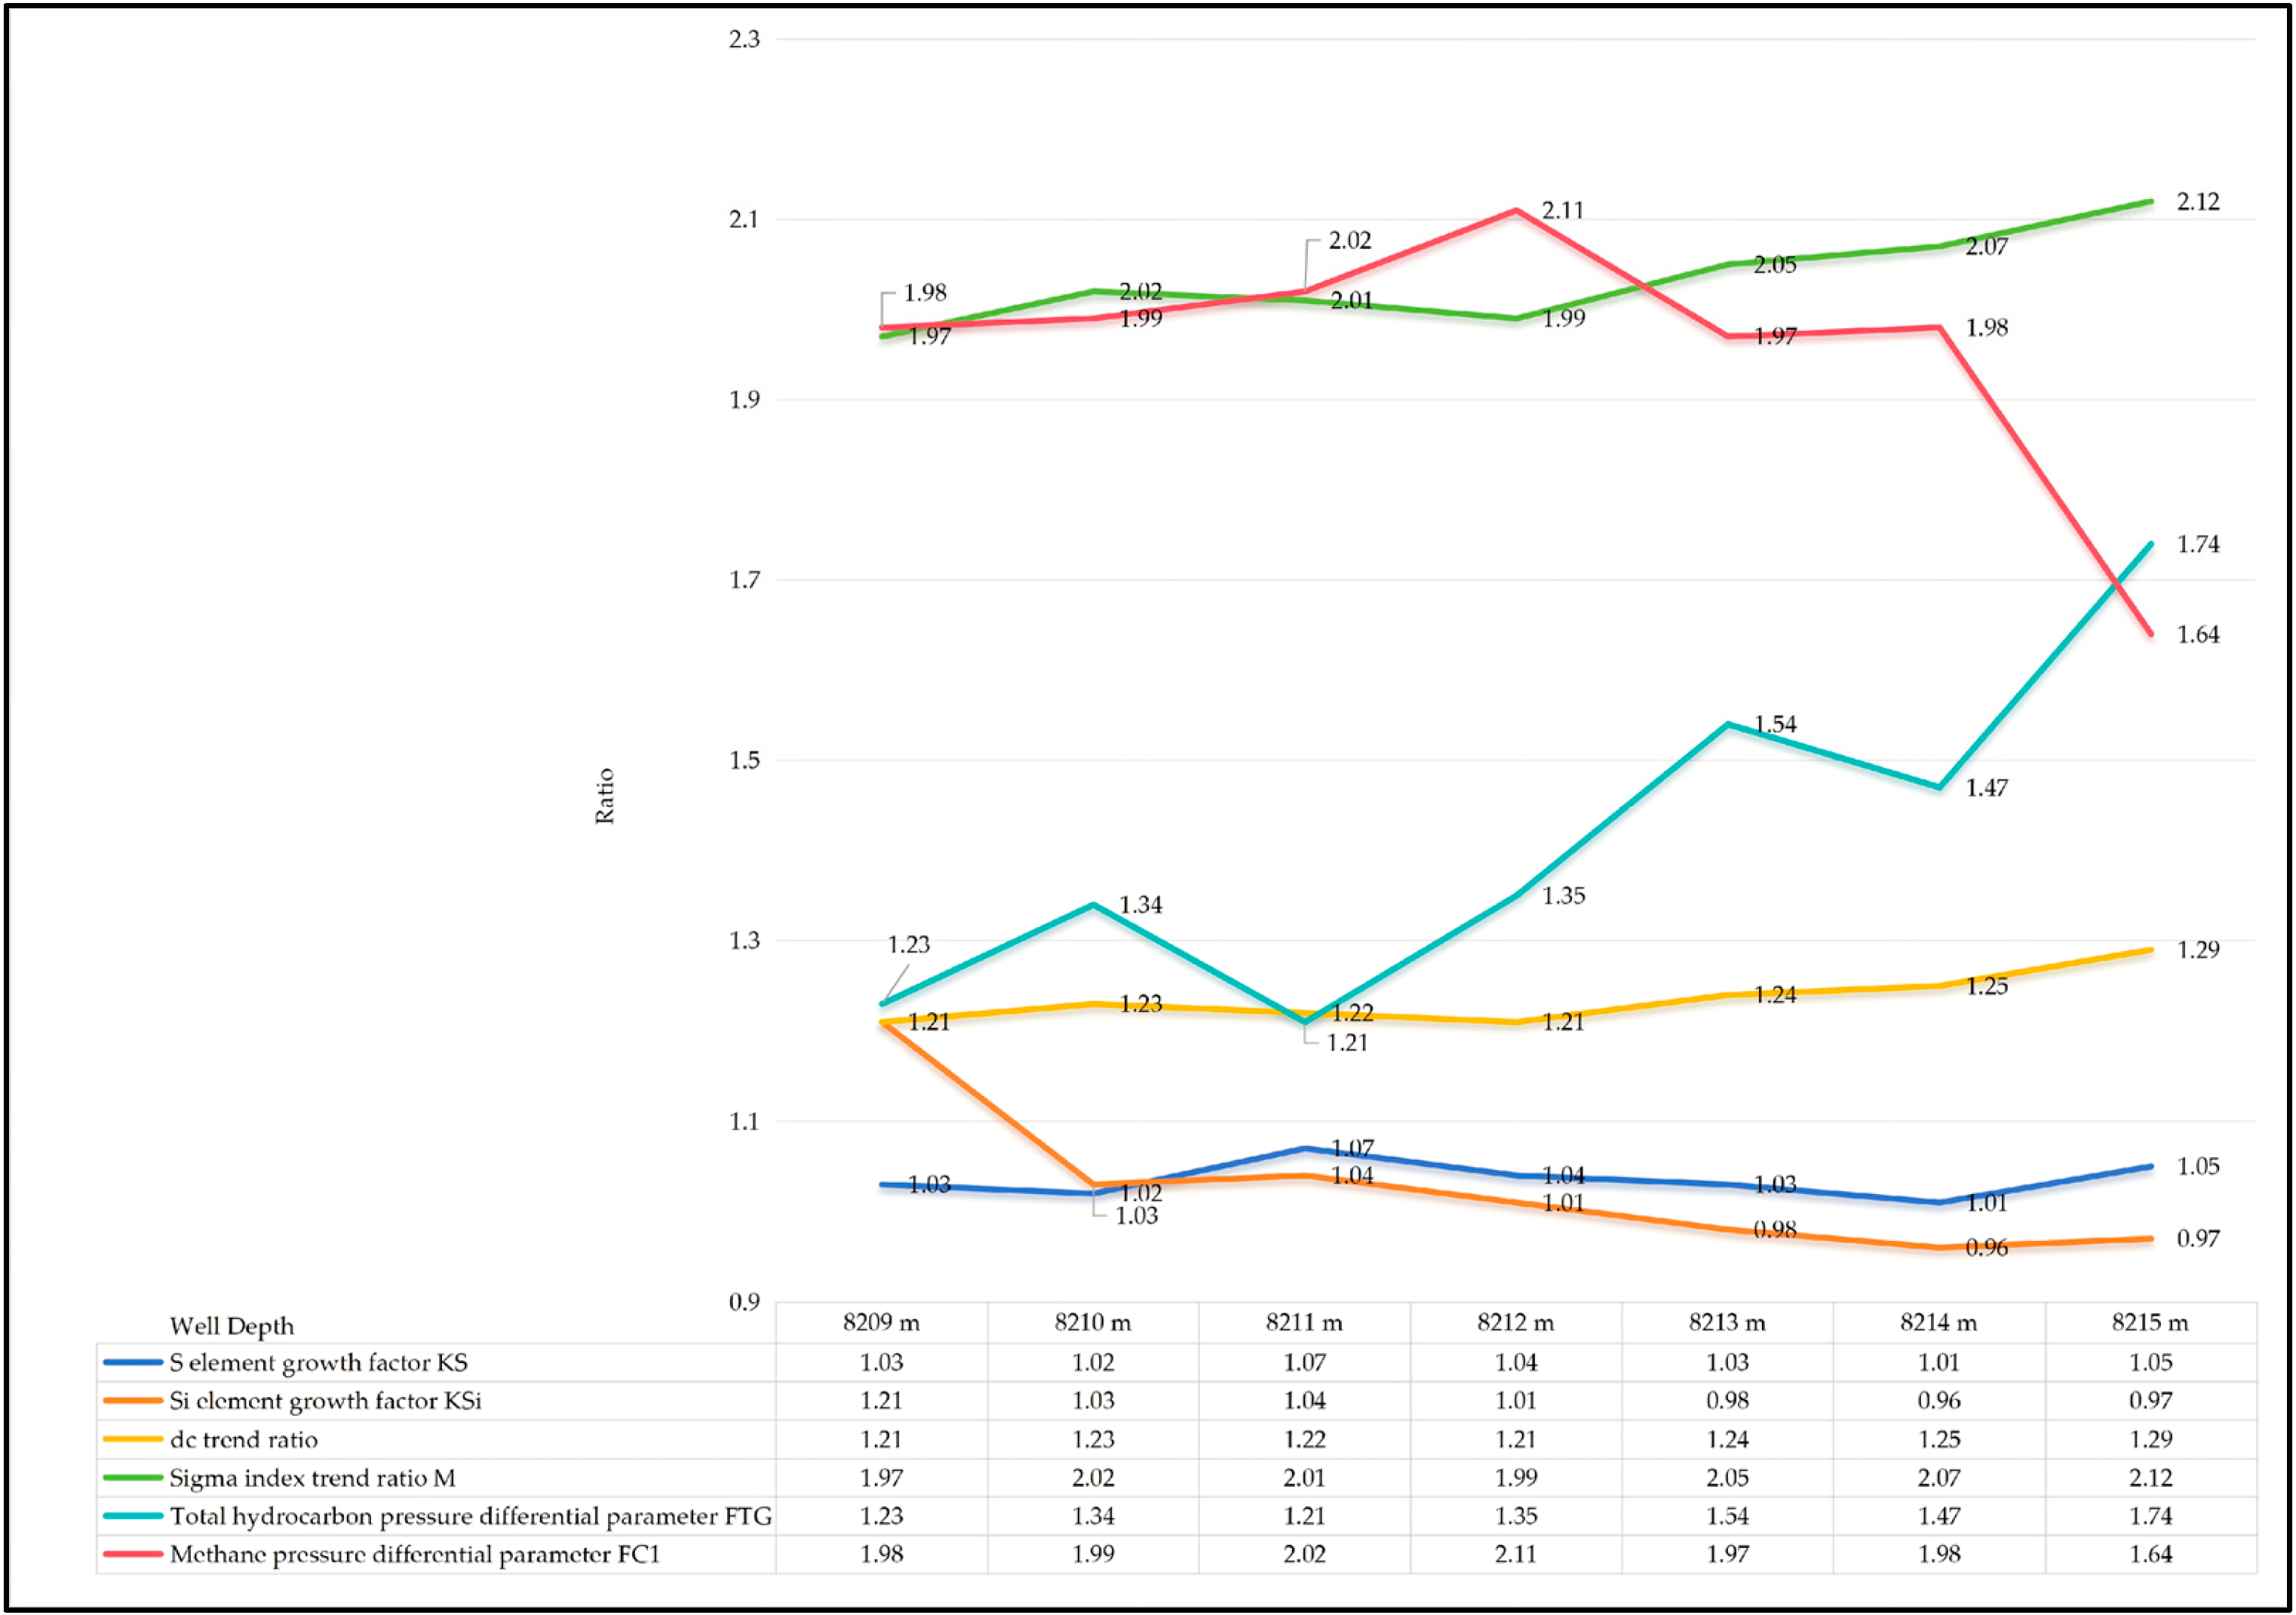
When drilling reached 8209.00–8215.00 m, the DC index and sigma index began to decrease and deviate from the trend line starting at 8208 m. The elemental logging parameters Si and S both showed slight increases, but the changes were not obvious. The gas pressure difference parameters did not show significant variation (
Figure 7).
Calculated abnormal pressure probability: 0.2 (low risk). Post-drilling verification: no abnormal overpressure, prediction correct [
30]. Subsequent pressure calculation based on post-drilling logging results showed that no abnormal high pressure developed in the lower formation [
31].
- (2)
Second Warning:
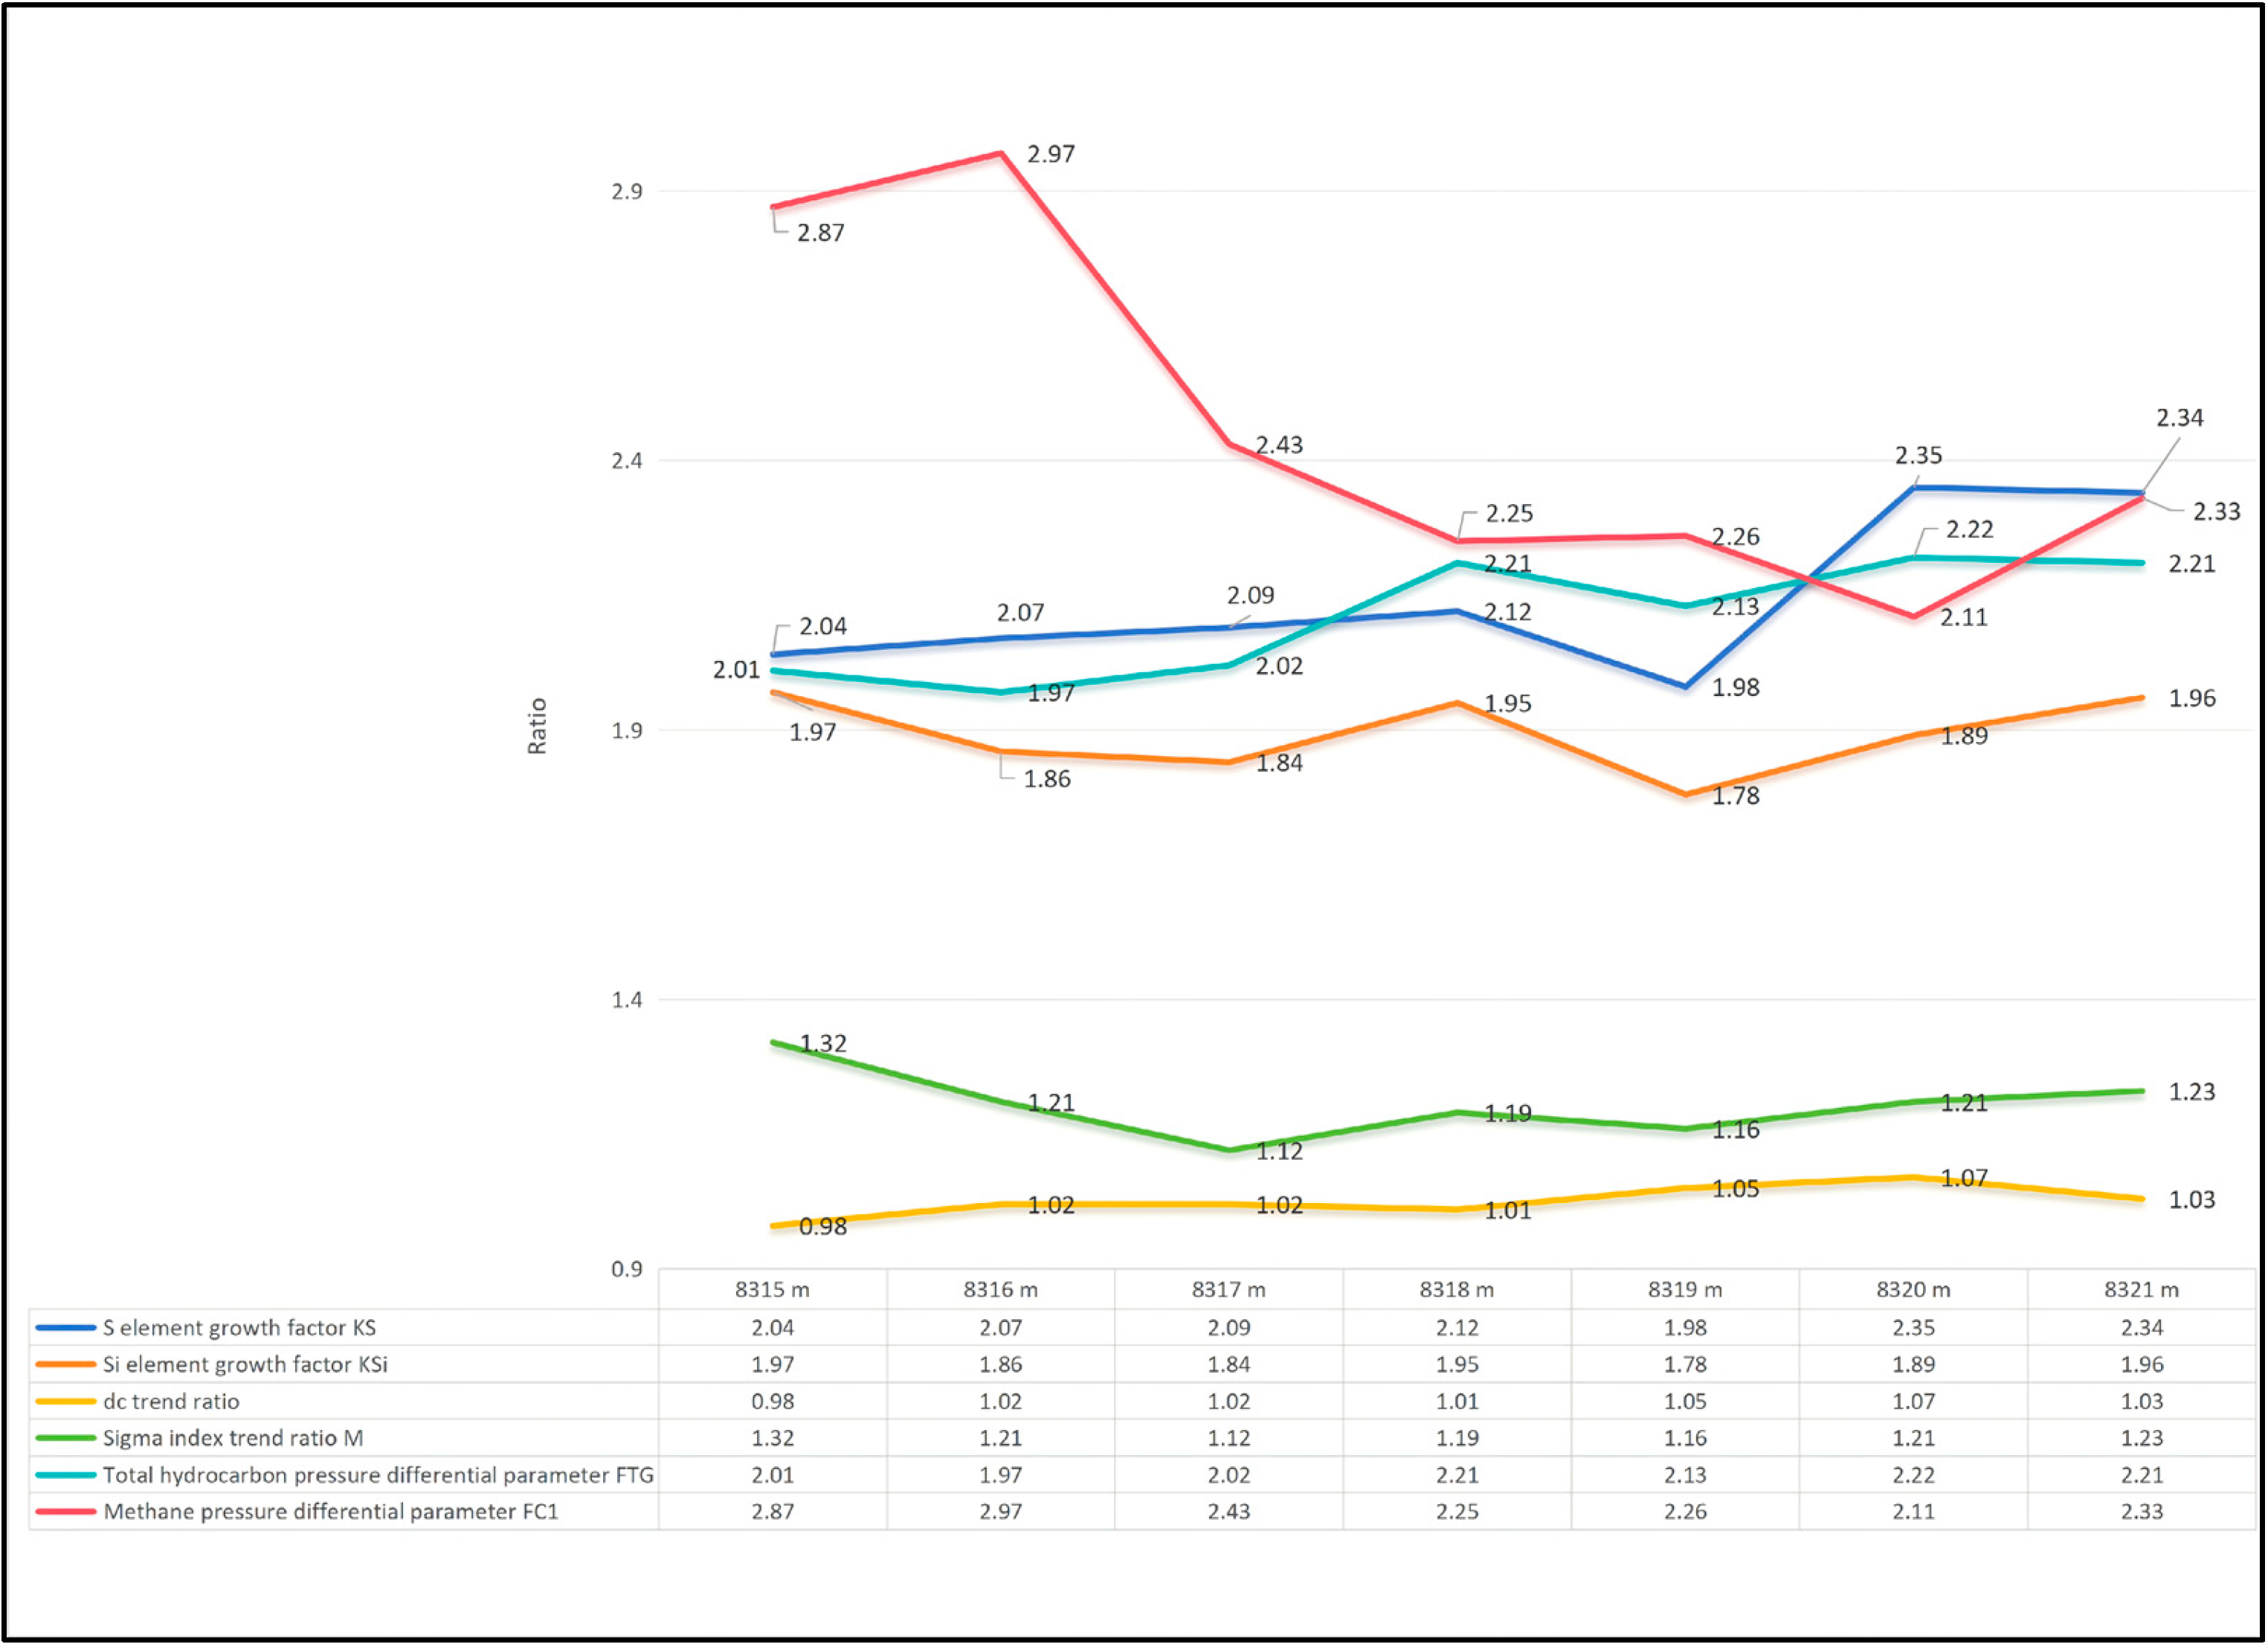
Drilling depth: 8315.00–8321.00 m (
Figure 8). Calculated probability: 0.55 (medium risk). Verification: pressure increased but no abnormal overpressure, prediction correct [
32]. The detailed parameter analysis is shown in the table below (
Figure 8).
- (3)
Third Warning:
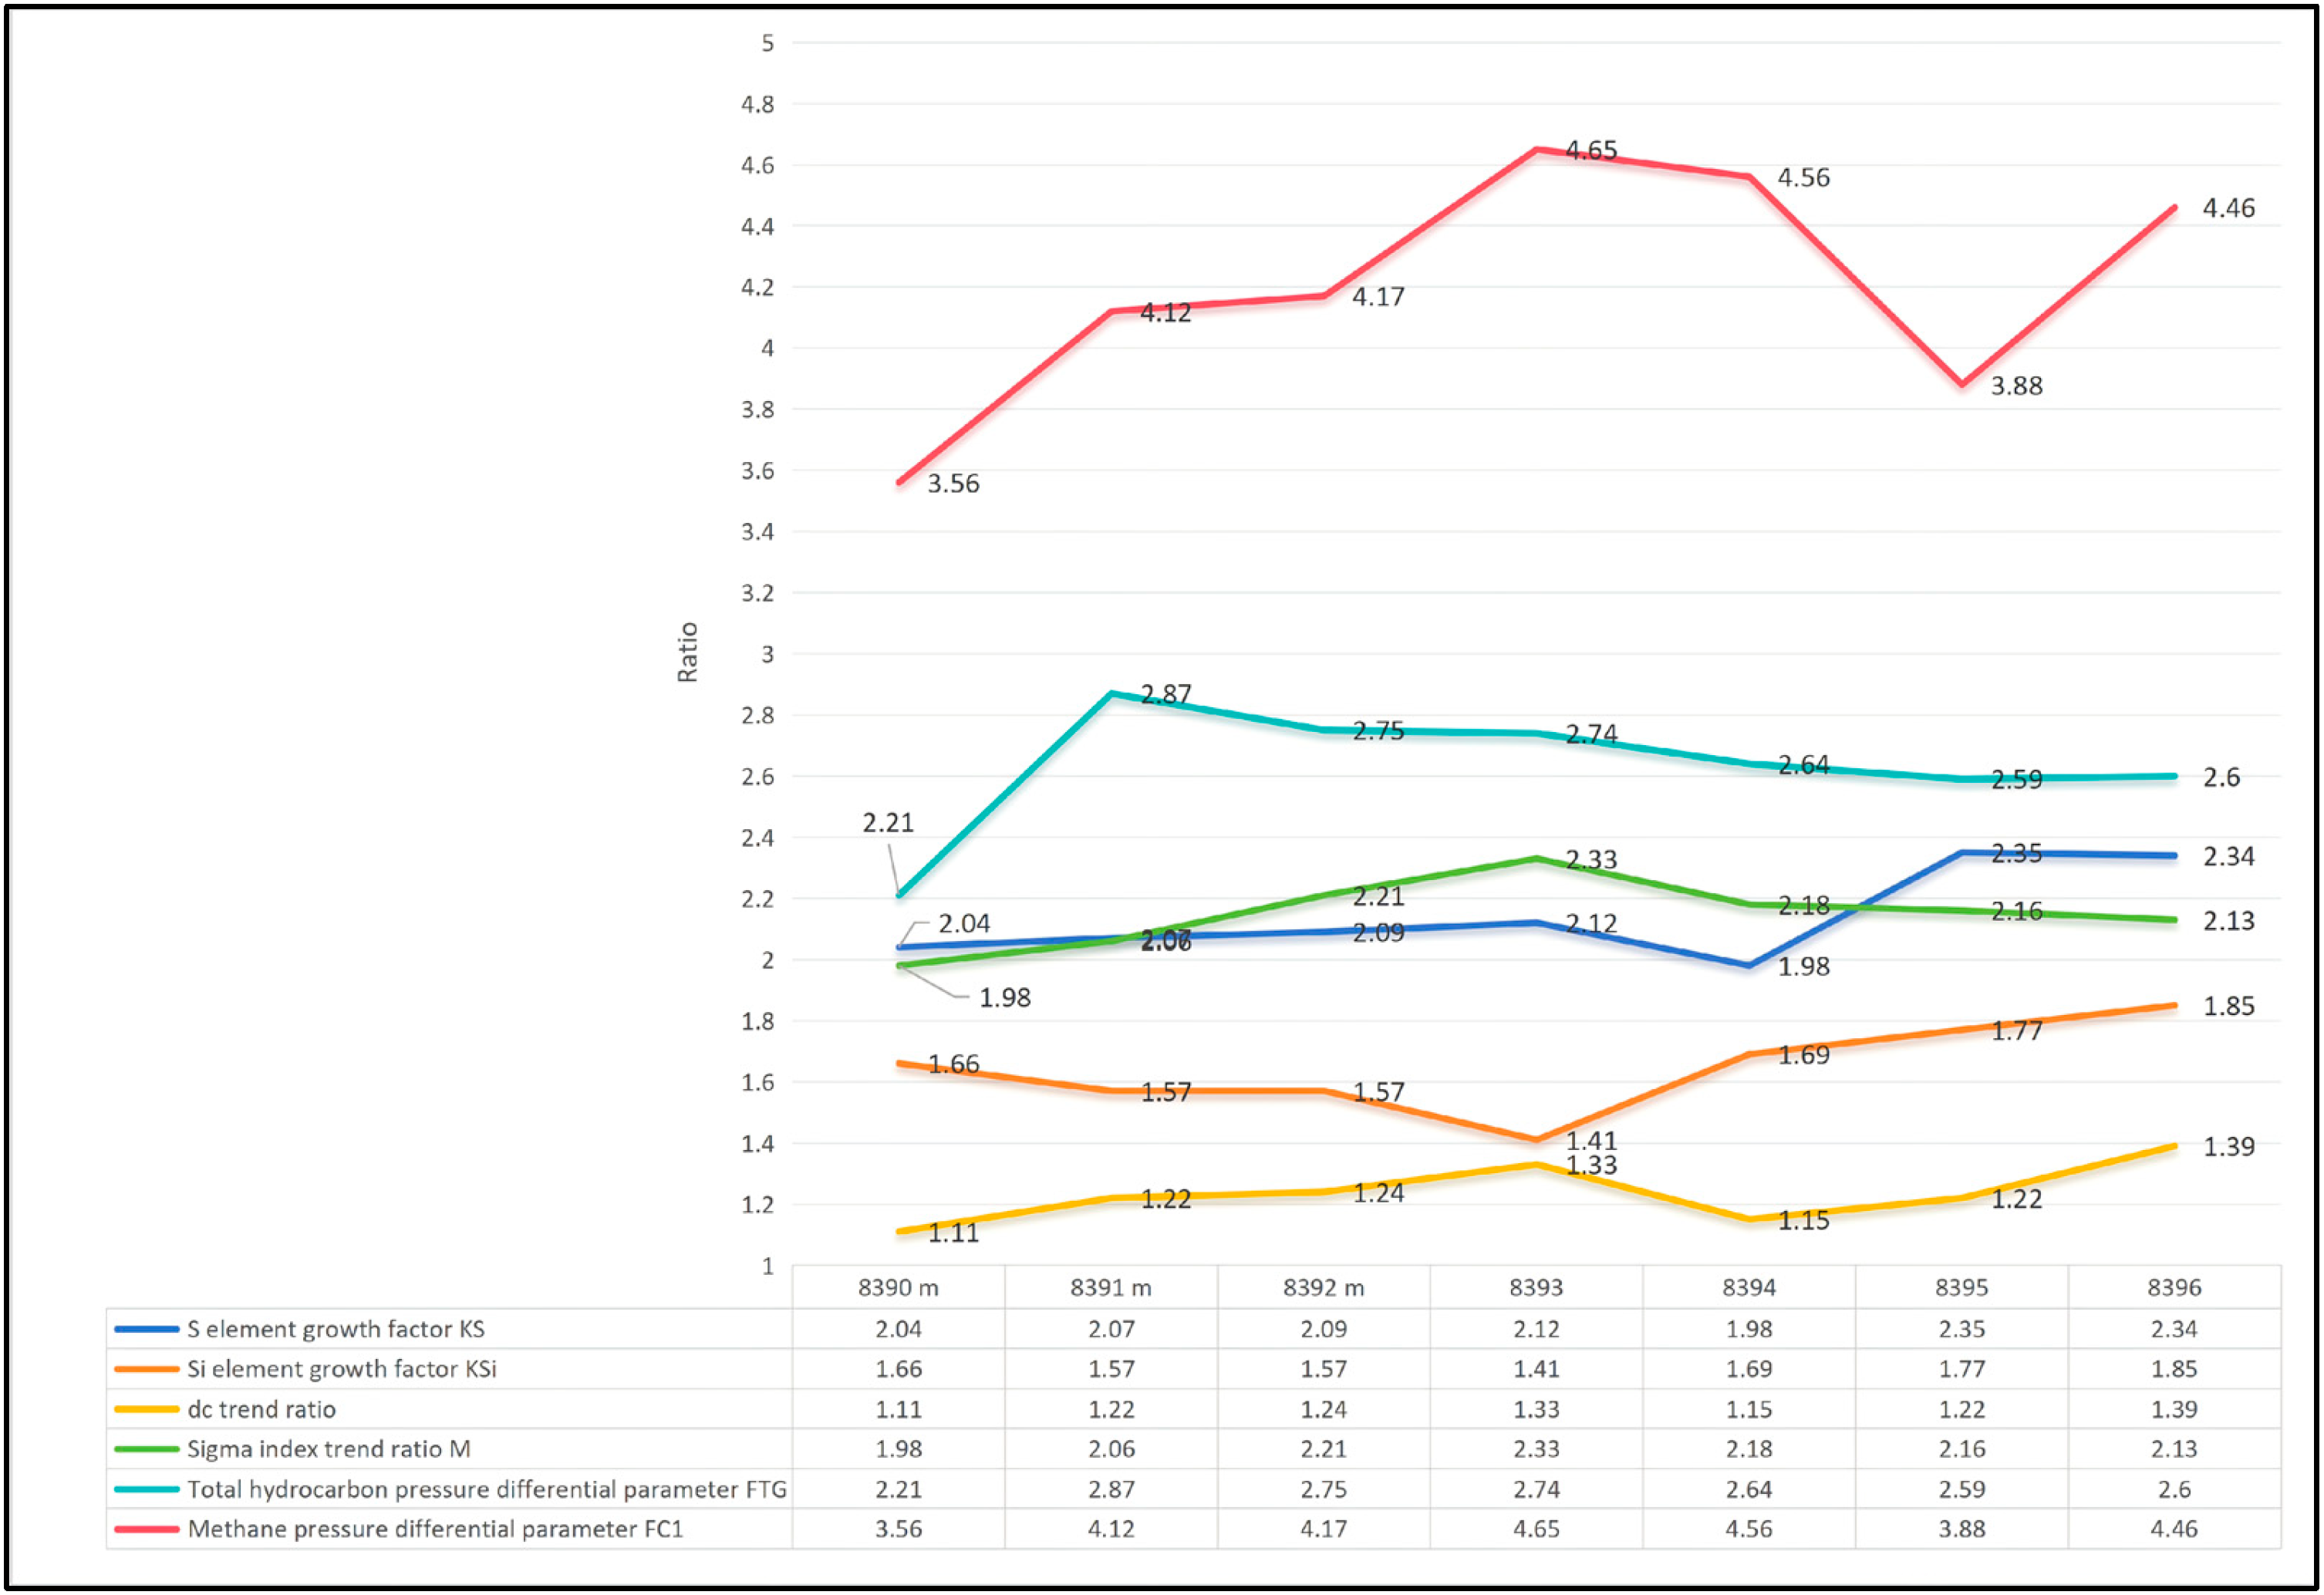
Drilling depth: 8390.00–8396.00 m (
Figure 9). Calculated probability: 0.80 (high risk). Verification: Abnormal overpressure confirmed at 8412 m, predicted 16 m in advance, correct.
According to the comprehensive formation pressure monitoring method, the probability of abnormal high pressure in the lower formation was calculated to be 0.80, indicating a high likelihood of abnormal overpressure development. Subsequent post-drilling testing confirmed that at a depth of 8412 m, the pressure test reached 1.77 g/cm3, indicating that abnormal overpressure in the lower formation was successfully predicted 16 m in advance.
In total, three comprehensive formation pressure monitoring analyses were conducted in this well. Two predictions indicated a low probability of high-pressure formation development, while one prediction indicated a high probability. Subsequent post-drilling verification demonstrated that the prediction accuracy reached 100%.
5.2. Well Hade-18
- (1)
First Warning:
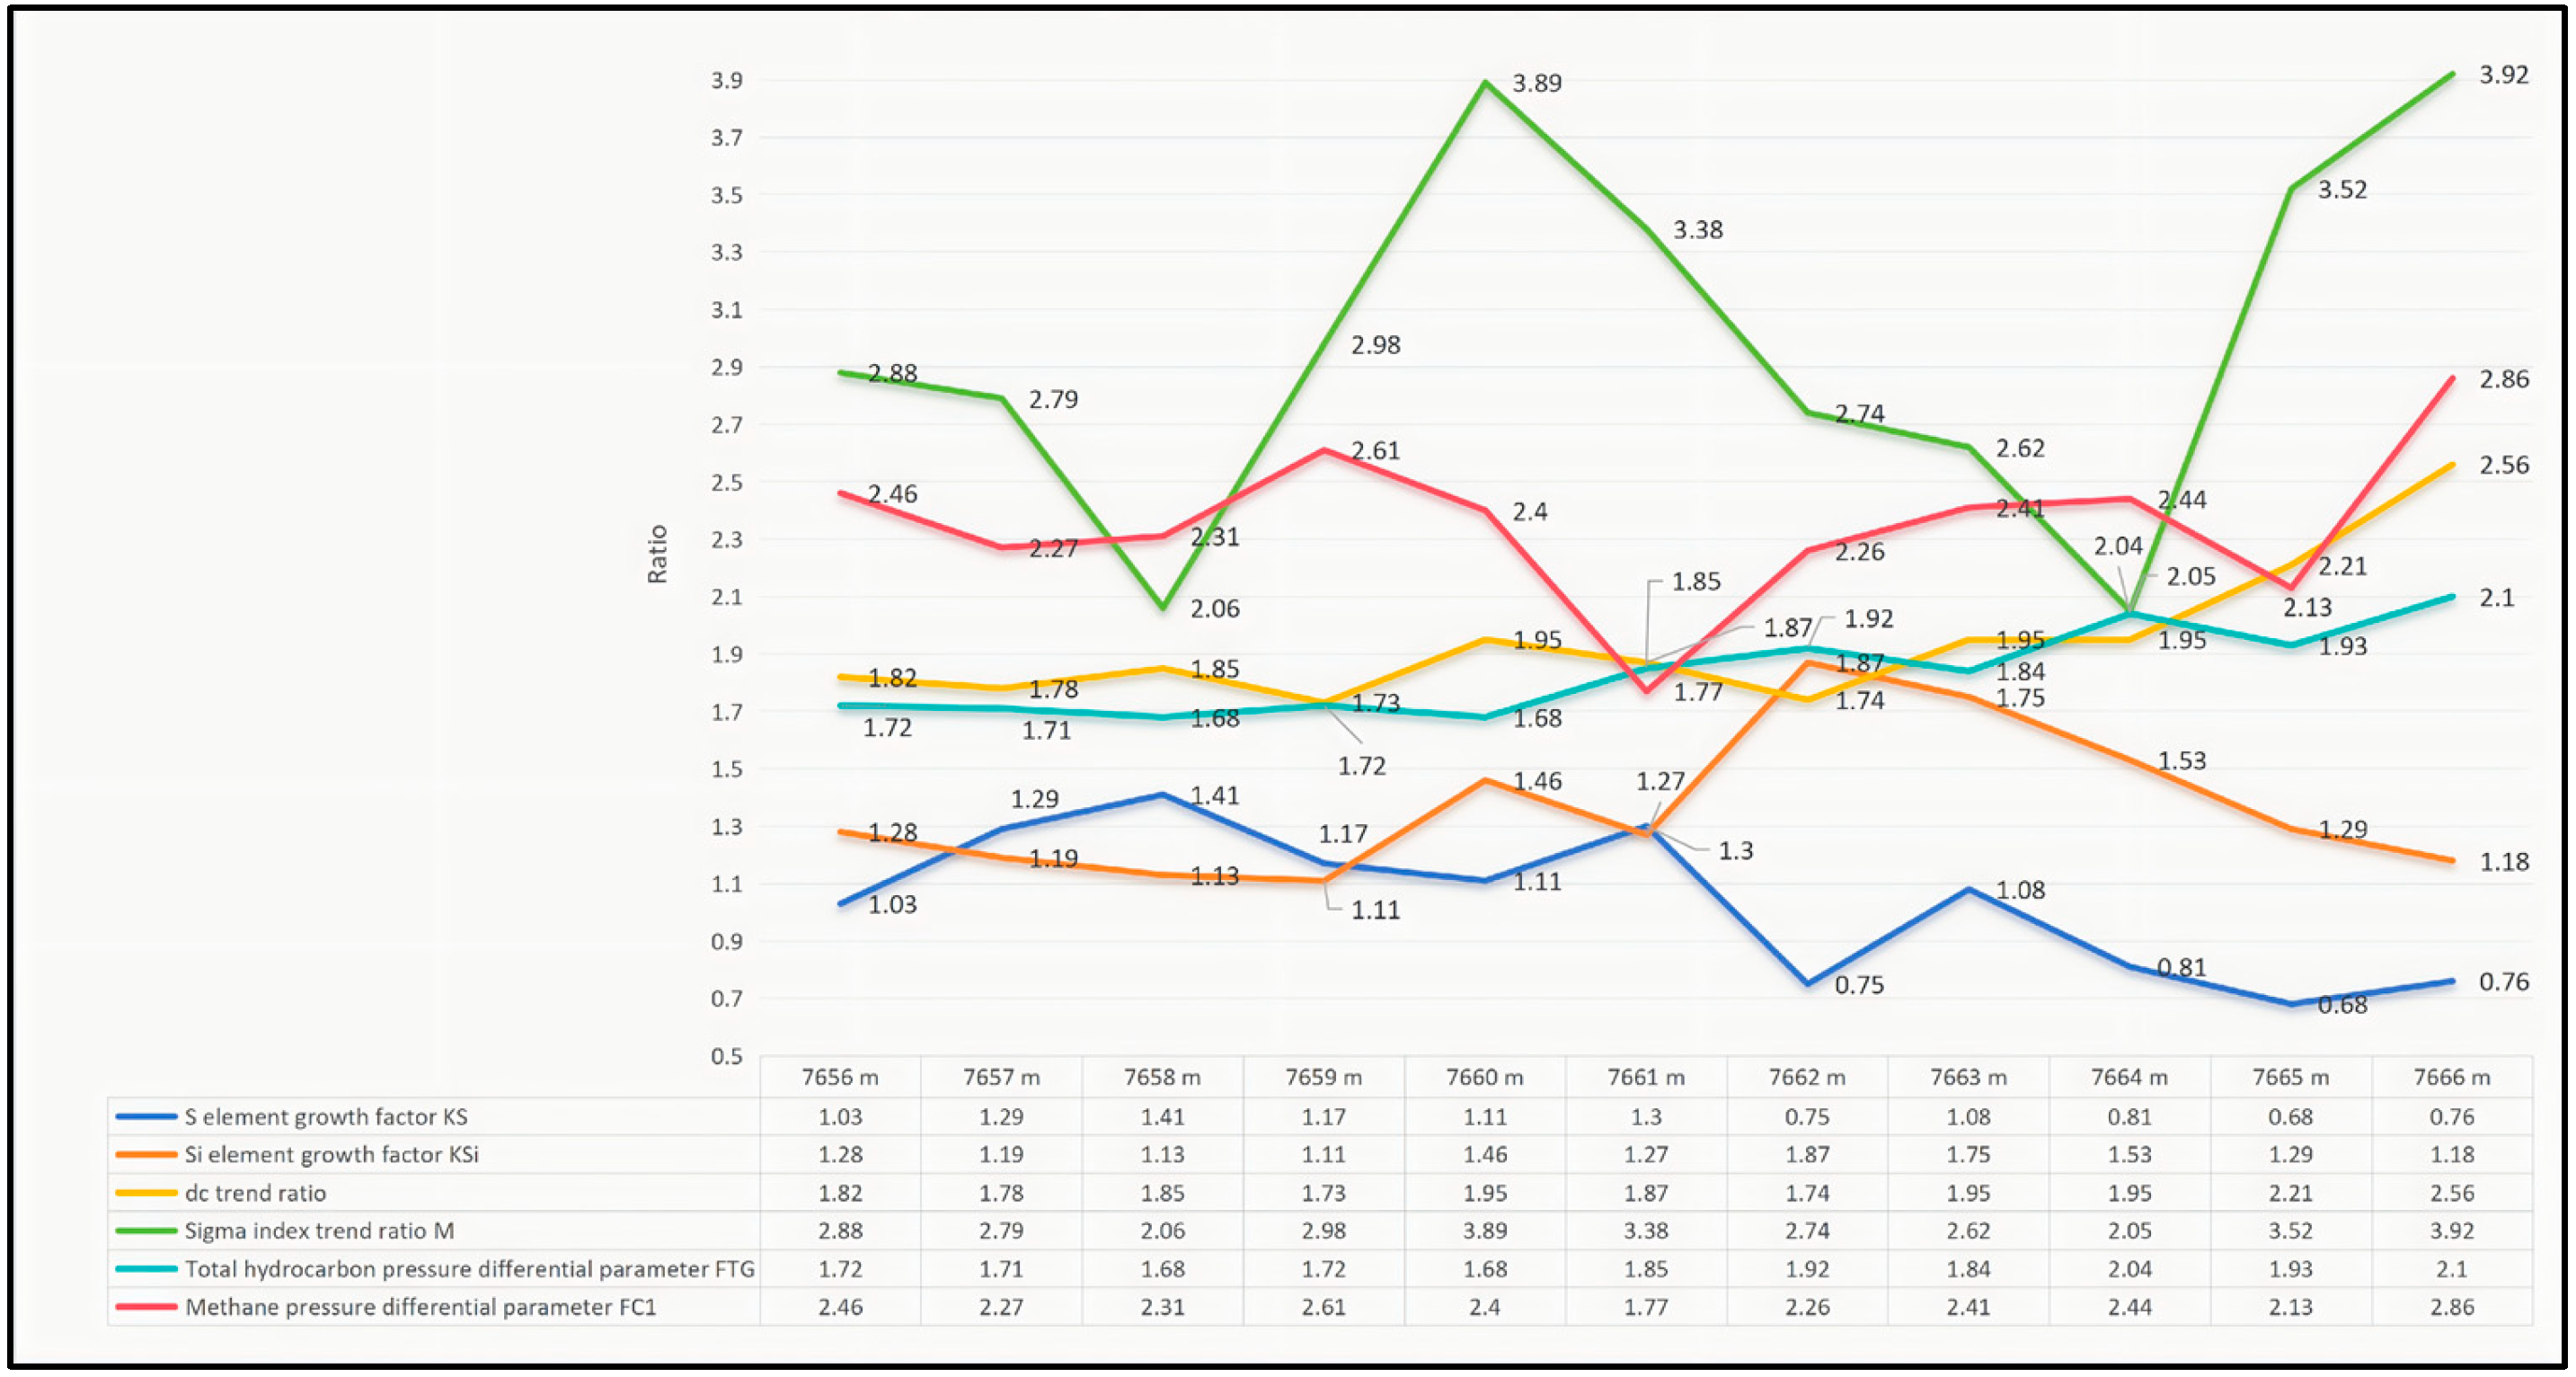
Drilling depth: 7656.00–7666.00 m. Calculated probability: 0.45 (low risk). However, overflow occurred at 7690 m (
Figure 10). This interval should be interpreted as a missed warning rather than a false alarm, because the model underestimated the impending overpressure response.
The missed warning at 7656.00–7666.00 m was re-evaluated using post-drilling data. Quantitative analysis shows that the newly introduced aggressive PDC bit caused a baseline shift of −0.15 in the DC index and −0.22 in the sigma index relative to offset well baselines, corresponding to an approximately 12% reduction in the DC trend. This mechanical interference partially masked the formation response and reduced the sensitivity of the drillability-based indicators.
In addition, CT scan analysis and image logs from the 7690 m overflow zone revealed a cluster of small-scale secondary faults with estimated shale gouge ratio (SGR) values of 45–60%. This indicates a locally effective sealing capacity capable of trapping a limited pressure compartment. The regional caprock thickness parameter, which was defined at a basin scale (>250 m), could not capture this localized fault-bounded compartment. As a result, the pressure buildup was too small in volume to trigger strong pre-drill elemental anomalies at the bit face, but it was sufficient to cause a kick upon penetration.
To improve robustness, a dynamic bit correction factor has been incorporated into the sigma index algorithm to normalize for PDC bit efficiency, and local fault sealing should be considered as an additional structural constraint in future model upgrades.
- (2)
Second Warning:
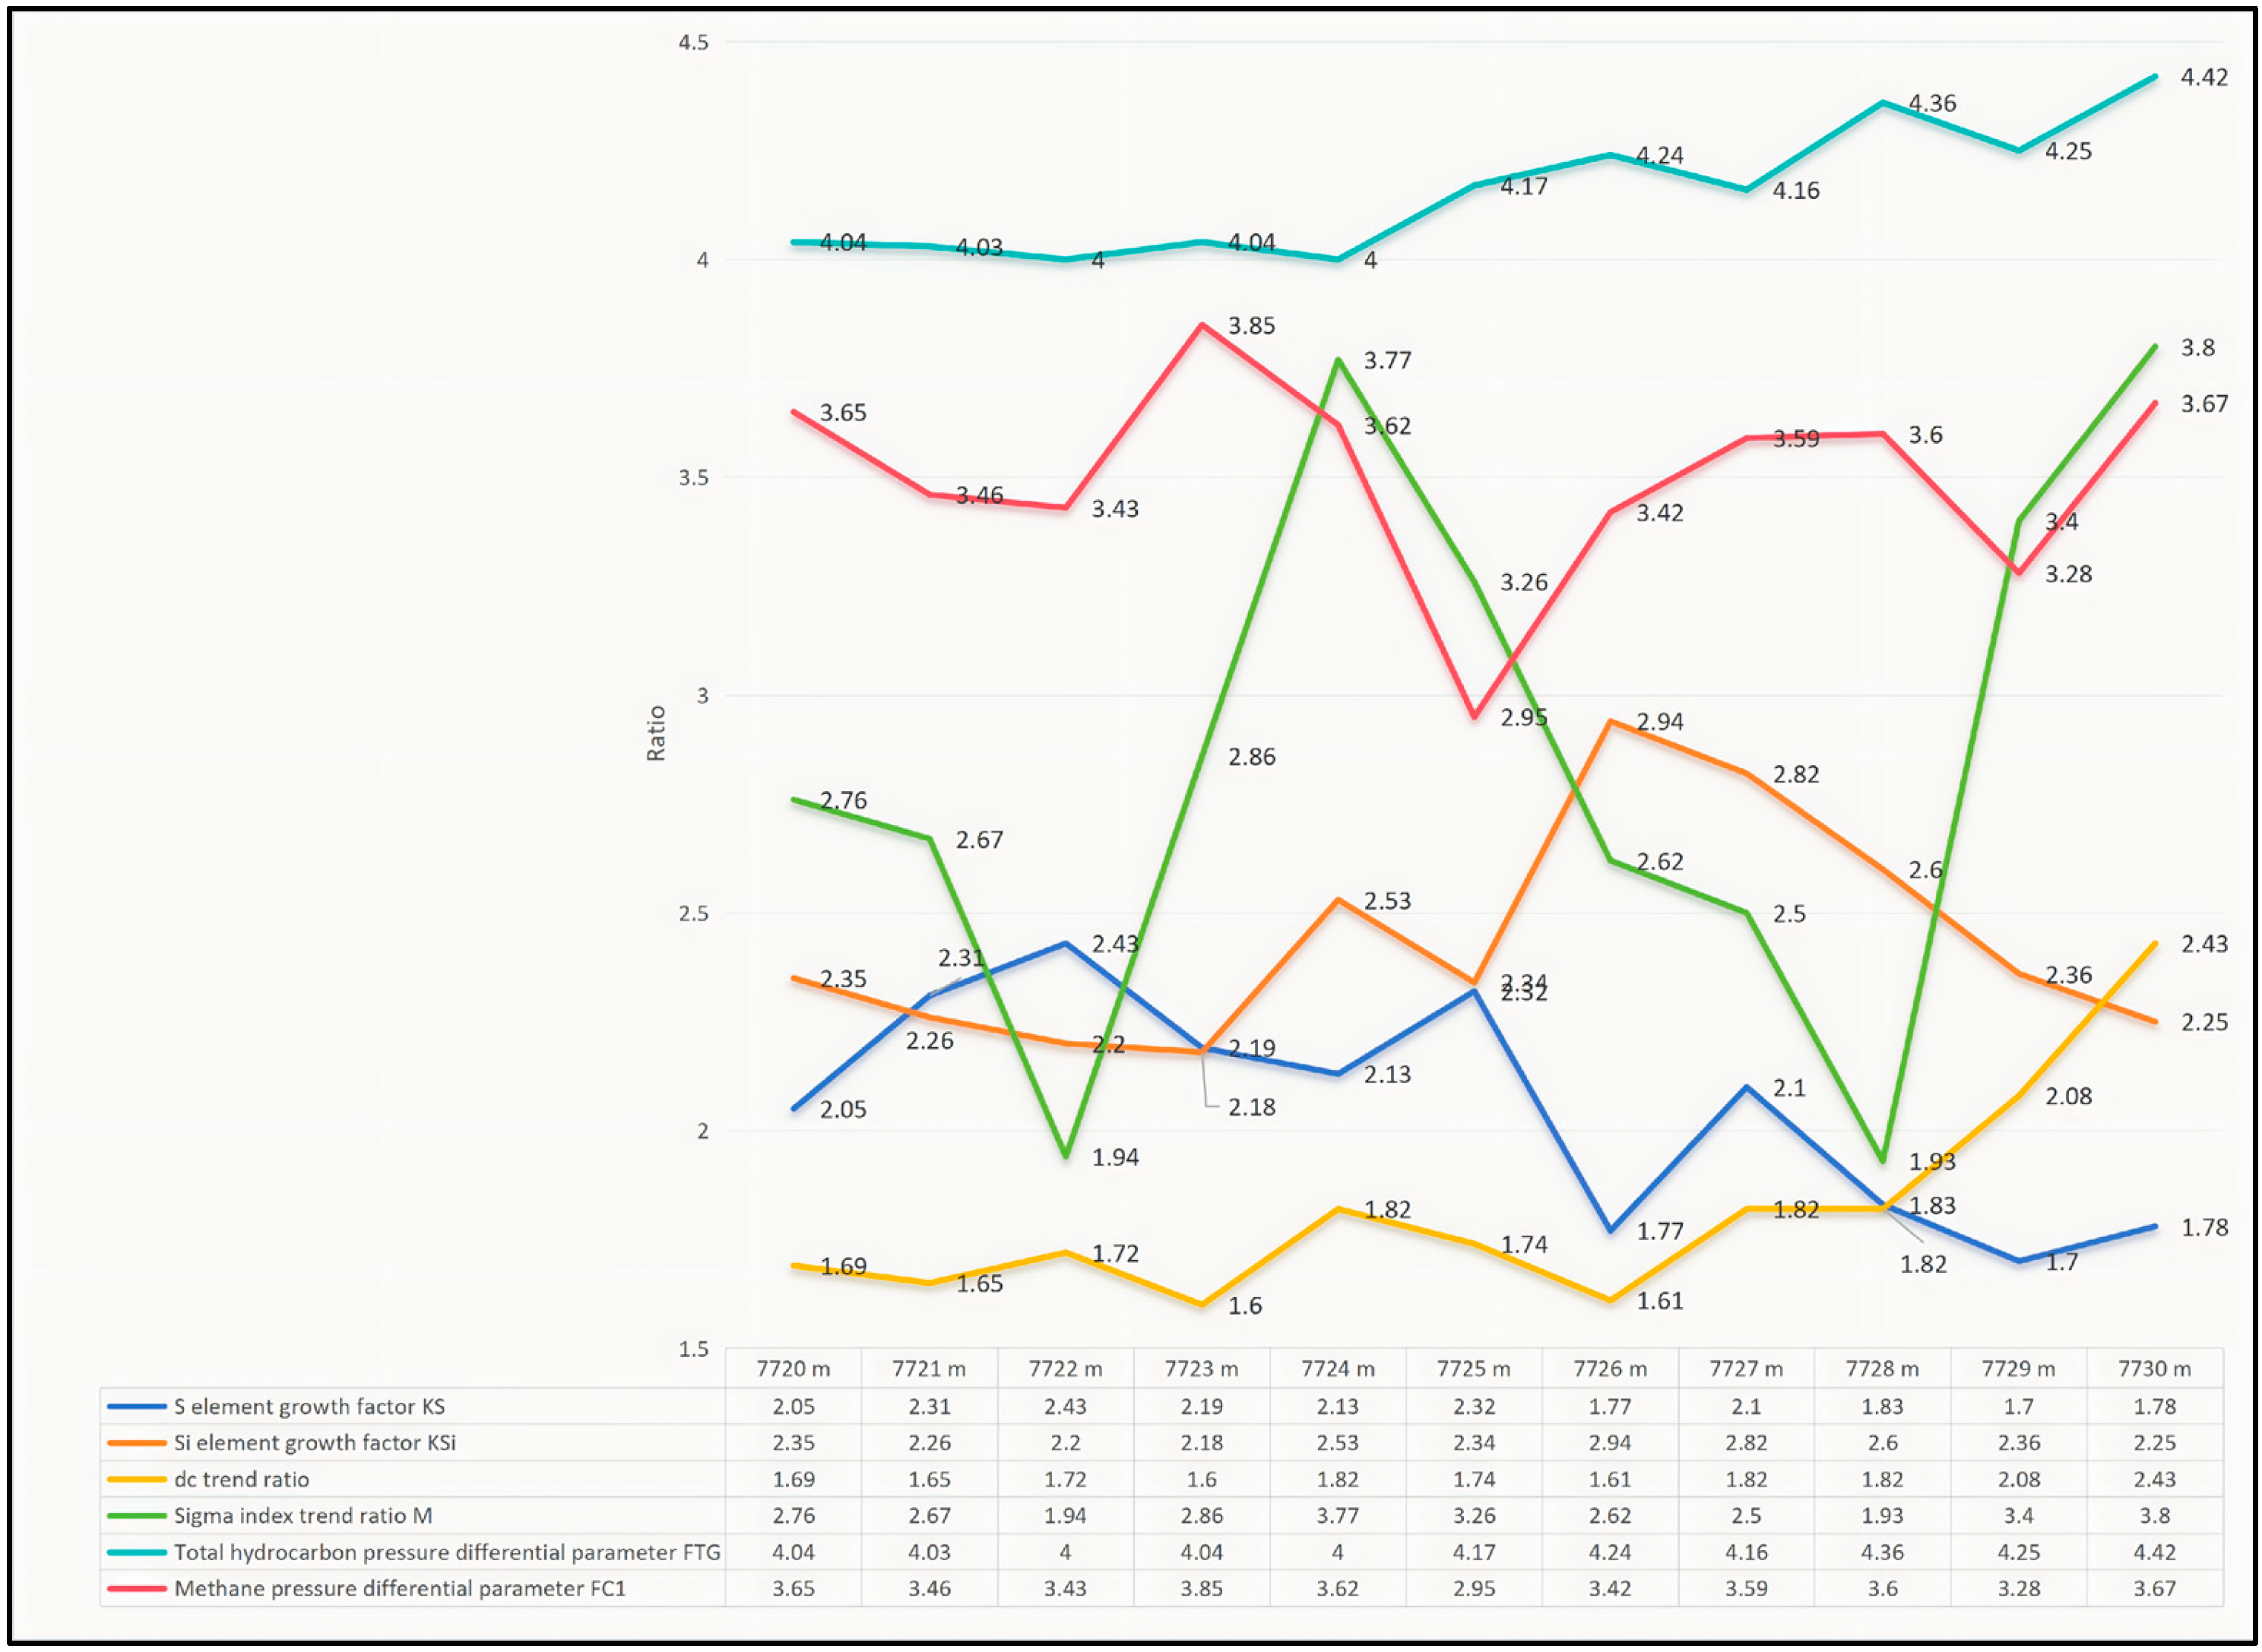
Drilling depth: 7720.00–7730.00 m. Calculated probability: 1.0 (highest risk). Overflow occurred at 7736 m, which was predicted 16 m in advance and was therefore correct (
Figure 11).
- (3)
Third Warning:
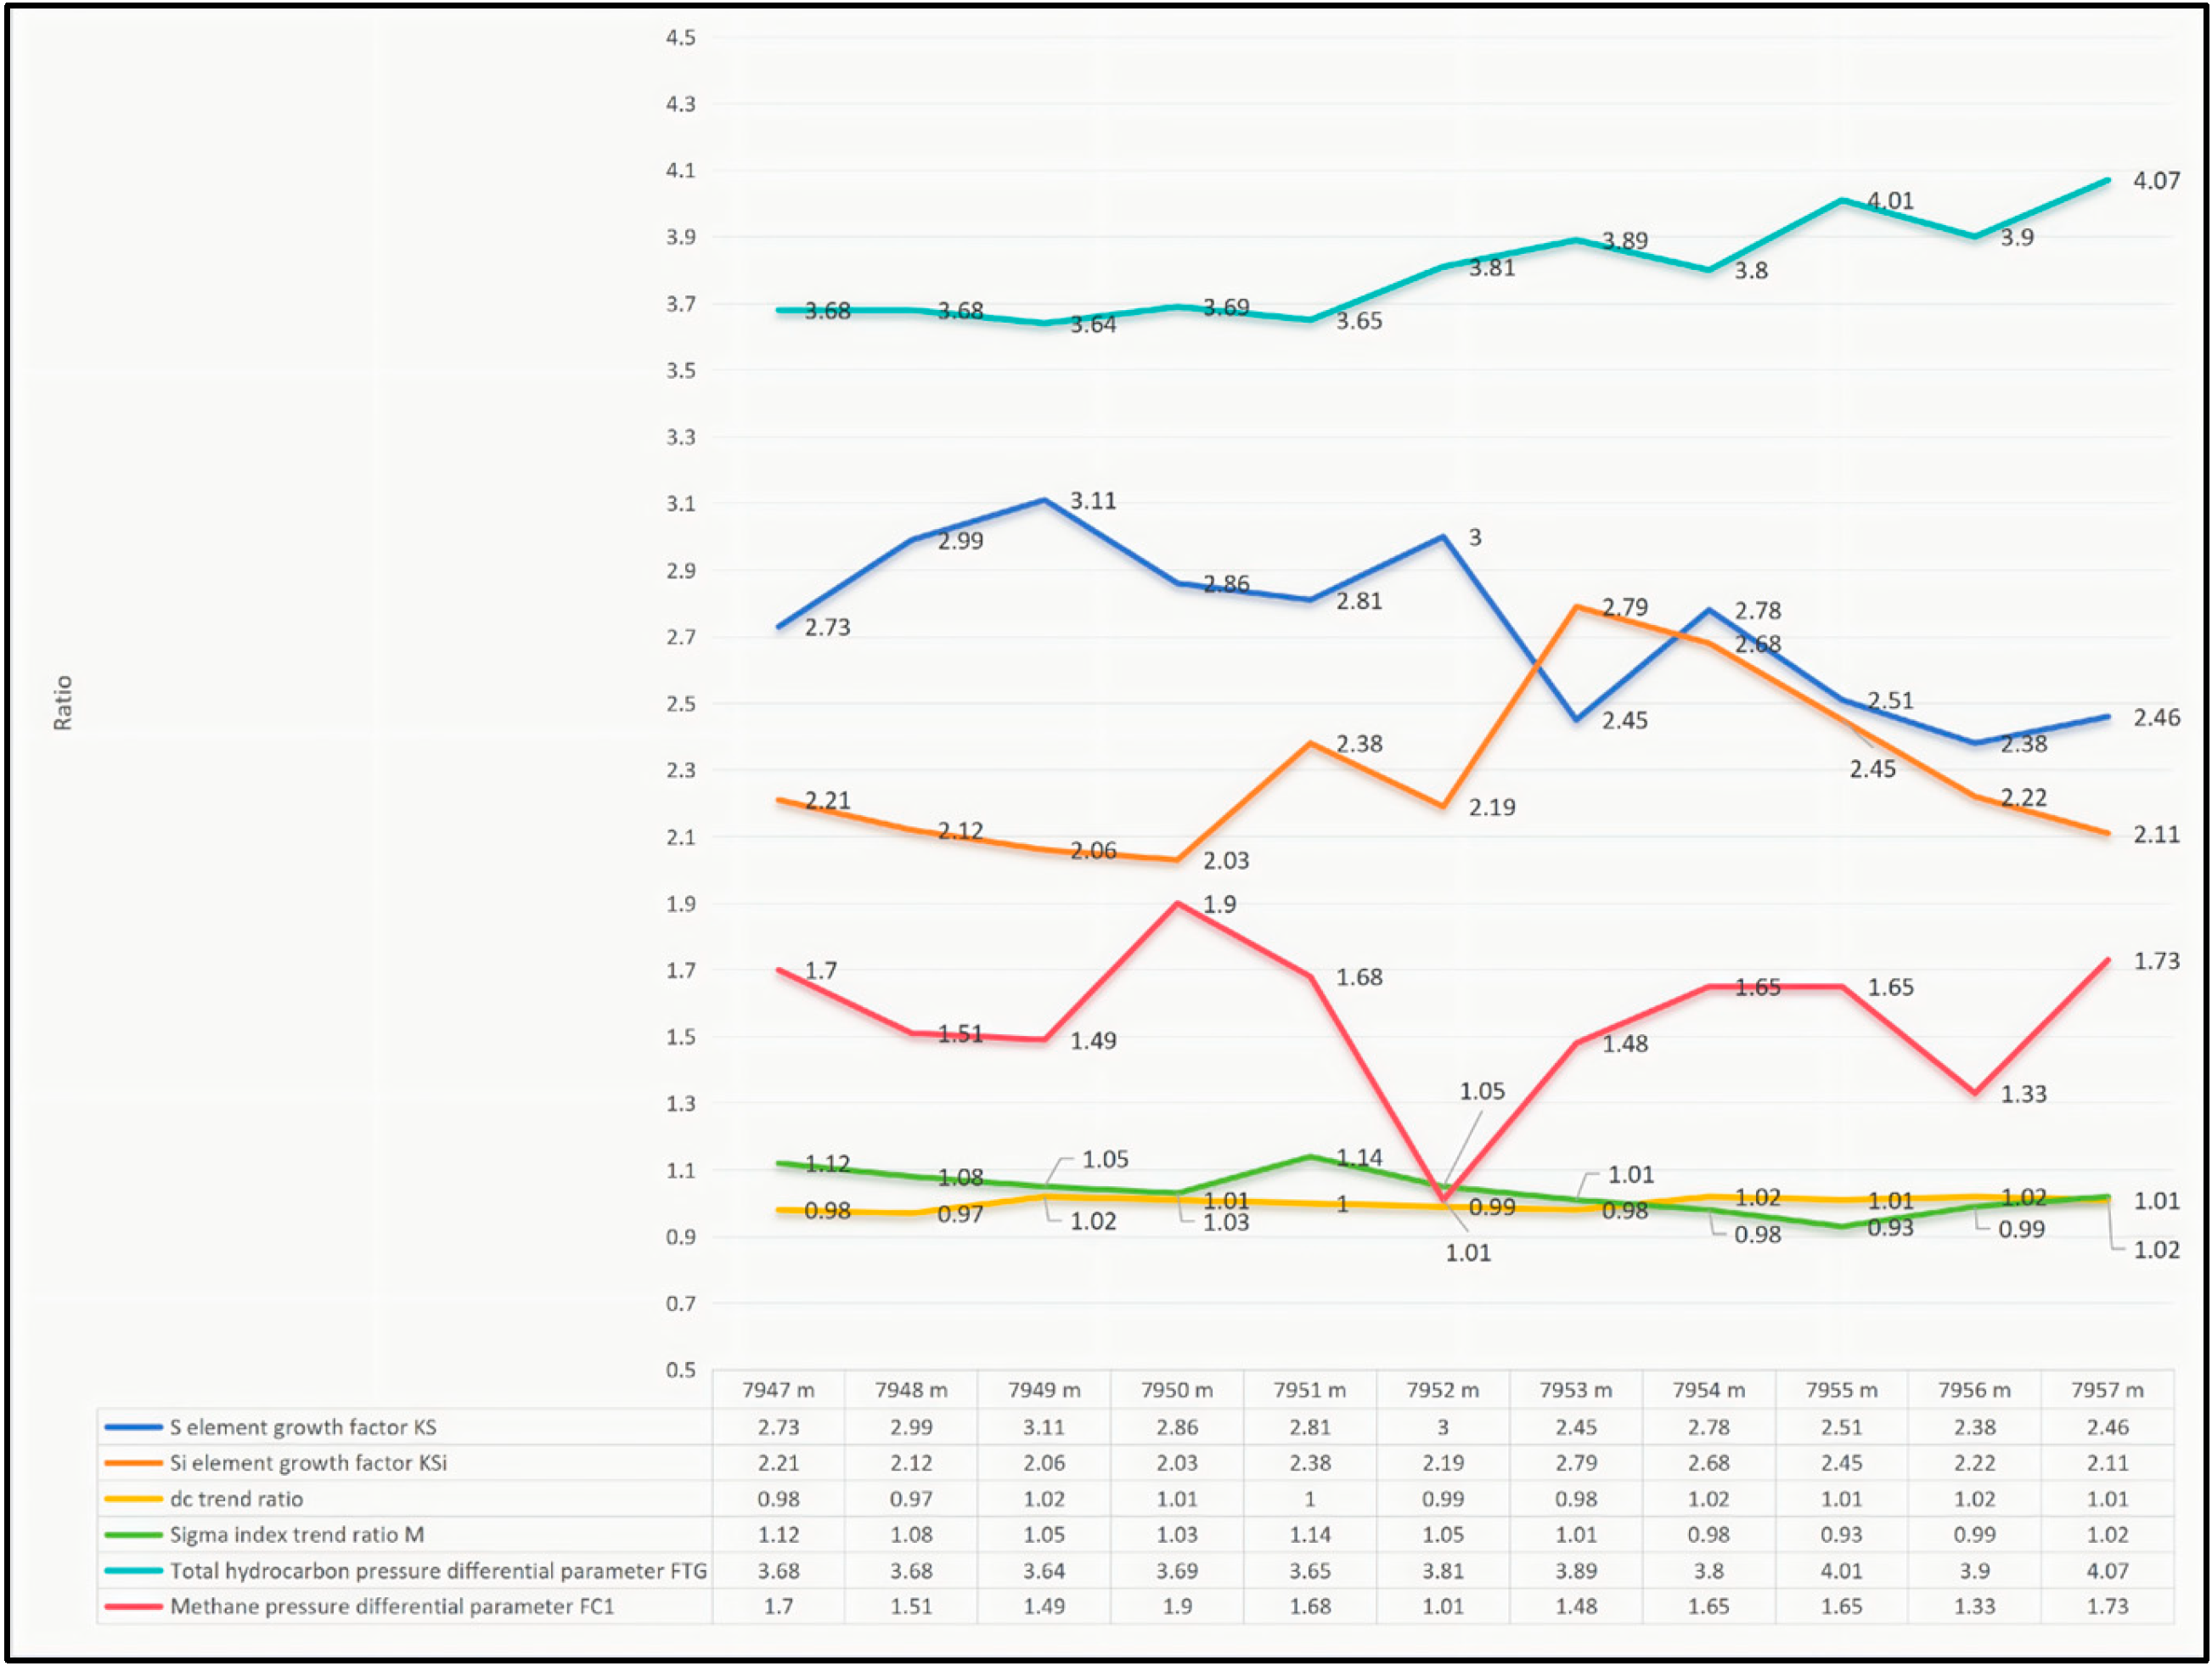
Drilling depth: 7947.00–7957.00 m (
Figure 12). Calculated probability: medium risk. Verification: no abnormal overpressure, correct.
In total, three warnings were conducted in this well. The first warning indicated a probability of 0.45, but abnormal overpressure developed in the lower formation, resulting in a relatively large prediction error. The other two predictions of high-pressure formations were successfully achieved in advance, enabling effective prediction of abnormal overpressure in ultra-deep carbonate formations. Total: three warnings, accuracy 66.7% (one false alarm, two correct).
5.3. Well TKe-1
Three warnings were conducted, all correctly predicting no abnormal overpressure, accuracy 100% (
Figure 10,
Figure 11 and
Figure 12) omitted for simplified complete tables with clear units and annotations).
- (1)
First Warning:
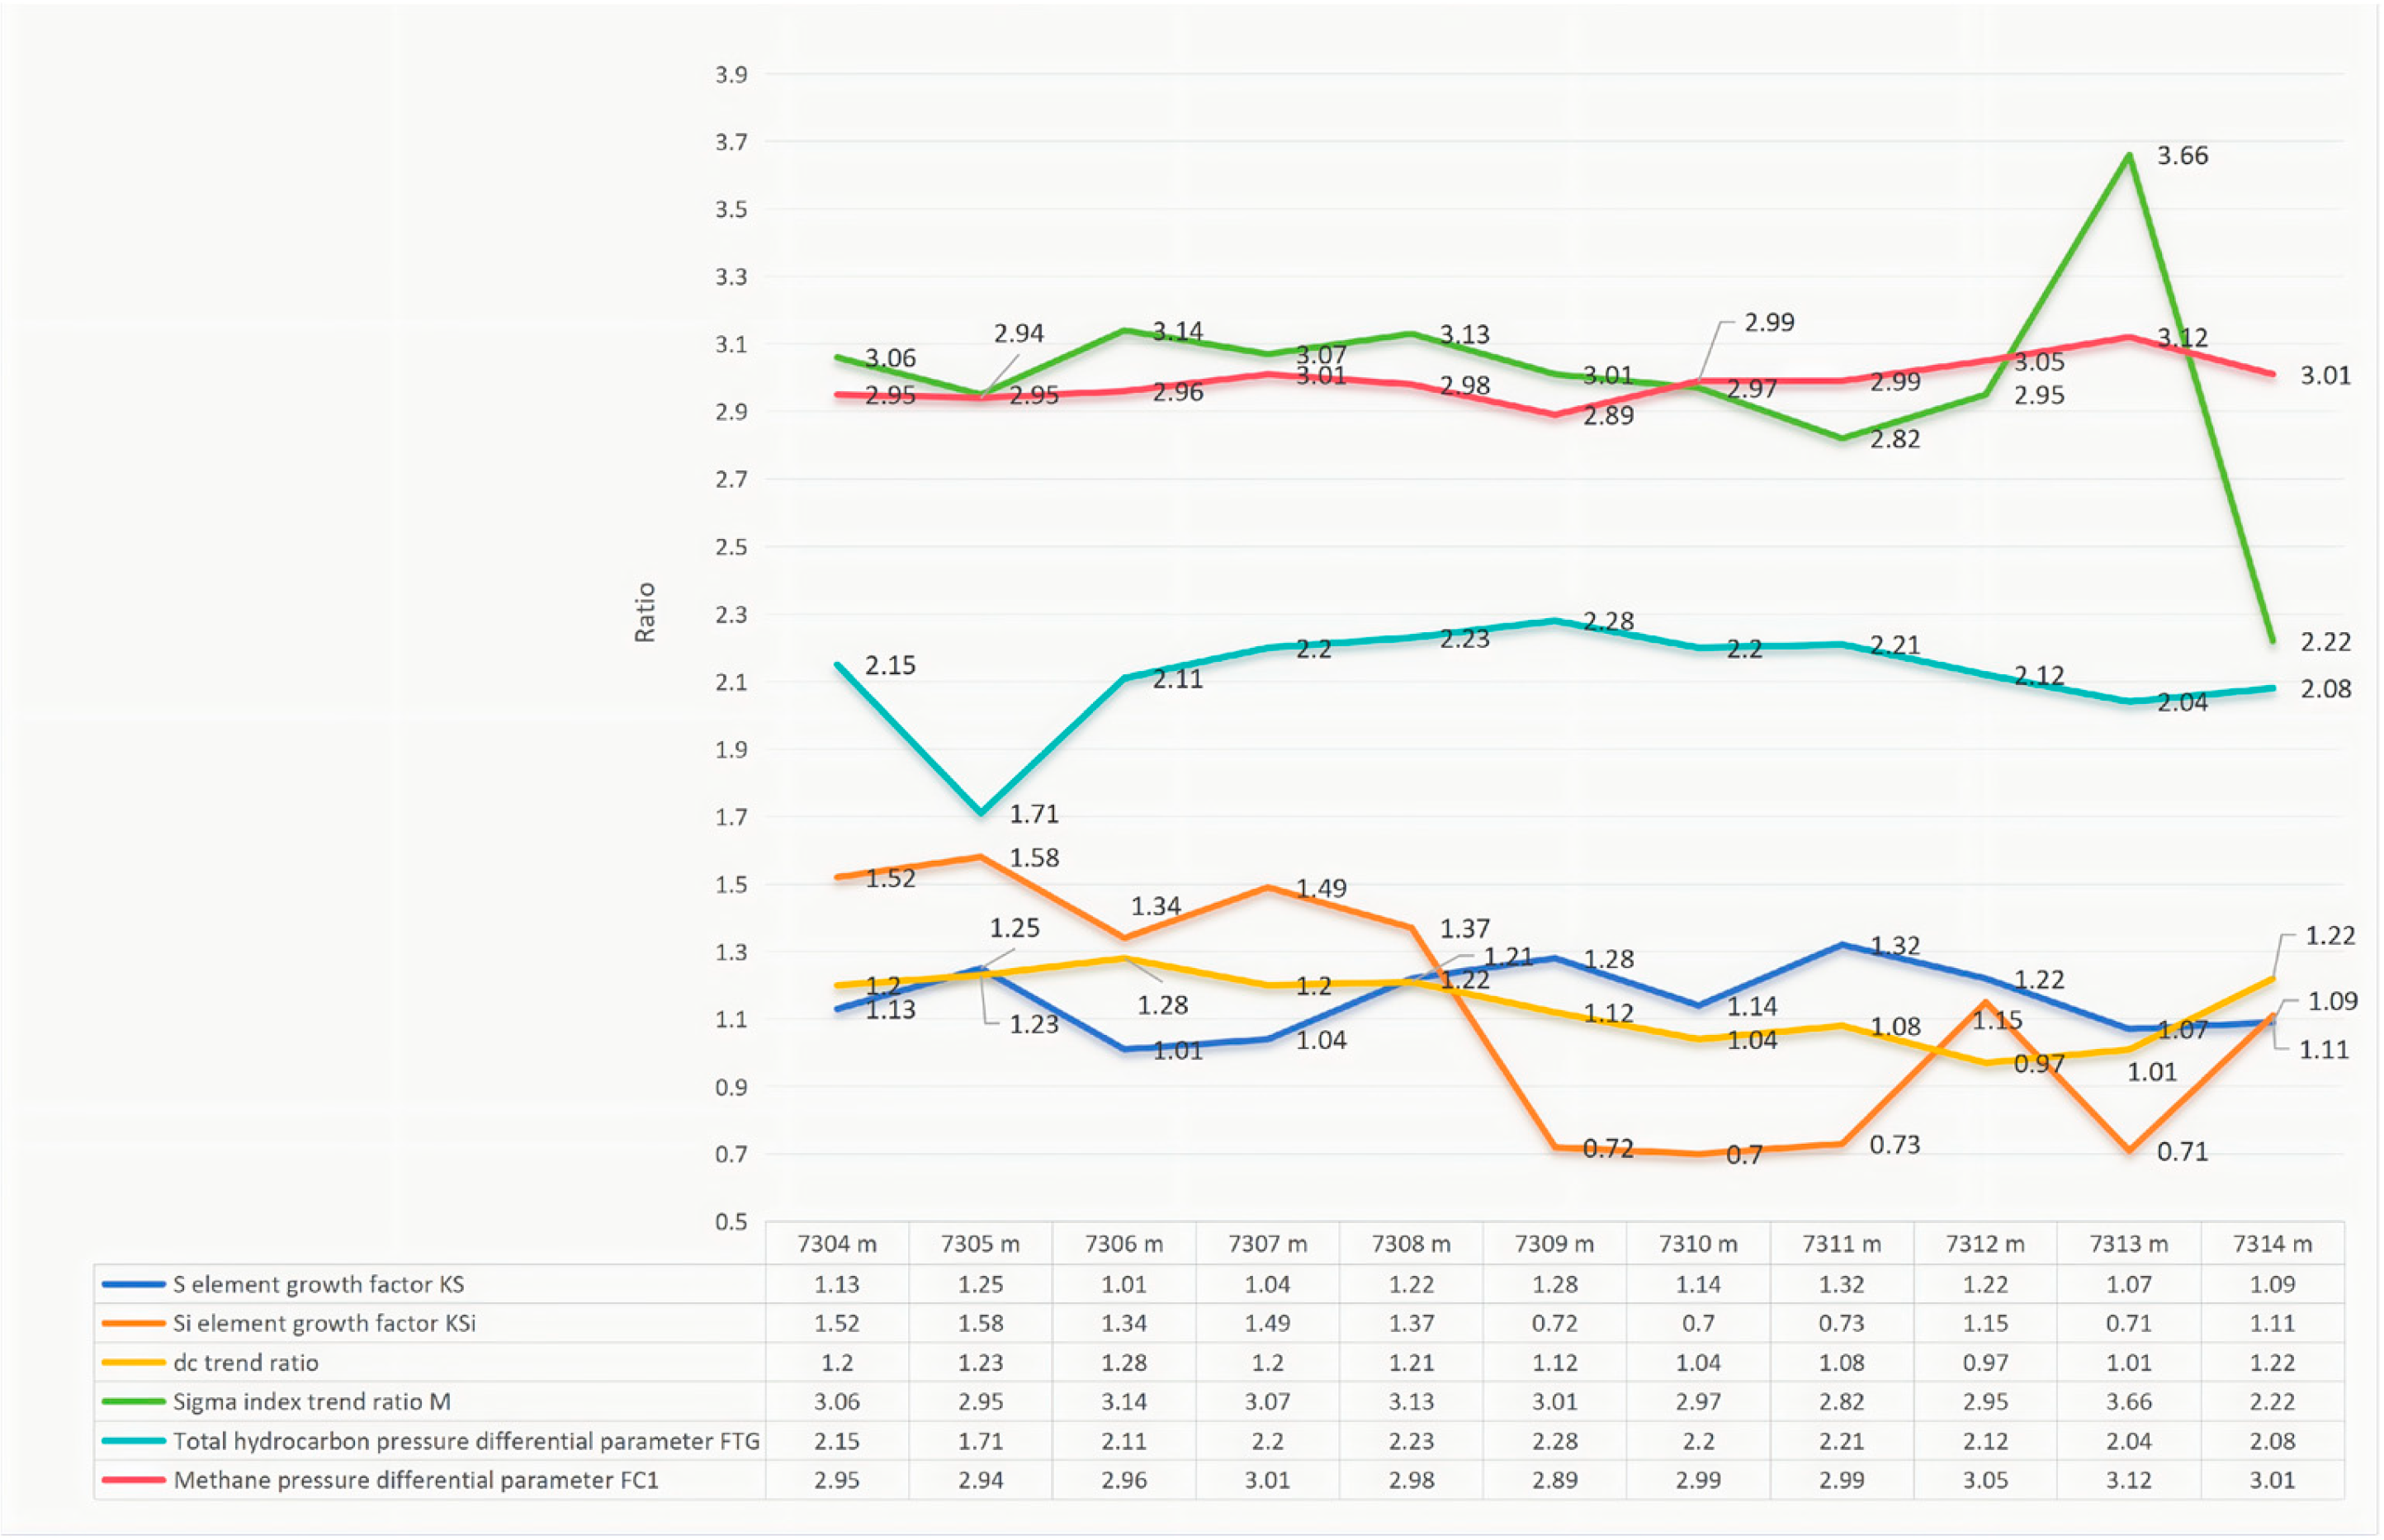
When drilling reached 7304.00–7314.00 m, the DC index and sigma index deviated significantly from the trend line and decreased beginning at 7304 m. The elemental logging parameters Si and S showed no obvious anomalies, and the gas pressure difference parameters did not exhibit significant variation. The detailed parameter analysis is shown in the table below (
Figure 13).
According to the comprehensive formation pressure monitoring method, the probability of abnormal high-pressure development in the lower formation was calculated to be 0.2, indicating a very low likelihood of abnormal overpressure in the lower formation. Subsequent drilling verification confirmed that no abnormal overpressure developed in the lower formation. The decrease in rock drillability parameters was caused by the introduction of a high-efficiency aggressive PDC drill bit.
- (2)
Second Warning:
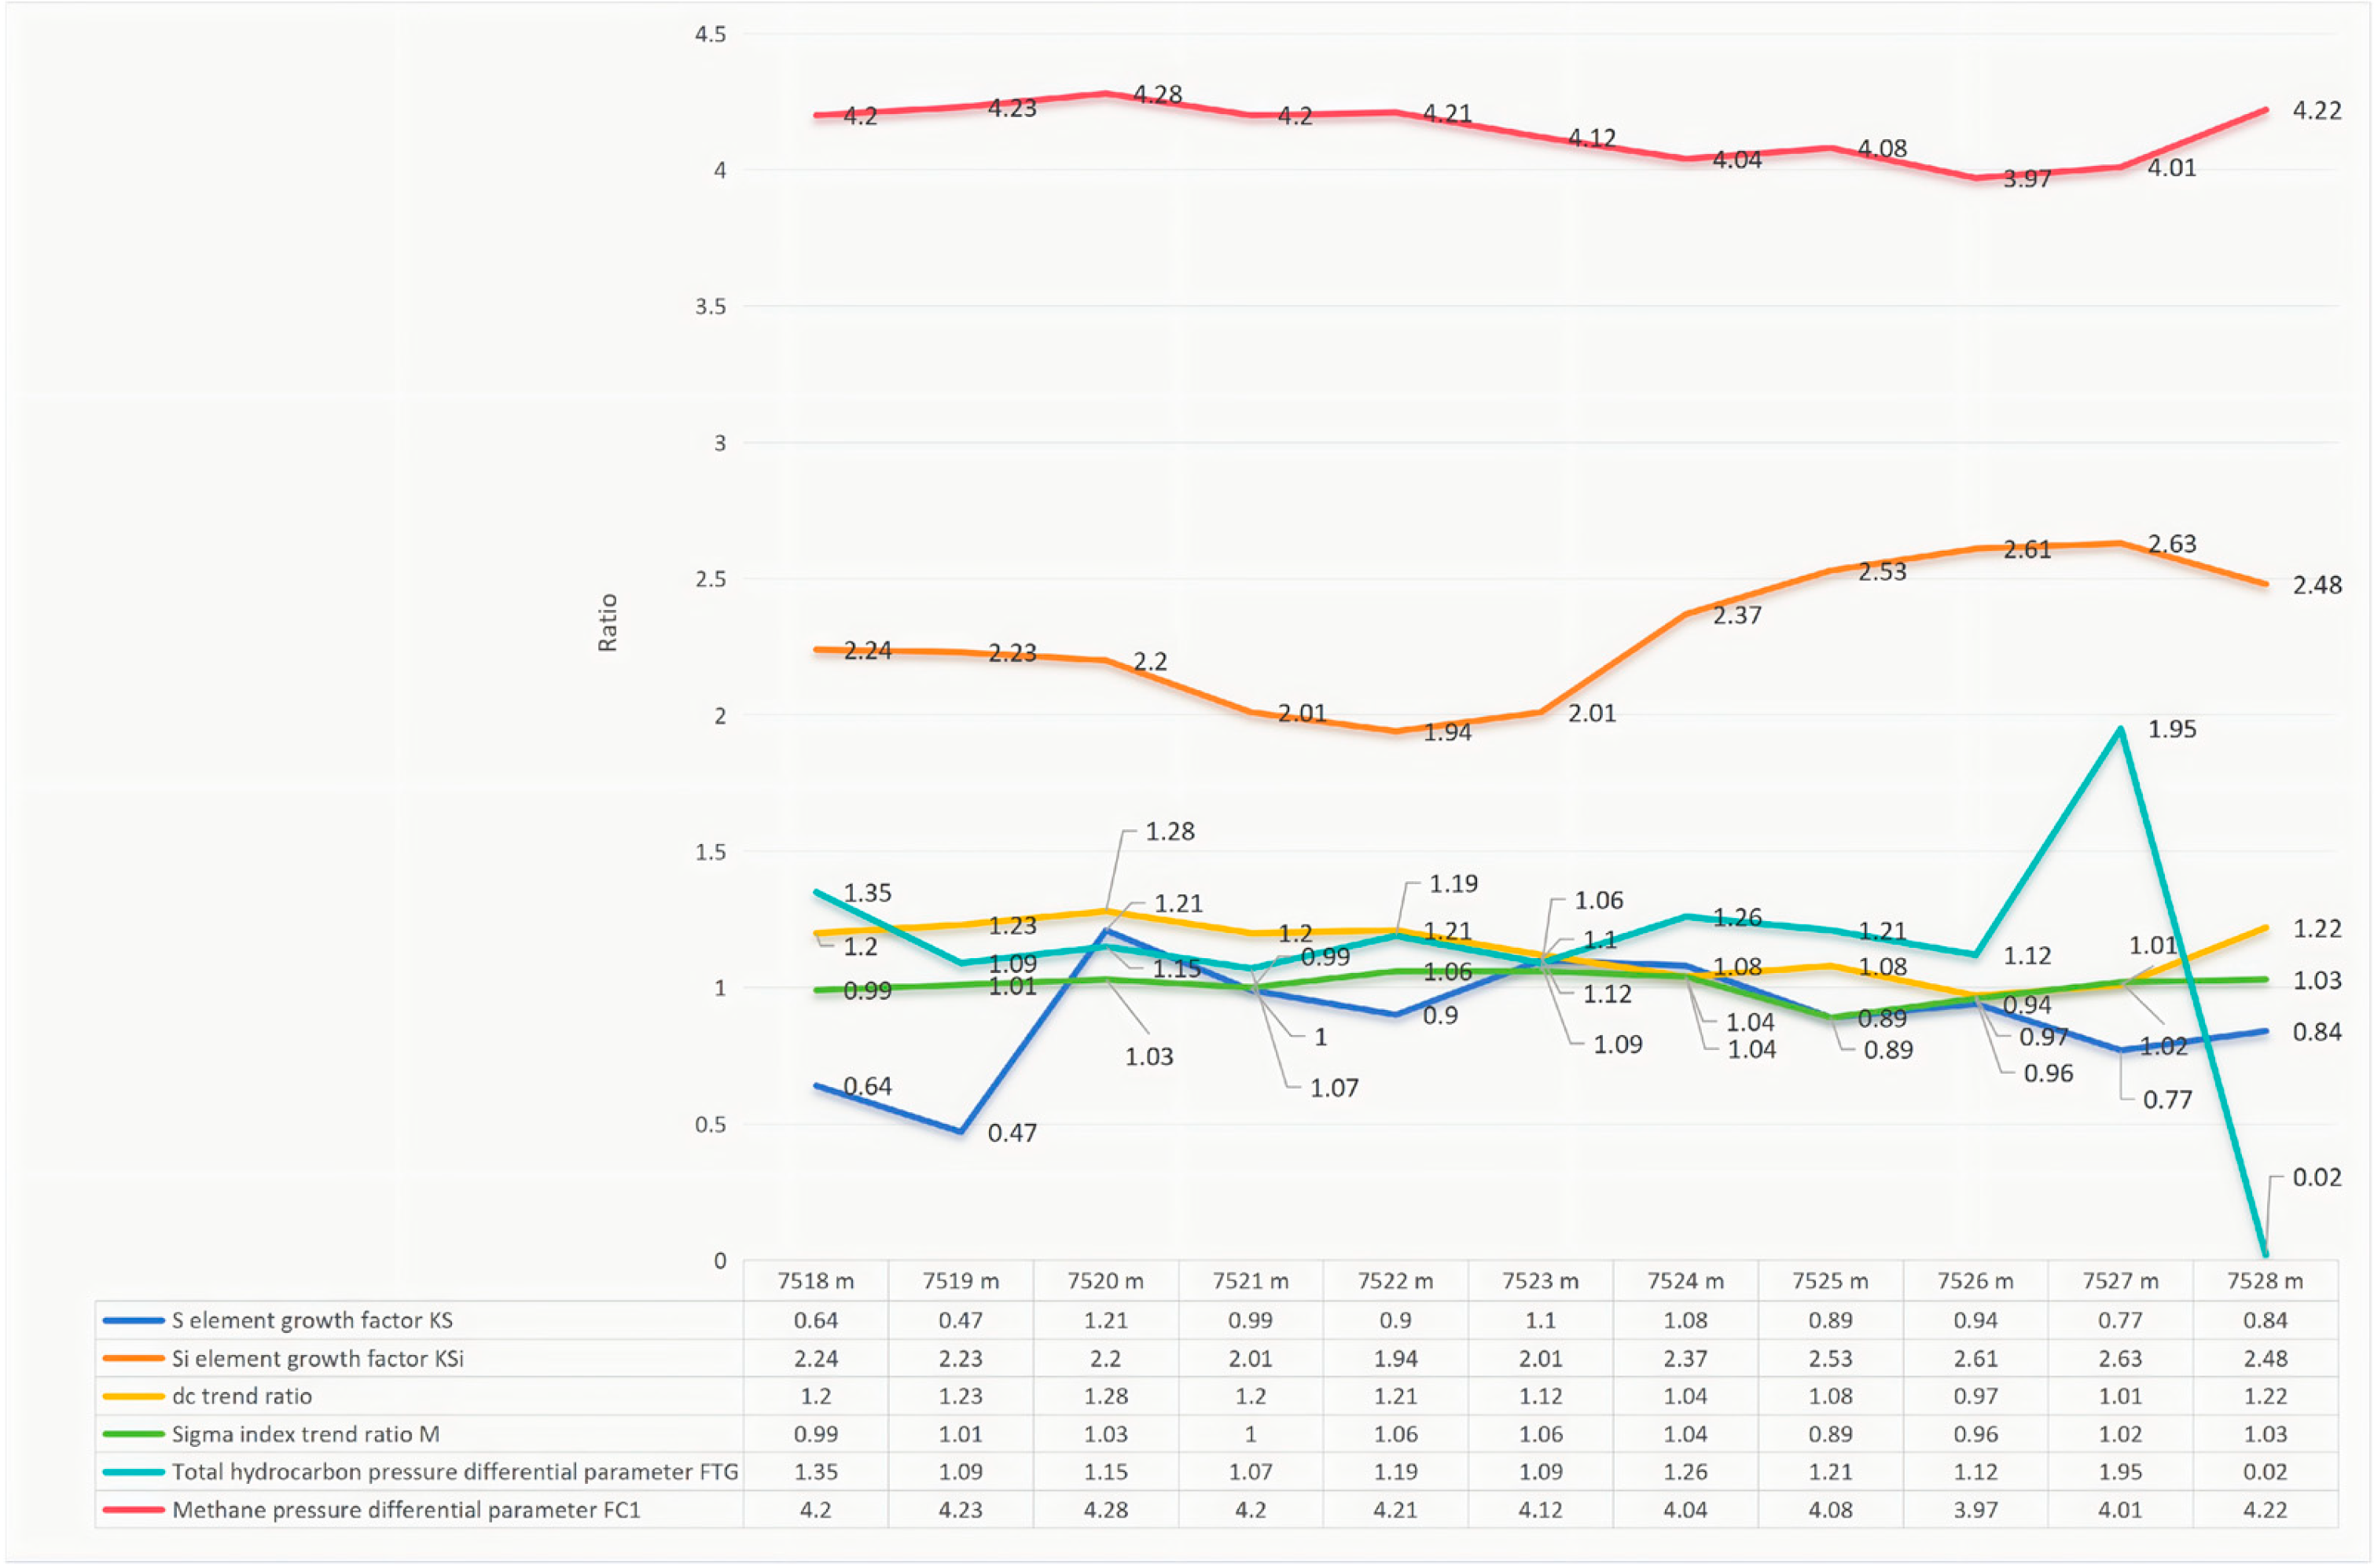
When drilling reached 7518.00–7528.00 m, the DC index and sigma index did not show obvious anomalies. The Si element exhibited an increasing trend, whereas the S element parameter did not show any obvious anomaly. The total hydrocarbon gas pressure difference parameter showed no significant variation, while the methane gas pressure difference parameter increased noticeably. The detailed parameter analysis is shown in the table below (
Figure 14).
According to the comprehensive formation pressure monitoring method, the probability of abnormal high-pressure development in the lower formation was calculated to be 0.35, indicating a very low possibility of abnormal overpressure development. Subsequent drilling verification confirmed that no abnormal overpressure developed in the lower formation.
- (3)
Third Warning:
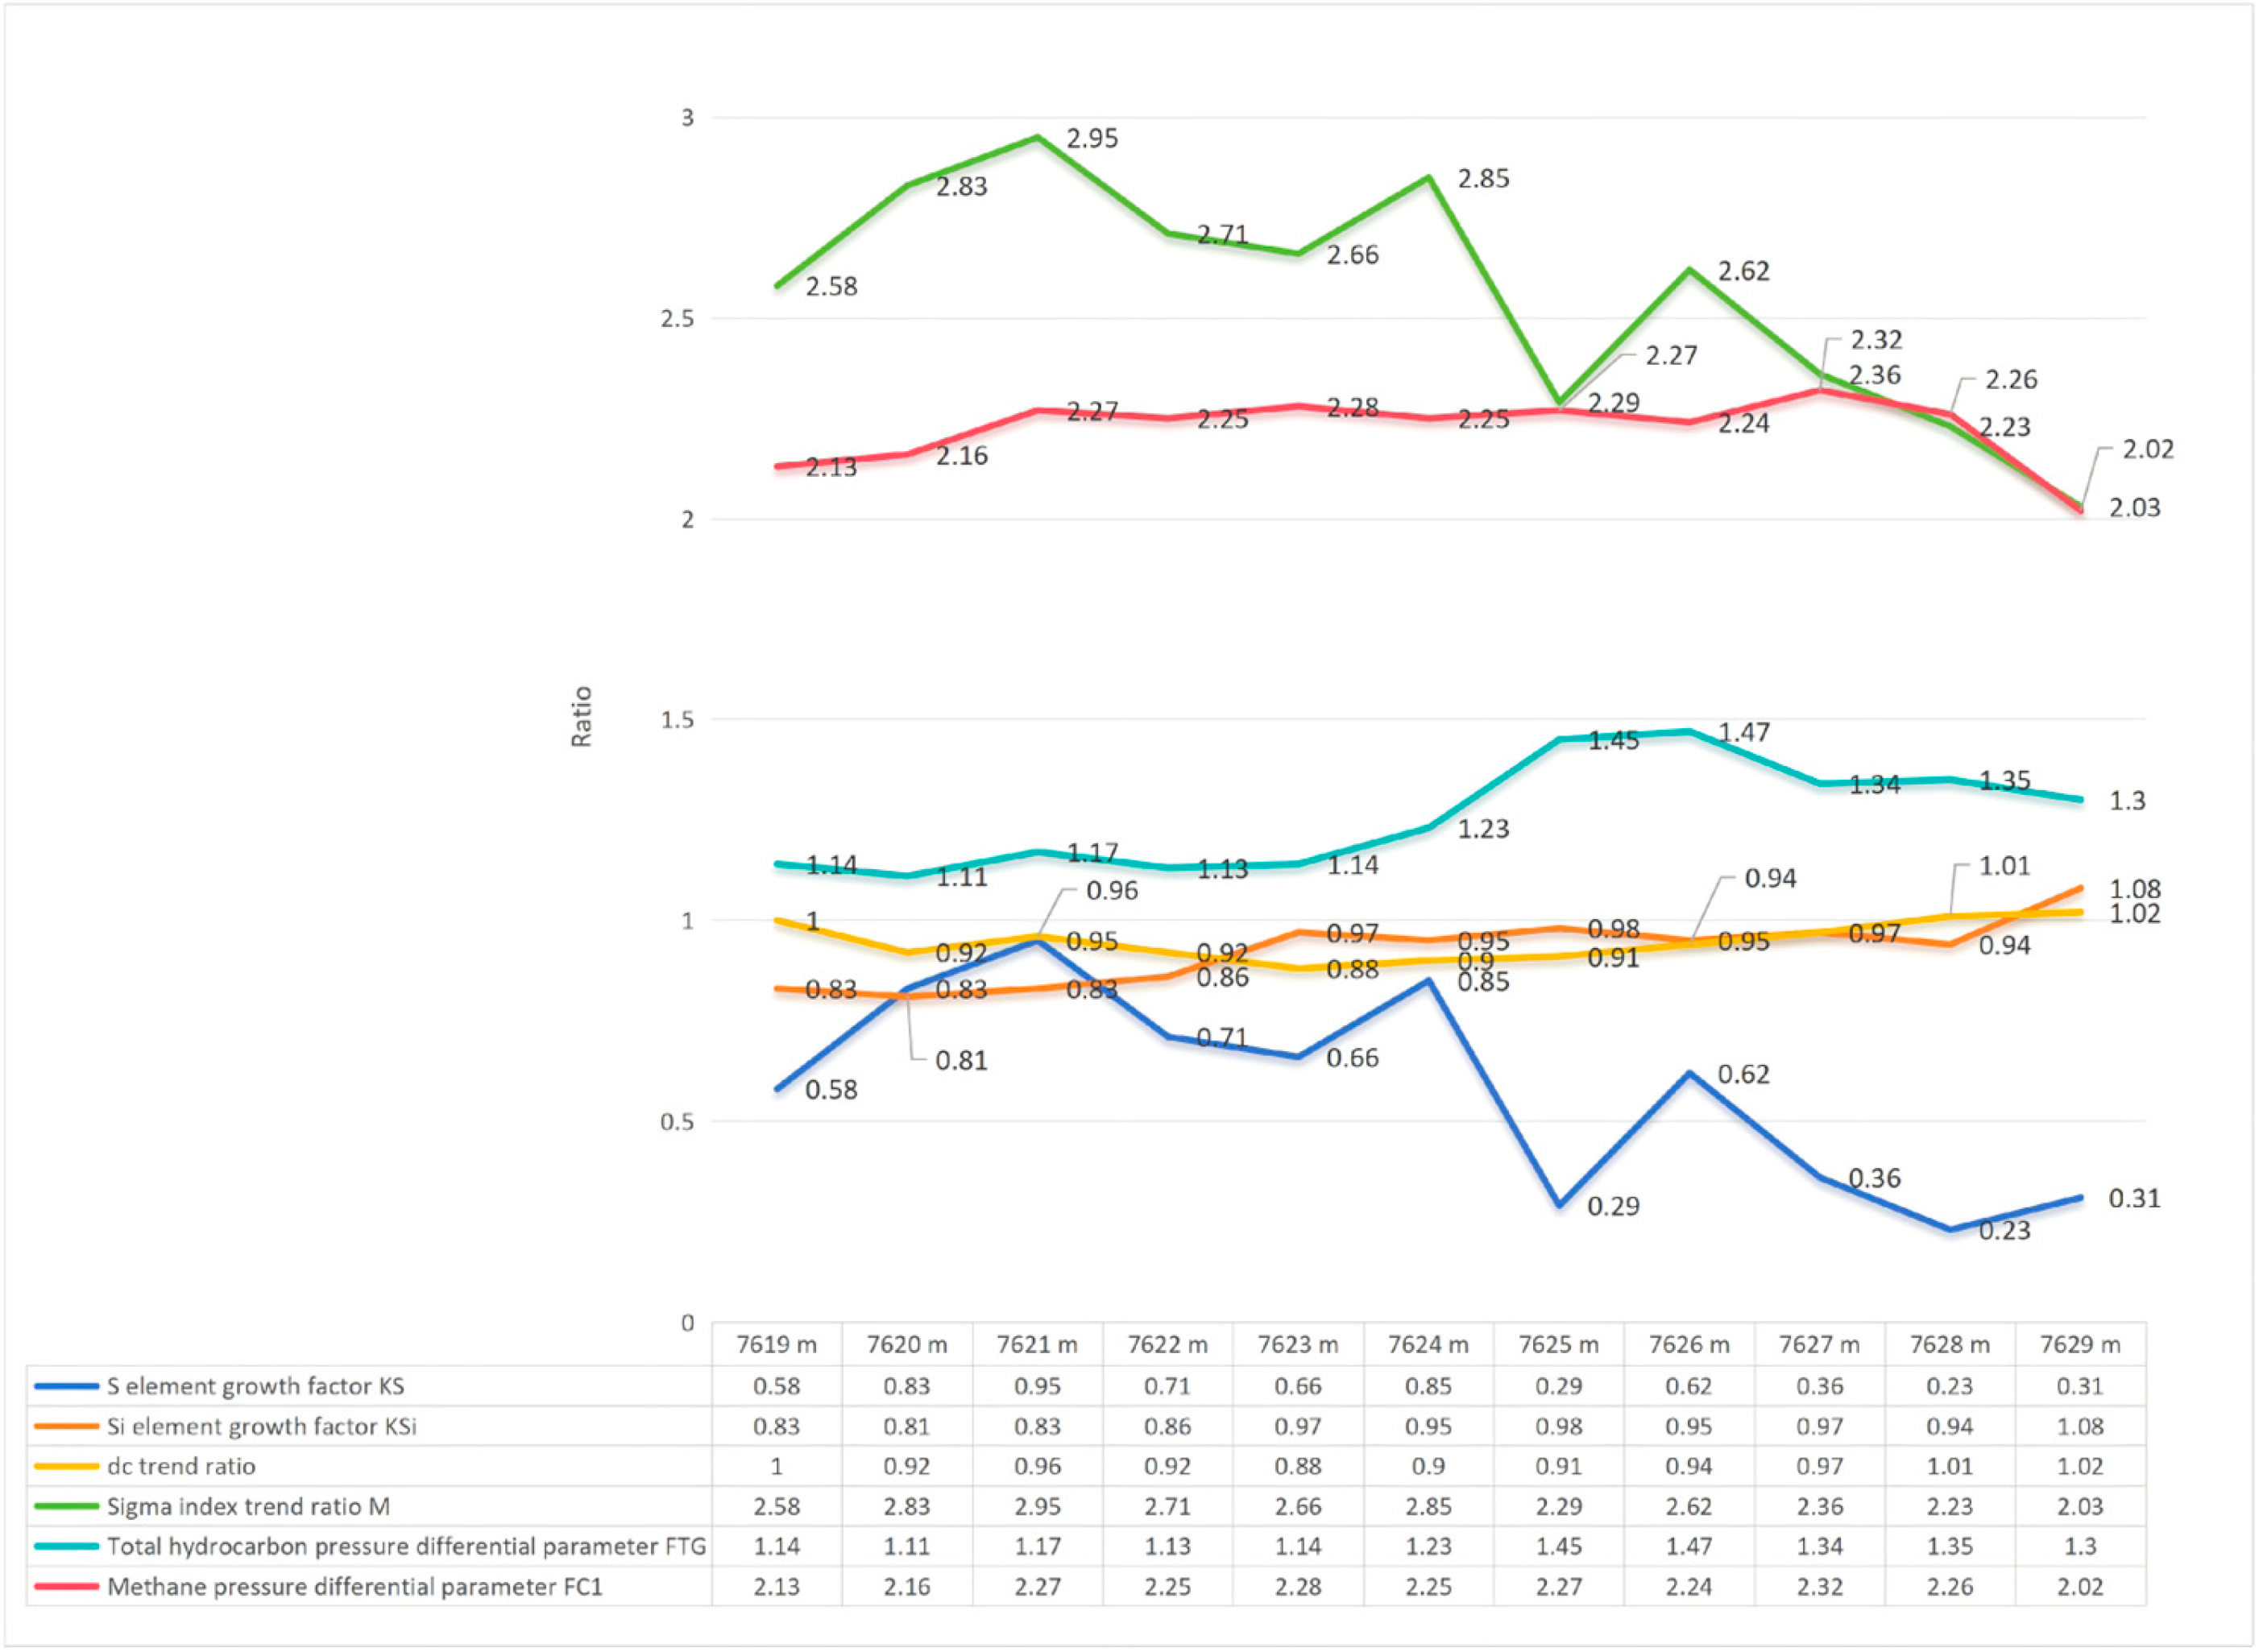
When drilling reached 7619.00–7629.00 m, the DC index showed no obvious anomaly, whereas the sigma index deviated from the trend line. The elemental logging parameters Si and S did not show obvious anomalies, and the gas pressure difference parameters did not exhibit significant variation. The detailed parameter analysis is shown in the table below (
Figure 15).
According to the comprehensive formation pressure monitoring method, the probability of abnormal high-pressure development in the lower formation was calculated to be 0.2, indicating a very low likelihood of abnormal overpressure in the lower formation [
33,
34,
35]. Subsequent drilling verification confirmed that no abnormal overpressure developed in the lower formation.
A total of three warnings were conducted in this well, all of which successfully predicted that no high-pressure formation developed in the well. Post-drilling logging verification further confirmed the high accuracy of the prediction results.
6. Conclusions
An integrated while-drilling process for detecting abnormal formation overpressure was developed by combining elemental logging, gas logging, and drilling engineering parameters, realizing real-time multi-source identification of pressure anomalies in ultra-deep carbonate formations.
Key indicators (S, Si elemental anomalies, gas logging parameters) were validated via ROC analysis, confidence intervals, and sensitivity analysis; thresholds are field-calibrated and statistically robust. The sigma index was clearly defined with a calculation formula, improving method reproducibility.
The false alarm in Well Hade-18 was caused by PDC bit interference and local fault heterogeneity; dynamic threshold optimization can reduce such misjudgments. The model weighting scheme (0.4, 0.3, 0.2, 0.1) was verified via AHP and entropy weight method, with good objectivity. Field application in 3 Tarim Basin ultra-deep wells achieved 88.89% prediction accuracy, effectively improving drilling safety.
Application scope and boundary conditions: This method is only validated for Ordovician ultra-deep (>6000 m) carbonate formations in the Tarim Basin. It is not directly applicable to clastic formations, shallow formations, or other basins without:
Recalibrating indicator thresholds;
Re-optimizing parameter weights;
Verifying adaptability to local lithology and tectonic settings.
Future work will expand the sample size, introduce machine learning for dynamic threshold optimization, and extend validation to other basins and lithologies.
Author Contributions
Conceptualization, G.Z., L.C., and L.W.; methodology, G.Z.; software, G.Z.; validation, G.Z., G.C., and Y.N.; formal analysis, G.Z.; investigation, G.Z.; resources, G.Z.; data curation, G.Z. and L.C.; writing—original draft preparation, G.Z. and L.W.; writing—review and editing, G.Z., G.C., C.H., C.W., and L.W.; visualization, G.Z., L.W., and C.H.; supervision, G.C. and L.C.; project administration, G.Z.; funding acquisition, G.C. and Y.N. All authors have read and agreed to the published version of the manuscript.
Funding
This research was funded by the Jingzhou Association for Science and Technology, Hubei, China, grant number JZCXZK202525.
Data Availability Statement
The data supporting the findings of this study are available from the corresponding author upon reasonable request. The well logging and core measurement data utilized in this research were furnished by CNPC under a confidentiality agreement. Owing to proprietary constraints and confidentiality obligations, public dissemination of these datasets is restricted. With explicit permission from the data provider, representative subsets of the data and implementation specifics pertaining to the associated analytical methodologies may be procured by contacting the corresponding author. The original contributions presented in this study are included in the article. Further inquiries can be directed to the corresponding author.
Acknowledgments
The authors gratefully acknowledge CNP for providing the well logging data, elemental and gas logging data, as well as core analysis results utilized in this study. We also express our sincere appreciation to the anonymous reviewers for their insightful comments and constructive suggestions, which greatly improved the quality and clarity of the manuscript. During the preparation of this paper, the authors employed Grammarly (Version 14.0) solely for grammar checking and language polishing. The authors have thoroughly reviewed and edited the final content and accept full responsibility for the work presented.
Conflicts of Interest
Authors Gongyang Chen and Yi Ning were employed by the company Hubei Changlu Wellbore Information Technology Co., Ltd. Author Chuan He was employed by the company Jianghan Branch, Sinopec Geophysical Corporation. The remaining authors declare that the research was conducted in the absence of any commercial or financial relationships that could be construed as a potential conflict of interest. The companies in affiliation and funding had no role in the design of the study; in the collection, analyses, or interpretation of data; in the writing of the manuscript, or in the decision to publish the results.
References
- He, D.; Jia, C.; Zhao, W.; Xu, F.; Luo, X.; Liu, W.; Tang, Y.; Gao, S.; Zheng, X.; Zheng, N.; et al. Research Progress and Key Issues of Ultra-Deep Oil and Gas Exploration in China. Pet. Explor. Dev. 2023, 50, 1333–1344. [Google Scholar] [CrossRef] [Scilit]
- Zhu, G.; Zhang, Z.; Jiang, H.; Yan, L.; Chen, W.; Li, T.; Li, X. Evolution of the Cryogenian Cratonic Basins in China, Paleo-Oceanic Environment and Hydrocarbon Generation Mechanism of Ancient Source Rocks, and Exploration Potential in 10,000 M-Deep Strata. Earth-Sci. Rev. 2023, 244, 104506. [Google Scholar] [CrossRef] [Scilit]
- Guo, X.; Cai, X.; Liu, J.; Liu, C.; Cheng, Z.; Gao, B.; Shi, L. Natural Gas Exploration Progress of Sinopec During the 13th Five-Year Plan and Prospect Forecast During the 14th Five-Year Plan. Nat. Gas Ind. B 2022, 9, 107–118. [Google Scholar] [CrossRef] [Scilit]
- Zhu, G.; Milkov, A.V.; Li, J.; Xue, N.; Chen, Y.; Hu, J.; Li, T.; Zhang, Z.; Chen, Z. Deepest Oil in Asia: Characteristics of Petroleum System in the Tarim Basin, China. J. Pet. Sci. Eng. 2020, 199, 108246. [Google Scholar] [CrossRef] [Scilit]
- He, C.; Mao, N.; Cheng, L.; Du, G. An Intelligent Choquet Fuzzy Integral-Based Framework for Risk Assessment in Seismic Acquisition Processes. Processes 2025, 13, 3558. [Google Scholar] [CrossRef] [Scilit]
- Saha, A.; Bhattacharya, B. Controls on Near-Surface and Burial Diagenesis of a Syn-Rift Siliciclastic Rock Succession: A Study from Permian Barren Measures Formation, Southern India. Sediment. Geol. 2022, 436, 106170. [Google Scholar] [CrossRef] [Scilit]
- He, C.; Mao, N.; Zhang, Z.; Liu, L.; Yang, F.; Ning, Y.; Wan, L. Suitability Evaluation of CO2 Geological Storage in the Jianghan Basin Using Choquet Fuzzy Integral and Multi-Source Indices. Processes 2026, 14, 395. [Google Scholar] [CrossRef] [Scilit]
- Kopal, M.; Yerkinkyzy, G.; Nygård, M.T.; Cely, A.; Ungar, F.; Donnadieu, S.; Yang, T. Real-Time Fluid Identification from Integrating Advanced Mud Gas and Petrophysical Logs. Petrophysics 2024, 65, 470–483. [Google Scholar] [CrossRef] [Scilit]
- Mishra, P.; Roger, J.-M.; Jouan-Rimbaud-Bouveresse, D.; Biancolillo, A.; Marini, F.; Nordon, A.; Rutledge, D.N. Recent Trends in Multi-Block Data Analysis in Chemometrics for Multi-Source Data Integration. TrAC Trends Anal. Chem. 2021, 137, 116206. [Google Scholar] [CrossRef] [Scilit]
- Fan, C.; He, W.; Liu, Y.; Xue, P.; Zhao, Y. A Novel Image-Based Transfer Learning Framework for Cross-Domain HVAC Fault Diagnosis: From Multi-Source Data Integration to Knowledge Sharing Strategies. Energy Build. 2022, 262, 111995. [Google Scholar] [CrossRef] [Scilit]
- Boutaleb, K.; Baouche, R.; Sadaoui, M.; Radwan, A.E. Sedimentological, Petrophysical, and Geochemical Controls on Deep Marine Unconventional Tight Limestone and Dolostone Reservoir: Insights from the Cenomanian/Turonian Oceanic Anoxic Event 2 Organic-Rich Sediments, Southeast Constantine Basin, Algeria. Sediment. Geol. 2022, 429, 106072. [Google Scholar] [CrossRef] [Scilit]
- Alabere, A.O.; Alsuwaidi, M.; Hassan, A.A.; Mansurbeg, H.; Morad, S.; Al-Shalabi, E.W.; Al Jallad, O. Controls on the Formation and Evolution of Multimodal Pore Network in Lower Cretaceous Limestone Reservoir, Abu Dhabi, United Arab Emirates. Mar. Pet. Geol. 2023, 152, 106222. [Google Scholar] [CrossRef] [Scilit]
- Gao, D.; Lin, C.; Huang, L.; Hu, M.; Ren, P.; Sun, C.; Zhao, Y. Depositional Facies and Diagenesis of the Lianglitage Formation in Northwestern Tazhong Uplift, Tarim Basin, China: Implications for the Genesis of Ultra-Deep Limestone Reservoir. Arab. J. Geosci. 2021, 14, 750. [Google Scholar] [CrossRef] [Scilit]
- Aljawad, M.S.; Aboluhom, H.; Schwalbert, M.P.; Al-Mubarak, A.; Alafnan, S.; Mahmoud, M. Temperature Impact on Linear and Radial Wormhole Propagation in Limestone, Dolomite, and Mixed Mineralogy. J. Nat. Gas Sci. Eng. 2021, 93, 104031. [Google Scholar] [CrossRef] [Scilit]
- Lai, J.; Liu, S.; Xin, Y.; Wang, S.; Xiao, C.; Song, Q.; Chen, X.; Yang, K.; Wang, G.; Ding, X. Geological-Petrophysical Insights in the Deep Cambrian Dolostone Reservoirs in Tarim Basin, China. AAPG Bull. 2021, 105, 2263–2296. [Google Scholar] [CrossRef] [Scilit]
- Yan, R.; Xu, G.; Xu, F.; Song, J.; Yuan, H.; Luo, X.; Fu, X.; Cao, Z. The Multistage Dissolution Characteristics and Their Influence on Mound–Shoal Complex Reservoirs from the Sinian Dengying Formation, Southeastern Sichuan Basin, China. Mar. Pet. Geol. 2022, 139, 105596. [Google Scholar] [CrossRef] [Scilit]
- Khazaie, E.; Noorian, Y.; Kavianpour, M.; Moussavi-Harami, R.; Mahboubi, A.; Omidpour, A. Sedimentological and Diagenetic Impacts on Porosity Systems and Reservoir Heterogeneities of the Oligo-Miocene Mixed Siliciclastic and Carbonate Asmari Reservoir in the Mansuri Oilfield, SW Iran. J. Pet. Sci. Eng. 2022, 213, 110435. [Google Scholar] [CrossRef] [Scilit]
- Wang, B.; Qiu, N.; Amberg, S.; Duan, Y.; Littke, R. Modelling of Pore Pressure Evolution in a Compressional Tectonic Setting: The Kuqa Depression, Tarim Basin, Northwestern China. Mar. Pet. Geol. 2022, 146, 105936. [Google Scholar] [CrossRef] [Scilit]
- Wang, Q.-C.; Chen, D.-X.; Gao, X.-Z.; Li, M.-J.; Shi, X.-B.; Wang, F.-W.; Chang, S.-Y.; Yao, D.-S.; Li, S.; Chen, S.-M. Overpressure Origins and Evolution in Deep-Buried Strata: A Case Study of the Jurassic Formation, Central Junggar Basin, Western China. Pet. Sci. 2023, 20, 1429–1445. [Google Scholar] [CrossRef] [Scilit]
- Wei, W.; Whitaker, F.; Hoteit, H.; Vahrenkamp, V. The Creation of Calcite Microcrystals and Microporosity Through Deep Burial Basinal Flow Processes Driven by Plate Margin Obduction—A Realistic Model? Mar. Pet. Geol. 2022, 136, 105432. [Google Scholar] [CrossRef] [Scilit]
- Xie, W.; Chen, S.; Gan, H.; Wang, H.; Wang, M.; Vandeginste, V. Preservation Conditions and Potential Evaluation of the Longmaxi Shale Gas Reservoir in the Changning Area, Southern Sichuan Basin. Geosci. Lett. 2023, 10, 36. [Google Scholar] [CrossRef] [Scilit]
- Zou, C.; Zhao, Z.; Pan, S.; Yin, J.; Lu, G.; Fu, F.; Yuan, M.; Liu, H.; Zhang, G.; Luo, C.; et al. Unveiling the Oldest Industrial Shale Gas Reservoir: Insights for the Enrichment Pattern and Exploration Direction of Lower Cambrian Shale Gas in the Sichuan Basin. Engineering 2024, 42, 278–294. [Google Scholar] [CrossRef] [Scilit]
- Xie, B.; Zhao, X.; Bai, L.; He, X.; Wang, Y.; Lv, Y.; Gao, Y. Logging Evaluation of Shale Porosity with Variable Matrix Parameters in Continental Facies: A Case Study of the Lianggaoshan Formation, Sichuan Basin. Processes 2025, 13, 4004. [Google Scholar] [CrossRef] [Scilit]
- Shao, D.; Zhang, T.; Zhang, L.; Li, Y.; Meng, K. Effects of Pressure on Gas Generation and Pore Evolution in Thermally Matured Calcareous Mudrock: Insights from Gold-Tube Pyrolysis of the Eagle Ford Shale Using Miniature Core Plugs. Int. J. Coal Geol. 2022, 252, 103936. [Google Scholar] [CrossRef] [Scilit]
- Wang, J.; Zhang, M.; Wang, B.; Tan, X.; Wu, W.J.; Liu, Y.; Bi, G.J.; Tor, S.B.; Liu, E. Influence of Surface Porosity on Fatigue Life of Additively Manufactured ASTM A131 EH36 Steel. Int. J. Fatigue 2021, 142, 105894. [Google Scholar] [CrossRef] [Scilit]
- Wang, J.; Fu, X.; Wei, H.; Zheng, B.; Wang, Z.; Shen, L.; Mansour, A. An Overview of the Qiangtang Basin: Geology, Hydrocarbon Resources and the Role of the Tethyan Evolution. J. Asian Earth Sci. 2024, 266, 106128. [Google Scholar] [CrossRef] [Scilit]
- Sheevam, P.; Calvin, W.M. Comprehensive Characterization and Geochemical Alteration Pathways of Drill Core from the Humu’ula Groundwater Research Project, Hawaii, USA: I. Pohakuloa Training Area. J. Volcanol. Geotherm. Res. 2025, 462, 108311. [Google Scholar] [CrossRef] [Scilit]
- Zhao, X.; Li, N.-B.; Niu, H.-C.; Jiang, Y.-H.; Yan, S.; Yang, Y.-Y.; Fu, R.-X. Hydrothermal Alteration of Allanite Promotes the Generation of Ion-Adsorption LREE Deposits in South China. Ore Geol. Rev. 2023, 155, 105377. [Google Scholar] [CrossRef] [Scilit]
- Lu, X.; Zhao, M.; Zhang, F.; Gui, L.; Liu, G.; Zhuo, Q.; Chen, Z. Characteristics, Origin and Controlling Effects on Hydrocarbon Accumulation of Overpressure in Foreland Thrust Belt of Southern Margin of Junggar Basin, NW China. Pet. Explor. Dev. 2022, 49, 991–1003. [Google Scholar] [CrossRef] [Scilit]
- Zhang, D.; Chen, K.; Tang, J.; Liu, M.; Zhang, P.; He, G.; Cai, J.; Tuo, X. Prediction of Formation Pressure Based on Numerical Simulation of In-Situ Stress Field: A Case Study of the Longmaxi Formation Shale in the Nanchuan Area, Eastern Chongqing, China. Front. Earth Sci. 2023, 11, 1225920. [Google Scholar] [CrossRef] [Scilit]
- Song, Y.; Chen, M.; Zhang, K.; Reddy, A.S.N.; Cao, F.; Zhu, F. QuantAS: A Comprehensive Pipeline to Study Alternative Splicing by Absolute Quantification of Splice Isoforms. New Phytol. 2023, 240, 928–939. [Google Scholar] [CrossRef] [Scilit]
- Wang, R.; Luo, A.-L.; Zhang, S.; Ting, Y.-S.; O’bRiain, T.; Lamost Mrs Collaboration. Stellar Parameters and Chemical Abundances Estimated from LAMOST-II DR8 MRS Based on Cycle-StarNet. Astrophys. J. Suppl. Ser. 2023, 266, 40. [Google Scholar] [CrossRef] [Scilit]
- Reddy, Y.N.V.; Miranda, W.R.; Nishimura, R.A. Measuring Pressure Gradients After Transcatheter Aortic Valve Implantation: Rethinking the Bernoulli Principle. J. Am. Heart Assoc. 2021, 10, e022515. [Google Scholar] [CrossRef] [Scilit]
- Li, C.; Zhang, L.; Luo, X.; Lei, Y.; Yu, L.; Cheng, M.; Wang, Y.; Wang, Z. Overpressure Generation by Disequilibrium Compaction or Hydrocarbon Generation in the Paleocene Shahejie Formation in the Chezhen Depression: Insights from Logging Responses and Basin Modeling. Mar. Pet. Geol. 2021, 133, 105258. [Google Scholar] [CrossRef] [Scilit]
- Tsessler, M.; Cohen, S.; Wang, L.; Koch, D.D.; Zadok, D.; Abulafia, A. Evaluating the Prediction Accuracy of the Hill-RBF 3.0 Formula Using a Heteroscedastic Statistical Method. J. Cataract. Refract. Surg. 2021, 48, 37–43. [Google Scholar] [CrossRef] [Scilit]
Figure 1.
Tectonic location map of the study area. (Legend: tectonic units (Northern Depression, Central Uplift, Tabei Uplift), study well locations, fault distribution; Unit: kilometers (km); coordinate: WGS84 geographic coordinate system).
Figure 1.
Tectonic location map of the study area. (Legend: tectonic units (Northern Depression, Central Uplift, Tabei Uplift), study well locations, fault distribution; Unit: kilometers (km); coordinate: WGS84 geographic coordinate system).
Figure 2.
Comprehensive logging chart for Well Goulier 1. (X-axis: depth (m); Y-axis: logging parameters (natural gamma: API, acoustic transit time: μs/m, density: g/cm3, resistivity: Ω·m); curve legend: GR (natural gamma), AC (acoustic transit time), DEN (density), RT (resistivity); annotation: dense limestone interval, overflow depth).
Figure 2.
Comprehensive logging chart for Well Goulier 1. (X-axis: depth (m); Y-axis: logging parameters (natural gamma: API, acoustic transit time: μs/m, density: g/cm3, resistivity: Ω·m); curve legend: GR (natural gamma), AC (acoustic transit time), DEN (density), RT (resistivity); annotation: dense limestone interval, overflow depth).
Figure 4.
Statistical distribution of the C1/THC ratio at the top of the Yingshan Formation in wells from the Fuyuan–Manshen area. (X-axis: C1/THC ratio; Y-axis: frequency; legend: normal-pressure interval, abnormal overpressure interval; annotation: threshold line (C1/THC = 0.8)).
Figure 4.
Statistical distribution of the C1/THC ratio at the top of the Yingshan Formation in wells from the Fuyuan–Manshen area. (X-axis: C1/THC ratio; Y-axis: frequency; legend: normal-pressure interval, abnormal overpressure interval; annotation: threshold line (C1/THC = 0.8)).
Figure 5.
DC index for atmospheric pressure wells (X-axis: depth (m); Y-axis: DC index (dimensionless); curve legend: blue represents measured DC index, red represents the normal trend line DCN; annotation: normal compaction interval).
Figure 5.
DC index for atmospheric pressure wells (X-axis: depth (m); Y-axis: DC index (dimensionless); curve legend: blue represents measured DC index, red represents the normal trend line DCN; annotation: normal compaction interval).
Figure 6.
DC index for abnormally high-pressure wells (X-axis: depth (m); Y-axis: DC index (dimensionless); curve legend: blue represents measured DC index, red represents the normal trend line DCN; annotation: normal compaction interval).
Figure 6.
DC index for abnormally high-pressure wells (X-axis: depth (m); Y-axis: DC index (dimensionless); curve legend: blue represents measured DC index, red represents the normal trend line DCN; annotation: normal compaction interval).
Figure 7.
Integrated stratigraphic pressure monitoring data sheet.
Figure 7.
Integrated stratigraphic pressure monitoring data sheet.
Figure 8.
Integrated stratigraphic pressure monitoring data sheet.
Figure 8.
Integrated stratigraphic pressure monitoring data sheet.
Figure 9.
Integrated stratigraphic pressure monitoring data sheet.
Figure 9.
Integrated stratigraphic pressure monitoring data sheet.
Figure 10.
Integrated stratigraphic pressure monitoring data sheet.
Figure 10.
Integrated stratigraphic pressure monitoring data sheet.
Figure 11.
Integrated stratigraphic pressure monitoring data sheet.
Figure 11.
Integrated stratigraphic pressure monitoring data sheet.
Figure 12.
Integrated stratigraphic pressure monitoring data sheet.
Figure 12.
Integrated stratigraphic pressure monitoring data sheet.
Figure 13.
Integrated stratigraphic pressure monitoring data sheet.
Figure 13.
Integrated stratigraphic pressure monitoring data sheet.
Figure 14.
Integrated stratigraphic pressure monitoring data sheet.
Figure 14.
Integrated stratigraphic pressure monitoring data sheet.
Figure 15.
Integrated stratigraphic pressure monitoring data sheet.
Figure 15.
Integrated stratigraphic pressure monitoring data sheet.
Table 1.
Stratigraphic column and lithological description of the ultra-deep Ordovician strata in the study area, Tarim Basin.
Table 1.
Stratigraphic column and lithological description of the ultra-deep Ordovician strata in the study area, Tarim Basin.
| System | Series | Formation (Fm.) | Code | Brief Lithological Description |
|---|
| Ordovician | Upper | Terekewati Fm. | O3t | Dominated by medium- to thick-bedded gray mudstone, intercalated with thin- to thick-bedded silty mudstone and argillaceous siltstone. |
| Ordovician | Upper | Sangtamu Fm. | O3s | Medium- to thick-bedded gray mudstone inter-bedded with argillaceous limestone. |
| Ordovician | Upper | Lianglitage Fm. | O3l | Medium- to thick-bedded gray micritic limestone and calcarenite inter-bedded with thin mudstone layers. |
| Ordovician | Middle | Tumuxiuke Fm. | O2t | Thick-bedded brownish-gray limestone and argillaceous limestone, inter-bedded with calcareous mudstone. |
| Ordovician | Middle | Yijianfang Fm. | O2yj | Arenitic and argillaceous sandy limestone inter-bedded with gray argillaceous limestone and calcirudite. |
| Ordovician | Lower-Middle | Yingshan Fm. (Upper Member) | O1-2y1 | Thick- to massive-bedded gray arenitic limestone and gravelly calcarenite, intercalated with thin beds of brownish-gray dolomitic limestone. |
| Ordovician | Lower-Middle | Yingshan Fm. (Lower Member) | O1-2y2 | Predominantly medium- to thick-bedded gray argillaceous-silty limestone and sandy limestone, inter-bedded with gray dolomitic limestone and algal limestone. |
| Ordovician | Lower | Penglaiba Fm. | O1p | Thick-bedded dolomite and dolomitic limestone with minor chert nodules (primarily developed in adjacent areas). |
Table 2.
Element indicator significance in ultra-deep well carbonate rocks.
Table 2.
Element indicator significance in ultra-deep well carbonate rocks.
| Characteristic Elements | Geological Significance | Unit |
|---|
| Si | Silica content | ppm |
| Sr | Hydrothermal activity | ppm |
| S | Organic matter content | ppm |
| Al | Clay content | ppm |
| Mg | Dolomite content | % |
| Ca | Calcite content | % |
Table 3.
DC index statistics table.
Table 3.
DC index statistics table.
| Well | Overflow Point (m) | DC Index Variation Range | Distance from Change Point to Overflow Point (m) |
|---|
| FD-1 | 8190.00 | 0.56 → 0.46 | 28 |
| GL-1 | 7688.00 | 0.79 → 0.64 | 32 |
| GL-2 | 7628.00 | 1.04 → 0.98 | 19 |
| YM-4 | 7279.00 | 1.31 → 1.07 | 527 |
| YM-8 | 7233.00 | 1.22 → 0.55 | 376 |
| ZG-70 | 7413.84 | 1.13 → 1.04 | 65 |
| Normal-pressure well | / | No obvious change | / |
| Disclaimer/Publisher’s Note: The statements, opinions and data contained in all publications are solely those of the individual author(s) and contributor(s) and not of MDPI and/or the editor(s). MDPI and/or the editor(s) disclaim responsibility for any injury to people or property resulting from any ideas, methods, instructions or products referred to in the content. |