Article

Research on ADTH-DTW-Based Alignment Method for Multi-Round In-Line Inspection Data of Oil and Gas Pipelines

1
College of Safety and Ocean Engineering, China University of Petroleum, Beijing 102249, China
2
Guangdong Dapeng LNG Company Limited, Shenzhen 518102, China
3
Key Laboratory of Oil and Gas Production Equipment Quality Inspection and Health Diagnosis, State Administration for Market Regulation, Beijing 102249, China
*
Author to whom correspondence should be addressed.
Processes 2026, 14(9), 1360; https://doi.org/10.3390/pr14091360
Submission received: 22 March 2026 / Revised: 2 April 2026 / Accepted: 9 April 2026 / Published: 24 April 2026
(This article belongs to the Section Petroleum and Low-Carbon Energy Process Engineering)

Abstract

As global energy demand continues to grow, the inherent safety requirements for natural gas long-distance pipelines are becoming increasingly stringent. Therefore, accurately analyzing the trends in pipeline defects using multi-round internal inspection data is of great significance for enhancing pipeline inherent safety levels and reducing the risk of pipeline medium leakage. However, existing pipeline in-line inspection data alignment methods for long-distance multi-round pipeline data alignment suffer from cumbersome alignment procedures and low computational efficiency. This paper proposes an adaptive threshold dynamic time warping defect alignment method (Adaptive Dynamic Threshold-Dynamic Time Warping, ADTH-DTW) for rapidly matching multi-round in-line inspection data. A new multi-round in-line inspection data alignment framework based on valve-weld-defect is established. By integrating the DTW algorithm into each alignment stage, unnecessary manual effort is avoided, significantly improving data alignment efficiency. First, the ADTH method is used to clean redundant weld seam data in the in-line inspection data. By dynamically generating expected values and combining an intelligent point selection strategy, the method accurately identifies and removes interfering data. Additionally, valve chamber data is used to correct the overall mileage, providing a data foundation for subsequent defect alignment. Second, the dynamic time warping algorithm is used to align weld seam data and establish a data mapping table. Finally, relative displacement methods are employed to achieve defect matching. The validation results from three rounds of in-vehicle inspection data tested on-site indicate that the ADTH-DTW algorithm achieves an average 23.08% improvement in alignment accuracy compared to methods such as DTW, KL divergence, JS divergence, and linear interpolation, with computational efficiency nearly tripled. This effectively addresses the issue of incompatible computational efficiency and accuracy in existing data alignment algorithms, thereby enhancing the intrinsic safety level of natural gas long-distance pipelines.

1. Introduction

The global demand for oil and gas resources is steadily increasing, driving rapid development in the energy sector. As the most economical and efficient means of natural gas transportation, pipelines serve as a critical foundation for energy development. Taking China as an example, by 2023, the country had constructed 124,000 km of natural gas pipelines, a figure projected to reach 163,000 km by 2025 [1]. With the continuous expansion of pipeline networks, an increasing number of natural gas pipelines are being routed through high-social-value areas characterized by dense infrastructure and high population concentrations. In such regions, pipeline failures could result in incalculable human and economic losses [2]. In-line inspection (ILI) of natural gas pipelines has long been regarded by domestic and international enterprises as a crucial means of enhancing intrinsic pipeline safety. A key challenge that urgently needs to be addressed—to improve data utilization efficiency and safeguard the intrinsic safety levels of natural gas pipelines—is how to analyze multi-round ILI data to identify newly emerging defects and pinpoint high-risk locations [3,4].
Current research on data alignment methods for multi-round ILI data can be broadly categorized into three main approaches: methods based on mathematical models [5], methods based on machine learning [6], and methods based on text similarity [7]. Mathematical model-based approaches primarily utilize statistical mathematical models to analyze the statistical patterns within ILI data for alignment purposes. Typical methods include Kullback–Leibler (KL) divergence [8] and Jensen–Shannon (JS) divergence [9]. For instance, the Huabei Oilfield Company and the PetroChina Pipeline Company both employed the KL divergence method, using construction data as the baseline reference for data alignment. The results indicated that after applying KL divergence alignment, the alignment ratio of ILD features exceeded 90% [10]. Machine learning-based methods, on the other hand, leverage statistical data information to train machine learning models, which are then applied for data alignment. Kang Chun proposed a batch-iterative alignment algorithm for ILI data, achieving 100% alignment for valves, flanges, elbows, and tees, a girth weld alignment rate as high as 99%, and defect alignment rates consistently above 90% [11]. Liu Huan [12] utilized the eXtreme Gradient Boosting (XGBoost) algorithm to achieve alignment between ILI and external inspection data, followed by a comprehensive analysis based on the aligned results. Yang He [13,14] proposed a data mining algorithm for weld data alignment, enabling precise matching of features in ILI reports. Liu Haipeng et al. [15] established a relational model between ILI and external inspection mileage data using a multiple linear regression algorithm, using pipeline mileage as a benchmark. This facilitated the creation of a mapping table between the two datasets, subsequently employing a linear stretching algorithm to achieve segment-by-segment alignment. Text similarity-based methods process textual data to accomplish alignment. Zhang Hewei [16] employed Chinese semantic similarity algorithms and methodologies to construct a synonym thesaurus. By comparing the similarity between standard fields and fuzzy fields and determining matching degrees, this approach ultimately achieved field-level alignment across different ILI reports. A detailed comparison of these three methodological categories is presented in Table 1.
Data alignment algorithms currently employed in the industry exhibit distinct characteristics. Algorithms based on mathematical models are widely adopted by major pipeline operating companies; however, these methods impose stringent requirements on data quality. An excessive presence of anomalous data points can potentially lead to a degradation in alignment accuracy. In contrast, machine learning-based methods necessitate substantial quantities of labeled data for model training; yet, in numerous practical scenarios, acquiring sufficient training data proves challenging. Semantic similarity algorithms, as an emerging alignment approach, demonstrate high accuracy but are exclusively applicable to textual data. While each of the three aforementioned methods is suited to different application scenarios in data alignment, they commonly share limitations, including high demands on data quality and low computational efficiency when applied to long-distance pipelines. Consequently, there is an urgent need to develop an algorithm specifically designed for the alignment of ILI data from long-distance natural gas pipelines, aiming to reduce manual intervention costs and enhance alignment efficiency. To address these challenges, this paper proposes an adaptive threshold dynamic time warping-based defect alignment method for the rapid matching of multi-round ILI data. Furthermore, a novel multi-round ILI data alignment framework integrating valves, girth welds, and defects is constructed, which effectively improves data alignment efficiency while maintaining computational accuracy.

2. Theoretical Background

2.1. Real-Time Dynamic Time Warping Algorithm

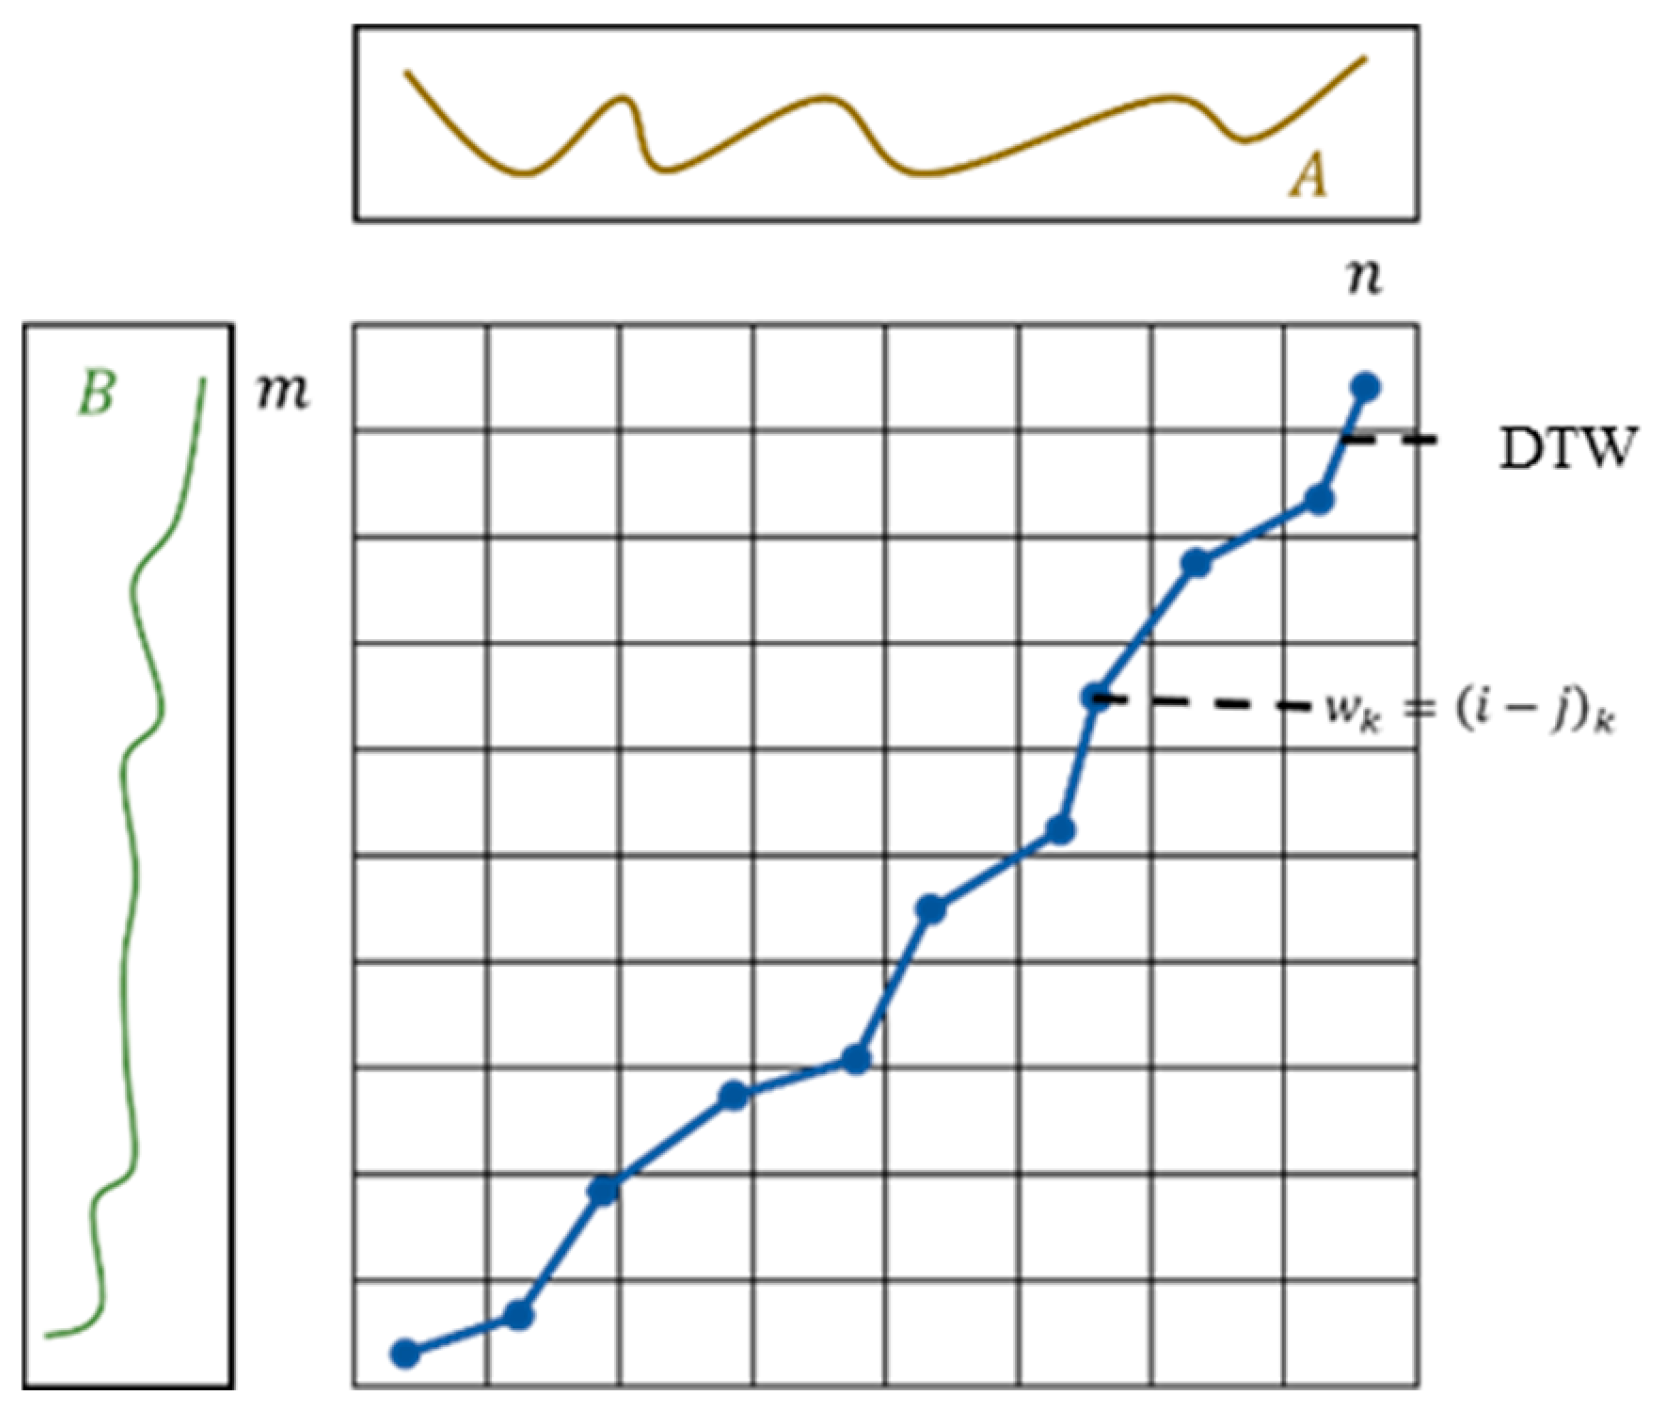
The Dynamic Time Warping (DTW) algorithm, originally proposed by Japanese researcher Itakura in the 1960s [17,18,19,20], is a technique for measuring the similarity between two time series of varying lengths. The computational process of DTW primarily consists of two stages: constructing an accumulated cost matrix and identifying the optimal warping path. Consider two time series, A = [a1, a2, …, am] and B = [b1, b2, …, bn], with lengths m and n, respectively. First, an m × n matrix is constructed, where rows correspond to sequence A and columns to sequence B, and each matrix element represents the accumulated distance between corresponding points. Subsequently, using the recursive dynamic programming formulation (Equation (1)), the accumulated distance is computed progressively from the bottom-left corner of the matrix. Upon completion of these calculations, a backtracking procedure is performed from the top-right corner to identify the path with the minimum accumulated distance—namely, the optimal warping path. A smaller cumulative distance indicates greater similarity between the two time series:
D T W i ,   j = d a i , b j + m i n D T W i 1 , j 1 D T W i 1 , j D T W i , j 1
where d ( a i , b j ) is the distance between a i and b j , and d ( a i , b j ) is the cumulative distance from D   ( 1 , 1 ) to D ( i , j ) .
Figure 1 is a schematic diagram illustrating the application principle of the DTW algorithm. DTW finds the optimal nonlinear matching path between two sequences through dynamic programming, allowing local stretching or compression along the time axis. This eliminates phase shifts caused by differences in sampling frequency or speed variations, achieves global alignment of the sequences, and quantifies the cumulative distance between corresponding points as a measure of similarity. Here, A represents the data to be aligned, and B represents the reference data for alignment.

2.2. Alignment Workflow for ILI Data

Existing data alignment methods primarily follow a sequential procedure—typically aligning valves, bends, magnetic marker units, girth welds, and defects in that order—to identify corresponding defects either manually or algorithmically. The specific workflow for data alignment is outlined as follows [21,22]:
(1)
Landmark Alignment
The starting mileages of two inspection runs are first determined. Prominent features such as valves and bends (including magnetic marker units) that exhibit minimal positional changes are identified and unified. Using one inspection dataset (generally the first run) as a reference, positional corrections are applied to align the data from subsequent inspection runs.
(2)
Defect Alignment
Based on the results of landmark alignment, defects from different inspection runs are matched by evaluating their distances to adjacent girth welds and their clock orientations. Owing to inevitable inaccuracies in the in-line inspection tools, a tolerance threshold is permitted for positional discrepancies; points falling within this threshold range are considered aligned.

3. Theoretical Frameworks

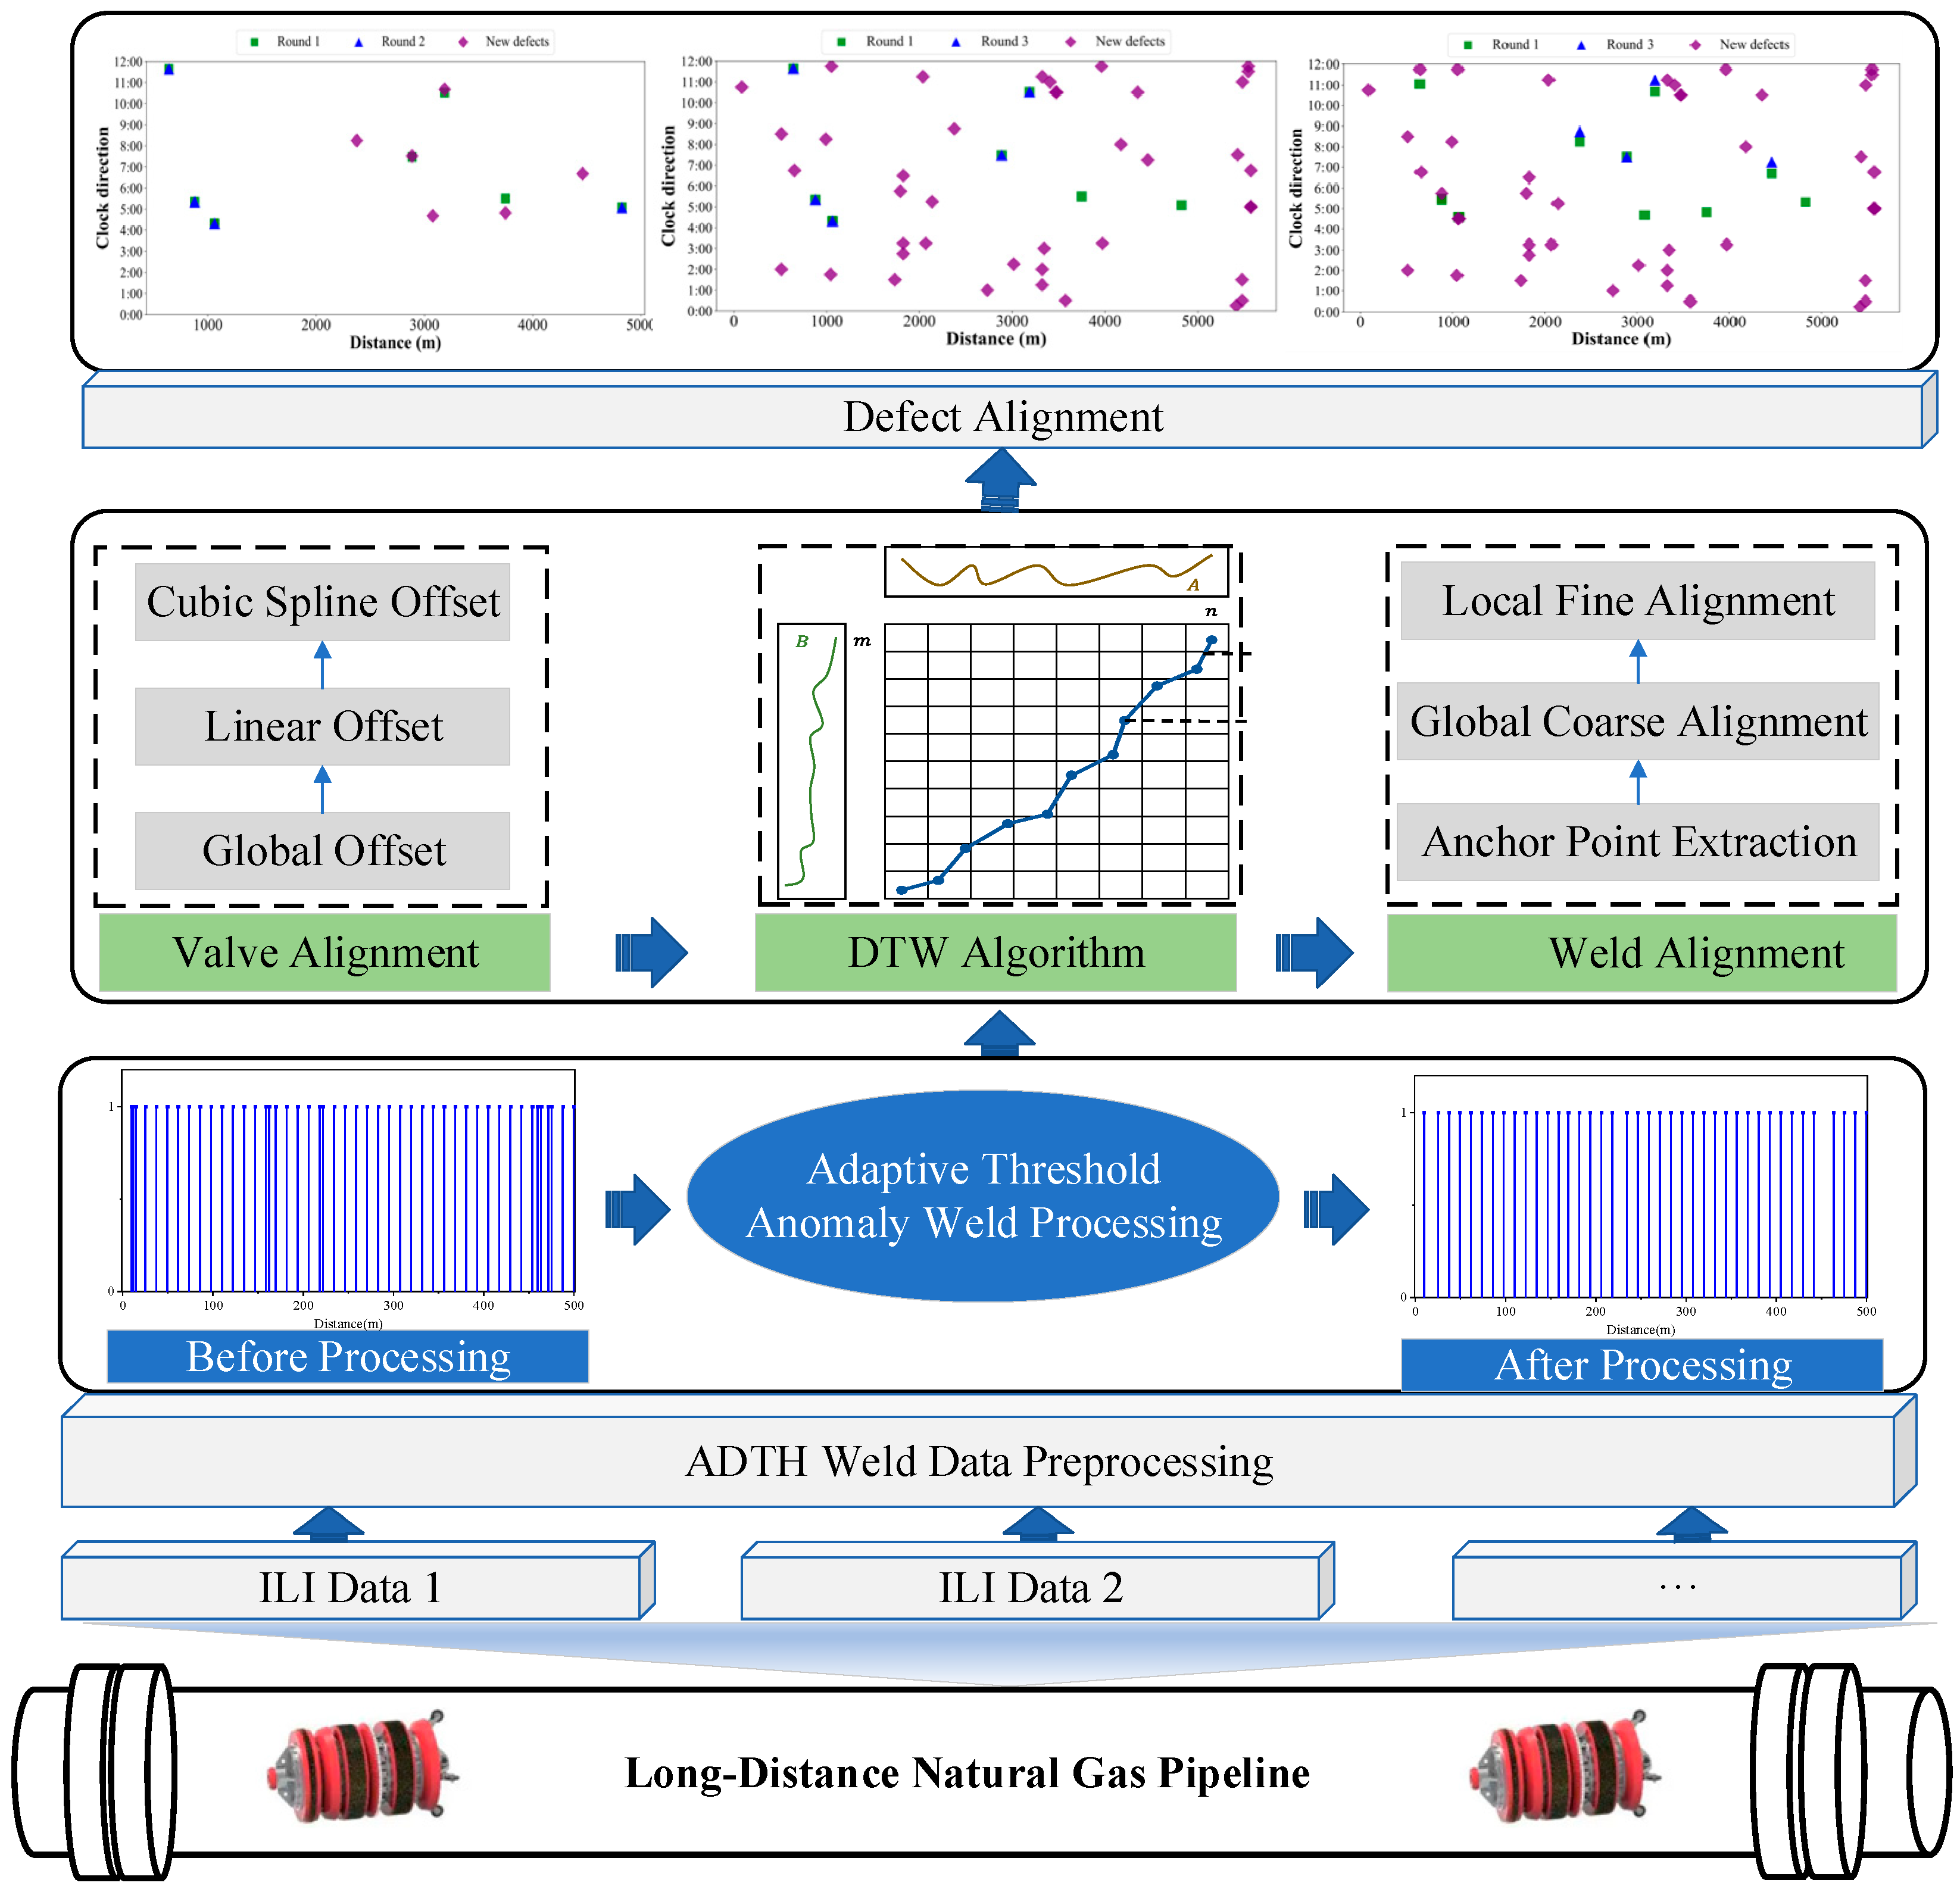
To address the challenges of cumbersome alignment procedures and limited accuracy in existing multi-round ILI data alignment methods, this paper proposes an ILI data alignment framework based on valves, girth welds, and defects. By integrating the ADTH-DTW algorithm, the proposed method achieves high-precision alignment of multi-round ILI data. Firstly, data preprocessing is performed on the raw datasets. Subsequently, the ADTH algorithm is applied to reprocess the girth weld data, eliminating welds that do not conform to specified standards. Valve data are then aligned, and the offset magnitude is evaluated to correct the mileage of overall features based on the detected displacement of the ILI tool. Finally, the DTW algorithm is employed to align all defect data. The overall workflow of the proposed algorithm is illustrated in Figure 2.

3.1. Weld Data Processing

Weld seam data serves as a reference basis for subsequent defect alignment. However, excessive weld seam data increases the complexity of the alignment algorithm and causes resource redundancy. Therefore, it is necessary to preprocess the weld seam data to eliminate outliers (the standard spacing between adjacent weld seams is 12 m) to ensure the smooth operation of the subsequent alignment algorithm. This paper adopts ADTH to perform related operations. The core of this algorithm lies in dynamically generating predicted values and utilizing an intelligent point screening strategy to accurately identify and eliminate interfering data while avoiding excessive deletion of normal data [23,24]. Specifically, first initialize a result list and set three key parameters: the theoretical interval, the allowable fluctuation range (threshold) ε, and the number of candidate points to check forward n (n ≤ 5). Next, add the first point D 0 of the sorted data as the starting point to the list, and set the current valid point P = D 0 . Starting from the second data point D 1 , perform dynamic traversal matching:
(1)
Calculate the predicted point: For the current valid point P , calculate the next predicted point E based on the theoretical interval Δ , using the formula E = P + Δ .
(2)
Find candidate valid points: Within the fluctuation range E ε , E + ε of the predicted point E , check the n data points after the current point. Assume the current traversal reaches the i-th data point. If D j E ε , E + ε (where i j < min i + n , N ) , and   N is the total number of data points, then take D j as a candidate valid point.
(3)
Select the best valid point: If candidate valid points exist, choose the point with the smallest absolute difference from the predicted point E among these candidates as the best valid point B , B = arg D j C a n d i d a t e s min | D j E | . Add the best valid point B to the result list C , update the current valid point P = B , and skip the intermediate points that deviate from the expected ones, continuing the matching from the next point.
(4)
Handle the case of no candidate valid points: If there are no candidate valid points, and D j [ P + Δ 2 ε , P + Δ + 2 ε ] , then treat the current point D i as a valid point, add it to the result list C , update the current valid point P = D i , and then continue traversing the data backward, repeating the above matching process until all data points have been traversed.

3.2. Valve Alignment and Mileage Correction

Since the positions of valve chambers are fixed, the difference in the reported mileage of the same valve chamber between two inspections reflects the overall deviation of the in-line inspection. The core of valve alignment is to eliminate the systematic mileage deviation between different inspection reports by using valve chambers with known absolute positions. The steps for valve alignment and mileage correction are as follows:
(1)
Match Common Valves
(2)
Calculate Offset
For each common valve chamber, calculate the mileage difference, as shown in Formula (2):
Δ = S A 1 S A 2
Here, Δ is the offset; S A 1 , S A 2 are the mileage values of valve chamber A in the reference run and the alignment run, respectively.
(3)
Overall Mileage Correction
If the offsets are consistent, shift the mileage values of the run to be aligned as a whole; if the offsets change linearly (i.e., the valve chamber differences form an arithmetic progression), use linear interpolation for correction (using valve chambers as demarcation points for piecewise linear interpolation). If the offsets change nonlinearly, use cubic spline interpolation for correction.

3.3. In-Line Inspection Data Alignment Process

After valve chamber alignment and mileage correction operations, before defect alignment, it is necessary to perform an alignment operation on the girth welds first. The specific steps for girth weld alignment are as follows:
(1)
Anchor Point Extraction
Extract the characteristic rows from each in-line inspection table and extract the mileage and weld number as local anchor points for storage, generating a reference sequence and a sequence to be aligned.
(2)
Global Rough Alignment
Use constrained Dynamic Time Warping (DTW) to quickly perform an alignment operation on all weld data, aligning the weld mileage of the entire pipeline to the reference system.
(3)
Local Fine Alignment
Apply DTW in segments to perform a secondary alignment on the local sections between adjacent welds based on the global alignment. First, divide the pipeline into small local segments based on the weld data. Second, set a small window to limit the offset. Third, generate a mapping table of weld data before and after alignment to serve as a relative displacement reference for subsequent defect alignment. Finally, complete the alignment operation for the girth weld data.

4. Experimental Study

4.1. Analysis of Causes for Data Drift

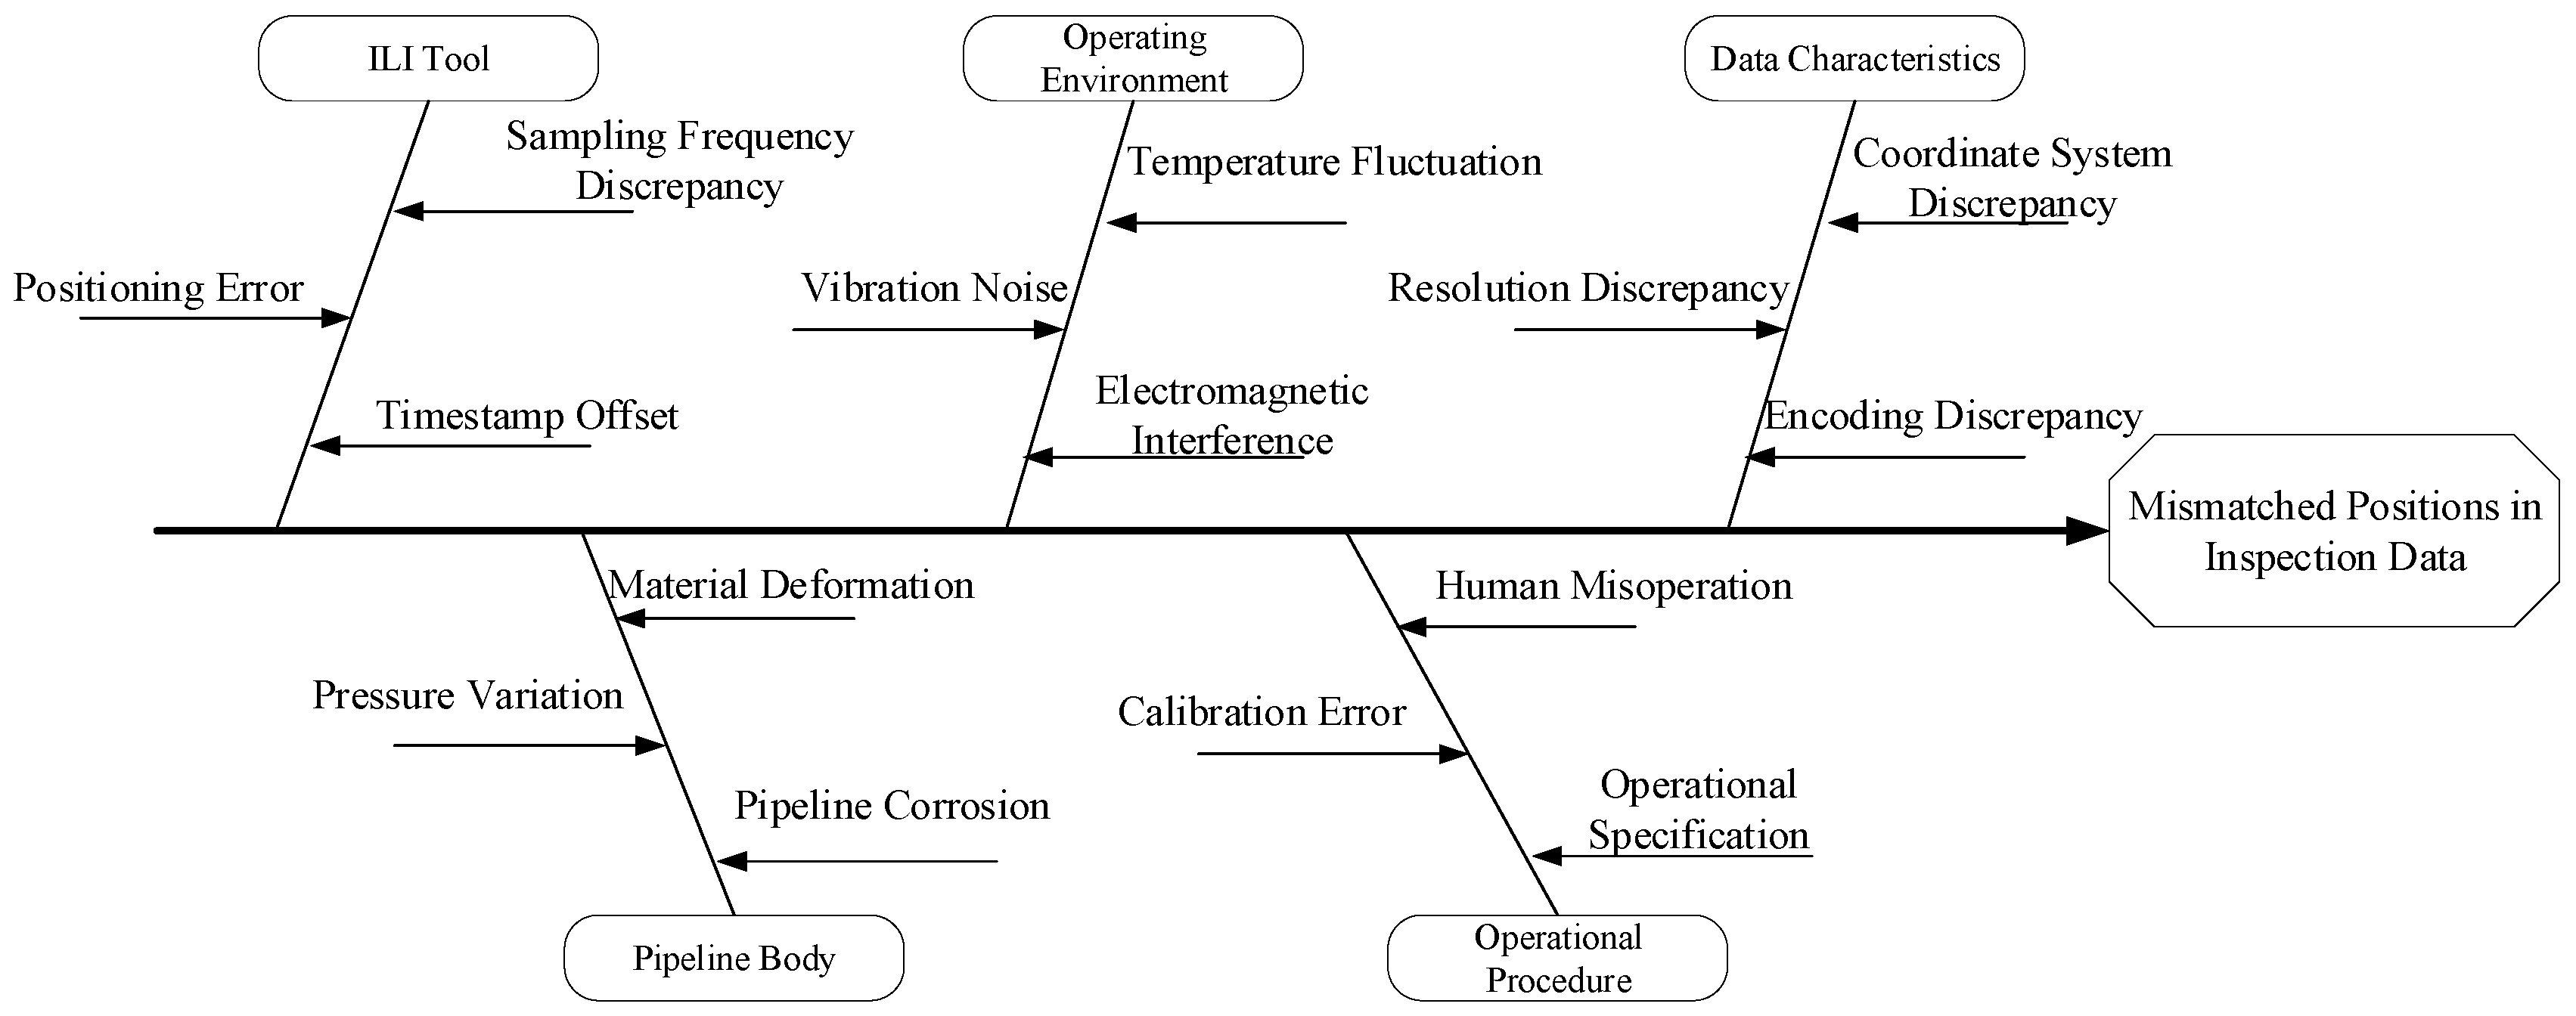
The spatial misalignment observed in multi-run pipeline inspection data arises from the synergistic effects of detector characteristics, environmental disturbances, data heterogeneity, and pipeline–human factors, as illustrated in Figure 3. Variations in acquisition frequency, positioning system errors, and timestamp asynchrony across different inspection runs lead to inaccuracies in the spatiotemporal reference. Temperature fluctuations in the pipeline’s operating environment induce material deformation, while mechanical vibrations and electromagnetic noise compromise the stability of sensor signals. Heterogeneity in multi-source data, including differences in coordinate system definitions, spatial resolution, and encoding protocols, further impedes feature alignment. Additionally, geometric structural drift caused by corrosion and pressure-induced deformation of the pipeline itself, coupled with deviations in procedural execution and inconsistencies in standards during human operation, collectively and significantly reduces the spatial matching accuracy of multi-run inspection results through a nonlinear coupling mechanism.

4.2. In-Line Inspection Data Alignment Workflow

The data utilized in this study were derived from three ILI runs conducted on a 5.6 km longitudinally welded pipeline segment by a nationally recognized inspection company, commissioned by a domestic pipeline operator. Features such as valve stations, girth welds, metal loss anomalies, and bends were documented throughout the inspections. A detailed statistical summary of these features is presented in Table 2.

4.3. ADTH-Based Data Preprocessing

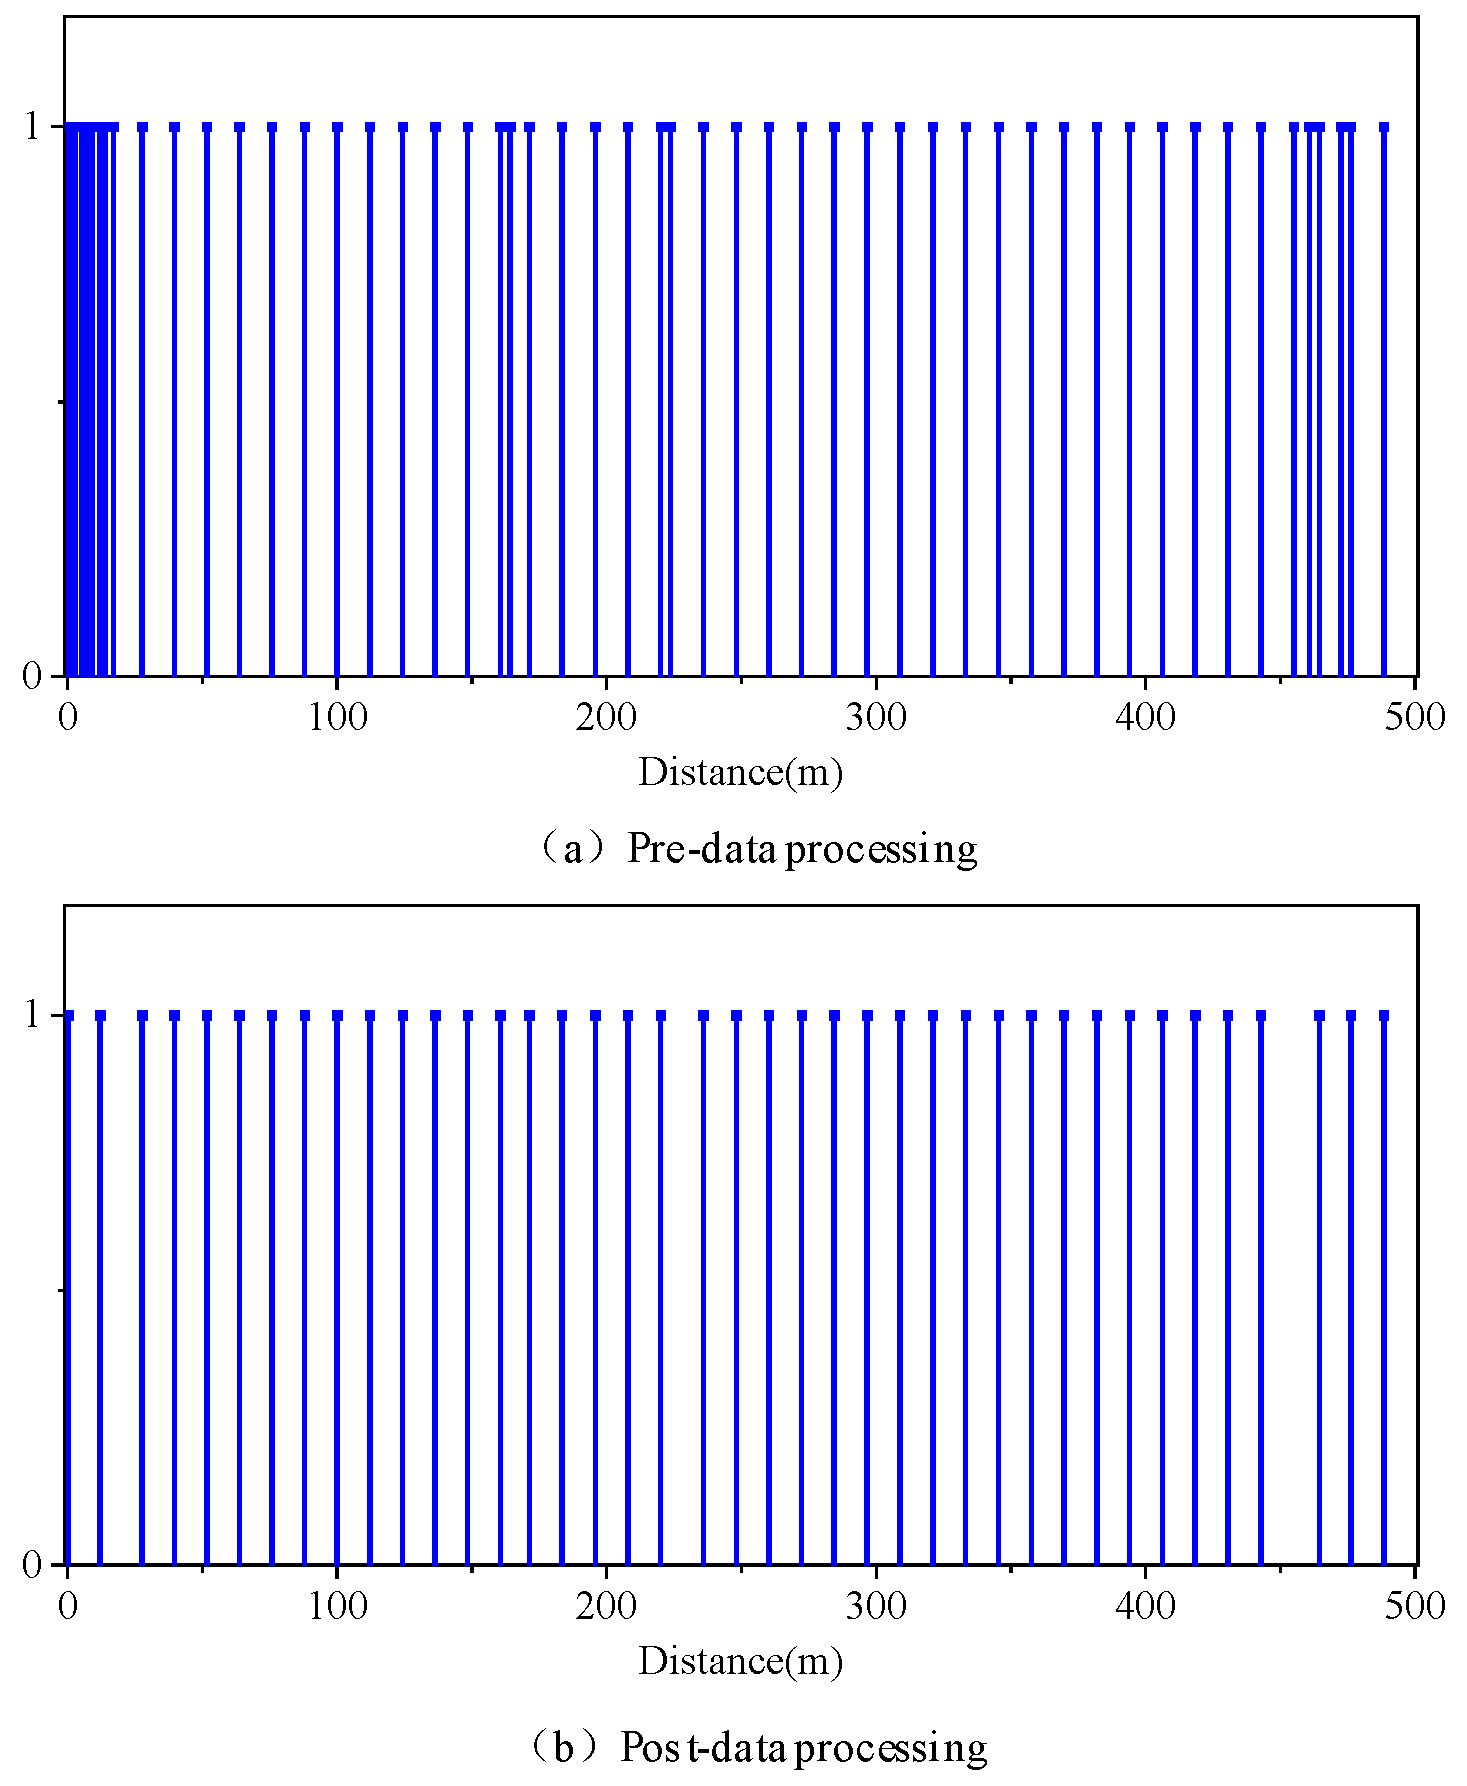
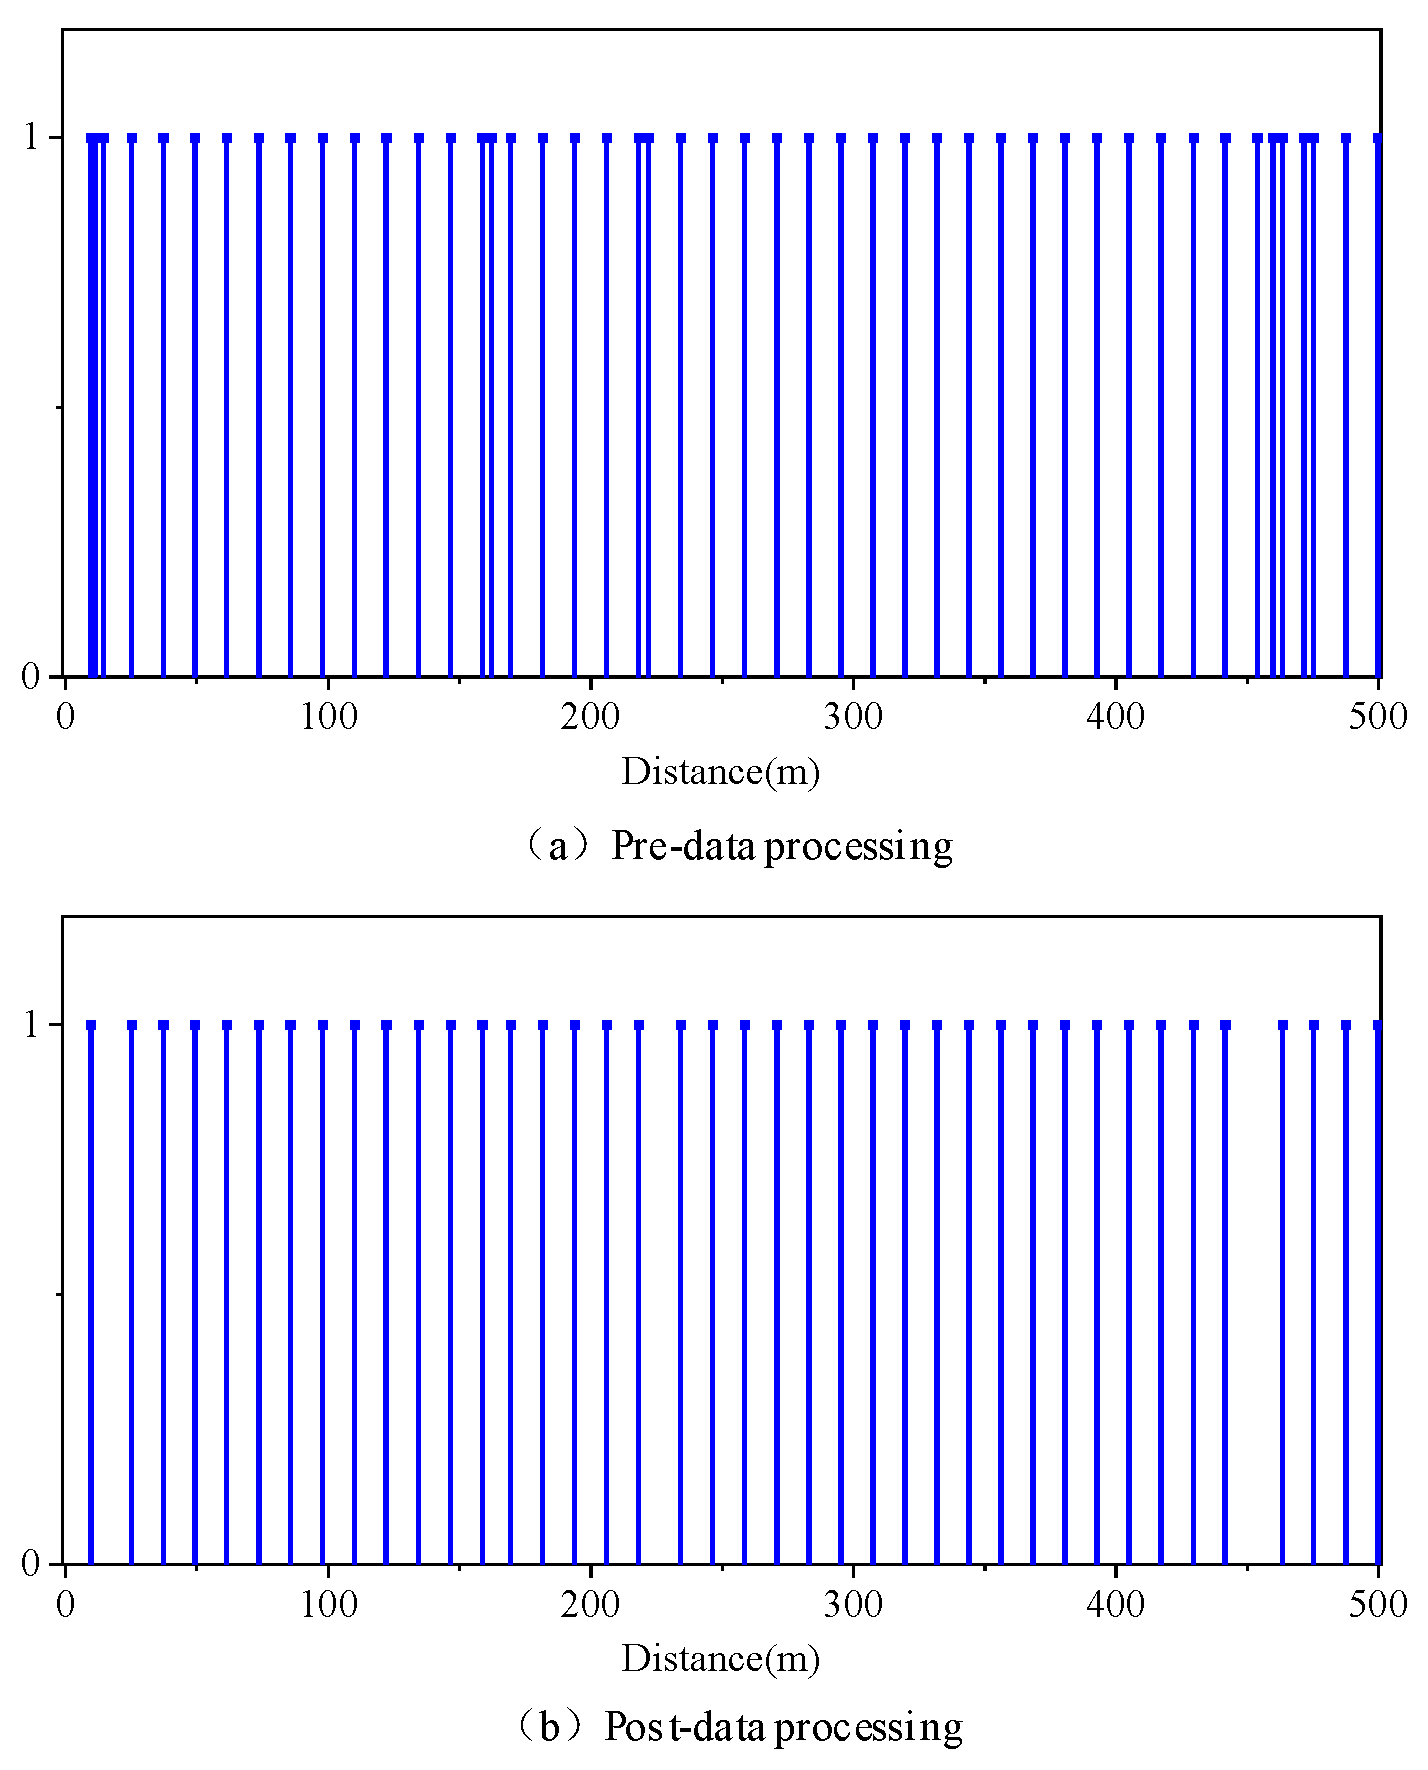
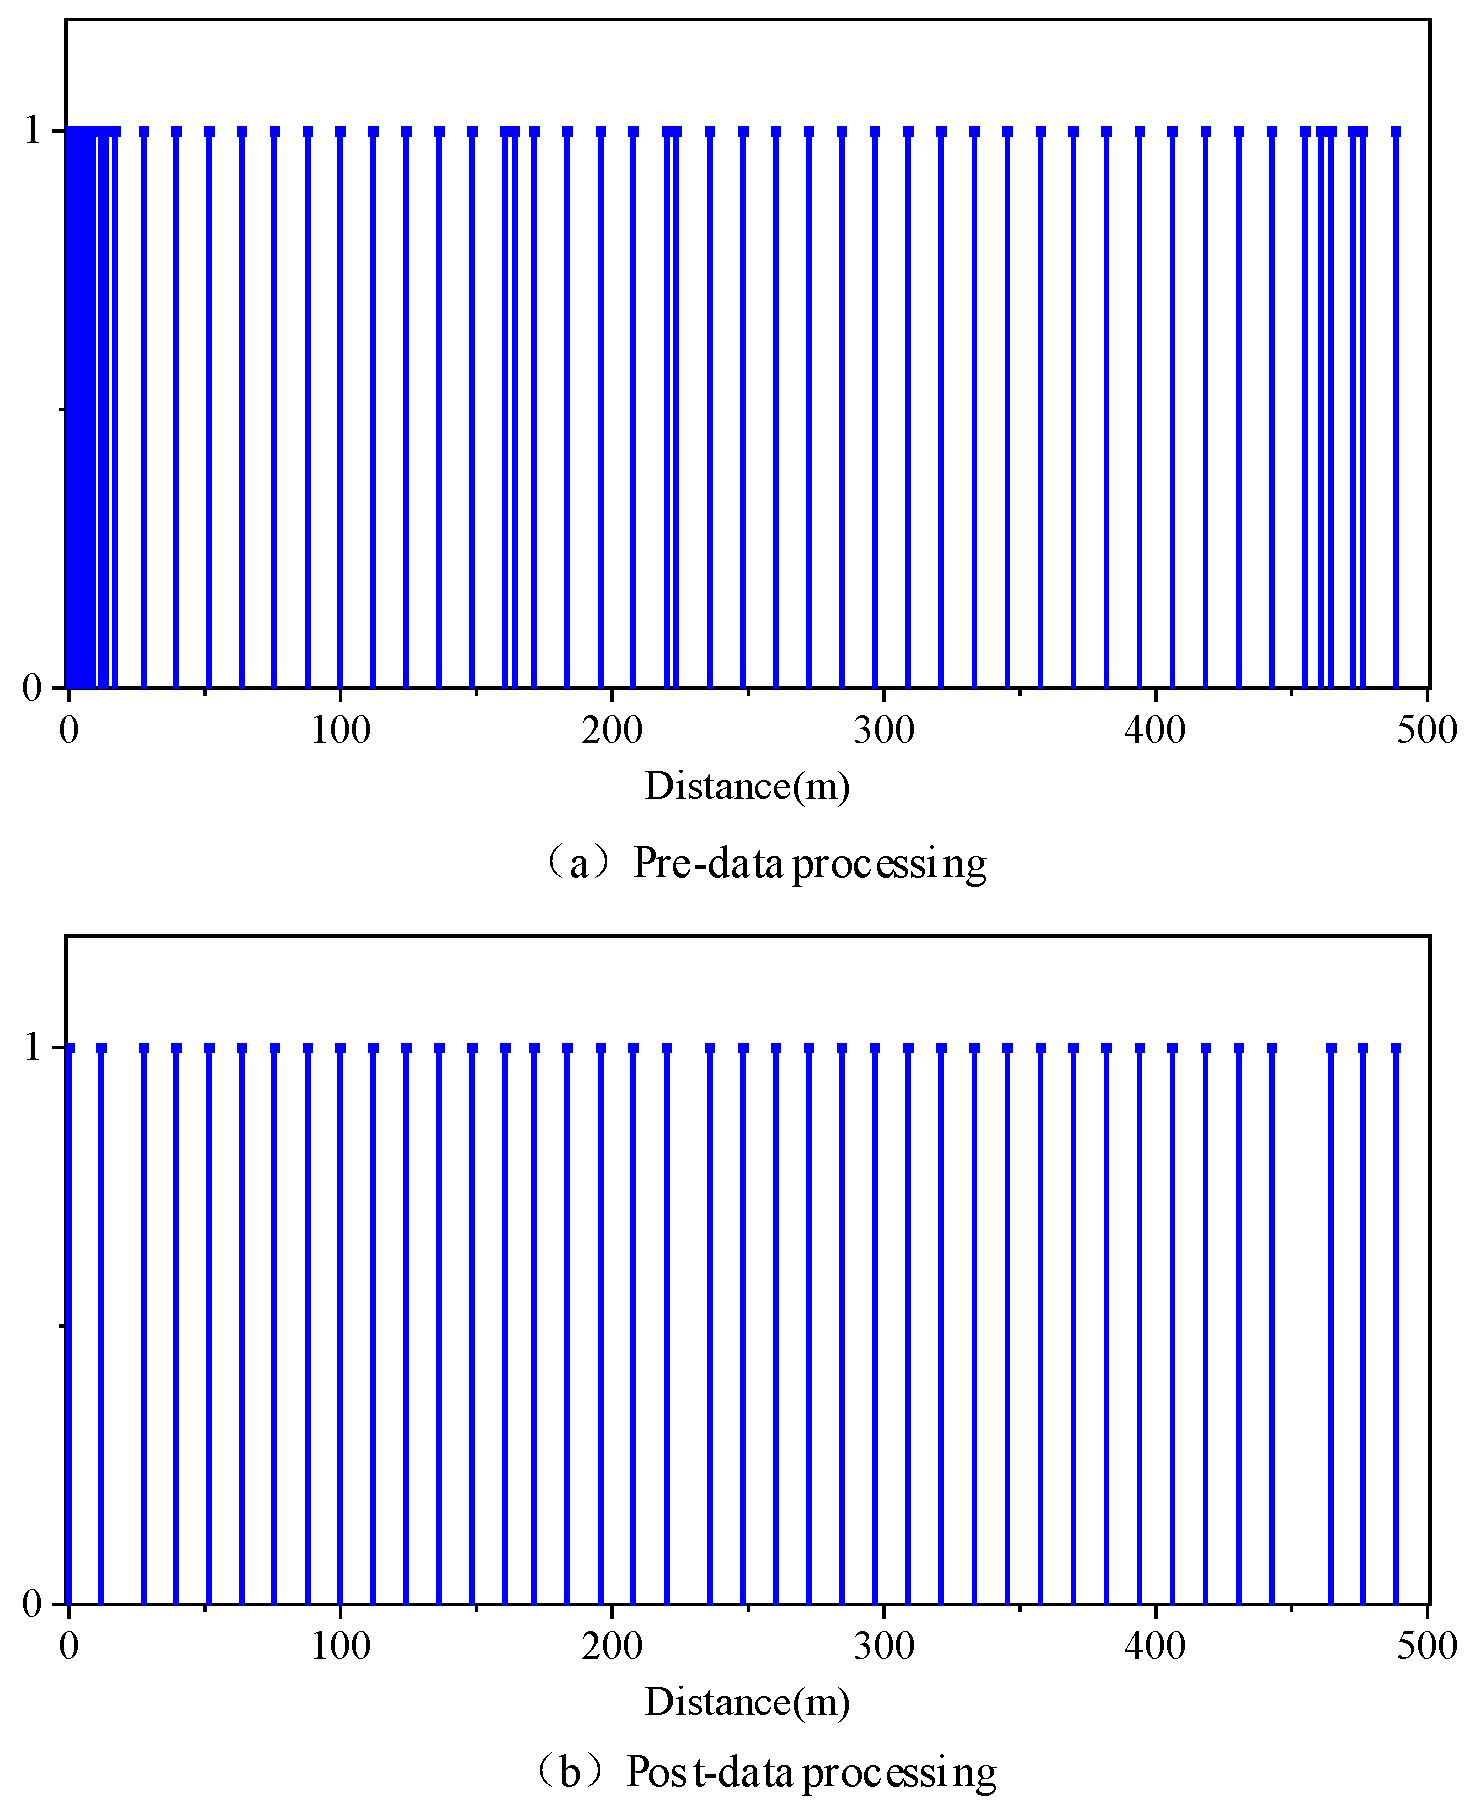
Following data standardization and mileage sorting, it was necessary to process the noise present in the weld seam data. Given that the typical spacing between adjacent weld seams is approximately 12 m, a 5.6 km pipeline segment would be expected to contain around 467 weld features. Accordingly, the ADTH algorithm was applied to the raw data from the three ILI runs to identify and remove anomalous weld records. The results of this cleaning process are summarized in Table 3. Furthermore, a comparative analysis of the weld data before and after anomaly processing for the first 500 m of each run is presented in Figure 4, Figure 5 and Figure 6.
As presented in Table 3, the raw ILI data contained a substantial amount of redundant weld records, with approximately 70% of the intervals between adjacent welds falling within the acceptable range and an average spacing of around 10 m. Following processing by the ADTH algorithm, the proportion of valid weld intervals increased by more than 10%, and the weld spacing converged to approximately 12 m. The post-processing valid interval proportion of 83.1% indicates that, after deduplication and merging, 83.1% of the remaining 415 intervals lay within the reasonable range. The average spacing of 12.39 ± 32.66 m shows that while the mean value approached the 12 m baseline, the large standard deviation (±32.66 m) reflects the presence of a few extreme intervals caused by severe local data gaps. Figure 4, Figure 5 and Figure 6 clearly illustrate the effect of preprocessing: before cleaning, dense clusters of welds were observed at the beginning of the segment and near the 200 m and 500 m positions, whereas after processing, the weld locations became relatively uniformly distributed. These results demonstrate that the ADTH algorithm performs excellently in removing anomalous weld records from ILI data, thereby providing a cleaner and more reliable data foundation for subsequent alignment procedures.

4.4. DTW Data Alignment

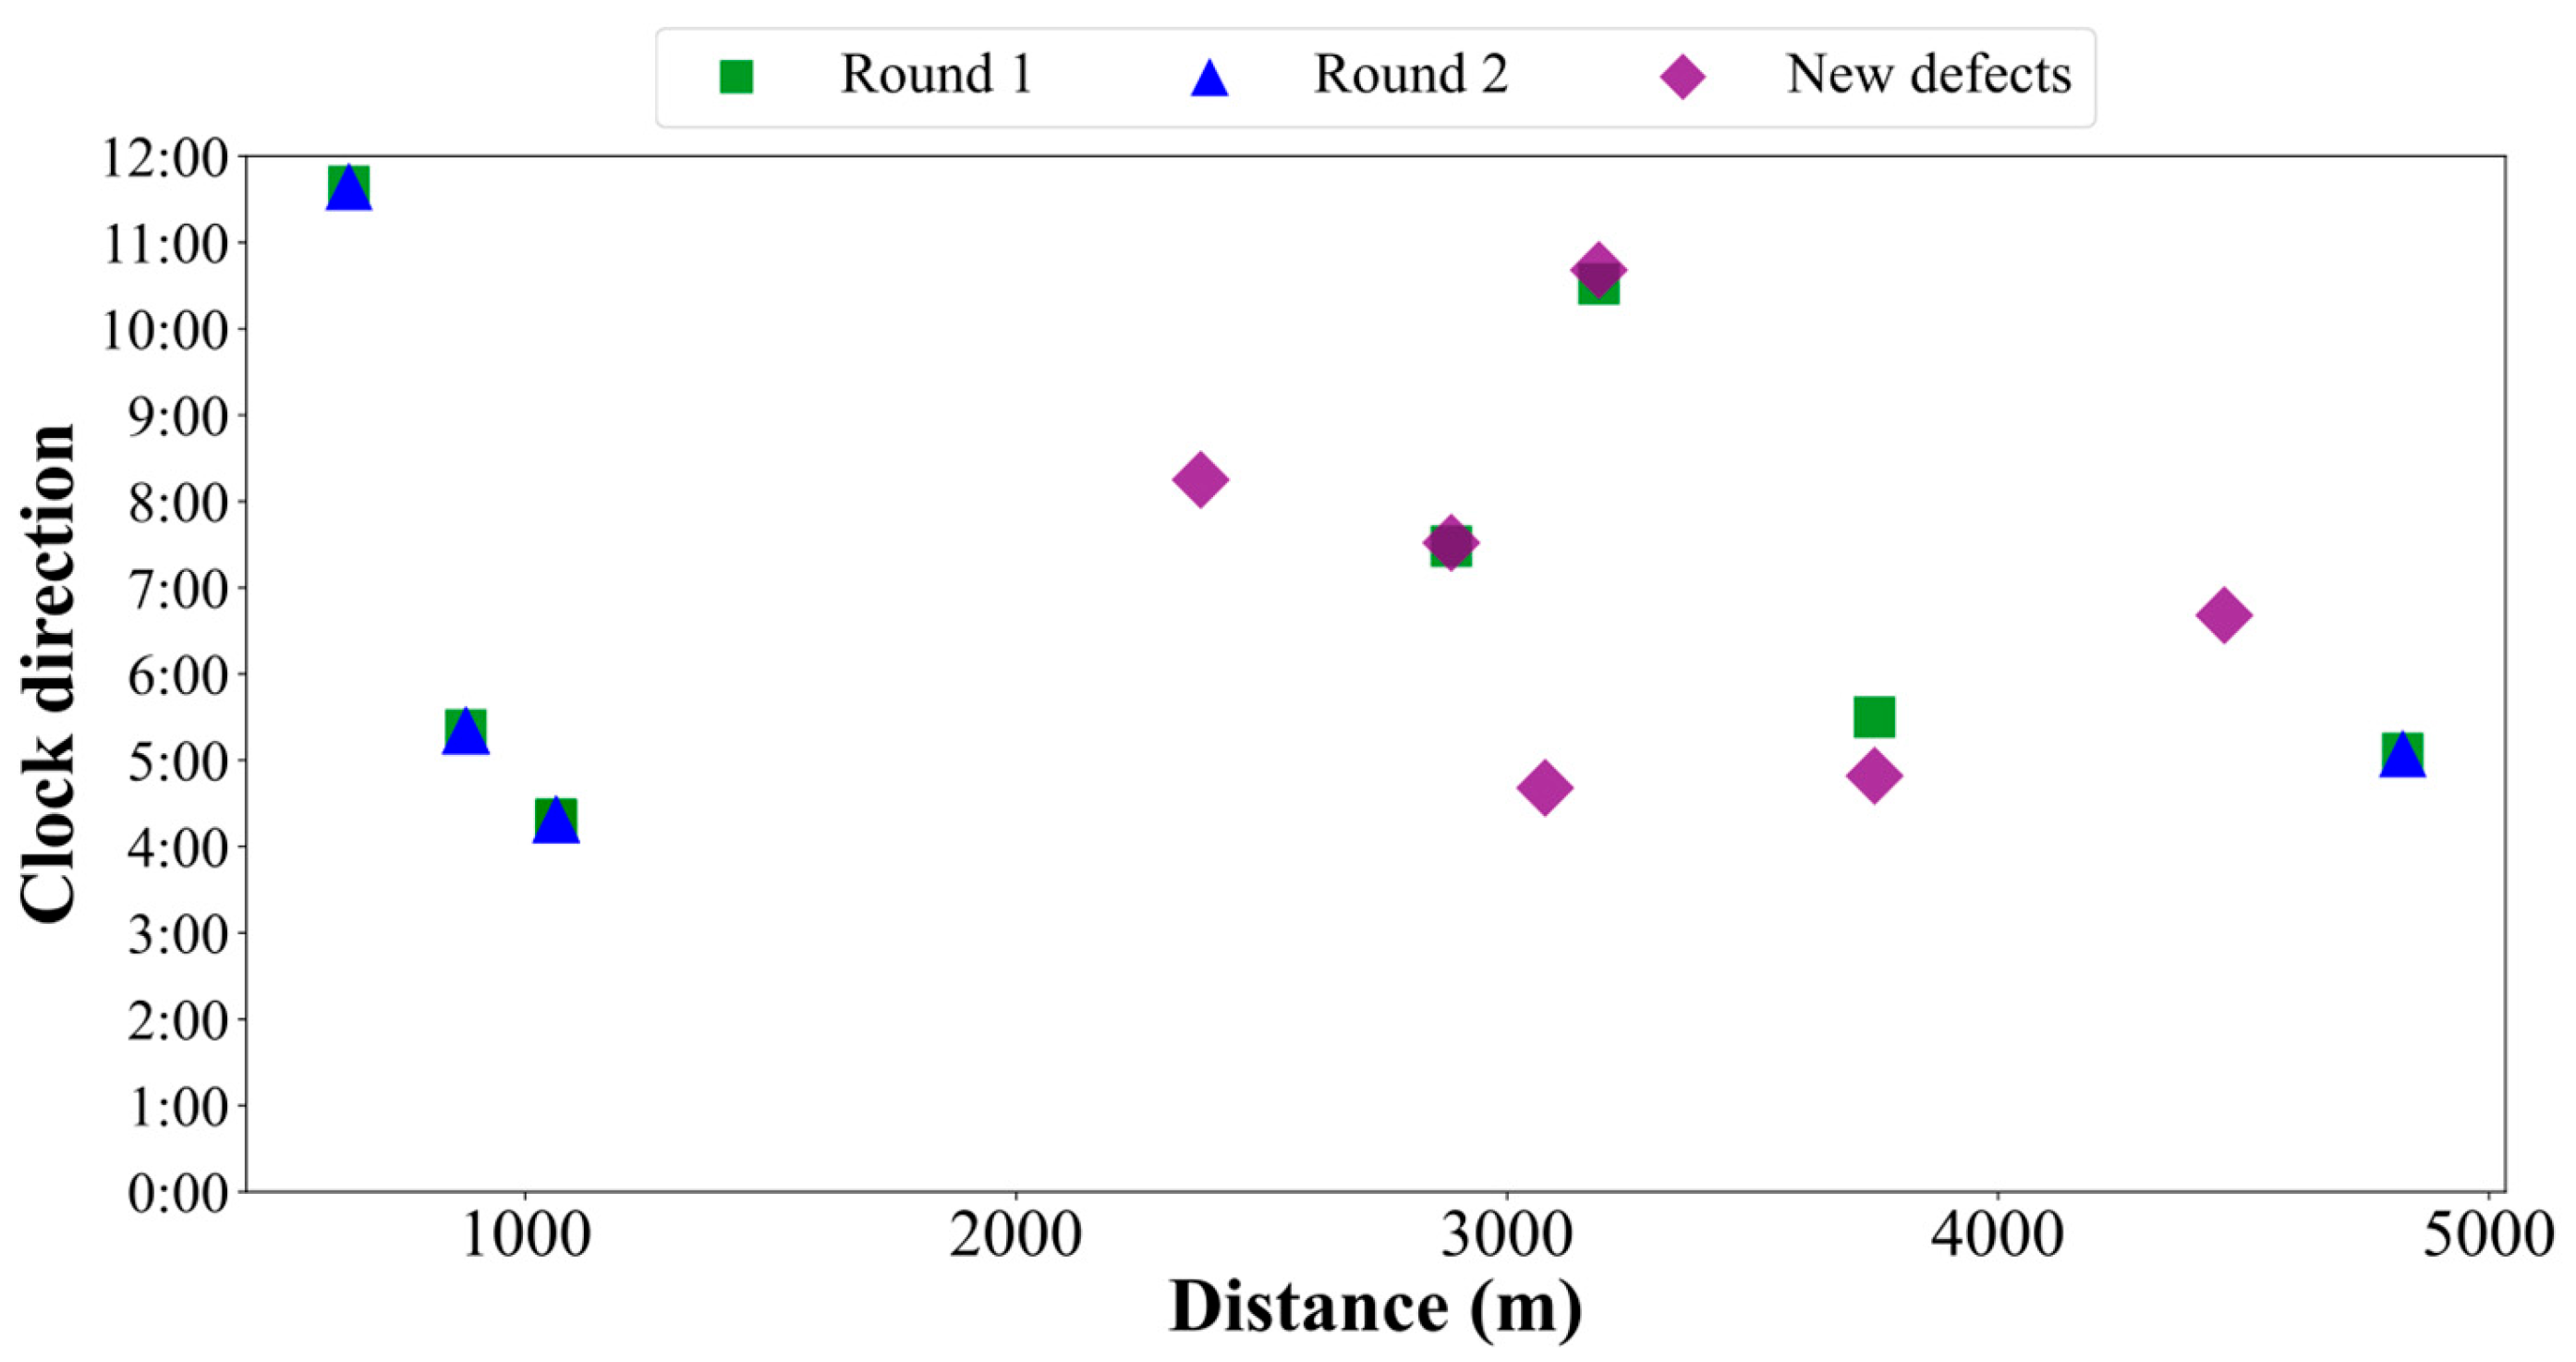
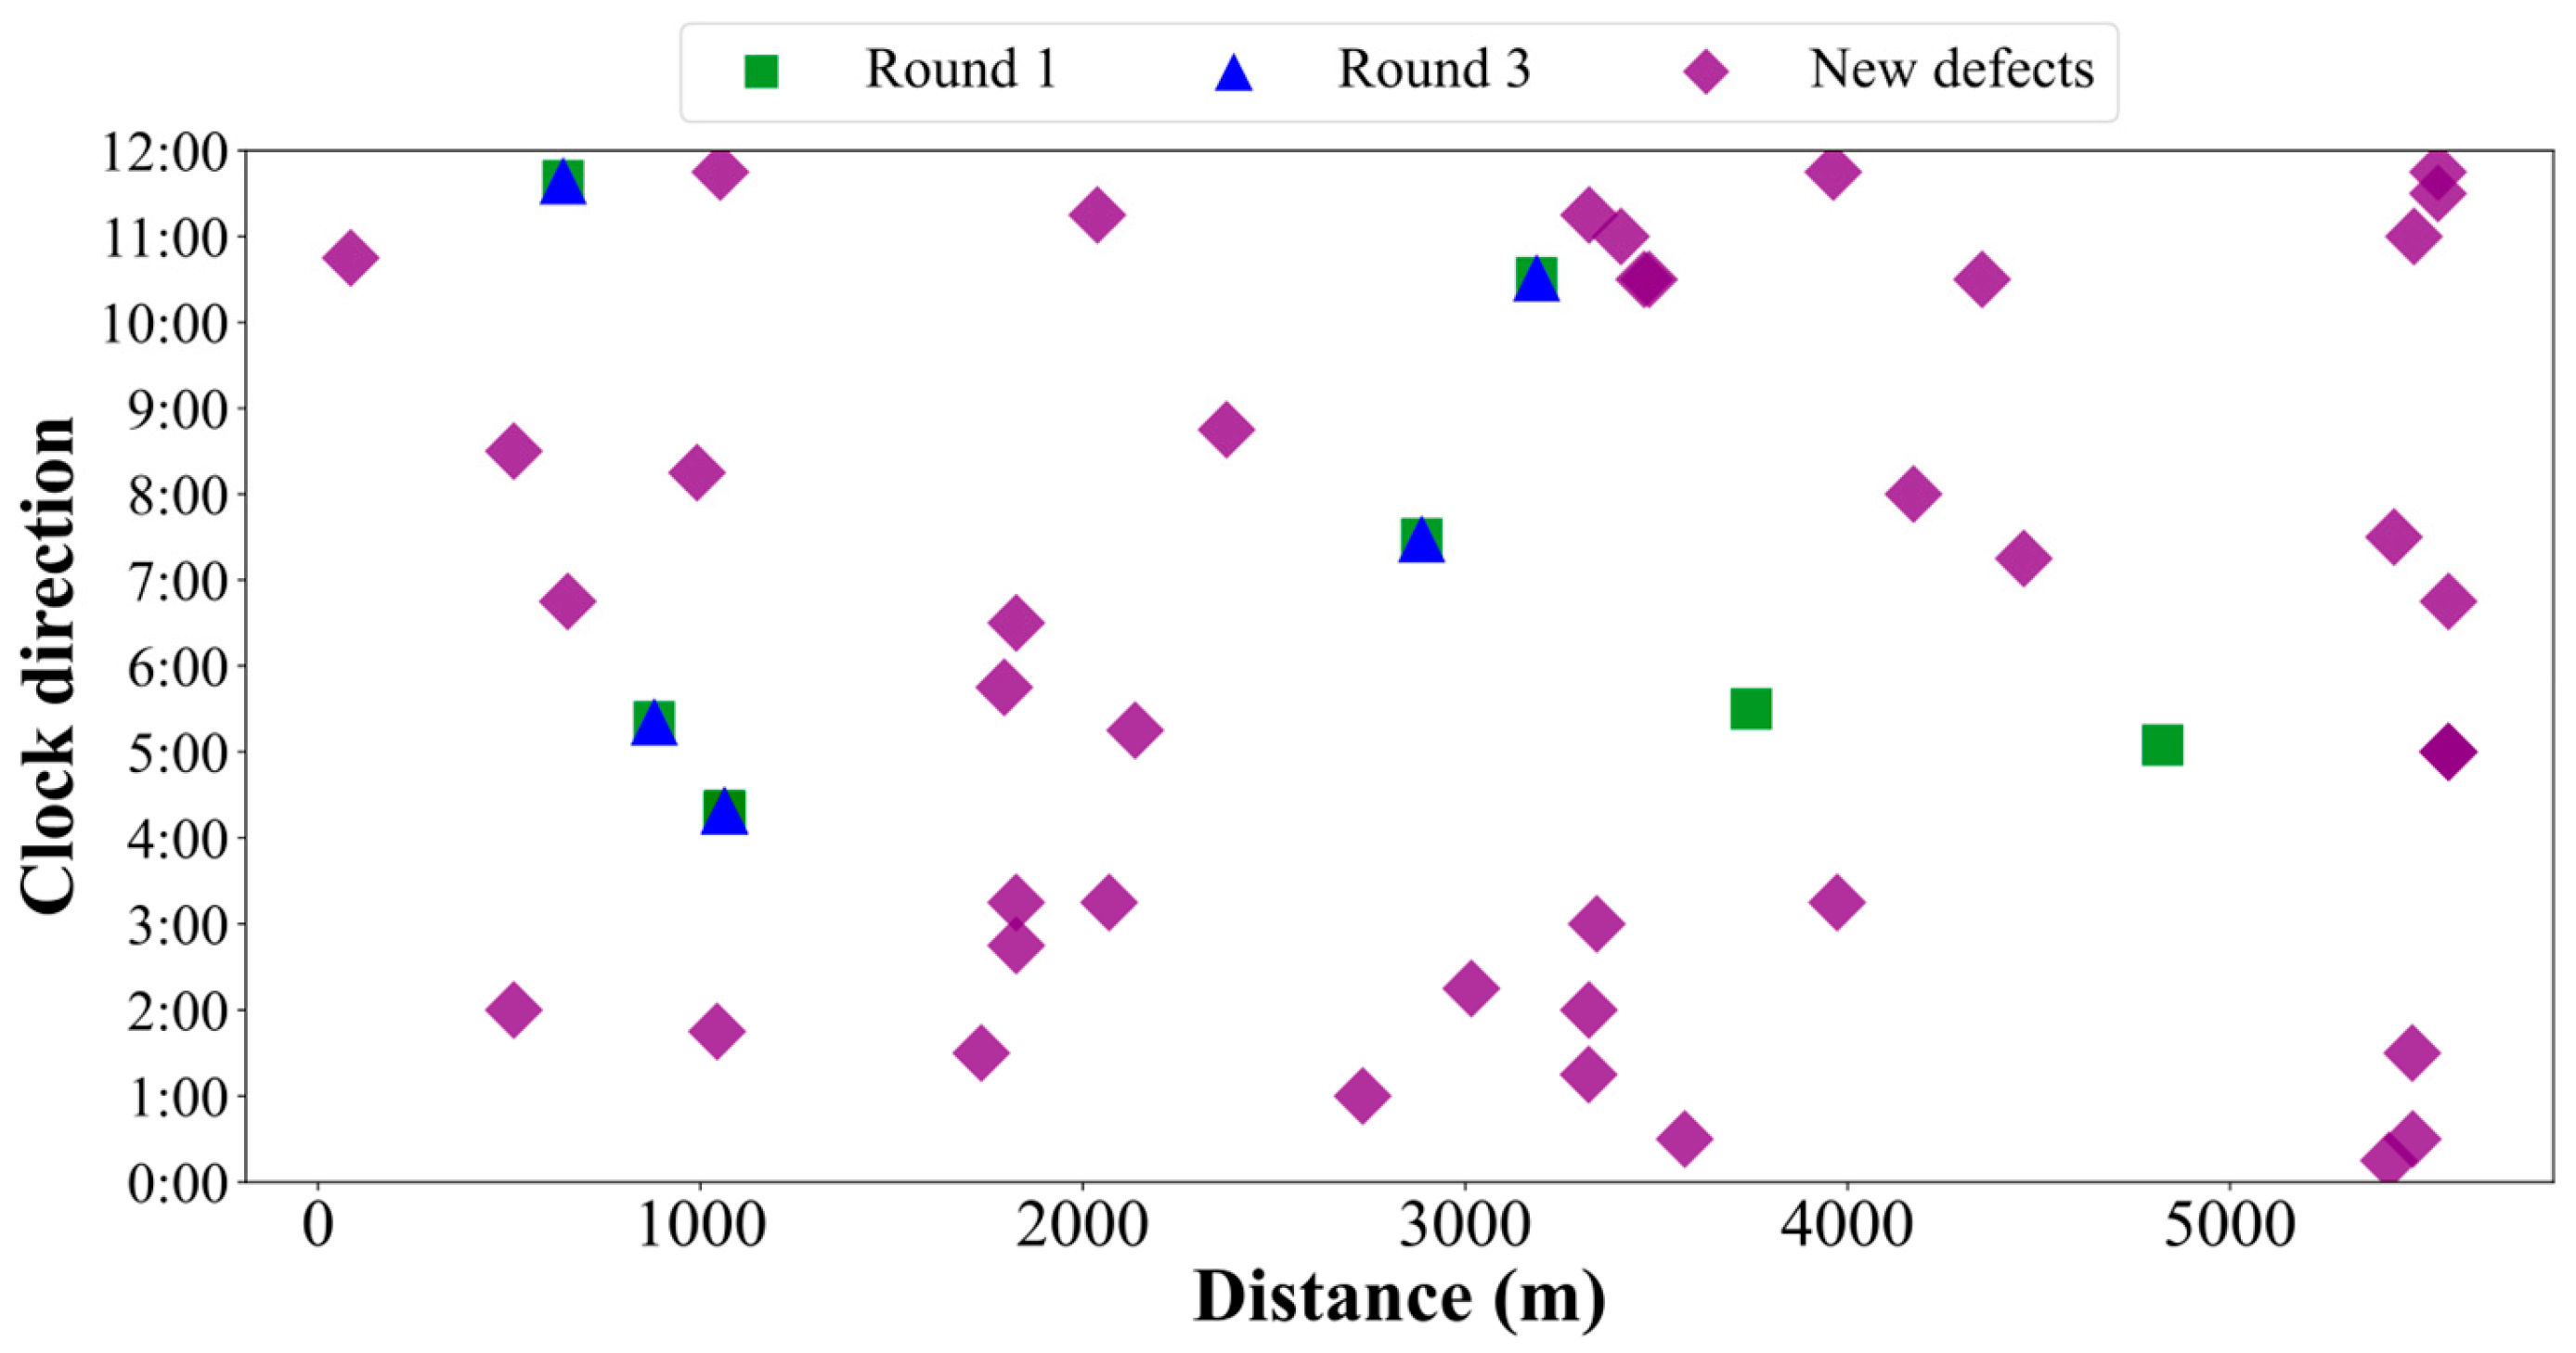
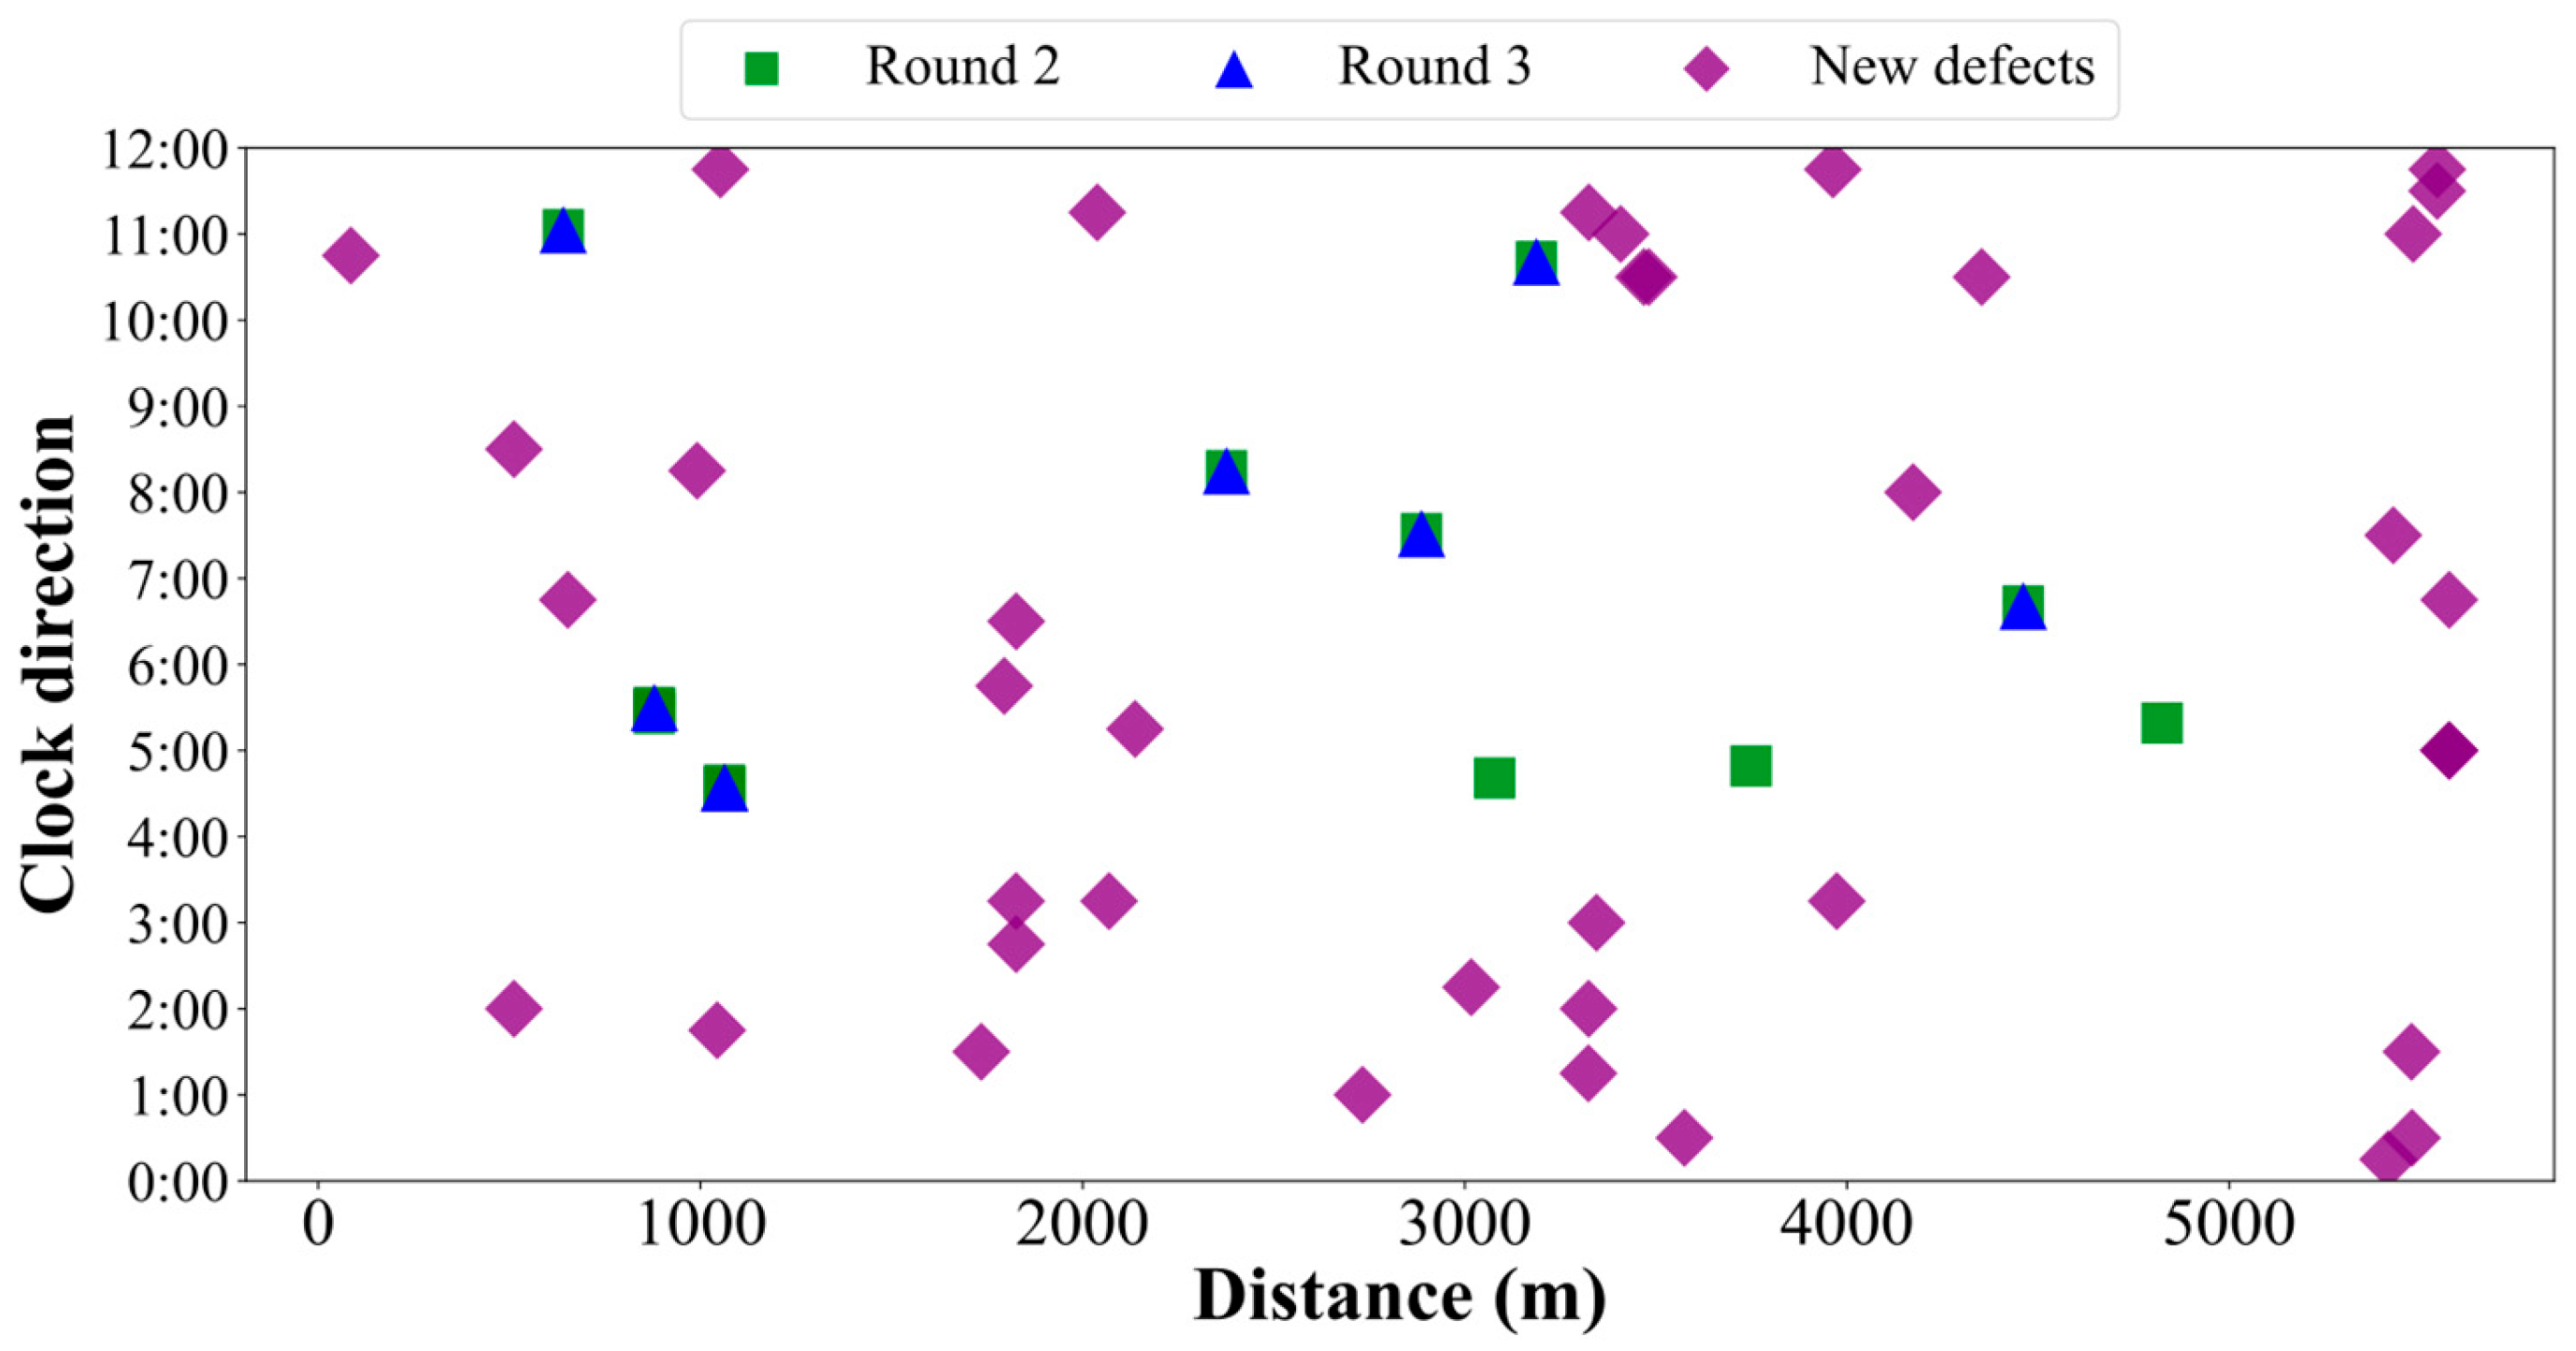
Applying the DTW algorithm for data alignment, the initial states and alignment results of the defects from the three ILI runs for the 5.6 km pipeline segment are presented in Figure 7, Figure 8 and Figure 9. Table 4 provides a statistical summary of the alignment outcomes. As can be observed from Figure 7, Figure 8 and Figure 9, the defects in the alignment runs closely coincide with those in the reference run across all runs, achieving high-precision alignment of the multi-run ILI data. This demonstrates that the ADTH-DTW algorithm can accurately identify defects at the same locations across different runs and pinpoint the positions of newly appearing defects.
Table 4 shows that four defects were aligned between the first and second runs, five between the first and third runs, and seven between the second and third runs. The failure to align certain defect positions across different runs can primarily be attributed to the excavation verification and repair procedures conducted after each inspection. After repair, the defect may appear as “repaired” in subsequent inspections (no longer identified as a defect), or the changes in local pipe geometry and magnetic signal characteristics may prevent the inspection tool from effectively matching it with its pre-repair state. Consequently, some defects detected in the first run were no longer present in the second run. As can be seen from Figure 7, Figure 8 and Figure 9, except for two defects in the first-run-to-second-run alignment that overlapped (at a distance of 1000 m, two defects at clock positions between 4 and 6 o’clock) and were not accurately matched, high-precision alignment was achieved in the first-run-to-third-run and second-run-to-third-run comparisons. No cases were observed where two defects at the same location were not correctly identified by the model. These results demonstrate that the ADTH-DTW algorithm enables high-precision alignment of multi-run ILI data, and the alignment outcomes are highly reliable.

5. Discussions

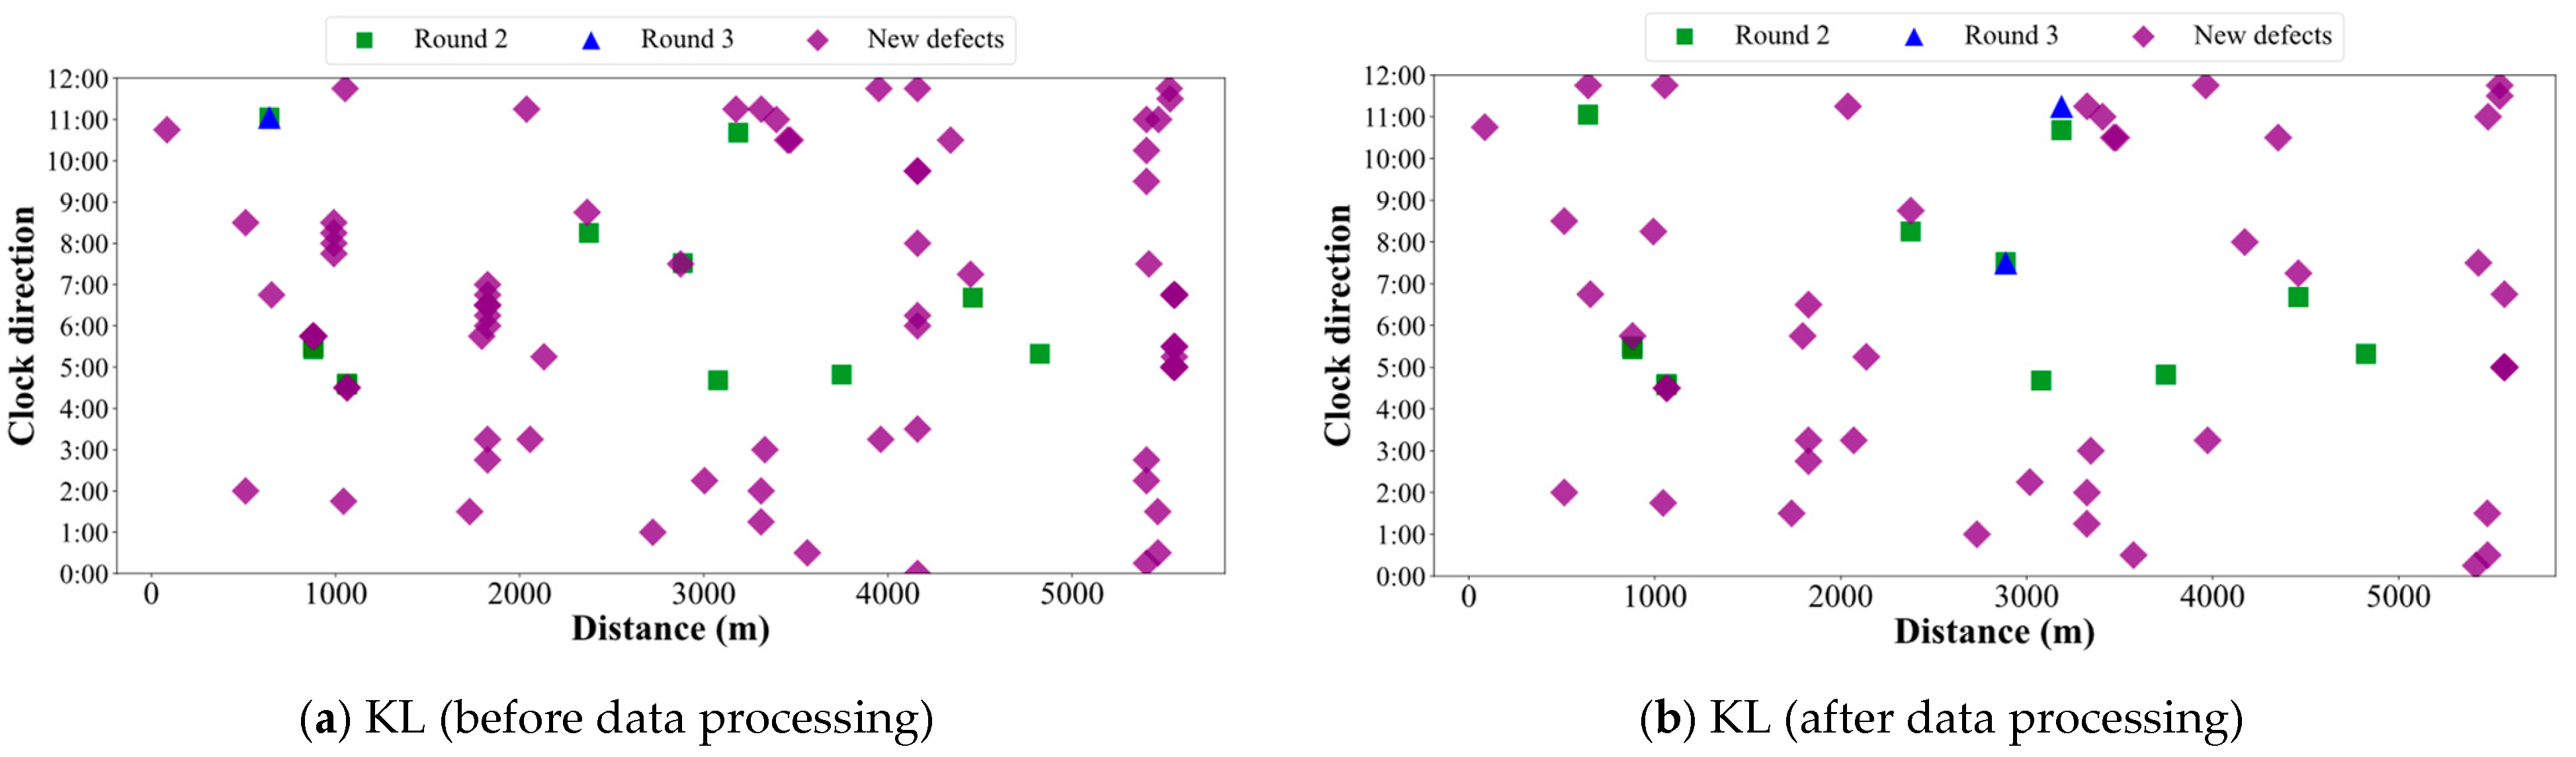
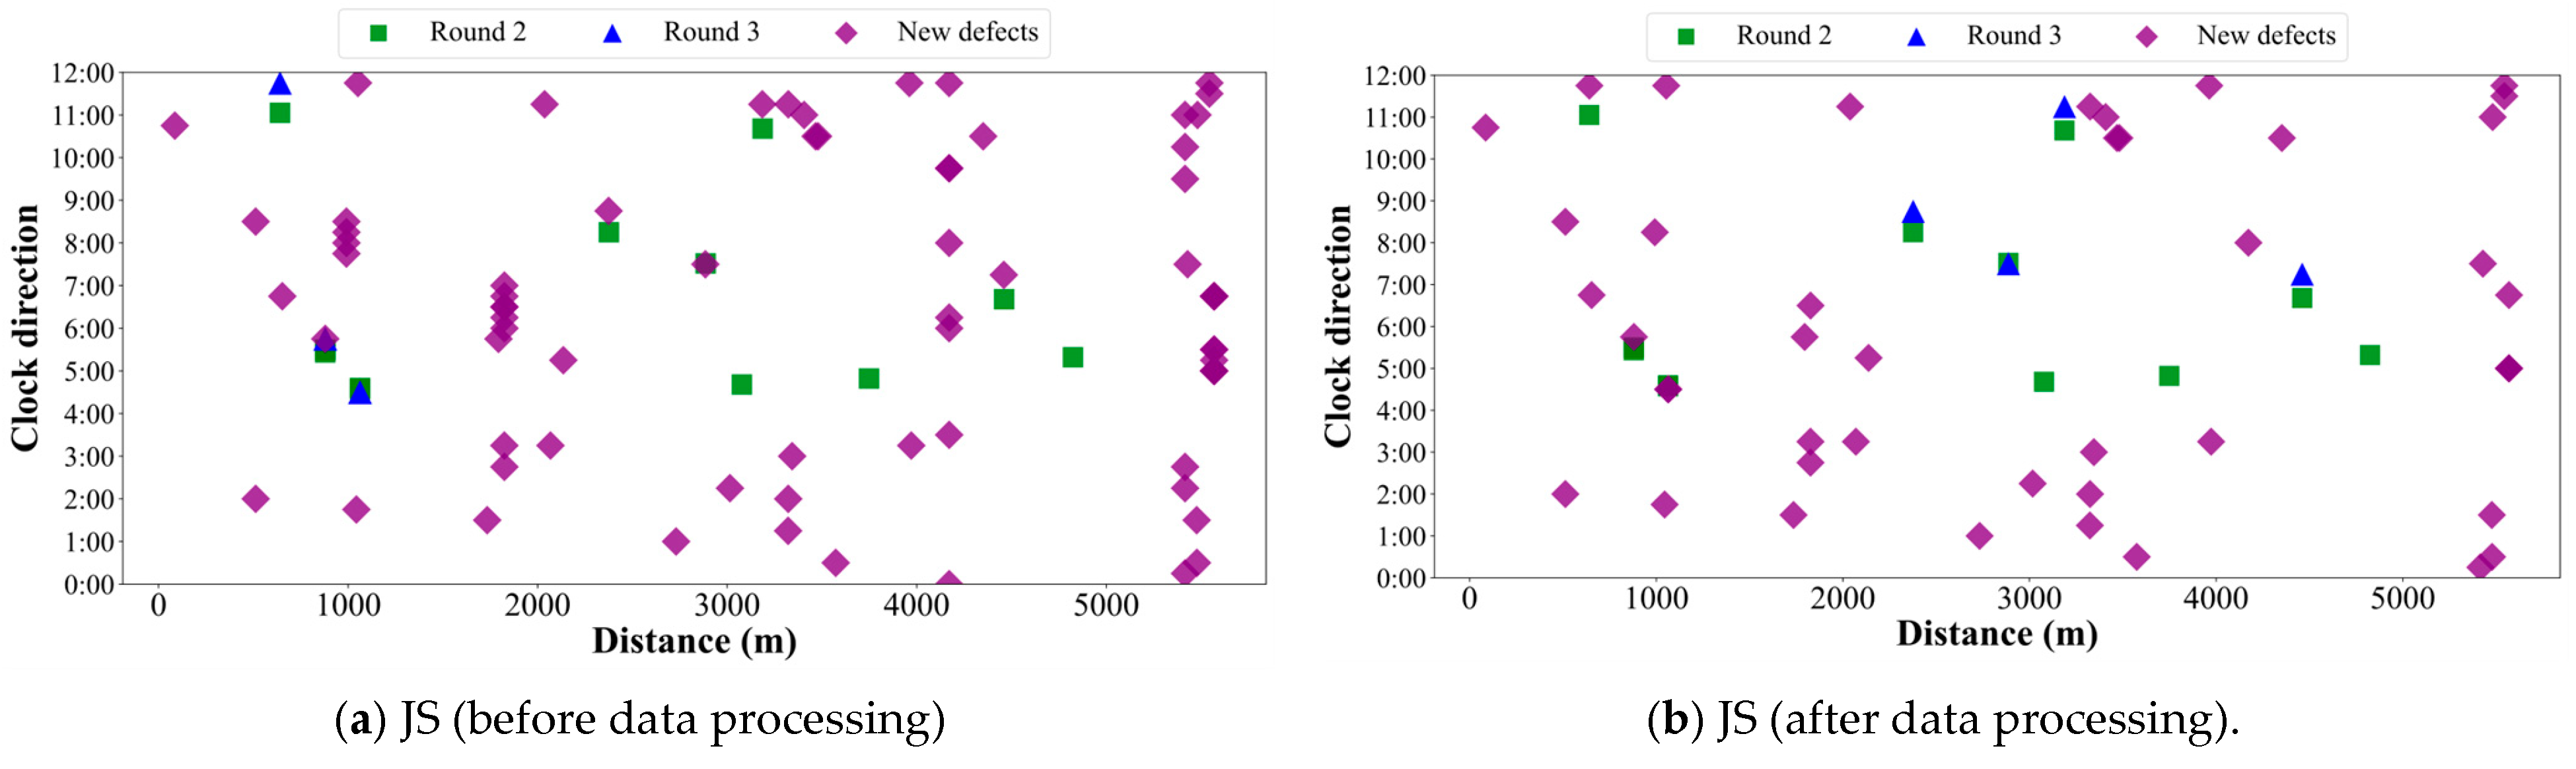
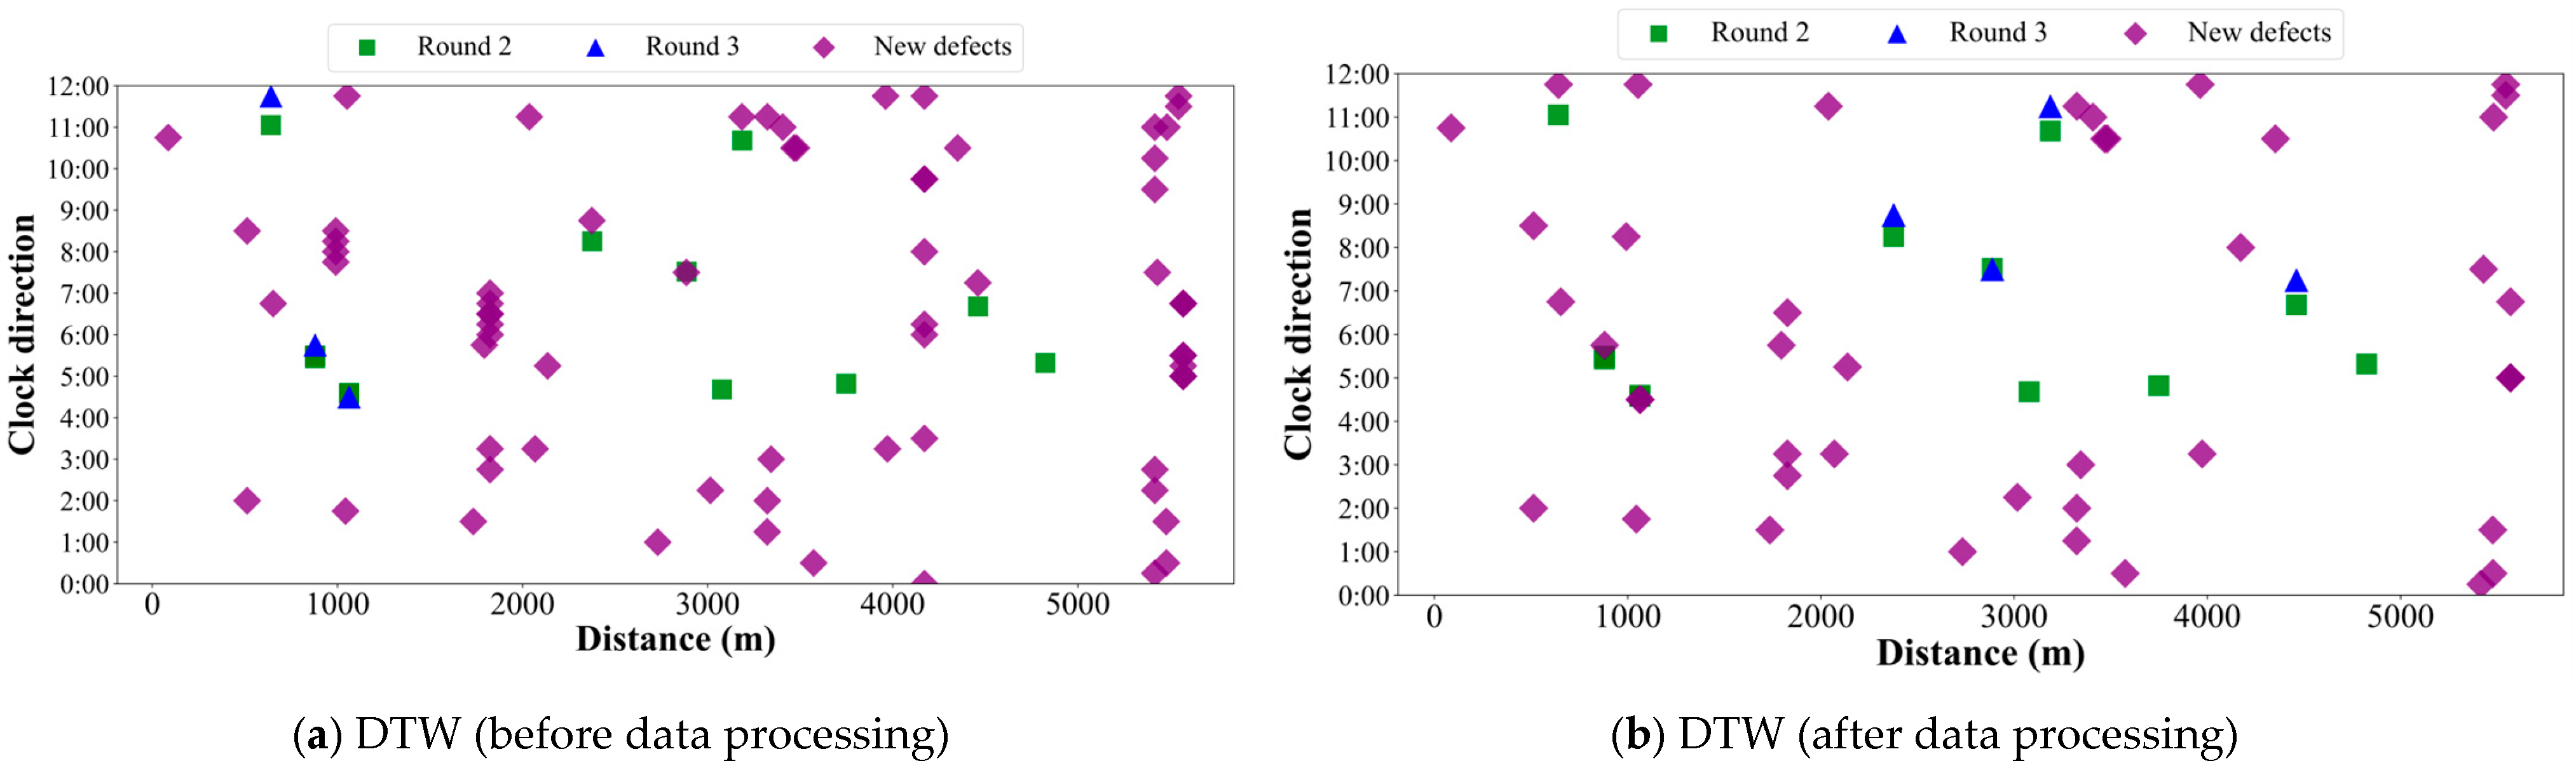
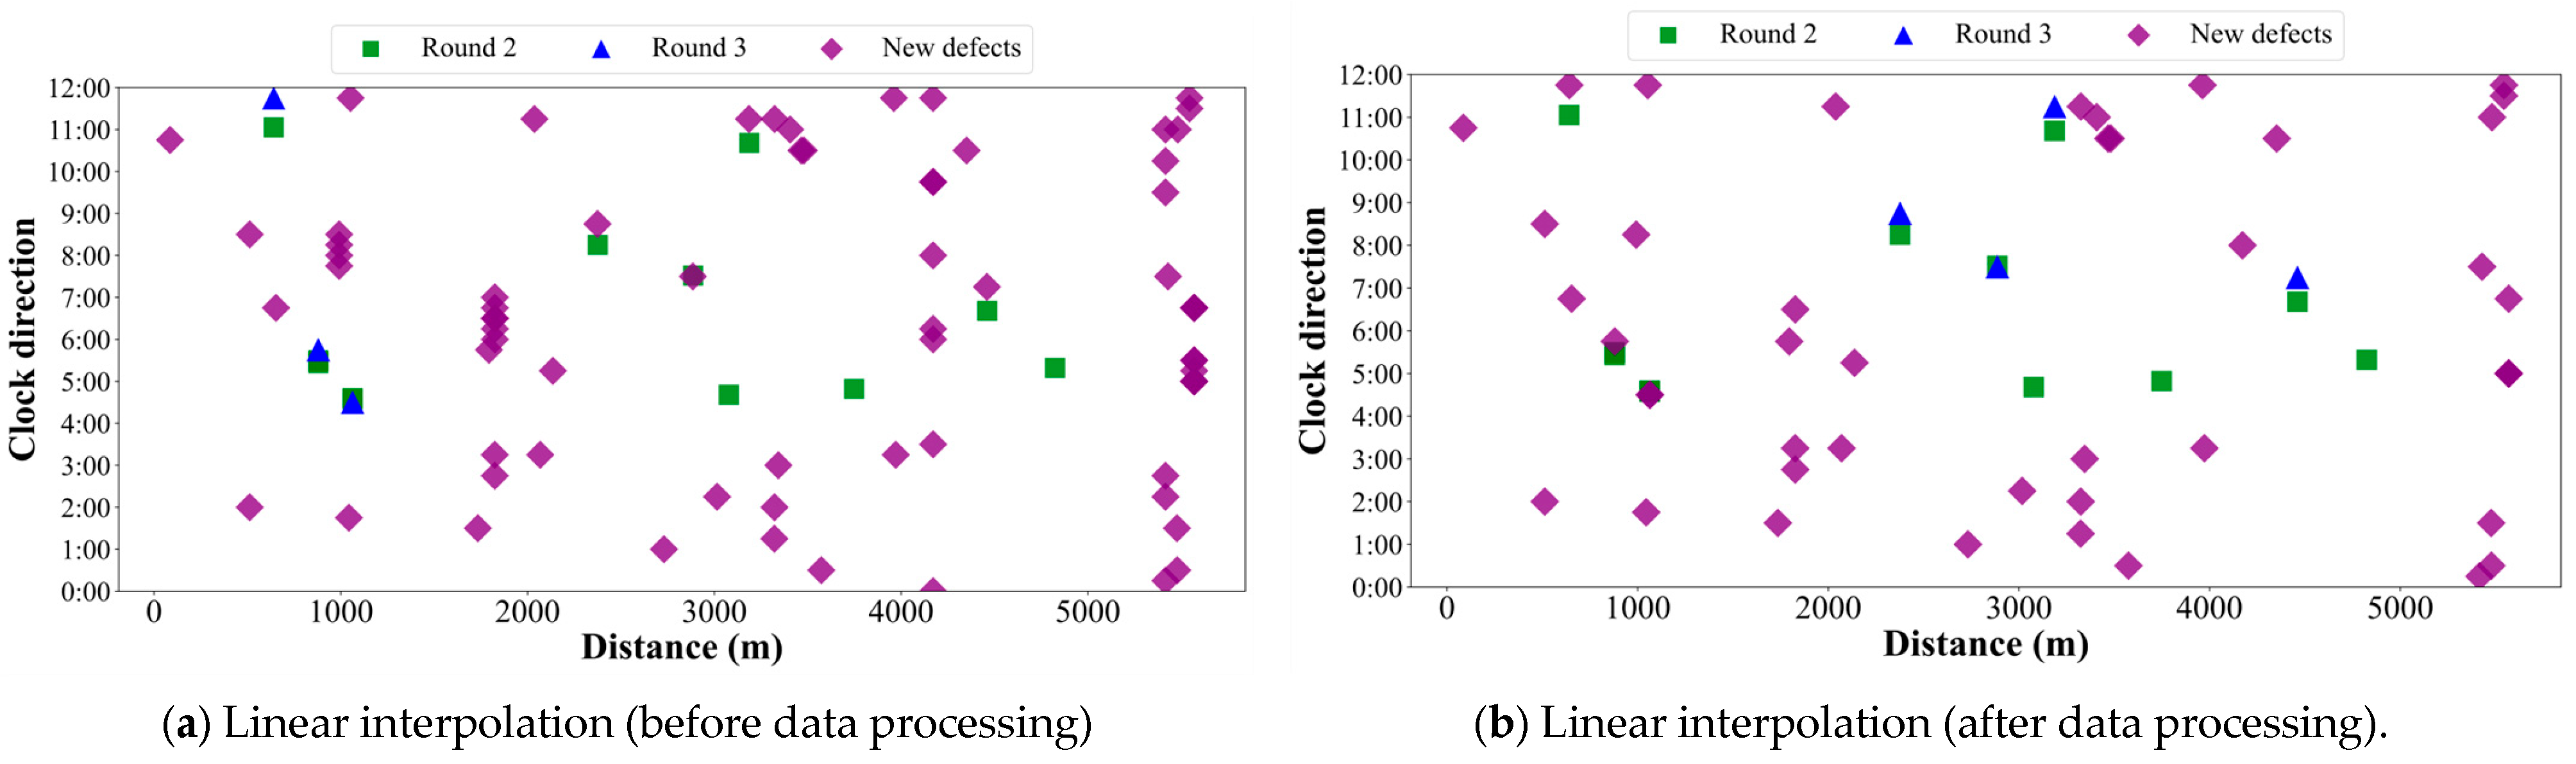
To validate the superior performance of the ADTH-DTW-based defect alignment algorithm, this study selected several commonly used algorithms in the industry for comparison and discussion, namely KL divergence, JS divergence, linear interpolation, and DTW. The calculation formulas for KL divergence, JS divergence, and linear interpolation are shown in Equations (3) and (4), and the DTW algorithm is shown in Equation (1). The validation data were obtained from the second- and third-run in-line inspection data of a 5.6 km pipeline segment. The alignment results of the various algorithms before and after data processing for the two runs are illustrated in Figure 10, Figure 11, Figure 12 and Figure 13. The alignment results using raw data are presented in Table 5, while the comparison of alignment results after adaptive threshold processing is shown in Table 6.
(1)
KL divergence:
If P1 and P2 are two different probability density functions over a continuous interval D, then the KL divergence for discrete variables is given by Equation
D ( P 1 P 2 ) = x D P 1 ( x ) log 2 P 1 ( x ) P 2 ( x )
(2)
JS divergence:
Since KL divergence is not symmetric, i.e., D ( P 1 P 2 ) D ( P 2 P 1 ) , the JS divergence is used as a measure of similarity to address this issue. Given two probability distributions, P1 and P2, the JS divergence formula is shown in Equation
J S ( P 1 P 2 ) = 1 2 K L P 1 P 1 + P 2 2 + 1 2 K L P 2 P 1 + P 2 2
(3)
Linear interpolation:
Assuming that the mileage deviation varies linearly along the pipeline, a linear mapping function is constructed using endpoints (e.g., the first and last valves). The specific formula is given in Equation (3).
f ( x ) = y k + x x k x k + 1 x k ( y k + 1 y k ) , x k x x k + 1
From panels (a) of Figure 10, Figure 11, Figure 12 and Figure 13, it can be observed that when using raw data not processed by the adaptive threshold algorithm, all types of algorithms exhibit poor alignment performance. Among them, KL divergence, JS divergence, DTW, and linear interpolation algorithms all identify 78 defects in the third run. This is because there are a large number of corrosion clusters in the pipeline. These dense corrosion defects appearing at specific locations seriously affect the accuracy of the alignment algorithms. Although there are many corrosion defects at such locations, they are close to each other and relatively small in size (e.g., at a distance of 1000 m, clock position 8 o’clock; at 1800 m, clock positions 5 to 7 o’clock, etc.). Therefore, these defects are usually consolidated to ensure alignment accuracy. As can be seen from Table 5, the defect identification and alignment performance of KL divergence, JS divergence, DTW, and linear interpolation algorithms differ from one another. KL divergence exhibits the poorest alignment effect, while the DTW algorithm mistakenly identifies too many defects as aligned defects, and its performance is also unsatisfactory.
A comparison of Figure 10, Figure 11, Figure 12 and Figure 13 with Figure 9 reveals that the ADTH-DTW algorithm exhibits a clear advantage over the JS divergence, KL divergence, DTW, and linear interpolation methods in terms of alignment performance. In Figure 9, defects located at the same position in the two ILI runs are perfectly aligned (Specifically: one defect at 800 m with a clock position of 11 o’clock; two defects at 1000 m with clock positions between 4 and 6 o’clock; two defects between 1000 and 2000 m with clock positions between 7 and 9 o’clock; one defect at 3200 m with a clock position between 10 and 11 o’clock; and one defect at 4500 m with a clock position between 6 and 7 o’clock). Although the other algorithms also show defects from the two runs appearing in close proximity, they fail to recognize these as aligned defects and instead identify them as new defects. The analysis in Table 6 shows that the JS divergence, linear interpolation, KL divergence, and DTW algorithms all failed to identify three defects each, and their alignment performance is inferior to that of the ADTH-DTW algorithm. Moreover, as shown in Table 6, the computational efficiency of DTW is more than three times higher than that of the other algorithms, while the matching rate of ADTH-DTW is, on average, 23.08% higher than that of the comparative methods. These results indicate a substantial improvement in computational efficiency achieved by the proposed algorithm. In summary, the comparative evaluation of ADTH-DTW against other data alignment algorithms demonstrates that ADTH-DTW significantly enhances both computational efficiency and alignment matching rate, making it well-suited for the alignment of multi-run ILI data in long-distance natural gas pipelines.

6. Conclusions

To address the issues of cumbersome alignment procedures and low computational efficiency in existing data alignment methods for multi-run in-line inspection (ILI) of long-distance natural gas pipelines, this paper proposes an ILI data alignment approach based on the ADTH-DTW model and establishes a novel valve–weld–defect alignment framework for multi-run ILI data. The practical efficacy of the proposed method was validated using three runs of ILI data obtained from a domestic pipeline operator. The results demonstrate that the model exhibits excellent performance in processing anomalous weld records and aligning defects at identical locations. Comparative analysis using the second and third runs of ILI data against several other algorithms reveals that the computational efficiency of the DTW algorithm is improved by more than threefold, while the alignment accuracy is increased by an average of 23.08%. By integrating the DTW algorithm into each stage of the alignment process, the proposed approach avoids unnecessary manual intervention and substantially improves the overall efficiency of data alignment.

Author Contributions

Conceptualization, Q.L. (Qiang Li). and L.Z.; methodology, Q.L. (Qiang Li). and Z.T.; software, Q.L. (Qiang Liang).; validation, D.W., J.W. and X.C.; formal analysis, Z.T.; data curation, Q.L. (Qiang Li); writing—original draft preparation, Q.L. (Qiang Li). All authors have read and agreed to the published version of the manuscript.

Funding

This work was supported by the National Major Science and Technology Projects of China [grant number 2025ZD1403701].

Data Availability Statement

The data presented in this study are available on request from the corresponding author. The data are not publicly available due to the presence of sensitive operational information from the enterprise’s in-line inspection, including geographical locations of key equipment and facilities.

Conflicts of Interest

Authors Qiang Li, Qiang Liang and Donghong Wei were employed by the Guangdong Dapeng LNG Company Limited. The remaining authors declare that the research was conducted in the absence of any commercial or financial relationships that could be construed as potential conflicts of interest.

Nomenclature

Δ represents the offset
S A 1 , S A 2 represent the mileage values of valve chamber A in the reference run and the alignment run, respectively

References

  1. Vanaei, H.R.; Eslami, A.; Egbewande, A. A review on pipeline corrosion, in-line inspection (ILI), and corrosion growth rate models. Int. J. Press. Vessel. Pip. 2017, 149, 43–54. [Google Scholar] [CrossRef] [Scilit]
  2. Liu, T.; Cai, X.; Zhou, W.; Wang, K.; Wang, J. Enhanced detection of pipeline leaks based on generalized likelihood ratio with ensemble learning. Processes 2025, 13, 558. [Google Scholar] [CrossRef] [Scilit]
  3. Xu, L.; Yu, J.; Zhu, Z.; Man, J.; Yu, P.; Li, C.; Wang, X.; Zhao, Y. Research and application for corrosion rate prediction of natural gas pipelines based on a novel hybrid machine learning approach. Coatings 2023, 13, 856. [Google Scholar] [CrossRef] [Scilit]
  4. Liu, H.; Cai, X.; Meng, X. Fast and accurate prediction of corrosion rate of natural gas pipeline using a hybrid machine learning approach. Appl. Sci. 2025, 15, 2023. [Google Scholar] [CrossRef] [Scilit]
  5. Wen, Y.X.; Jia, F.S.; Liu, P.C.; Wang, F.; Chen, J.Z.; Ma, Y.L. Research and application of probability distribution law of corrosion detection data of in-line inspection in pipeline. Oil-Gas Field Surf. Eng. 2024, 43, 70–76. [Google Scholar]
  6. Dann, M.R.; Dann, C. Automated matching of pipeline corrosion features from in-line inspection data. Reliab. Eng. Syst. Saf. 2017, 162, 40–50. [Google Scholar] [CrossRef] [Scilit]
  7. Wang, M.X. Research on Biomedical Ontology Alignment Based on Multi-Strategy. Master’s Thesis, Wuhan University of Technology, Wuhan, China, 2022. [Google Scholar]
  8. Wang, B.; Hang, C.C.; Liu, J.; Sun, P.; Yang, Y. Alignment and application of internal detection data and construction materials for pipelines. Oil-Gas Field Surf. Eng. 2018, 37, 87–89. [Google Scholar]
  9. Hu, W.; Jing, Y.H. Recommendation algorithm based on fusion of KL divergence and JS divergence similarity. J. Harbin Univ. Commer. (Nat. Sci. Ed.) 2020, 36, 48–53. [Google Scholar]
  10. Liu, G.R. Pipeline integrity evaluation technology based on two-round internal detection data mining. World Pet. Ind. 2023, 30, 62–68. [Google Scholar]
  11. Kang, C.; Zhang, P.G.; Ma, X.L.; Deng, Y.F.; Deng, B.H.; Cao, H.F.Y. Batch by batch iteration-based algorithm for internal detection data alignment. Control Instrum. Chem. Ind. 2025, 52, 449–456+469. [Google Scholar]
  12. Liu, H. Research on pipeline integrity evaluation technology considering alignment of internal and external inspection data. Pet. Eng. Constr. 2022, 48, 44–48. [Google Scholar]
  13. Yang, H.; Liu, X.L.; Li, Q.; Ling, J.Y.; Yu, H. Research and application of alignment algorithm for multiple in-line inspection data of oil and gas pipeline. Pipeline Tech. Equip. 2020, 1, 21–24+28. [Google Scholar]
  14. Yang, H. Comparative Analysis Method and Application of Oil and Gas Pipeline In-Line Inspection Data. Master’s Thesis, Northeast Petroleum University, Daqing, China, 2017. [Google Scholar]
  15. Liu, H.P.; Gu, S.Y.; Liu, Q.L.; Zhang, J.K.; Hao, Y.; Wu, X.C.; Jiang, Y.L.; Wan, P. Alignment method of internal and external pipeline inspection data based on machine learning algorithm. Oil Gas Storage Transp. 2021, 40, 1236–1241. [Google Scholar]
  16. Zhang, H.W.; Jin, J.; Dong, S.H.; Zhang, L.B.; Li, N. Application of semantic similarity calculation in parameter matching of detection data. Pet. Sci. Bull. 2018, 3, 446–451. [Google Scholar]
  17. Fumitada, I.; Taizo, U. Distance measure for speech recognition based on the smoothed group delay spectrum. In ICASSP ‘87: IEEE International Conference on Acoustics, Speech, and Signal Processing; The Institute of Electrical and Electronics Engineers, Inc.: New York, NY, USA, 1987; pp. 1257–1260. [Google Scholar]
  18. Tomaszewska, J.; Witoś, M.; Kwaśniewski, J. Application of dynamic time warping (DTW) in comparing MRT signals of steel ropes. Appl. Sci. 2025, 15, 7924. [Google Scholar] [CrossRef] [Scilit]
  19. Althobaiti, M. Unsupervised dynamic time warping clustering for robust functional network identification in fNIRS motor tasks. Sensors 2026, 26, 1848. [Google Scholar] [CrossRef] [Scilit] [PubMed]
  20. Wang, L.; Koniusz, P. Uncertainty-DTW for time series and sequences. In European Conference on Computer Vision; Springer: Cham, Switzerland, 2022. [Google Scholar]
  21. Cui, K. Algorithm and application of pipeline in-line inspection data alignment. In Proceedings of the ASME Pressure Vessels and Piping Conference; ASME: New York, NY, USA, 2022. [Google Scholar]
  22. Niu, Y.; Li, X.; Li, J.; Liu, Y.Q.; Judith, J. Research on sentence semantic similarity based on DTW and improved Hungarian algorithm. Comput. Digit. Eng. 2021, 49, 242–247. [Google Scholar]
  23. Wu, X.; Xu, J.; Li, K.; Yin, J.; Xiong, J. FLDTMatch: Improving unbalanced data classification via deep semi-supervised learning with self-adaptive dynamic threshold. Mathematics 2025, 13, 392. [Google Scholar] [CrossRef] [Scilit]
  24. Zheng, L.; Jiang, Y.; Jiang, H.; Tang, C.; Jiao, W.; Shi, Z.; Rehman, A.U. Adaptive dynamic threshold graph neural network: A novel deep learning framework for cross-condition bearing fault diagnosis. Machines 2023, 12, 18. [Google Scholar] [CrossRef] [Scilit]
Figure 1. Dynamic bending distance path diagram.
Processes 14 01360 g001
Figure 2. Data alignment algorithm process based on ADTH-DTW.
Processes 14 01360 g002
Figure 3. Analysis of the causes of mismatches in the spatial positioning of multi-round internal detection data.
Processes 14 01360 g003
Figure 4. Comparison of pre-treatment and post-treatment of the first round of in-line inspection data for the first 500 m of welds.
Processes 14 01360 g004
Figure 5. Comparison of pre-treatment and post-treatment of the second round of in-line inspection data for the first 500 m of welds.
Processes 14 01360 g005
Figure 6. Comparison of pre-treatment and post-treatment of the third round of in-line inspection data for the first 500 m of welds.
Processes 14 01360 g006
Figure 7. First round–Second round defect alignment results diagram.
Processes 14 01360 g007
Figure 8. Defect alignment results diagram for the first to third rounds of testing.
Processes 14 01360 g008
Figure 9. Second round–Third round internal defect alignment results diagram.
Processes 14 01360 g009
Figure 10. KL divergence 2–3 round defect alignment results diagram.
Processes 14 01360 g010
Figure 11. JS divergence 2–3 round defect alignment results diagram.
Processes 14 01360 g011
Figure 12. DTW 2–3 round defect alignment results chart.
Processes 14 01360 g012
Figure 13. Linear interpolation 2–3 round defect alignment results chart.
Processes 14 01360 g013
Table 1. Current status of data alignment algorithm research.
CategoryMethodLimitation
Based on Mathematical ModelsLinear Interpolation AlgorithmProne to the issue of interpolation exceeding limits
KL DivergenceSusceptible to false positives and missed detections
JS DivergenceRelatively long alignment time
Based on Machine LearningXGBoost AlgorithmRelatively long computation time
Based on Text SimilaritySemantic SimilarityApplicable only to textual data
Table 2. Statistics of raw internal detection data.
ItemFirst ILI RunSecond ILI RunThird ILI Run
Valve Chamber433
Girth Weld542544559
Defect171348
Bend8280224
Table 3. Effectiveness of Data Alignment Algorithm.
MetricFirst ILI RunSecond ILI RunThird ILI Run
Raw Data Count541543558
Proportion of Valid Intervals72.1% (390/541)71.8% (390/543)69.5% (388/558)
Average Spacing10.27 m ± 5.93 m10.24 m ± 5.93 m9.96 m ± 5.95 m
Processed Data Count415415416
Proportion of Valid Intervals (Post)83.6% (346/415)83.6% (346/415)83.1% (345/415)
Average Spacing (Post)12.42 m ± 32.93 m12.43 m ± 32.94 m12.39 m ± 32.66 m
Table 4. Effectiveness of Data Processing Algorithm.
Alignment PairFirst Run–Second RunFirst Run–Third RunSecond Run–Third Run
Reference roundFirst RunFirst RunSecond Run
Defect Count in Reference Run8813
Alignment RunSecond RunThird RunThird Run
Duplicate Defect Count457
New Defect Count44341
Table 5. Comparison of 2–3 round data alignment algorithms (raw data).
ModelADTH-DTWKL DivergenceJS DivergenceDTWLinear Interpolation
Defect Count in Reference Run1313131313
Defect Count in Alignment Run4848484848
Matched Defects756117
New Defects4173726771
Table 6. Comparison of 2–3 round data alignment algorithms.
ModelADTH-DTWKL DivergenceJS DivergenceDTWLinear Interpolation
Defect Count in Reference Run1313131313
Defect Count in Alignment Run4848484848
Matched Defects74444
New Defects4144444444
Matching Rate53.85%30.77%30.77%30.77%30.77%
Computational Efficiency0.090.380.360.360.37
Disclaimer/Publisher’s Note: The statements, opinions and data contained in all publications are solely those of the individual author(s) and contributor(s) and not of MDPI and/or the editor(s). MDPI and/or the editor(s) disclaim responsibility for any injury to people or property resulting from any ideas, methods, instructions or products referred to in the content.