1. Introduction
One of the most effective strategies for reducing greenhouse gas emissions and supporting sustainable transportation systems is the electrification of road transport combined with increased reliance on local renewable energy sources [
1,
2]. Electric vehicles (EVs) play a critical role in achieving global sustainability goals by reducing emissions, improving energy efficiency, and enhancing urban air quality. Over the past decade, global EV adoption has increased rapidly due to policy incentives, declining battery costs, and technological advances. In 2024, global electric car sales exceeded 17 million, marking a 35% increase from 2023 [
3].
Despite their benefits, the widespread integration of EVs presents significant challenges for both the energy and transportation sectors. Numerous technical, economic, and social barriers must be addressed to facilitate seamless adoption [
4]. The complexity of EV integration stems from two primary factors: (1) EV charging loads are considerably larger than conventional loads, imposing substantial demands on power grids; and (2) the evolving nature of EV technology introduces uncertainties related to driver behavior, data availability, infrastructure development, and technological advancements [
5]. Accurate estimation of EV charging demand and assessment of grid impact are therefore essential [
6]. Addressing these challenges requires probabilistic charging models that capture the inherent variability of EV user behavior [
7]. These models support system planning and policy development by enabling reliable grid impact assessment [
8].
Extensive research has been conducted to develop models for estimating EV charging loads and their impact on power systems. For example, Shafiq et al. [
9] developed a deterministic model to assess residential EV charging demand in a specific U.S. region, with a focus on its reliability implications. Other studies have explored EV load estimation across various settings—including residential areas, workplaces, and fast-charging stations—using probabilistic and simulation-based approaches [
10]. Several studies have investigated EV charging load estimation across different operational environments using probabilistic and simulation-based approaches. In residential settings, researchers have focused on modeling home charging behavior by analyzing daily travel patterns, arrival times, and charging duration in order to estimate aggregated household charging demand. These studies often employ stochastic models and Monte Carlo simulation to capture the variability in driver behavior and charging preferences [
11,
12]. In workplace and public charging environments, the focus has typically been on predicting spatial and temporal charging demand patterns based on user mobility behavior, parking duration, and charging infrastructure availability. Such studies aim to support infrastructure planning and demand management in urban charging networks [
13,
14].
In addition, several works have addressed EV charging demand at fast-charging stations, where high charging power and short dwell times create different demand characteristics compared to residential or workplace charging. These studies often analyze charging station utilization, queueing behavior, and the potential impacts on power distribution networks [
15,
16]. Previous research has also examined the EV grid integration from both short- and long-term planning perspectives [
17]. However, the integration of renewable energy into existing power grids is associated with several technical and operational limitations [
18]. Coordinated charging strategies have been widely investigated to enhance grid reliability and stability by mitigating adverse impacts on the power system [
19].
Despite extensive research on EV charging demand in residential, workplace, and public charging environments, the charging behavior of EV fleets in rental car facilities remains largely unexplored. Rental car operations differ fundamentally from private vehicle use for several reasons: first, rental car companies are increasingly transitioning to EV fleets. Second, rental fleets consist of a large number of vehicles that require efficient charging within limited timeframes and locations. Third, investment in charging infrastructure within rental car companies is closely tied to economic viability. Given these factors, it is crucial to develop robust models to estimate EV consumption in rental fleets, thereby facilitating the design and implementation of suitable charging infrastructure.
This study aims to address the limited research on EV charging demand modeling for rental car fleets by proposing a probabilistic framework specifically tailored to rental car operational environments. Unlike conventional EV charging studies that primarily focus on private vehicles or public charging infrastructure, rental fleets exhibit distinct operational characteristics, including scheduled vehicle turnover, centralized parking locations, and constrained charging windows between rental periods. These characteristics introduce unique uncertainties in charging demand that are not adequately captured in existing models.
To address this challenge, the present study develops a data-driven probabilistic framework for estimating EV charging loads in rental car facilities. The proposed approach integrates multiple sources of information to represent the operational behavior of rental fleets more realistically. First, rental mobility data are analyzed to capture driving patterns such as trip distances, pick-up times, and drop-off times. Second, conventional rental vehicle data are systematically mapped to equivalent electric vehicle models based on comparable vehicle categories, enabling the estimation of EV energy consumption from real mobility records. Third, manufacturer specifications related to EV battery capacity and driving range are incorporated to represent realistic vehicle performance characteristics. Finally, charging standards and protocols are considered to model different charging power levels and infrastructure configurations.
To capture the inherent variability in rental fleet operations, a probabilistic modeling approach is adopted using Monte Carlo simulation (MCS). In addition, a statistical characterization and comparison methodology is applied to identify the most appropriate probability distributions for key behavioral variables based on goodness-of-fit tests. The resulting probabilistic framework allows the generation of diverse charging scenarios that reflect realistic operational conditions and uncertainties in EV charging demand.
By integrating empirical rental mobility data, EV technical parameters, and probabilistic simulation techniques, the proposed framework provides a systematic approach for estimating EV charging demand in rental fleet environments. The results offer practical insights for designing charging infrastructure, improving fleet charging strategies, and supporting decision-making for the transition toward electrified rental fleets. The main objectives of this paper are as follows:
- -
to develop a data-driven probabilistic model that represents EV charging demand in rental car facilities based on empirical mobility data;
- -
to incorporate uncertainties in rental behavior, charging time, and energy demand using MC simulation;
- -
to evaluate the impact of charger power levels and infrastructure size on energy served, unmet demand, and charger utilization; and
- -
to provide insights for planning charging infrastructure that balances operational reliability, infrastructure investment, and fleet availability.
The remainder of this paper is organized as follows:
Section 2 describes the data collection and statistical analysis methodology;
Section 3 presents the EV charging demand modeling and simulation setup;
Section 4 presents the mathematical formulation of EV charging management;
Section 5 discusses the results under different charging scenarios; and
Section 6 concludes the paper with key findings.
2. Methodology for Data Collection and Statistical Analysis
This section outlines the key procedures and research activities required to achieve the main objective of this study. It also provides a detailed overview of the procedures for collecting and analyzing data on the factors influencing EV load curves in rental car areas.
2.1. Identifying Key Determinants and Factors
The first step in this research is to identify the determinants affecting EV charging load patterns in car rental areas. Key factors include pickup and drop-off times, rental duration, mileage driven, and the specific characteristics of rental vehicles. Understanding these elements enables targeted data collection aligned with the objectives of this research.
The dataset used in this study consists of historical rental mobility records collected from four operational rental offices across different regions to ensure diverse geographic representation. The dataset includes 600 rental contracts recorded over a four-month period. Each contract contains information regarding vehicle pickup time, drop-off time, and total driven mileage. The dataset was filtered to remove incomplete records and entries with missing temporal or mileage information. After preprocessing, the dataset provides a representative sample of daily rental mobility patterns observed within the studied rental network.
Table 1 provides a sample of the collected data, including vehicle types, models, rental timelines, and corresponding EV parameters such as battery capacity and kilometers per charge. This dataset enables comprehensive analysis of rental behavior and energy consumption trends, facilitating the development of an accurate charging demand model.
Although the dataset originates from conventional internal combustion engine (ICE) vehicles, it captures the fundamental mobility characteristics of rental fleet operations, including trip timing, rental duration, and travel distance. These variables remain largely independent of vehicle propulsion technology and therefore provide a reliable basis for estimating EV charging demand. To translate ICE mobility data into EV charging requirements, each ICE vehicle category in the dataset was linked to a comparable EV model based on similarity in vehicle size, class, and general specifications, as shown in
Table 1. For instance, the Toyota Camry was matched with the Tesla Model S as an equivalent EV category. The Tesla Model S has a battery capacity of approximately 98 kWh and a driving range of about 535 km, making it a suitable representative counterpart for estimating EV energy demand in the simulation framework.
While the dataset provides a realistic representation of rental mobility behavior across multiple operational locations, it is important to acknowledge certain limitations. The data were collected over a four-month period, which may not fully capture seasonal variations in rental demand, such as peak tourism periods or holiday-related travel patterns. Additionally, regional differences in driving behavior and mobility needs may influence charging demand characteristics. Nevertheless, the dataset captures the fundamental operational patterns of rental fleet usage, including trip timing and travel distances, which are the primary drivers of charging demand. Therefore, it is considered sufficiently representative for the purpose of charging infrastructure planning at the operational level.
2.2. Statistical Model
It is essential to conduct a comprehensive statistical evaluation for accurately representing the stochastic characteristics of rental fleet behavioral variables that influence EV charging demand. The aim of this step is to determine suitable probability density functions (PDFs) capable of describing the variability observed in key operational parameters, including vehicle pick-up times, drop-off times, and rental duration. These variables play an important role in defining vehicle availability patterns and, consequently, the timing and magnitude of charging demand within the fleet charging infrastructure.
To identify the most appropriate statistical models, several theoretical probability distributions were examined. The evaluated distributions include commonly used statistical models such as the Normal, Lognormal, Beta, Gamma, and Weibull distributions, as well as more flexible distributions such as the Generalized Pareto and Generalized Extreme Value models. These distributions have been widely used in modeling stochastic behavior in transportation systems and energy demand studies. After identifying the candidate distributions, their suitability for representing the empirical datasets was evaluated using goodness-of-fit tests. In this study, the Kolmogorov–Smirnov (K–S) test was adopted due to its effectiveness in measuring the maximum deviation between the empirical cumulative distribution function of the observed data and the cumulative distribution function of the fitted theoretical distribution. A smaller K–S statistic indicates a closer agreement between the theoretical distribution and the empirical observations.
To provide a transparent comparison of the evaluated distributions, the K–S statistics obtained for the key behavioral variables are summarized in
Table 2. The table reports the goodness-of-fit results for several candidate probability distributions fitted to the empirical datasets representing pick-up times, drop-off times, and rental duration. The mathematical expressions of the selected probability density functions and their corresponding parameters are summarized in
Table 3. The parameters were estimated through statistical fitting of the empirical dataset using the EasyFit software package (Version 5.50), which applies standard parameter estimation techniques and evaluates candidate probability distributions [
20].
The selection of the final probability distributions was based on the K–S goodness-of-fit test. A significance level of 5% was adopted, and distributions with lower K–S statistics were considered better representations of the empirical data. The chosen distributions correspond to those that minimized the deviation between the empirical and theoretical cumulative distribution functions while remaining consistent with the observed behavior of the variables. Since the selected probability distributions were chosen based on their statistical agreement with the empirical data, the generated samples preserve the main characteristics of the observed variables. Consequently, the simulation outcomes are primarily driven by the underlying demand patterns rather than minor differences in the functional form of the fitted distributions. A detailed sensitivity analysis of alternative distributions is considered a potential extension for future work.
The results summarized in
Table 2 show that flexible heavy-tailed distributions provide the most suitable representation of the behavioral variables in the rental fleet dataset. Specifically, the Generalized Pareto distribution achieved the lowest K–S statistic for both pick-up times and rental duration, indicating a strong agreement with the observed data. For drop-off times, the Generalized Extreme Value distribution produced the lowest K–S statistic, demonstrating its ability to capture the asymmetric pattern of vehicle return behavior observed in the rental fleet operations. These findings indicate that rental fleet mobility variables exhibit skewed and non-Gaussian characteristics rather than simple symmetric distributions. Therefore, the probability distributions with the lowest K–S statistics were selected to represent the stochastic behavior of the studied variables in the Monte Carlo simulation framework used to estimate EV charging demand and evaluate charging infrastructure performance.
3. Simulation Model for EV Charging Energy Consumption
The proposed simulation model estimates the energy consumption of EVs when charging with chargers of specified capacity. This estimation is based on previously collected and analyzed data, including daily energy consumption, vehicle pickup, and drop-off times. The model is implemented in MATLAB (Version R2024a). In this study, the driving distance recorded from the rental contracts, which captures the distance traveled between the vehicle’s departure and return, is used to determine the required charging energy when the vehicle returns to the rental office. Therefore, the effect of mileage on charging demand is directly incorporated through the required energy variable. In contrast, rental duration is used to estimate the vehicle return time and determine the timing of charging events.
The simulation begins by defining key variables such as charger power, the number of vehicles, and the total simulation duration. It then computes the required charging time for each vehicle, accounting for each vehicle’s required charging energy and the charger power. Vehicles are prioritized based on their charging requirements, with those requiring the longest charging time given the highest priority.
Next, chargers are allocated efficiently to maximize the number of charged vehicles while minimizing waiting times. The simulation dynamically updates energy demand and charger utilization on an hourly basis. Two charger types are considered: a slow charger with a capacity of 7.2 kW and a fast charger with a capacity of 50 kW. Multiple scenarios are tested with varying numbers of chargers, ranging from 10 to 50.
The MATLAB-based model simulates the charging demand profile of EVs based on their drop-off times, pickup times, and required charging energy. The objective is to prioritize the charging schedule while considering constraints such as charger availability, charging power, and the necessity to fully charge each vehicle before its pickup time. The simulation process follows a structured approach, beginning with data initialization and priority sorting before allocating chargers based on availability.
Table 4 presents the pseudo-code of this workflow, illustrating the sequential steps from input data processing to the final output analysis. This flowchart highlights the key stages of the simulation, including charging scheduling, energy demand updates, and performance evaluation.
4. Mathematical Formulation of EV Charging Management
To effectively manage EV charging while ensuring efficient energy distribution, a mathematical framework is developed to represent the scheduling and allocation process. The scheduling is implemented using a priority-based heuristic that seeks to satisfy the objective under constraints. This formulation aims to maximize the total energy delivered to EVs while accounting for charging constraints and ensuring vehicle readiness by their designated pickup times.
Table 5 summarizes the key parameters and variables used in the mathematical model, including the number of EVs, charger power, operational time frames, charging start and end times, energy served, and unmet charging demand.
The following sub-section presents the detailed mathematical formulation, outlining the objective function, constraints, and equations governing the EV charging management system.
4.1. Objective
Maximize the total energy served to all EVs while respecting the charger constraints and ensuring EVs are ready by their pickup times, as expressed in (1)–(13).
4.2. Charging Time Calculation
The charging time required for each EV depends on the required charging energy and the rated power of the charger.
4.3. Charging Window Constraints
Charging for each EV can only begin after the vehicle returns to the rental office and must be completed.
4.4. Charger Availability
At any time step, each charger can serve at most one EV, thereby ensuring that charger capacity is not exceeded.
To represent the charger allocation and charging process over time, two binary decision variables are introduced. The variable represents the assignment of an EV to a charger , while indicates whether an EV is actively charging on charger at time step . These variables enable the model to capture both charger assignment and time-dependent charger utilization within the simulation horizon.
4.5. Energy Tracking
The served energy is tracked for each EV, and the unserved energy is computed as the difference between the required charging energy and the actual delivered energy.
At the fleet level, the total served energy (
ES) is obtained by summing the delivered energy across all EVs. Similarly, the total unserved energy (
ENS) represents the aggregate unmet charging demand in the system.
4.6. Demand Profile Computation
The hourly charging demand profile is computed by summing the charging power of all active chargers at each time step.
5. Results and Discussion
This section examines the charging performance of rental EV fleets under two commonly used charger power levels, 7.2 kW and 50 kW, to highlight their impact on energy delivery and system performance.
5.1. Energy Served and Not Served for Chargers 7.2 kW
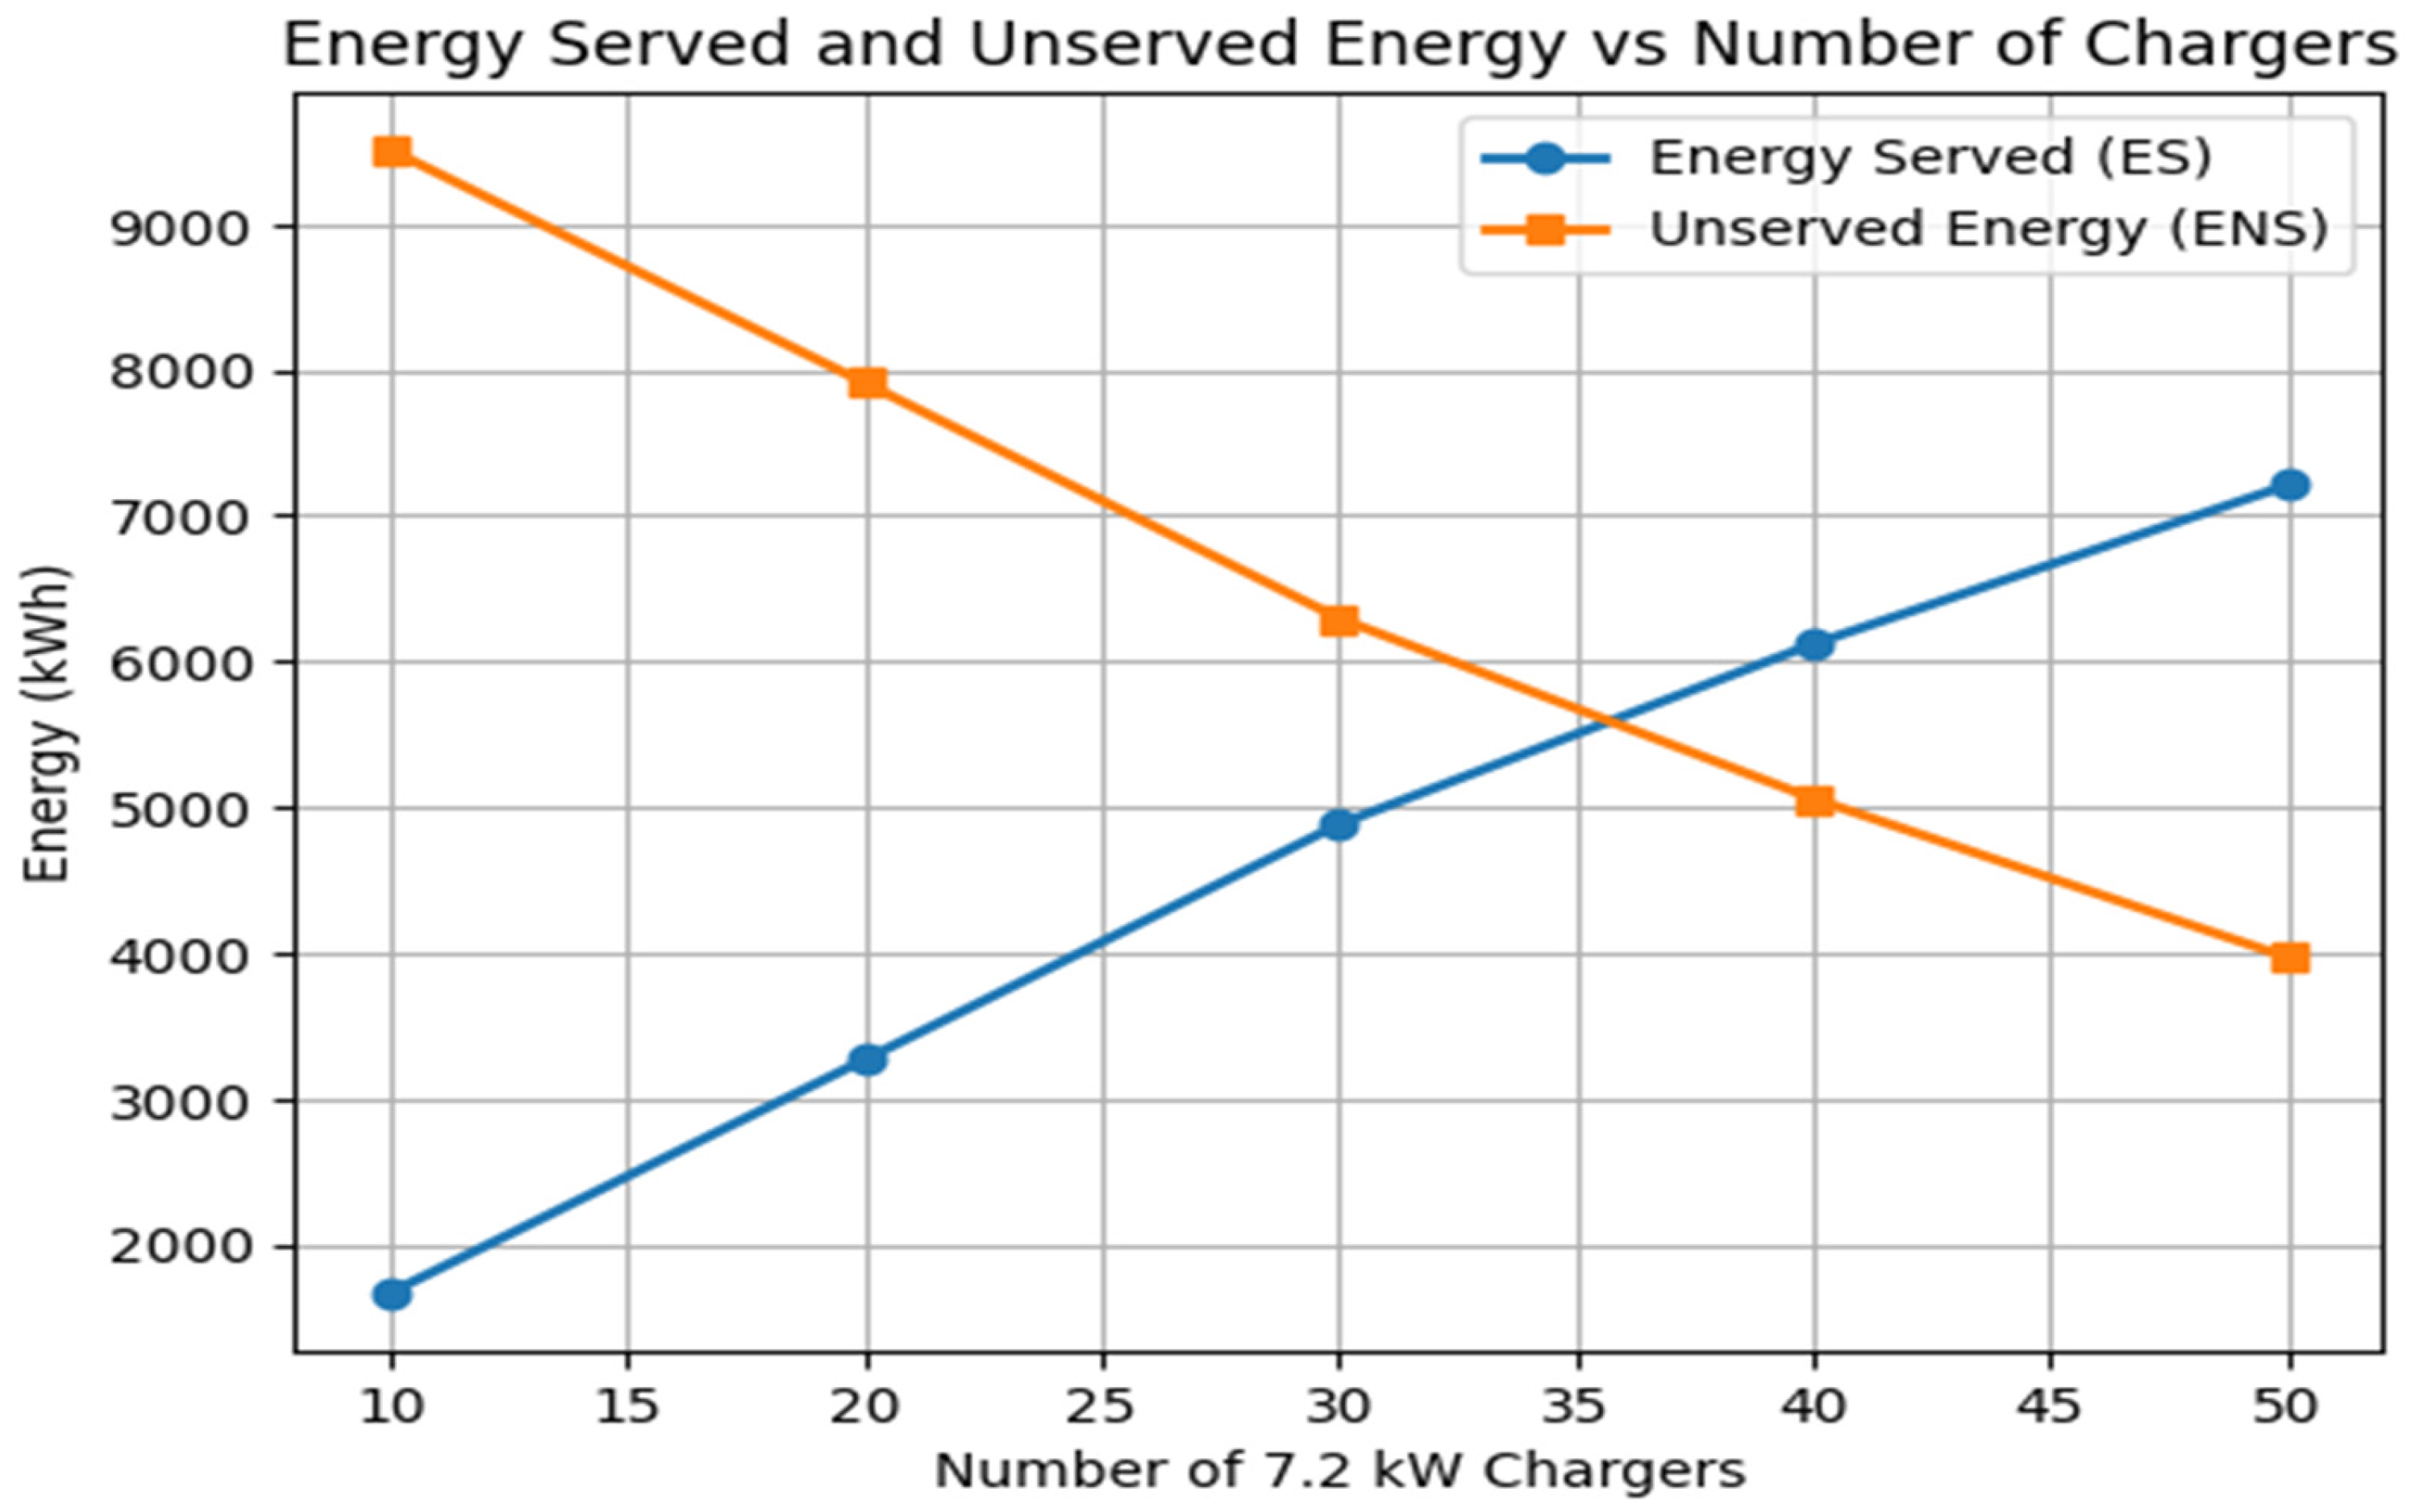
The performance of the charging system using 7.2 kW chargers is first evaluated by analyzing the balance between energy served (ES) and energy not served (ENS) across different infrastructure scenarios, as shown in
Figure 1. ENS is used as a key indicator to evaluate the adequacy of the charging infrastructure, such that ENS represents the portion of charging demand that cannot be satisfied within the available charging capacity and operational time constraints. In rental fleet operations, such unmet charging demand may translate into vehicles not reaching the required state of charge before their next scheduled rental, potentially affecting fleet readiness and service reliability. Therefore, lower ENS values indicate more reliable charging infrastructure capable of supporting the operational requirements of the rental fleet.
In the first scenario with 10 chargers, the ES was 1667 kWh, while the ENS was 9511 kWh, indicating that charging demand significantly exceeded available capacity, resulting in a high level of unserved energy. Similarly, in the fifth scenario with 50 chargers, the system achieved the highest ES at 7210 kWh and the lowest ENS at 3968 kWh, suggesting that the distribution capacity has reached a satisfactory level.
As the number of chargers increased from 10 to 50, there was a significant improvement in the amount of energy served and a consistent decrease in the amount of unserved energy. This indicates that the charging infrastructure can better meet the demand with an increasing number of chargers, enhancing the effectiveness and capacity of the network to provide service.
From an operational perspective, higher levels of unmet energy at lower charger counts indicate potential challenges in fleet readiness. When charging demand exceeds infrastructure capacity, some vehicles may not reach the required state of charge before their next rental period, potentially affecting vehicle availability and service reliability. As additional chargers are introduced, the system gains greater flexibility in allocating charging resources, which reduces the occurrence of unmet charging demand. However, the results also suggest that the marginal improvement decreases as the infrastructure capacity approaches the fleet’s charging requirements. This indicates that beyond a certain point, adding more chargers provides limited additional benefit.
These findings highlight the importance of balancing infrastructure capacity with operational demand. Adequate charger availability improves fleet readiness and charging reliability, while excessive infrastructure may lead to underutilized assets. Therefore, identifying an appropriate charger capacity is a key consideration in the planning of electrified rental fleets.
5.2. Energy Served and Not Served for Chargers 50 kW
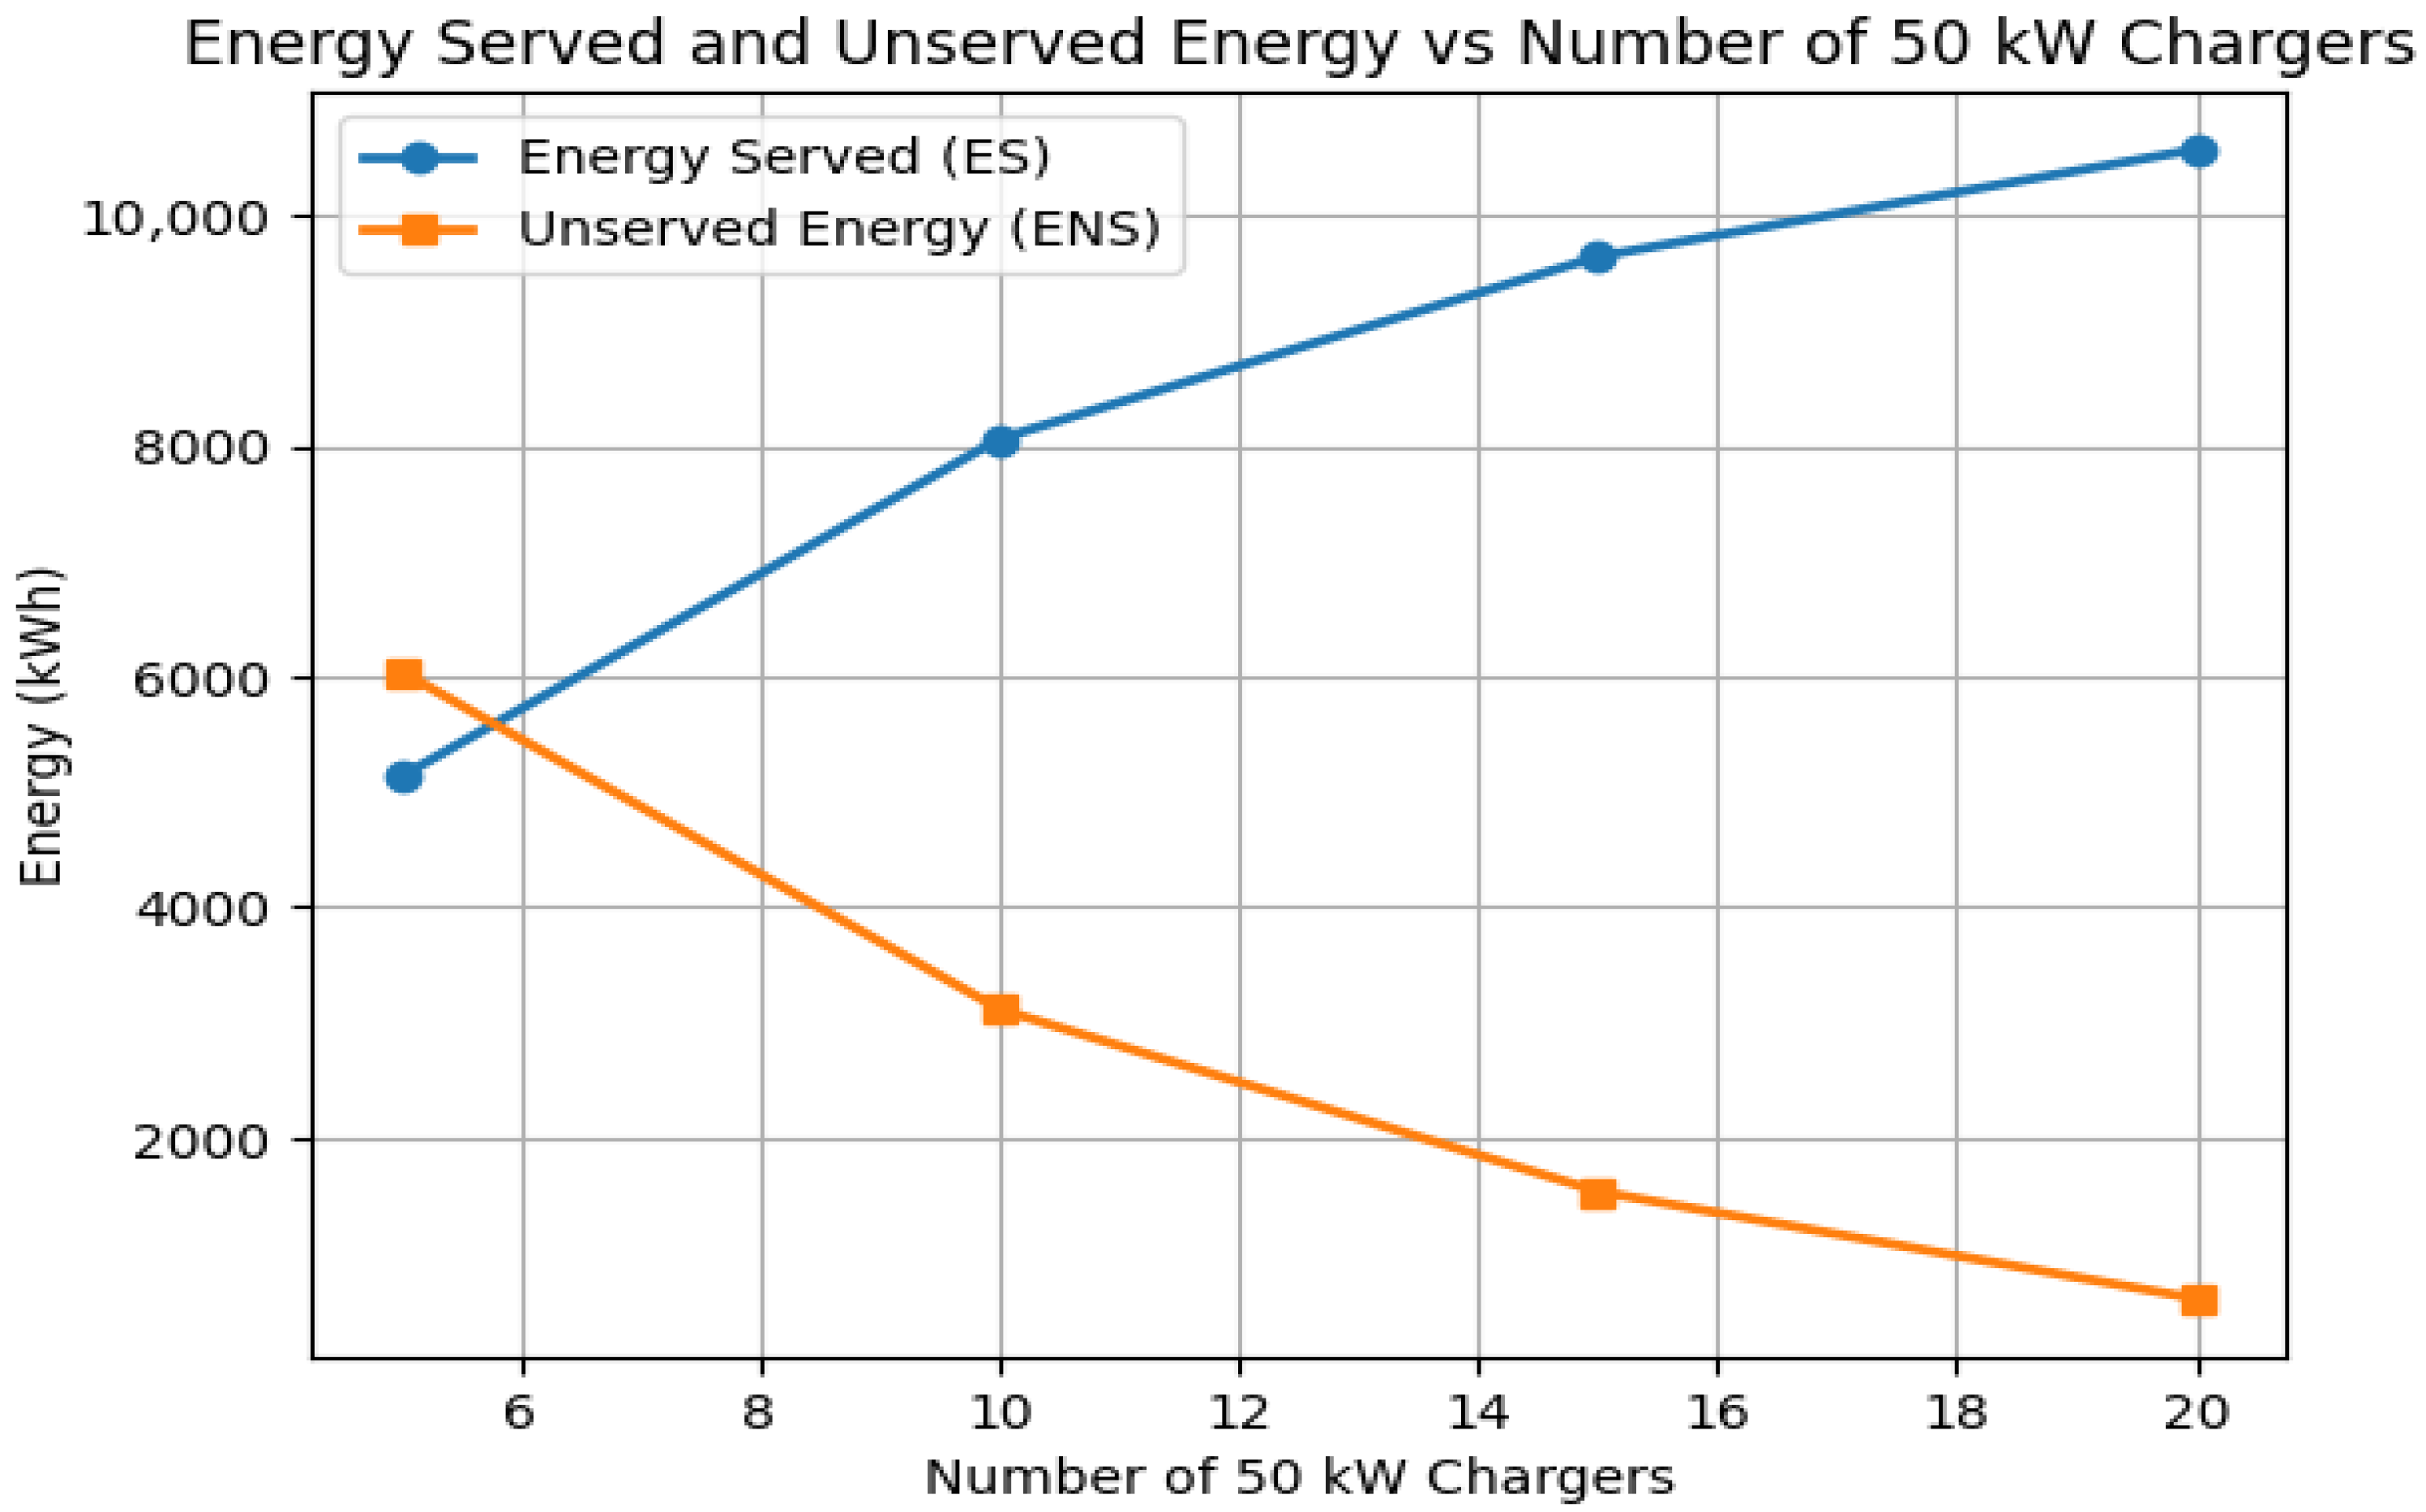
To assess the impact of higher charging power, the analysis was repeated for scenarios using 50 kW fast chargers, focusing on energy served (ES) and energy not served (ENS). As illustrated in
Figure 2, increasing the number of fast chargers significantly improves the system’s ability to satisfy the charging demand of the fleet. Compared with the Level-2 charging scenarios discussed in
Section 5.1, the higher charging power enables vehicles to reach the required state of charge within shorter time intervals, which substantially increases the amount of energy served and reduces unmet demand.
This improvement is particularly evident when the number of chargers increases from the initial scenario to higher infrastructure levels. The higher charging rate allows vehicles to complete charging cycles more quickly, thereby freeing chargers for other vehicles and improving overall charging throughput. In operational terms, this enhances fleet readiness and reduces the likelihood that vehicles remain undercharged before their next rental period.
However, similar to the trend observed in
Section 5.1, the incremental benefit decreases as additional chargers are installed. Once the charging infrastructure approaches the demand level of the fleet, further increases in charger numbers provide relatively smaller improvements in system performance. These findings suggest that fast chargers can significantly improve charging efficiency in high-turnover rental operations, but careful infrastructure planning is still required to avoid unnecessary overinvestment while ensuring reliable fleet availability.
5.3. Hourly Demand for Chargers 7.2 kW and 50 kW
Beyond total energy metrics, the temporal distribution of charging demand provides additional insight into system behavior over a 24 h period.
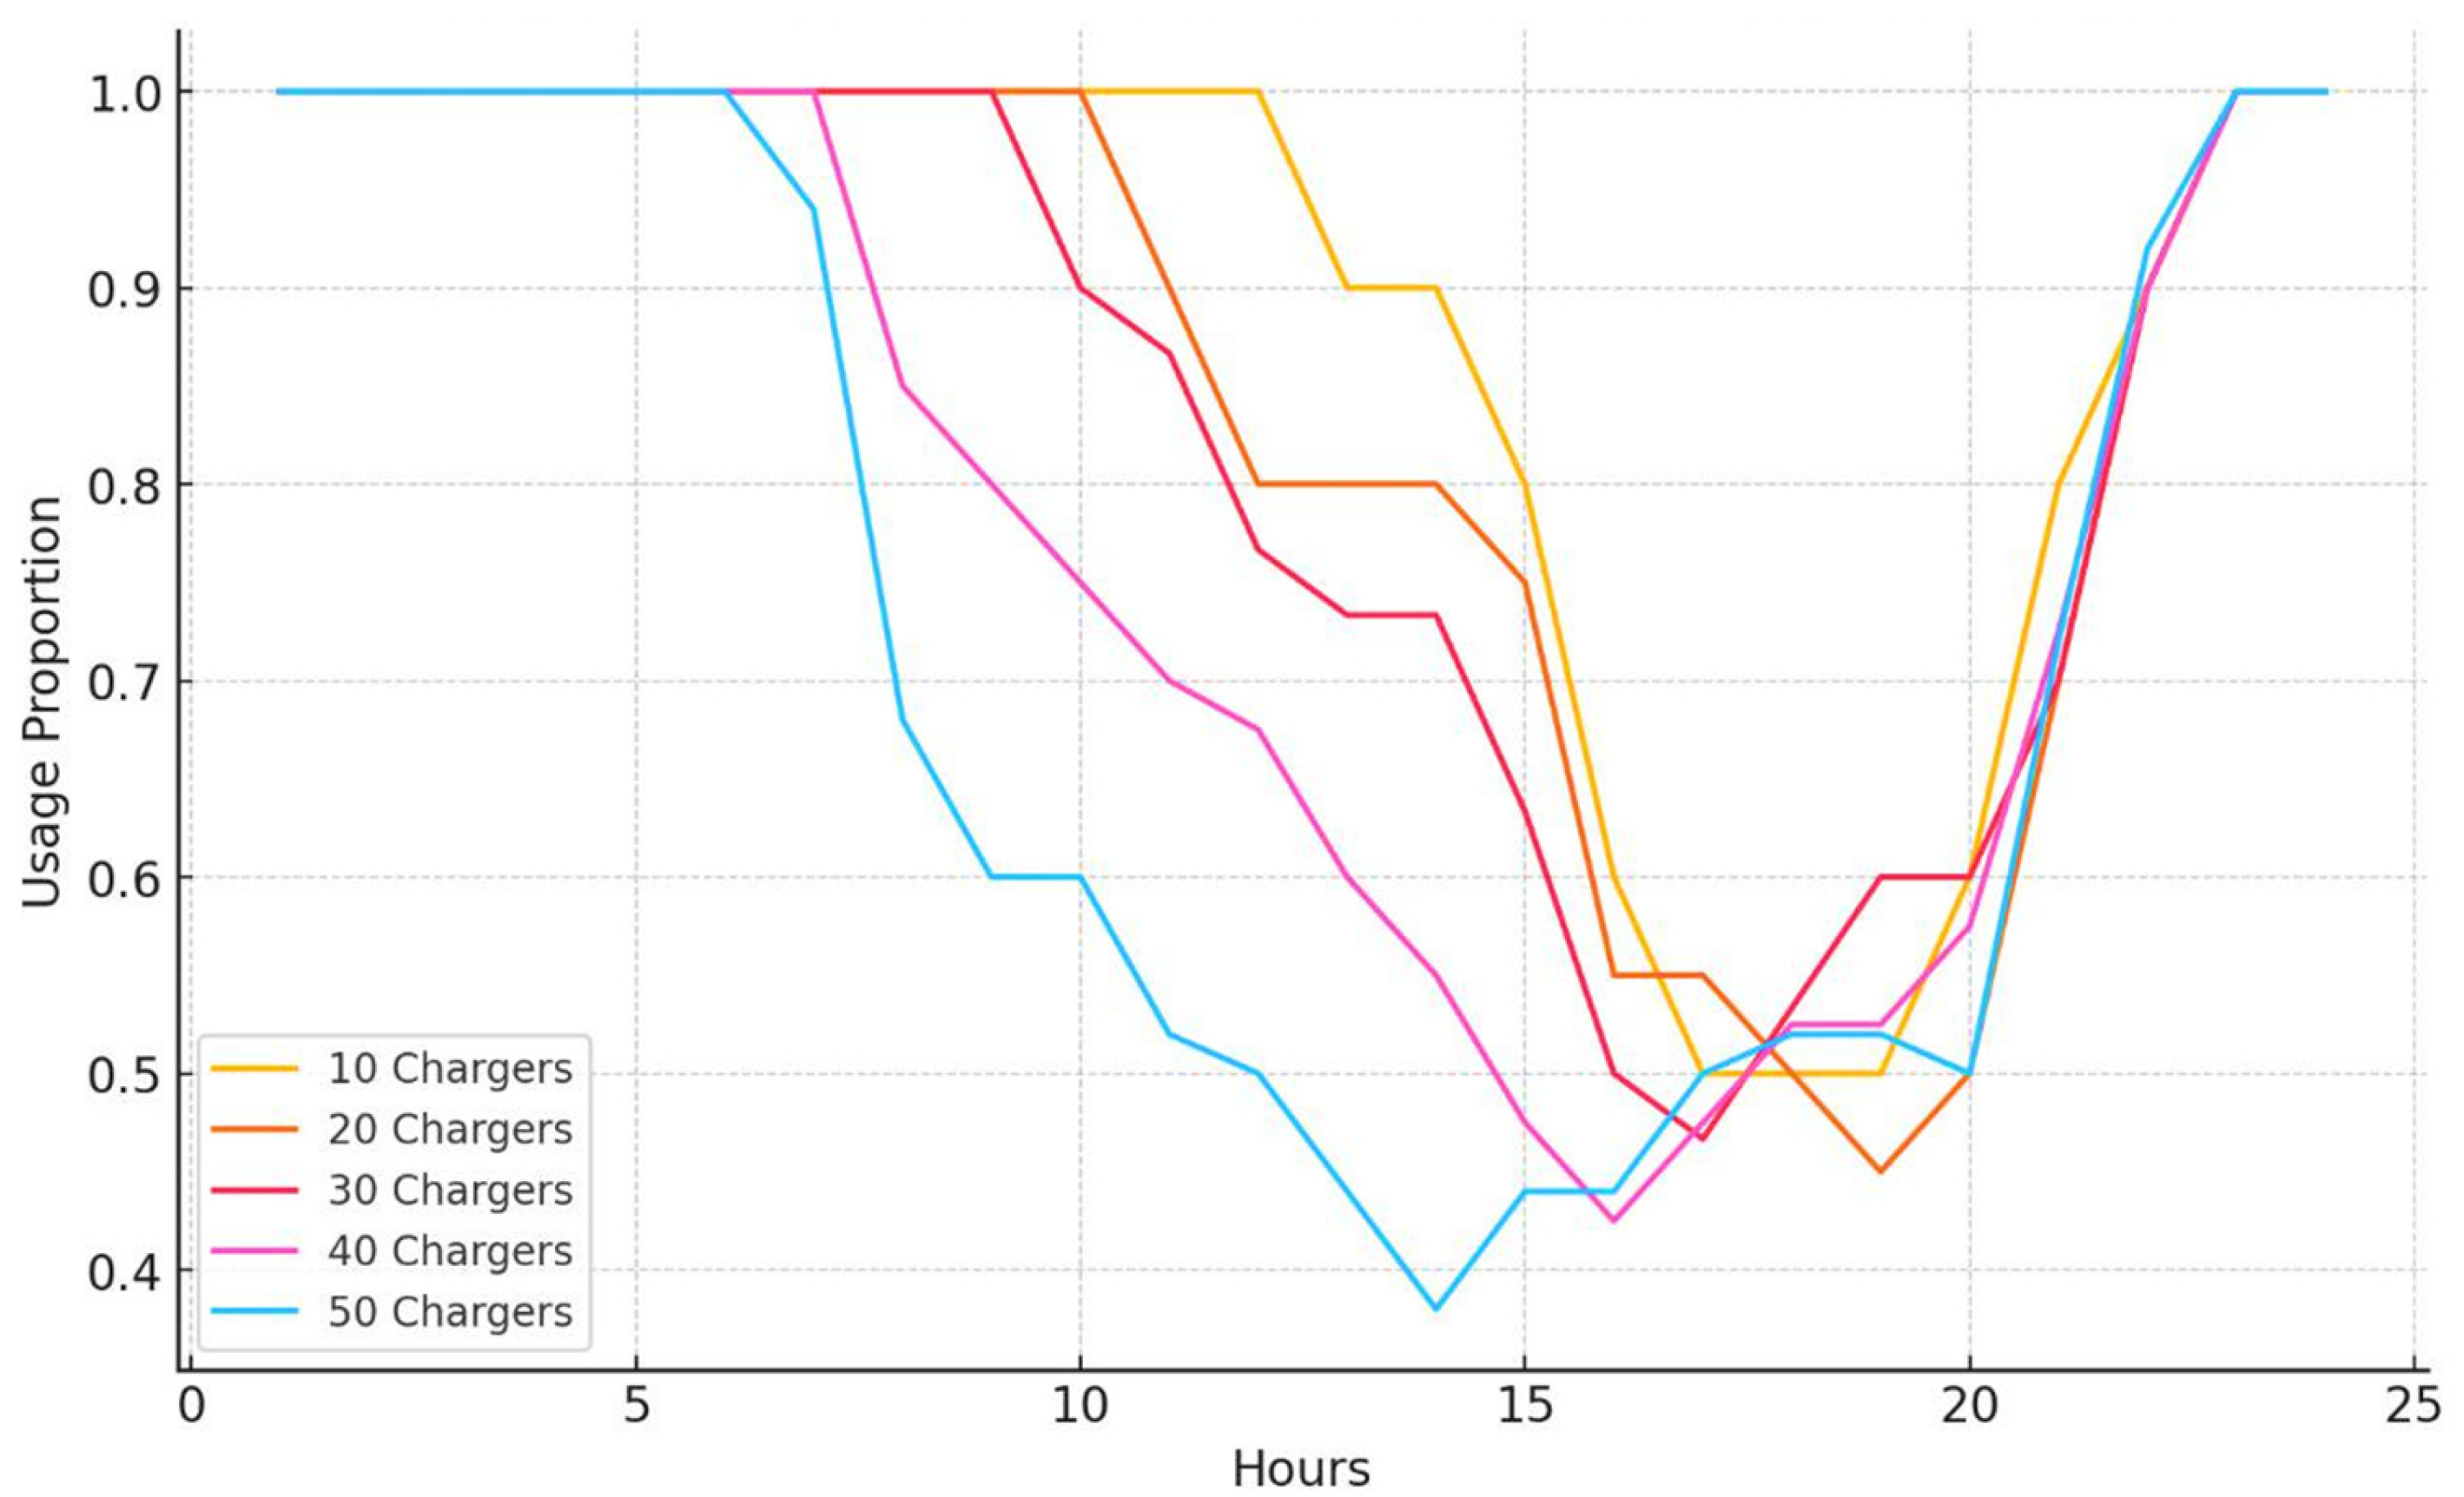
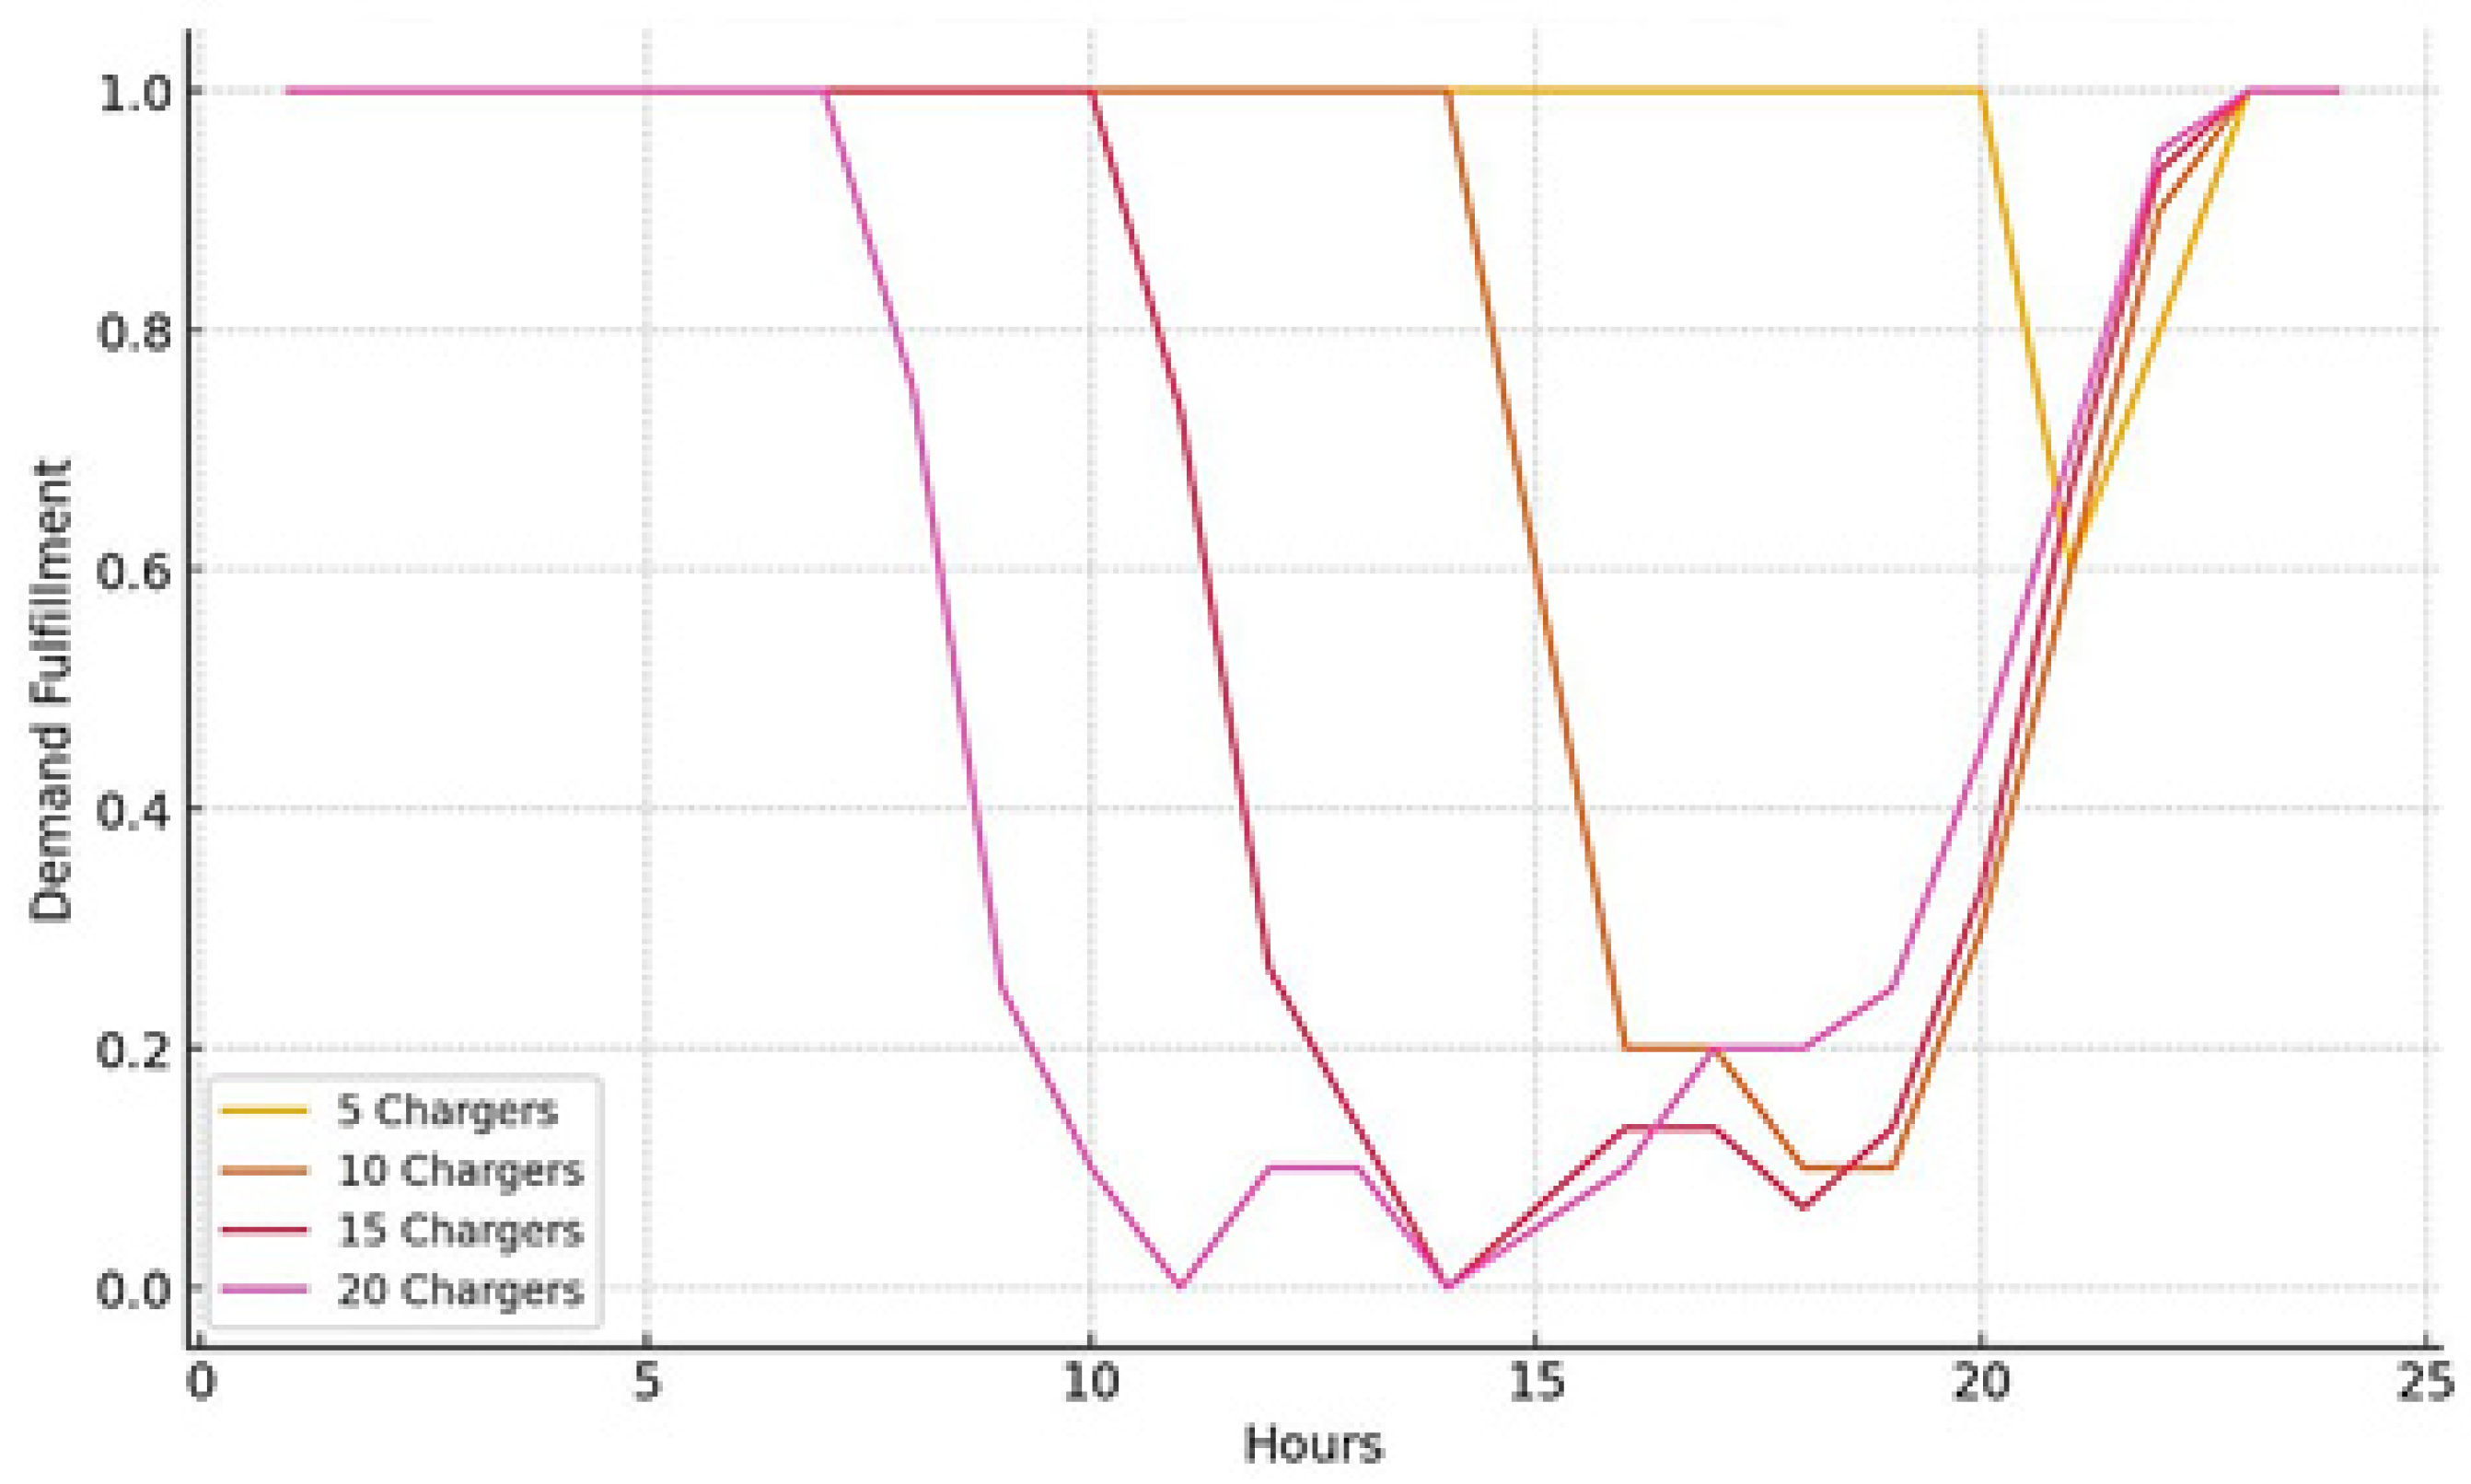
Figure 3 and
Figure 4 show hourly demand for 7.2 kW and 50 kW chargers, respectively. For the sake of clarity, it is important to note that these profiles are presented per unit, referring to the rated power that the chargers in each scenario can provide. For example, in the first scenario, ten 7.2 kW chargers can provide up to 72 kW. A value of 1.0 indicates that all chargers are in use, while a lower value indicates fewer chargers are in use. For all scenarios, high usage of all chargers is recorded, indicating full usage at 1 AM. Around midday, usage drops significantly across all scenarios, reaching a low point. Towards the end of the day, the profiles increase again, indicating higher charging demand in the evening. This behavior is somewhat correlated with the drop-off time of the EVs. With more chargers in use (40 and 50 chargers), a slightly more gradual decline is observed compared to lower numbers of chargers, indicating a better distribution of charging demand.
A comparison between the two charging levels reveals distinct demand dynamics, with 7.2 kW chargers exhibiting smoother usage patterns, while 50 kW chargers show sharper demand variations. Higher counts of chargers lead to better distribution of usage and fulfillment, underscoring the importance of sufficient charging infrastructure to meet varying demand throughout the day. In conclusion, these charts provide valuable insights into the temporal patterns of EV charger usage and demand fulfillment, emphasizing the need for strategic planning in charger deployment to optimize resource utilization and meet user demand efficiently.
5.4. Charger Utilization Analysis Across Infrastructure Scenarios
Charger utilization is examined to evaluate how effectively the charging infrastructure operates under different deployment scenarios. Charger utilization represents the proportion of time a charger is actively used during the simulation period and provides an important indicator of infrastructure efficiency and potential congestion. High utilization levels indicate heavy demand on the charging infrastructure, while lower utilization suggests greater flexibility in scheduling charging sessions.
To improve clarity while retaining the key insights from the detailed charger-level results, the utilization values across all scenarios are summarized in
Table 6, which reports the average, minimum, and maximum utilization levels observed for both Level-2 chargers (7.2 kW) and fast chargers (50 kW).
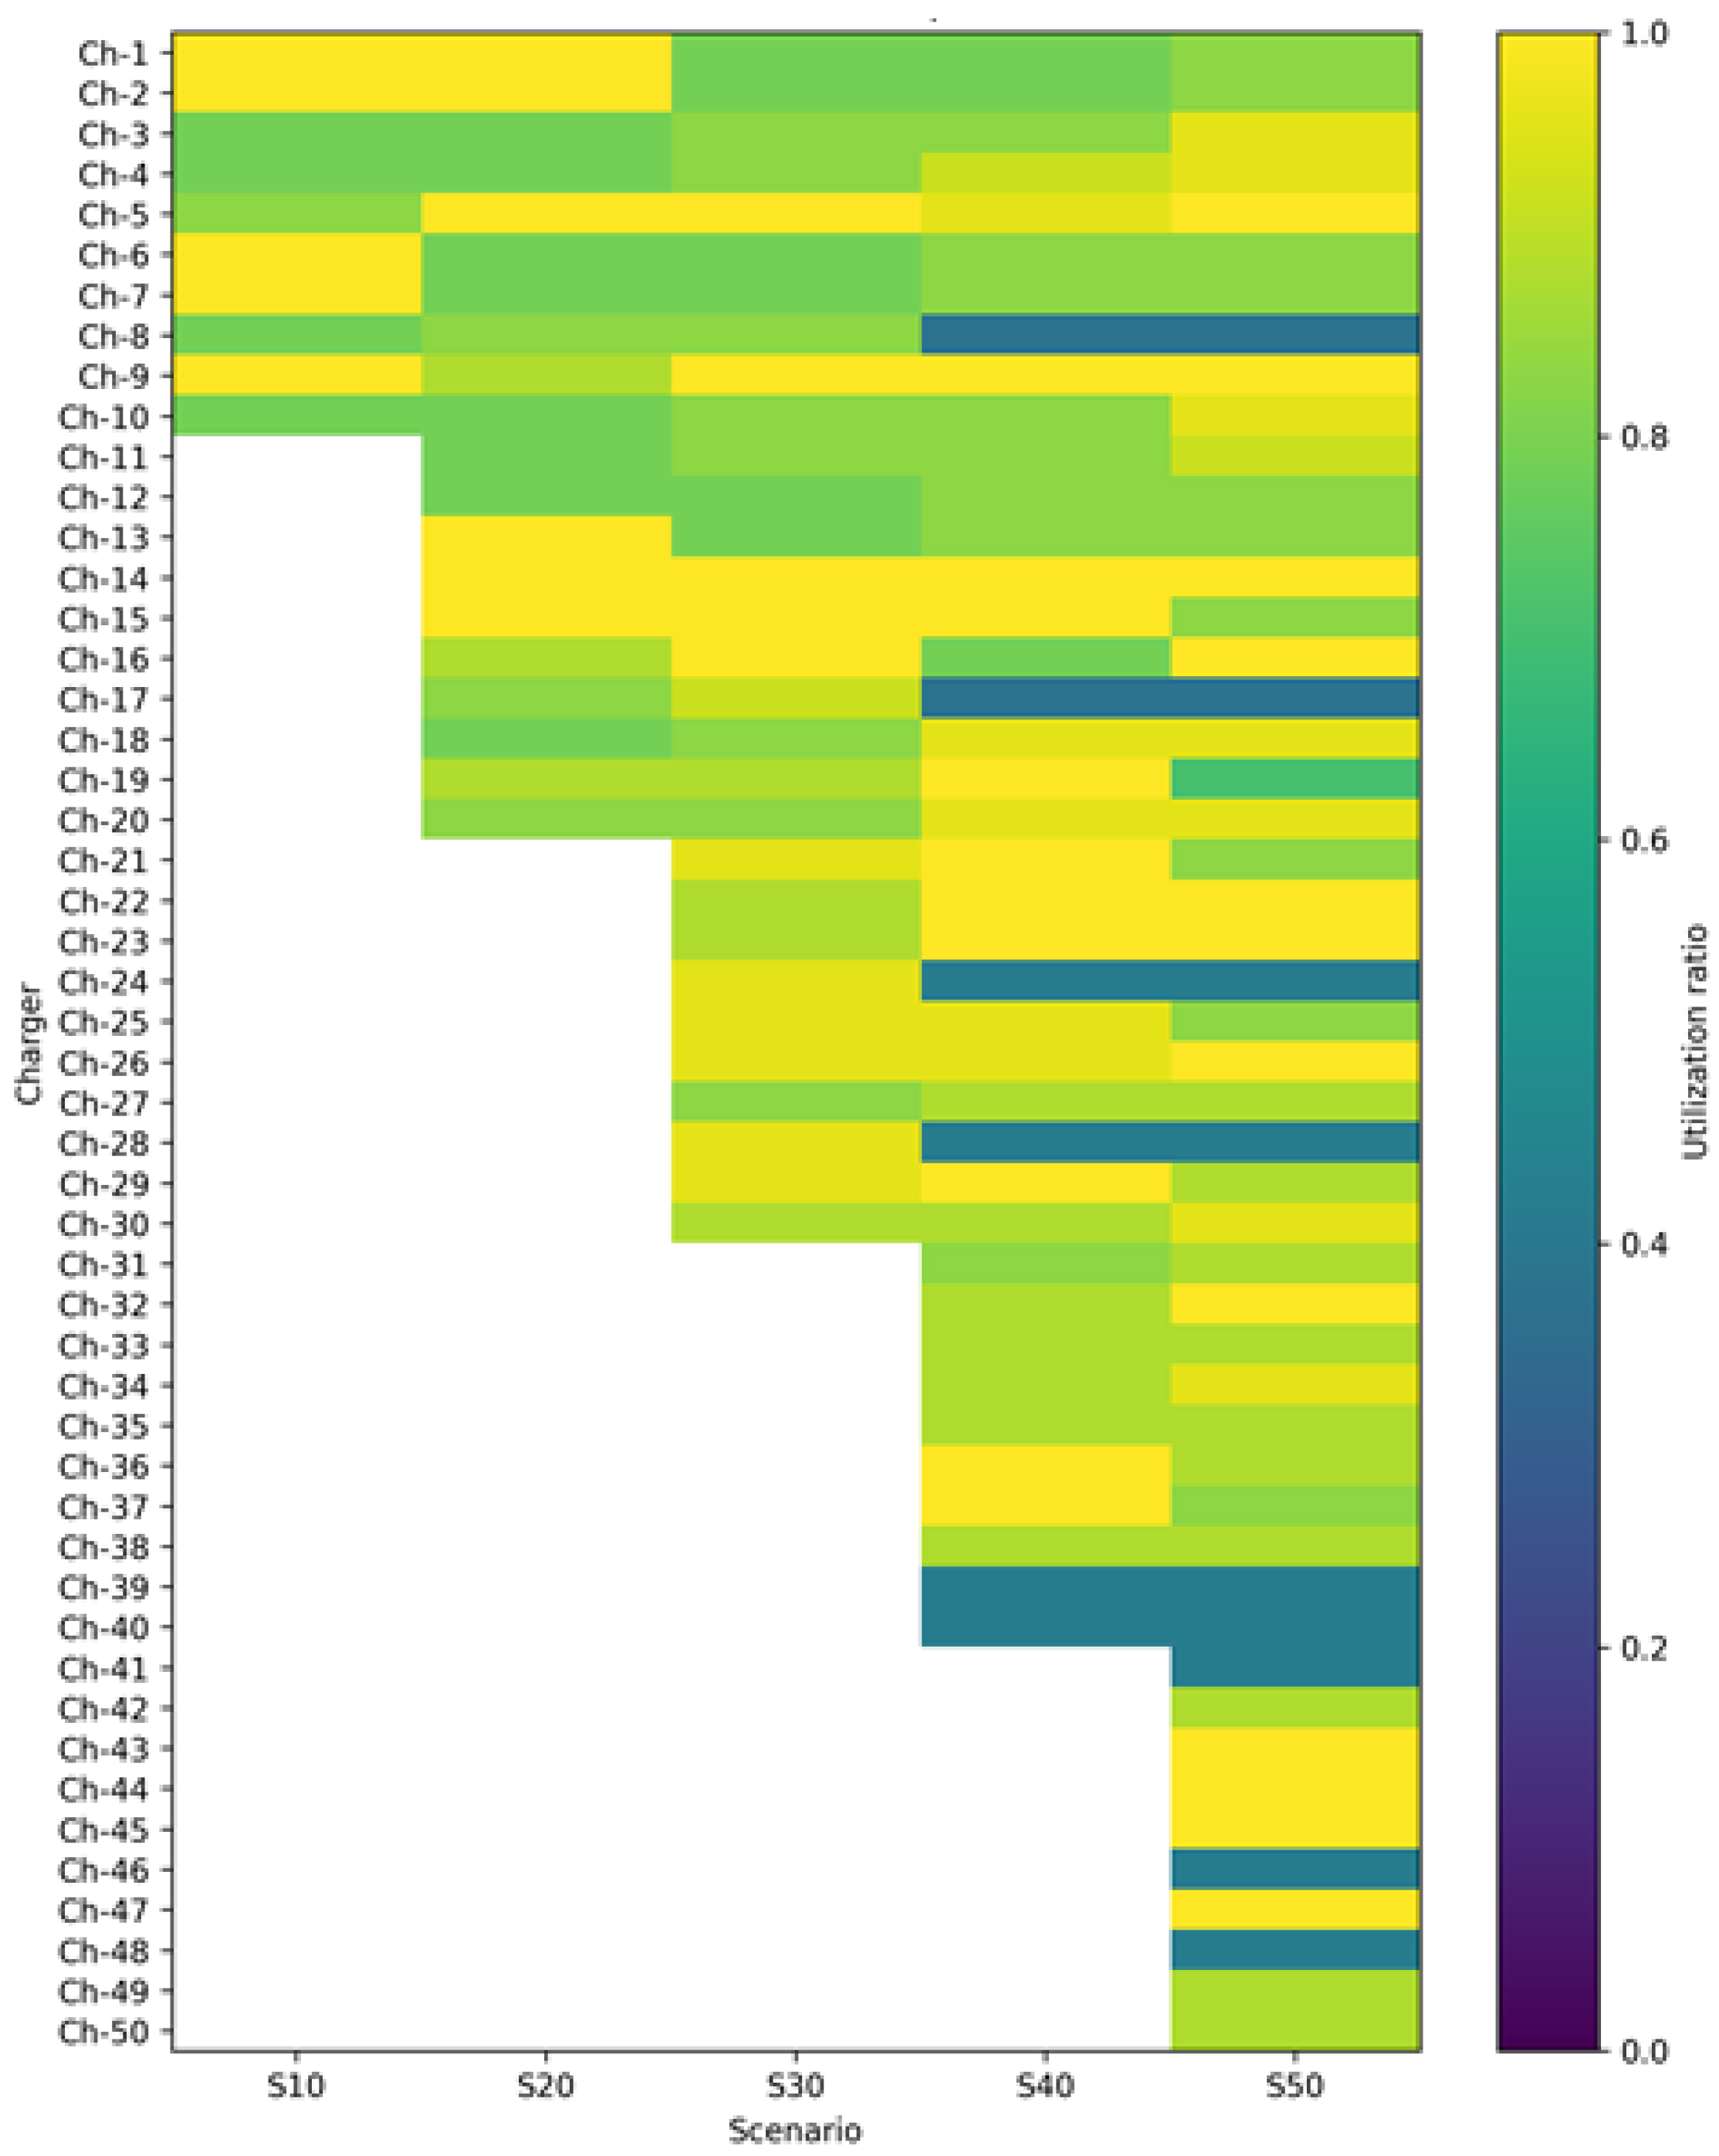
The results show that charger utilization generally decreases as the number of chargers increases. In scenarios with fewer chargers, utilization levels remain very high, indicating that the infrastructure operates close to its maximum capacity. This situation reflects strong charging demand relative to the available charging resources and may lead to congestion during peak charging periods.
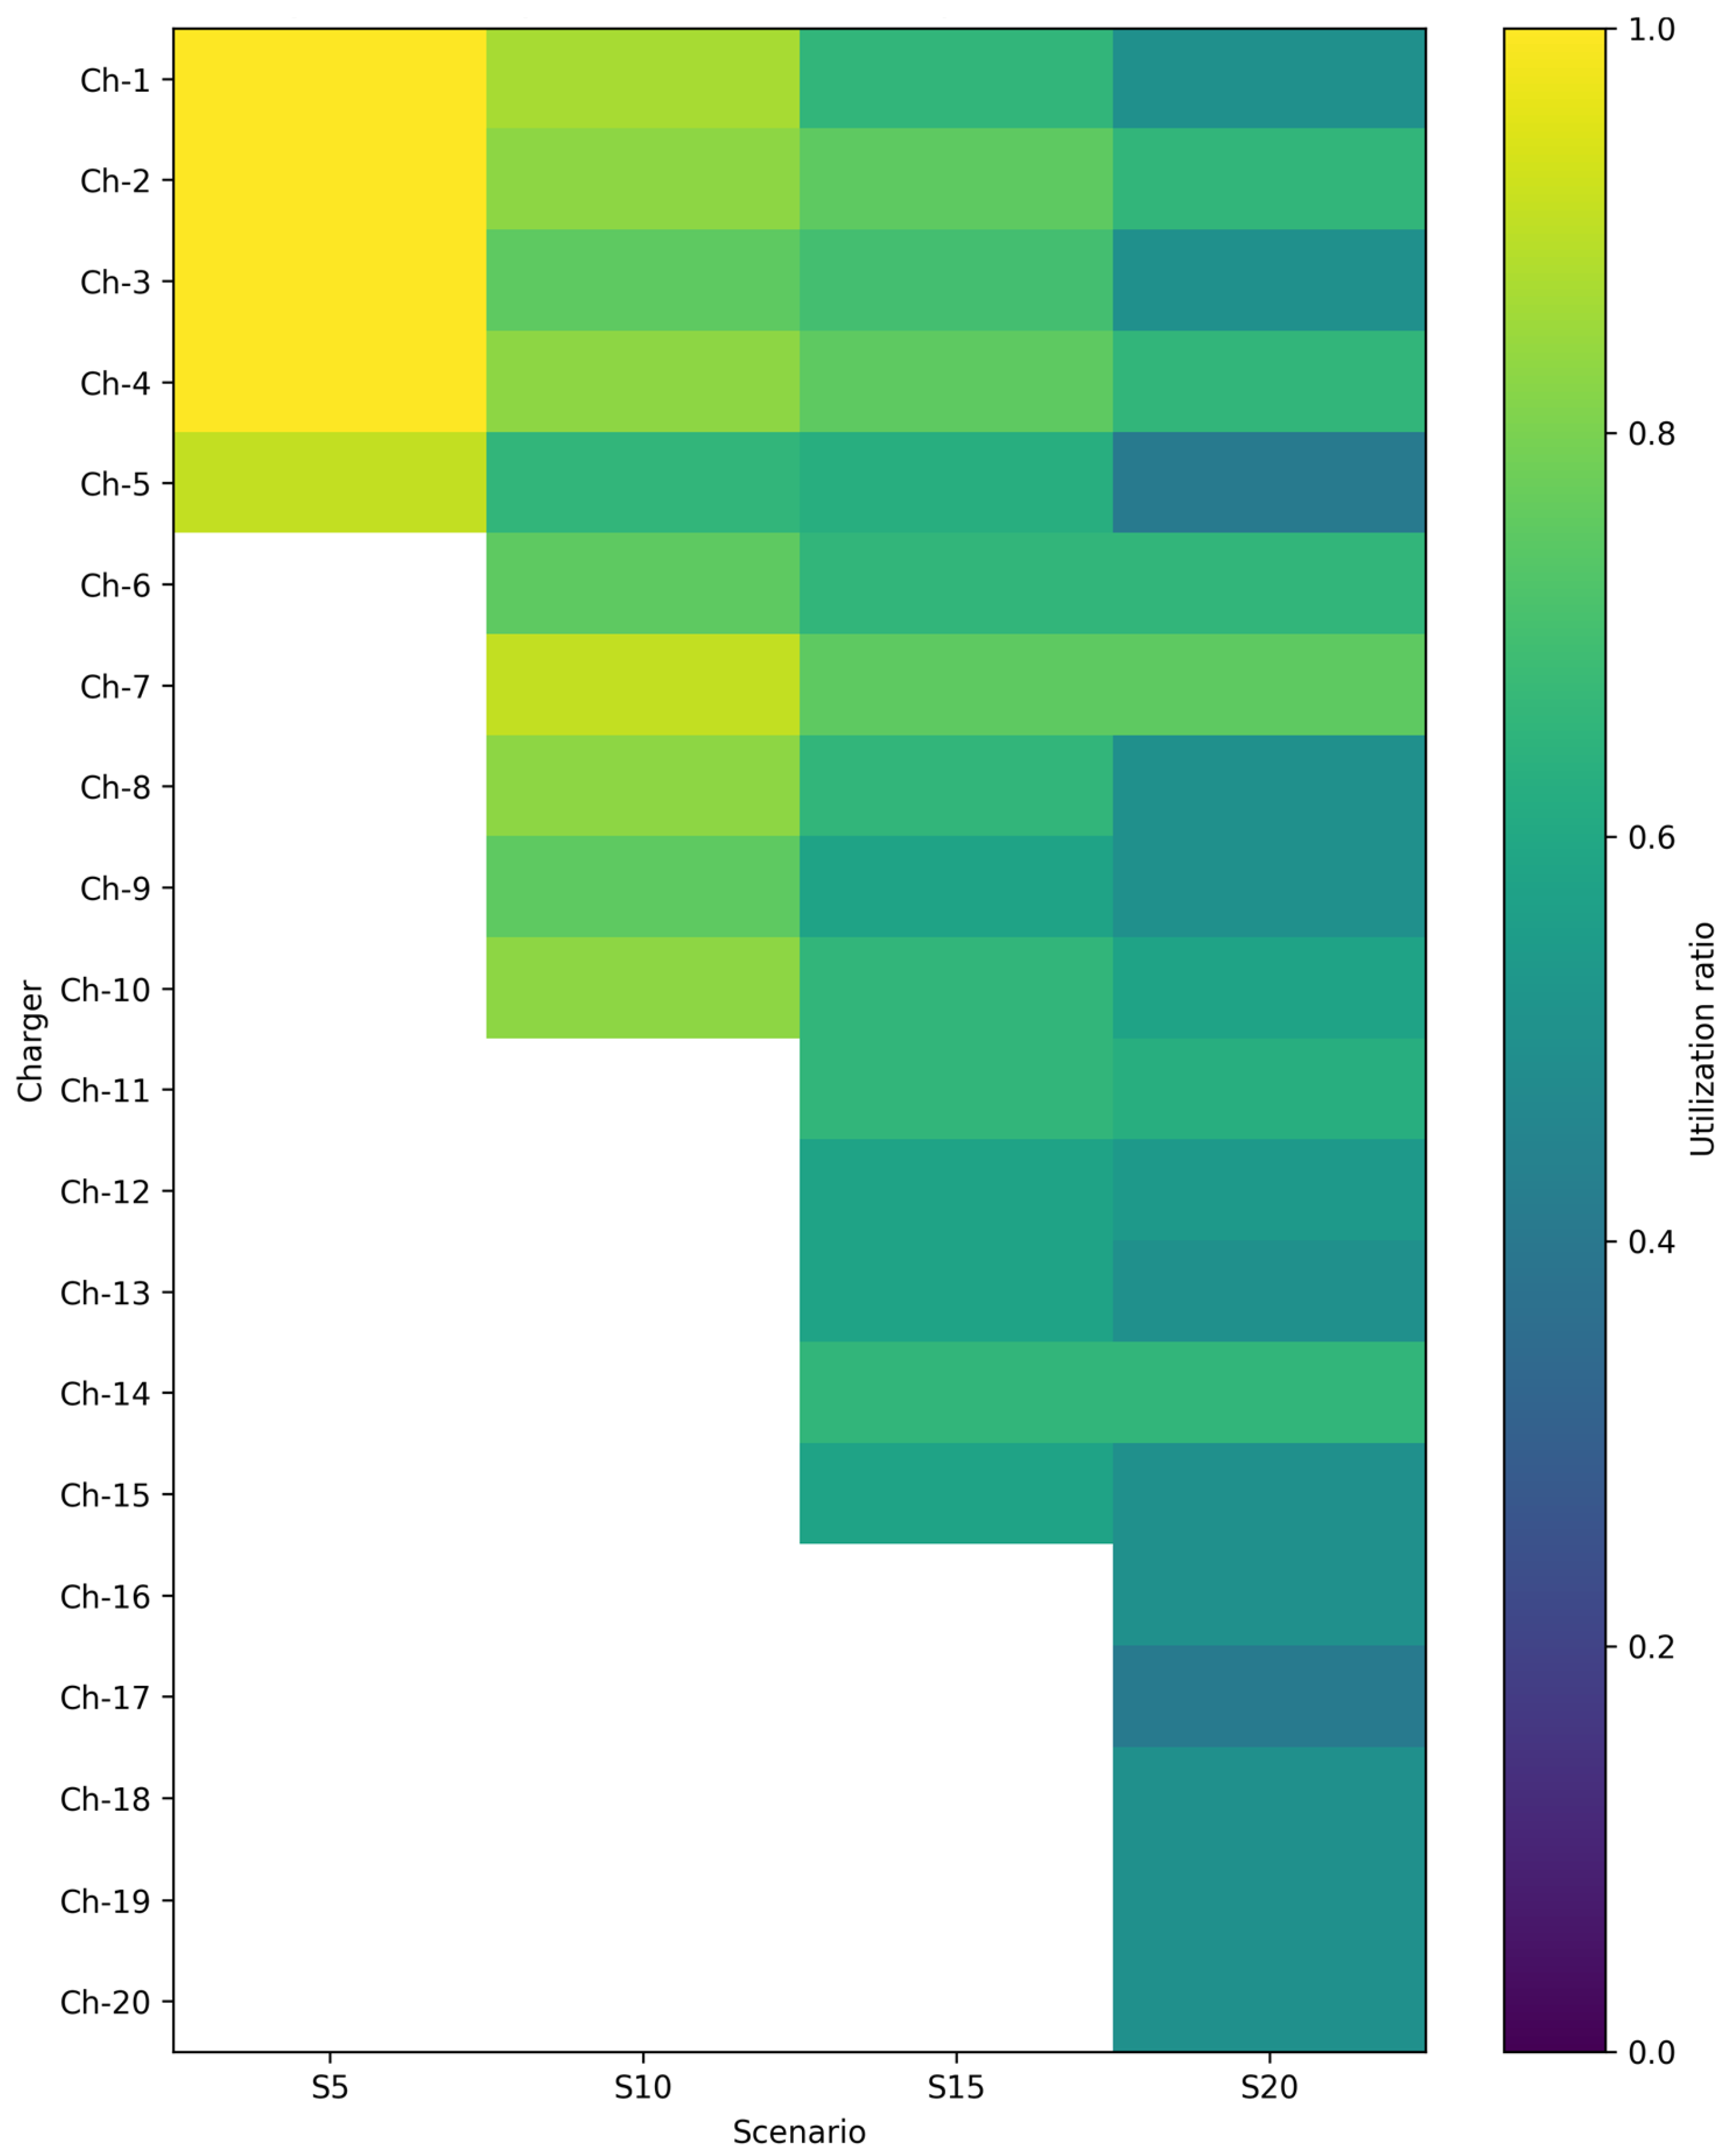
Figure 5 and
Figure 6 provide a visual representation of charger usage for the two charging technologies considered in this study.
Figure 5 illustrates the utilization patterns for Level-2 chargers (7.2 kW), where the chargers tend to operate at relatively high utilization levels across most scenarios due to the longer charging durations associated with lower charging power. Even when the number of chargers increases, the usage ratios remain relatively high because vehicles require longer charging times. In contrast,
Figure 6 shows the charger utilization patterns for fast chargers (50 kW). Due to the higher charging power, vehicles can complete charging sessions more quickly, which reduces the average utilization levels when additional chargers are installed. As the number of fast chargers increases from 5 to 20, the charging demand becomes more evenly distributed among the chargers, resulting in lower individual charger utilization and improved operational flexibility.
The simulation results provide direct support for practical infrastructure planning decisions in rental fleet electrification. Specifically, the observed trends in energy served, unserved energy, and charger utilization can be used to infer an appropriate number of chargers. While increasing the number of chargers improves the system’s ability to meet charging demand, the corresponding reduction in utilization at higher infrastructure levels indicates diminishing returns. This suggests that beyond a certain point, additional chargers contribute less to performance improvement while increasing infrastructure cost. Therefore, an appropriate charger capacity can be identified by balancing service reliability (low unserved energy) with efficient utilization, enabling informed and cost-effective infrastructure planning.
From an operational perspective, these results highlight the importance of balancing charger capacity and quantity in rental fleet charging infrastructure. Very high utilization levels may indicate efficient use of infrastructure but can also signal potential congestion and limited charging flexibility. Conversely, moderate utilization levels allow better distribution of charging demand and improve the ability of fleet operators to ensure vehicle readiness for subsequent rentals. This suggests that oversizing the charging infrastructure may lead to underutilized assets and increased capital costs without proportional operational benefits. Therefore, infrastructure sizing decisions should not be based solely on maximizing service levels, but rather on achieving an optimal balance between reliability and utilization. In this regard, demand management strategies, such as priority-based scheduling, load shifting, or controlled charging, play a critical role in improving infrastructure efficiency without requiring excessive expansion. These findings highlight that effective planning requires an integrated approach that considers both technical performance and economic implications.
6. Conclusions
This study presented a probabilistic framework for estimating EV charging demand in rental car facilities. The framework integrates empirical rental mobility data, EV technical specifications, and probabilistic modeling techniques to generate realistic charging demand scenarios. The results demonstrate that both charger power level and charger quantity play a critical role in determining system performance. Increasing the number of chargers significantly improves the amount of energy served while reducing unmet charging demand. However, the results also reveal diminishing returns as infrastructure capacity approaches fleet demand, highlighting the importance of balanced infrastructure planning. The analysis of charger utilization further shows that Level-2 chargers tend to operate at higher utilization due to longer charging durations, while fast chargers provide greater operational flexibility by reducing charging time and distributing demand more effectively across the available infrastructure. By incorporating empirical mobility data and probabilistic modeling, the proposed framework provides a practical planning tool for rental fleet electrification. The results can support infrastructure planners, fleet operators, and policymakers in evaluating charging infrastructure requirements, improving fleet readiness, and optimizing charger deployment strategies for rental car facilities.
Although the proposed framework captures the stochastic behavior of rental fleet operation, several extensions can further enhance its applicability. Future work may include the integration of distribution grid constraints, such as transformer capacity and feeder limits, and the incorporation of economic considerations, including charger installation costs and grid upgrade requirements. In addition, further studies could explore the sensitivity of planning outcomes to different probabilistic models in order to better understand the impact of distribution selection on charging demand estimation. Direct validation using real EV charging session data was not feasible due to the current lack of such datasets for rental fleet operations. With the anticipated expansion of electrified rental fleets, future research will enable validation of the proposed framework using real-world charging data. While factors such as driving behavior, road conditions, and environmental influences can affect EV energy consumption, these effects are not explicitly modeled in this framework. The inclusion of such detailed factors represents an important extension for future work.