Article

Evolution of High-Voltage Frequency-Domain Dielectric Spectroscopy Characteristics of Oil-Pressboard Insulating Bushings Under Aging and Moisture

1
State Grid Jibei Electric Power Research Institute, Beijing 100045, China
2
State Key Laboratory of Alternate Electrical Power System with Renewable Energy Sources, North China Electric Power University, Beijing 102206, China
3
State Grid Jibei Electric Power Co., Ltd., Beijing 100054, China
*
Author to whom correspondence should be addressed.
Processes 2026, 14(5), 864; https://doi.org/10.3390/pr14050864
Submission received: 12 February 2026 / Revised: 28 February 2026 / Accepted: 5 March 2026 / Published: 8 March 2026
(This article belongs to the Section Petroleum and Low-Carbon Energy Process Engineering)

Abstract

The insulation condition of oil-pressboard insulating bushings is commonly evaluated by measuring the dielectric loss factor and capacitance at power frequency. However, systematic investigations into the influence of aging and moisture defects on frequency-domain dielectric spectroscopy (FDS) characteristics are still insufficient. To address this issue, a 10 kV high-voltage FDS measurement system was independently developed. The system has an output voltage range of 0~10 kV and a test frequency band of 1 mHz~10 Hz, with excellent measurement stability and high test accuracy. The standard deviation of dielectric loss of the system is on the order of 10−4 and the relative error is less than 5%. It also features reliable weak current detection capability and thermal stability. Based on this system, the dielectric spectral characteristics of oil-pressboard insulation models with different moisture contents and aging levels were investigated under various temperatures and applied voltages. The results indicate that the dielectric spectrum shifts toward higher frequencies with increasing temperature. Moreover, the low-frequency dielectric loss of degraded insulation increases linearly with the applied voltage, and the rate of increase shows a positive correlation with both moisture content and aging duration. As insulation degradation becomes more severe, the voltage-dependent characteristic frequency moves toward higher frequencies. This frequency refers to the characteristic frequency where the dielectric loss of insulation presents an obvious linear variation with the change of applied voltage. Unaged and dry bushings exhibit only weak voltage dependence at 0.01 Hz, whereas bushings aged for 28 days with a moisture content of 4.121% demonstrate pronounced voltage dependence at 10 Hz. These results provide a valuable technical basis for diagnosing coupled aging and moisture defects in oil-pressboard insulated bushings.

1. Introduction

Power transformers, as key equipment in power plants and substations, are core devices of high value and high reliability requirements in the power system. High-voltage bushings, as an important component of the power transformer lead-out line system, have a significant impact on the stable operation of the transformer and the power system in terms of their safety and reliability in operation. At present, among the types of bushings widely used in electrical engineering, oil-pressboard insulated bushings account for approximately 93% and are mainly applied in voltage levels of 110 kV and above. However, due to the bushing being exposed to complex operating conditions such as high voltage, large current, and high temperature for a long time, its insulation is prone to aging and moisture deterioration. Transformer accidents caused by bushing faults still occur from time to time, and its operating condition is directly related to the safe and stable operation of substations and power systems.
With the development of dielectric response technology, frequency-domain dielectric spectroscopy has gradually attracted extensive attention from scholars at home and abroad and achieved a series of research results due to its advantages such as carrying rich insulation state information, high sensitivity to moisture and aging, and potential for online monitoring. As early as the 20th century, researchers conducted dielectric spectrum tests on laboratory-made insulating samples and explored methods for evaluating the insulation state of transformers by analyzing frequency-domain dielectric spectrum curves and changes in dielectric relaxation characteristics [1,2]. In recent years, scholars have conducted in-depth research on the characteristic parameters and their evolution patterns in the frequency-domain dielectric spectrum curve, focusing on multiple influencing factors such as water content and temperature. Dong Ming et al. systematically analyzed the influence of moisture on the dielectric spectral characteristics of oil-pressboard insulation in the frequency domain, and pointed out that the real part of the dielectric constant increases with the increase of moisture content in the low-frequency range, the imaginary part of the curve rises as a whole in the entire frequency band, and the “bulge” feature in the mid and high frequency regions gradually weakens and disappears. They found that moisture in oil-pressboard insulation causes a significant increase in low-frequency dielectric loss and shifts the characteristic frequency to higher values [3,4]. I. Fofana et al. studied the frequency-domain dielectric spectrum characteristics of oil-pressboard capacitive bushings in the 1 mHz to 1 kHz band under different water contents and different temperatures and found that the frequency-domain dielectric spectrum below 1 Hz was most sensitive to the damp state of the bushings. They reported that elevated temperatures accelerate the polarization process, leading to a frequency shift of the dielectric loss peak [5]. Liao et al. studied the effect of measurement temperature on the aging characterization of oil-pressboard insulation. The results showed that as the measurement temperature increased, the frequency-domain dielectric spectrum curve of the aged oil-impregnated paperboard shifted as a whole in the low-frequency region toward higher values and proposed a translation factor based on the frequency–temperature relationship to achieve the equivalent conversion of the dielectric spectrum curve at different test temperatures. They further demonstrated that both moisture and aging contribute to this frequency shift, with moisture having a more pronounced effect in the mid-frequency band [6].
In summary, the existing research has revealed the variation patterns of the frequency-domain dielectric spectral characteristics of oil-pressboard insulation samples under different moisture and aging conditions and verified the feasibility of dielectric properties as a key indicator for diagnosing insulation state. However, most current studies are still based on simplified samples such as oil-impregnated paperboard or equivalent models. Due to the special internal structure of the sheath—a capacitive structure with insulation wound in multiple layers and multiple layers of aluminum foil inside, which is characterized by high layering, slender geometry, and a large number of metal foil layers, its electric field distribution characteristics, polarization process, and equivalent dielectric response mechanism are significantly different from those of traditional oil-impregnated paperboard samples. The latter is difficult to accurately reflect the dielectric spectral response characteristics of the actual sheath structure [7,8]. In addition, existing studies have mostly focused on the influence of a single factor, while the variation pattern of the dielectric spectrum in the frequency domain of high-voltage bushings under the coupling of multiple factors remains to be systematically clarified.
Against the shortcomings of existing research that mostly relies on simplified oil-impregnated paperboard samples and only focuses on the influence of single factors on the dielectric properties of insulation, this paper conducts an in-depth study based on the actual structural characteristics of oil-pressboard insulating bushings, aiming to reveal the evolution law of their frequency-domain dielectric spectroscopy characteristics under the coupling of aging and moisture defects, so as to provide a more accurate technical basis for the insulation defect diagnosis of bushings in engineering practice. This study is carried out based on a self-developed 10 kV high-voltage frequency-domain dielectric spectroscopy measurement system, breaking through the limitations of traditional research in sample selection and analysis dimensions by incorporating the coupling effects of multiple factors including moisture, aging, temperature and applied voltage into the research framework. In the specific research process, we first complete the development and performance verification of the high-voltage frequency-domain dielectric spectroscopy measurement system, then fabricate a 26 kV oil-pressboard insulating bushing test model and simulate moisture and aging defects of different degrees, and finally conduct systematic frequency-domain dielectric spectroscopy tests to analyze the evolution law of the bushing’s dielectric characteristics under different test conditions. All the above tests are carried out within a specific scope, including the frequency range of 0.001~10 Hz, the temperature range of 25~85 °C and the applied voltage range of 200 V~10 kV.
The structure of this paper is as follows: Section 2 introduces the development and performance verification of the 10 kV high-voltage FDS measurement system; Section 3 describes the fabrication of the bushing test model and the simulation method of aging and moisture defects; Section 4 analyzes the FDS characteristics of the bushing under single and coupled factors in detail; Section 5 summarizes the full text and puts forward the research limitations and future work directions. To study the influence laws of key operating and testing parameters such as moisture exposure, aging status, test temperature, and excitation voltage on the dielectric spectrum characteristics of oil-pressboard insulated bushings, thus providing theoretical basis and experimental support for defect diagnosis and condition assessment of high-voltage frequency-domain dielectric spectra of oil-pressboard insulating bushings [9,10].

2. Development of High-Voltage Frequency-Domain Dielectric Spectroscopy Apparatus

2.1. Theoretical Foundations of Frequency-Domain Dielectric Spectroscopy

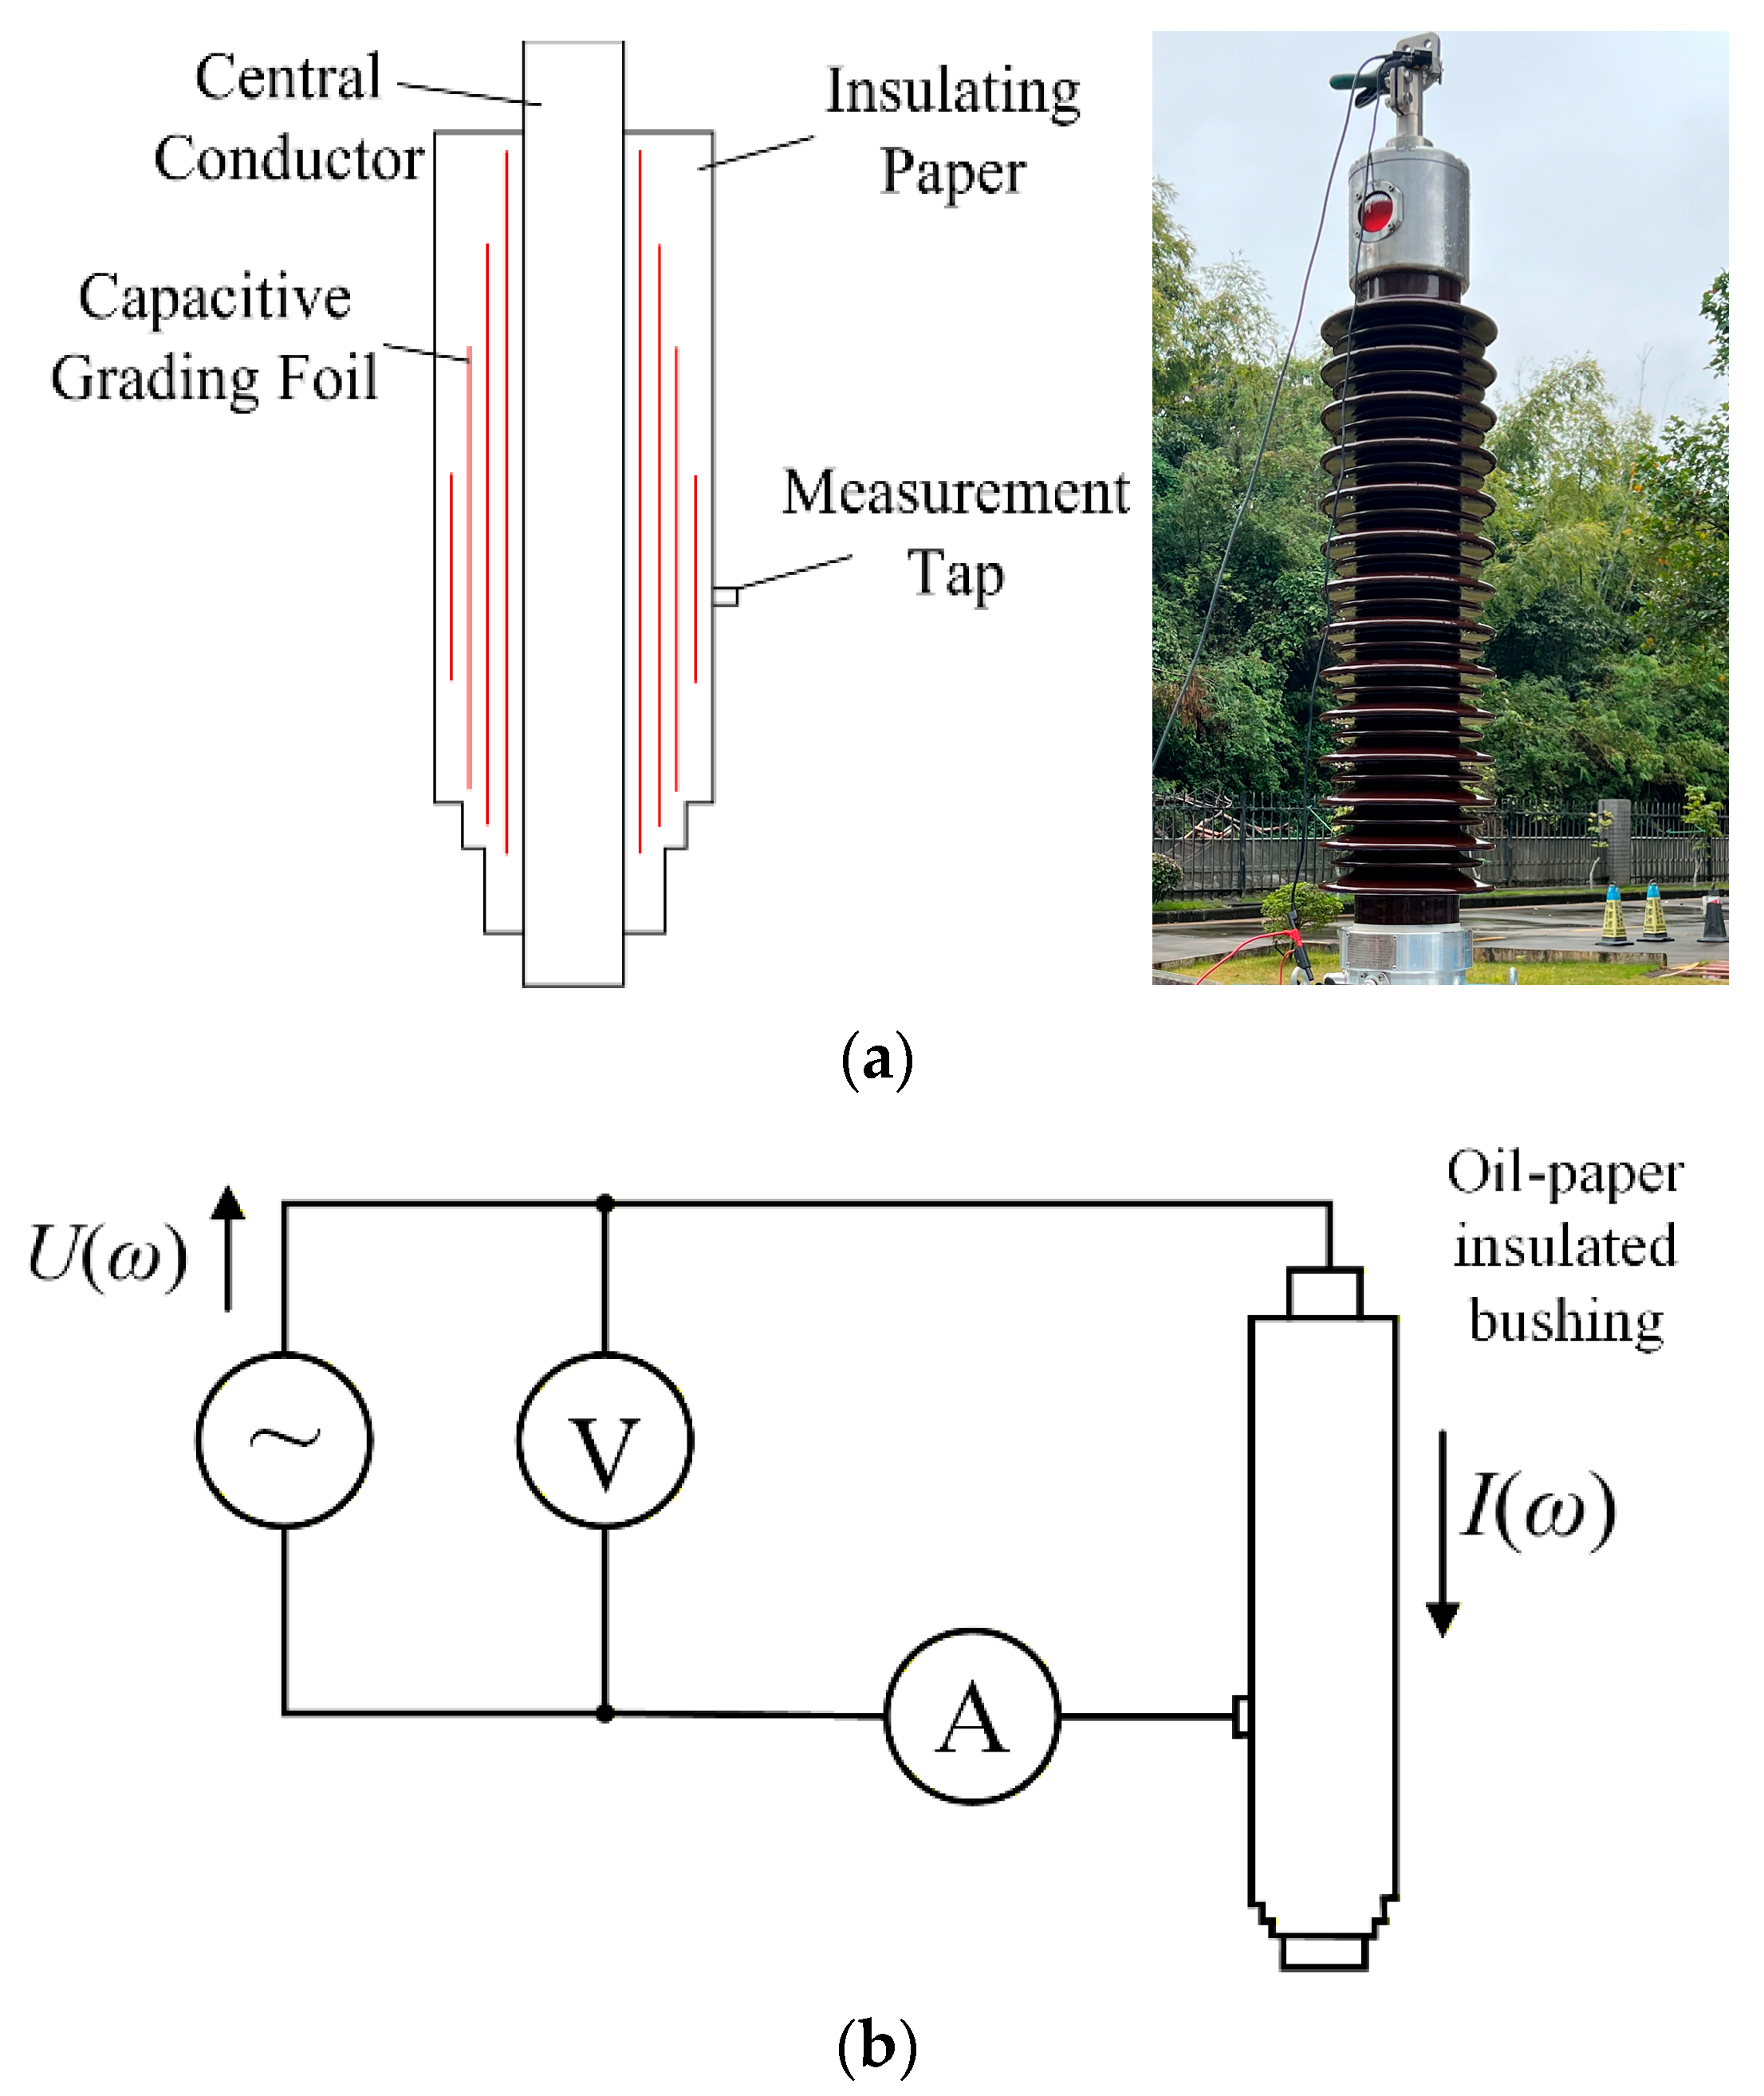
In frequency-domain dielectric response testing, alternating electric fields of different frequencies are applied to the medium under test. By taking advantage of the polarization and conductivity of the medium under alternating voltage, dielectric parameters such as dielectric loss factor and complex capacitance at different frequencies can be obtained by measuring the phase difference between the voltage across the medium and the current flowing through it. The relationships of dielectric loss factor and complex capacitance with frequency are respectively represented as tanδ-f curves and C*-f curves, and these curves are collectively referred to as frequency-domain dielectric spectrum curves. Oil-pressboard insulation, as an important composite insulating medium widely used in power equipment, has dielectric properties that directly reflect the insulation health of the equipment [11,12]. The main insulation structure of the oil-pressboard insulating bushing is shown in Figure 1a, which consists of a central conductive rod, multiple layers of insulating paper and built-in aluminum foil plates, in which a typical capacitive structure is formed between the conductive rod and each layer of aluminum foil plates. The outermost aluminum foil plates of the core serve as the end screen and lead out the measurement terminals for measuring dielectric parameters such as the dielectric loss factor and capacitance of the bushing [13]. The measurement principle of the frequency-domain dielectric spectrum is shown in Figure 1b.
When a sinusoidal voltage U(ω) is applied between the conductive rod and the final screen, the response current I(ω) is
I * ( ω ) = j ω C * ( ω ) U * ( ω )
The complex capacitance constant C* is obtained
C * ( ω ) = C ( ω ) j C ( ω ) = C 0 ε r ( ω ) j ε r ( ω ) + σ 0 / ε 0 ω
The dielectric loss tangent can be expressed as
tan δ = C ( ω ) / C ( ω )
From the above formula, it can be seen that the dielectric constant has the same meaning as the complex capacitance, where the real part C′ represents the strength of the dielectric polarization, and the imaginary part C″ represents the dielectric conductance and the loss caused by slack polarization [14].
In practical measurements, since the geometric structure of the sample is often difficult to determine, the complex capacitance is usually taken directly as the analysis parameter. Let the amplitudes of the output voltage and response current be Um and Im, respectively, and their initial phases be θu and θi. Denoting the phase angle between the voltage and current as φ, the expression for the complex capacitance can be obtained as follows:
C * = I m e j θ i j ω U m e j θ u = j I m ω U m e j φ = I m ω U m ( sin φ j cos φ )
C = I m ω U m sin φ
C = I m ω U m cos φ

2.2. Hardware Architecture of the 10 kV High-Voltage Frequency-Domain Dielectric Spectrum

2.2.1. Overall Architecture of the Device

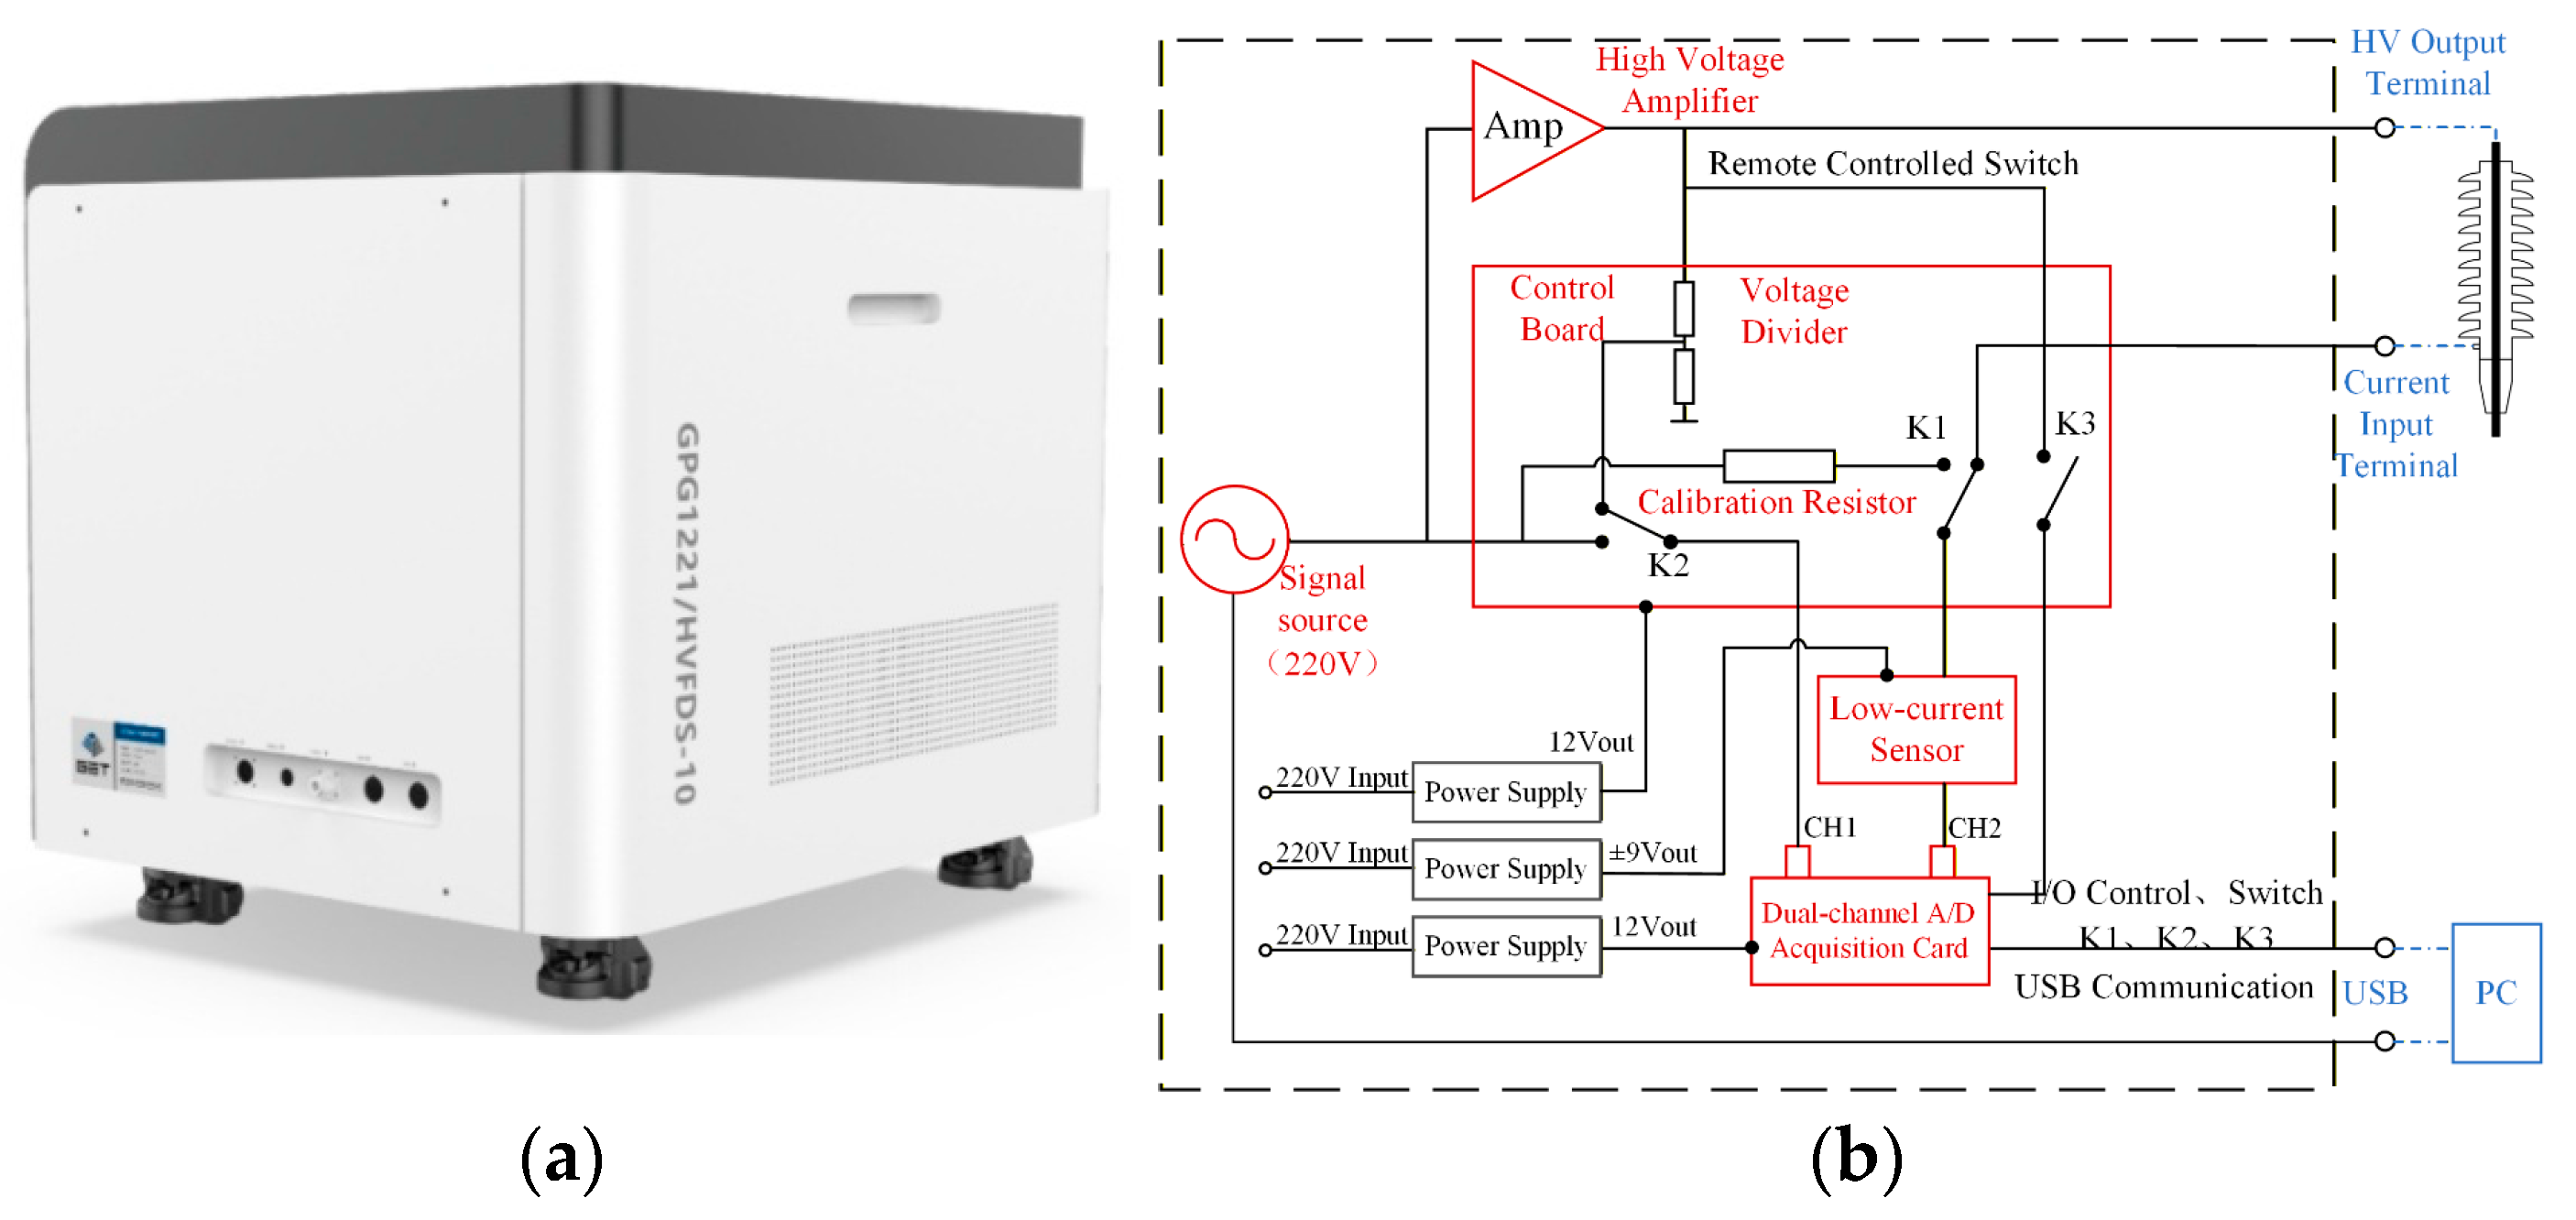
Based on the measurement principle of frequency-domain dielectric spectroscopy technology, this paper designs and develops a set of high-voltage frequency-domain dielectric spectroscopy measurement devices with an output voltage range of 0–10 kV and a frequency range of 1 mHz–10 Hz. The device integrates key functional modules such as the signal generator, high-voltage amplifier and microcurrent sensor, and has good signal generation and weak current detection capabilities. To ensure the thermal stability of the system over long periods of operation and to prevent performance drift or device damage due to temperature rise, the device is equipped with a forced air-cooled heat dissipation system, including fans and multi-hole ventilation structures, which effectively improves heat dissipation efficiency. The physical appearance of the device is shown in Figure 2a.
The design circuit of the high-voltage dielectric spectrum measurement device mainly consists of two circuits, namely the calibration circuit for the phase Angle delay of the current sensor and the measurement circuit for the oil-pressboard insulated sample under test. The hardware architecture is shown in Figure 2b, and K1 and K2 are switches used to switch between the measurement and calibration circuits.
Due to the differences in geometry, capacitance parameters, etc. among different types of oil-pressboard insulated bushings, the amplitudes of the response currents they generate under the action of an alternating electric field vary greatly [15,16]. Therefore, it is necessary to select the appropriate microcurrent sensor gain according to the object being measured to achieve effective amplification and precise measurement of the signal. However, the microcurrent sensor itself inevitably has a certain phase angle delay, that is, there is a lag in the phase of the voltage signal output by the sensor relative to the input current signal, and this phase delay is closely related to the selection of the sensor cut-off frequency and the frequency of the input signal [17]. As the frequency of the input signal increases, the phase delay introduced by the sensor gradually increases. Therefore, in order to ensure the accuracy and reliability of the measurement results of the phase difference between voltage and current of the oil-pressboard insulated sample, phase calibration of the microcurrent sensor is required during the frequency-domain dielectric spectroscopy test to eliminate the influence of the sensor phase characteristics on the test results. In typical on-site and laboratory application scenarios, the calibration of the 10 kV FDS measurement system is divided into two levels: phase calibration and overall performance calibration. Phase calibration of the microcurrent sensor is a mandatory operation and must be completed before each FDS measurement to eliminate real-time systematic errors caused by the sensor’s phase characteristics. For the overall performance calibration of the system, it should be completed before the first use of the device; in addition, if the device is moved, overhauled or subjected to a drastic ambient temperature change (±20 °C or more), the overall system calibration must be re-conducted to ensure the basic measurement performance of the whole device.

2.2.2. Hardware Core Unit

The high-voltage frequency-domain dielectric spectroscopy device is mainly composed of three parts: the high-voltage variable frequency power supply, the microcurrent measurement unit, and the signal acquisition and control unit. Based on a comprehensive consideration of power supply capacity and output current capability, the main test frequency range of the developed device was determined to be 1 mHz to 10 Hz, and accordingly, the AMS-10B2 high-voltage amplifier produced by Matsusada was selected, with an output voltage range of −10 kV to +10 kV. The output current capacity is ±2 mA and the bandwidth is up to DC to 1 kHz. The microcurrent measurement unit uses HB-873 pA class weak current amplifier module, sensor gain range 1 × 10³ V/A to 1 × 10¹¹ V/A, maximum output voltage 4.5 V, with detection capability for a wide range of currents from pA class to mA class. The signal acquisition and control unit consist of an AD data acquisition card, a control board and a computer. The measurement device uses the NI USB-6356 data acquisition card for signal acquisition, and the parameters are configured through software. The trigger mode is set to single trigger, the acquisition mode is set to continuous acquisition, and the sampling rate is set to 10,000 S/s to ensure the accurate acquisition of low-frequency dielectric response signals.
The rated parameters of the key components are as follows. The AMS-10B2 high-voltage amplifier, manufactured by Matsusada Precision Inc. (Kyoto, Japan), delivers an output of ±10 kVdc, ±2 mA maximum and 20 W maximum, with a slew rate of 30 V/μs and a frequency response of DC to 1 kHz at full scale and DC to 2 kHz at 10 percent full scale. It is a solid-state device that supports multi-waveform output. The HB-873 pA-class weak current preamplifier module, produced by Nanjing Hongbin Weak Signal Detection Co., Ltd. (Nanjing, Jiangsu, China), features a gain range of 1 × 10³ to 1 × 10¹¹ V/A, a gain-dependent frequency range of DC to 30 kHz, an input open-circuit noise of 20 fA/Hz, a DC drift of ≤50 fA/°C, a maximum output voltage of ±4.5 V, an output impedance of less than 100 Ω and a power supply of ±9 V. The NI USB-6356 multifunction data acquisition (DAQ) card, manufactured by National Instruments (NI) (Austin, TX, USA), is equipped with a USB 2.0 High-Speed interface, 16 single-ended or 8 differential 16-bit analog input channels with a maximum sampling rate of 1 MS/s. The input range is software-selectable and covers ±0.2 V, ±1 V, ±2 V, ±5 V and ±10 V. The card also has 2 16-bit analog output channels with a maximum update rate of 2.86 MS/s, 24 digital I/O channels for 5 V TTL and CMOS, as well as 4 32-bit counter/timer channels with a maximum frequency of 80 MHz.

2.3. Performance Test of the Dielectric Spectrum Device

2.3.1. Stability Test

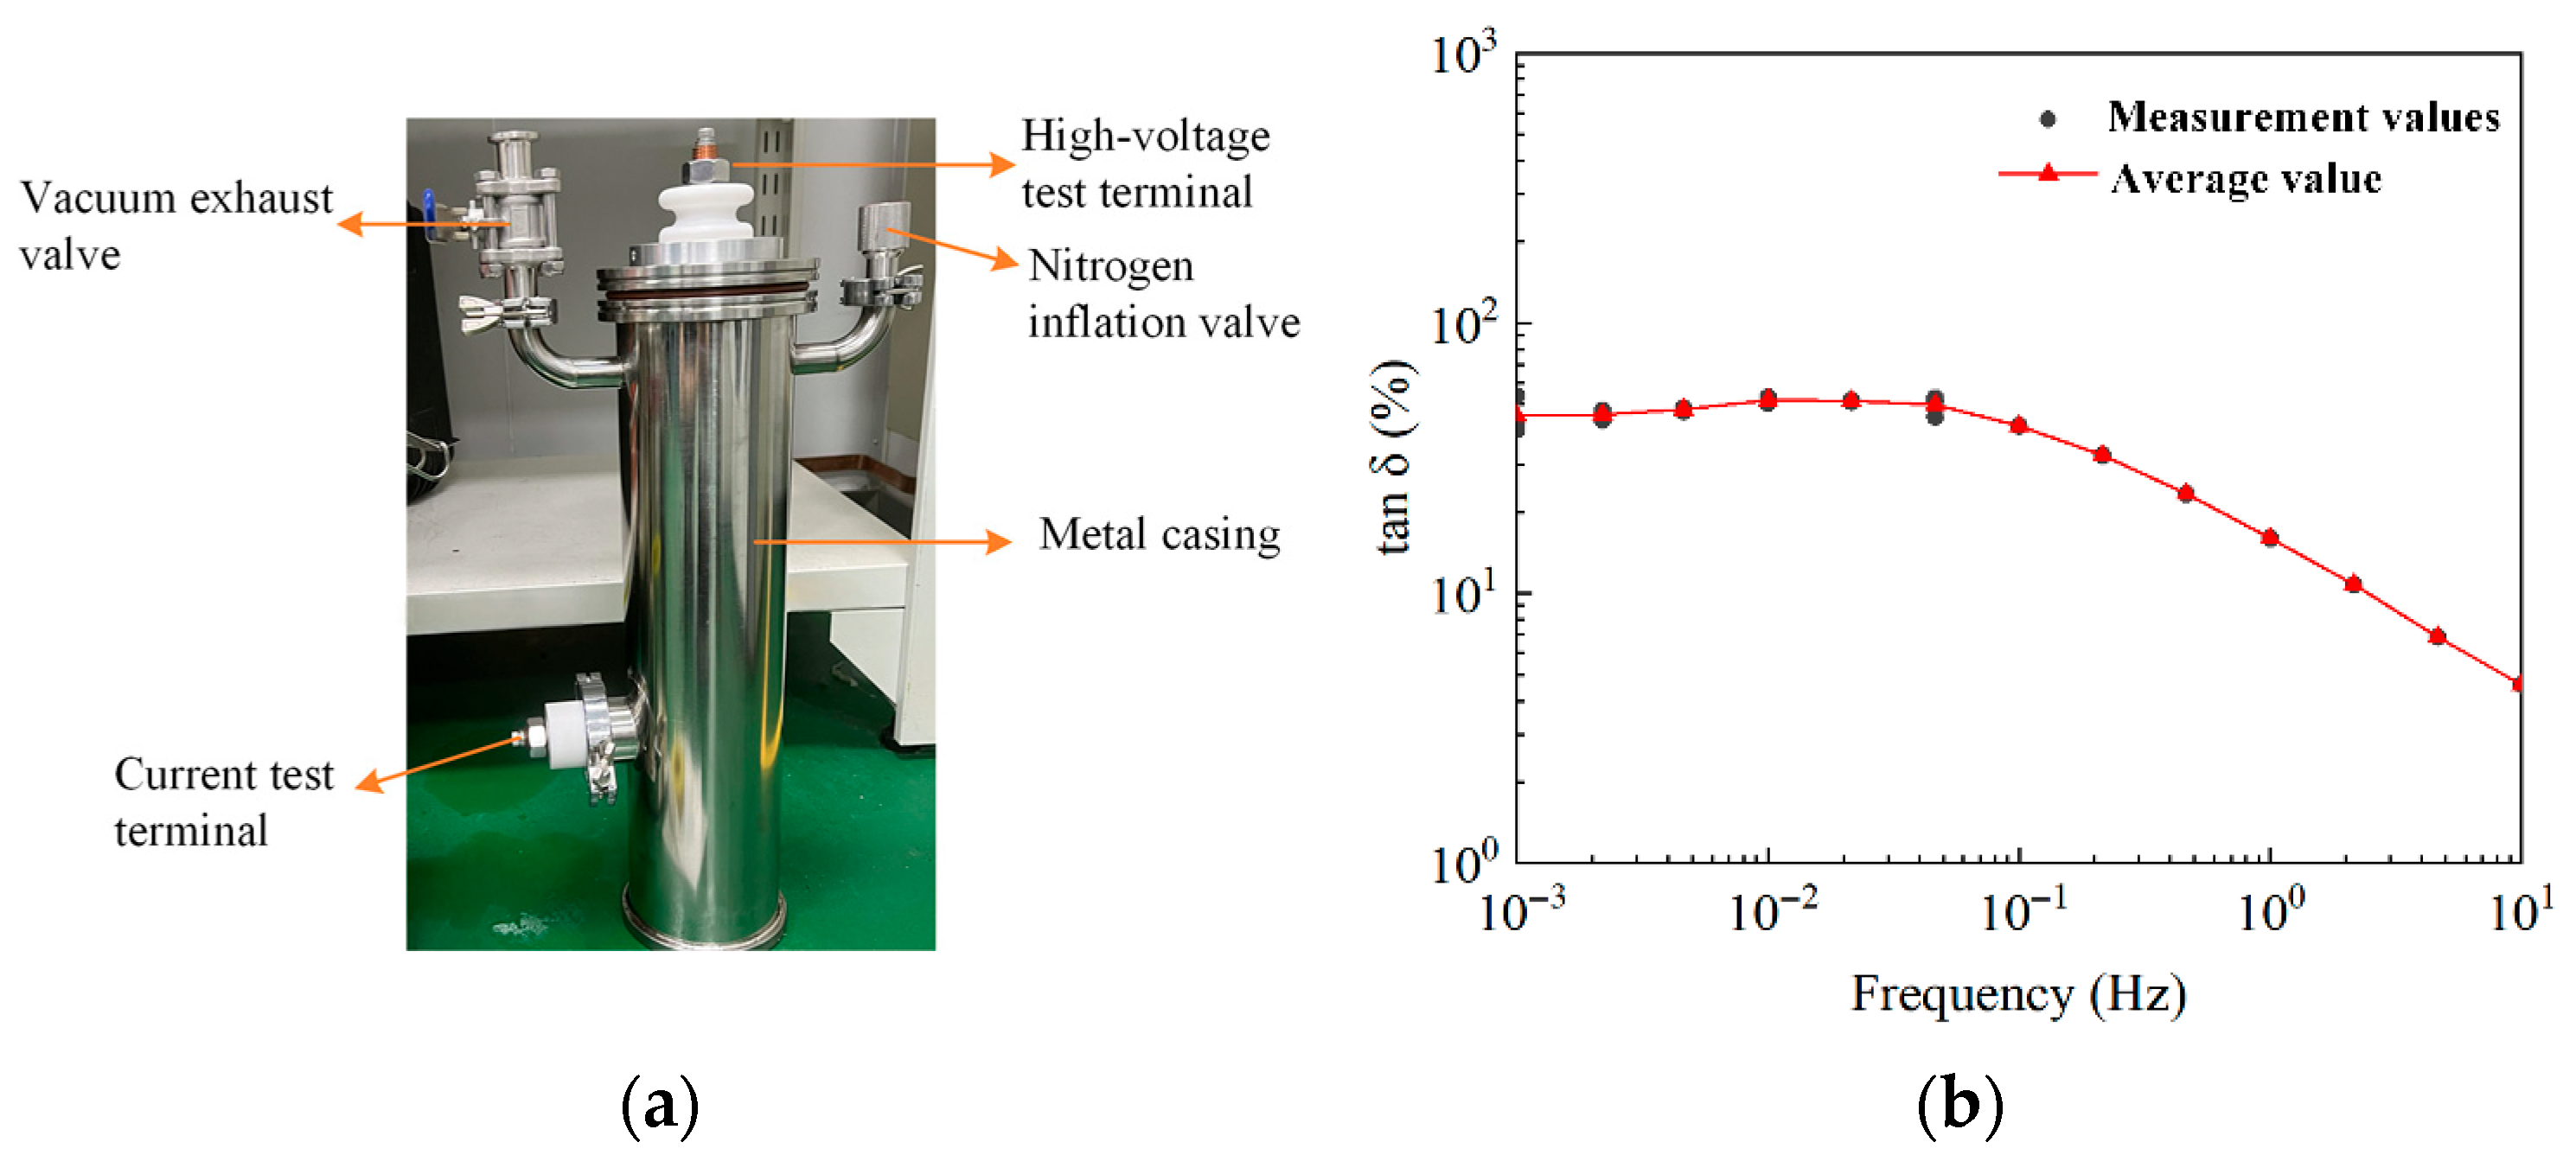
A 26 kV laboratory oil-pressboard insulating bushing model was selected as the test object to conduct stability tests on the developed high-voltage frequency-domain dielectric spectrum measurement device. The dielectric spectrum curves were measured in the range of 0.001 Hz to 10 Hz. Five consecutive cycles were sampled at each frequency point, and the standard deviations were calculated for the five resulting dielectric loss factor (tanδ) data. The test bushing model and test results are shown in Figure 3, respectively. The test results show that the maximum standard deviation of the dielectric loss values is 3.1 × 10⁻⁴, which occurs at 0.001 Hz throughout the test band. Further repeated tests on multiple groups of samples revealed that the standard deviation of dielectric loss values at each frequency point remained on the order of 10−4, indicating that the developed device had good measurement stability and could meet the requirements of dielectric spectroscopy testing in the high-voltage frequency domain.

2.3.2. Accuracy Test

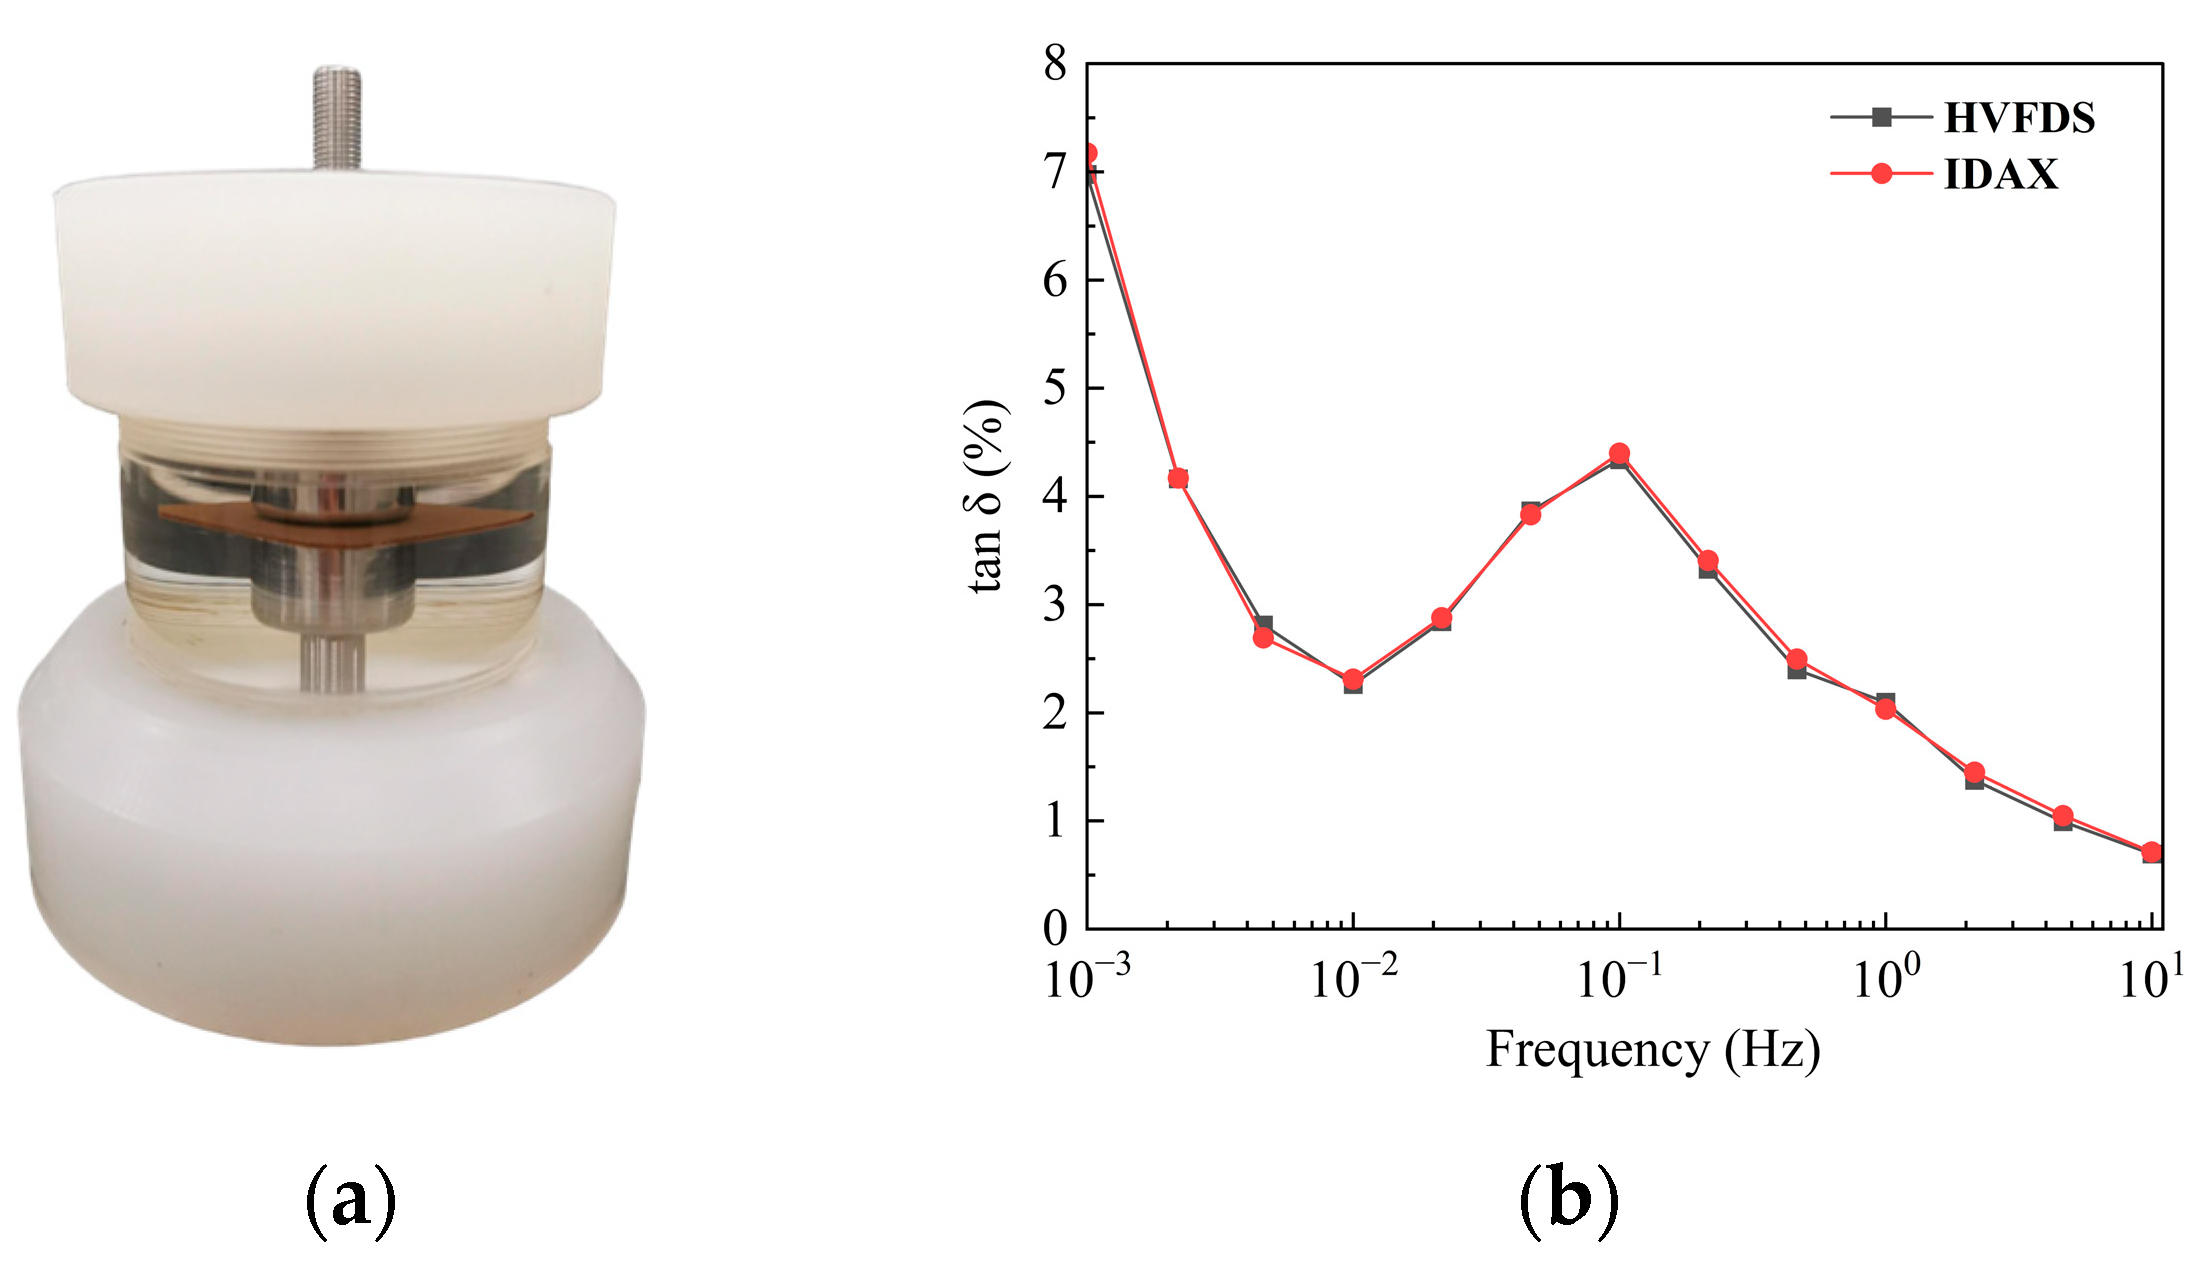
To verify the accuracy of the measurement device, single-layer oil-impregnated cardboard was selected as the test sample for frequency-domain dielectric spectroscopy tests, and the test results were compared with those measured by the IDAX 300 dielectric spectroscopy analyzer manufactured by Megger Instruments Limited, Dover, United Kingdom. The tested samples are shown in Figure 4a, and the comparison test results are shown in Figure 4b. The results show that the maximum relative error of the dielectric loss curve occurs at 4.64 Hz and was 2.432%; the corresponding absolute error of tanδ was 0.0043. Subsequently, a large number of comparative tests showed that the maximum error of dielectric loss values at each frequency point could be controlled within 5%. Therefore, the accuracy of the 10 kV high-voltage frequency-domain dielectric spectroscopy measurement device developed in this paper met the requirements.

2.4. Comparison with Commercial Systems

To further demonstrate the performance advantages of the proposed system, a comparison with commercial dielectric spectroscopy equipment was conducted. Table 1. presents a performance comparison between the developed measurement system and representative commercial systems such as IDAX-based platforms. The comparison includes key technical indicators such as voltage range, frequency range, measurement resolution, and measurement accuracy. Although commercial instruments such as IDAX-300 provide broader frequency coverage and higher intrinsic resolution, they are mainly designed for general laboratory insulation testing. In contrast, the developed platform provides stable 0–10 kV excitation and reliable millihertz-level operation with improved field adaptability, allowing more realistic simulation of in-service electrical stress for voltage-dependent dielectric analysis.

3. Test Model of Oil-Pressboard Insulating Bushing and Defect Simulation

3.1. Test Model

The test model used in this paper is an oil-pressboard insulating bushing with a rated voltage of 26 kV, as shown in Figure 3a. The casing is made of stainless steel, which has good sealing performance and is equipped with vacuum and inflation valves for easy maintenance and debugging during the test process. The main insulation of the casing is a typical capacitive structure, consisting of four evenly arranged aluminum foil plates with a zero-screen radius of 16.5 mm and a zero-screen plate length of 250 mm. To ensure similarity between the bushing model and the actual bushing structure [18].
To achieve the equivalence of the test model and the actual 500 kV oil-pressboard insulating bushing in the distribution of electric field intensity, the electric field distribution was optimized by reasonably adjusting the insulation thickness between each layer of the bushing core and the step length. The calculation results show that the maximum radial electric field of the model is 4.5 kV/mm, the maximum upper axial electric field is 0.10 kV/mm, the maximum lower axial electric field is 0.43 kV/mm, and the deviation of the maximum electric field in each direction from the target value is controlled within 5%. In addition, the test model was manufactured in accordance with the actual oil-pressboard capacitive bushing process, and the drying and vacuum oil immersion processes were carried out strictly in accordance with the relevant specification procedures, thus ensuring the good insulation performance of the bushing model and the reliability of the test results.

3.2. Simulation of Typical Defects

3.2.1. Sample Preconditioning

First, the capacitor core is wound according to the manufacturing process of the bushing. The capacitor core requires a strict drying process. The transformer oil used in this paper is No. 25 Karamay transformer oil. The capacitor core is placed in the transformer oil, and the vacuum chamber parameters are set at 105 °C 100 Pa, and vacuum immersion for 48 h. After the drying impregnation, the water content of the capacitor core should be less than 1% [19,20,21].

3.2.2. Simulation of Moisture Defects

When transformers leave the factory, the initial moisture content of insulating paper is generally controlled to be less than 1%. However, due to the influence of the operating environment and factors such as moisture produced by its own insulation aging, the moisture content may increase by only about 4% to 5%. Generally, it is considered that the moisture content in the paper is less than 1% in a dry state and more than 4% in a severely damp state. The method of moisture absorption in this paper is natural moisture absorption: the capacitor core is fully exposed to natural air for moisture absorption, and the environmental humidity is maintained at 60% to 70%, and different moisture content bushings are prepared by controlling the moisture absorption time. The moisture content was tested using a Karl Fischer titrator. Based on the above principles, this paper controls the water content of the oil-pressboard insulating bushing between 0.5% and 5%.

3.2.3. Simulation of Aging Defects

When the external cooling air is 20 °C, the transformer operates at rated current and the insulation material of a certain temperature class is damaged due to thermal aging, the service life of the transformer is generally defined as 20 years [22,23]. When the accelerated thermal aging test is conducted at 130 °C, the life of the solid insulation of the transformer reaches its end in about 30 days. Therefore, the sampling interval is required to reflect the variation pattern of aging as well as ensure the difference in the results of the separation. Based on these principles, this paper selects aging times of 0 days, 7 days, 14 days, 21 days, and 28 days, covering the entire stage from the initial to the final stage of transformer bushing aging. At the same time, to avoid the influence of initial moisture on the aging rate, the bushing models used during aging were all pre-treated dry models.
It should be noted that accelerated high-temperature aging mainly reflects dominant thermal degradation behavior and may not fully reproduce the complex multi-factor stresses encountered in long-term field operation. Nevertheless, this protocol provides a repeatable experimental basis for investigating dielectric aging characteristics under controlled thermal stress conditions.

3.2.4. Dielectric Spectroscopy Test Scheme

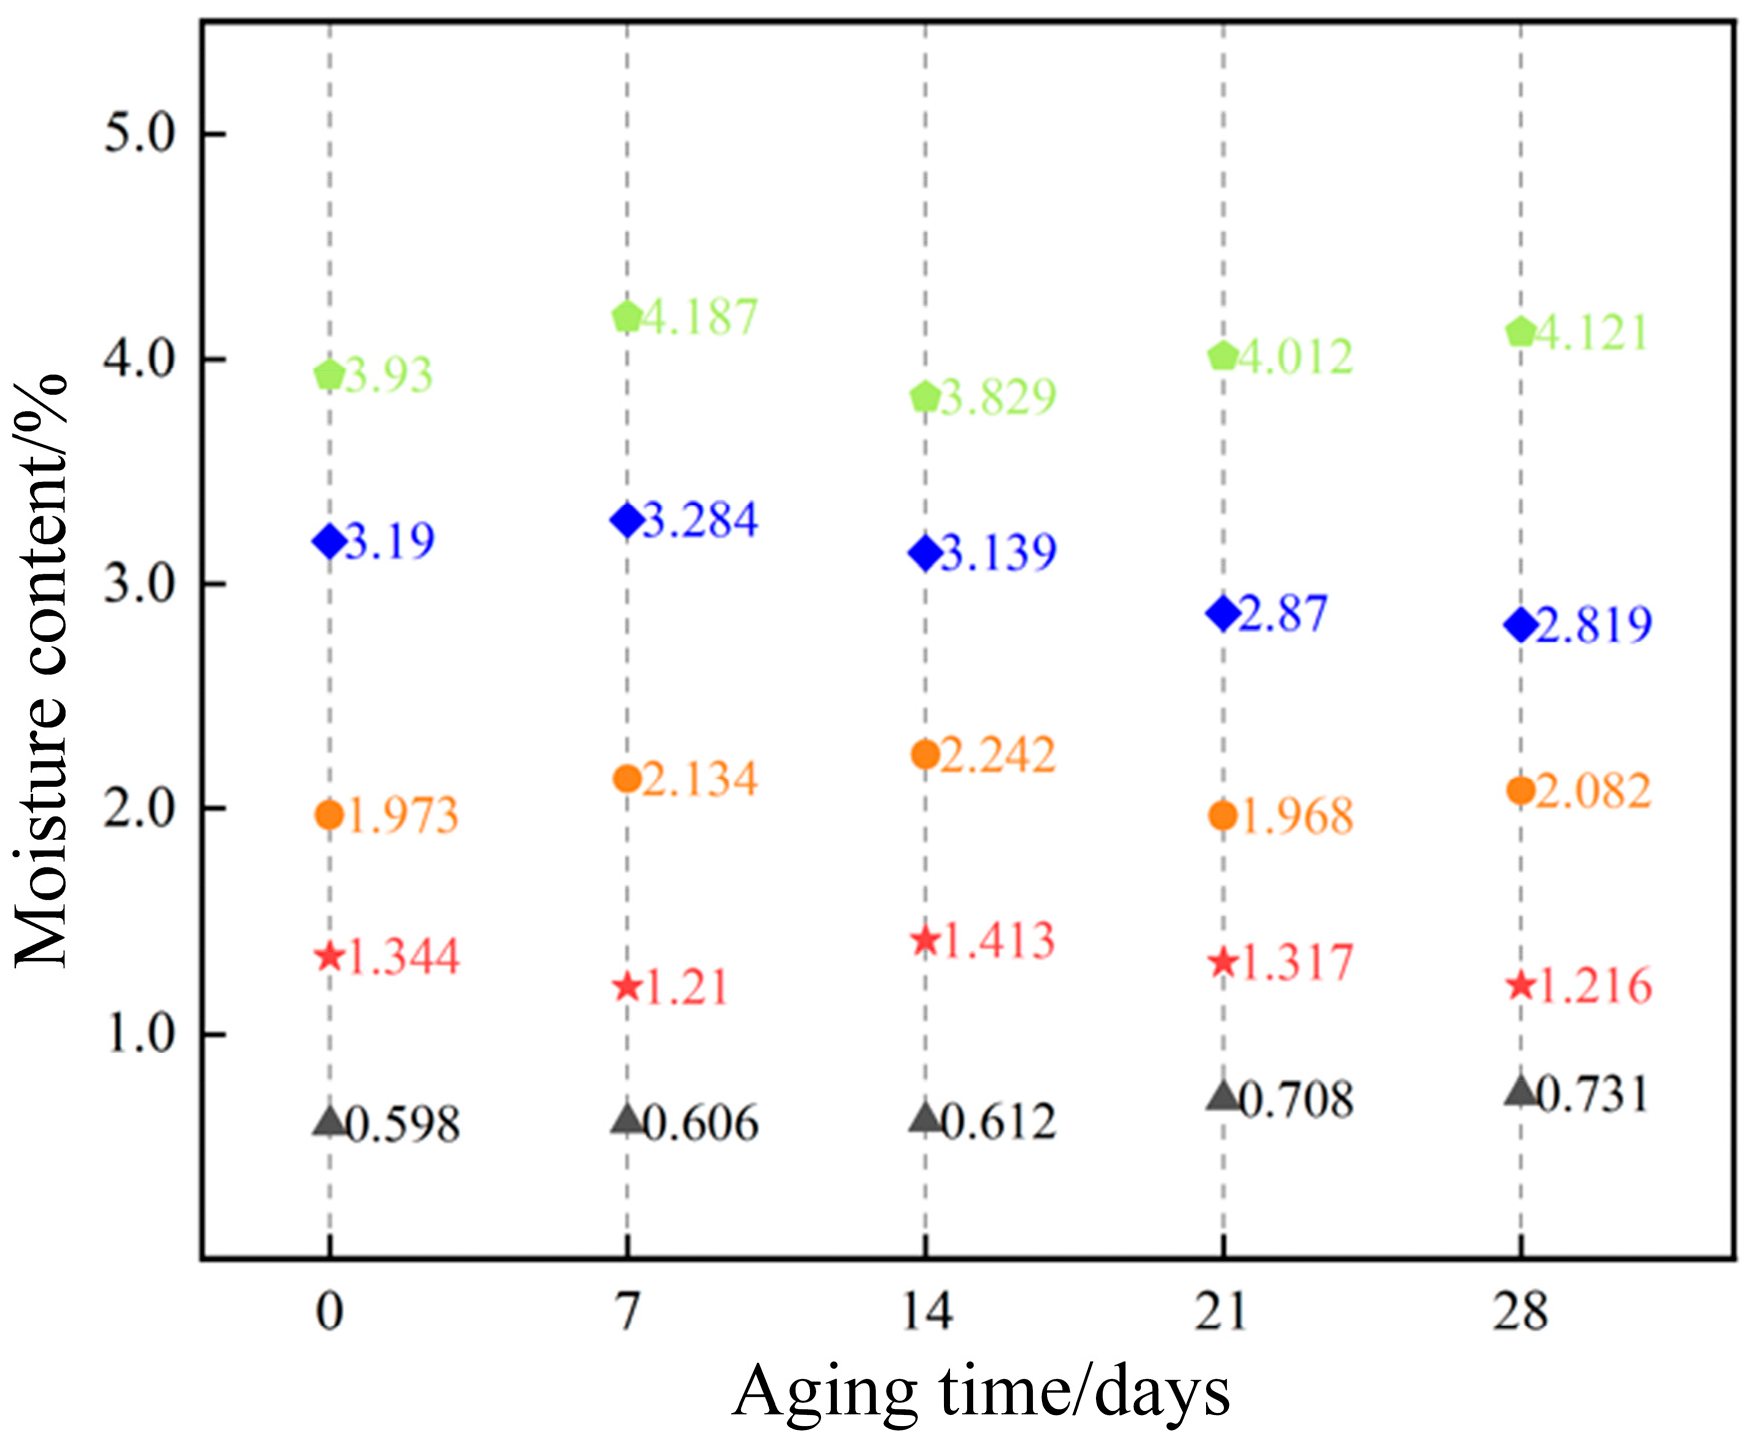
According to the above defect simulation method, the oil-pressboard insulating samples prepared in this paper are shown in Figure 5, moisture content distribution of oil-pressboard insulating bushing samples under different aging times (0 d, 7 d, 14 d, 21 d, 28 d). It can be seen that the water content is distributed relatively uniformly in each aging state, achieving the expected test objective. All the samples prepared in the laboratory were classified according to the variation patterns and relevant requirements of moisture and aging in the field transformer.
The applied test voltages in the experiment are 200 V, 1 kV, 2 kV, 5 kV and 10 kV, and the voltage is increased continuously in the above order during the test. For each test condition including different moisture content, aging time, temperature and applied voltage, three identical oil-pressboard insulating bushing samples are tested repeatedly, and the average value of the three test results is taken as the final experimental data to reduce the random error of the test. Before testing the samples, first record the temperature of the sample to be tested and the ambient temperature. Once the sample and the ambient temperature reach thermal equilibrium, conduct the measurement under constant temperature conditions. The “constant temperature conditions” in the experiment refer to that the temperature of the sample and the ambient temperature are kept consistent, and the temperature fluctuation range is controlled within ±0.5 °C to ensure the stability of the test environment. Then, set the test voltage, test frequency range and parameters related to the sample in the dielectric spectrum test software, start the test and collect the dielectric loss factor and capacitance data within the frequency range of 0.001 Hz to 10 Hz. Finally, the moisture content of the sample under test was determined and recorded using a Karl Fischer moisture titrator.

4. Analysis of High-Voltage Dielectric Spectral Characteristics of Oil-Pressboard Insulating Bushings

4.1. Analysis of Dielectric Spectral Characteristics in the High-Voltage Frequency Domain Under Moisture Conditions

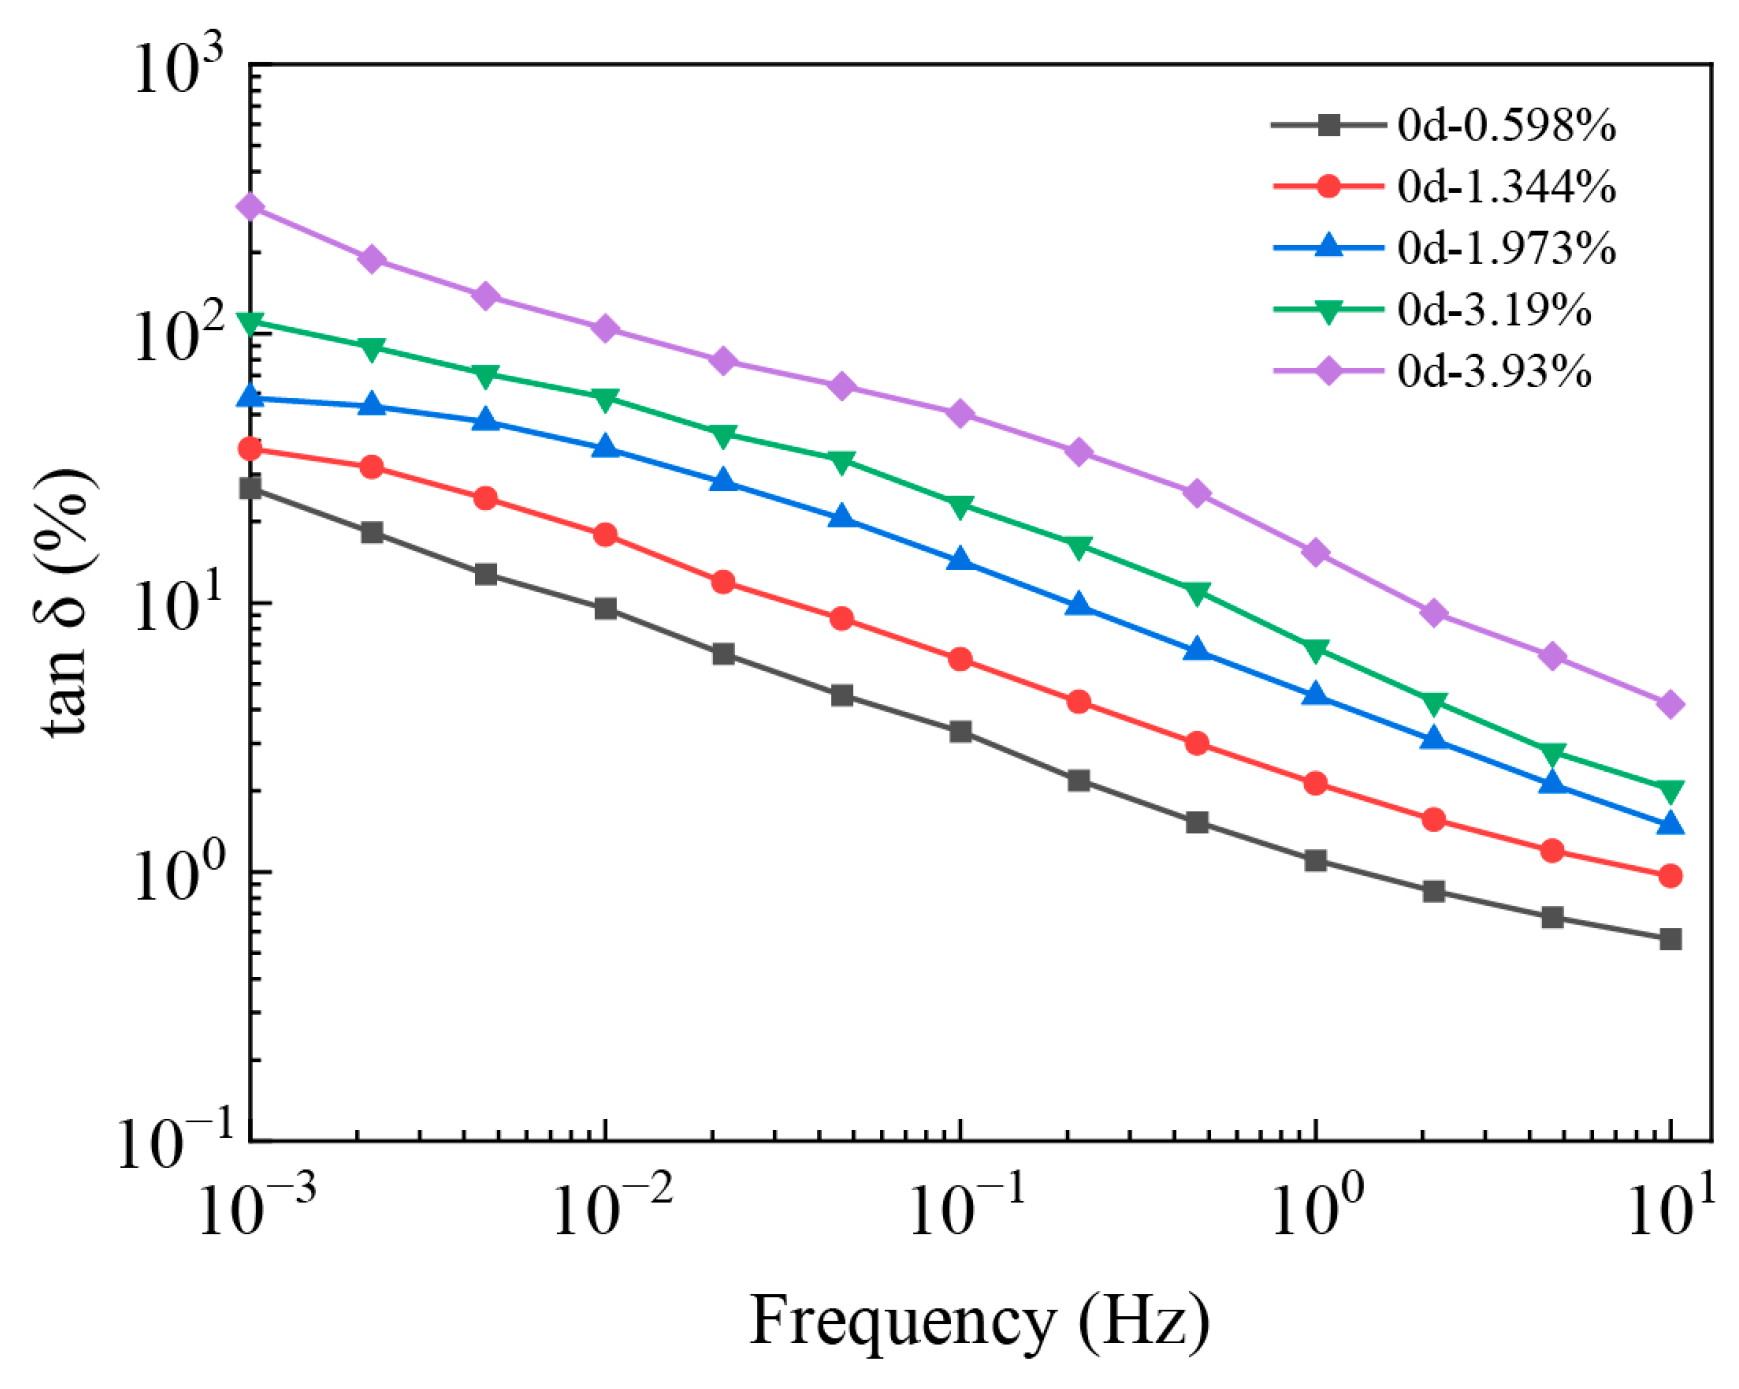
The test temperature was 25 °C and the test voltage was 10 kV. The dielectric spectrum curves of unaged oil-pressboard insulating bushings at different water contents are shown in Figure 6. Over the entire frequency band from 0.001 Hz to 10 Hz, tan δ increases with the increase of water content. This is because after the casing absorbs moisture, water is a strongly polar molecule. On the one hand, it increases the electrical conductivity of the paper, thereby increasing the electrical conductivity loss. On the other hand, it is equivalent to introducing impurities into the insulation system. The strong polarity of water increases the number of molecules involved in the plane per unit volume, making it easier to form interfacial polarization, resulting in increased polarization loss. When the moisture is severe, protrusions similar to “steps” will appear in the mid-band. The “step-like” bulge in the mid-frequency band under high humidity conditions is due to the fact that the high moisture content makes the oil-pressboard insulation system form a large number of polar water molecule clusters at the oil-paper interface; at the mid-frequency, the polarization relaxation speed of water molecule clusters is consistent with the change speed of the applied alternating electric field, resulting in a sudden increase in the interfacial polarization loss of the insulation system, thus forming a “step-like” bulge in the tanδ-f curve [24,25]. With the further increase of frequency, the polarization relaxation of water molecule clusters cannot keep up with the change of the electric field, and the polarization loss decreases, so the tanδ-f curve returns to the normal variation trend.
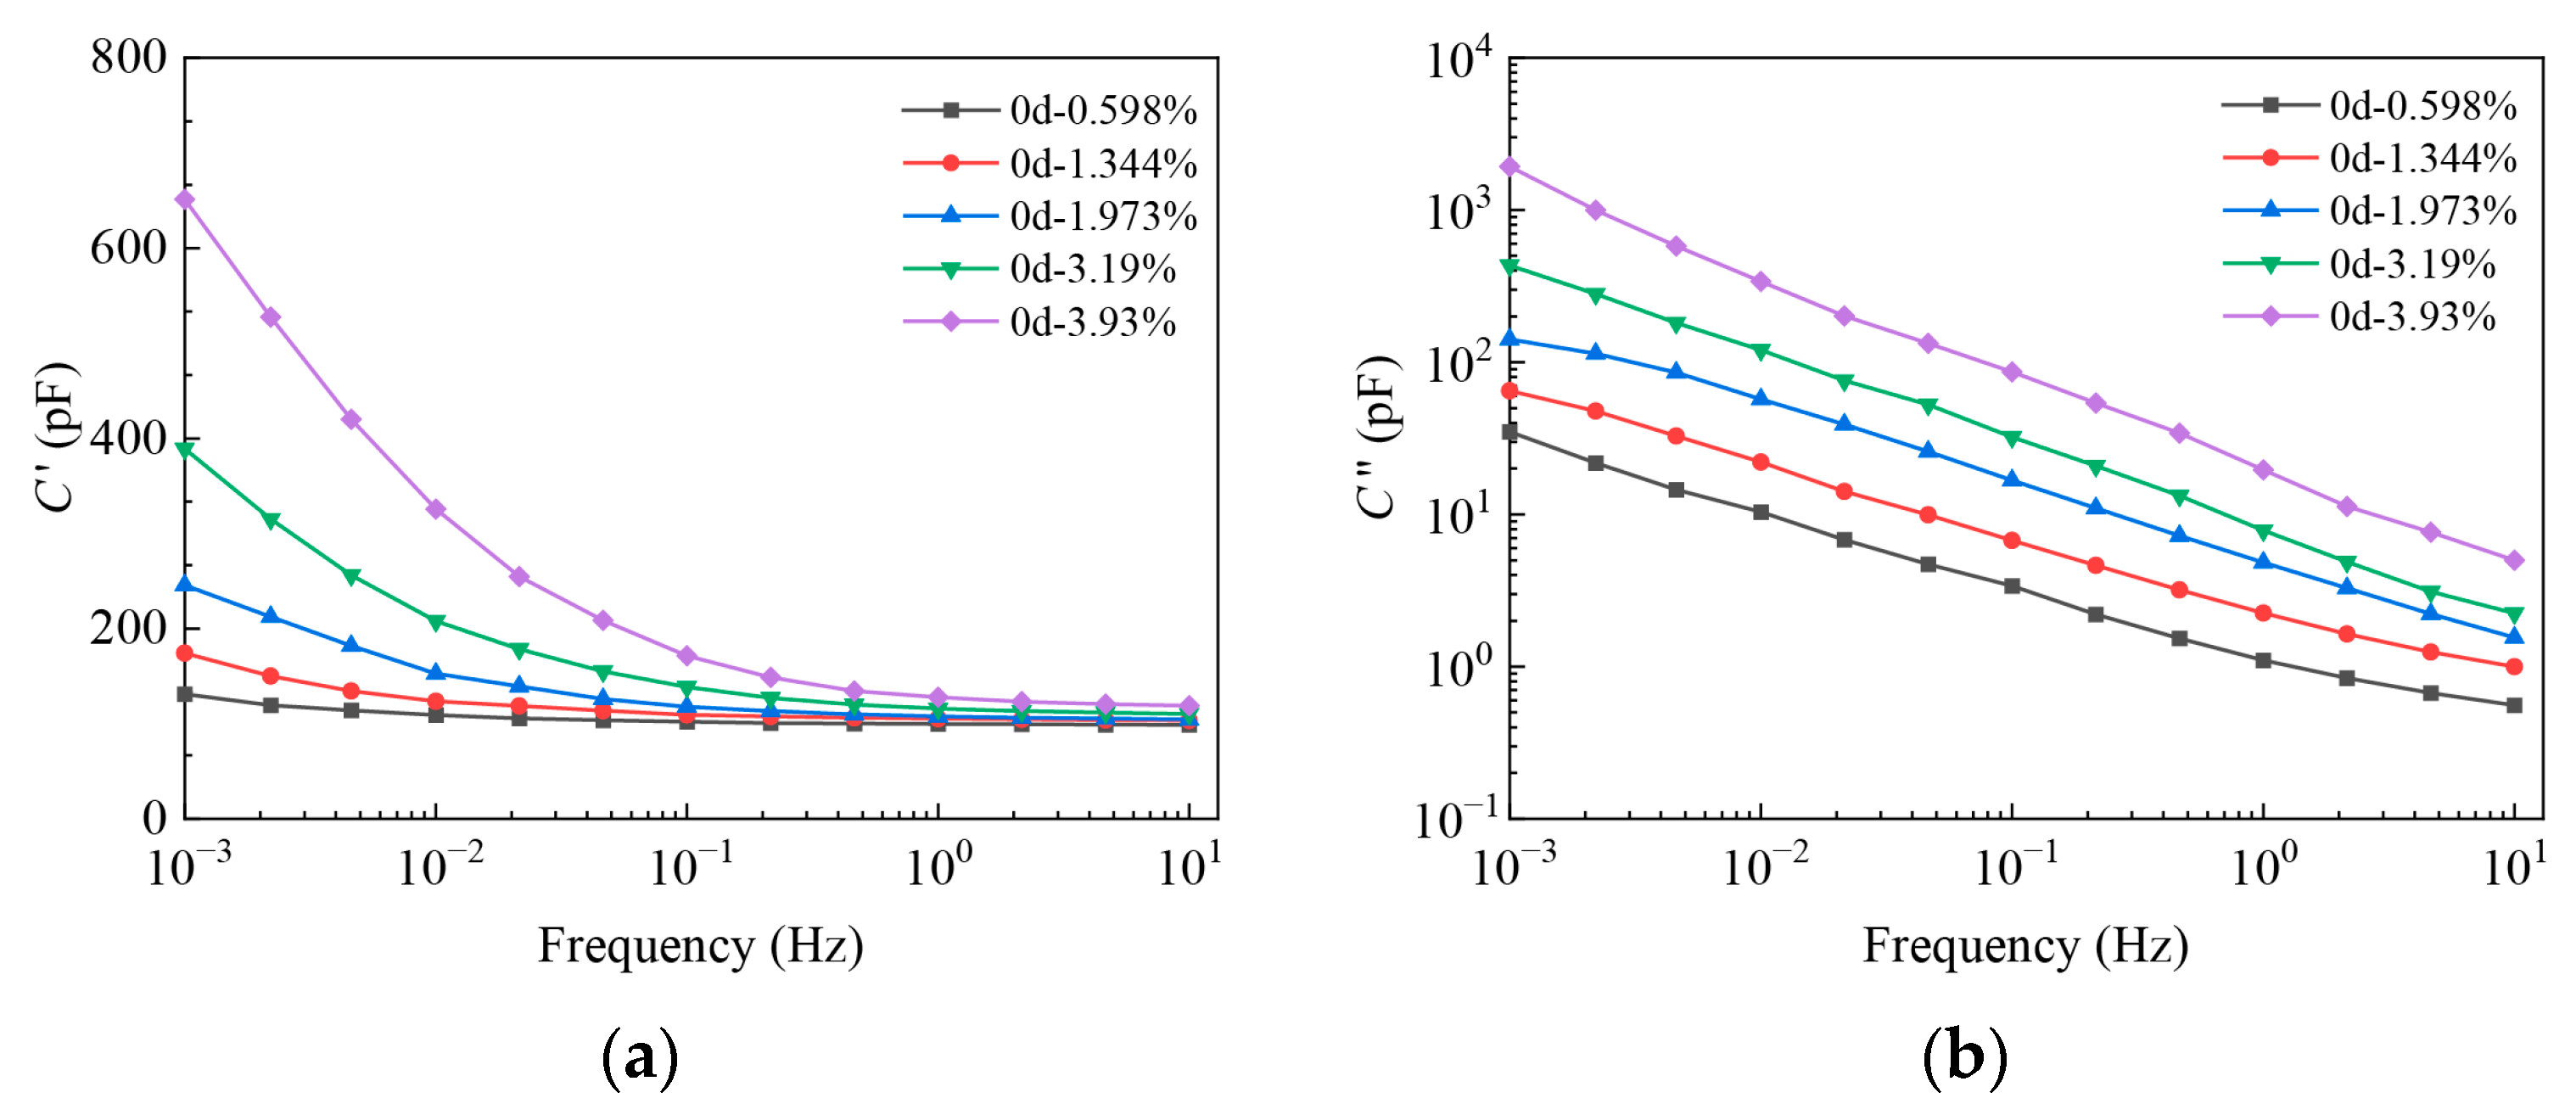
Figure 7 shows the dielectric spectrum of the real and imaginary parts of the complex capacitance of the oil-pressboard insulating bushing. It can be seen that the real part of the complex capacitance gradually increases with the increase of water content within the range of 0.001 Hz to 1 Hz, while the imaginary part is similar to the change of the dielectric loss curve and approximately linear in logarithmic coordinates. This is because the imaginary part reflects the conductance and polarization information inside the insulation. The increase in water content intensifies both behaviors.
To make the test results more intuitive, taking an unaged bushing as an example, the characteristic frequencies of 0.01 Hz and 0.001 Hz were selected for analysis, and the rate of change of low-frequency dielectric loss at a 10 kV test voltage was calculated. The results are shown in Table 2. The “dielectric loss change percentage” refers to the percentage increase of the dielectric loss value of the oil-pressboard insulating bushing sample with different moisture contents relative to the dry unaged bushing sample (moisture content 0.598%) at the corresponding characteristic frequency (0.01 Hz/0.001 Hz) under the test voltage of 10 kV. The results show that, compared with the dielectric spectrum of the unaged bushing, the dielectric loss values of the bushings in all insulation states at 10 kV increase at 0.001 Hz. When the water content of the sheath was 1.973% or more, the dielectric loss rate at 0.01 Hz began to increase with the increase of water content.

4.2. Analysis of Dielectric Spectral Characteristics in the High-Voltage Frequency Domain in the Aging State

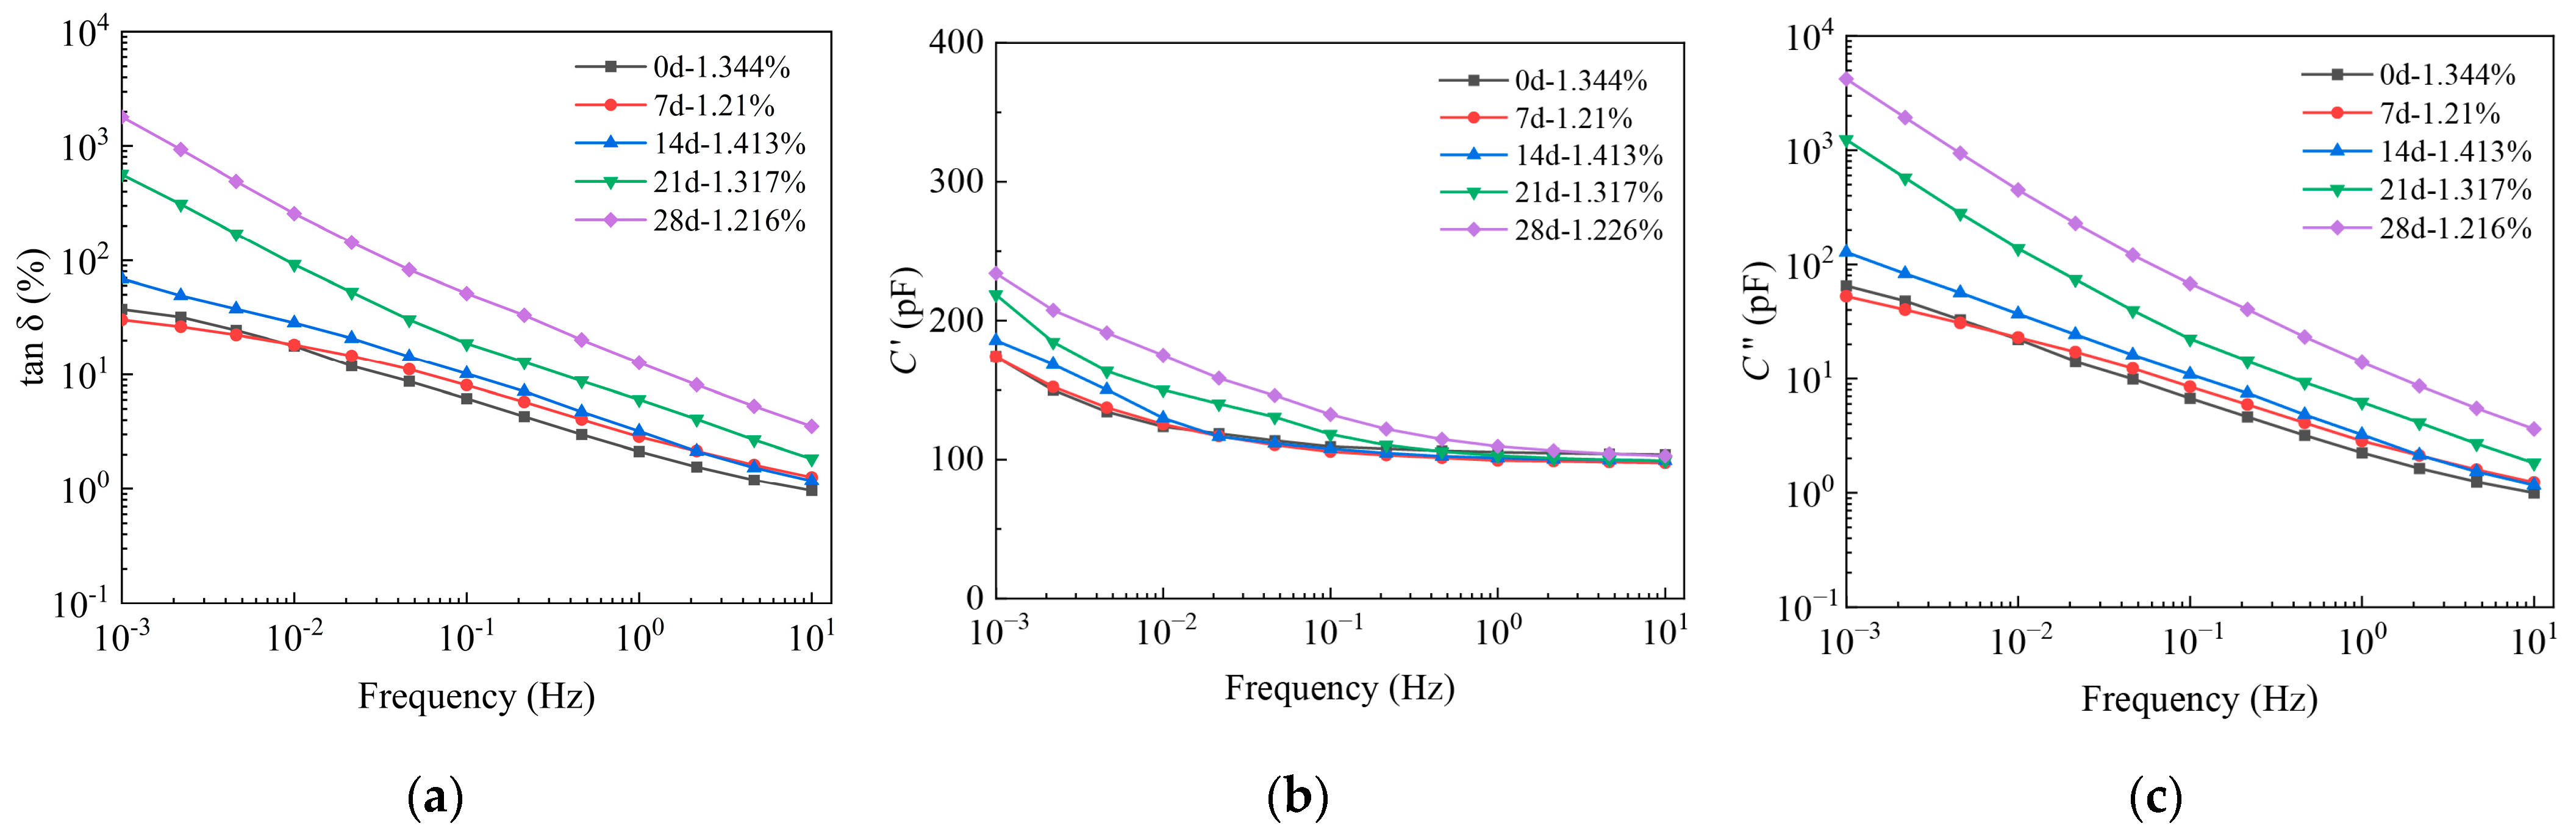
The dielectric spectrum curves of the oil-pressboard insulating bushings during accelerated thermal aging at 130 °C are shown in Figure 8. The water content is around 1.3%. It can be seen that the polarization characteristics of the unaged bushings are different from those of the aged bushings. Dielectric loss increases with aging time; the real part shows an increasing trend throughout the frequency band, and the imaginary part has similar characteristics to the dielectric loss curve.
The main component of the bushing capacitor core is cellulose, which decomposes during high-temperature thermal aging and produces various polar aging by-products. These aging products generally exhibit much higher polarity and permittivity than insulating oil and pressboard. As aging progresses, the concentration of polar groups and charge carriers in the insulation system increases. Under an external electric field, enhanced dipolar polarization and interfacial polarization occur simultaneously within the oil-pressboard composite structure. The frequency-dependent polarization behavior can be described using a Debye-type relaxation model:
ε * ( ω ) = ε + ε s ε 1 + j ω τ
where ε*(ω) denotes the complex permittivity at angular frequency ω; εs is the static permittivity in the low-frequency limit; ε is the permittivity in the high-frequency limit; j is the imaginary unit; and τ is the polarization relaxation time constant. Thermal aging promotes the formation of polar by-products and increases interfacial heterogeneity in the oil-pressboard insulation system, thereby modifying both the relaxation time distribution and the polarization strength. Consequently, the dispersion region shifts toward lower frequencies, and the dielectric response becomes more pronounced and more sensitive to frequency variation after aging.
To quantitatively analyze the effect of aging on dielectric characteristics, the results obtained at 200 V were taken as the reference. The characteristic frequencies of 0.01 Hz and 0.001 Hz were selected for analysis, as shown in Table 3. At 0.01 Hz, the variation rate of dielectric loss already shows an increasing trend with aging time. Moreover, at 0.001 Hz, the magnitude of the variation rate is more pronounced. These results indicate that the dielectric loss increases with the progression of aging, which is consistent with the characteristic behavior observed under moisture conditions.

4.3. Analysis of Dielectric Spectral Characteristics in the High-Voltage Frequency Domain at Test Temperature

The influence of temperature on the frequency-domain dielectric spectrum is particularly significant. Therefore, the high-voltage dielectric spectrum characteristics of oil-pressboard insulating bushings at different temperatures need to be studied. When testing the dielectric spectrum curve, temperature consistency must be maintained.
According to the standard IEC 60137 [26], the maximum operating temperature for conventional capacitive bushings is 100 °C and the maximum daily average temperature is 90 °C. Therefore, the upper limit is not higher than 90 °C. When the temperature is below 20 °C, because the oil has a certain viscosity, the movement of water molecules is slow and migration is not obvious. Set the lower limit of the temperature range in the laboratory environment at 25 °C. The temperature variation of the transformer in operation is relatively small, typically between 10 °C and 20 °C Therefore, the temperature variation is set at 15 °C. For the purpose of enriching the sample, this paper selects oil-pressboard insulating bushing models with different degrees of moisture exposure at test temperatures of 25 °C, 40 °C, 55 °C, 70 °C, and 85 °C as test subjects.
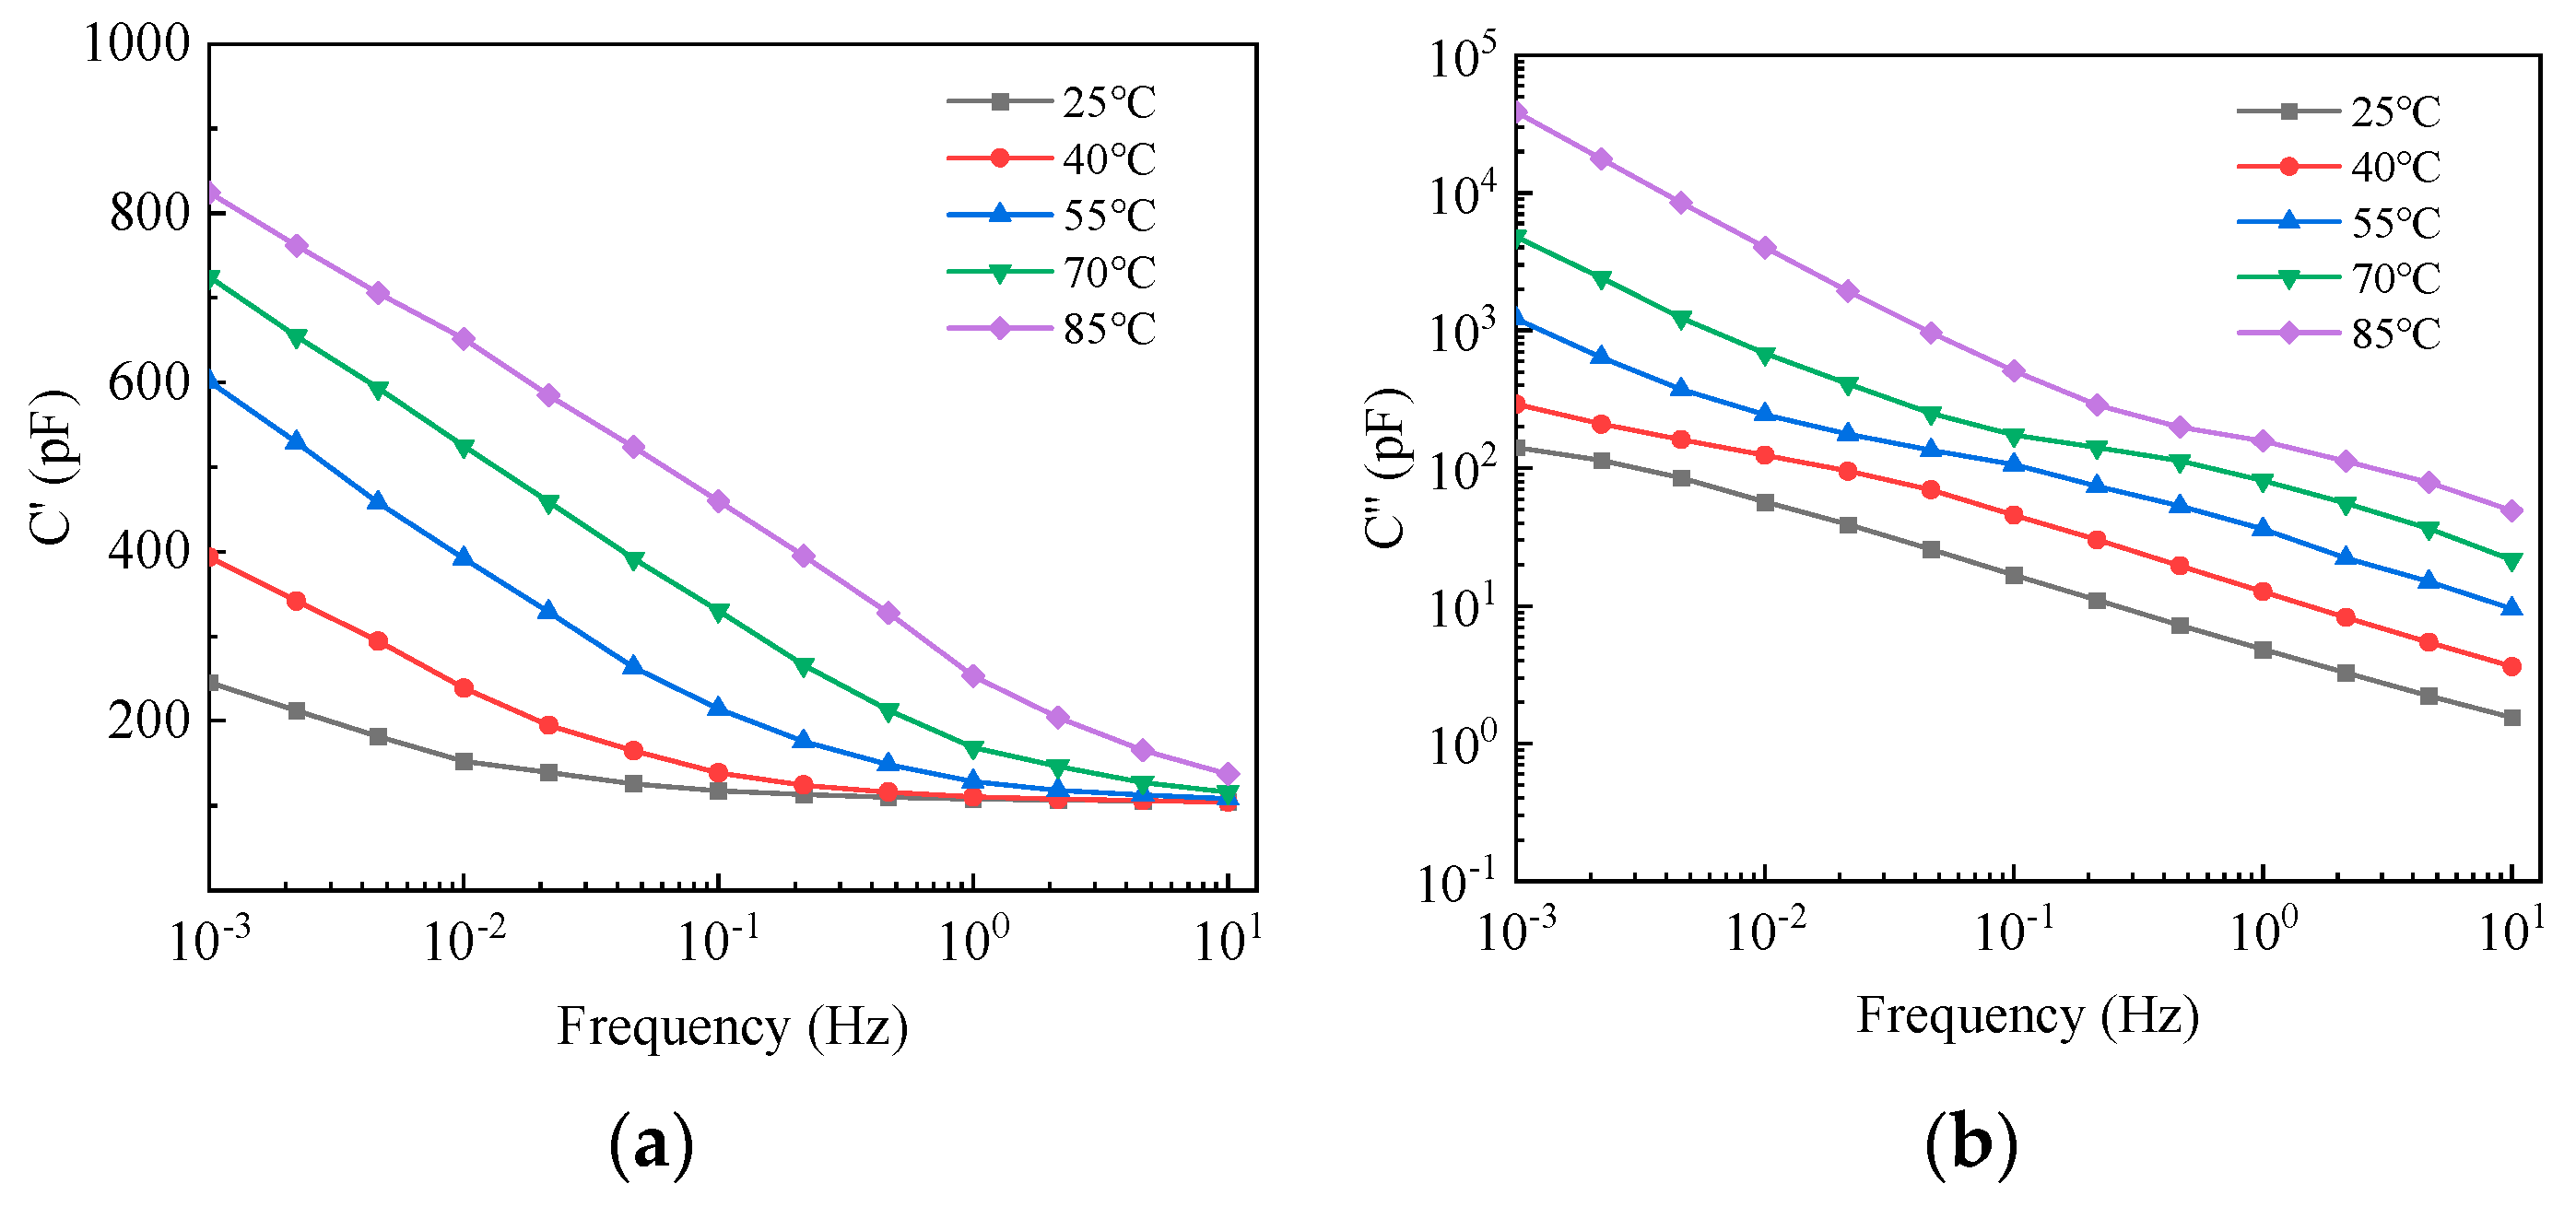
Dielectric spectrum tests were conducted at 10 kV test voltages, and Figure 9 shows the dielectric spectrum curves of the unaged bushings. It can be seen that as the temperature rises, both the real and imaginary parts of the complex capacitance curves increase over the entire frequency band, and the imaginary part moves toward higher frequencies. This is because at room temperature, the interfacial polarization of the oil-pressboard insulating bushing cannot be established as the test frequency increases because it cannot keep up with the change in the speed of the electric field turning. But as the temperature rises, the time required for polarization to be established decreases, allowing the polarization to be fully completed, and the polarization phenomenon becomes obvious.
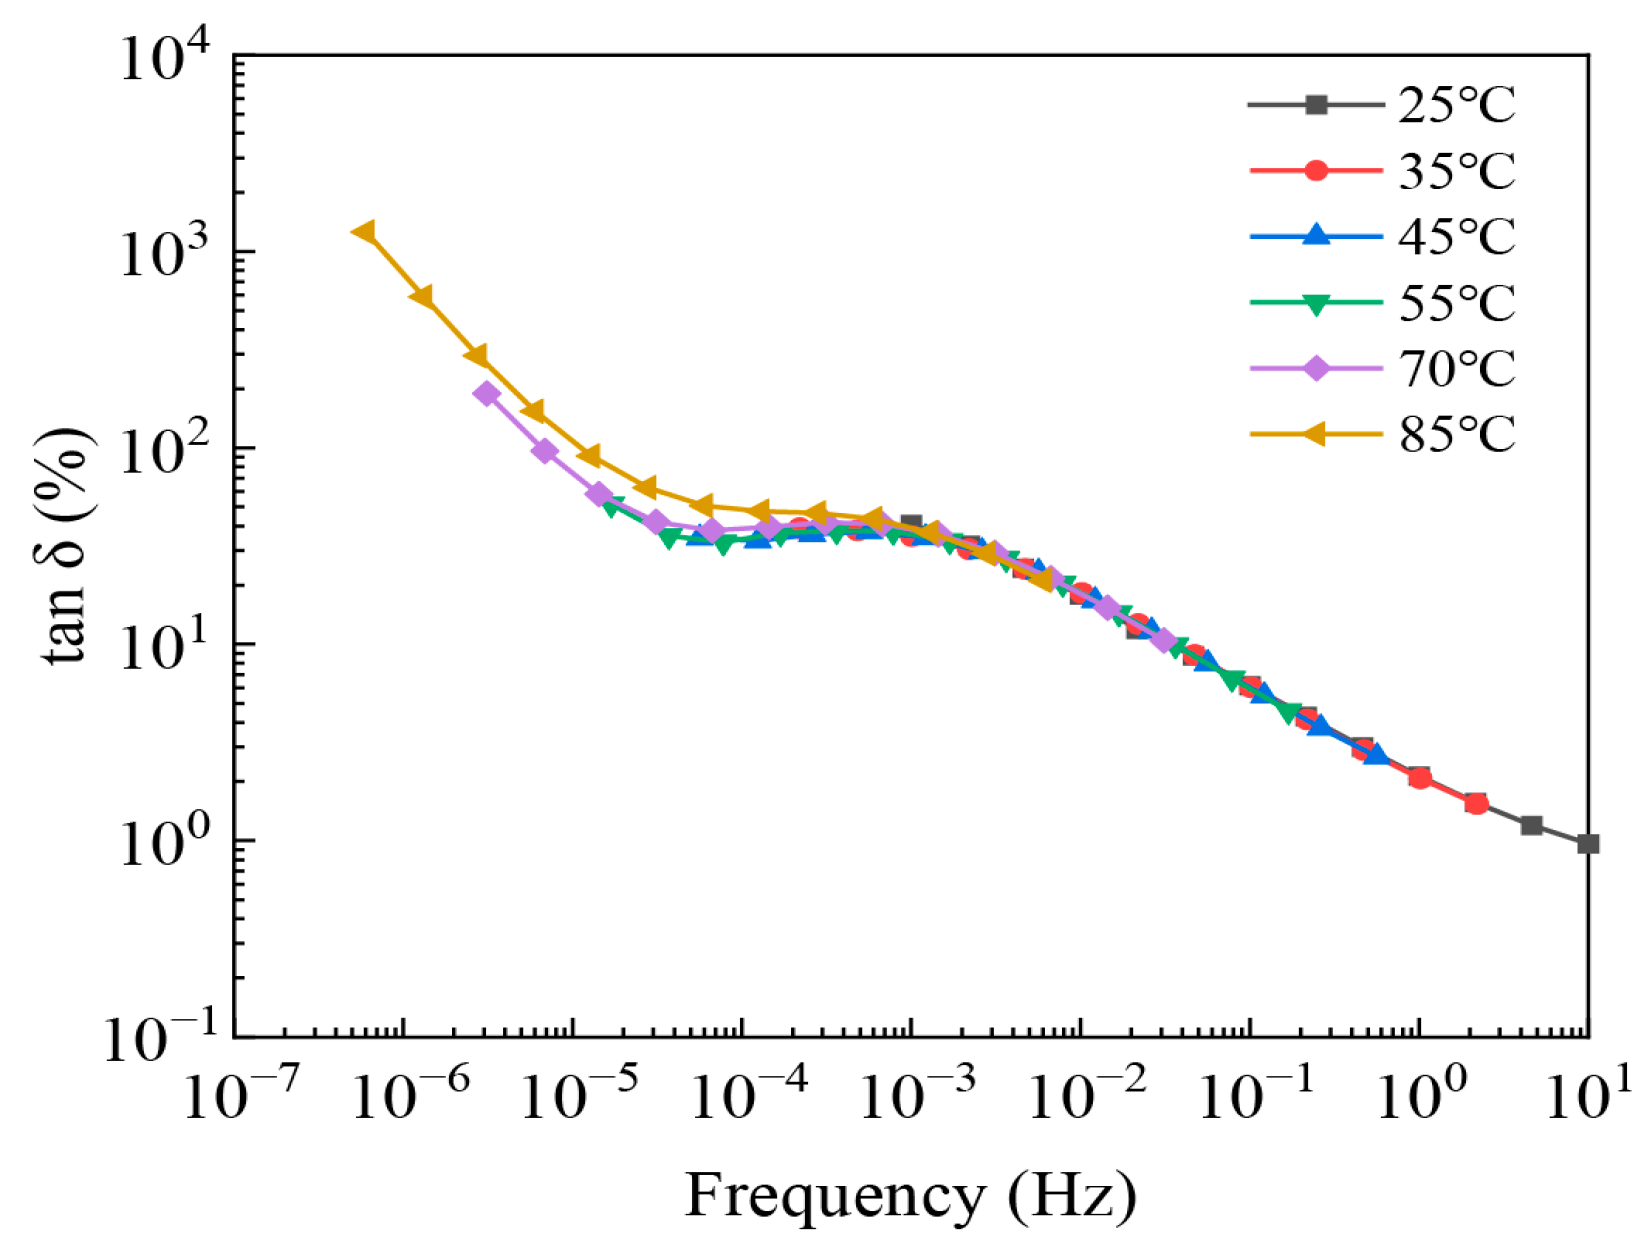
For the dry bushings, the frequency–temperature superposition method was applied to analyze the dielectric spectra. The curve at 25 °C was selected as the reference curve, and the test temperatures were 25 °C, 35 °C, 45 °C, 55 °C, 70 °C, and 85 °C. According to the time–temperature superposition principle, the measured data at different temperatures can be horizontally shifted to an equivalent frequency scale using a temperature-dependent shift factor:
f eq = a T f
where feq is the equivalent frequency at the reference temperature, f is the measured frequency, and aT is the temperature shift factor. After translation, as shown in Figure 10, the dielectric spectral curves at different temperatures exhibit poor superposition. With increasing temperature, the curves shift toward higher frequencies and display an upward drift in dielectric loss—particularly pronounced at 85 °C.
This indicates that the direct application of the frequency–temperature superposition method requires a single dominant relaxation process and temperature normalization conditions. However, from the curve shape it can be inferred that at least two polarization mechanisms exist in the oil-pressboard insulation system, namely dipolar polarization and interfacial polarization. These two processes have different dynamic behaviors and temperature dependences, and their characteristic frequency ranges are not identical. When both polarization processes are present within the measured frequency band, their combined contribution leads to an overall upward and rightward shift of the dielectric spectrum curve.
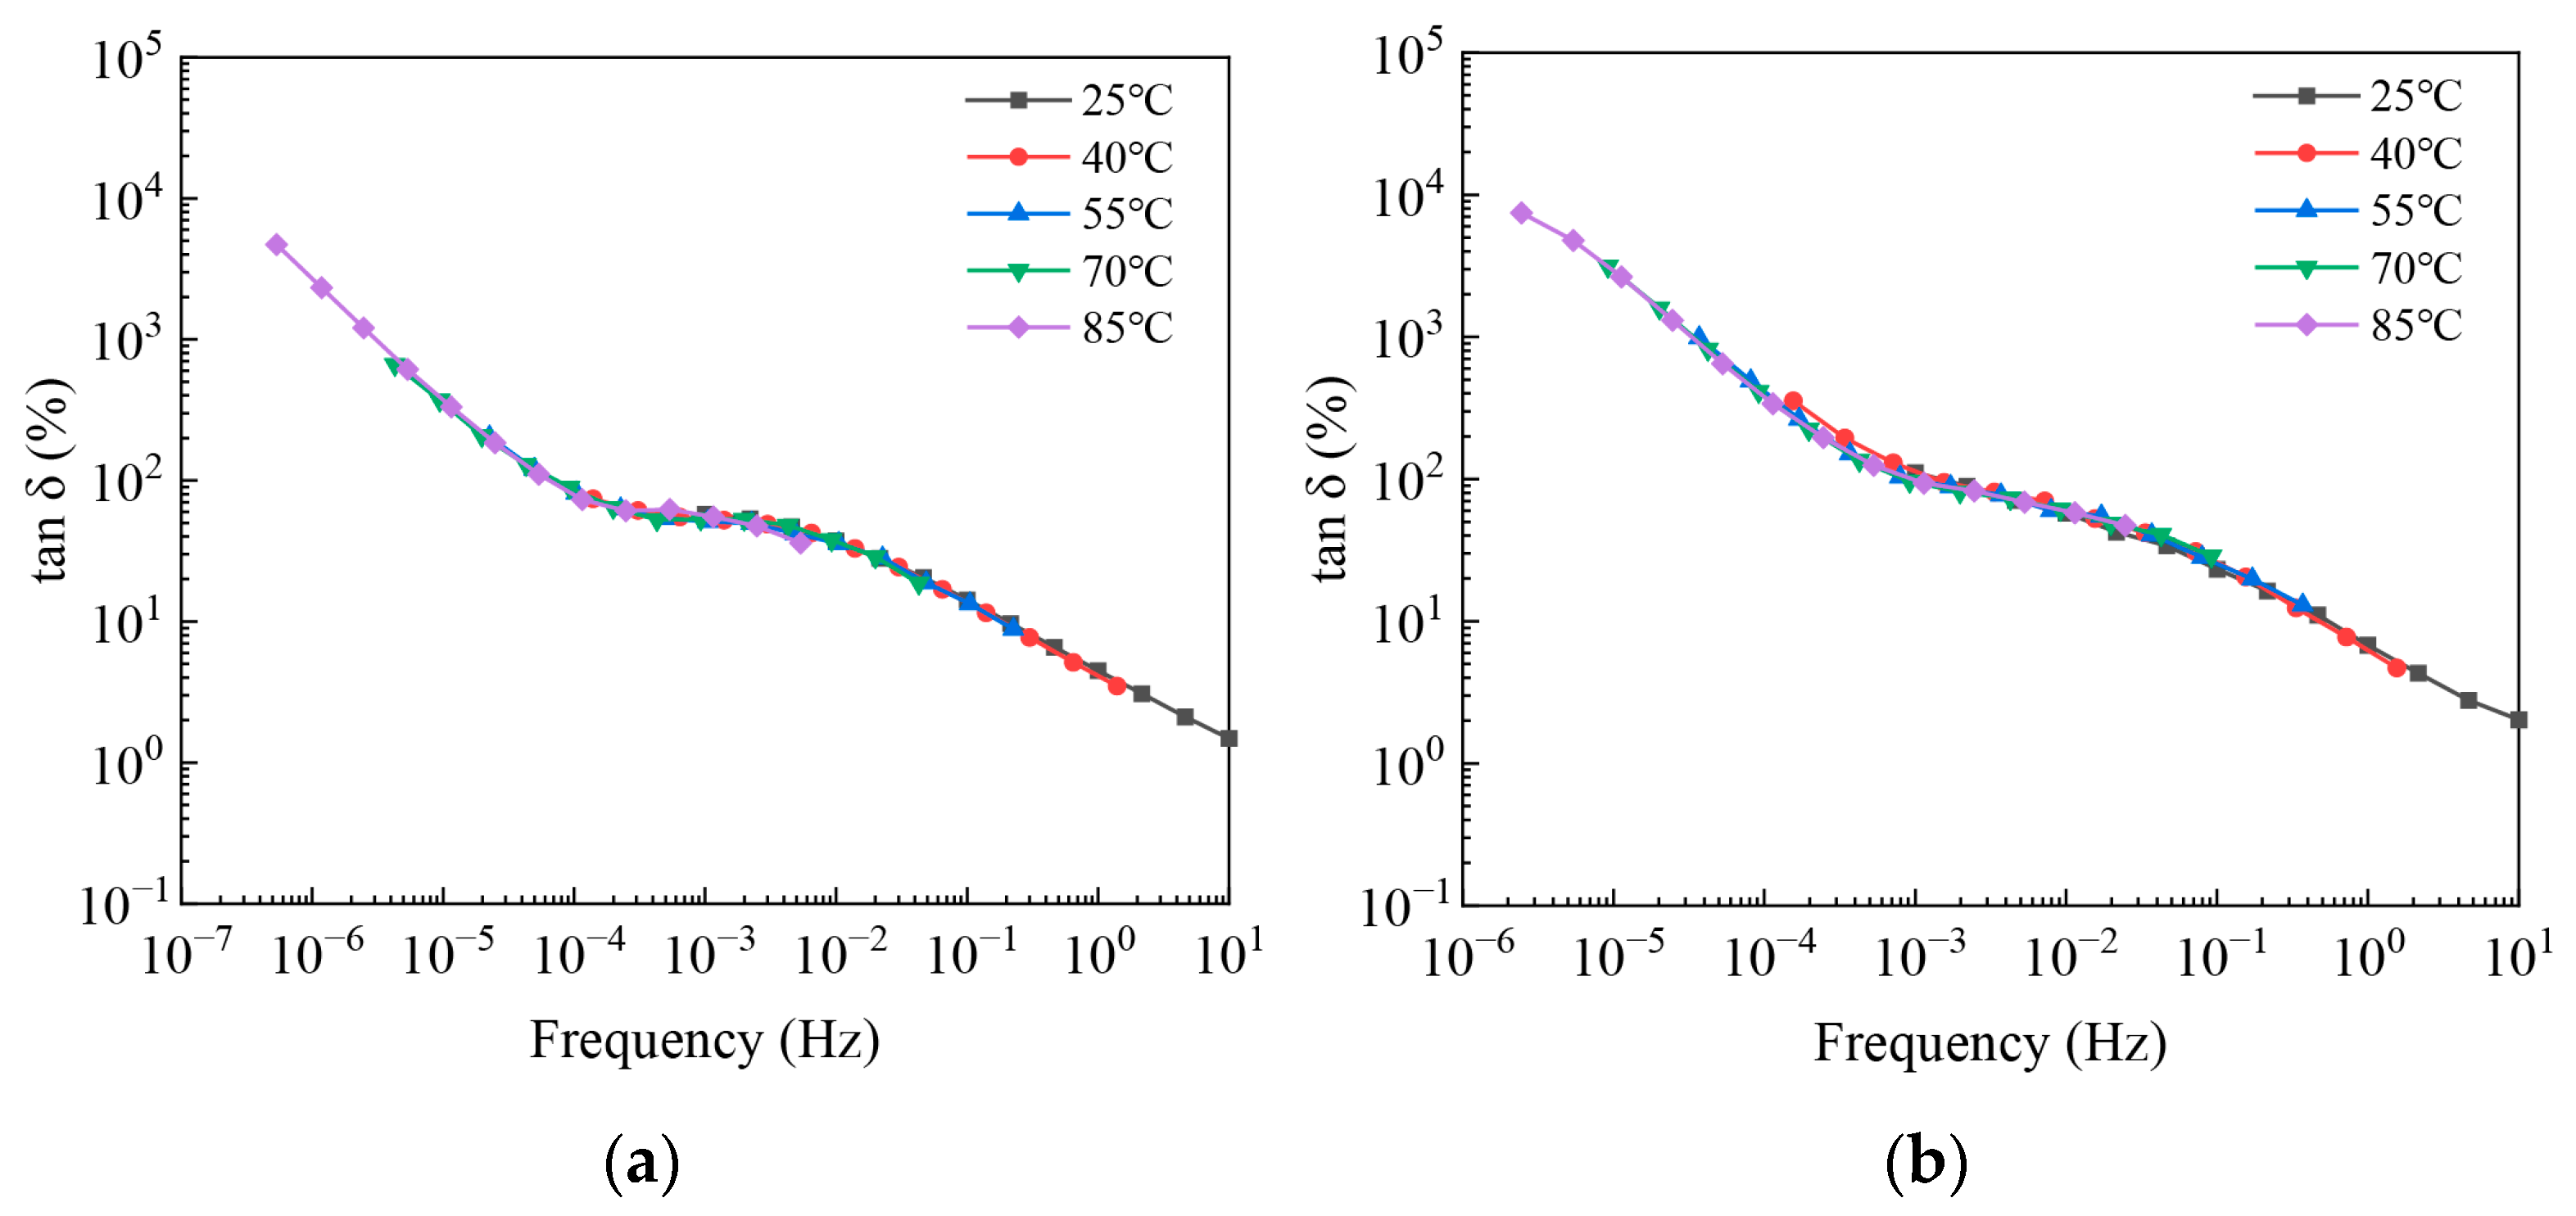
However, as the water content increases, this phenomenon gradually disappears, and Figure 11 shows the curve after temperature translation of the moistened casing. It can be seen that the “temperature drift” on the dielectric spectral curve of the dry casing is not obvious on the spot. Instead, the translated curve has a better degree of overlap, indicating that the temperature characteristics of various polarizations on this casing are relatively consistent. This feature indicates that the simple frequency–temperature translation method may not be applicable to oil-pressboard insulating samples.
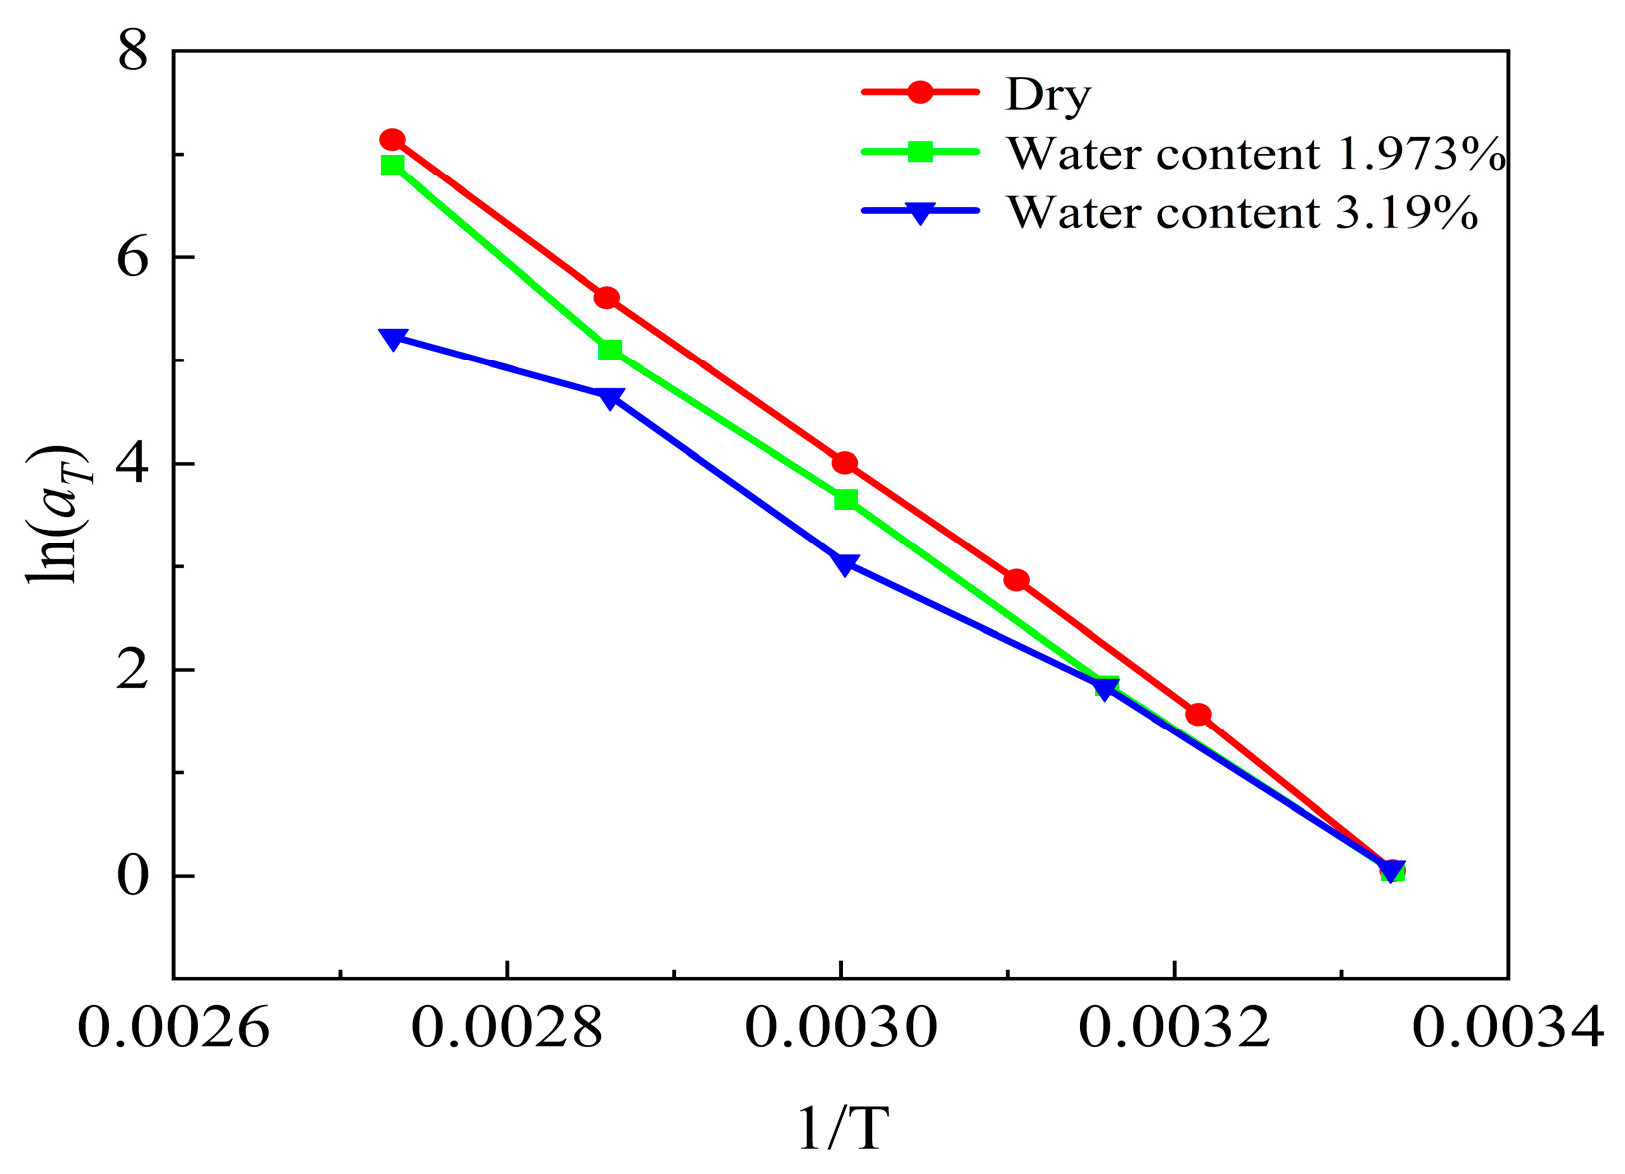
To quantitatively evaluate the time–temperature superposition behavior, the temperature shift factor a T was extracted using 25 °C as the reference temperature. In the adopted horizontal translation, the shifted frequency satisfies f′ = f/aT. The extracted aT values for the dry bushing and the two moist bushings are listed in Table 4. Figure 12 shows the corresponding ln(aT) versus 1/T plots, which enable a direct quantitative comparison between dry and moist conditions. It can be observed that the moist samples exhibit a more consistent ln(aT) − 1/T trend than the dry sample, indicating that the apparent temperature dependence becomes more regular when moisture-related conduction/interfacial polarization dominates in the measured band. In contrast, the dry sample shows poorer superposition quality, which supports that multiple mechanisms contribute simultaneously and a single horizontal shift may not strictly capture the full-band response.

4.4. Analysis of Dielectric Spectral Characteristics in the Frequency Domain at Different Voltages

To explore the dielectric spectrum characteristics of oil-pressboard insulating bushings at different voltages, test voltages of 200 V, 1 kV, 2 kV, 5 kV, and 10 kV were selected, and the step-up sequence was continuous step-up.
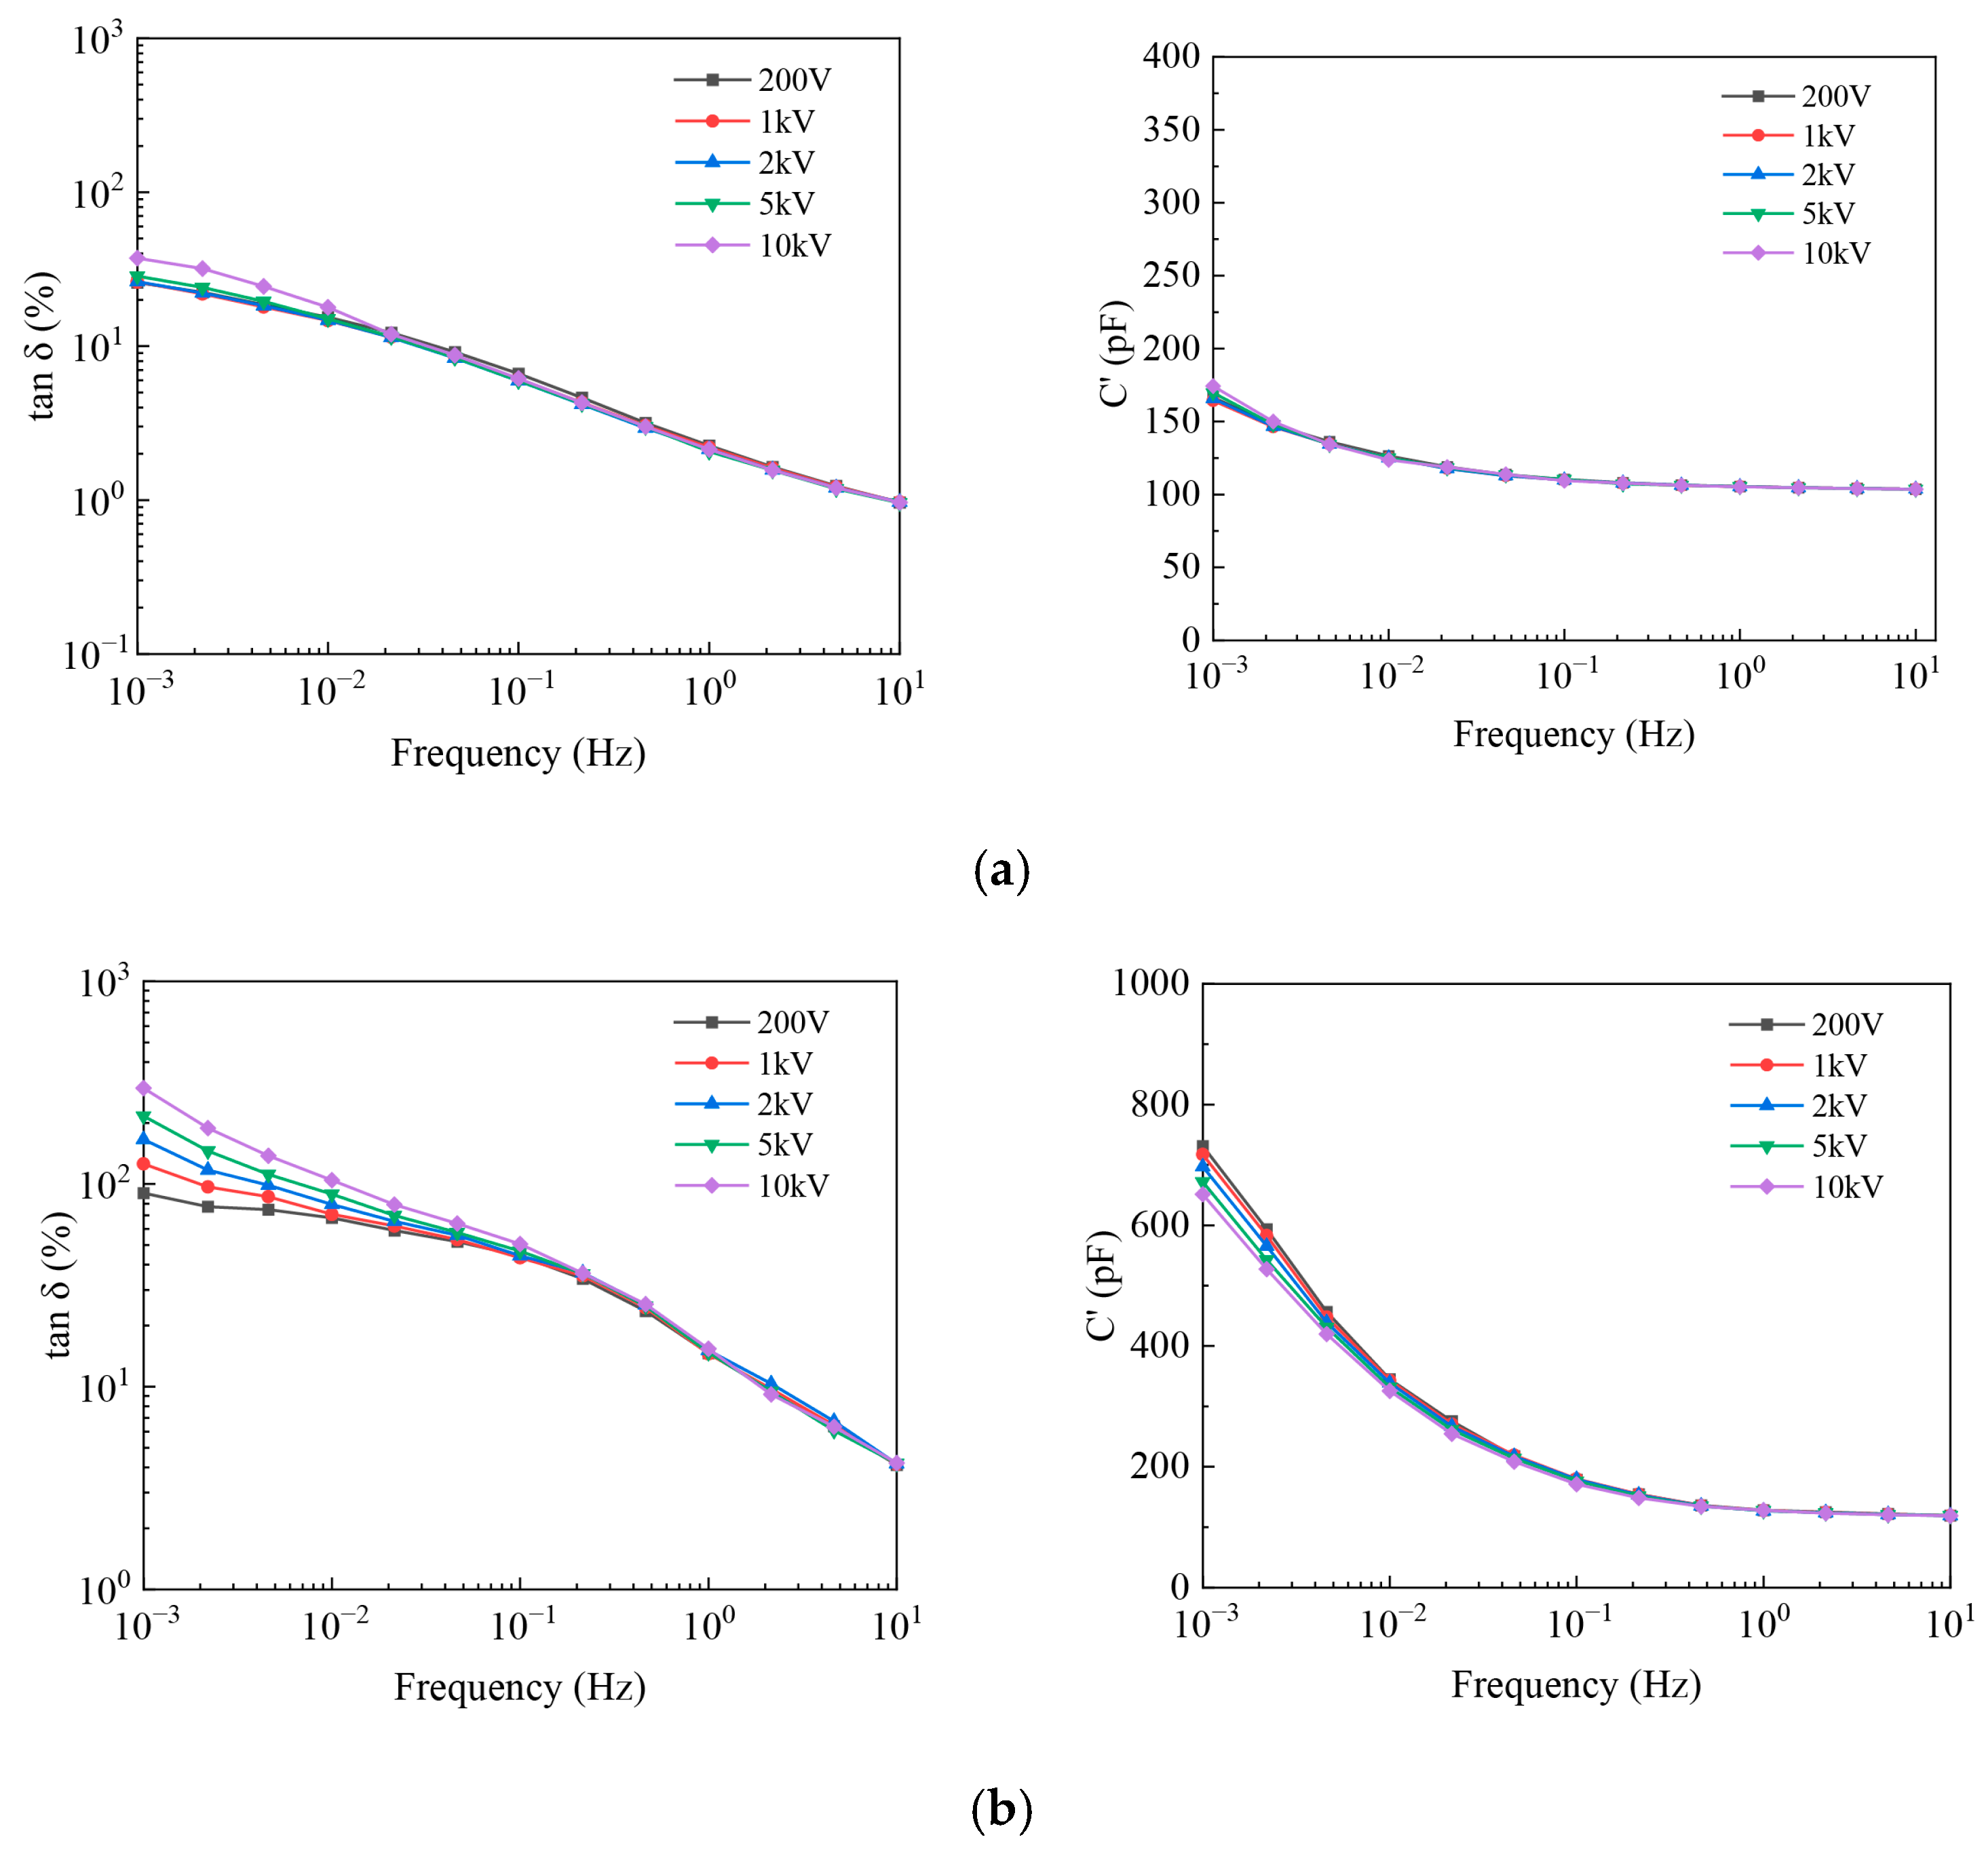
Figure 13 shows the dielectric spectrum curves of oil-pressboard insulation bushings with moisture contents of 1.344% and 3.93% under different voltages. It can be seen from the figure that as the test voltage increases, the dielectric loss curve of the bushing rises significantly at low frequencies, with the highest curve at 10 kV. The real part of the complex capacitance does not show a distinct pattern with the voltage increase, but the imaginary part shows a consistent pattern with the dielectric loss curve. By comparing the test results for moisture contents of 1.344% and 3.93%, it can be observed that, as the moisture level increases, the voltage-dependent characteristic frequencies in the dielectric spectrum gradually shift toward higher frequencies.
From a physical perspective, the voltage-induced increase of tanδ in the low-frequency range can be attributed to the field-dependent electrical response of the oil-pressboard insulation system: (i) field-enhanced conduction, where a higher electric field promotes charge carrier transport and increases the effective conductivity contribution that dominates low-frequency loss; (ii) space charge accumulation and interfacial effects in the heterogeneous oil-pressboard structure, where charge injection/accumulation at interfaces may distort local fields and enhance interfacial polarization loss; (iii) trap-assisted hopping and Poole–Frenkel-type field-assisted detrapping, where moisture and aging modify trap density/depth in cellulose, and a stronger field increases detrapping probability, leading to higher conduction-related loss; and (iv) nonlinear dielectric behavior in heterogeneous dielectrics, where interface polarization and material heterogeneity may cause an amplitude-dependent response, especially under severe moisture/aging conditions.
The dielectric loss values under different insulation conditions were analyzed using 0.001 Hz and 0.01 Hz as characteristic frequencies to investigate the relationship between dielectric loss and test voltage. It should be noted that the field-dependent response is generally nonlinear; however, within the tested voltage range (200 V–10 kV) and at the selected characteristic frequencies, the observed voltage dependence can be well approximated by a first-order linear relationship for quantifying sensitivity. The results are presented in Table 5. Four representative insulation states were selected for fitting analysis, including unaged and dry bushings with moisture content of 0.598%, severely moist unaged bushings with moisture content of 3.93%, severely aged and dry bushings with moisture content of 0.731%, and severely aged and severely moist bushings with moisture content of 4.121%. The fitting results show that when the insulation condition is good, namely for unaged and dry bushings, the dielectric loss at 0.01 Hz does not exhibit a clear linear increasing trend, whereas a strong linear relationship is observed at 0.001 Hz, with the goodness of fit exceeding 0.96. When the insulation condition deteriorates, a good linear growth relationship appears earlier at 0.01 Hz, with the goodness of fit exceeding 0.97. These results indicate that when a higher test voltage is applied, the characteristic information of insulation degradation can be detected earlier, which facilitates faster identification of the insulation deterioration state of the bushing.

5. Conclusions

This study developed a 10 kV high-voltage FDS measurement system and conducted systematic FDS tests on bushing test models with different insulation states. The experiments were performed on 26 kV oil-pressboard insulating bushings over a frequency range of 0.001 Hz to 10 Hz. The core findings are summarized as follows:
  • Performance of the developed measurement system: The independently designed 10 kV high-voltage FDS system has excellent stability and accuracy, with the dielectric loss factor (tanδ) standard deviation at each frequency point on the 10−4 order and the maximum relative error controlled within 5%, providing a reliable experimental platform for the high-voltage dielectric spectrum test of power insulation equipment.
  • Quantified influence of moisture and aging: Both moisture and thermal aging significantly increase the bushing’s dielectric loss across the entire frequency band, with the most obvious effect in the low-frequency band. The dielectric loss of unaged bushings at 0.001 Hz rises by up to 79.04% at a moisture content of 3.93%; bushings with ~1.3% moisture content see a more than 40% increase in full-band dielectric loss after 28 days of 130 °C accelerated thermal aging due to enhanced polarization from polar aging by-products.
  • Temperature regulation mechanism of FDS characteristics: The bushing’s FDS curve shifts entirely to higher frequencies with increasing test temperature (25~85 °C), with low-frequency dielectric loss increasing by about 50%. Dry bushings show poor FDS curve superposition after frequency–temperature translation due to multiple polarization mechanisms, while damp bushings have well-overlapping translated curves with consistent polarization temperature characteristics.
  • Voltage-dependent dielectric response characteristics: The dielectric spectrum of oil-pressboard bushings exhibits obvious voltage-dependent behavior. For bushings without insulation defects, the dielectric spectrum shows no significant variation with increasing excitation voltage. In contrast, bushings with insulation deterioration demonstrate a clear linear increasing trend of low-frequency dielectric loss with rising test voltage.
  • Engineering implications and follow-up research: This study quantifies the dielectric loss variation and characteristic frequency shift of bushings under different insulation states, providing a quantitative reference for on-site defect diagnosis, with voltage-dependent characteristic frequency and low-frequency dielectric loss growth rate as key diagnostic indicators for aging and moisture coupling defects. Subsequent research will expand the test frequency range to 10 Hz~1 kHz, conduct on-site tests on 110 kV and above bushings, simulate electrical-mechanical-thermal coupling aging, and establish a quantitative FDS defect diagnosis model to realize intelligent insulation state diagnosis of oil-pressboard insulating bushings.

Author Contributions

Conceptualization, C.G. and B.Q.; methodology, C.G.; software, Y.M.; validation, H.L., D.C., and G.L.; formal analysis, Z.N.; investigation, M.H.; resources, Z.N.; data curation, M.H.; writing—original draft preparation, M.H.; writing—review and editing, C.G. and Y.M.; visualization, Y.M.; supervision, C.G.; project administration, Z.N.; funding acquisition, Z.N. All authors have read and agreed to the published version of the manuscript.

Funding

This research was funded by the Science and Technology Project of State Grid Corporation of China (Research on Low-Frequency On-Site Testing Technology and Equipment Development for Substation Electrical Equipment, 52018K25000G).

Data Availability Statement

The raw data supporting the conclusions of this article will be made available by the authors on request.

Conflicts of Interest

Authors Huan Li, Deliang Cheng, and Guangwei Liu were employed by the company State Grid Jibei Electric Power Research Institute. Author Zheng Niu was employed by the company State Grid Jibei Electric Power Co., Ltd. The remaining author declares that the research was conducted in the absence of any commercial or financial relationships that could be construed as a potential conflict of interest. The company was not involved in the study design, analysis, interpretation of data, the writing of this article, or the decision to submit it for publication.

References

  1. Yang, L.; Chen, J.; Wang, S.; Gao, J. Dielectric response measurement of oil-pressboard insulation based on system identification and its time-frequency-domain conversion method. IEEE Trans. Dielectr. Electr. Insul. 2018, 25, 1688–1698. [Google Scholar] [CrossRef]
  2. Ojha, S.K.; Purkait, P.; Chakravorti, S. Evaluating the Effects of Temperature on Moisture Dynamics and Relaxation Mechanism in Transformer Oil-pressboard Insulation. IEEE Trans. Dielectr. Electr. Insul. 2024, 31, 151–159. [Google Scholar] [CrossRef]
  3. Hu, Y.; Dong, M.; Song, B.; Xia, C.; Xie, J.; Liu, Y. Parameters Extraction and Mechanism Analysis of the Moisture in Oil–Paper Based on the Spectral Decomposition of Dielectric Response. IEEE Trans. Dielectr. Electr. Insul. 2022, 29, 1441–1449. [Google Scholar] [CrossRef]
  4. Hu, Y.; Chang, H.; Chen, J.; Wu, Q.; Zhang, C.; Dong, M. An Experimental Study of the Dynamic Characteristics of the Short-gap and Low-energy Arcs in Insulating Oil. In IEEE Transactions on Dielectrics and Electrical Insulation; IEEE: New York, NY, USA, 2025. [Google Scholar] [CrossRef]
  5. Fofana, I.; Hemmatjou, H.; Meghnefi, F.; Farzaneh, M.; Setayeshmehr, A.; Borsi, H. On the Frequency Domain Dielectric Response of Oil-Paper Insulation at Low Temperatures. IEEE Trans. Dielectr. Electr. Insul. 2010, 17, 799–807. [Google Scholar] [CrossRef]
  6. Ye, W.; Hao, J.; Gao, C.; Qiao, X.; Zhang, J.; Liao, R. Molecular Mechanism Analysis of Multicomponent Mixed Insulating Oil Improving Lightning Impulse Discharge Characteristics of Oil-Impregnated Paper. IEEE Trans. Dielectr. Electr. Insul. 2025, 32, 1615–1622. [Google Scholar] [CrossRef]
  7. Yang, L.; Zou, T.; Deng, B.; Zhang, H.; Mo, Y.; Peng, P. Assessment of Oil-pressboard Insulation Aging Using Frequency Domain Spectroscopy and Moisture Equilibrium Curves. IEEE Access 2019, 7, 45670–45678. [Google Scholar] [CrossRef]
  8. Bundschuh, J.; Späck-Leigsnering, Y.; De Gersem, H. Considering Capacitive Effects in Foil Winding Homogenization. IEEE J. Multiscale Multiphys. Comput. Tech. 2024, 9, 179–187. [Google Scholar] [CrossRef]
  9. Farade, R.A.; Abdul Wahab, N.I.; Mansour, D.E.A.; Azis, N.B.; Jasni, J.B.; Veerasamy, V. The Effect of Interfacial Zone Due to Nanoparticle–Surfactant Interaction on Dielectric Properties of Vegetable Oil Based Nanofluids. IEEE Access 2021, 9, 107033–107045. [Google Scholar] [CrossRef]
  10. Liang, Z.; Sun, Y.; Cheng, H.; Zhang, N.; Li, B.; Liu, Y.; Fang, Y.; Zhang, Y. A comprehensive evaluation method for moisture and aging state of oil-immersed paper bushings based on dielectric modulus and K-nearest neighbor algorithm. Front. Energy Res. 2024, 11, 1348433. [Google Scholar] [CrossRef]
  11. Bundschuh, J.; Späck-Leigsnering, Y.; De Gersem, H. Foil Winding Homogenization with Consideration of Capacitive Effects. In Proceedings of the 2024 IEEE 21st Biennial Conference on Electromagnetic Field Computation (CEFC), Jeju, Republic of Korea, 2–5 June 2024; pp. 1–2. [Google Scholar] [CrossRef]
  12. Li, Z.; He, D.; Ren, F.; Li, S.; Wu, H.; Sun, Y. Effect of Temperature on the Internal Electric Field Distribution and Discharge Mechanism of Converter Transformer Under AC–DC Composite Voltage. IEEE Trans. Dielectr. Electr. Insul. 2025, 32, 1084–1093. [Google Scholar] [CrossRef]
  13. Lyutikova, M.N.; Korobeynikov, S.M.; Ridel, A.V. Method for Reducing Sediment Formation in Transformer Oil. IEEE Trans. Dielectr. Electr. Insul. 2024, 31, 2208–2215. [Google Scholar] [CrossRef]
  14. Du, L.; Feng, H.; He, P.; Yang, F.; Zhang, Z. Effects of Temperature and Moisture Content on the Enhancement of Dielectric Loss of OIP Bushings Under Harmonic Voltages. IEEE Trans. Dielectr. Electr. Insul. 2024, 31, 1103–1109. [Google Scholar] [CrossRef]
  15. Nasr, A.M.H.; Nashashibi, A.Y.; Sarabandi, K. Ultrawideband Characterization of Complex Dielectric Constant of Planar Materials for 5G Applications. IEEE Trans. Instrum. Meas. 2021, 70, 1–11. [Google Scholar] [CrossRef]
  16. Scheler, M.; Rossner, M.; Reissenweber, L.; Berger, F.; Prucker, U.; Hopf, A. Potential Distribution in the Bushing Core of a Solid-Gas Insulated High Voltage Bushing in the Very Low Frequency Region Under the Effect of a Temperature Gradient. In Proceedings of the 2018 IEEE Electrical Insulation Conference (EIC), San Antonio, TX, USA, 17–20 June 2018; pp. 504–507. [Google Scholar] [CrossRef]
  17. Rahman, O.; Islam, T.; Khera, N.; Khan, S.A. A Novel Application of the Cross-Capacitive Sensor in Real-Time Condition Monitoring of Transformer Oil. IEEE Trans. Instrum. Meas. 2021, 70, 1–12. [Google Scholar] [CrossRef]
  18. Neshatvar, N.; Langlois, P.; Demosthenous, A. A Non-Linear Feedback Current Driver With Automatic Phase Compensation for Bioimpedance Applications. IEEE Trans. Circuits Syst. II Express Briefs 2018, 65, 1340–1344. [Google Scholar] [CrossRef]
  19. He, Y.; Zhang, S.; Lu, Z.; Fang, S.; Liu, H. Analysis and Modeling of the Nonlinear Characteristics of the Insulation Medium in Capacitor Cores and the Electric Thermal Coupling Mechanism of the Main Insulation Structure of High-Voltage Bushings. IEEE Access 2025, 13, 64976–64990. [Google Scholar] [CrossRef]
  20. Xiaozhou, F.; Zekun, S.; Xinwei, Z.; Hanwen, B.; Hai, X.; Fangcheng, L. Impregnation Model and Experimental Study of Mineral Oil/Meta-Aramid Paper Combination Insulation. IEEE Trans. Dielectr. Electr. Insul. 2024, 31, 2003–2012. [Google Scholar] [CrossRef]
  21. Farade, R.A.; Abdul Wahab, N.I.; Said, Z.; Khan, T.M.Y.; Saleel, C.A. Toward green and sustainable dielectric nanofluids: Surfactant impacts on stability, properties, and regulations. Adv. Colloid Interface Sci. 2025, 346, 103668. [Google Scholar] [CrossRef] [PubMed]
  22. Greaves, B.; Prevost, T.; Casserly, E.; Burk, G.; Niroula, A. Water Solubility of Aged Mineral Oil and Natural Ester Liquids. In Proceedings of the 2023 IEEE 22nd International Conference on Dielectric Liquids (ICDL), Worcester, MA, USA, 25–28 June 2023; pp. 1–5. [Google Scholar] [CrossRef]
  23. Fasani, D.; D’Avanzo, G.; Villa, A.; Sozzi, M.; Barbieri, L.; Palladini, D. Experimental Analysis of Aging of a Dry Transformer: Comparison of Two Methods for PD Measurements. IEEE Trans. Dielectr. Electr. Insul. 2025, 32, 1719–1727. [Google Scholar] [CrossRef]
  24. Mishra, D.; Baral, A.; Chakravorti, S. Reliable Assessment of Oil-Paper Insulation Used in Power Transformer Using Concise Dielectric Response Measurement. IEEE Trans. Dielectr. Electr. Insul. 2023, 30, 1255–1264. [Google Scholar] [CrossRef]
  25. Zhang, D.; Zhao, H.; Yun, H.; Liu, X.; Han, Y.; Mu, H.; Zhang, G. Study on FDS characteristics of oil-immersed paper insulation bushing under non-uniform moisture content. IET Sci. Meas. Technol. 2018, 12, 465–473. [Google Scholar] [CrossRef]
  26. IEC 60137:2017; Insulated Bushings for Alternating Voltages Above 1000 V. International Electrotechnical Commission (IEC): Geneva, Switzerland, 2017.
Figure 1. Principle of frequency-domain dielectric spectroscopy measurement: (a) schematic diagram of the main insulation of oil-pressboard insulating bushings; (b) schematic diagram of frequency-domain dielectric spectrum measurement.
Processes 14 00864 g001
Figure 2. High-voltage frequency-domain dielectric spectroscopy measurement system: (a) photograph of the measurement setup; (b) hardware structure diagram.
Processes 14 00864 g002
Figure 3. High-voltage frequency-domain dielectric spectroscopy system stability test results: (a) model of 26 kV oil-pressboard insulating bushing; (b) test results of high-voltage frequency-domain dielectric spectrum.
Processes 14 00864 g003
Figure 4. High-voltage frequency-domain dielectric spectroscopy system accuracy test results (a) Single-layer oil-impregnated cardboard sample; (b) test results of high-voltage frequency-domain dielectric spectroscopy.
Processes 14 00864 g004
Figure 5. Moisture content distribution of oil-pressboard insulating bushing samples under different aging times (0 d, 7 d, 14 d, 21 d, 28 d).
Processes 14 00864 g005
Figure 6. Dielectric spectrum tanδ-f curves of unaged, different moisture content oil-pressboard insulating bushings.
Processes 14 00864 g006
Figure 7. Complex capacitance curves of unaged, different moisture content oil-pressboard insulating bushings (a) C′-f curve; (b) C″-f curve.
Processes 14 00864 g007
Figure 8. Dielectric spectrum curves of oil-pressboard insulating bushings with different aging times (a) tanδ-f curve; (b) C′-f curve; (c) C″-f curve.
Processes 14 00864 g008
Figure 9. Dielectric spectrum curves of oil-pressboard insulating bushings at different temperatures. (a) C′-f curve; (b) C″-f curve.
Processes 14 00864 g009
Figure 10. FDS curve after temperature translation of the drying casing.
Processes 14 00864 g010
Figure 11. FDS curves of high water content bushings after temperature translation (a) water content 1.973%; (b) water content 3.19%.
Processes 14 00864 g011
Figure 12. Comparison of temperature shift factors.
Processes 14 00864 g012
Figure 13. Dielectric spectrum characteristics of two different moisture content bushings with voltage variation (a) Dielectric spectrum curve of the bushing with a water content of 1.344% varying with voltage; (b) Dielectric spectrum curve of the bushing with a water content of 3.930% varying with voltage.
Processes 14 00864 g013
Table 1. Comparison between the developed system and commercial dielectric spectroscopy system.
ParameterProposed SystemIDAX-300
Output voltage range0–10 kV0–2 kV
Frequency range0.001–10 Hz0.1 mHz–10 kHz
Current measurement resolutionpA-μA0.1 pA
Measurement inaccuracy5–10%0.5%
Field testing capabilitySupportedLimited depending on configuration
Table 2. Dielectric loss rate at characteristic frequencies.
Water Content/%0.01 Hz Dielectric Loss Change/%0.001 Hz Dielectric Loss Change/%
0.5984.2520.32
1.34421.1942.22
1.9733.5044.04
3.1915.546.44
3.9331.6779.04
Table 3. Dielectric loss factor at different aging days.
Aging Days/%0.01 Hz Dielectric Loss Change/%0.001 Hz Dielectric Loss Change/%
02.89216.94
146.81526.15
2130.2698.60
2839.02205.04
Table 4. Extracted temperature shift factors aT (reference temperature: 25 °C).
Temperature/°CaT
DryWater Content 1.973%Water Content 3.19%
251.0001.0001.000
354.893
406.5756.439
4519.387
5563.49443.34423.224
70341.763203.894123.759
851723.4301334.932230.205
Table 5. Relationship between dielectric loss and test voltage under different insulation states of bushings.
Aging Time (Days)Moisture Content (%)0.01 Hz0.001 Hz
00.598Processes 14 00864 i001Processes 14 00864 i002
03.930Processes 14 00864 i003Processes 14 00864 i004
280.731Processes 14 00864 i005Processes 14 00864 i006
284.121Processes 14 00864 i007Processes 14 00864 i008
Disclaimer/Publisher’s Note: The statements, opinions and data contained in all publications are solely those of the individual author(s) and contributor(s) and not of MDPI and/or the editor(s). MDPI and/or the editor(s) disclaim responsibility for any injury to people or property resulting from any ideas, methods, instructions or products referred to in the content.