Article

Consequence Assessment of a 440 L Propylene Y-Cylinder Gas Cabinet in Semiconductor Gas Supply Systems
1
Department of Environmental Engineering, Ajou University, Suwon 16499, Republic of Korea
2
Safety, Health and Environment Policy Research and Development Department, SK Hynix, Icheon 17336, Republic of Korea
3
Department of Environmental and Safety Engineering, Ajou University, Suwon 16499, Republic of Korea
*
Author to whom correspondence should be addressed.
†
These authors contributed equally to this work.
Processes 2026, 14(20), 3223; https://doi.org/10.3390/pr14203223
Submission received: 4 August 2026 / Revised: 1 October 2026 / Accepted: 2 October 2026 / Published: 9 October 2026

Abstract

The use of propylene (C3H6) in semiconductor manufacturing processes is increasing, and conventional 47 L cylinder supply systems are recognized as a primary source of leakage accidents associated with human error due to the need for frequent manual cylinder replacement. In this study, a Computational Fluid Dynamics (CFD)-based dispersion analysis and a preliminary accident consequence assessment—based on explicitly stated assumptions—were conducted for a gas cabinet housing a 440 L Y-type propylene cylinder. The potential for Vapor Cloud Explosion (VCE) was analyzed using a TNT equivalence model that accounts for the internal volume of the semi-enclosed cabinet. Pressure Vessel Burst (PVB) was evaluated using the Brode–Baker–Tang approach, while the fireball resulting from a Boiling Liquid Expanding Vapor Explosion (BLEVE) was assessed using the EFFECTS software. Under emergency ventilation conditions, the steady-state volume of the flammable gas cloud exceeding the Lower Flammability Limit (LFL) was calculated to be 6.9 m3, representing less than 0.2% of the total indoor volume. The distance corresponding to an overpressure of 1 psi was estimated to be 12.0 m for PVB and 13.6 m for VCE. Additionally, assuming that the entire 185 kg inventory participates in fireball formation, the distance corresponding to a radiant heat flux of 5 kW/m2 was calculated to be 104 m. However, this distance represents an upper bound solely with respect to the fraction of material participating in fireball formation and does not account for other input variables in the fireball model. The presented results represent a preliminary consequence analysis based on the specified assumptions. Some of the applied assumptions are conservative; for instance, a constant leak rate and complete participation of the stored inventory in fireball formation were assumed. Conversely, the neglect of liquid pool evaporation and the assumption that vessel rupture occurs at operating pressure are not conservative approaches. The analysis indicates that, while the consequences of overpressure are confined to the immediate vicinity of the gas cabinet, the extent of thermal radiation impact depends on whether accident scenarios initiated by external fires can be prevented. These findings provide consequence-based baseline data for the design of safety systems—such as emergency ventilation, gas detection, automatic shut-off, fire suppression, and protective structures—for facilities utilizing 440 L Y-type cylinders. However, these results alone do not determine whether the installation of such facilities is acceptable from a safety perspective.

1. Introduction

The semiconductor industry is experiencing a continuous increase in the consumption of specialty gases, driven by the ongoing miniaturization of devices and the expansion of production capacity. Among these gases, propylene (C3H6) is widely utilized in semiconductor manufacturing processes, and its consumption is steadily increasing [1].
Conventional gas supply systems typically employ 47 L cylinders. While these systems are widely established, the increasing demand for gas necessitates frequent cylinder replacement, resulting in operational challenges and safety concerns. Each replacement operation requires manual intervention, thereby increasing the likelihood of gas leaks caused by improper connections, valve mishandling, and other forms of human error [2]. As production volumes increase, these repetitive operations can become a significant factor contributing to overall process risk. At the facility examined in this study, the adoption of 440 L Y-type cylinders is projected to reduce the frequency of cylinder replacement operations by approximately 89%. This reduction can minimize exposure to manual replacement operations, which are associated with the potential for human-error-induced leaks. This figure was calculated based on the facility’s actual operational records for cylinder replacement; however, specific numerical data, such as annual propylene consumption and the exact number of replacement operations, have been omitted from this study due to business confidentiality. This reduction rate is consistent with the ratio of the rated propylene fill mass per cylinder (approximately 20 kg for a standard 47 L cylinder versus 185 kg for a 440 L Y-type cylinder), implying an approximately 89% reduction in cylinder replacement operations under equivalent annual consumption. However, this figure represents a reduction in the frequency of cylinder replacement operations rather than a quantitative reduction in the overall accident frequency.
Increasing cylinder capacity can significantly extend the cylinder replacement interval [3]. However, as the gas inventory stored in a single vessel increases, the amount of stored energy also increases. In the event of a leak or vessel failure, the resulting explosion or fire could cause more severe consequences than those associated with accidents involving conventional small-capacity cylinders.
Previous research has investigated gas leakage, ventilation performance, and explosion hazards in semiconductor gas cabinets; these studies include assessments of flammable gas dispersion using a combination of tracer gas testing and CFD analysis, as well as analyses of explosion loads acting on protective barriers of cylinder cabinets [4,5,6,7]. However, most of these studies have focused on conventional cylinder systems or have examined individual risk factors, such as ventilation performance, in isolation, leaving quantitative assessments of leak dispersion and explosion consequences for large-capacity Y-type cylinder gas cabinets limited. Therefore, it is necessary to quantitatively assess the potential consequences of accidents involving large-capacity Y-type cylinder systems based on clearly defined worst-case scenarios, utilizing established consequence assessment methodologies.
In this study, a multi-scenario consequence assessment—including CFD-based dispersion analysis and scenarios such as Pressure Vessel Burst (PVB), Vapor Cloud Explosion (VCE), and Boiling Liquid Expanding Vapor Explosion (BLEVE)—was conducted to quantitatively evaluate the potential accident consequences of a 440 L propylene Y-type cylinder gas cabinet.
Computational Fluid Dynamics (CFD) was applied to analyze the dispersion behavior of propylene released from the 440 L Y-type cylinder gas cabinet. The CFD geometry, ventilation boundary conditions, and process parameters were established directly from the actual design drawings and operational specifications of the facility, rather than relying on idealized or generalized models. Additionally, the ventilation characteristics of both the gas cabinet and the Bulk Specialty Gas System (BSGS) room were considered under normal and emergency operating conditions. Major accident scenarios—including PVB, VCE, and BLEVE—were evaluated through Quantitative Consequence Assessment (QCA). Based on the resulting data on explosion overpressure, thermal radiation, and flammable gas dispersion, the potential consequences of the analyzed accident scenarios were characterized. This study focuses on the magnitude of potential accident consequences under defined leakage and explosion scenarios rather than on risk estimation based on accident occurrence probabilities. Consequently, a comprehensive Probabilistic Risk Assessment—which would incorporate accident frequencies, such as those associated with leakage, ignition, and equipment failure, as well as explicit risk acceptance criteria—falls outside the scope of this study.
The results of this study provide quantitative engineering data regarding the potential consequences of accidents involving a 440 L propylene Y-cylinder gas cabinet under the examined conditions; these findings can serve as foundational information to support the design and safety assessment of large-capacity specialty gas supply systems in semiconductor manufacturing facilities.

2. Methods

2.1. Target Facility and Operational Conditions

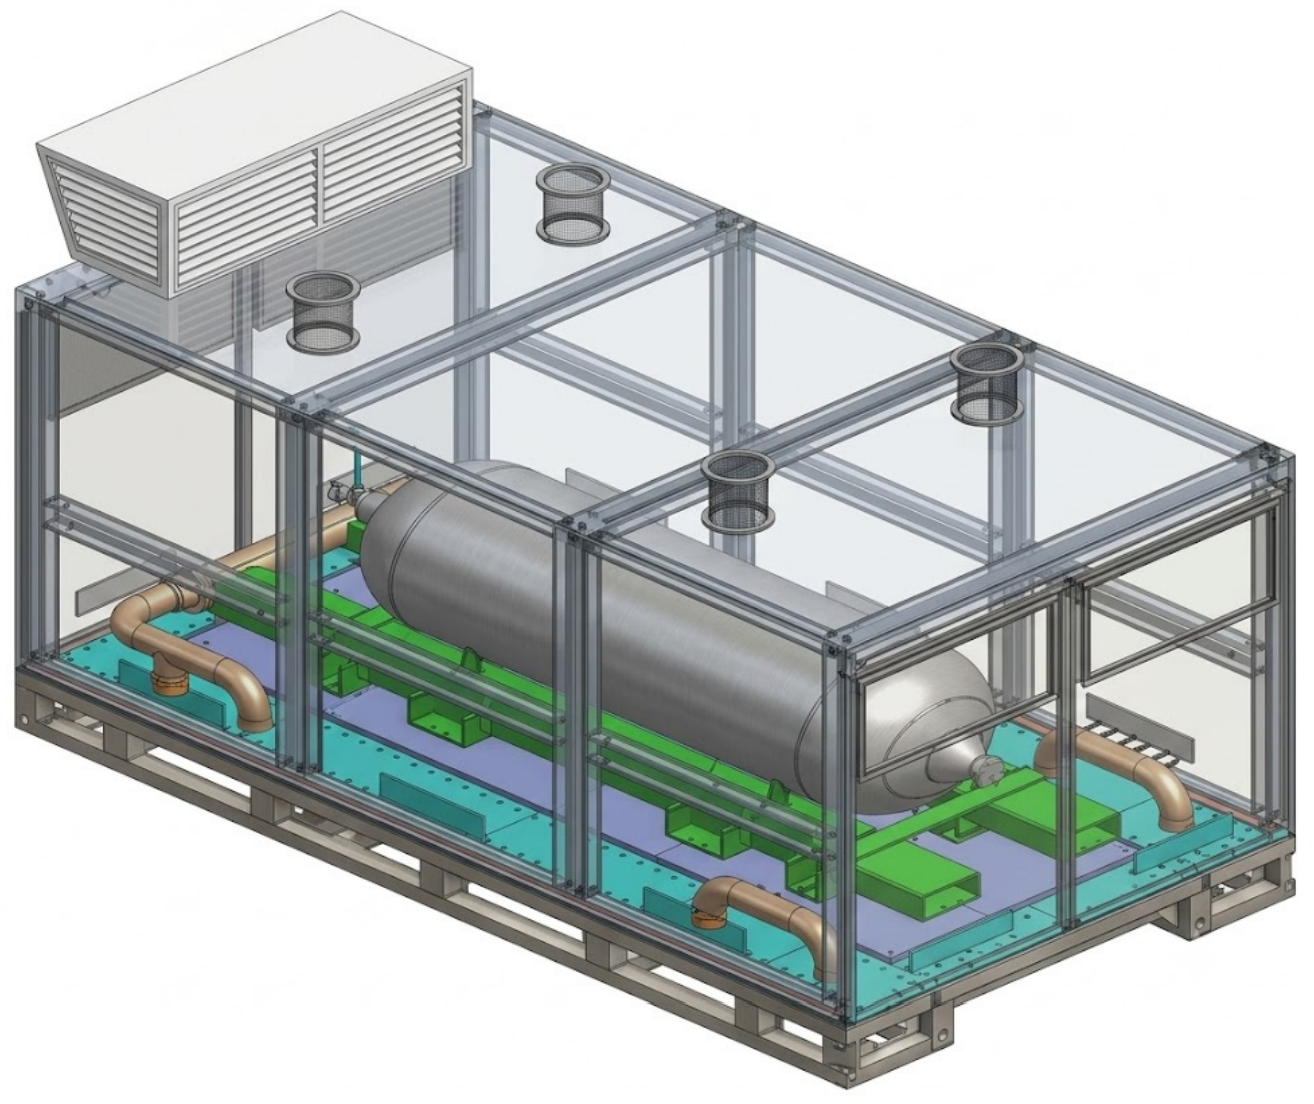
The target system is a 440 L Y-cylinder gas cabinet designed to supply propylene to semiconductor manufacturing processes. The cabinet has external dimensions of 1600 mm (W) × 2986 mm (D) × 1764 mm (H), while the installed Y-cylinder has an outer diameter of 609.6 mm and an overall length of 2115 mm (Table 1 and Figure 1).
Four 6-inch exhaust ducts are installed at the top of the cabinet to remove leaked gas. During normal operation, the cabinet is maintained at a negative pressure of −120 Pa. When a gas leak is detected, the ventilation system automatically switches to emergency mode, increasing the exhaust pressure to −200 Pa. This −200 Pa value is the emergency-mode exhaust pressure applied as the CFD boundary condition for all leak-dispersion results reported in this study (Section 3), matching the facility’s actual as-operated emergency ventilation condition.
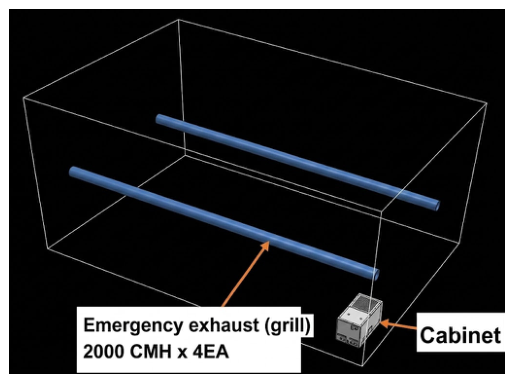
The gas cabinet is located inside a Bulk Specialty Gas System (BSGS) room measuring 24.3 m × 16.0 m × 13.5 m, corresponding to an internal volume of approximately 5000 m3. Four emergency supply and exhaust units, each rated at 2000 CMH, provide a total emergency ventilation capacity of 8000 CMH. This ventilation system is intended to limit the accumulation and dispersion of leaked gas during abnormal operating conditions [7].

2.2. Leak Scenario and Source Term Modeling

The leak scenario was established using the process conditions summarized in Table 2. The Y-cylinder was assumed to contain 185 kg of liquefied propylene (C3H6). The initial vessel pressure was set to 10.6 bar (abs.), corresponding to the saturated vapor pressure of propylene at 25 °C.
A leak through a 12.7 mm opening, equivalent to the internal diameter of a 1/2-inch tube, was selected to represent a credible worst-case pipe rupture. This corresponds to full-bore (guillotine) rupture of the largest process connection at the cylinder outlet. This leak-scenario definition was set following the outflow and risk-assessment guidance of the TNO Yellow Book [8] and the Purple Book (CPR 18E) [9]. The discharge coefficient (Cd) was assumed to be 1.0 following the recommendations of the TNO Yellow Book [8], providing a conservative estimate of the maximum release rate. Because this worst-case leak scenario is precisely the type of event that initiates the facility’s automatic transition to emergency-mode ventilation (Section 2.1), the resulting −200 Pa emergency exhaust condition—rather than the −120 Pa normal-operation value—was applied as the CFD boundary condition for the dispersion results reported in this study (Section 2.3).
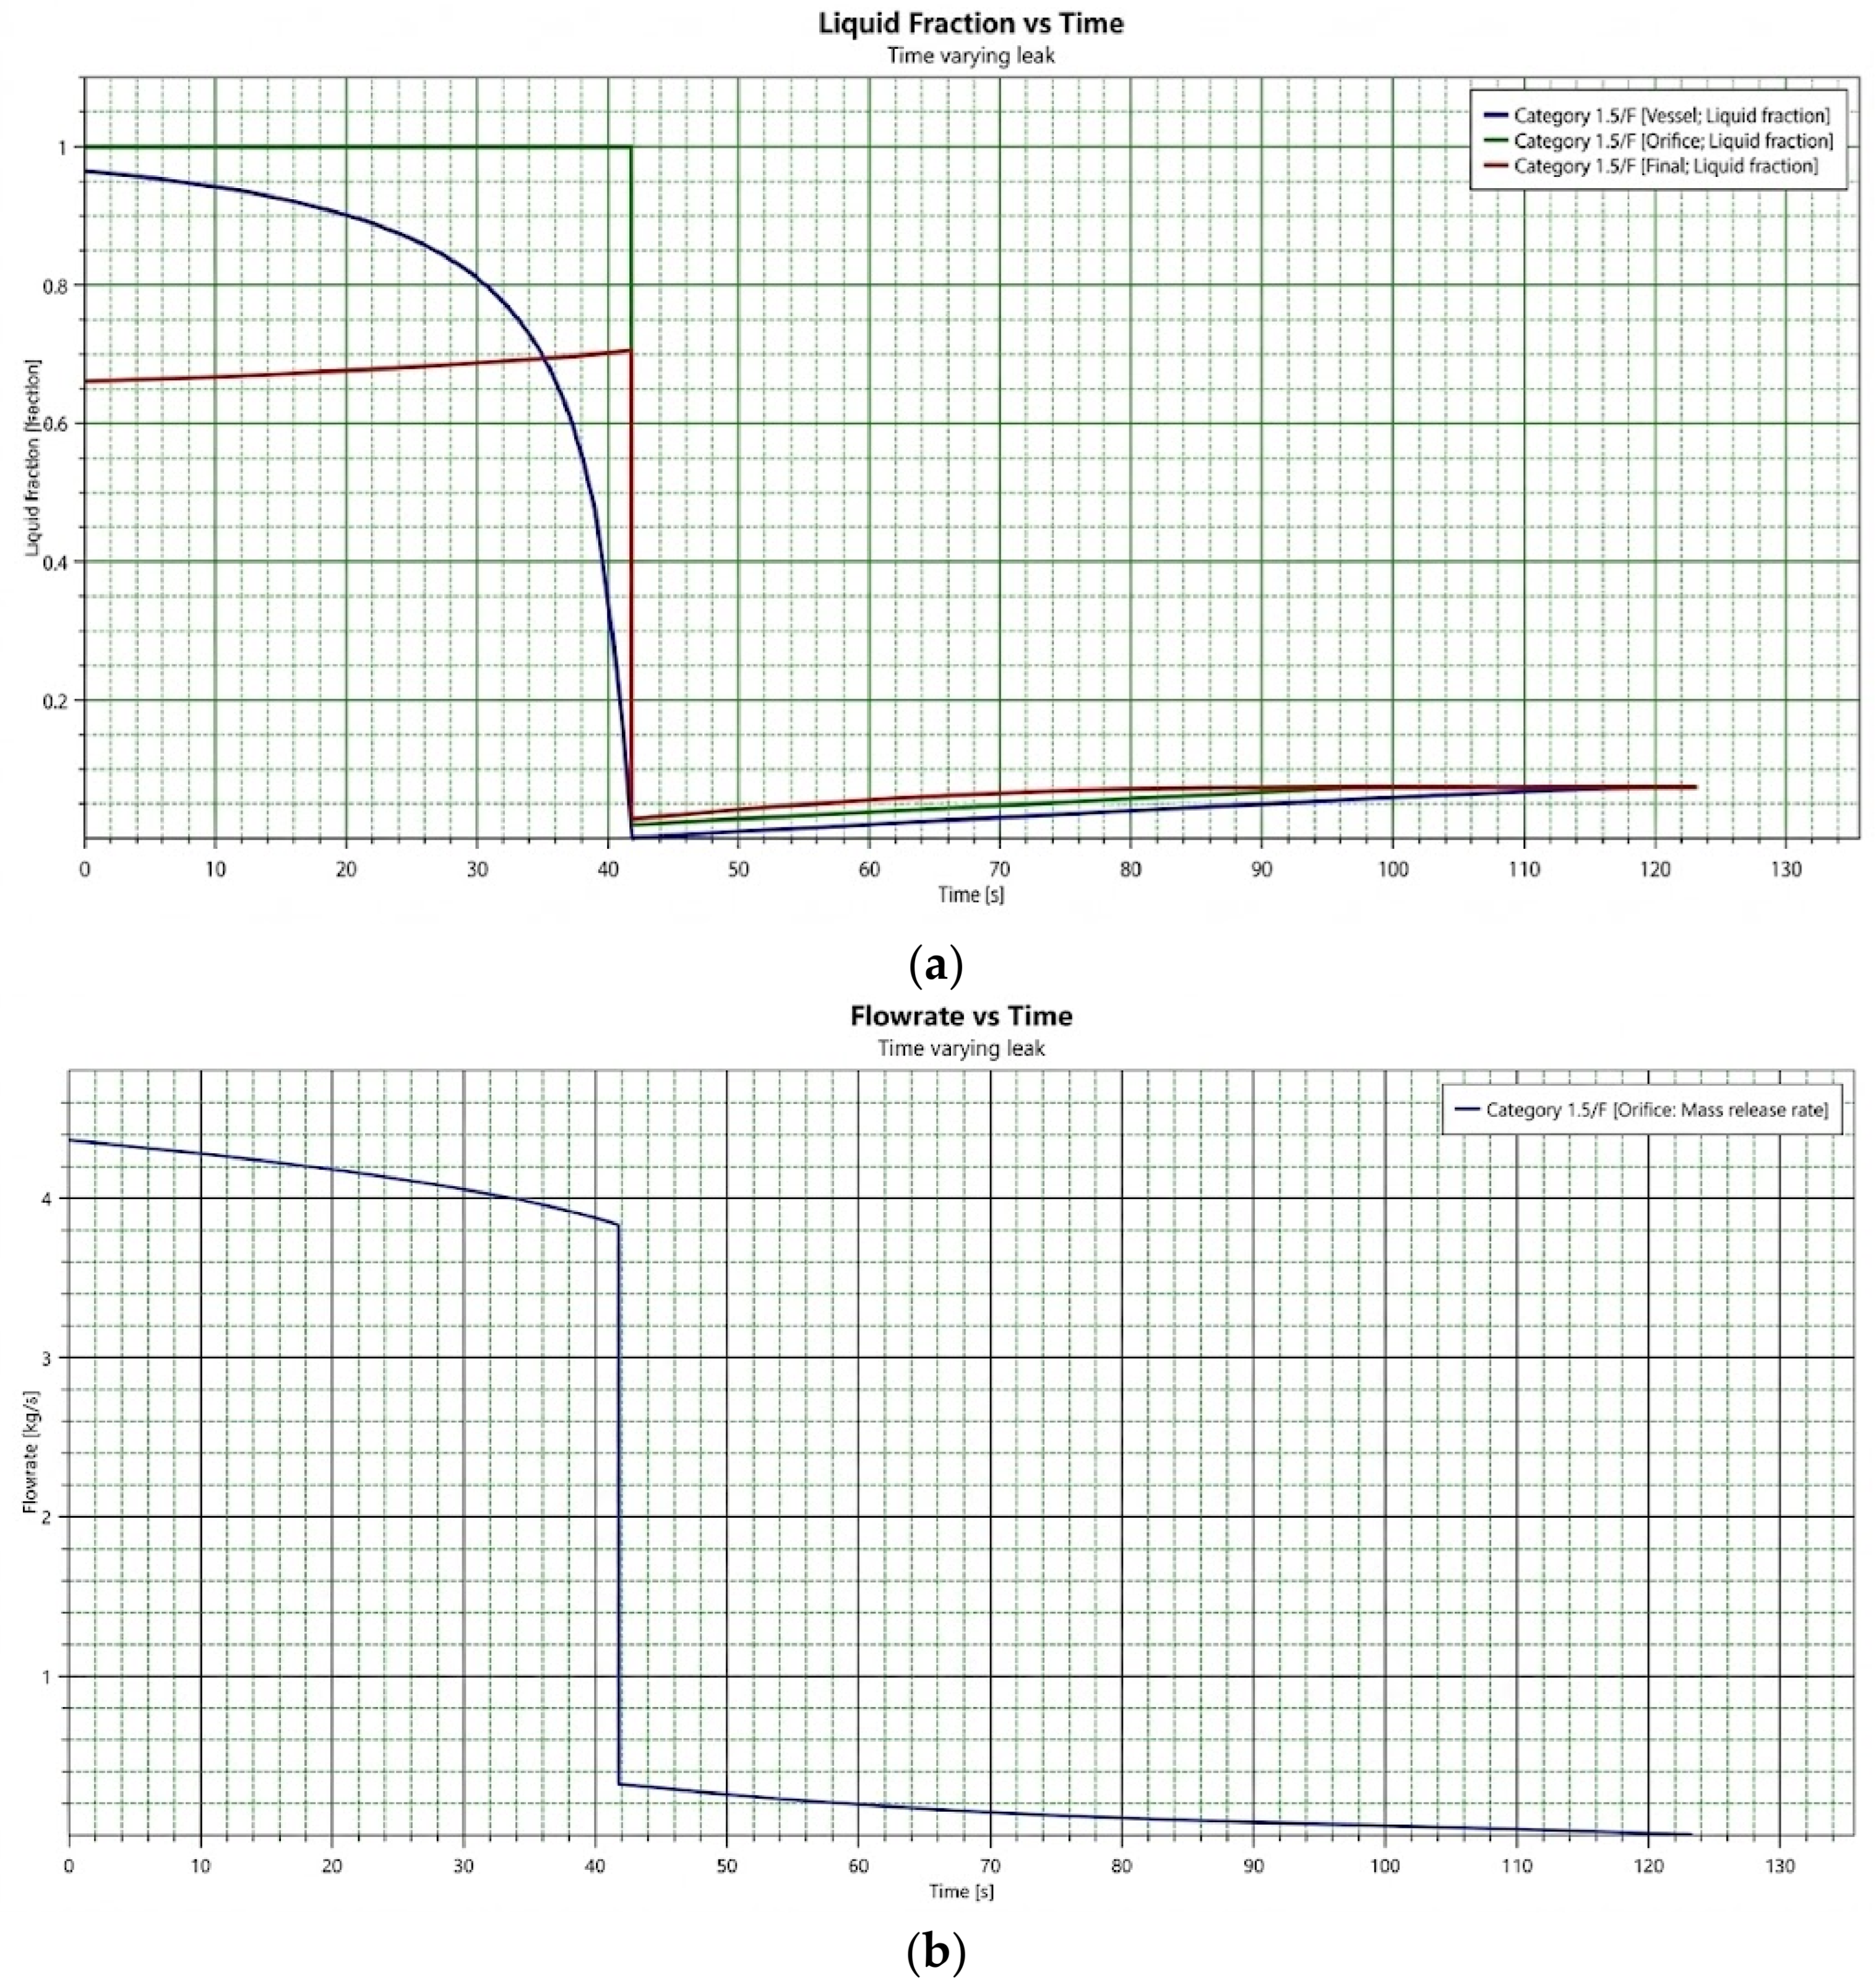
The two-phase flashing behavior of liquefied propylene following vessel depressurization was calculated using PHAST (version 8.9), yielding the transient liquid fraction and vapor fraction shown in Figure 2. Of these, only the resulting vapor-phase release rate of 1.48 kg/s was selected as the CFD source term for the dispersion simulations described in Section 2.3, applied there as a constant boundary condition; the remaining liquid/aerosol fraction was assumed to rain out within the cabinet and accumulate as a liquid pool on the cabinet floor; this fraction was not included as a direct CFD source. Evaporation from such a pool would add vapor to the cabinet over time; its omission therefore acts in the non-conservative direction and is only partly offset by the constant-rate assumption described in Section 2.3, and it is noted as a limitation in Section 4.
Figure 2 presents the transient two-phase release calculated using PHAST over the full duration of the leak scenario. The simulation used the same input conditions as the target facility, including an initial vessel pressure of 10.6 bar (abs.), a 12.7 mm leak orifice, and a total propylene inventory of 185 kg. Figure 2a shows the variation in the liquid fraction of the vessel inventory over time. The liquid fraction remains high while the pressurized liquid propylene is discharged and then decreases sharply at approximately 40–42 s. This transition corresponds to the depletion of almost the entire initial 185 kg liquid inventory, after which the release transitions to a much lower-rate vapor blowdown from the remaining vessel headspace. Figure 2b shows the corresponding total two-phase mass release rate. The release rate initially reaches 4.36 kg/s and decreases by approximately one order of magnitude at the same transition point, followed by a further gradual decline over the remainder of the simulated release period.
The vapor/liquid split shown in Figure 2a is not prescribed as an input assumption but is calculated by the PHAST rainout model from the specified release conditions. For the flashing, momentum-driven jet release, the model accounts for in-flight evaporation of liquid droplets as a function of droplet size distribution and jet momentum, based on correlations reported by Witlox and Harper [10]. Droplets that evaporate before reaching the ground contribute to the vapor fraction, while the remaining liquid/aerosol fraction rains out and accumulates within the cabinet as a liquid pool. For the modeled 12.7 mm orifice and initial pressure of 10.6 bar (abs.), approximately 34% of the initial two-phase release rate of 4.36 kg/s was predicted to become vapor:
ṁv = ṁtotal × fv = 4.36 × 0.34 ≈ 1.48 kg/s.
where ṁv is the vapor-phase mass release rate (kg/s), ṁtotal is the total two-phase mass release rate (kg/s), and fv is the vapor fraction predicted by the rainout model [dimensionless]. The remaining approximately 66% was predicted to remain as the liquid/aerosol fraction. The resulting vapor-phase mass release rate of 1.48 kg/s was subsequently applied as the CFD source term in Section 2.3.

2.3. CFD Simulation and Grid Configuration

Three-dimensional CFD simulations were performed using ANSYS Fluent 12.0 to predict gas dispersion and ventilation behavior within both the gas cabinet and the BSGS room [11]. The computational domain reproduced the full dimensions of the BSGS room (24.3 m × 16.0 m × 13.5 m), including the detailed geometry of the gas cabinet and the installed Y-cylinder (Figure 3).
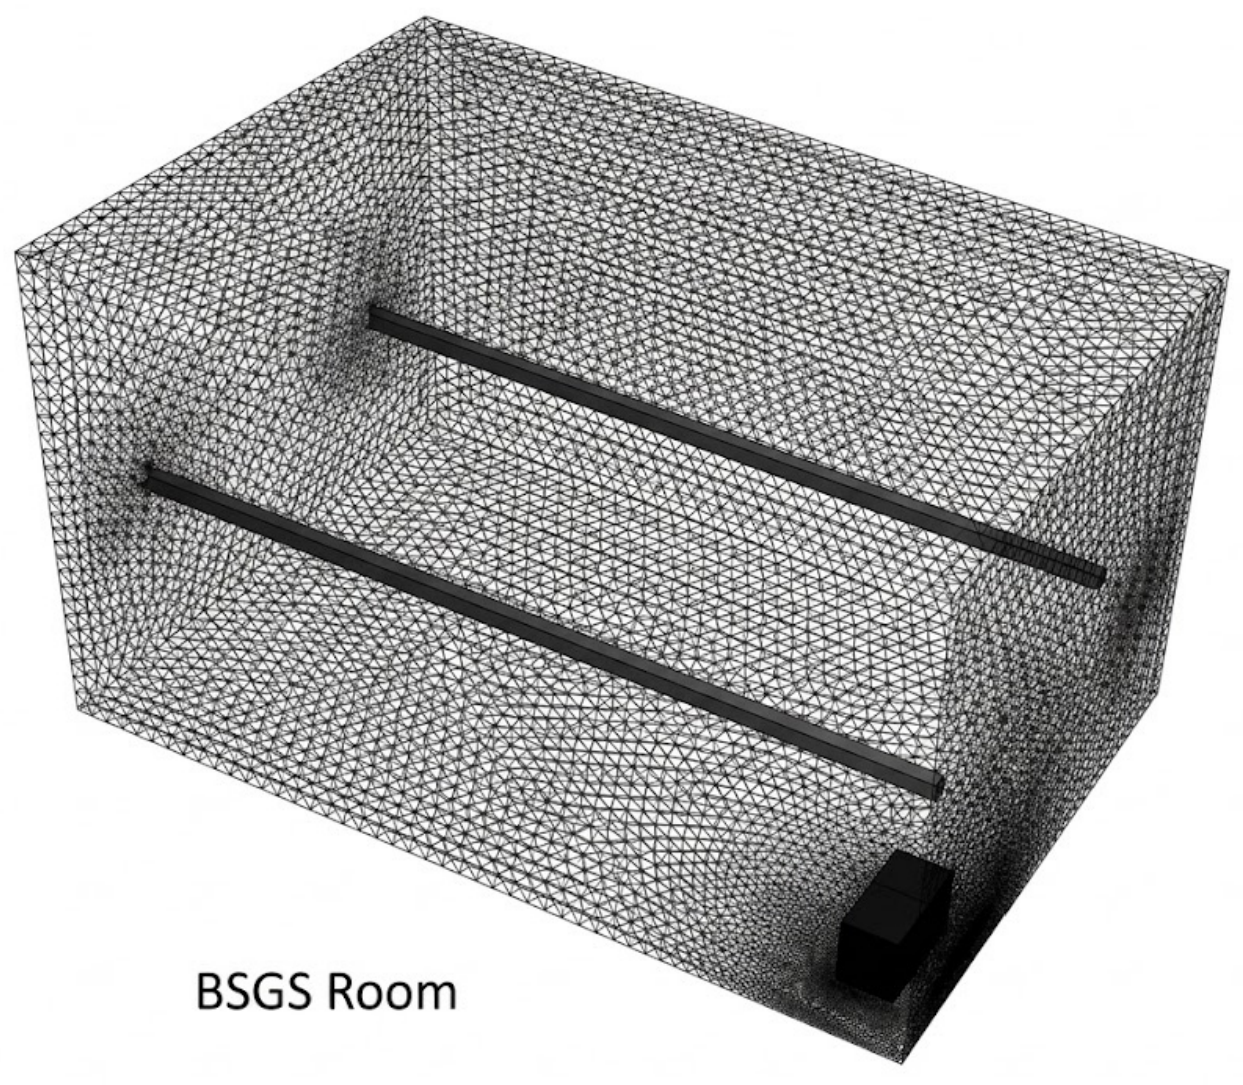
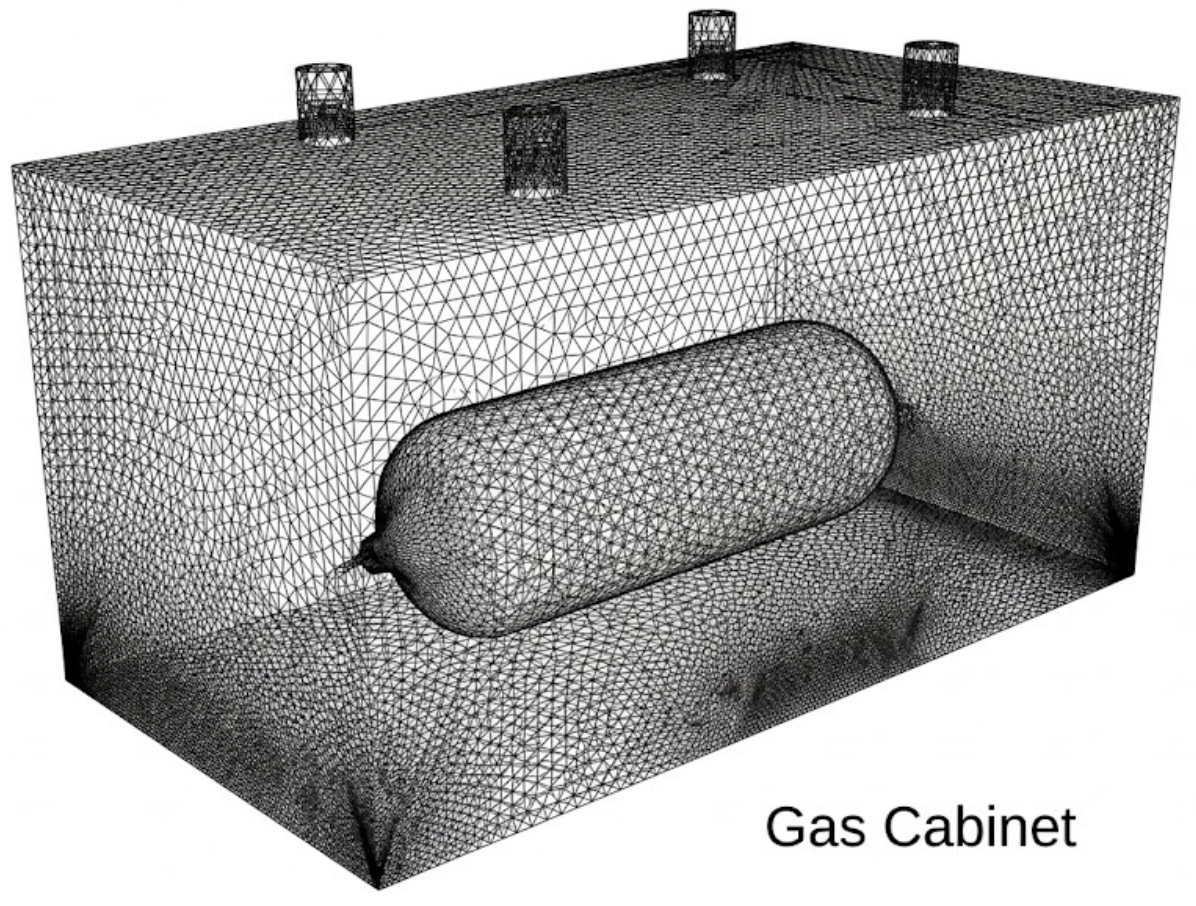
Unstructured tetrahedral meshes were generated to accurately represent the complex geometry. Approximately 3.39 million cells were used for the full-room model, while the detailed gas cabinet model contained approximately 2.76 million cells (Figure 4 and Figure 5). Local mesh refinement was applied around the leak opening, ventilation duct, and air inlet grilles to improve the resolution of regions with steep pressure and velocity gradients; the minimum cell size adjacent to the leak opening was 0.7 mm, and the overall mesh quality corresponded to a maximum skewness of 0.841 and a minimum orthogonal quality of 0.208. The dependence of the results on mesh resolution was examined with coarse, medium, and fine meshes of 1.66, 3.39, and 7.89 million cells for the full-room model, together with sensitivity analyses of the spatial discretization scheme and turbulence model (Section 3.1). This unstructured-tetrahedral approach, combined with local refinement concentrated in the steep-gradient regions identified above, follows established CFD meshing guidance for indoor airflow and dispersion simulations [12,13].
The governing equations for mass, momentum, and energy conservation were solved using the standard k–ε turbulence model [14,15]. Gas dispersion was simulated with the species transport model [16], with molecular diffusion coefficients evaluated from kinetic theory and a turbulent Schmidt number of 0.7, and propylene properties taken from the Fluent material database, while the ideal gas equation of state was adopted to account for density variations caused by pressure changes during high-pressure gas release [17]. Gravity was included in the governing equations to capture buoyancy-driven natural convection and gas accumulation arising from the density difference between propylene and air. The leak-dispersion simulations were run as steady-state analyses, using a constant propylene release rate of 1.48 kg/s as a conservative boundary condition representing a sustained release, under ambient conditions of 25 °C and 101,325 Pa, consistent with the saturated-vapor-pressure basis used for the leak scenario (Section 2.2). This ideal-gas treatment was applied to the expanded vapor phase entering the Fluent domain. The near-orifice flashing and choked-flow behavior were calculated separately using PHAST (Section 2.2), and the resulting vapor-phase mass release rate was subsequently imposed as the CFD source boundary condition. A direct comparison of ideal-gas and real-gas (Soave–Redlich–Kwong) equations of state for pressurized-release calculations has reported modest differences in the resulting discharge conditions for typical scenarios [18]. Accordingly, the ideal-gas formulation was used for the downstream dispersion domain considered in this study, while the potential influence of real-gas effects in the near-field is recognized as a methodological limitation.
The standard k–ε model was selected as a baseline turbulence model for the indoor ventilation and gas-dispersion analysis, consistent with established CFD guidance and previous indoor heavy-gas dispersion studies [12,14]. A systematic sensitivity comparison with alternative turbulence models was not performed in the present study.
The governing transport equations for turbulent kinetic energy (k) and its dissipation rate (ε) in the standard k–ε model are given in Equations (2) and (3), following Launder and Spalding [15].
∂(ρk)/∂t + ∂(ρkui)/∂xi = ∂/∂xj[(μ + μt/σk)∂k/∂xj] + Gk − ρε
∂(ρε)/∂t + ∂(ρεui)/∂xi = ∂/∂xj[(μ + μt/σε)∂ε/∂xj] + C1ε(ε/k)Gk − C2ε ρ(ε2/k)
Here, μt = ρCμk2/ε is the turbulent (eddy) viscosity and Gk is the production of turbulent kinetic energy from mean velocity gradients; the standard model constants Cμ = 0.09, C1ε = 1.44, C2ε = 1.92, σk = 1.0, and σε = 1.3 follow the original Launder and Spalding formulation [15].
The mass release rate obtained from the PHAST analysis (1.48 kg/s) was applied as the inlet boundary condition for the leak source [19]; this value follows directly from the PHAST-calculated vapor-phase release-rate profile described in Section 2.2 (Figure 2b). To conservatively represent a sustained worst-case release, this rate was applied as a constant, steady-state CFD boundary condition rather than the time-varying (decaying) release-rate profile shown in Figure 2b; see the limitations discussion in Section 4 for further discussion of this simplification. Pressure outlet conditions of −120 Pa during normal operation were specified at the cabinet exhaust. The emergency-mode outlet condition applied for the leak-dispersion CFD results reported in this study (Section 3) was −200 Pa, consistent with the facility’s actual emergency-mode operating condition. Air entered the cabinet through 150 supply grilles (12 mm × 110 mm each) located at the lower front section, allowing the internal flow field to develop naturally. The leak source was located at the cylinder valve at the top of the Y-cylinder and discharged vertically upward; it was specified as a mass-flow inlet of 1.48 kg/s at 300 K with a turbulence intensity of 10% and a hydraulic diameter of 12.7 mm, while the supply grilles, represented in the CFD model as a single lumped inlet surface rather than as 150 individually resolved openings, were specified with a turbulence intensity of 10% and a hydraulic diameter of 0.5 m based on that lumped surface. All solid surfaces, including the cylinder, cabinet walls, and room walls, were treated as adiabatic, no-slip walls using the standard wall function. The steady-state solution was obtained with the pressure-based solver using the SIMPLE pressure–velocity coupling scheme, the Standard pressure interpolation scheme, and first-order upwind discretization for the momentum, species, and turbulence equations; the solution was iterated for 25,000 iterations, with scaled residuals converged below 10−3 for continuity, momentum, turbulence, and species and below 10−6 for energy. For the BSGS room, the combined emergency ventilation capacity of 8000 CMH (four units at 2000 CMH each, Section 2.1) was applied as the CFD boundary condition, matching the facility’s actual installed emergency ventilation system.
Table 3 summarizes the key input assumptions used in the leak, dispersion, and explosion consequence analyses, distinguishing credible (as-built/operating) values from conservative (worst-case) assumptions.
Table 4 summarizes the numerical settings and boundary conditions used for the CFD simulations.

2.4. Rationale for Explosion Consequence Assessment Methods

The explosion consequence assessment applies a different calculation method to each scenario according to its underlying physical mechanism, consistent with the damage-threshold criteria specified in KOSHA GUIDE P-102-2021 [20] (1 psi overpressure for blast/structural damage, 5 kW/m2 for thermal radiation). Pressure vessel burst (PVB) is a physical explosion driven by the sudden release of mechanical energy stored in the pressurized vessel, rather than a combustion process; the Brode energy calculation method [21] was therefore selected because it is formulated directly from vessel pressure, volume, and specific heat ratio rather than from a fuel-air combustion energy term, consistent with its established use for physical (non-combustion) pressure-vessel-burst explosions in process-safety consequence-assessment guidance [22]. The Baker–Tang blast curve was then used as a screening-level correlation to estimate the separation distance under the semi-enclosed and congested geometry of the gas cabinet. For the BLEVE fireball, Gexcon EFFECTS software was used to evaluate the thermal radiation from the resulting propylene combustion. The vapor cloud explosion (VCE), by contrast, is a chemical (combustion) explosion resulting from the ignition of a flammable propylene-air mixture; the classical TNT Equivalency Method was therefore applied instead of the Brode–Baker–Tang approach as a screening-level method consistent with established process-safety consequence-assessment guidance [22]. The same guidance also presents congestion/confinement-based alternatives such as the multi-energy and Baker–Strehlow–Tang methods; because a detailed congestion and confinement characterization of the flammable cloud was outside the scope of the present facility-specific assessment, the TNT Equivalency Method was adopted as a practical screening approach. The governing equations for each method are presented in Section 2.5, Section 2.6 and Section 2.7; the corresponding facility-specific substitutions and results are presented in Section 3.2.

2.5. Pressure Vessel Burst (PVB) Overpressure Calculation Method

The Brode energy calculation model [21] was employed to calculate the overpressure propagation distance in the event of a pressure vessel burst (PVB), in which the vessel is completely structurally ruptured due to an abnormal increase in pressure caused by exposure of the vessel to an external fire or high-temperature heat source for a prolonged period. To conservatively account for the shock wave overpressure amplification effect due to reflection from structures and the ground surface, a surface-burst correction factor of 2 was applied, and the total explosion energy is expressed as Equation (4). In the present screening calculation, the vessel pressure P1 was represented by the normal operating pressure rather than by a fire-induced rupture pressure (Section 3.2.1).
E = 2 ( P 1 − P 0 ) V 1 γ − 1
In Equation (4), E denotes the total explosion energy (J); P1 is the absolute pressure inside the vessel before rupture (Pa); P0 represents the ambient atmospheric pressure (Pa); V1 is the total internal volume of the vessel (m3); and γ is the specific heat ratio of the target gas [dimensionless].
By applying Sachs scaling [23] to the calculated explosion energy, the dimensionless scaled distance ( R ¯ ) is obtained from Equation (5). The attenuation of the blast overpressure was then evaluated using the CCPS Baker–Tang curve [22] (Section 3.2.1).
R ¯ = R ⋅ ( P 0 E ) 1 / 3
In Equation (5), R ¯ is the dimensionless scaled distance, R is the actual separation distance (m), P0 is atmospheric pressure (Pa), and E is the previously calculated explosion energy (J).

2.6. BLEVE Fireball Thermal Radiation Calculation Method

To predict the intensity of thermal radiation in the BLEVE fireball scenario, where the container ruptures and the high-pressure liquefied gas inside is rapidly ejected into the atmosphere and ignited to form a large, elevated fireball [24], Gexcon EFFECTS 13.1.0 software was employed [25], and a computational simulation was performed.

2.7. Vapor Cloud Explosion (VCE) Calculation Method

The classical TNT Equivalency Method [26] was applied to quantitatively evaluate the chemical explosion, in which a substantial quantity of released combustible gas mixes with atmospheric air to form a vapor cloud within its flammable range, which is subsequently ignited by an ignition source.
M = V × E × η E TNT
In Equation (6), M is the converted TNT equivalent mass (kg), V is the effective explosion volume (m3), and η is the explosion efficiency (applying a conservative value of 0.1); E is the energy density of the propylene-air mixture within the flammable envelope, taken as 3.909 MJ/m3 for a stoichiometric-range propylene-air mixture; and E_TNT is the TNT standard explosion energy (4.184 MJ/kg). The energy-density value of 3.909 MJ/m3 is derived from the heat of combustion of propylene and its stoichiometric concentration in air, evaluated at standard temperature and pressure (0 °C, 1 atm); as a material property of the propylene-air mixture, this value is referenced to standard conditions independent of the 25 °C ambient condition used for the leak-dispersion scenario described in Section 2.3. Specifically, for the stoichiometric combustion of propylene in air, 2C3H6 + 9O2 + 36N2 → 6CO2 + 6H2O + 36N2 (air approximated as 20 vol% O2 and 80 vol% N2), 2 mol of propylene react with 45 mol of air, giving a total reactant mixture of 47 mol and a stoichiometric propylene fraction of 2/47 = 4.26 vol%. Taking the molar heat of combustion of propylene as 2057.8 kJ mol−1 and the molar volume of an ideal gas at standard temperature and pressure as 22.4 L mol−1, the energy released per unit volume of the stoichiometric mixture is E = (2 × 2057.8 kJ)/(47 × 22.4 L) = 3909 kJ m−3 = 3.909 MJ/m3, the value used in Equation (6).
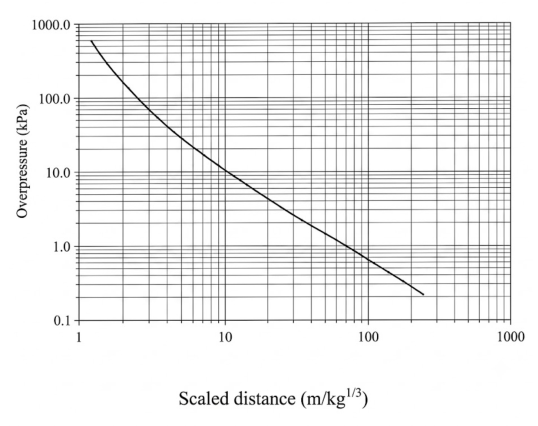
The resulting TNT equivalent mass is subsequently mapped to the Kingery–Bulmash (K-B) chart by locating the target damage-threshold criterion (1 psi, ≈7 kPa) on the chart’s overpressure axis and reading the corresponding scaled distance (Z) on the horizontal axis; Equation (7) is then applied to convert this scaled distance into the actual separation distance (R).
R = Z × M1/3

3. Results

3.1. Fluid Motion and Gas Dispersion Analysis

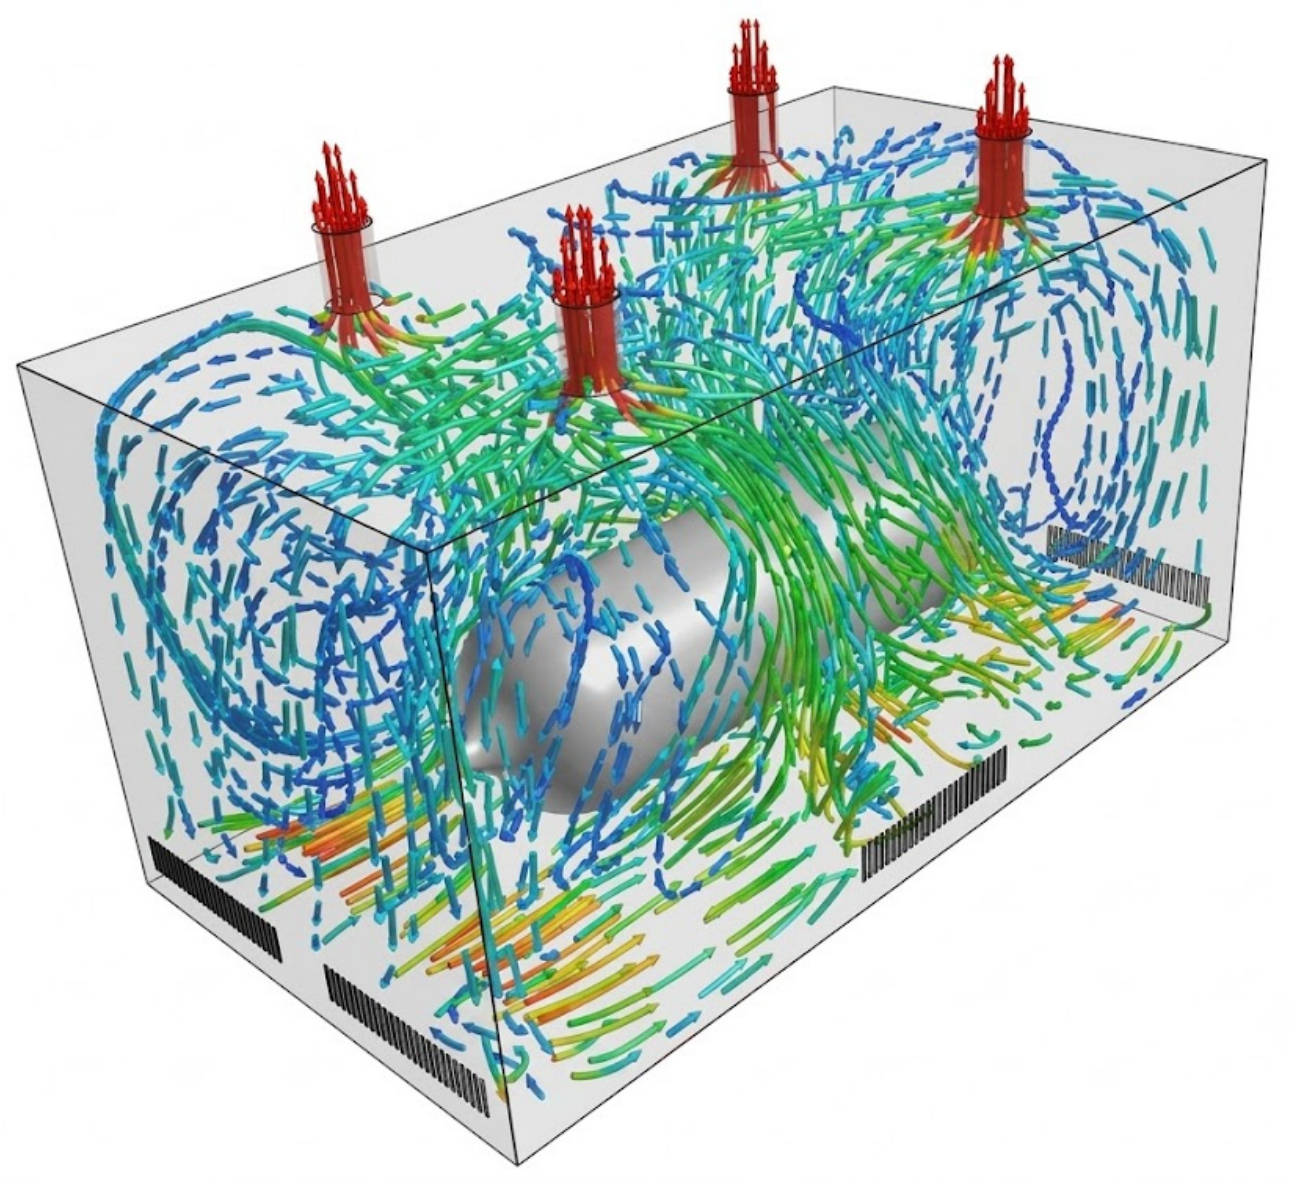
The airflow pattern inside the gas cabinet was first evaluated under normal operating conditions. As shown in Figure 6, fresh air entered through the lower supply grilles, flowed upward along the surface of the Y-cylinder, and exited through the four upper exhaust ducts. Based on visual inspection of the velocity streamlines in Figure 6, a stable upward ventilation pattern was established without noticeable stagnant regions or recirculation zones; this assessment is qualitative, as no quantitative stagnation or recirculation criterion (e.g., a local velocity or residence-time threshold) was applied. The four parallel 6-inch exhaust ducts provided a combined exhaust flow rate of approximately 42 CMM, corresponding to an average flow velocity of approximately 10 m/s in each duct, with an inlet velocity of 3.4 m/s at the supply grilles. With a cross-sectional area of π(0.1524 m)2/4 ≈ 0.0182 m2 per duct (≈0.073 m2 for the four ducts in total), the combined exhaust flow of 42 CMM (0.70 m3/s) corresponds to 0.70/0.073 ≈ 9.6 m/s, consistent with the reported duct velocity; on the supply side, the 150 grilles (12 mm × 110 mm, total open area ≈ 0.198 m2) at 3.4 m/s admit ≈ 0.67 m3/s (≈40 CMM), which balances the exhaust flow within approximately 4%.
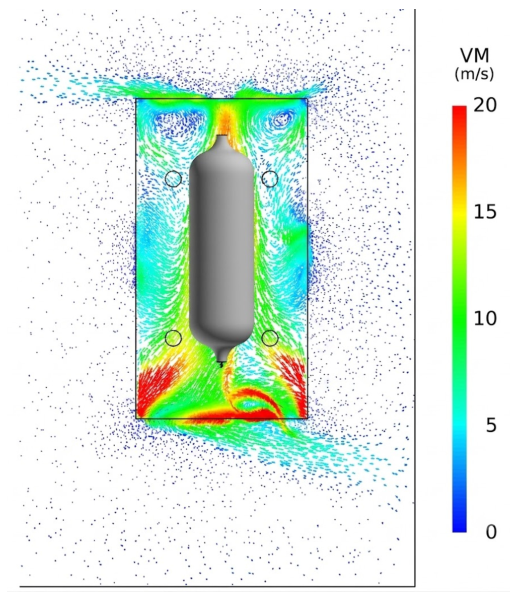
A steady-state leak simulation was then performed using a propylene release rate of 1.48 kg/s under emergency ventilation conditions (−200 Pa), with the emergency exhaust system modeled as operating at the −200 Pa set point; detection and activation delay of the emergency ventilation system cannot be represented in a steady-state analysis; they were outside the scope of this base-case simulation and are addressed separately in the ventilation-failure-mode discussion below. Under this sustained release, propylene dispersed throughout the cabinet owing to the high-momentum jet and turbulent mixing. The average gas concentration inside the cabinet was approximately 27.8% at steady state, exceeding the upper flammability limit (UFL), as illustrated in Figure 7.
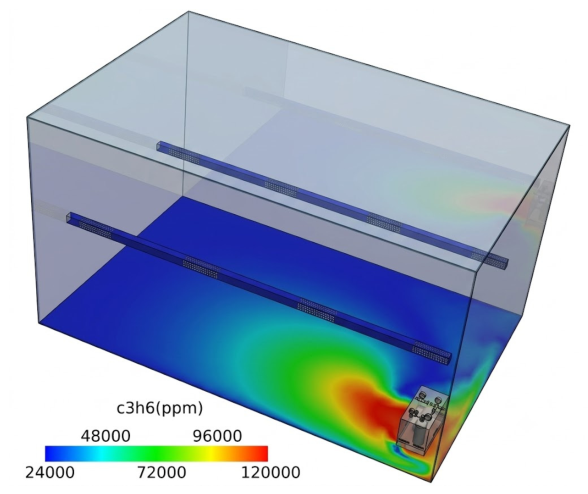
Propylene leaving the cabinet through the four exhaust ducts is discharged outside the computational domain; only the fraction escaping into the BSGS room through the cabinet’s supply-grille openings against the exhaust draft enters the room. Figure 8 shows that elevated propylene concentrations were limited to the vicinity of the gas cabinet openings, while concentrations in the remaining room were maintained at low levels by the emergency ventilation. The steady-state average concentration within the room was approximately 190 ppm; at the 8000 CMH room ventilation rate, this corresponds to a propylene flow into the room of approximately 0.7 g/s, i.e., less than 0.1% of the 1.48 kg/s release, the remainder being captured by the cabinet exhaust.
The flammable vapor cloud was quantified using the lower flammability limit (LFL) of 2.4 vol% as the threshold concentration. The resulting steady-state flammable cloud volume was 6.9 m3, representing less than 0.2% of the total BSGS room volume. The flammable region remained localized around the gas cabinet under the simulated emergency ventilation conditions. This −200 Pa emergency-mode exhaust condition is not a parametric design choice selected among candidate ventilation rates but the as-built/as-operated setting of the installed emergency ventilation system (Table 1); the reported 6.9 m3 flammable cloud volume therefore reflects the facility’s actual operating condition. Because it was obtained with a constant, non-decaying release rate under steady-state conditions, this value should be regarded as an upper-bound steady-state screening result rather than as the physical cloud volume at any instant of an actual release.
The numerical sensitivity of these results was examined in three ways, each changing one setting from the base case (Table 5). First, three mesh levels of 1.66, 3.39, and 7.89 million cells were generated for the full-room model by varying the maximum element size and growth rate while retaining the local refinement described in Section 2.3. Second, the first-order upwind scheme was replaced by second-order upwind discretization. Third, the Standard k–ε model was replaced by the RNG k–ε model. The flammable cloud volume converged monotonically with mesh refinement (7.84, 6.90, and 6.66 m3): the medium-to-fine difference was 3.6%, compared with 13.6% from coarse to medium. The second-order scheme changed the cloud volume by 1.4% and the RNG k–ε model by 4.3%. The maximum in-cabinet mole fraction and the exhaust flow rate differed from the medium-mesh values by less than 3.1% and 6%, respectively, across the fine-mesh, second-order, and RNG k–ε variants. Across all cases, the flammable cloud volume remained within 6.66–7.20 m3. Because this volume is added to the 8.43 m3 cabinet volume in Section 3.2.3, the range corresponds to an effective explosion volume of 15.1–15.6 m3 (−1.6% to +2.0% relative to 15.3 m3) and, through the cube-root scaling of Equation (7), to a 1 psi distance of 13.5–13.6 m, a change of less than 1%. The medium mesh with the base-case settings was therefore retained for the results reported here; its cloud volume lies on the larger (conservative) side of the range. Experimental or tracer-gas validation was not available for this configuration and is discussed as a limitation in Section 4.
Table 5. Mesh-dependence and numerical-sensitivity results of the leak-dispersion CFD model (emergency-ventilation base case, −200 Pa, 1.48 kg/s). Percentage values in parentheses are relative differences from the medium-mesh baseline.
CaseCells (Million)DiscretizationTurbulence ModelFlammable Cloud Volume (m3)Max. In-Cabinet Mole Fraction (–)Exhaust Flow Rate (CMM)
Coarse mesh1.661st-order upwindStandard k–ε7.84 (+13.6%)0.862 (+14.0%)35.2 (−16.3%)
Medium mesh (baseline)3.391st-order upwindStandard k–ε6.900.75642
Fine mesh7.891st-order upwindStandard k–ε6.66 (−3.5%)0.742 (−1.9%)44.5 (+5.9%)
Medium mesh, 2nd-order3.392nd-order upwindStandard k–ε7.00 (+1.4%)0.779 (+3.0%)44.2 (+5.2%)
Medium mesh, RNG k–ε3.391st-order upwindRNG k–ε7.20 (+4.3%)0.771 (+2.0%)43.9 (+4.6%)

3.2. Quantitative Explosion Consequence Assessment

Explosion consequences were evaluated using the dispersion results obtained from the CFD analysis. Three representative accident scenarios were considered: pressure vessel burst (PVB), BLEVE fireball, and vapor cloud explosion (VCE). Human injury and structural damage were assessed using an overpressure criterion of 1 psi, while thermal radiation was evaluated using a threshold of 5 kW/m2 in accordance with the KOSHA guideline and CCPS recommendations [20,22]. The governing equations and method-selection rationale for each scenario are presented in Section 2.4, Section 2.5, Section 2.6 and Section 2.7; this section reports the corresponding facility-specific substitutions, results, and figures.

3.2.1. Pressure Vessel Burst (PVB) Overpressure Analysis

Substituting the specific parameters for the 440 L propylene Y-cylinder—P1 = 10.6 bar, P0 = 1.013 bar, V1 = 0.44 m3, and γ = 1.2—into Equation (4) yields a total explosion energy of approximately 4,218,170 J. Explicitly, with all pressures converted to Pa (P1 = 1,060,000 Pa; P0 = 101,325 Pa): E = 2 × (1,060,000 − 101,325) × 0.44/(1.2 − 1) = 2 × 958,675 × 0.44/0.2 = 4,218,170 J. For this PVB screening calculation, the vessel pressure P1 was represented by the normal operating pressure of 10.6 bar (abs.); this value does not represent the actual pressure at fire-induced vessel rupture, which may be higher, and the result should therefore be regarded as a preliminary estimate rather than a prediction based on the rupture pressure. Likewise, a specific heat ratio of γ = 1.2 was adopted as a screening value; because the Brode energy scales with 1/(γ − 1), a lower value representative of propylene vapor near ambient temperature (γ ≈ 1.15) would increase the calculated energy by approximately one-third and the corresponding 1 psi distance by approximately 10%.
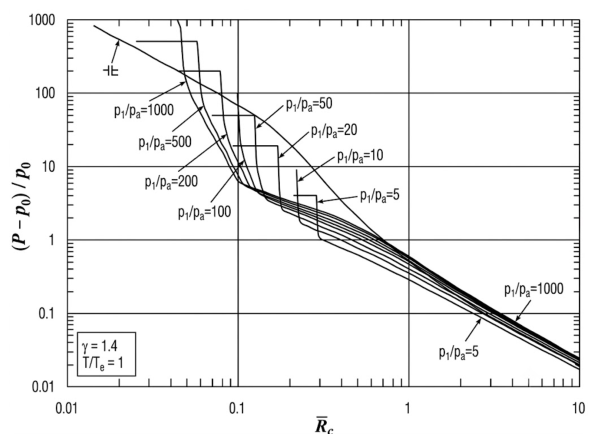
The initial pressure ratio of the target vessel (P1/P0 ≈ 10.6/1.01 ≈ 10) was located on the Baker–Tang curve, and the dimensionless scaled distance ( R ¯ ) corresponding to the injury threshold overpressure of 1 psi (Ps/P0 ≈ 0.07), where Ps/P0 denotes the ratio of the target side-on overpressure to atmospheric pressure (distinct from the vessel initial pressure ratio P1/P0 above), was read as approximately 3.5. Converting this scaled distance to the actual separation distance (R) using Equation (5), the maximum hazard radius at which the blast overpressure from rupture of the 440 L propylene vessel decays to 1 psi was determined to be 12.0 m. Explicitly: R = R ¯ × (E/P0)1/3 = 3.5 × (4,218,170/101,325)1/3 = 3.5 × 3.466 ≈ 12.1 m, which is reported as 12.0 m to the precision of the graphical reading of R ¯ from the Baker–Tang curve (Figure 9).
Figure 9. Baker–Tang curve for dimensionless overpressure (Ps − P0)/P0 versus dimensionless scaled distance R ¯ [22].
Processes 14 03223 g009

3.2.2. BLEVE Fireball Thermal Radiation Analysis

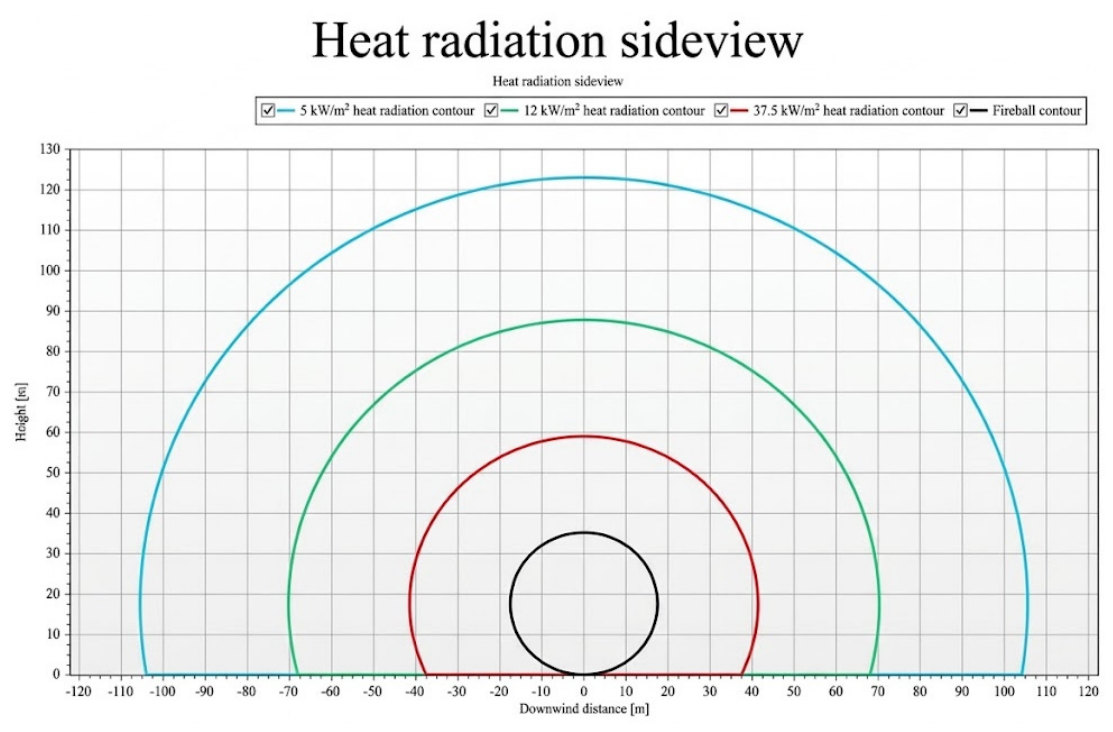
To represent the maximum credible damage severity, an upper-bound screening scenario was assumed in which the entire 185 kg propylene inventory contained in the cylinder participates 100% in fireball formation and the overall combustion reaction. This 100% participation assumption was adopted as a conservative upper-bound screening condition, intended to characterize the maximum potential thermal-radiation consequence of complete inventory involvement rather than to predict the fraction expected to participate in an actual BLEVE. A value of 5 kW/m2, which is the reference intensity for second-degree burns to the human body due to radiant heat exposure, was set as the human damage threshold [27]. As shown in Figure 10, the radiant energy intensity as a function of distance was calculated. Based on the analysis, the upper-bound thermal-radiation hazard radius under the assumed 100% inventory participation scenario, defined using the maximum diameter of the fireball and the point at which the thermal radiation intensity generated during the combustion duration falls below 5 kW/m2, was determined to be 104 m measured from the release point at the gas cabinet. The 104 m value is therefore an upper bound only with respect to the assumed inventory participation fraction; the other fireball inputs (Table 6) are credible operating values rather than bounding assumptions. It should be used as a screening distance for safeguard and separation-distance evaluation, not as an expected accident distance.
The key EFFECTS model inputs and outputs for this calculation, together with the participation-fraction sensitivity cases described below, are summarized in Table 6.
Because complete participation is a bounding assumption, the EFFECTS calculation was repeated with 25%, 50%, 75%, and 100% of the inventory participating; all other inputs were unchanged (Table 6). The 5 kW/m2 distance increased monotonically from 67 m (25%) to 83 m (50%), 94 m (75%), and 104 m (100%), scaling approximately with the cube root of the participating mass. Even at 25% participation, the thermal-radiation distance remains far beyond the overpressure distances of Section 3.2.1 and Section 3.2.3. The conclusion that this scenario is governed by preventing its external-fire precursor therefore does not depend on the participation fraction assumed.

3.2.3. Vapor Cloud Explosion (VCE) Analysis

To construct a bounding scenario, the effective explosion volume (V) combines the gas cabinet’s internal volume (8.43 m3) with the external flammable-cloud volume exceeding the LFL obtained from the CFD analysis (6.9 m3), giving an effective explosion volume of 15.3 m3. The 8.43 m3 cabinet volume was calculated from the cabinet’s external (overall) dimensions rather than the net free volume remaining after subtracting the space occupied by the cylinder and piping, so this choice overestimates rather than underestimates the available reactive volume. Treating the geometric volume of a gas cabinet as the volume available for a flammable gas–air mixture in a TNT-equivalency calculation follows the approach previously applied to a semiconductor cylinder cabinet [6] and is consistent with the multi-energy practice of defining the blast source by the geometric volume of the confined and obstructed region [8,22,28]. The cabinet interior is included because it constitutes a confined, congested region housing the cylinder and piping, and the degree of confinement and congestion—rather than total cloud size or fuel mass alone—is the primary driver of vapor cloud explosion severity [28]. The CFD results indicate an average in-cabinet concentration of approximately 27.8 vol% during the release (Section 3.1), which is above the upper flammability limit of propylene, such that the cabinet contents are too fuel-rich to ignite under that condition. The cabinet volume is nevertheless retained in the effective explosion volume because the mixture necessarily passes through the flammable range as it is diluted by the emergency ventilation flow and as it discharges into the BSGS room; a worst-case screening assessment cannot assume that ignition is avoided throughout that transition. Treating the full cabinet volume as reactive therefore locates the ignition at the most reactive point of the dilution history, rather than at the steady-state concentration field predicted by the CFD simulation. The 15.3 m3 value should therefore be interpreted as a conservative equivalent reactive volume for blast-consequence estimation, rather than as the actual spatial volume occupied by a homogeneous stoichiometric mixture—a recognized simplification in vapor cloud explosion modeling generally [29]; the sensitivity of the resulting hazard distance to both this volume assumption and the explosion-efficiency assumption is summarized in Table 7. The explosion efficiency (η) was adopted at 10% (0.1), which lies at the upper end of the 1–10% range of explosion efficiencies reported for vapor cloud explosions in the TNT-equivalency guidance of the TNO Yellow Book and the CCPS guidelines [8,22] and was therefore treated as a conservative value for the present screening assessment; an additional 20% case beyond this range was included in Table 7 as a sensitivity test, and the governing equation for calculating the TNT equivalent mass (M) is defined as Equation (6).
Explicitly substituting these values into Equation (6): M = (15.3 × 3.909 × 0.1)/4.184 = 5.981/4.184 ≈ 1.43 kg, where the numerator V × E × η = 15.3 × 3.909 × 0.1 ≈ 5.981 MJ (5,981,068 J) is the TNT-equivalent explosion energy after applying the 10% efficiency factor, and the pre-efficiency combustion energy of the participating propylene-air mixture (V × E) is 15.3 × 3.909 ≈ 59.81 MJ (59,810,676 J). Because the TNT-equivalent mass M scales linearly with η through Equation (6), whereas the separation distance R scales with η1/3 through the Hopkinson–Cranz cube-root scaling already used with the K-B chart, the sensitivity of this result to both the assumed reactive volume and the explosion-efficiency assumption can be evaluated directly from these equations without additional simulation, as summarized in Table 7.
An alternative reactive volume can be defined from the CFD concentration field as the volume of mixture between the LFL (2.4 vol%) and the UFL (11.0 vol%). This volume is bounded by the cases already given in Table 7. Outside the cabinet, the mixture between the LFL and the UFL is a subset of the 6.9 m3 volume exceeding the LFL, so the concentration-based external reactive volume cannot exceed 6.9 m3 and the corresponding 1 psi distance cannot exceed 10.4 m (first row of Table 7). Inside the cabinet, the steady-state average concentration of 27.8 vol% lies above the UFL, so only a small part of the 8.43 m3 cabinet volume is within the flammable range at that instant. A concentration-based estimate at the steady-state instant therefore lies between 10.4 m and the 13.6 m obtained with the full cabinet volume. However, the fuel-rich cabinet mixture necessarily passes through the flammable range as it is diluted—after isolation of the leak, during the decay of the release rate, or on loss of exhaust. The steady-state concentration field therefore does not bound the reactive volume over the whole release, and the 13.6 m distance is retained as the reported screening value. The two cases in Table 7 bracket the VCE hazard distance between the concentration-based estimate (≤10.4 m) and the bounding case (13.6 m).
Table 7. Sensitivity of the vapor cloud explosion (VCE) hazard distance to the assumed effective reactive volume and explosion efficiency.
CaseEffective Volume (V)Explosion Efficiency (η)TNT Equivalent Mass (M)1 psi Distance (R)
Case based on CFD-derived flammable cloud only 6.9 m30.10.65 kg10.4 m
Concentration-based case (LFL–UFL mixture only; upper bound)≤6.9 m30.1≤0.65 kg≤10.4 m
Cabinet geometric volume only 8.43 m30.10.79 kg11.1 m
Adopted (cabinet + cloud) 15.3 m30.11.43 kg13.6 m
Low-sensitivity efficiency case 15.3 m30.050.72 kg10.8 m
High-sensitivity efficiency case 15.3 m30.202.86 kg17.1 m
By mapping this result to the K-B chart in Figure 11 [30] by locating the damage-threshold criterion of 1 psi (≈7 kPa) on the chart’s overpressure axis and reading the corresponding scaled distance on the horizontal axis, the scaled distance (Z) at which the overpressure reaches 1 psi was read as approximately 12 m/kg1/3. Equation (7) was applied to derive the actual separation distance (R) based on the read Z value.
Substituting the scaled distance of 12 and the equivalent mass of 1.43 kg into Equation (7) gives a distance of 13.6 m at which the vapor cloud explosion (VCE) overpressure decays to 1 psi. Explicitly: R = Z × M1/3 = 12 × 1.431/3 = 12 × 1.127 ≈ 13.5 m, which is reported as 13.6 m to the precision of the graphical reading of Z from the K-B chart.

3.3. Summary of Explosion Consequence Results

Table 8 summarizes the predicted consequences for the three accident scenarios. The PVB and vapor cloud explosion produced overpressure impact distances of 12.0 m and 13.6 m, respectively, using the 1 psi criterion. In contrast, the BLEVE fireball generated the largest hazard zone, with a thermal radiation impact radius of 104 m based on the 5 kW/m2 criterion.

4. Discussion

This study evaluated the potential accident consequences associated with the introduction of 440 L Y-type propylene gas cylinder cabinets by integrating CFD simulations with a quantitative analysis of explosion consequences. Although increasing cylinder capacity increases the quantity of hazardous material stored in a single vessel, the results of this study indicate that the associated accident consequences can be managed through appropriate ventilation and engineering safety measures. These two lines of reasoning address distinct questions and are not intended to be consolidated into a single quantitative risk figure. Specifically, the analysis of exposure frequency (Section 1) supports the consideration of 440 L cylinders by highlighting the reduction in exposure to manual cylinder replacement tasks—a primary source of human-error-induced major leaks. Meanwhile, the consequence assessment conducted in this study independently addresses concerns regarding the greater energy stored in large-capacity vessels by quantifying the consequences of worst-case explosions and leaks for the 440 L system, while accounting for the level of protection provided by the facility’s existing ventilation and safety interlock systems.
The CFD analysis results showed that the flammable vapor cloud was limited to 6.9 m3 under the assumed emergency ventilation conditions. This volume represents less than 0.2% of the total BSGS room volume, demonstrating that the emergency exhaust system effectively limits the accumulation of flammable gas under the simulated conditions. The majority of the leaked propylene was diluted and removed before reaching hazardous concentration levels, and hazardous concentrations were not reached outside the immediate vicinity of the gas cabinet. It is important to note that the flammable gas cloud volume of 6.9 m3 was calculated under intentionally conservative conditions, in which the maximum vapor release rate of 1.48 kg/s—determined using PHAST—was applied as a steady-state source in the CFD simulation. Consequently, this result represents a preliminary estimate of flammable gas accumulation based on the facility’s emergency ventilation conditions and the specified release source assumptions; it does not represent a prediction of the actual time-dependent release behavior. While conservative assumptions were applied with respect to the release rate, evaporation from the liquid pool formed by the leaked liquid was not considered (Section 4, limitations).
The explosion analysis predicted similar overpressure impact distances for both the PVB and vapor cloud explosion scenarios. The calculated distances corresponding to the 1 psi overpressure criterion were 12.0 m and 13.6 m, respectively. These results indicate that, under the investigated conditions, the consequences of an explosion would be largely confined to the area surrounding the gas cabinet. Therefore, the installation of blast-resistant barriers or the maintenance of adequate separation distances could significantly reduce the potential impact on adjacent process equipment.
In contrast, the BLEVE fireball resulted in a considerably larger hazard zone due to thermal radiation. The predicted thermal radiation impact distance based on the 5 kW/m2 criterion reached 104 m. Although this scenario relied on a bounding assumption—that the entire propylene inventory would contribute to fireball formation—the results underscore the importance of preventing situations in which the vessel is exposed to external fire. Therefore, fire detection systems, emergency shutdown systems, and the rapid isolation of gas supplies are essential for reducing the likelihood of such accident scenarios. The assumption of 100% involvement under worst-case conditions is consistent with the consequence assessment approaches outlined in the TNO Yellow Book and CCPS Guidelines cited in this study [8,22], thereby establishing an upper bound for the thermal radiation hazard distance based on the participating inventory (Table 6). Consequently, preventing the conditions that precede such accidents serves as the primary control measure for managing these scenarios [31]. In semiconductor specialty gas facilities, risks are typically managed through multiple layers of protection rather than relying solely on separation distances. These measures include fire detection systems linked to in-cabinet fire suppression systems [32,33], emergency exhaust capacities designed with sufficient margin above anticipated leak rates [5,7], and automatic emergency gas supply shutdown systems [32]. Since detection/suppression and automatic shutdown systems operate independently of the ventilation system, this configuration ensures that failure of a single protection layer does not compromise the overall safety function—a key characteristic of the defense-in-depth approach [34]. Thus, the impact distances presented in this study should be interpreted as design inputs for the development and validation of these safety systems. This study did not conduct quantitative CFD analyses for specific ventilation system failure modes (such as partial or total exhaust blockage, delayed emergency ventilation activation, or alternative leak locations); such cases represent degraded performance states of safety systems rather than the defined leak scenarios themselves. Their contribution to risk depends on the failure frequency and reliability of the ventilation system—factors that fall within the scope of probabilistic risk assessment, which is beyond the scope of the consequence analysis conducted in this study. However, the upper bound of consequences for a scenario involving the complete loss of dilution capability within the cabinet has already been established in the VCE scenario, in which the entire cabinet volume is treated as the volume capable of participating in the reaction (Section 3.2.3). Analysis of gas dispersion resulting from ventilation system failure is proposed as a topic for future research.
From an operational perspective, replacing existing 47 L cylinders with 440 L Y-type cylinders can significantly reduce the frequency of cylinder exchanges. Since manual cylinder replacement is recognized as a primary source of gas leaks in semiconductor facilities, reducing the number of replacement operations can reduce the likelihood of accidents arising from human error. As noted in Section 1, the facility under study is expected to experience a substantial reduction through this approach; the adoption of 440 L Y-type cylinders is projected to decrease replacement frequency by approximately 89%, thereby directly reducing exposure to human errors associated with manual handling—a key factor identified in leak incidents. Therefore, evaluating the safety of large-capacity gas supply systems requires consideration of both accident consequences and the frequency of accident occurrence. This study did not quantify the net change in risk resulting from the replacement of 47 L cylinders with 440 L Y-type cylinders; the 89% reduction figure was used solely to characterize the decrease in exposure associated with manual cylinder replacement operations. The results of this study demonstrate that the potential consequences of accidents associated with increased large-scale gas storage capacities can be mitigated through appropriate facility design and engineering safety systems. The calculated impact distances provide quantitative engineering data for evaluating the adequacy of safety measures—such as reliable gas detection systems [35], emergency ventilation, automatic emergency shut-off valves, and protective structures—and for determining the required separation distances and protective measures when introducing large-capacity gas cabinets into semiconductor manufacturing facilities. In summary, while the two types of overpressure impacts are governed by separation distance and structural protection, the thermal radiation impact—which is substantially greater—is primarily controlled by preventing the sustained external fire conditions that precede a BLEVE. Such precursor conditions are best addressed through fire detection, fire suppression, and automatic shut-off safety systems rather than separation distance alone. Therefore, while these consequence assessment results outline the safety measures required for implementing a 440 L system at the facility in question, they are insufficient on their own to determine whether the system should be adopted. Such a decision requires additional data on accident frequency, clearly defined risk acceptance criteria, and experimental validation of dispersion models—all of which fall outside the scope of this study.
Comparison with existing research. Previous research on semiconductor gas cabinets has primarily focused on ventilation performance and the dispersion of flammable gases. This includes studies that evaluated the behavior of semiconductor gas cabinets by combining tracer gas testing with CFD analysis [4], as well as research addressing ventilation and exhaust system design for flammable gas leaks within gas cabinets [5,7]. Meanwhile, research related to explosions has analyzed the impact of hydrogen explosions occurring inside semiconductor cylinder cabinets on protective barriers [6]. Such studies provide an important basis for understanding specific hazard mechanisms within conventional gas box and cabinet configurations. In contrast, this study focuses on the 440 L propylene Y-cylinder configuration of a specific facility; it characterizes the release source using PHAST, performs steady-state CFD dispersion analysis, and integrates three distinct damage mechanisms—pressure vessel rupture, vapor cloud explosion, and BLEVE fireball—into a unified “worst-case scenario” consequence assessment framework. Thus, the contribution of this study lies not in the development of new CFD or explosion models, but in the integration and application of established consequence assessment methodologies tailored to the specific characteristics of a large-capacity propylene gas supply system.
Regarding the CFD analysis, two methodological limitations must also be considered. First, as the study targeted a specific industrial facility configuration for which leakage test data were unavailable, the CFD results could not be validated against experimental data or tracer gas measurements. However, assessments of mesh dependency and sensitivity to discretization and turbulence models (Section 3.1, Table 5) revealed that differences in the predicted flammable gas cloud volume were less than 5% when comparing medium and fine meshes, or when applying second-order discretization and the RNG k–ε model. Therefore, the CFD results presented here should be regarded as numerically verified, engineering-level estimates of gas dispersion under the specified release source and ventilation conditions, rather than experimentally validated predictions based on the actual leakage history. The results are best expressed as preliminary estimates based on the stated assumptions. While a constant leak rate and steady-state emergency ventilation boundary conditions represent conservative input parameters, the exclusion of liquid pool evaporation and the use of the operating pressure as the PVB rupture pressure (Section 3.2.1) do not constitute conservative approaches. The quantitative predictive performance of the model could be further enhanced through validation using experimental data or tracer gas measurements.
Second, in the CFD simulation of leak dispersion, the leak rate of 1.48 kg/s predicted by PHAST was applied as a constant, steady-state source rather than as a time-decaying profile. As the analysis was conducted as a steady-state solution, the reported concentrations and flammable gas cloud volumes represent an equilibrium state established by balancing the leak rate—maintained at a constant level—against the emergency ventilation flow rate. Consequently, the analysis did not account for the initial development and subsequent increase in the concentration field or the actual decline in the leak rate over time; the reported results therefore reflect the conservative assumption of a non-decaying leak rate rather than the actual declining source strength. This conservatism can be quantitatively bounded using the PHAST results themselves (Section 2.2, Figure 2b). The total release rate decreases from an initial value of 4.36 kg/s to approximately 0.3 kg/s when the liquid inventory is depleted after approximately 42 s and further decreases to approximately 0.1 kg/s after approximately 80 s. Since the release following liquid depletion consists primarily of vapor, the release rate is approximately 5 to 15 times lower than the constant 1.48 kg/s vapor leak source applied throughout the CFD simulation. Therefore, for leak durations exceeding the initial approximately 40 s liquid release period, the CFD results substantially overestimate the sustained vapor inflow and the resulting flammable gas cloud volume. Furthermore, evaporation from the liquid pool formed on the floor by the leaked liquid was not modeled as a vapor source, which acts in a non-conservative manner with respect to the concentration levels inside the cabinet. If prediction of the actual leak history is required, future studies could perform transient analyses incorporating both time-varying leak source terms and liquid pool evaporation.
In addition to the two points mentioned above, several further methodological improvements could be considered for future research. These include a real-gas equation-of-state comparison for the near-field flashing release; a comparison with Reynolds stress or scale-resolving turbulence models for the buoyancy-driven flashing jet; an explicit volume integration of the LFL–UFL band of the CFD concentration field, which was bounded rather than integrated in Section 3.2.3; and additional CFD cases incorporating ventilation system failure scenarios (such as partial or complete exhaust blockage or delayed operation) and alternative leak locations. Such extended studies fall outside the scope of the CFD and consequence assessments conducted in the present study and are therefore recommended as topics for future research.

5. Conclusions

This study investigated the accident consequences that could arise from introducing a 440 L propylene Y-cylinder gas cabinet for semiconductor manufacturing, using CFD simulations and preliminary explosion consequence analysis under explicitly stated assumptions. The major findings are summarized as follows.
  • CFD simulations showed that, under the simulated steady-state conditions, emergency ventilation effectively limited the dispersion of leaked propylene. The flammable vapor cloud exceeding the lower flammability limit (LFL) occupied 6.9 m3, representing less than 0.2% of the total BSGS room volume. Under the simulated conditions, the hazardous region remained confined to the area surrounding the gas cabinet.
  • The predicted overpressure distances corresponding to the 1 psi criterion were 12.0 m for the PVB and 13.6 m for the vapor cloud explosion. In contrast, the BLEVE fireball produced a substantially larger thermal radiation hazard, with an upper-bound impact radius of 104 m under the assumed 100% inventory participation scenario, based on the 5 kW/m2 criterion. Among the investigated consequence metrics, the BLEVE fireball therefore produced the largest calculated hazard distance; this value is an upper bound only with respect to the assumed participation fraction (67–104 m for 25–100% participation, Table 6) and should not be interpreted as an expected accident distance.
  • Increasing cylinder capacity increases the potential consequences of a single accident because of the larger gas inventory. However, the longer replacement interval substantially reduces the frequency of manual cylinder handling, which is a recognized source of gas leak incidents in semiconductor facilities. The present consequence assessment does not establish how the overall risk changes relative to the conventional 47 L system; such a comparison would require accident-frequency data in addition to consequence analysis.
Overall, the present results do not establish an unconditional safety determination or an overall risk reduction for the 440 L propylene Y-cylinder system. Within the preliminary consequence framework applied here, the calculated overpressure distances (12.0 m for PVB and 13.6 m for VCE) remain confined to the immediate vicinity of the gas cabinet and can be accommodated by separation distance and protective structures, while the substantially larger thermal-radiation distance of 104 m is an upper bound with respect to the inventory participation fraction only, obtained for complete participation in a BLEVE—a scenario whose precursor conditions are addressed by fire-detection, suppression, and automatic-isolation safeguards. These results characterize the consequence side of the decision to introduce the 440 L propylene Y-cylinder at the facility examined. They indicate the safeguards that such an installation would require: adequate emergency ventilation, gas detection, automatic isolation, fire suppression, and protective structures maintained as a defense-in-depth design. A decision on its introduction would additionally require the accident-frequency information and risk-acceptance criterion identified above, together with experimental validation of the dispersion model. The findings provide quantitative engineering information that may support the design, operation, and consequence assessment of large-capacity specialty gas supply systems in semiconductor manufacturing facilities.

Author Contributions

Conceptualization, D.K. and S.J.; methodology, D.K. and H.-H.K.; software, D.K.; validation, S.-Y.L.; formal analysis, D.K.; investigation, D.K.; resources, H.-H.K. and S.-Y.L.; data curation, D.K.; writing—original draft preparation, D.K.; writing—review and editing, D.-y.S. and S.J.; visualization, D.K.; supervision, D.-y.S. and S.J.; project administration, S.J.; funding acquisition, S.J. and H.-H.K. All authors have read and agreed to the published version of the manuscript.

Funding

This research was funded by SK hynix Inc.

Institutional Review Board Statement

Not applicable.

Informed Consent Statement

Not applicable.

Data Availability Statement

The facility design and operating data used in this study were provided by SK hynix Inc. under a confidentiality agreement and are not publicly available. The CFD and consequence-model input parameters required to reproduce the results are reported in Table 1, Table 2, Table 3, Table 4, Table 5 and Table 6 of the manuscript; further data are available from the corresponding author on reasonable request and subject to the permission of SK hynix Inc.

Acknowledgments

The authors thank SK hynix Inc. for providing the facility design and operating data used in this study.

Conflicts of Interest

Authors Hyuk-Hwa Kwon and Seok-Yong Lee were employed by the company SK hynix Inc. The remaining authors declare that the research was conducted in the absence of any commercial or financial relationships that could be construed as a potential conflict of interest.

References

  1. Chelton, C.F.; Glowatz, M.; Mosovsky, J.A. Chemical hazards in the semiconductor industry. IEEE Trans. Educ. 1991, 34, 269–288. [Google Scholar] [CrossRef] [Scilit]
  2. Chen, J.R. Characteristics of fire and explosion in semiconductor fabrication processes. Process Saf. Prog. 2002, 21, 19–25. [Google Scholar] [CrossRef] [Scilit]
  3. Cheng, C.-M.; Hwang, S.-L. Applications of integrated human error identification techniques on the chemical cylinder change task. Appl. Ergon. 2015, 47, 274–284. [Google Scholar] [CrossRef] [Scilit] [PubMed]
  4. Kim, S.-E.; Lee, K.-H.; Kang, C.; Jung, S. Tracer Gas Test and CFD Analysis of Semiconductor Gas Box for Flammable Gas Leakage. Energies 2022, 15, 8166. [Google Scholar] [CrossRef] [Scilit]
  5. Kim, S.-R.; Moon, H.-S.; Jeong, P.-H. Optimal Ventilation Design for Flammable Gas Leaking from Gas Box Used in Semiconductor Manufacturing: Case Study on Korean Semiconductor Industry. Fire 2023, 6, 432. [Google Scholar] [CrossRef] [Scilit]
  6. Min, M.; Lee, K.-H.; Jung, S. A Study on the Effect of Hydrogen Gas Explosion in a Cylinder Cabinet for Semiconductors on the Protective Wall. Energies 2022, 15, 7480. [Google Scholar] [CrossRef] [Scilit]
  7. Lim, K.-Y.; Jung, S.; Kim, S.-R. Gas Box Exhaust Design Modification for Accidental Hazardous Gas Releases in Semiconductor Industry. Processes 2024, 12, 2531. [Google Scholar] [CrossRef] [Scilit]
  8. TNO. Methods for the Calculation of Physical Effects Due to Releases of Hazardous Materials (“Yellow Book,” CPR 14E/PGS 2); Netherlands Ministry: The Hague, The Netherlands, 2005. Available online: https://publicatiereeksgevaarlijkestoffen.nl/publicaties/pgs2/ (accessed on 1 September 2026).
  9. Committee for the Prevention of Disasters (CPR). Guidelines for Quantitative Risk Assessment (“Purple Book,” CPR 18E/PGS 3); Netherlands Ministry: The Hague, The Netherlands, 1999. Available online: https://publicatiereeksgevaarlijkestoffen.nl/publicaties/PGS3 (accessed on 1 September 2026).
  10. Witlox, H.W.M.; Harper, M. Two-Phase Jet Releases, Droplet Dispersion and Rainout I. Overview and Model Validation. J. Loss Prev. Process Ind. 2013, 26, 453–461. [Google Scholar] [CrossRef] [Scilit]
  11. ANSYS, Inc. ANSYS Fluent User’s Guide, Release 12.0; ANSYS, Inc.: Canonsburg, PA, USA, 2009; Available online: https://studylib.net/doc/25829583/flug-12-0?utm_source (accessed on 1 September 2026).
  12. Franke, J.; Hellsten, A.; Schlünzen, K.H.; Carissimo, B. The COST 732 Best Practice Guideline for CFD simulation of flows in the urban environment: A summary. Int. J. Environ. Pollut. 2011, 44, 419–427. [Google Scholar] [CrossRef] [Scilit]
  13. Liu, Y.; Long, Z.; Liu, W. A semi-empirical mesh strategy for CFD simulation of indoor airflow. Indoor Built Environ. 2022, 31, 2240–2256. [Google Scholar] [CrossRef] [Scilit]
  14. Dong, L.; Zuo, H.; Hu, L.; Yang, B.; Li, L.; Wu, L. Simulation of heavy gas dispersion in a large indoor space using CFD model. J. Loss Prev. Process Ind. 2017, 46, 1–12. [Google Scholar] [CrossRef] [Scilit]
  15. Launder, B.E.; Spalding, D.B. The numerical computation of turbulent flows. Comput. Methods Appl. Mech. Eng. 1974, 3, 269–289. [Google Scholar] [CrossRef] [Scilit]
  16. Rajak, U.; Nashine, P.; Chaurasiya, P.K.; Verma, T.N. A numerical investigation of the species transport approach for modeling of gaseous combustion. J. Therm. Eng. 2021, 7, 2054–2067. [Google Scholar] [CrossRef] [Scilit]
  17. Cheng, Z.; Agranat, V.M.; Tchouvelev, A.V.; Houf, W.; Zhubrin, S.V. PRD Hydrogen Release and Dispersion, a Comparison of CFD Results Obtained from Using Ideal and Real Gas Law Properties. In Proceedings of the 1st International Conference on Hydrogen Safety, Pisa, Italy, 8–10 September 2005. Paper No. 110090. [Google Scholar]
  18. Witlox, H.W.M.; Fernandez, M.; Harper, M.; Stene, J. Modelling and validation of atmospheric expansion and near-field dispersion for pressurised vapour or two-phase orifice releases. In Proceedings of the Hazards 26, Edinburgh, UK, 24–26 May 2016. IChemE Symposium Series No. 161. Paper No. 04. [Google Scholar]
  19. DNV, G.L. PHAST (Process Hazard Analysis Software Tool), Version 8.9; Det Norske Veritas: Høvik, Norway; Available online: https://www.dnv.com/services/phast/ (accessed on 1 September 2026).
  20. Korea Occupational Safety and Health Agency (KOSHA). KOSHA GUIDE P-102-2021: Technical Guidelines for Accident Consequence Prediction Techniques; KOSHA: Ulsan, Republic of Korea, 2021; Available online: https://www.kosha.or.kr/kosha/data/guidanceP.do (accessed on 1 September 2026).
  21. Brode, H.L. Numerical Solutions of Spherical Blast Waves. J. Appl. Phys. 1955, 26, 766–775. [Google Scholar] [CrossRef] [Scilit]
  22. Center for Chemical Process Safety (CCPS). Guidelines for Vapor Cloud Explosion, Pressure Vessel Burst, BLEVE, and Flash Fire Hazards, 2nd ed.; AIChE/CCPS: New York, NY, USA, 2010; Available online: https://ccps.aiche.org/publications/books/guidelines-vapor-cloud-explosion-pressure-vessel-burst-bleve-and-flash-fire-hazards-2nd-edition (accessed on 1 September 2026).
  23. Sachs, R.G. The Dependence of Blast on Ambient Pressure and Temperature; BRL Report No. 466; Aberdeen Proving Ground: Aberdeen, MD, USA, 1944; Available online: https://apps.dtic.mil/sti/html/tr/ADA800535/index.html (accessed on 1 September 2026).
  24. Prugh, R.W. Quantitative evaluation of fireball hazards. Process Saf. Prog. 1994, 13, 83–91. [Google Scholar] [CrossRef] [Scilit]
  25. Gexcon AS. EFFECTS Software, Version 13.1.0; Gexcon AS: Bergen, Norway; Available online: https://www.gexcon.com/software/effects/ (accessed on 1 September 2026).
  26. Baker, Q.A.; Tang, M.J.; Scheier, E.A.; Silva, G.J. Vapor cloud explosion analysis. Process Saf. Prog. 1996, 15, 106–109. [Google Scholar] [CrossRef] [Scilit]
  27. Roberts, T.; Gosse, A.; Hawksworth, S. Thermal Radiation from Fireballs on Failure of Liquefied Petroleum Gas Storage Vessels. Process Saf. Environ. Prot. 2000, 78, 184–192. [Google Scholar] [CrossRef] [Scilit]
  28. van den Berg, A.C. The multi-energy method: A framework for vapour cloud explosion blast prediction. J. Hazard. Mater. 1985, 12, 1–10. [Google Scholar] [CrossRef] [Scilit]
  29. Tam, V.H.Y.; Tan, F.; Savvides, C. A Critical Review of the Equivalent Stoichiometric Cloud Model Q9 in Gas Explosion Modelling. Eng 2021, 2, 156–180. [Google Scholar] [CrossRef] [Scilit]
  30. Kingery, C.N.; Bulmash, G. Airblast Parameters from TNT Spherical Air Burst and Hemispherical Surface Burst; ARBRL-TR-02555; U.S. Army Ballistic Research Laboratory: Aberdeen Proving Ground, MD, USA, 1984; Available online: https://unsaferguard.org/un-saferguard/kingery-bulmash (accessed on 1 September 2026).
  31. Abbasi, T.; Abbasi, S.A. The boiling liquid expanding vapour explosion (BLEVE): Mechanism, consequence assessment, management. J. Hazard. Mater. 2007, 141, 489–519. [Google Scholar] [CrossRef] [Scilit] [PubMed]
  32. National Fire Protection Association (NFPA). NFPA 318: Standard for the Protection of Semiconductor Fabrication Facilities, 2025th ed.; NFPA: Quincy, MA, USA, 2025. [Google Scholar]
  33. National Fire Protection Association (NFPA). NFPA 55: Compressed Gases and Cryogenic Fluids Code, 2023th ed.; NFPA: Quincy, MA, USA, 2023. [Google Scholar]
  34. Center for Chemical Process Safety (CCPS). Layer of Protection Analysis: Simplified Process Risk Assessment; AIChE/CCPS: New York, NY, USA, 2001; ISBN 978-0-8169-0811-0. [Google Scholar]
  35. Chew, B.-K.; Mahmud, A.; Singh, H. Autonomous Hazardous Gas Detection Systems: A Systematic Review. Sensors 2025, 25, 6618. [Google Scholar] [CrossRef] [Scilit] [PubMed]
Figure 1. Isometric 3D view and geometric structure of the 440 L large-capacity Y-cylinder gas cabinet.
Processes 14 03223 g001
Figure 2. PHAST simulation results: (a) liquid and gas fraction trajectories versus time under rapid flash evaporation; (b) calculated total mass leak rate versus release duration.
Processes 14 03223 g002
Figure 3. Entire 3D computational analysis domain and layout of the BSGS room.
Processes 14 03223 g003
Figure 4. Unstructured tetrahedral grid system utilized for the entire BSGS room simulation.
Processes 14 03223 g004
Figure 5. Refined localized mesh structure and grid system inside the gas cabinet housing the Y-cylinder.
Processes 14 03223 g005
Figure 6. Airflow velocity streamlines and flow fields inside the gas cabinet under normal operational ventilation conditions. Colours indicate the propylene concentration in ppm according to the colour bar.
Processes 14 03223 g006
Figure 7. Steady-state propylene concentration profile and distribution inside the gas cabinet during a high-pressure leak event under emergency-mode ventilation (−200 Pa).
Processes 14 03223 g007
Figure 8. Iso-surface representation of the flammable vapor cloud volume exceeding the lower flammability limit (LFL, 2.4 vol%) within the BSGS room under emergency-mode ventilation (−200 Pa). Colours indicate the propylene concentration in ppm according to the colour bar.
Processes 14 03223 g008
Figure 10. Thermal radiation hazard footprint and calculation results simulated via Gexcon EFFECTS 13.1.0.
Processes 14 03223 g010
Figure 11. Kingery–Bulmash (K-B) chart for explosion overpressure estimation versus scaled distance (Z) in vapor cloud explosions.
Processes 14 03223 g011
Table 1. Facility and equipment conditions.
ParameterValue/Specification
Cabinet Size1600 (W) × 2986 (D) × 1764 (H) mm
Vent PressureNormal: −120 Pa/Emergency: −200 Pa (applied; actual facility emergency operating condition)
Cylinder Capacity440 L
Table 2. Target materials and process parameters.
Process ParameterValue/Specification
Target GasPropylene (C3H6)
Total Mass185 kg
Leak Pressure10.6 bar (abs.)
Hole Size (Orifice Diameter)12.7 mm
Discharge Coefficient (Cd)1.0
Table 3. Summary of key input assumptions.
ParameterValue UsedBasisType
Leak orifice diameter 12.7 mm (1/2-inch tube ID)Matches the 1/2-inch tube fitting at the cylinder outlet connection; full-bore (guillotine) rupture of this line, per TNO Yellow Book worst-case screening approachConservative
Discharge coefficient (Cd) 1.0TNO Yellow Book recommendation for maximum release rateConservative
Vessel pressure, leak scenario 10.6 bar (abs.)Saturated vapor pressure of propylene at 25 °CCredible (operating)
Emergency ventilation pressure (CFD b.c.) −200 PaEmergency-mode exhaust pressure applied as the CFD boundary condition in this study, matching the facility’s actual emergency operating conditionCredible (as-built)
Mass release rate to CFD 1.48 kg/sPHAST predicts a two-phase release of 4.36 kg/s, of which ~34% flashes to vapor (1.48 kg/s); this vapor rate was applied as a constant CFD source, deliberately excluding the release-rate decay over timeConservative (steady-state, no decay)
Vessel burst pressure, PVB (Equation (4)) 10.6 bar (abs.)Same operating condition as the leak scenario (10.6 bar abs.; P1 = 1,060,000 Pa substituted into Equation (4)); the vessel is assumed to burst at its operating pressureCredible (operating)
BLEVE fireball fuel participation 100% of 185 kgUpper-bound screening scenario: entire vessel inventory participates in fireballConservative
VCE explosion efficiency (η) 10% (0.1)Value from chemical process explosion-evaluation guidelines; sensitivity to both η and V given in Section 3.2.3 (R = 10.4–17.1 m)Conservative
VCE effective explosion volume 15.3 m3 (8.43 + 6.9)Full cabinet volume conservatively treated as reactive, added to CFD cloud volume; sensitivity to this assumption given in Section 3.2.3Conservative
Table 4. Numerical settings and boundary conditions used for the CFD simulations (ANSYS Fluent).
SettingValue/Specification
SolverPressure-based, steady-state; 25,000 iterations
Turbulence modelStandard k–ε with standard wall functions
Pressure–velocity couplingSIMPLE
Spatial discretizationPressure: Standard; momentum, species, k, ε: first-order upwind
Convergence criteria (scaled residuals)10−3 (continuity, momentum, k, ε, species); 10−6 (energy)
Density/species diffusionIdeal gas; kinetic theory, turbulent Schmidt number 0.7
Material propertiesPropylene and air from the Fluent material database
Leak sourceMass-flow inlet, 1.48 kg/s at 300 K; cylinder top valve, vertically upward; turbulence intensity 10%, hydraulic diameter 12.7 mm
Supply grilles150 openings (12 mm × 110 mm, total open area ≈ 0.198 m2), represented as a single lumped inlet surface; turbulence intensity 10%, hydraulic diameter 0.5 m (based on the lumped inlet surface)
Cabinet exhaustPressure outlet, −200 Pa (emergency mode); four 6-inch ducts discharging outside the computational domain
BSGS room ventilation8000 CMH (four units × 2000 CMH)
WallsAdiabatic, no-slip, standard wall function
Ambient conditions25 °C, 101,325 Pa; gravity included
MeshUnstructured tetrahedral; 3.39 M cells (room), 2.76 M cells (cabinet); minimum cell 0.7 mm at leak; max. skewness 0.841, min. orthogonal quality 0.208
Table 6. EFFECTS input parameters and results for the BLEVE fireball thermal-radiation analysis at 25%, 50%, 75%, and 100% inventory participation (Gexcon EFFECTS 13.1.0). Ambient temperature 25 °C, relative humidity 83%, vessel volume 0.44 m3, damage threshold 5 kW/m2.
Parameter25%50%75%100% (Base Case)
Duration of the fireball (s)2.542.963.253.48
Maximum diameter of the fireball (m)23.128.332.135.1
Surface emissive power, clear flame (kW/m2)244.2256.8265.0271.1
Distance to 5 kW/m2 (m)678394104
Table 8. Summary of explosion impact assessment results.
Explosion Scenario TypeDamage Threshold CriterionMaximum Consequence Impact Distance
Pressure Vessel Burst (PVB)Overpressure:
1 psi (7 kPa)
12.0 m
VCE (Vapor Cloud Explosion)Overpressure:
1 psi (7 kPa)
13.6 m
BLEVE fireballThermal Radiation:
5 kW/m2
104.0 m
Disclaimer/Publisher’s Note: The statements, opinions and data contained in all publications are solely those of the individual author(s) and contributor(s) and not of MDPI and/or the editor(s). MDPI and/or the editor(s) disclaim responsibility for any injury to people or property resulting from any ideas, methods, instructions or products referred to in the content.