Article

Relationship Between Pore-Throat and Pressure in Oil Charging in Tight Conglomerate Reservoirs of the Xiazijie Formation in Manan Area, Junggar Basin: Proved from NMR Experiment


1
Research Institute of Exploration and Development, PetroChina Xinjiang Oilfield Company, Karamay 834000, China
2
School of Geophysics and Petroleum Resources, Yangtze University, Wuhan 430100, China
3
School of Petroleum Engineering, Yangtze University, Wuhan 430100, China
*
Author to whom correspondence should be addressed.
Processes 2026, 14(18), 2997; https://doi.org/10.3390/pr14182997 (registering DOI)
Submission received: 30 July 2026 / Revised: 6 September 2026 / Accepted: 10 September 2026 / Published: 20 September 2026
(This article belongs to the Section Petroleum and Low-Carbon Energy Process Engineering)

Abstract

The Xiazijie Formation in the Manan Area, Junggar Basin, is an extra-low- to ultra-low-porosity and -permeability deep conglomerate reservoir. The relationship between pore-throat and pressure in oil charging in this tight reservoir is undefined at the initial exploration stage. By combining high-pressure Hg injection with one-dimensional nuclear magnetic resonance (NMR) experiments, a conversion relationship between relaxation time in NMR and pore-throat radius during high-pressure Hg injection was established. Online NMR displacement experiments were conducted at pressures of 2, 5, 15, 25, 35, and 45 MPa. The variation patterns of reservoir oil saturation and the lower limit of the oil-charged pore-throat radius were investigated. The results show that the oil saturation of conglomerate reservoirs ranges from 8% to 32% at a charging pressure of 2 MPa, and from 19% to 52% at a pressure of 45 MPa. The average oil saturation follows a monotonically increasing power function with charging pressure. Oil saturation rapidly increases as charging pressure increases at low pressures, while it gradually increases at high pressures. The lower limit of the oil-charged pore-throat radius ranges from 12 to 82 nm at a charging pressure of 2 MPa, and from 8 to 20 nm at 45 MPa. This lower limit follows a monotonically decreasing power function with charging pressure. The lower limit of the oil-charged pore-throat radius rapidly decreases as charging pressure increases at low values, whereas it gradually decreases with a further increase in charging pressure. Understanding the relationship between oil saturation and the oil-charged pore-throat radius lower limit at different charging pressures could improve the understanding of the reservoir-forming rules and liquid-injection development in the tight conglomerate reservoir of the Xiazijie Formation in the Manan Area.

1. Introduction

The Junggar Basin is an important hydrocarbon-rich area in northwestern China. In the basin, the Mahu Sag is the largest hydrocarbon-rich sag. Two large oil zones, Kewu and Mahu, have been discovered in the peripheral thrust belt and the slope area of the sag. Several areas with reserves of 100 million tons have been established, which confirms the possibility of exploring a whole petroleum system in which conventional and unconventional oil and gas coexist in an orderly manner [1,2,3]. The Lower Permian Fengcheng Formation is the main source rock interval in the Mahu Sag. It is continuously and widely distributed and has a unique hydrocarbon-generation type. The source rock has undergone multiple stages of intense hydrocarbon generation and expulsion, providing an important material basis for large-scale hydrocarbon accumulation [4,5]. Coarse-grained fan-delta deposits developed in the Middle Permian Xiazijie Formation, which is the first reservoir interval overlying the Fengcheng Formation source rocks [6,7]. With large depositional thickness, the Xiazijie Formation was vertically charged by whole hydrocarbon and laterally distributed throughout the whole area. The overlying Lower Wuerhe Formation serves as a regional caprock. This results in a favorable source-reservoir-caprock assemblage in the Xiazijie Formation [8]. At present, hydrocarbon exploration and development of the Xiazijie Formation are in the initial stage and are mainly concentrated in the southern part of the sag, the Manan Area. Multiple oil reservoirs have been proven near the fault zone, with developed producing petroleum reserves of 1.3 × 10⁸ t. A favorable area of 372 km2 has been confirmed, with controlled reserves of 0.3 × 10⁸ t and predicted reserves exceeding 1.1 × 10⁸ t. It is one of the major replacement domains for large-scale reserve growth and production increase in the Mahu Sag. With an average daily oil production of 15.7 t, the reservoirs have been tested in low oil saturation in more than 30 wells. However, the burial depth of the Xiazijie Formation generally exceeds 3500 m in the Manan Area. The conglomerate lithology of the Xiazijie Formation is complex; the reservoir physical properties are poor; the heterogeneity is strong; and the differences in burial depth and formation pressure are large. The dynamic mechanism of oil saturation and the lower limit of the oil-charged pore-throat radius in different hydrocarbon charging pressures remain unclear.
Unlike conventional oil and gas reservoirs, hydrocarbon charging in tight reservoirs must overcome greater capillary forces before entering nanoscale pore-throats [9,10,11]. The lower limit of the pore-throat radius for hydrocarbon charged under accumulation pressure is one of the key parameters in the exploration and development of tight oil and gas reservoirs [12,13,14]. By integrating rock mechanics, mud logging, effective pore-throat analysis, and other methods, Deng et al. [15] determined that the lower limits of the charged pore-throat diameter at the source-reservoir interface and in the reservoir of the Chang 8 tight sandstone interval in the Fuxian Area, Ordos Basin, are 15.77 nm and 24 nm, respectively. Li [16] used multiple analytical and testing datasets to establish a relationship model between charging pressure and the lower limit of the charged pore-throat radius and identified the lower limit of the effective charged pore-throat radius as approximately 100 nm in the Chang 7 tight sandstone reservoir of the Yanchang Formation in the Ordos Basin. Wang et al. [17] integrated high-pressure Hg injection, NMR experiments, mud logging, oil testing, and other data to determine that the lower limit of the charged pore-throat radius of the Chang 8 reservoir in the Maling Area of the Ordos Basin is 77 nm. Jiang et al. [18] developed an online three-dimensional microscopic imaging system for core-fluid displacement and established a quantitative evaluation method for the oil charging degree of image-resolvable pores and pore-throats. However, few studies have yet addressed the coupling relationship between the oil-charged pore-throat radius and charging pressure in tight conglomerate reservoirs in the Junggar Basin.
In recent years, increasingly improved online NMR displacement experiments have provided a new method for quantitatively characterizing the occurrence states of oil (gas) and water in tight reservoirs under different charging pressures [19,20,21]. To understand the relationship between pore-throat and pressure during oil charging in the tight conglomerate reservoirs of the Xiazijie Formation in the Manan Area, 16 tight conglomerate samples were acquired from four cored wells. High-pressure Hg injection and one-dimensional NMR experiments were combined to establish the conversion relationship between the relaxation time in NMR and pore-throat radius in high-pressure Hg injection. Online NMR displacement was then used to simulate the variation patterns of reservoir oil saturation and the lower limit of the charged pore-throat radius under oil charging pressures of 2 MPa, 5 MPa, 15 MPa, 25 MPa, 35 MPa, and 45 MPa. The results would support the exploration and development of favorable tight conglomerate reservoirs in the Xiazijie Formation of the Manan Area.

2. Geological Setting

2.1. Stratigraphic Characteristics

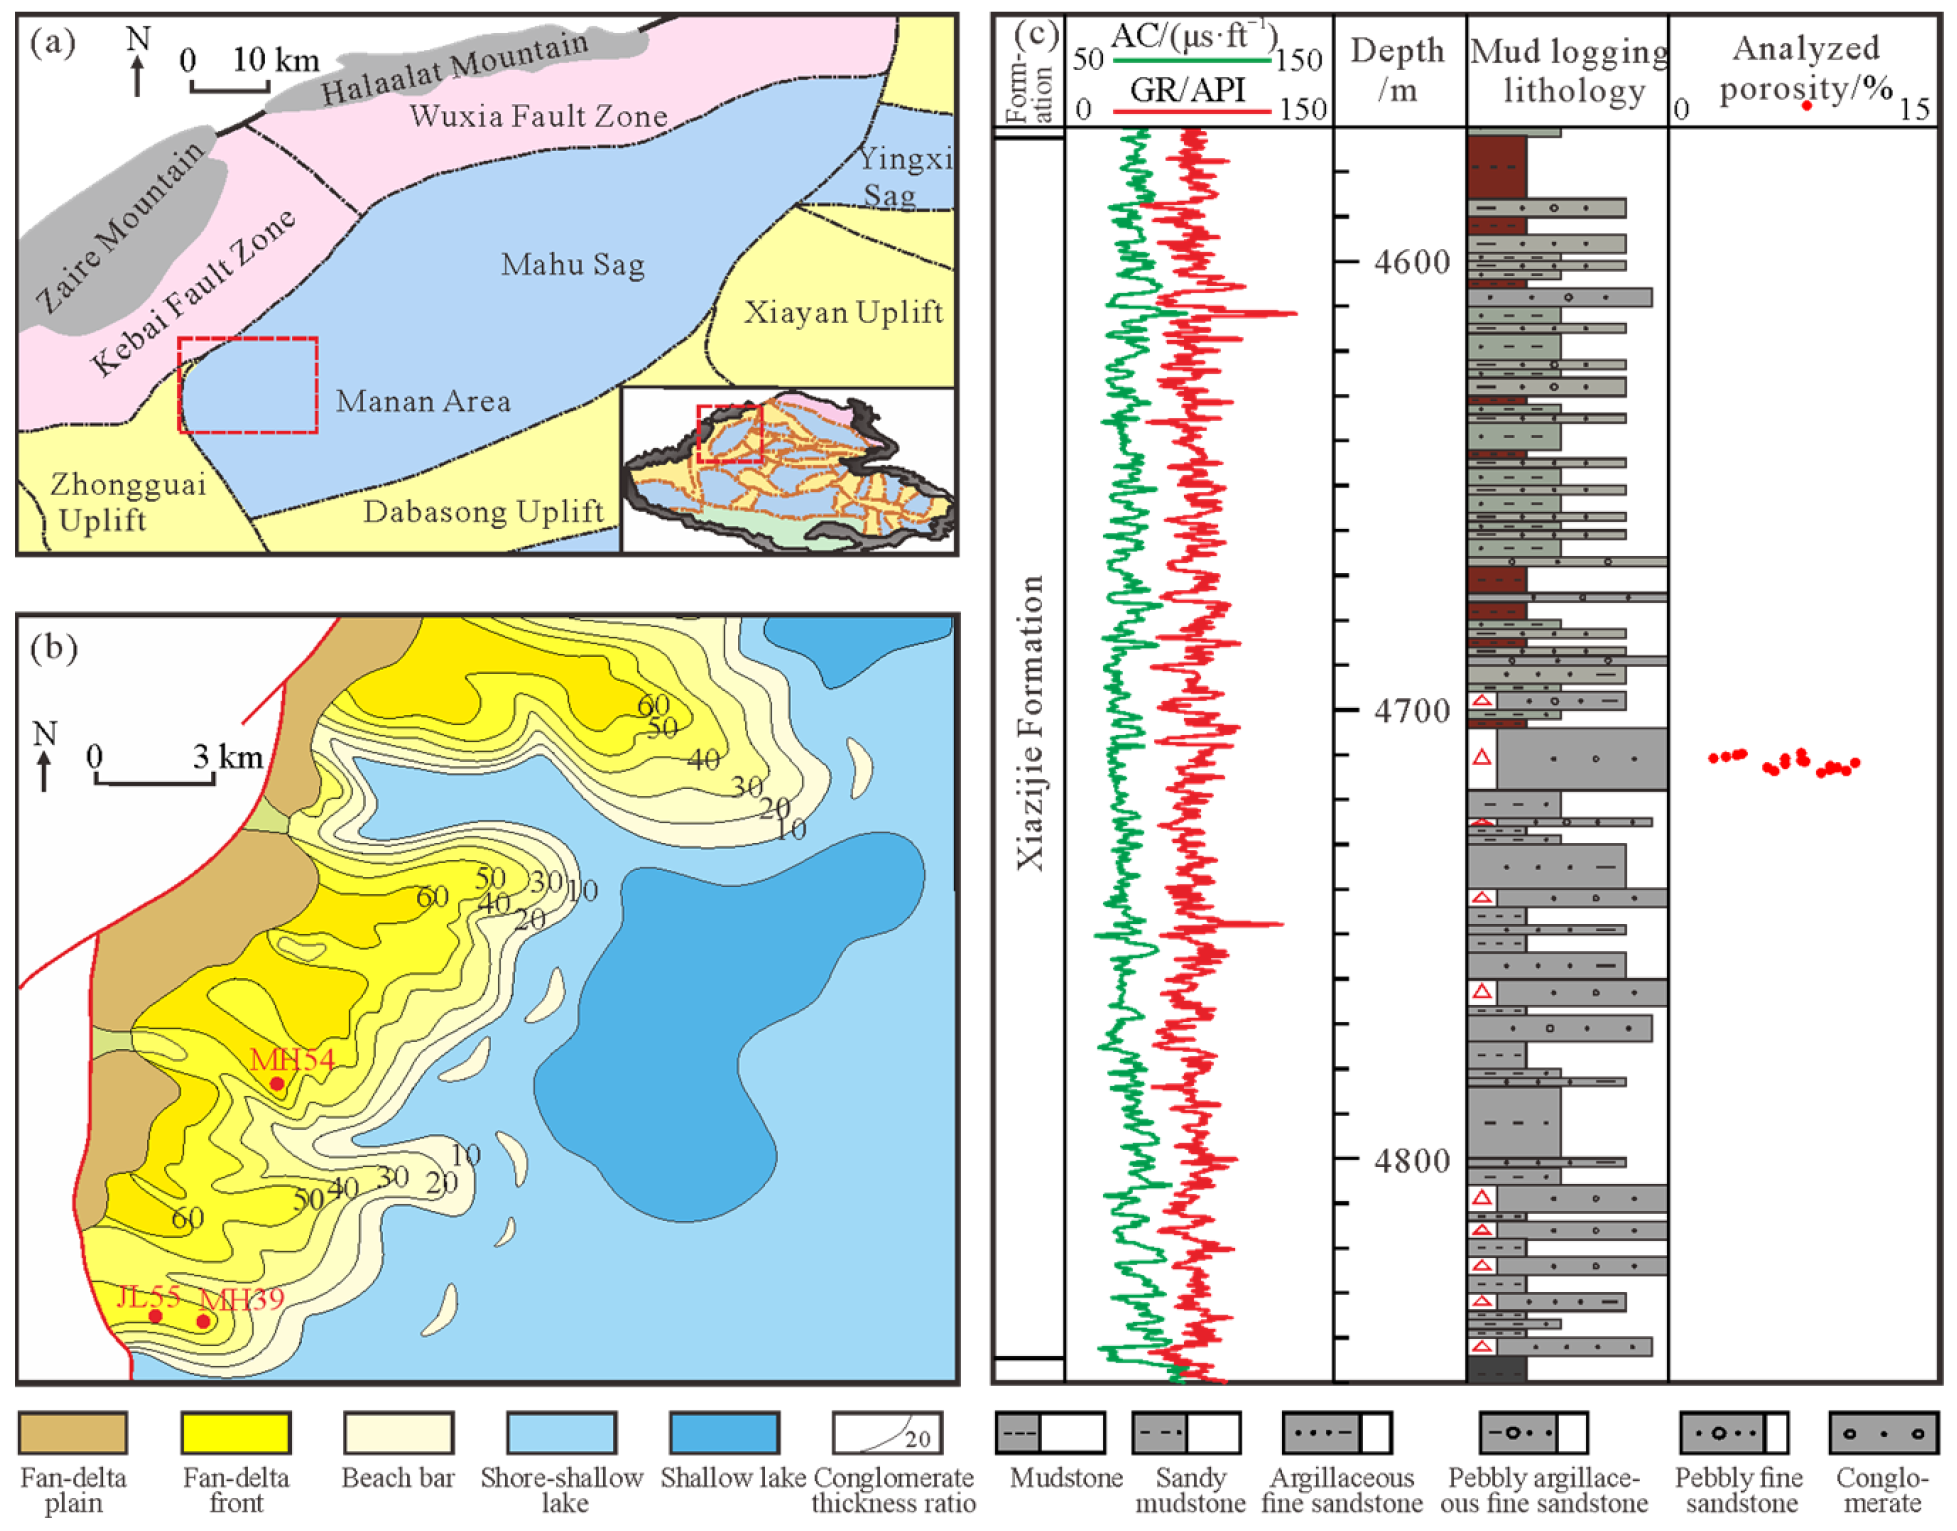
Structurally, the Mahu Sag is located on the northwestern margin of the Junggar Basin. It is adjacent to the Xiayan Uplift and Yingxi Sag to the east, the Kebai and Wuxia Fault Zones to the northwest, and the Zhongguai and Dabasong Uplifts to the south (Figure 1a) [22]. From bottom to top, the stratigraphic succession of the Mahu Sag consists of the Carboniferous (C), Permian (P), Triassic (T), Jurassic (J), and Cretaceous (K). In the Permian, the Jiamuhe Formation (P1j), Fengcheng Formation (P1f), Xiazijie Formation (P2x), Lower Wuerhe Formation (P2w), and Upper Wuerhe Formation (P3w) were deposited successively. Controlled by paleogeomorphology and provenance, a restricted lacustrine fan-delta depositional system developed in the Xiazijie Formation (Figure 1b). The formation lithology is characterized by interbedded conglomerate, fines, and mudstone (Figure 1c).

2.2. Reservoir Characteristics

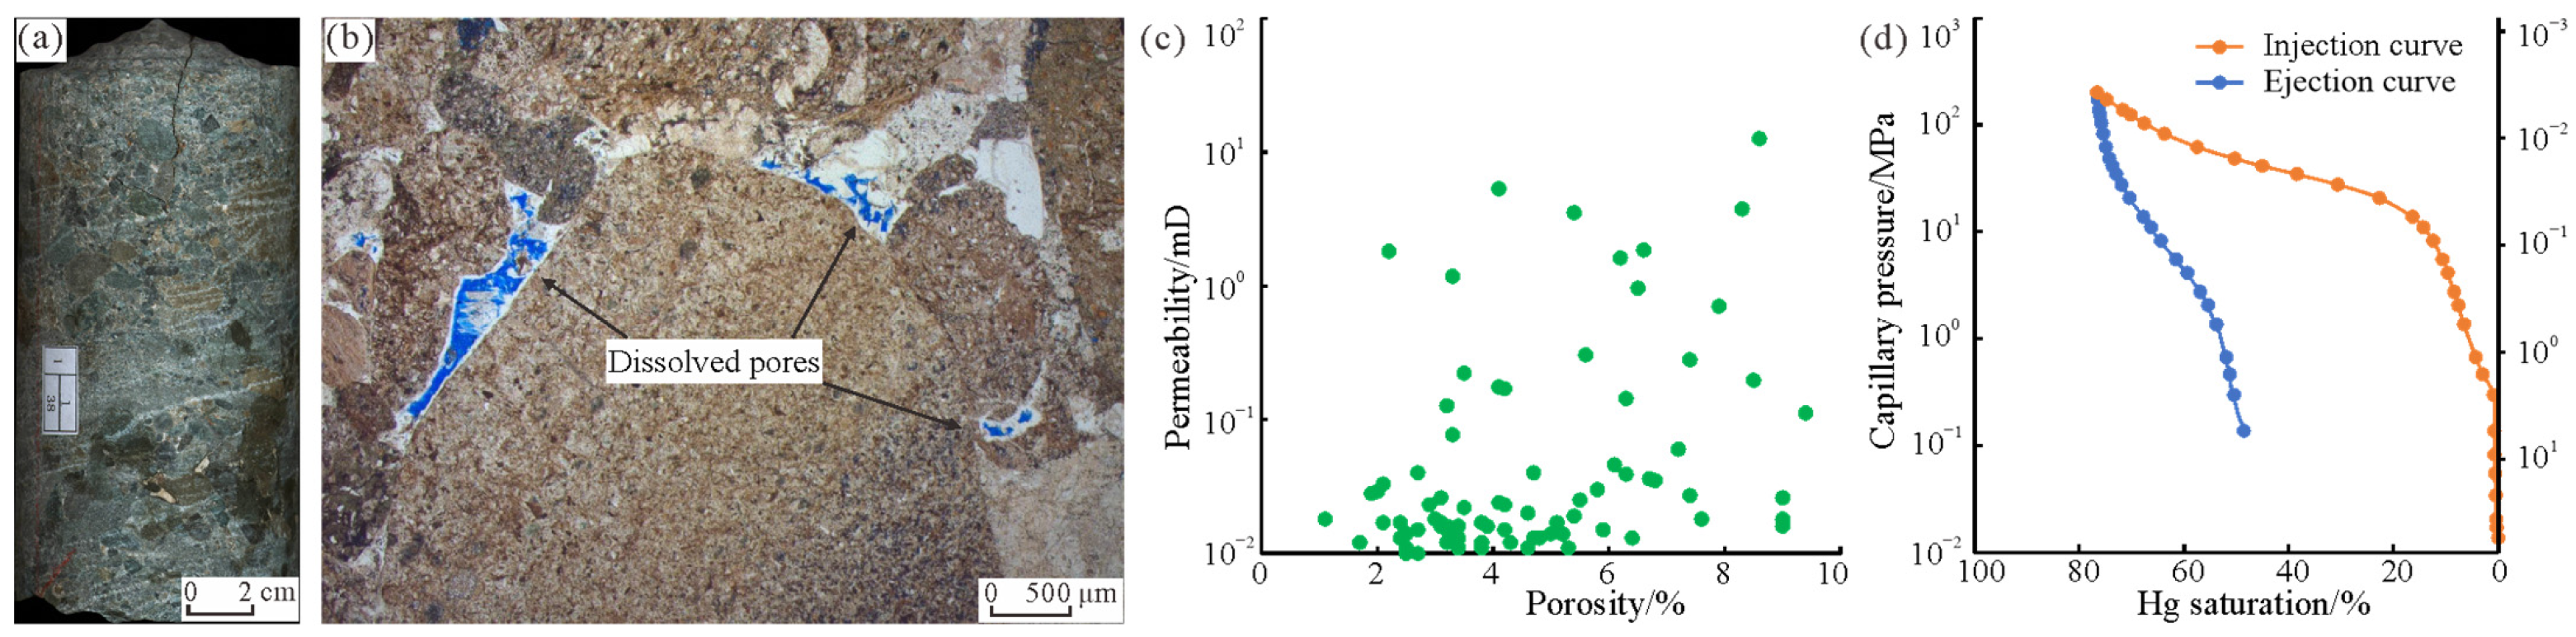
The grain size of the conglomerate in the Xiazijie Formation in the Manan Area is dominated by pebbles and granules, with abundant sand as supporting grains (Figure 2a). The conglomerates are mainly derived from volcanic clasts such as andesite, tuff, and dacite. The interstitial materials contain high proportions of sand and mud, and laumontite, calcite, and clay minerals are the main cements [22]. The conglomerate reservoirs of the Xiazijie Formation mainly develop intergranular dissolution pores and intragranular dissolution pores (Figure 2b), with porosity mainly ranging from 3% to 10% (averaging 5.1%) and permeability ranging from 0.01 to 10 mD (averaging 0.1 mD). They are classified as extra-low to ultra-low porosity–permeability reservoirs, with a poor porosity–permeability relationship (Figure 2c) [7]. According to the high-pressure Hg intrusion experiment, the maximum pore-throat radius ranges from 0.5 to 1.3 μm, the average pore-throat radius is ~15 nm, Hg ejection efficiency is low, and the median and drainage pressures are high. The reservoir characteristics of the conglomerate in the Xiazijie Formation indicate a complicated pore-throat structure (Figure 2d).

3. Databases and Methods

3.1. Research Procedure

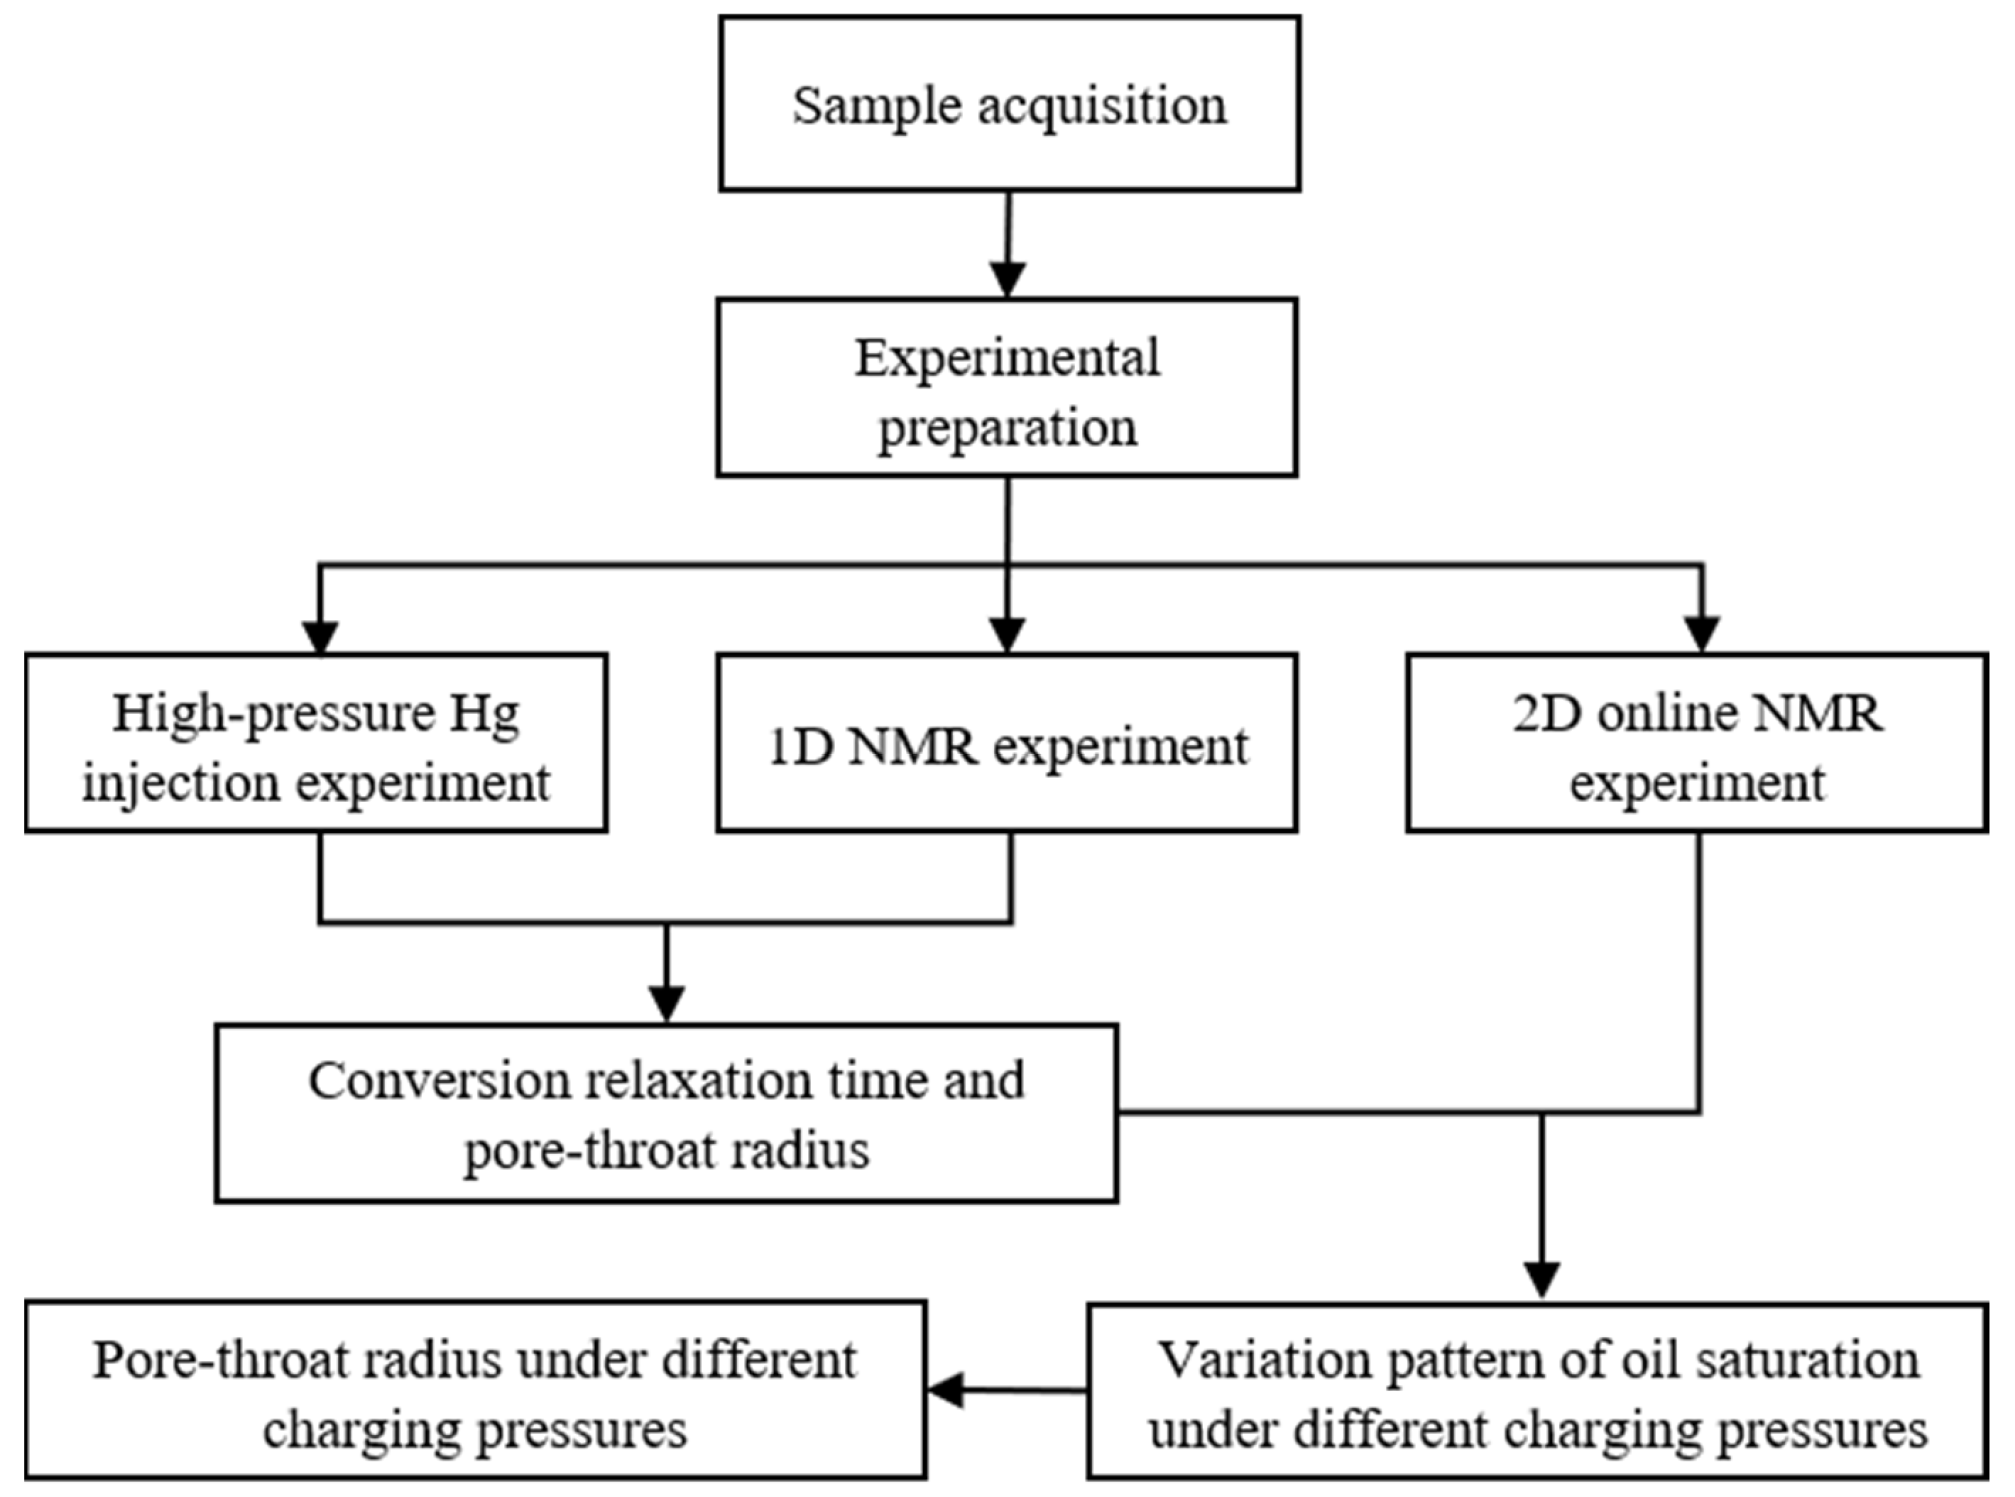
To understand the relationship between pore-throat characteristics and oil charging pressure in tight conglomerate reservoirs based on NMR experiments, it is crucial to elucidate the primary petrophysical features of the Xiazijie Formation. This study comprises five stages (Figure 3). The first stage involves sample acquisition. Based on the reservoir characteristics of the Xiazijie Formation in the Manan Area, 16 samples with a diameter of 2.5 cm were drilled from full-diameter cores collected from four wells, including one pair of parallel samples. The samples were cut by wire to obtain standard cylindrical samples with a height of 5 cm.
The second stage is experimental preparation. Sample pretreatment and subsequent experimental analyses were performed at the Hubei Key Laboratory of Oil and Gas Drilling and Production Engineering (Yangtze University). The cylindrical samples were successively subjected to oil washing and salt washing by soaking to remove residual oil and salts. After drying and weighing, helium porosity and permeability tests were conducted using the CMS-400 automatic overburden measurement system manufactured by Core Laboratories.
The third stage involves Hg injection and NMR experiments. One sample from the pair of parallel samples was selected for the high-pressure Hg injection experiment using the AutoPore IV-9510 fully automatic Hg porosimeter manufactured by Micromeritics Instrument Corporation. The other sample was saturated with water under a pressure of 30 MPa for 2d and then centrifuged for one-dimensional NMR testing. The remaining 14 samples were used for two-dimensional online NMR displacement experiments. The fourth stage establishes the conversion relationship between relaxation time and pore-throat radius. Finally, variation patterns of oil saturation and pore-throat radius under different charging pressures are discussed in the fifth stage.

3.2. NMR Experiment

At a room temperature of 25 °C, one-dimensional NMR experiments and two-dimensional online NMR displacement experiments were conducted using the MacroMR12-150H-I large-bore NMR analysis and imaging system manufactured by Niumag Analytical Instrument Corporation, Suzhou, Jiangsu Province, China. The experimental procedure followed the Chinese petroleum and natural gas industry standard ‘Specification for measurement of rock NMR parameter in laboratory’ (SY/T6490—2023). The instrument sampling frequency was set to 200 kHz, waiting time to 3000 ms, echo spacing to 0.12 ms, and the number of sampling echoes to 12,000. Aviation kerosene with a density of 0.795 g/cm3 (25 °C) was selected as the charging medium for the two-dimensional online NMR displacement experiment. The procedures of the two-dimensional online NMR displacement experiment were as follows. (a) The two-dimensional NMR spectrum and total signal intensities of oil and water were standardized with volumes of 0.1 mL, 0.5 mL, 1.0 mL, 1.5 mL, and 2.0 mL, respectively, to determine the conversion relationship between the NMR signal and fluid volume. (b) Dry samples were saturated with water under a pressure of 30 MPa for 2d, and then the T2T1 two-dimensional NMR spectra of the water-bearing samples were measured. (c) After oil charging for 5 h under displacement pressures of 2 MPa, 5 MPa, 15 MPa, 25 MPa, 35 MPa, and 45 MPa, respectively, the T2T1 two-dimensional NMR spectra were measured again. (d) Based on the conversion relationship between the NMR signal and the fluid volume, the oil saturation of the samples under different charging pressures was calculated.

3.3. Conversion Relaxation Time and Pore-Throat Radius

High-pressure Hg injection experiments can yield the pore-throat radius distribution of cores. One-dimensional NMR experiments can measure relaxation time and porosity component data. Li et al. [23] established the conversion relationship between relaxation time and pore-throat radius using the cumulative distribution curves of high-pressure Hg injection pore-throat radius and relaxation time. Liu et al. [24] and Li et al. [25] used this conversion relationship to quantitatively characterize the fluid mobility and pore structure characteristics of tight conglomerate reservoirs. Firstly, cumulative distribution curves of high-pressure Hg injection pore-throat radius and relaxation time were plotted simultaneously. Secondly, both cumulative distribution frequencies below the maximum Hg intrusion saturation were selected. Thirdly, taking the scale of the cumulative distribution data of high-pressure Hg injection pore-throat radius as the standard, the cumulative distribution data of relaxation time were interpolated. Finally, the conversion formula between NMR relaxation time and high-pressure Hg injection pore-throat radius was fitted [23,24,25]:
r = C T 2 1 n
where r is the pore-throat radius, μm; T2 is the NMR relaxation time, ms; and C and n are the dimensionless conversion coefficient and exponent, respectively. In this study, a cubic spline function program was developed using Python 3.10 to interpolate the cumulative distribution data of the relaxation time. The parameters C and n were fitted in Microsoft Excel. Interested readers can contact the corresponding author to obtain the related code and declassified experimental datasets free of charge.

4. Results

4.1. Online NMR Charging

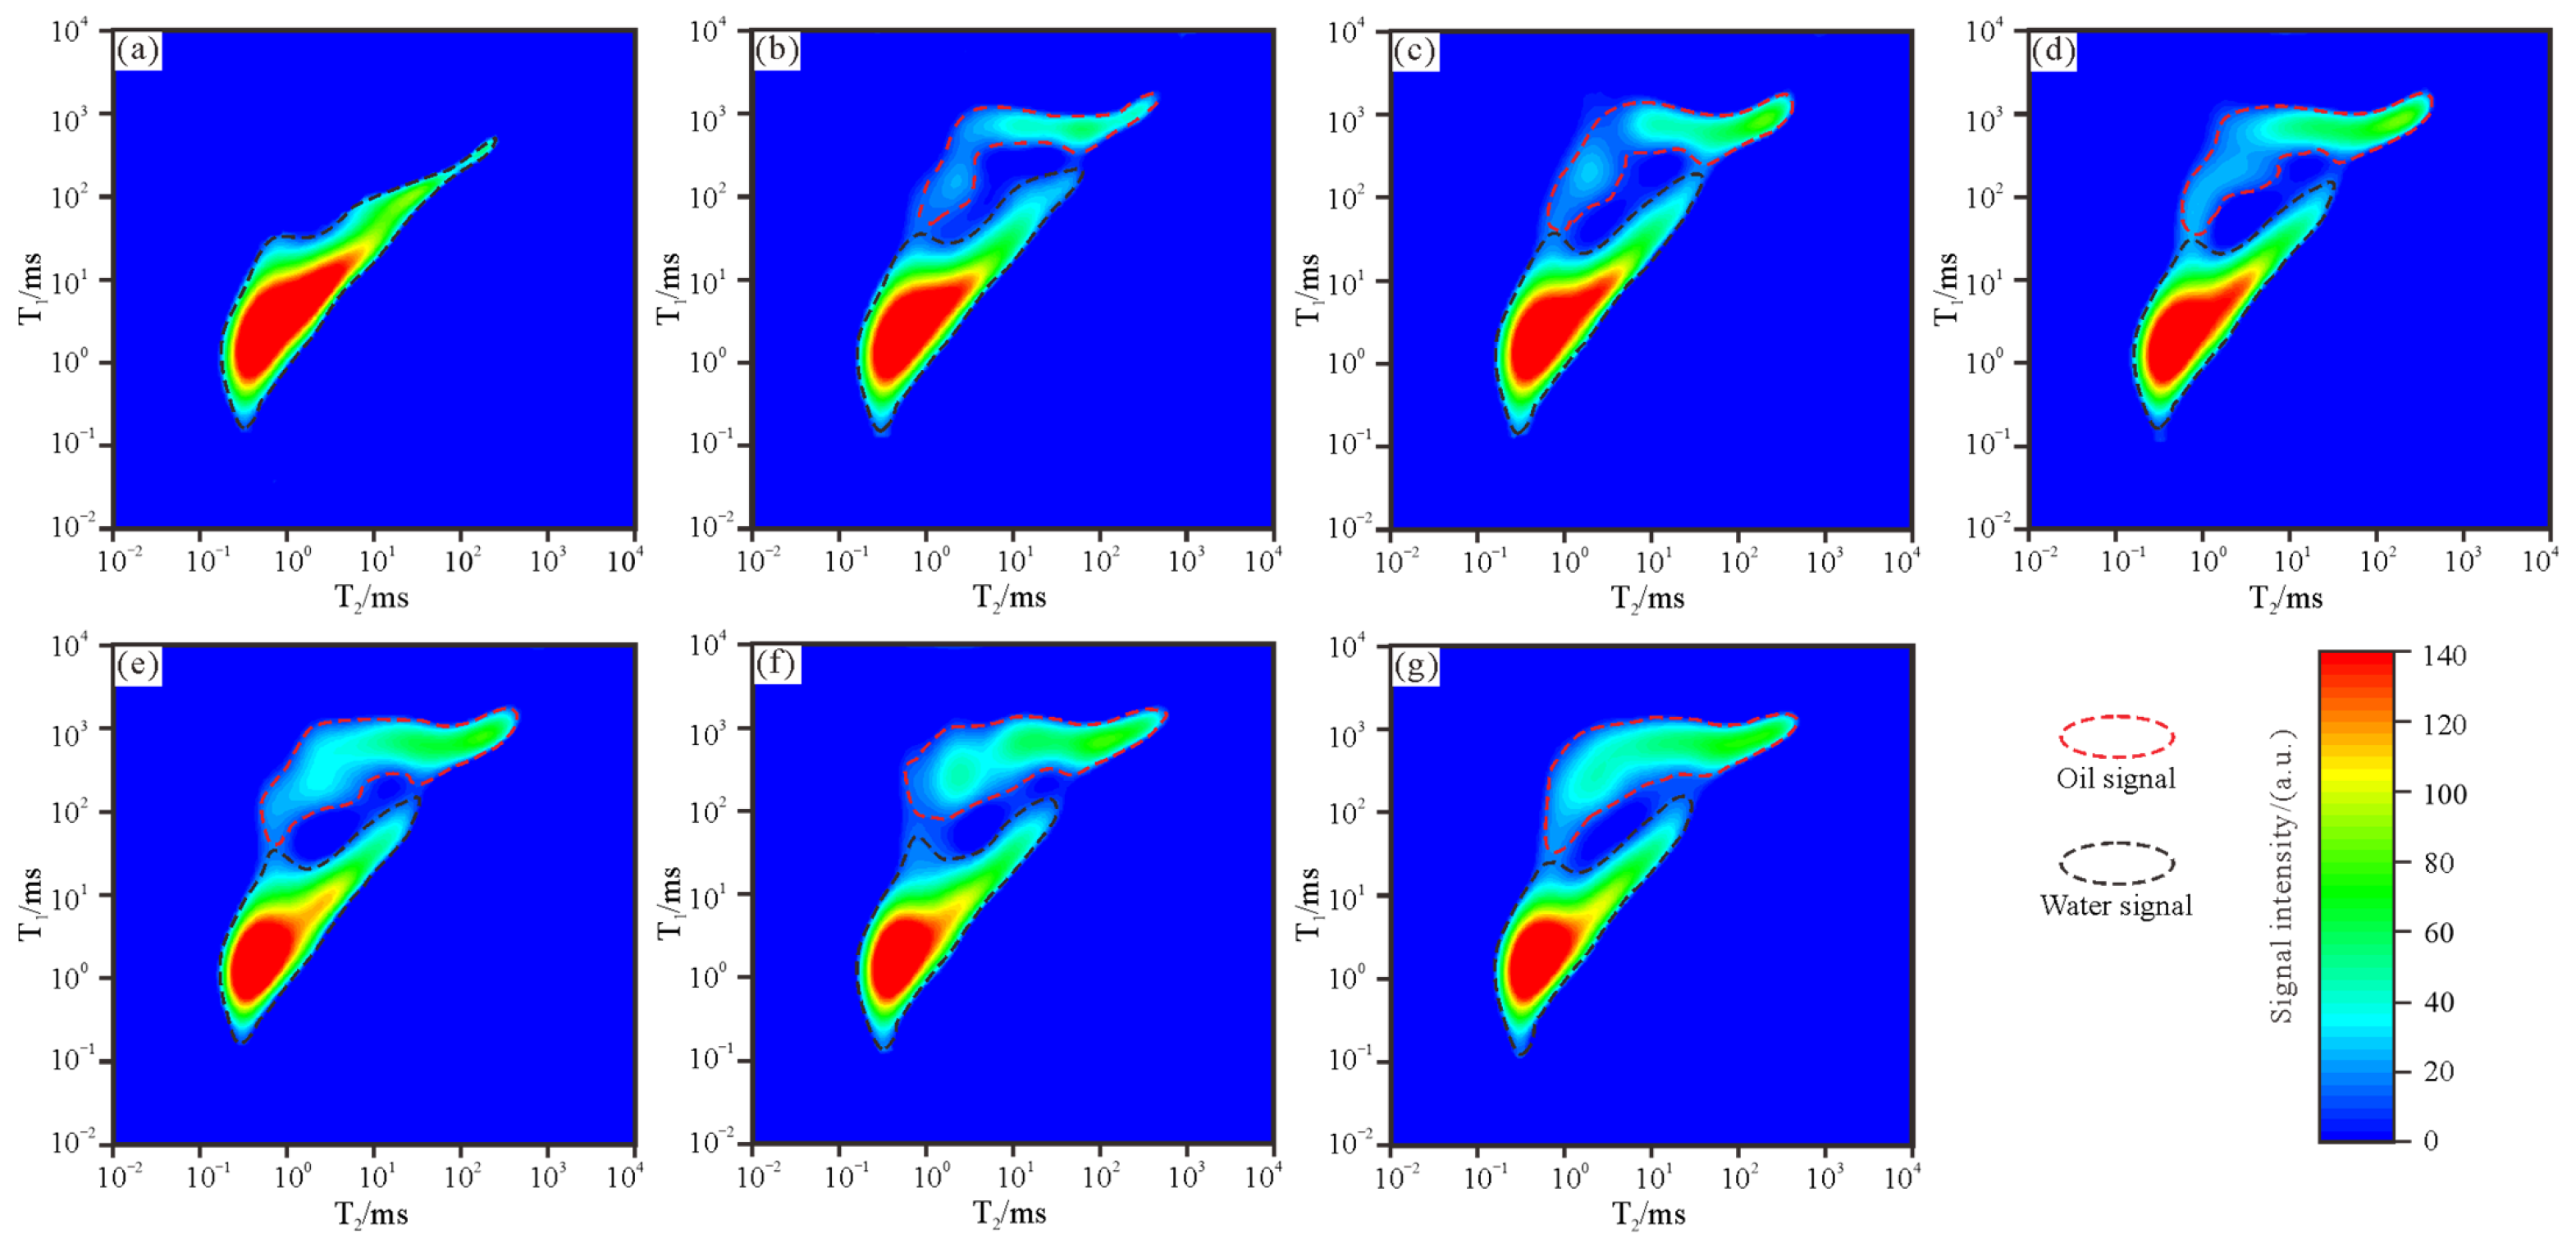
After kerosene was displaced into tight conglomerate samples for 5 h under charging pressures of 2 MPa, 5 MPa, 15 MPa, 25 MPa, 35 MPa, and 45 MPa, the NMR signals of oil and water molecules were measured. In the T2T1 two-dimensional NMR spectra, the area of the oil NMR signal gradually increased, indicating that oil molecules progressively entered the rock pore-throats. For example, the conglomerate sample from 4715.84 m in Well JL55 has a porosity of 6.92% and a permeability of 0.131 mD. Its T2T1 two-dimensional NMR spectra under different charging pressures and the variation in oil saturation are shown in Figure 4a–g. When kerosene began to enter the sample, oil signals appeared in the upper part of the NMR spectrum. When the charging pressure was 2 MPa, the oil saturation of the sample rapidly increased to 18.9%; when the charging pressure was 5 MPa, the oil saturation was 27.3%; when the charging pressure exceeded 15 MPa, the oil saturation increased slowly from 31.4% to 38.7% under a charging pressure of 45 MPa.

4.2. NMR Pore-Throat Radius

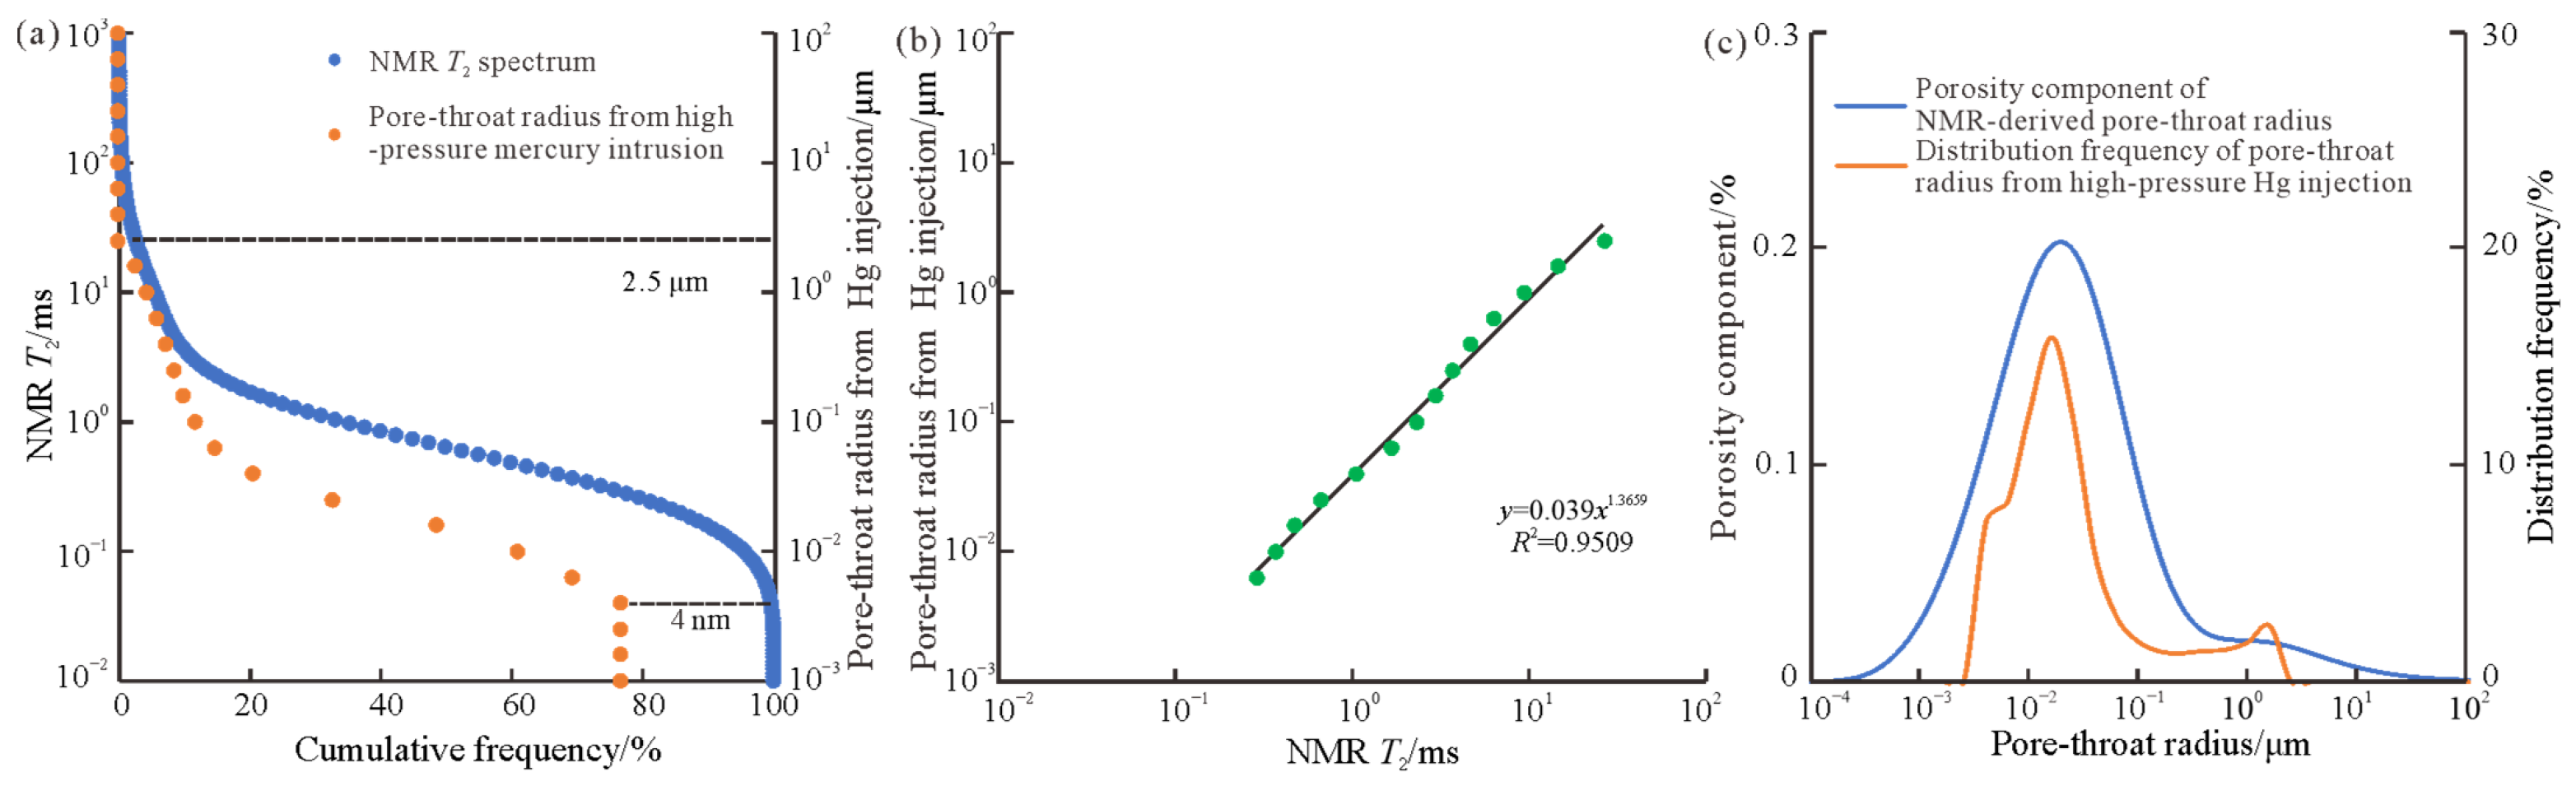
High-pressure Hg injection experiments provide an effective method for converting NMR relaxation time into pore-throat radius. The T2 spectrum of a water-saturated core reflects the response characteristics of all pore-throats in the rock. In high-pressure Hg injection experiments, however, Hg cannot be completely injected into small pores. The pore-throat radius distribution obtained from Hg intrusion cannot characterize pore-throat information beyond the maximum Hg intrusion saturation. Therefore, only the cumulative distribution data of the T2 spectrum corresponding to the Hg intrusion pore-throat radius distribution are selected to establish the conversion relationship between relaxation time and pore-throat radius. The cumulative distribution curves of high-pressure Hg injection pore-throat radius and relaxation time from one pair of parallel samples are shown in Figure 5a. The maximum Hg saturation in the high-pressure Hg injection experiment is 76.64%. The cumulative NMR relaxation time corresponding to Hg intrusion pore-throat radii ranging from 4 nm to 2.5 μm is extracted. The cubic spline interpolation method is used to match the relaxation time and Hg intrusion pore-throat radius at the same cumulative frequency scale. A power-function formula was then fitted by the least squares method, resulting in C = 0.039 and 1/n = 1.3659 for Formula (1) (Figure 5b):
r = 0.039 T 2 1.3659
Finally, the relaxation time of the NMR T2 spectrum was converted into pore-throat radius (Figure 5c). The results show that the NMR pore-throat radius distribution has a wider range, but the curve shapes of the two methods are generally consistent.

5. Discussion

5.1. Variation Pattern of Oil Saturation Under Different Charging Pressures

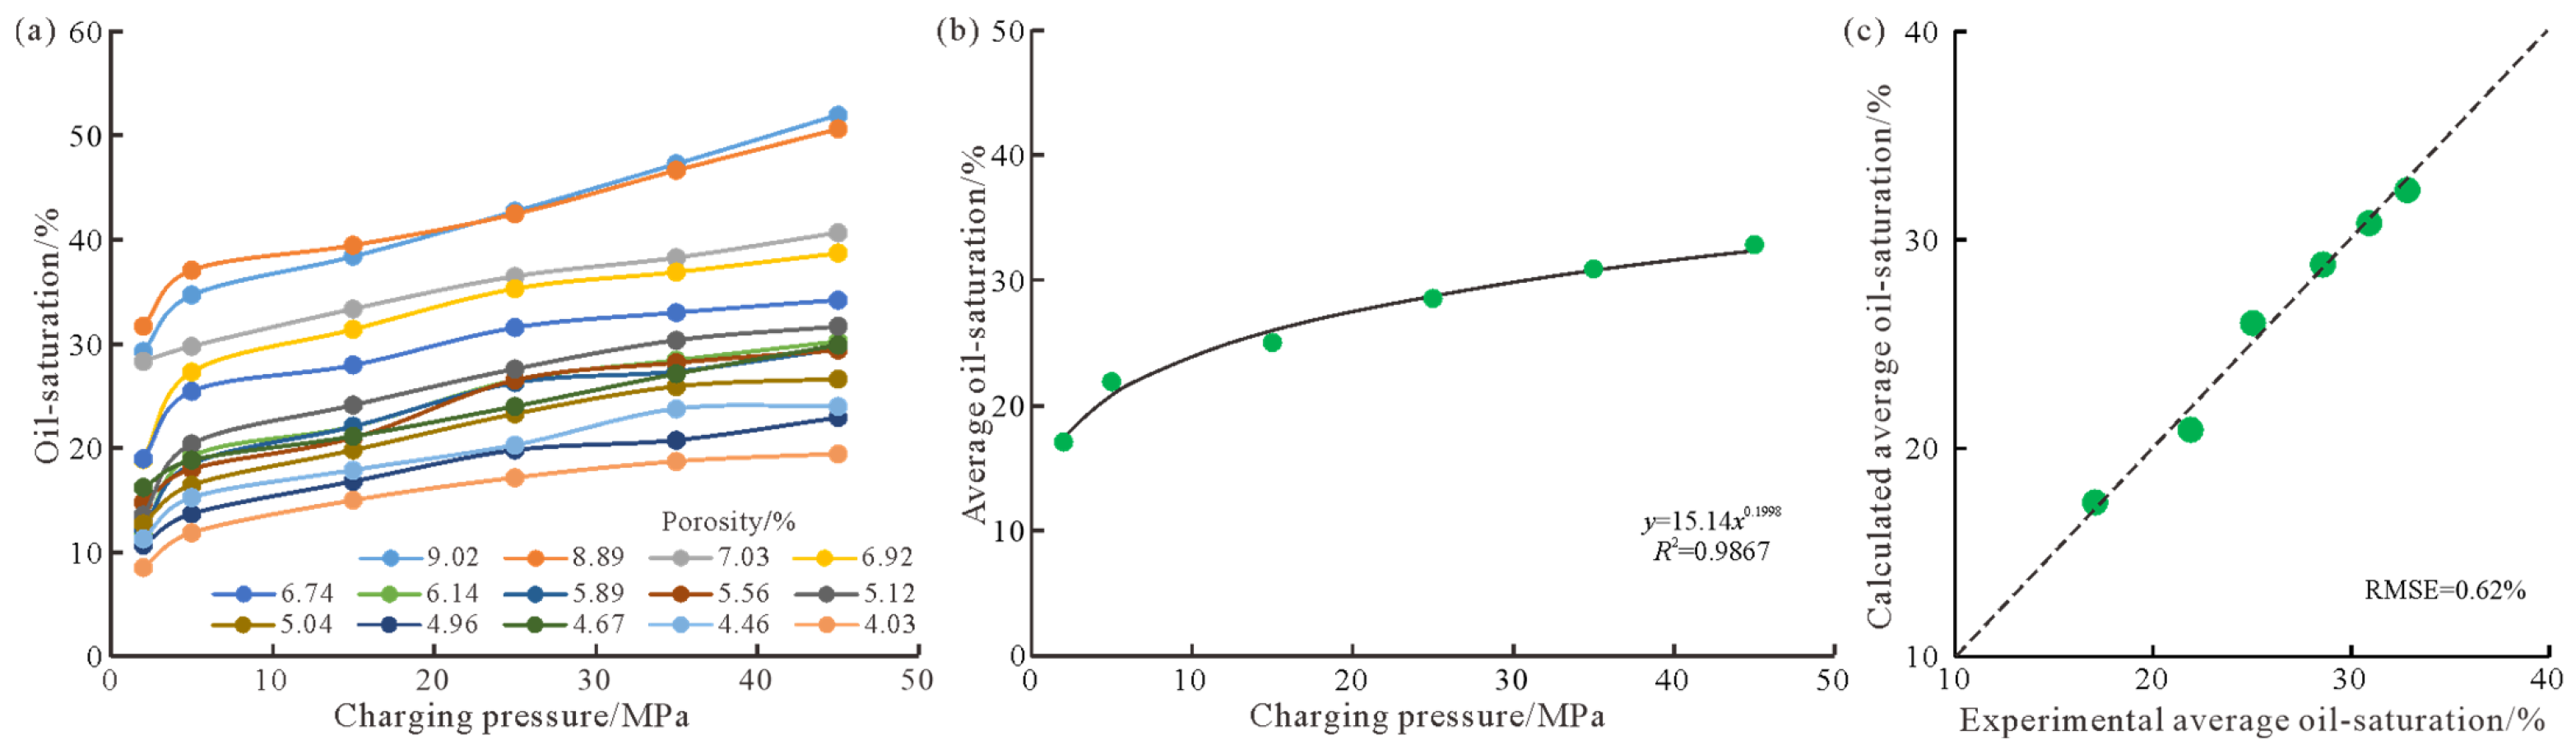
In the NMR experiments on oil charging in tight conglomerate reservoirs, online NMR displacement experiments were performed on all 14 samples. The oil saturations of the samples ranged from 8% to 32% under a charging pressure of 2 MPa. As the charging pressure increased to 45 MPa, the oil saturations ranged from 19% to 52%. The oil saturation of tight conglomerate reservoirs in the Xiazijie Formation showed a monotonically increasing relationship with charging pressure in each sample. Overall, the greater the sample porosity, the higher the oil saturation under different charging pressures (Figure 6a).
Using the least squares method, the relationship between charging average oil saturation (So) of all samples and the charging pressure (Pc) is a power function: So = 15.14 × Pc0.1998. The fitted determination coefficient R2 = 0.9867 (Figure 6b). In this power function, the root mean square error (RMSE) between the experimental and calculated charging average oil saturation is just 0.62% at 2 MPa, 5 MPa, 15 MPa, 25 MPa, 35 MPa, and 45 MPa (Figure 6c). When the charging pressure is relatively low, the reservoir oil saturation increases rapidly as the charging pressure increases; whereas at relatively high charging pressures, it increases slowly. Formation charging pressure is the primary driving force for fluid migration within reservoirs. In initially water-bearing formations, the greater the oil charging pressure and the longer the charging duration, the more oil molecules can enter the reservoir [26,27,28].

5.2. Minimum Oil-Bearing Pore-Throat Radius Under Different Charging Pressures

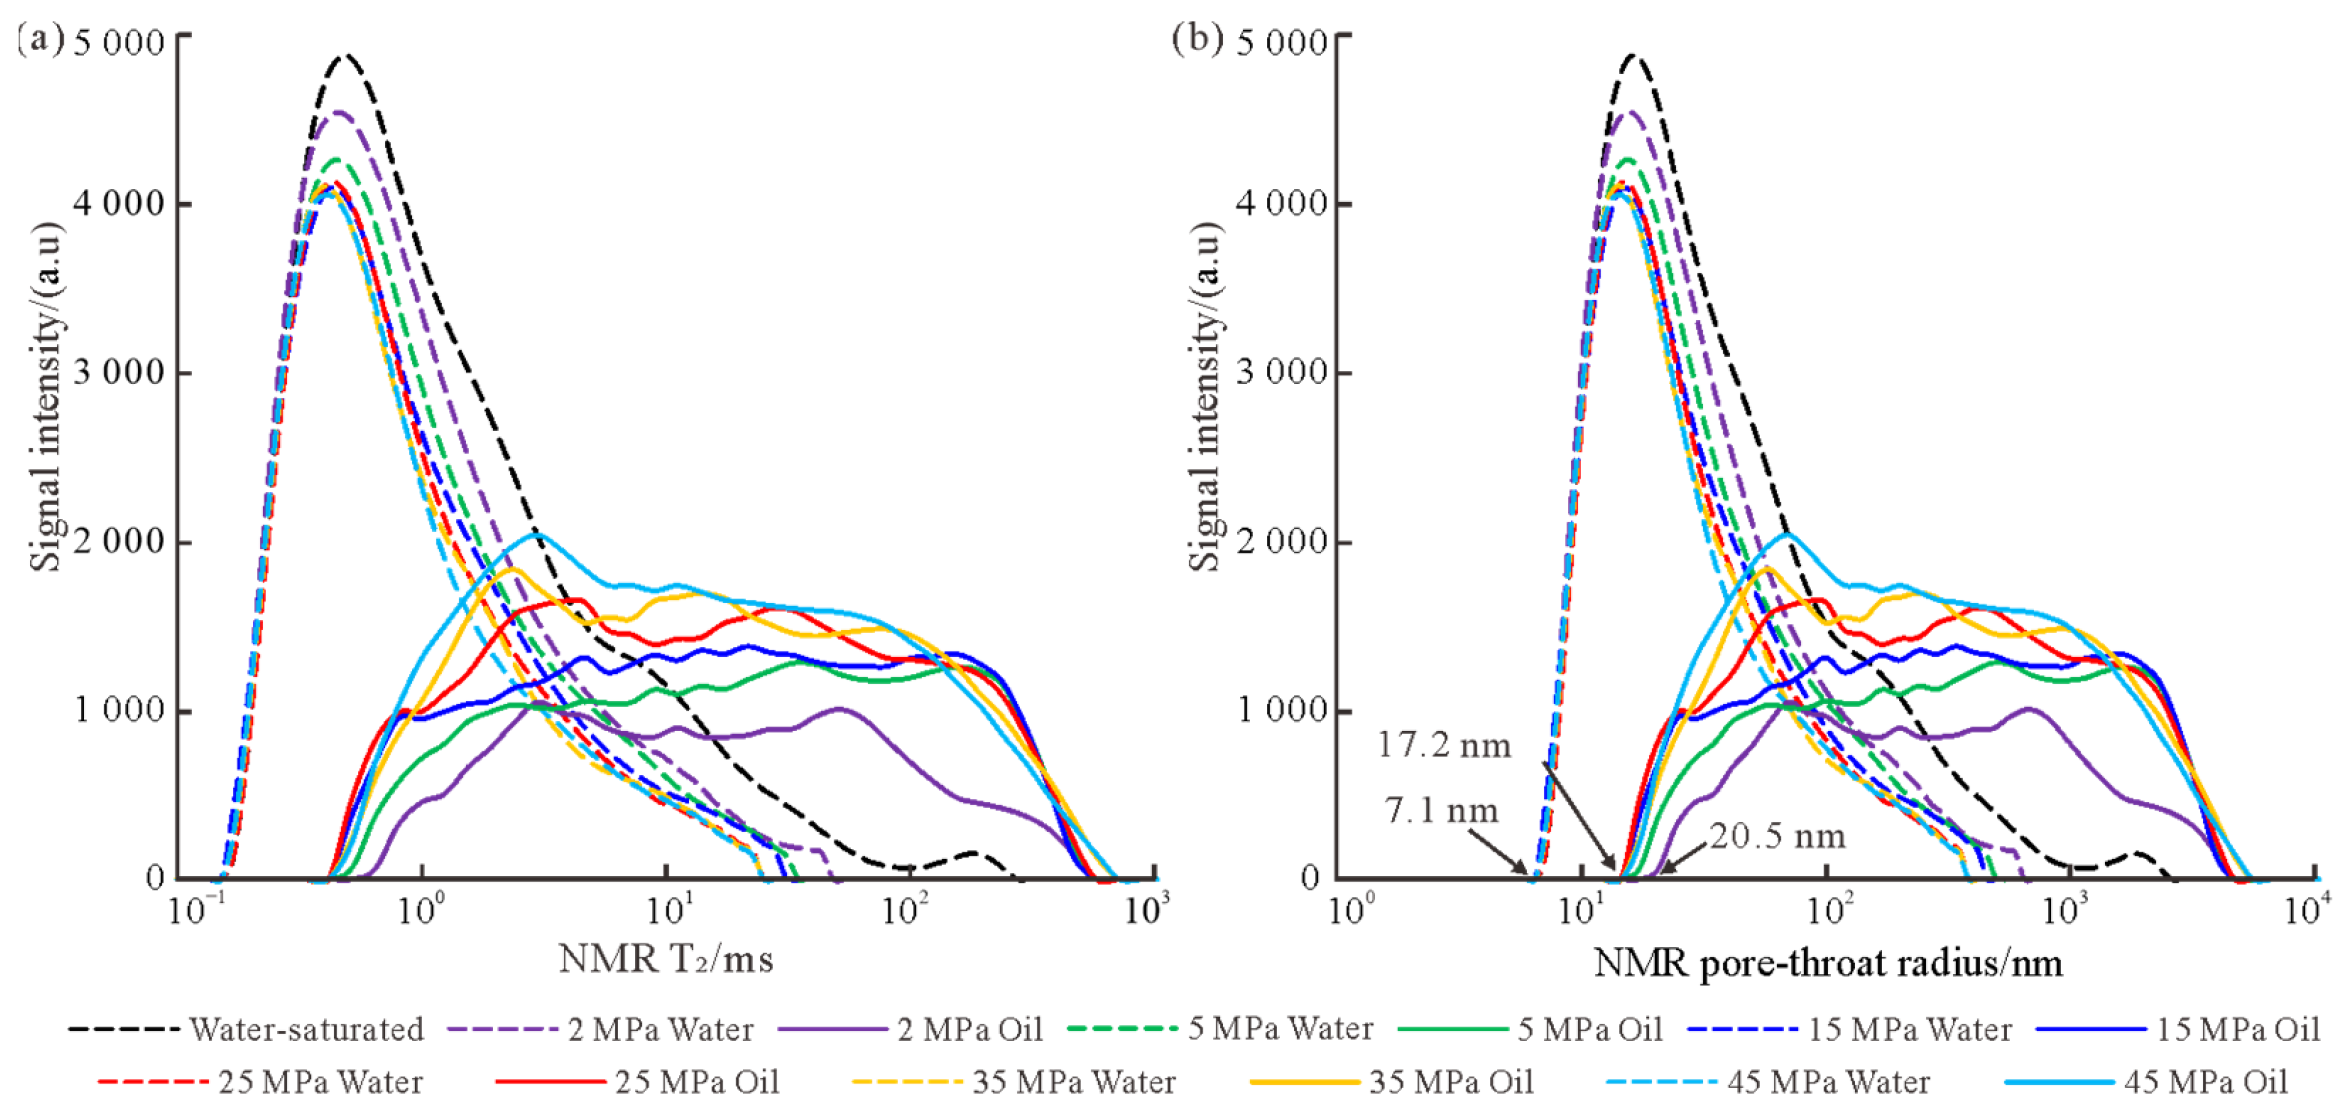
The relationship between the NMR signal and the relaxation time for the conglomerate sample from a depth of 4715.84 m in Well JL55 under different charging pressures is shown in Figure 7a. When the charging pressure exceeded 5 MPa, the shortest relaxation time of the oil NMR signal remained unchanged. Using the conversion relationship between the NMR relaxation time and the pore-throat radius established for the Xiazijie Formation based on Formula (2), the relationship between the NMR signal and the reservoir pore-throat radius under different charging pressures was obtained (Figure 7b). Under water-saturated conditions, the minimum pore-throat radius accessible to water molecules is 7.1 nm. When the charging pressure was 2 MPa, the lower limit of the charged pore-throat radius was 20.5 nm. When the charging pressure exceeded 5 MPa, the minimum pore-throat radius accessible to oil molecules was consistently 17.2 nm. This indicates that even with a continuous increase in charging pressure, oil molecules cannot break through the lower limit of the charged pore-throat radius of 17.2 nm in this rock sample.
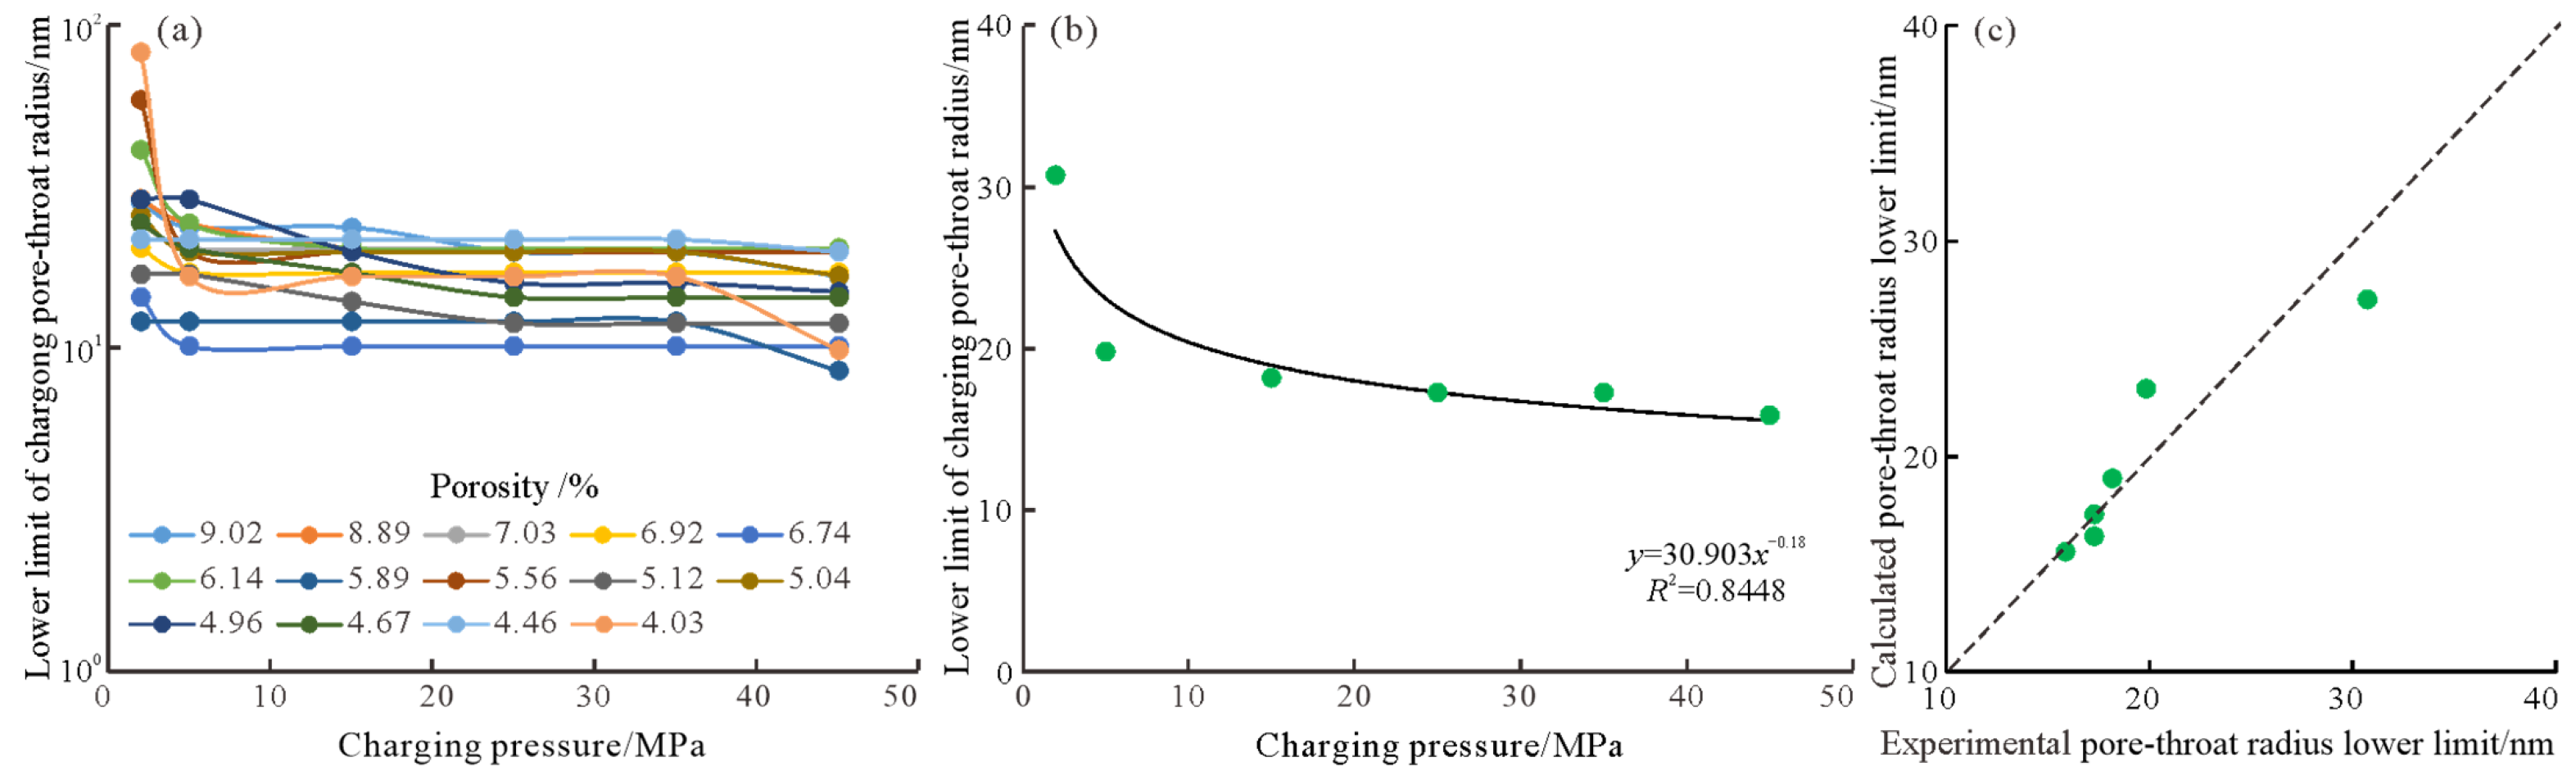
The lower limits of the charged pore-throat radius of the 14 samples under different charging pressures are shown in Figure 8a. Under a charging pressure of 2 MPa, the lower limits of the charged pore-throat radius ranged from 12 nm to 82 nm. As the charging pressure increased to 45 MPa, they ranged from 8 nm to 20 nm. The lower limit of the charged pore-throat radius of tight conglomerate reservoirs in the Xiazijie Formation showed a monotonically decreasing relationship with charging pressure in each sample.
Fitted by the least squares method, the relationship between the average lower limit of the charged pore-throat radius (rmin) and the charging pressure is a power-function: rmin = 30.903 × Pc−0.18. The fitted determination coefficient is R2 = 0.8448 (Figure 8b). When the charging pressure is relatively low, the lower limit of the charged pore-throat radius decreases rapidly as the charging pressure increases; whereas at relatively high charging pressures, it decreases slowly. In this power function, the root mean square error (RMSE) between the experimental and calculated average lower limit of the charged pore-throat radius is only 2.02 nm at 2 MPa, 5 MPa, 15 MPa, 25 MPa, 35 MPa, and 45 MPa (Figure 8c). Theoretically, reservoirs are water-bearing at the early stage. In tectonic processes and hydrocarbon accumulation, crude oil begins to charge under different formation pressures. Water in large pores is gradually displaced by crude oil. As the oil charging pressure progressively increases, water in small pore-throats is replaced by crude oil [29,30]. After oil charging pressure stabilizes in the late stage of accumulation, oil molecules can no longer enter smaller pore-throats. Finally, the two-phase fluids of oil and water reach a dynamic equilibrium.
It should be emphasized that practical physical variables controlling oil charging in buried tight reservoirs are highly complex, including crude-oil properties, rock wettability, formation temperature, and geological charging timescales, among others. Addressing all of these variables within a single study is impractical at the initial exploration stage of the Xiazijie Formation in the Manan Area. Therefore, constrained by the practical data and experiment conditions, this study focuses on the coupling relationship between pore-throat and pressure in oil charging in the tight conglomerate reservoirs based on NMR experiments. These results are expected to contribute to the understanding of the reservoir-forming rules and liquid-injection development in future exploration.

6. Conclusions

(1)
The oil saturation of the tight conglomerate reservoirs of the Xiazijie Formation in the Manan Area ranges from 8% to 32% under a charging pressure of 2 MPa. As the charging pressure increases to 45 MPa, the oil saturation rises to 19–52%. The average oil saturation of the reservoir shows a monotonically increasing power-function relationship with charging pressure.
(2)
The lower limit of the charged pore-throat radius of the tight conglomerate reservoirs of the Xiazijie Formation in the Manan Area ranges from 12 nm to 82 nm under a charging pressure of 2 MPa. As the charging pressure increases to 45 MPa, this lower limit ranges from 8 nm to 20 nm. The lower limit of the charged pore-throat radius exhibits a monotonically decreasing power-function relationship with charging pressure.

Author Contributions

X.Y.: Conceptualization, writing—review and editing, funding acquisition. L.Z.: Methodology, Data curation. H.C.: Visualization, Supervision, Project administration. R.Y.: Formal analysis, Writing—original draft. Z.Z.: Validation, Investigation. F.D.: Resources, Writing—review and editing. N.X.: Data curation. All authors have read and agreed to the published version of the manuscript.

Funding

This study was financially supported by the New National Science and Technology Major Project for Oil and Gas Exploration and Development (No. 2025ZD1400302).

Data Availability Statement

The data analyzed in this study are subject to the following licenses/restrictions. The data presented in this study are available on request from the corresponding author.

Acknowledgments

The reviewers are gratefully acknowledged for their constructive comments that substantially improved the quality of this manuscript. Also, we appreciate the editor’s suggestions to revise this manuscript. During the preparation of this manuscript, the authors used the Deepseek-V4.1-Flash for the purposes of English grammar, structure, and spelling. The authors have reviewed and edited the output and take full responsibility for the content of this publication.

Conflicts of Interest

Xincai You, Lei Zhang, Hailong Chen, Zhiwen Zou, and Fangpeng Dou were employed by the Research Institute of Exploration and Development, PetroChina Xinjiang Oilfield Company, Karamay, Xinjiang, 834000, China. The remaining authors declare that the research was conducted in the absence of any commercial or financial relationships that could be construed as potential conflicts of interest.

Abbreviations

The following abbreviations are used in this manuscript:
NMRNuclear magnetic resonance
T1Longitudinal relaxation time, ms
T2Transverse relaxation time, ms
rPore-throat radius, μm
CCoefficient in conversion relaxation time and pore-throat radius
nExponent in conversion relaxation time and pore-throat radius
SoCharging average oil saturation of all samples, %
PcCharging pressure, MPa
RMSERoot mean square error
rminLower limit of the charged pore-throat radius, nm

References

  1. Song, Y.; Tang, Y.; He, W.J.; Gong, D.Y.; Yan, Q.; Chen, G.; Shan, X.; Liu, C.W.; Liu, G.; Qin, Z.J.; et al. New fields, new types and resource potentials of oil-gas exploration in Junggar Basin. Acta Petrol. Sin. 2024, 45, 52–68. [Google Scholar] [CrossRef]
  2. Kang, X.; Tan, J.Q.; Hu, W.X.; Jin, J.; Hu, R.P.; Cao, J. Differences in reservoir formation mechanisms across the whole petroleum system in the Mahu Sag, Junggar Basin. Oil Gas Geol. 2025, 46, 1250–1266. [Google Scholar] [CrossRef]
  3. Mao, X.J.; Liu, Y.; Wang, G.Z.; Yan, Q.; Zhao, C.Y.; Zhu, K.; Li, M.Y.; Xu, J.J.; Cao, J. Spatiotemporal coupling between source-reservoir configurations and hydrocarbon accumulation in the whole petroleum system of Mahu Sag, Junggar Basin. Acta Petrol. Sin. 2025, 46, 1260–1277. [Google Scholar] [CrossRef]
  4. He, W.J.; Song, Y.; Tang, S.Q.; You, X.C.; Bai, Y.; Zhao, Y. Hydrocarbon accumulation mechanism of total petroleum system in Permian Fengcheng Formation, Mahu Sag. Xinjiang Pet. Geol. 2022, 43, 663–673. [Google Scholar] [CrossRef]
  5. Tang, Y.; Lei, D.W.; Cao, J.; Liu, Y.; Huang, L.L.; Li, H. Total petroleum system and inner-source natural gas exploration in Permian Strata of Junggar Basin. Xinjiang Pet. Geol. 2022, 43, 654–662. [Google Scholar] [CrossRef]
  6. Jiang, W.; Han, B.; Xie, T.S.; Chen, H.L.; Wang, Z.W. The main controlling factors and accumulation model of laterally connected source-reservoir tight oil reservoirs in the whole oil and gas system: A case study of the second member of Fengcheng Formation in Manan Slope Area. J. Northeast Pet. Univ. 2026, 50, 81–94. [Google Scholar] [CrossRef]
  7. Ma, Y.P.; Wang, G.D.; Zhang, X.W.; Pan, S.X.; Huang, L.J.; Chen, Y.B.; Guo, J.J. Development model of secondary pores in coarse-grained deposits: A case study of Permian Xiazijie Formation in northwestern margin of Junggar Basin. Lithol. Reserv. 2019, 31, 34–43. [Google Scholar] [CrossRef]
  8. Yang, F.; Bian, B.L.; Liu, H.Y.; Yao, Z.Q.; You, X.C.; Liu, H.L.; Wei, Y.Z. Sedimentary characteristics of fan delta in restricted lacustrine basin of Permian Xiazijie Formation in Mahu Sag. Lithol. Reserv. 2022, 34, 63–72. [Google Scholar] [CrossRef]
  9. Eslami, M.; Kadkhodaie-Ilkhchi, A.; Sharghi, Y.; Golsanami, N. Construction of synthetic capillary pressure curves from the joint use of NMR log data and conventional well logs. J. Pet. Sci. Eng. 2013, 111, 50–58. [Google Scholar] [CrossRef] [Scilit]
  10. Xu, R.; Yang, S.; Xiao, Z.; Jin, Y. Quantitatively study on imbibition of fracturing fluid in tight sandstone reservoir under high temperature and high pressure based on NMR technology. J. Pet. Sci. Eng. 2022, 208, 109623. [Google Scholar] [CrossRef] [Scilit]
  11. Singh, A.; Jha, N.K.; Mandal, P.P.; Esteban, L.; Desai, B.G. Pore throat characterization of bioturbated heterogeneous sandstone, Bhuj Formation, Kachchh India: An integrated analysis using NMR and HPMI studies. J. Pet. Sci. Eng. 2022, 211, 110221. [Google Scholar] [CrossRef] [Scilit]
  12. Adenutsi, C.D.; Li, Z.; Xu, Z.; Sun, L. Influence of net confining stress on NMR T2 distribution and two-phase relative permeability. J. Pet. Sci. Eng. 2019, 178, 766–777. [Google Scholar] [CrossRef] [Scilit]
  13. Hosseinzadeh, S.; Kadkhodaie, A.; Yarmohammadi, S. NMR derived capillary pressure and relative permeability curves as an aid in rock typing of carbonate reservoirs. J. Pet. Sci. Eng. 2020, 184, 106593. [Google Scholar] [CrossRef] [Scilit]
  14. Li, C.; Liu, G.; Cao, Z.; Sun, M.; You, Y.; Liu, N. Oil charging pore throat threshold and accumulation effectiveness of tight sandstone reservoir using the physical simulation experiments combined with NMR. J. Pet. Sci. Eng. 2022, 208, 109338. [Google Scholar] [CrossRef] [Scilit]
  15. Deng, Y.R.; Ren, Z.L.; Ma, W.Q.; Chen, X.P.; Yang, G.L.; Nanka, E. Reservoir properties and hydrocarbon charging threshold of Chang 8 tight sandstones in Fuxian area, Ordos Basin. Pet. Geol. Exp. 2018, 40, 288–294. [Google Scholar] [CrossRef]
  16. Li, C. Research on Effectiveness of Oil Charging in the Tight Sandstone Reservoir of the Chang 7 Member, Ordos Basin. Ph.D. Thesis, China University of Petroleum (Beijing), Beijing, China, 2020. [Google Scholar] [CrossRef]
  17. Wang, H.N.; Xiao, H.; Miao, C.Y.; Liu, Y.P.; Lin, W. Comprehensive determining method of the lower limit of the oil-charging in tight sandstone reservoirs and its application: A case of Chang-8 oil reservoir in Maling area of Ordos Basin. Pet. Geol. Oilfield Dev. Daqing 2020, 39, 147–156. [Google Scholar] [CrossRef]
  18. Jiang, W.B.; Lin, M.; Ji, L.L.; Cao, G.H.; Zhang, L.K.; Dou, W.C.; Zheng, S.P.; Chen, Z.; Qiu, X. On-line microscopic imaging investigation on oil charging characteristics in tight reservoirs. Pet. Geol. Exp. 2023, 45, 366–377. [Google Scholar] [CrossRef]
  19. Wang, M.; Guan, Y.; Zhang, J.; Zhou, N.; Liu, W.; Liu, J. Oil charging model and controlling factors revealed by an online nuclear magnetic resonance (NMR) system. Mar. Pet. Geol. 2020, 118, 104442. [Google Scholar] [CrossRef] [Scilit]
  20. Liu, J.; Li, H.; Tan, Q.; Liu, S.; Zhao, H.; Wang, Z. Quantitative study of CO2 huff-n-puff enhanced oil recovery in tight formation using online NMR technology. J. Pet. Sci. Eng. 2022, 216, 110688. [Google Scholar] [CrossRef] [Scilit]
  21. Zhang, T.; Ming, T.; Yuan, L.; Zhu, G.; Yang, X. Experimental study on stress-dependent multiphase flow in ultra-low permeability sandstone during CO2 flooding based on LF-NMR. Energy 2023, 278, 127874. [Google Scholar] [CrossRef] [Scilit]
  22. Zhu, Z.W.; Chen, J.M.; Ma, Y.Z.; Yu, X.; Shi, Z.; Wang, J.X.; Qin, Y.D. The different characteristics and controlling factors of glutenite reservoirs of Xiazijie Formation in the west slope of Mahu Sag. J. Northeast Pet. Univ. 2025, 49, 81–90+109. [Google Scholar] [CrossRef]
  23. Li, A.F.; Ren, X.X.; Wang, G.J.; Wang, Y.Z.; Jiang, K.L. Characterization of pore structure of low permeability reservoirs using a nuclear magnetic resonance method. J. China Univ. Pet. 2015, 39, 92–98. [Google Scholar] [CrossRef]
  24. Liu, S.; Wu, J.P.; Zhou, W.; Li, Y.; Li, J.L. Physical properties of tight glutenite reservoirs in Mahu 1 wellblock and their effects on fluid mobility. J. Xi’an Shiyou Univ. (Nat. Sci. Ed.) 2023, 38, 15–23. [Google Scholar] [CrossRef]
  25. Li, H.; Yuan, R.; Wang, Q.Y.; Xie, Z.Y.; Zhang, R.; Chen, M.N.; Yuan, Y.F.; Xiao, N. Pore study of tight conglomerate reservoir based on nuclear magnetic resonance experiment: A case of the Permian Upper Wuerhe Formation in the Dongdaohaizi Sag, Junggar Basin. J. Northeast Pet. Univ. 2025, 49, 112–122. [Google Scholar] [CrossRef]
  26. Baur, F.; Katz, B. Some practical guidance for petroleum migration modeling. Mar. Pet. Geol. 2018, 93, 409–421. [Google Scholar] [CrossRef] [Scilit]
  27. Aydin, A. Fractures, faults, and hydrocarbon entrapment, migration and flow. Mar. Pet. Geol. 2000, 17, 797–814. [Google Scholar] [CrossRef] [Scilit]
  28. Wendebourg, J.; Biteau, J.-J.; Grosjean, Y. Hydrodynamics and hydrocarbon trapping: Concepts, pitfalls and insights from case studies. Mar. Pet. Geol. 2018, 96, 190–201. [Google Scholar] [CrossRef] [Scilit]
  29. Kamani, A.; Ahmadi-Falavarjani, A.; Ayatollahi, S.; Mahani, H. Pore-scale simulation of the effects of the interfacial viscoelasticity on oil displacement by low-salinity water in porous media. Phys. Fluids 2025, 37, 022147. [Google Scholar] [CrossRef] [Scilit]
  30. Alomier, A.; Hoecherl, M.; Cha, D.; Ayirala, S.; Yousef, A.A.; Hoteit, H. Experimental investigation of the impact of mixed wettability on pore-scale fluid displacement: A microfluidic study. ACS Appl. Mater. Interfaces 2024, 16, 69165–69179. [Google Scholar] [CrossRef] [Scilit] [PubMed]
Figure 1. Tectonic location of the Mahu Sag, sedimentary facies planar distribution, and stratigraphic composite chart of the Xiazijie Formation in the Manan Area. (a) Tectonic location of the Manan Area [22]; (b) sedimentary facies plane distribution of the Xiazijie Formation in the Manan Area; (c) stratigraphic chart of the Xiazijie Formation in the Manan Area, Well JL55.
Processes 14 02997 g001
Figure 2. Reservoir characteristics of conglomerate in the Xiazijie Formation. (a) Photograph of conglomerate at 4709 m, Well JL55. (b) Dissolved pores of laumontite cement in cast thin section at 4709.14 m, Well JL55. (c) Cross-plot of laboratory analysis of porosity and permeability. (d) High-pressure Hg intrusion experiment result.
Processes 14 02997 g002
Figure 3. Workflow for experimental NMR of oil charging characteristics in tight conglomerate reservoirs.
Processes 14 02997 g003
Figure 4. T2T1 two-dimensional NMR spectrum and oil saturation under different charging pressures of a conglomerate sample at 4715.84 m in Well JL55. (a) Water-saturated; (b) charging pressure 2 MPa, oil saturation 18.9%; (c) charging pressure 5 MPa, oil saturation 27.3%; (d) charging pressure 15 MPa, oil saturation 31.4%; (e) charging pressure 25 MPa, oil saturation 35.3%; (f) charging pressure 35 MPa, oil saturation 37.3%; (g) charging pressure 45 MPa, oil saturation 38.7%.
Processes 14 02997 g004
Figure 5. Conversion between NMR relaxation time and high-pressure Hg injection pore-throat radius in the tight conglomerate reservoir of the Xiazijie Formation. (a) NMR T2 spectrum and pore-throat radius from high-pressure Hg injection; (b) conversion between NMR T2 spectrum and pore-throat radius from high-pressure Hg injection; (c) comparison of NMR T2 spectrum and pore-throat radius from high-pressure Hg injection.
Processes 14 02997 g005
Figure 6. Changes in oil saturation under different charging pressures in the tight conglomerate reservoir of the Xiazijie Formation. (a) Relationship between charging pressure and oil saturation of samples with different porosity; (b) variation characteristics of average oil saturation under different charging pressures; (c) comparison between experimental and calculated average oil saturation under different charging pressures.
Processes 14 02997 g006
Figure 7. NMR T2 spectrum and pore-throat radius of oil and water under different charging pressures of a conglomerate sample at 4715.84 m in Well JL55. (a) NMR T2 spectrum of oil and water under different charging pressures; (b) pore-throat radius distribution of oil and water under different charging pressures.
Processes 14 02997 g007
Figure 8. Change features of pore-throat lower limit under different charging pressures of tight conglomerate reservoir in the Xiazijie Formation. (a) Relationship between charging pressure and lower limit of pore-throat radius for samples with different porosity; (b) variation characteristics of average lower limit of charged pore-throat radius under different charging pressures; (c) comparison between experimental and calculated average lower limit of charged pore-throat radius under different charging pressures.
Processes 14 02997 g008
Disclaimer/Publisher’s Note: The statements, opinions and data contained in all publications are solely those of the individual author(s) and contributor(s) and not of MDPI and/or the editor(s). MDPI and/or the editor(s) disclaim responsibility for any injury to people or property resulting from any ideas, methods, instructions or products referred to in the content.