1. Introduction
Hydrogen is used in chemical processing, refining, metals production, power generation, transport, storage, and emerging energy systems. The umbrella term “hydrogen incident” can therefore cover markedly different accidental sequences. A loss of containment from equipment designed for hydrogen may initiate one event; another may begin at an interface where a wider process system contains hydrogen; yet another may begin with a collision, conventional fire, runaway reaction or other non-hydrogen failure, after which hydrogen may be released, ignite, or remain contained. The location of initiation matters because the prevention of the threat of an accident sequence is not identical to mitigation after hydrogen becomes involved.
Incident databases support collective learning by retaining experience that individual organizations may encounter only rarely. Their usefulness depends on sufficiently structured information to retrieve comparable events and distinguish causes, escalation mechanisms, and consequences [
1,
2]. Incident learning can also examine where barriers succeeded, rather than only where they failed [
3]. Process-safety learning requires more than archiving, as reporting, analysis, decision, implementation, and follow-up form a holistic learning cycle; weak information or shallow classification can limit transfer to hazard reviews and barrier management [
4,
5,
6]. Safety-barrier and bow-tie approaches similarly distinguish initiating threats, preventive barriers, top events, and consequence-mitigation barriers [
7,
8,
9]. A database descriptor that separates where an event begins from how it develops is therefore potentially useful, even when the database cannot provide exposure-normalized risk estimates. Clear classification is also consistent with risk-based approaches to hydrogen governance [
10].
The Hydrogen Incidents and Accidents Database (HIAD), maintained by the Joint Research Centre of the European Commission and the Clean Hydrogen Partnership, is a public repository of hydrogen-related unwanted events [
11,
12,
13]. Earlier studies established the architecture of HIAD [
1,
14] and examined data limitations for quantitative risk assessment [
15]. Descriptive and application-focused studies subsequently summarized HIAD 2.0 statistics and lessons [
16], studied inspection and maintenance failures [
17], and analyzed value-chain [
18], refueling-station [
19], and hydrogen-economy cases [
20]. Relevant work has also examined hydrogen incidents beyond HIAD. West et al. [
15] critically compared HIAD with the U.S. DOE-supported H2Tools Lessons Learned database and other hydrogen safety data collection tools, while Alfasfos et al. [
20] identified 82 hydrogen-only events from various databases—including ARIA, eMARS, IChemE, H2Tools, Tukes, HIAD, and public news—and derived cross-database lessons for risk assessment. The hydrogen-focused resources like HIAD and H2Tools differ from the broader incident databases, such as the CCPS Process Safety Incident Database (PSID), which was developed for process-industry incident learning rather than hydrogen-specific event classification [
2].
Li et al. [
21] distinguished hydrogen-specific physical mechanisms from conventional failure modes. Sk et al. [
22] analyzed 755 HIAD 2.1 records and reported that 69.8% were hydrogen system-initiated; release and ignition dominated the physical-effect profile, while human, job, and management factors collectively accounted for more than half of the reported root cause entries, but their dataset preceded the intermediate initiating system category introduced in HIAD 2.2 and the structured initiating-cause and failure-mode fields added in HIAD 2.3. Wen et al. [
16] similarly emphasized lessons concerning system design, manufacturing and installation, human factors, and emergency response.
Other recent HIAD 2.1 studies have also used the database for physics-informed Bayesian-network risk modelling, the preliminary hazard analysis of pipelines and storage tanks, transformer-based cause and consequence prediction, and the large language model-assisted completion of missing categorical fields [
23,
24,
25,
26]. Those studies address risk modeling, hazard ranking, prediction, or data enhancement rather than the present study’s focus on the initiating system category taxonomy.
HIAD 2.2 expanded the descriptor “event initiating system” by adding an intermediate category for events initiated by a system that also contains hydrogen. HIAD 2.3 added structured descriptors for the “component affected”, “failure mode”, and “initiating cause”; HIAD 2.4 added standardized operating-condition ranges [
12]. The official rationale for the initiating system descriptor is to identify whether a hydrogen system was present at the start of the accidental sequence and to avoid attributing every record to hydrogen as the initiating element [
12]. The same guidance describes initiating cause as the reason why the affected component failed, while the hydrogen supply chain stage identifies the hydrogen activity involved. These are separate fields in the public schema; however, the guidance does not provide a detailed record-level coding algorithm or state that their assignments are statistically independent.
The novelty of this study lies in systematically evaluating the updated three-category initiating system taxonomy against newly structured initiating-cause and failure-mode fields together with contextual descriptors while explicitly addressing sparse categories and sensitivity to record quality and period. Relative to the closest whole-database studies, the contribution of this study is threefold. First, it uses the 1236-record HIAD 2.4 snapshot and the intermediate hydrogen-containing system category. Second, it jointly examines the initiating system category against initiating cause and failure mode, i.e., the fields that were added after HIAD 2.1. Third, it applies unpooled sparse-table tests, effect sizes, adjusted residuals, prespecified sensitivity analyses, and adjusted multinomial models.
Table 1 summarizes the distinction from Wen et al. [
16] and Sk et al. [
22].
This study provides a descriptive characterization of HIAD’s curator-assigned initiating system categories in the current downloadable dataset. It asks: (1) how are the initiating system categories distributed; (2) how do physical effects and consequences differ; (3) which supply chain stages, initiating causes, failure modes, applications, and operating conditions are over-represented; and (4) how do multi-label root cause classes co-occur with the three initiating system categories before and after adjustment for record quality, period, and region? The study does not seek to independently validate the curator labels, reconstruct causal mechanisms, or estimate risk. Its intended contribution is a reproducible account of how the taxonomy organizes the reported-event repository and how that organization may inform case selection and barrier review.
2. Materials and Methods
2.1. Data Source and Design
A cross-sectional secondary analysis was performed on the complete HIAD export downloaded from the Clean Hydrogen Knowledge Hub on 2 August 2026. The file contained 1236 event-level records carrying public quality labels 2–5. HIAD’s quality label reflects the quality and level of detail of the source information on a 1–5 scale, with 5 being the highest; label 1 is assigned to unvalidated records and is not made public, so the downloadable dataset contains labels 2–5. The HIAD guidance notes that many records with labels 2–3 lack sufficient descriptor detail for a meaningful lesson learned [
13]. The official website identified the active structure as HIAD 2.4 [
11,
12].
HIAD records are interpreted, reviewed, and validated by Joint Research Centre (JRC) experts before public release, but descriptor completeness depends on available primary and secondary sources. The database is geographically and sectorally uneven and lacks measures of operating exposure needed to calculate incident rates [
11,
13,
15]. The dataset was therefore treated as a census of the public curator-classified records present on the download date, not as a probability sample of all hydrogen events. The study analyzed curator-assigned structured labels without interpreting or recoding the event narratives. Researcher-defined processing was limited to label abbreviation, missing-value handling, multi-label decomposition, and prespecified analytical grouping.
2.2. Variables and Data Handling
The HIAD variable Event_Initiating_system records the system in which the accidental sequence was judged to have begun and was the primary grouping variable. Its official values were abbreviated as hydrogen system initiation (“Hydrogen system initiating event”), hydrogen-containing system initiation (“Event initiated by a system containing also hydrogen”), and non-hydrogen system initiation (“Non-Hydrogen system initiating event”). One record coded “n.a.” was excluded from analyses by initiating system. HIAD separately defines initiating-factor descriptors as what failed, how it failed, and why it failed, while supply chain stage describes the hydrogen activity involved [
12]. No published deterministic rule makes the initiating system a function of initiating cause or supply chain stage. Nevertheless, these fields may be assigned by curators from the same narrative and process context, and the public guidance does not provide a detailed coding algorithm that would establish independent assignment. Associations among the fields were therefore interpreted as within-database profile separation and coding coherence, not as an independent validation of causal structure. This shared coding context is the principal interpretive constraint on the headline associations with initiating cause and supply chain stage.
Seven structured descriptors—physical effect, consequence, hydrogen supply chain stage, initiating cause, failure mode, application, and operational condition—were each cross-tabulated with initiating system category. Root causes were analyzed separately using class-specific contingency tables and multinomial regression models.
Physical effect retained three official categories: hydrogen release and ignition, unignited hydrogen release, and no hydrogen release. Consequence retained seven categories: explosion, fire, leak without ignition, explosion followed by fire, fire followed by explosion, near miss, and false alarm. Sequence direction was preserved because fire-to-explosion and explosion-to-fire can represent different escalation patterns. Blank and “n.a.” values were excluded descriptor by descriptor.
Hydrogen supply chain stage, initiating cause, failure mode (labeled “How was it involved” in the downloaded HIAD export), application, and operational condition were analyzed using their unpooled database labels. Categories with fewer than 20 records were pooled only for display in residual heatmaps; all omnibus association tests used the complete unpooled tables. Dates were parsed by extracting four-digit years from the Date field. The earliest and latest years in the snapshot were 1785 and 2026. For period sensitivity analysis, a record was classified as year 2000 or later using the first year reported in its date field. The year 2000 was selected a priori as a pragmatic boundary between older and more recent records while retaining substantial sample sizes on both sides; it is not a formal HIAD-version boundary.
Root_causes contains multi-label classes adopted by HIAD: system design error, material/manufacturing error, installation error, job factors, human factors, management factors, environment, and unknown. Each root cause class (other than Unknown) was analyzed as a separate binary indicator because multiple classes can apply to one record. Blank root cause fields were excluded from root cause denominators. Unknown was reported separately as a classification-completeness indicator rather than interpreted as a causal mechanism.
2.3. Statistical Analysis
Counts and percentages within each initiating system category described the dataset. Pearson chi-square statistics quantified the association between initiating system category and each categorical descriptor. When any expected cell count was below five, the p-value was estimated from 100,000 fixed-margin Monte Carlo tables generated using SciPy’s Patefield algorithm and NumPy’s PCG64 generator initialized with seed 1; otherwise, the asymptotic Pearson chi-square p-value was used. With 100,000 simulations, the Monte Carlo standard error of any simulated p-value is bounded by ≈ 0.0016 (attained at p = 0.5); the bound is smaller for p-values further from 0.5. Cramér’s V summarized within-database separation. Because HIAD is neither a probability sample nor a complete census of all hydrogen incidents, the analysis emphasized effect sizes, adjusted residuals, and absolute percentage differences as descriptions of separation within the database snapshot. p-values test departure from independence within this snapshot and are not estimates of population-level sampling uncertainty. They were retained as a secondary reference alongside the descriptive effect sizes and residuals. No multiplicity adjustment was applied across the seven prespecified descriptor-level omnibus analyses in the primary presentation; as a robustness check, Holm’s procedure was also applied across those seven p-values. In tables with many rare categories, Cramér’s V remains calculable but can be sensitive to category granularity and the configuration of sparse cells; such values were treated as observed separation under the current taxonomy rather than precise population parameters. For the especially sparse initiating-cause table, a secondary sensitivity analysis pooled labels represented by fewer than 20 records into Other/rare and recalculated V and expected-cell counts. This grouping was not used for the primary omnibus analysis. For percentages highlighted for the hydrogen-containing-system category (n = 99), 95% Wilson confidence intervals were also calculated.
Adjusted standardized residuals were calculated as
, where
ri and
cj are the row and column marginal proportions. Values with absolute magnitude around two or larger were used to identify cells contributing strongly to an omnibus association; they were not treated as independently multiplicity-adjusted hypothesis tests. For each root cause class, a 3 × 2 table compared presence versus absence across the three initiating system categories. Holm’s sequential correction controlled family-wise error across the eight root cause class comparisons [
27].
Because the initiating system outcome has three nominal categories, multinomial logistic regression was used to estimate adjusted associations for each non-reference category relative to hydrogen-system initiation. The seven root cause classes (other than Unknown) were included as binary predictors, with four binary adjustment covariates: quality label Q4–Q5 (reference: Q2–Q3), year 2000 or later (reference: before 2000), Europe, and North America. For the two regional indicators, records from regions other than Europe and North America formed the reference category. The sensitivity model also included Unknown as a root cause indicator. The primary model excluded records with a blank or Unknown-only root cause field because it concerned the co-occurrence of the specified root cause classes. Heteroskedasticity-consistent HC0 robust standard errors and 95% confidence intervals were reported, and Holm correction was applied across the 14 primary root-class coefficients. A prespecified sensitivity model retained every record with a nonblank root cause field, included Unknown as an explicit classification-completeness indicator, and applied Holm correction across 16 root-class coefficients. Model convergence was required, and pairwise dependence among non-intercept predictors was summarized by the maximum absolute Pearson correlation. Both models are descriptive and are not intended for prediction or causal attribution.
Three sensitivity analyses repeated the unpooled omnibus tests for the seven descriptors—physical effect, consequence, supply chain stage, initiating cause, failure mode, application, and operational condition—in: (1) quality-label 4–5 records; (2) records dated 2000 or later; and (3) records meeting both restrictions. Root cause comparisons were repeated in the same three subsets.
Analysis used Python 3.13.14, NumPy 2.4.6, SciPy 1.18.0, and statsmodels 0.14.6. Analysis code, which was developed with assistance from GPT-5.6 Sol and run locally by the author, is available from the author upon reasonable request. All analytical procedures and resulting outputs were reviewed and verified by the author.
3. Results
3.1. Dataset Profile and Descriptor Availability
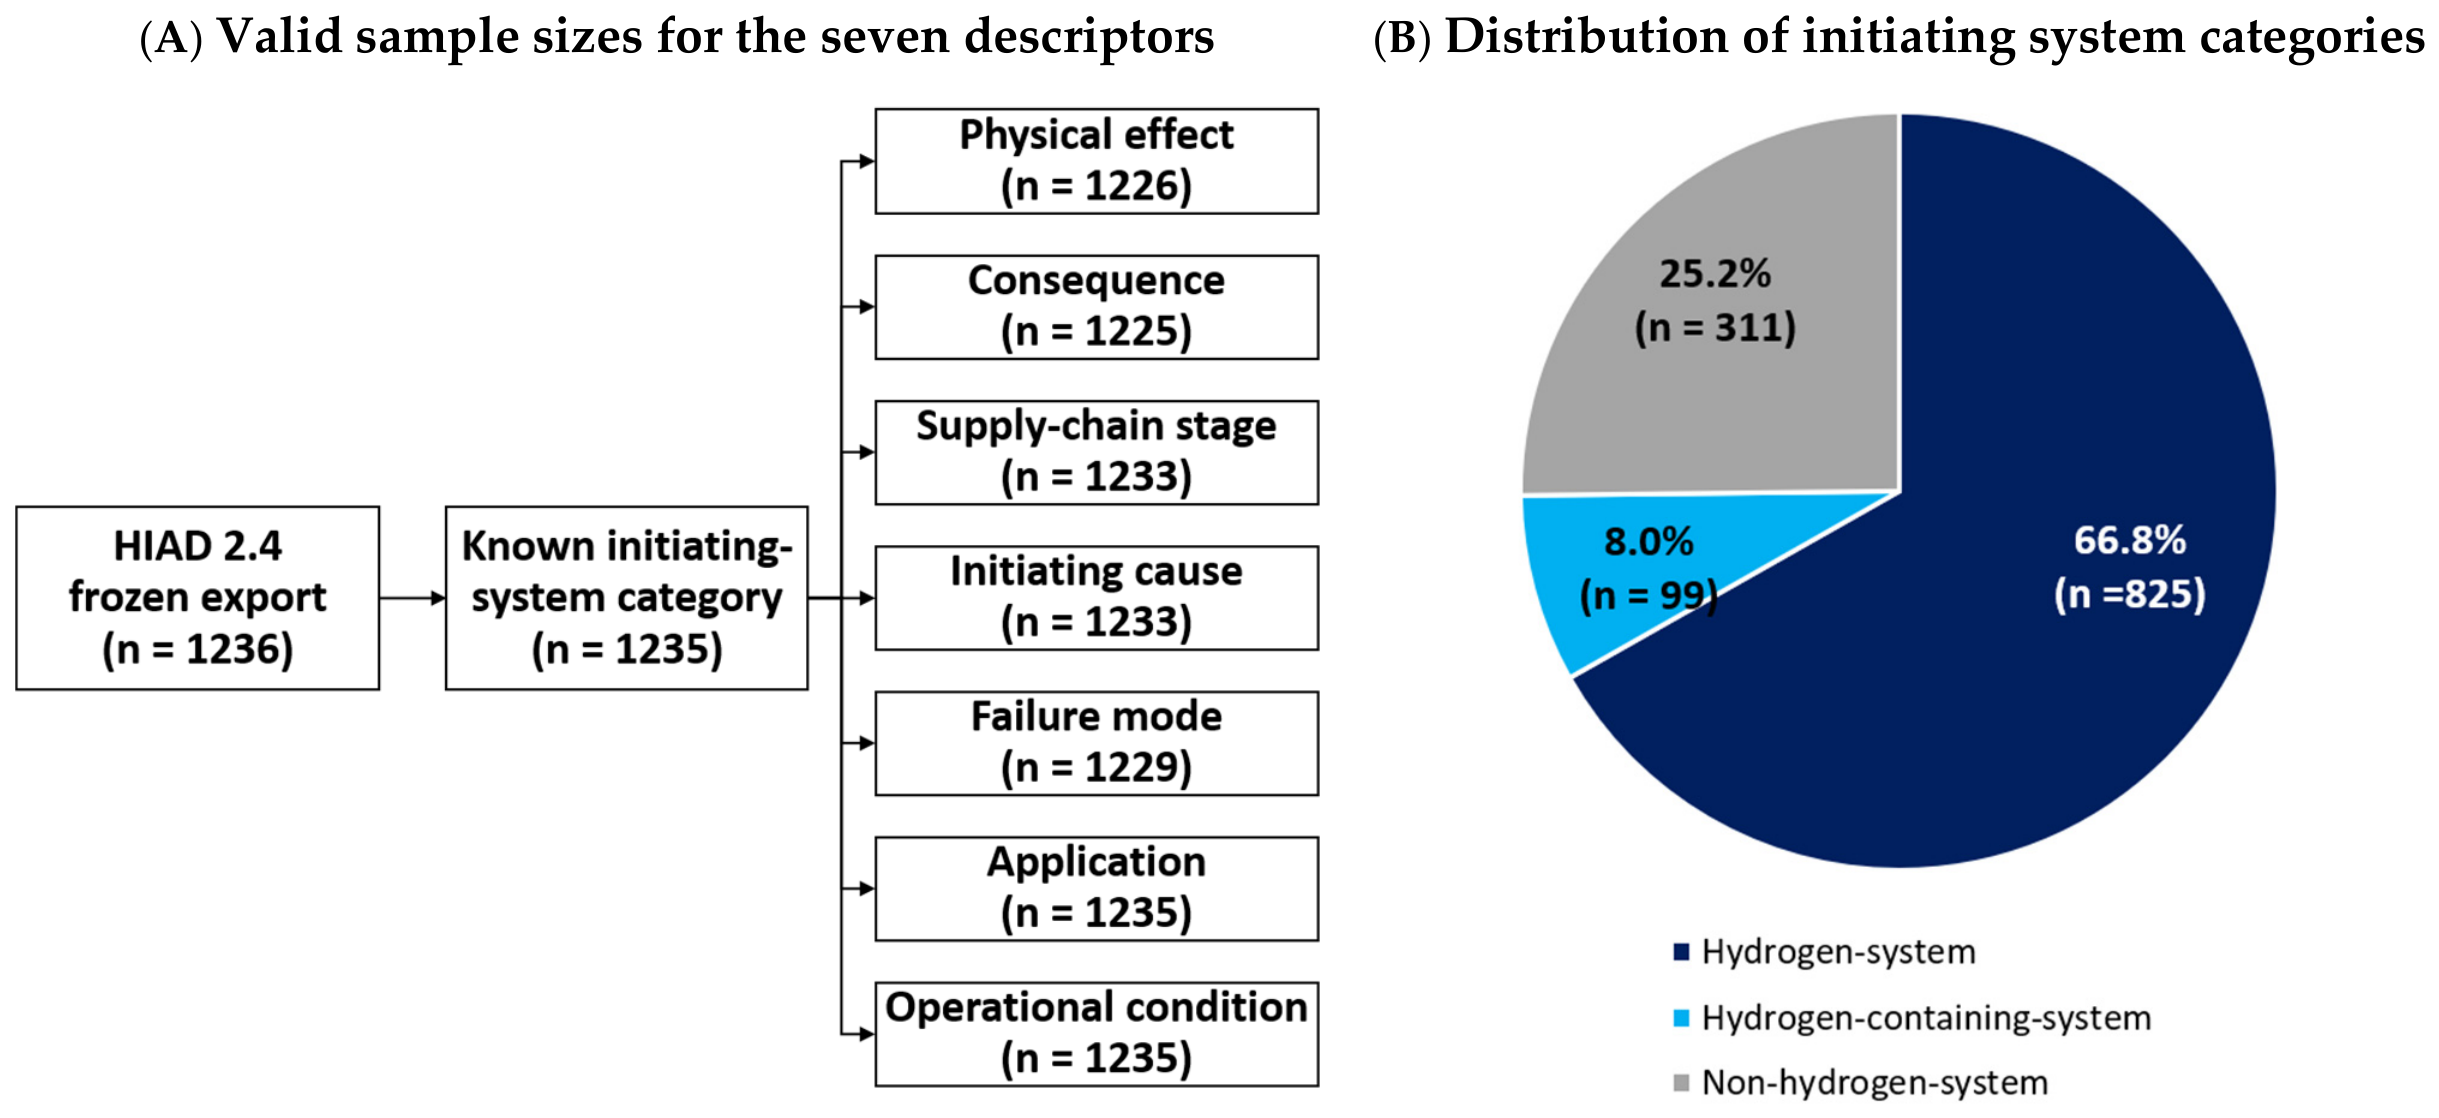
The export contained 1236 unique Event IDs dated from 1785 to 2026. One record lacked an initiating system category, leaving 1235 records for initiating system-based analyses (
Figure 1A). Hydrogen system initiation accounted for 825 records (66.8%), hydrogen-containing system initiation for 99 (8.0%), and non-hydrogen system initiation for 311 (25.2%) (
Figure 1B). The characteristics of the initiating system-known analytic cohort are summarized in
Table 2. Of the 1235 records, 327 (26.5%) had quality labels 4–5, and 658 (53.3%) were dated 2000 or later. Europe and North America accounted for the majority of the cohort (
Table 2).
The availability of the analyzed descriptors was high. Missing or n.a. values ranged from 0% for application and operational condition to 0.81% for consequence. Root cause fields were blank for two records (0.16%). Descriptor-specific valid sample sizes are shown in
Figure 1A.
3.2. Physical-Effect and Consequence Profiles by Initiating System Category
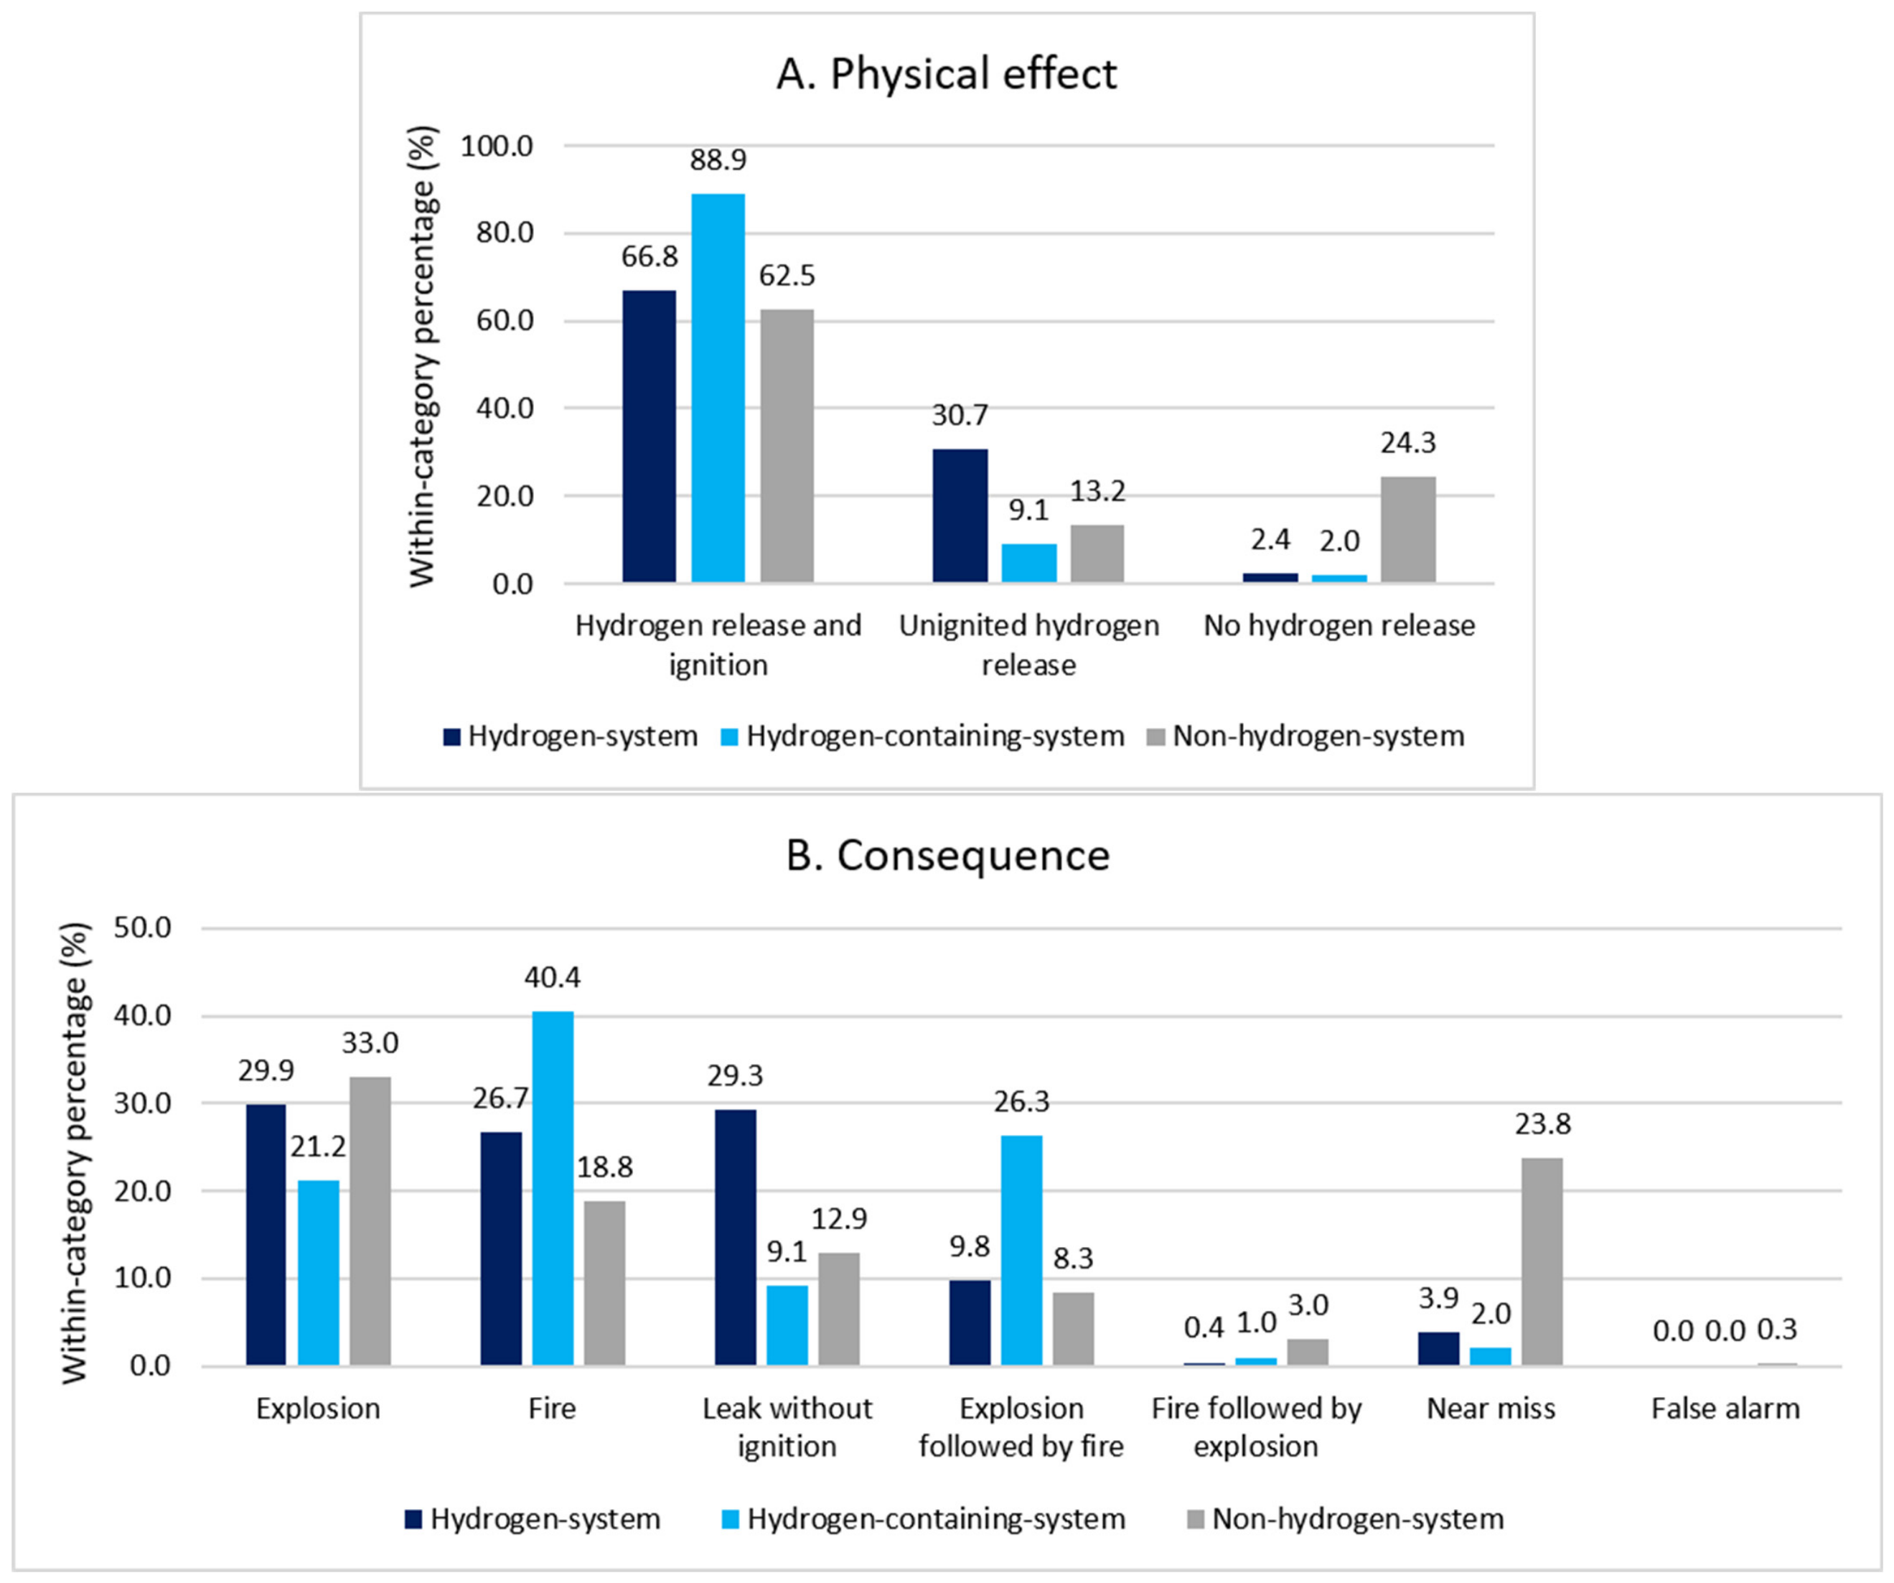
Initiating system category was associated with physical effect (n = 1226; χ2(4) = 187.1, p < 0.0001, Cramér’s V = 0.276). Hydrogen release and ignition was the most frequent physical effect in all three initiating system categories, but the overall distribution of physical effects differed across categories. Hydrogen-containing system records most often involved release and ignition (88.9%; 95% Wilson CI: 81.2–93.7%). Hydrogen system records had the largest proportion of unignited releases (30.7%), while non-hydrogen system records had the largest proportion with no hydrogen release (24.3%). Adjusted residuals identified these three contrasts as the principal contributors to the association.
Consequence also differed by initiating system (
n = 1225; χ
2(12) = 200.8, fixed-margin Monte Carlo
p < 0.0001, V = 0.286). Hydrogen-containing system records had the highest proportions of fire (40.4%; 95% Wilson CI: 31.3–50.3%) and explosion followed by fire (26.3%; 95% Wilson CI: 18.6–35.7%). Non-hydrogen system records were over-represented among near misses (23.8%) and fire followed by explosion (3.0%). Hydrogen system records were over-represented among leak-without-ignition outcomes (29.3%) and under-represented among near misses (3.9%).
Figure 2 retains the direction of fire–explosion sequences.
3.3. Contextual and Initiating-Factor Profiles
This section examines three contextual descriptors—supply chain stage, application, and operational condition—and two initiating-factor descriptors—initiating cause and failure mode.
The largest observed Cramér’s V values occurred for initiating cause (
n = 1233; V = 0.525) and hydrogen supply chain stage (
n = 1233; V = 0.492); both fixed-margin Monte Carlo
p-values were <0.001. Failure mode showed moderate separation (
n = 1229; V = 0.328), as did application (
n = 1235; V = 0.359); operational condition showed a smaller association (
n = 1235; V = 0.186). After Holm adjustment across the seven prespecified omnibus tests, all seven adjusted
p-values remained below 0.001. These values describe differently structured contingency tables and are not formal comparisons of predictive performance. The initiating-cause table was highly sparse, with 111 of 162 expected cells (68.5%) below five. Its fixed-margin Monte Carlo test avoids reliance on an asymptotic
p-value, but V = 0.525 may be sensitive to the rare-category structure. When labels represented by fewer than 20 records were grouped as Other/rare, expected cells below five fell to 11 of 51 (21.6%), and V decreased to 0.461. Initiating cause therefore remained a prominent within-database separator, but its exact effect size depended on category granularity. Because initiating system category, initiating cause, and supply chain stage were assigned from related narrative and process context, these effect sizes quantify coding coherence and profile separation rather than independent structure in the underlying incidents.
Table 3 reports all primary omnibus tests using unpooled source categories. Categories were pooled only for the sparsity sensitivity check and in
Figure 3 to make residual patterns legible.
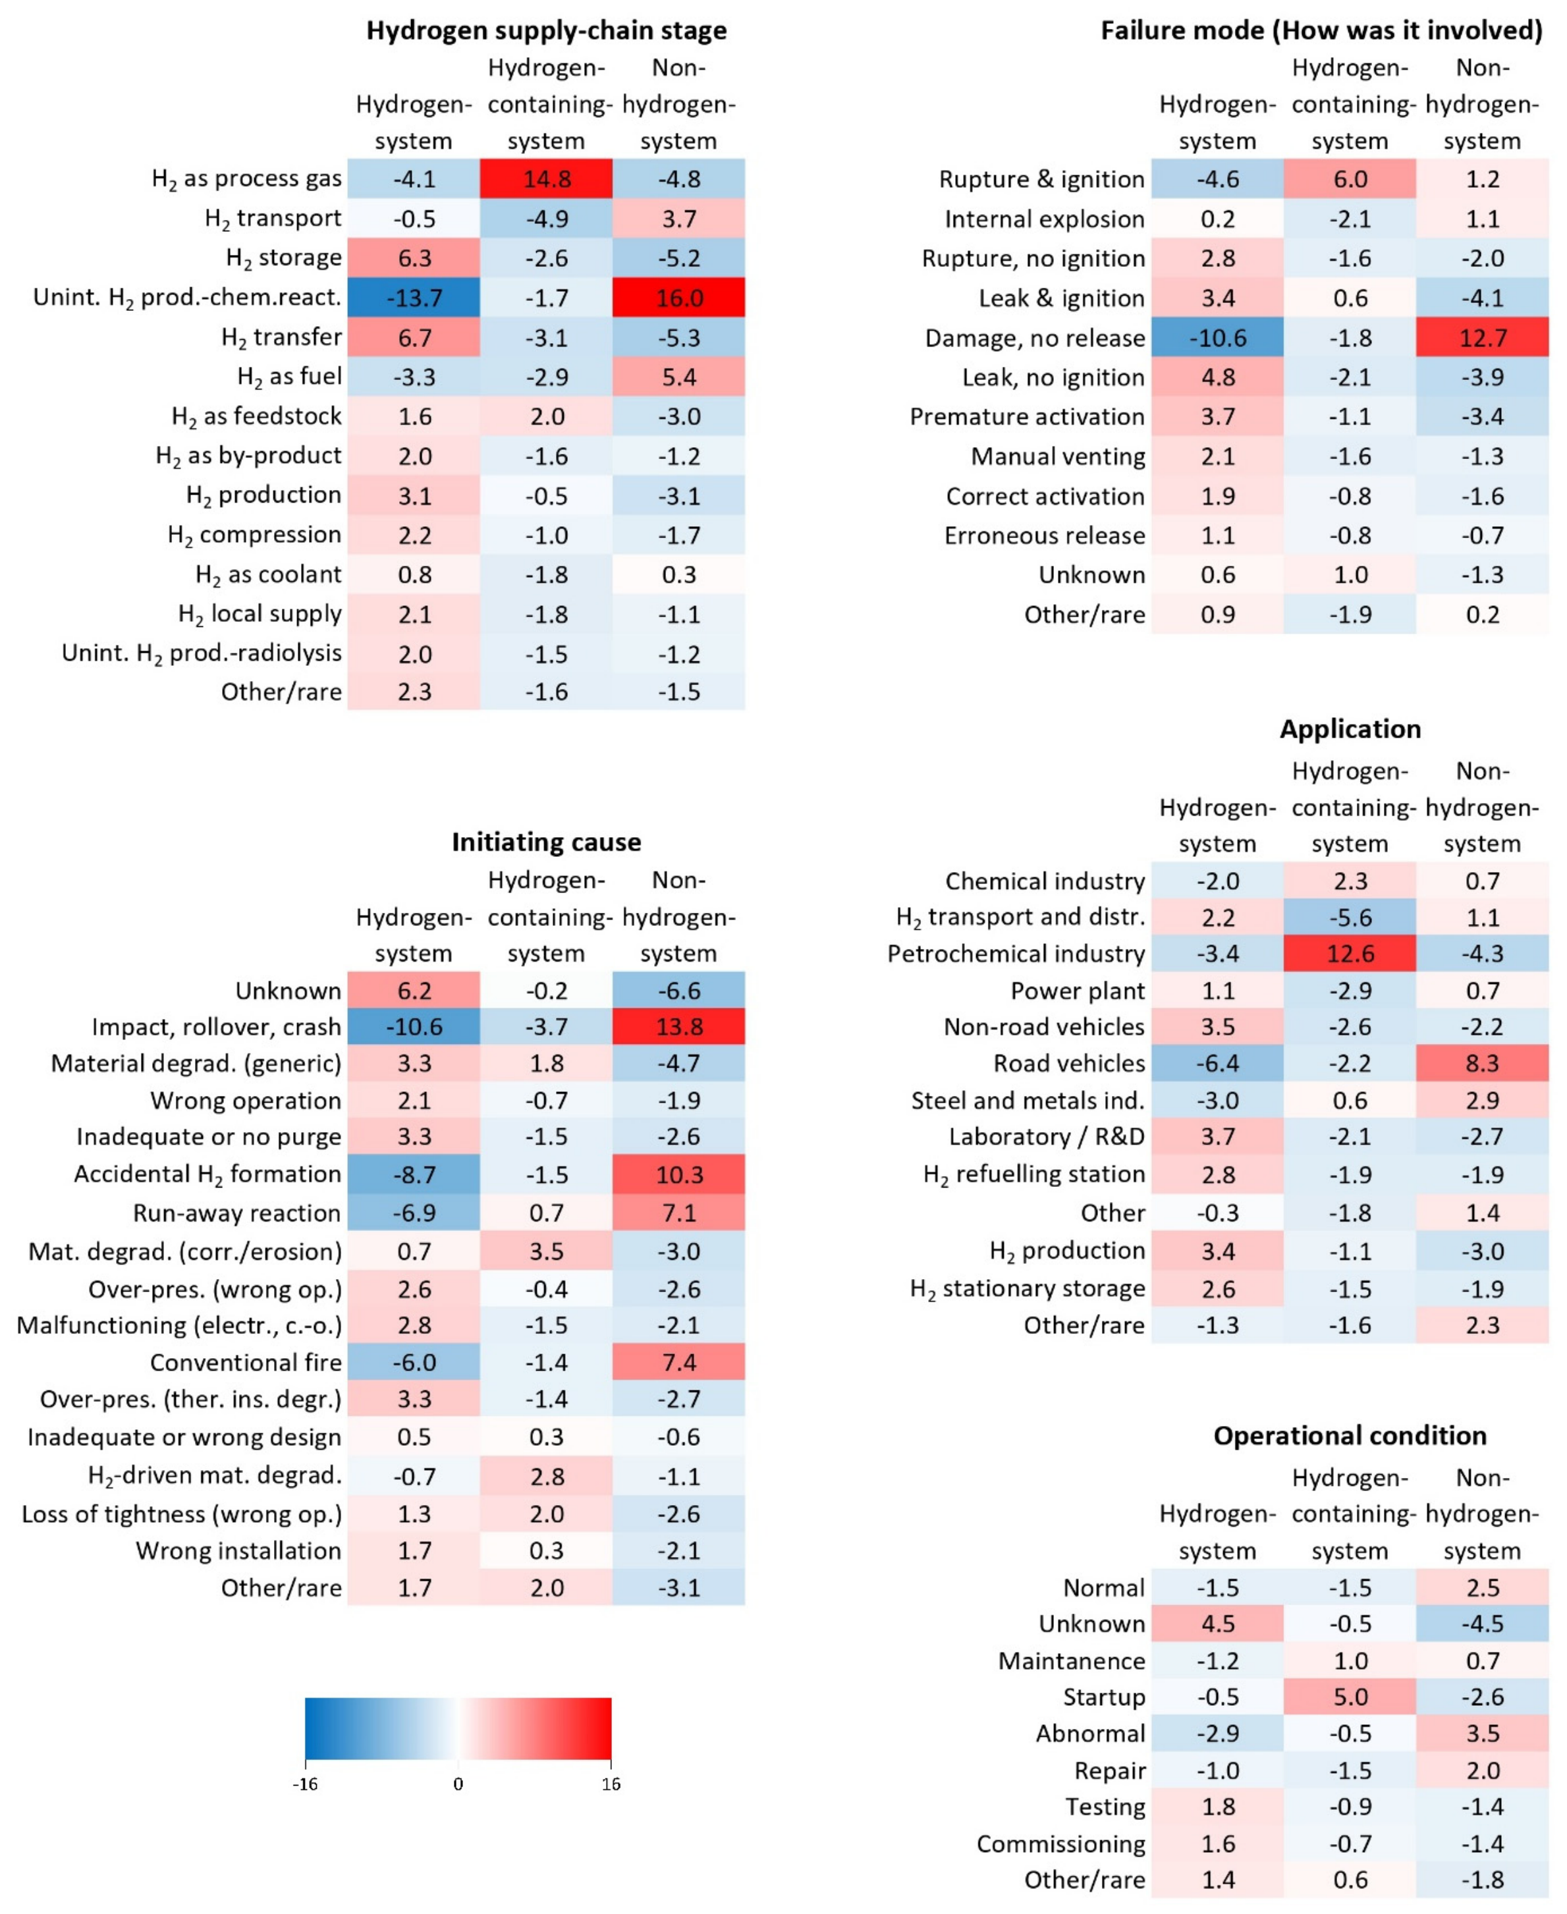
Hydrogen-containing system records formed the most concentrated profile: 77.8% were classified as hydrogen used as a process gas, 61.6% occurred in the petrochemical industry, 62.6% had rupture with ignition as the failure mode, and 17.2% occurred during startup. Because this category contained 99 records, its percentages are less precise than those of the larger groups; 95% Wilson intervals were 68.6–84.8% for process-gas service, 51.8–70.6% for petrochemical applications, 52.8–71.5% for rupture with ignition, and 11.0–25.8% for startup. Hydrogen system records were distributed across transport (18.0%), process-gas service (17.1%), storage (13.1%) and transfer (11.7%). Their common initiating causes included material degradation, wrong operation and inadequate purging, although 29.4% were coded unknown. Non-hydrogen system records were characterized by unintended chemical hydrogen generation (30.5% of supply chain stage classifications), impact/rollover/crash (32.3% of initiating causes), damage without release (21.4% of failure modes), and road-vehicle applications (12.2%).
Adjusted residuals illustrated in
Figure 3 showed distinct patterns across all five contextual and initiating-factor descriptors. Hydrogen-containing system initiation was strongly over-represented in process-gas service, rupture with ignition, petrochemical applications, and startup. Non-hydrogen system initiation was over-represented in unintended chemical hydrogen generation and hydrogen-as-fuel contexts; impact/rollover/crash, accidental hydrogen formation, runaway reactions, and conventional fires; damage without release; road-vehicle applications; and abnormal operating conditions. Hydrogen system initiation was over-represented in hydrogen storage and transfer, material degradation and inadequate or no purge, leak-without-ignition and leak-and-ignition failure modes, and hydrogen production, refueling-station, and stationary-storage applications. It was strongly under-represented in unintended chemical hydrogen generation, impact/rollover/crash, accidental hydrogen formation, conventional fires, damage without release, and road-vehicle applications. Operational-condition contrasts were generally weaker than those for the other four descriptors.
3.4. Root Cause Class Profiles and Adjusted Associations
Two records—one hydrogen system record and one non-hydrogen system record—had blank root cause fields and were excluded. The root-cause denominators are therefore 824, 99 and 310 rather than the overall initiating system category counts of 825, 99 and 311 shown in
Table 2. In the remaining 1233 records, substantive classes differed in magnitude and robustness (
Table 4). Human factors had the largest unadjusted separation (V = 0.250): they were recorded in 39.7% of non-hydrogen system records, 16.6% of hydrogen system records and 11.1% of hydrogen-containing system records. Management factors were most frequent in hydrogen-containing system records (41.4%), followed by non-hydrogen system records (33.5%) and hydrogen system records (24.3%). Installation error was more frequent in hydrogen system records (11.5%) than in the other two groups. System-design and environmental classes showed little separation. Unknown was recorded in 33.1% of hydrogen system records but 17.1% of non-hydrogen system records and is interpreted as a classification-completeness difference rather than a causal contrast.
The primary multinomial model included 880 records with at least one substantive root cause class: 552 hydrogen system, 71 hydrogen-containing system, and 257 non-hydrogen system records. Complete primary-model coefficients, confidence intervals,
p-values, Holm-adjusted
p-values for the root cause coefficients, and model diagnostics are provided in
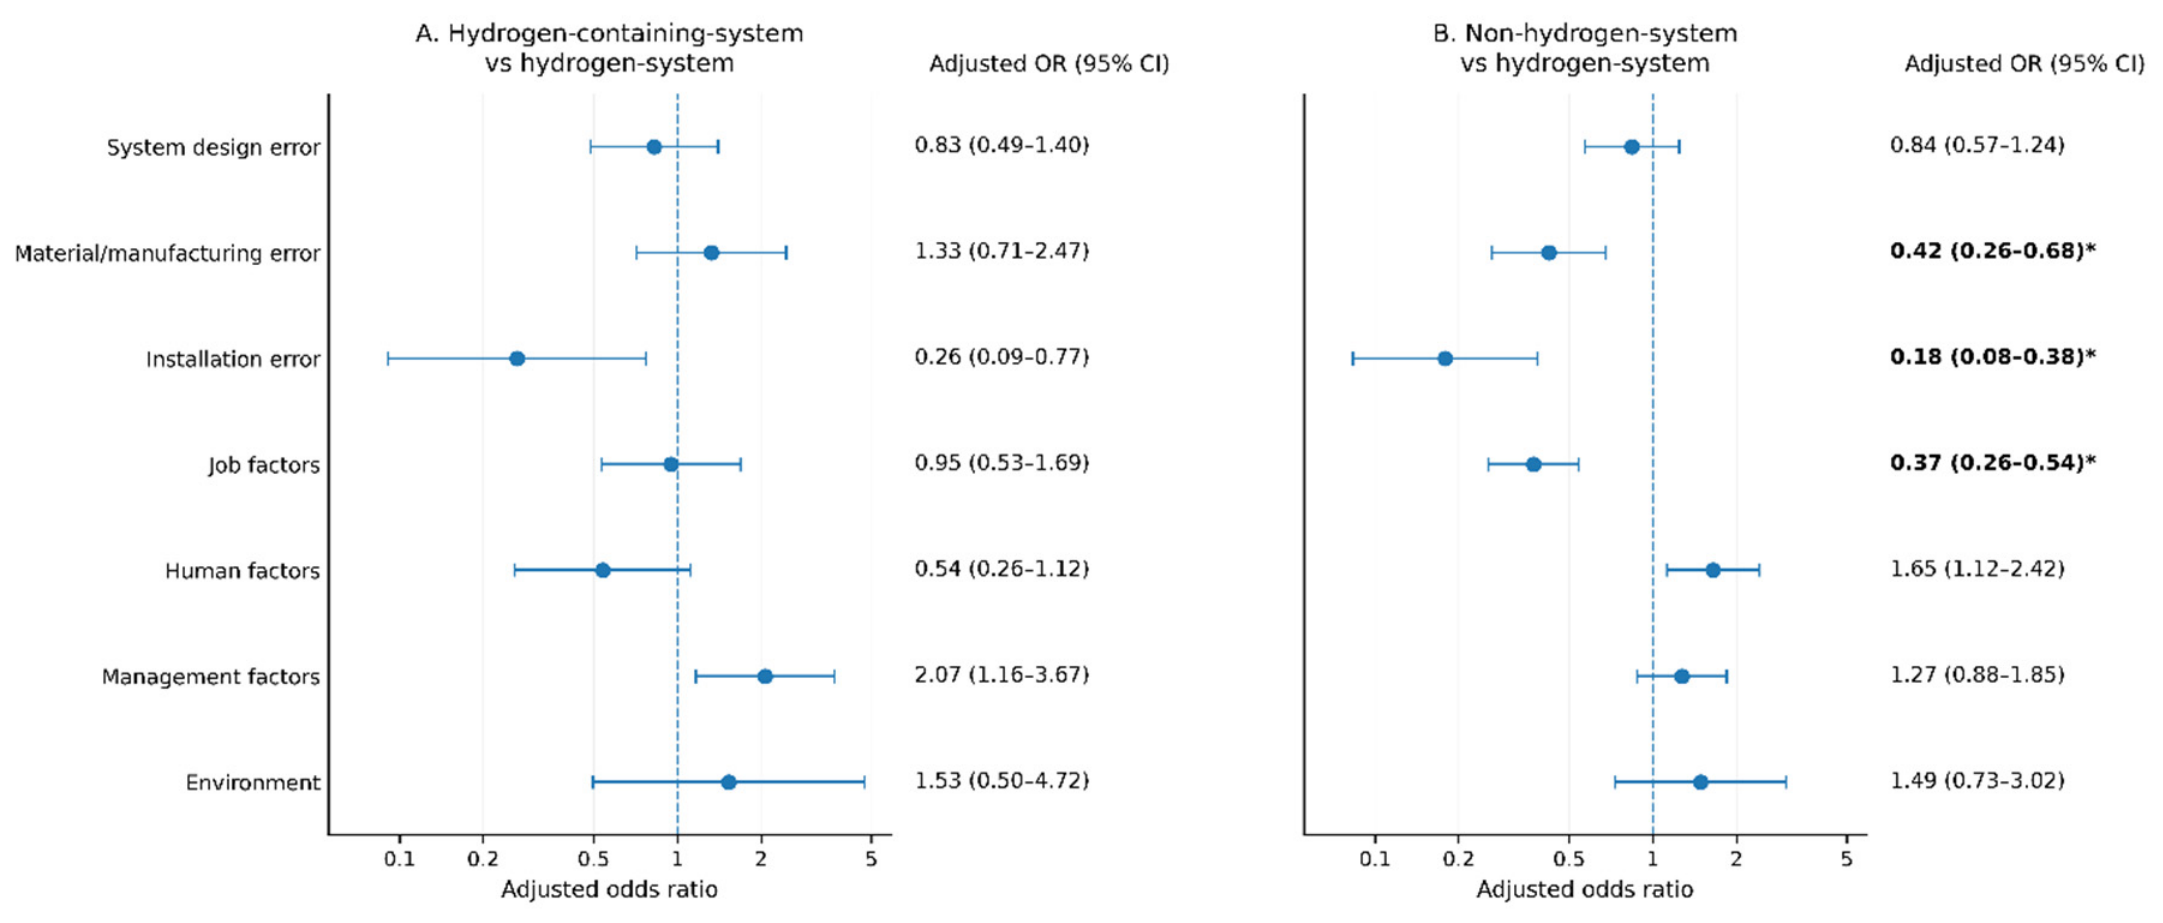
Supplementary Table S1. After adjustment and Holm correction across the 14 root-class coefficients, the presence of a material/manufacturing-error label was associated with lower odds of non-hydrogen system versus hydrogen-system initiation (OR 0.42, 95% CI 0.26–0.68; Holm
p = 0.004) (
Figure 4). The same direction was observed for installation error (OR 0.18, 0.08–0.38; Holm
p < 0.001) and job factors (OR 0.37, 0.26–0.54; Holm
p < 0.001). Nominal associations for human factors in the non-hydrogen system contrast and for management and installation classes in the hydrogen-containing system contrast did not remain supported after the 14-test correction. The model had a McFadden pseudo-R
2 = 0.144 and a likelihood-ratio
p < 0.0001.
A full-record sensitivity model retained 1233 records with a nonblank root cause field and included Unknown as an explicit classification-completeness indicator. The three supported substantive associations were materially unchanged: material/manufacturing error OR 0.42, installation error OR 0.18, and job factors OR 0.37 for non-hydrogen system versus hydrogen system initiation. Unknown was also associated with lower odds of non-hydrogen system initiation, which is interpreted only as a difference in classification completeness. Both models converged successfully. Maximum absolute pairwise correlations among non-intercept predictors were 0.687 in the primary model and 0.705 in the full-record model; estimates are therefore interpreted as conditional associations rather than independent causal effects. All model estimates describe adjusted co-occurrence of curator-assigned labels, not causal effects.
Figure 4.
Adjusted associations between substantive root cause classes and initiating system category in the primary multinomial logistic model (n = 880). Hydrogen system initiation was the reference outcome. Adjusted odds ratios were estimated simultaneously for the seven substantive root cause indicators while adjusting for quality label 4–5, year 2000 or later, Europe, and North America; regions other than Europe and North America formed the regional reference group. Points show adjusted odds ratios, and error bars show HC0 robust 95% confidence intervals. Exact estimates and confidence intervals are shown beside each point. The vertical dashed line denotes OR = 1. Asterisks indicate Holm-adjusted p < 0.05 across the 14 root cause coefficients.
Figure 4.
Adjusted associations between substantive root cause classes and initiating system category in the primary multinomial logistic model (n = 880). Hydrogen system initiation was the reference outcome. Adjusted odds ratios were estimated simultaneously for the seven substantive root cause indicators while adjusting for quality label 4–5, year 2000 or later, Europe, and North America; regions other than Europe and North America formed the regional reference group. Points show adjusted odds ratios, and error bars show HC0 robust 95% confidence intervals. Exact estimates and confidence intervals are shown beside each point. The vertical dashed line denotes OR = 1. Asterisks indicate Holm-adjusted p < 0.05 across the 14 root cause coefficients.
3.5. Sensitivity Analyses
Across the seven structured descriptors shown in
Table 5, associations generally persisted when analyses were restricted by record quality and period, although effect magnitudes varied. In quality-label 4–5 records, Cramér’s V was 0.185 for physical effect, 0.270 for consequence, 0.622 for supply chain stage, 0.613 for initiating cause and 0.247 for failure mode. In records dated 2000 or later, corresponding values were 0.329, 0.353, 0.572, 0.589 and 0.374, respectively. The combined quality 4–5/post-2000 subset produced the same qualitative ordering, with the largest observed separation for initiating cause and supply chain stage. Application differences also persisted in all three restricted subsets (V = 0.403–0.469). Operational-condition differences were smaller and were not supported in the quality 4–5 subset (V = 0.206, Monte Carlo
p = 0.077) or the combined subset (V = 0.245,
p = 0.098), although they remained supported in post-2000 records (V = 0.173,
p = 0.007).
Root cause sensitivity results were less uniform. Installation error differences persisted after Holm correction in quality-label 4–5 and combined quality/time subsets. In contrast, the large full-sample differences in human factors and Unknown attenuated in quality-label 4–5 records, while human factor differences remained pronounced in the post-2000 subset. This pattern indicates that some root cause contrasts depend on historical or lower-detail records and should not be generalized as stable properties of all high-quality events.
4. Discussion
4.1. Principal Findings and Scope of Inference
The initiating system descriptor organizes the current HIAD snapshot into three statistically distinguishable curator-coded descriptive profiles associated with different recorded contexts. Approximately two-thirds of records with a known initiating system category were hydrogen system-initiated, 8.0% were hydrogen-containing system-initiated and one-quarter were non-hydrogen system-initiated. The hydrogen system share changed modestly from 69.8% in the 755-record HIAD 2.1 analysis [
22] to 66.8% in the present HIAD 2.4 snapshot. This difference should not be interpreted as a temporal trend or evidence that the category proportions are stable because HIAD 2.2 introduced the intermediate hydrogen-containing system category [
12], and the public repository subsequently grew and evolved. Apparent differences between published HIAD snapshots may therefore reflect database growth and taxonomy changes as well as changes in the composition of reported events.
The largest observed within-schema Cramér’s V values occurred for supply chain stage and initiating cause, followed by application, failure mode, consequence and physical effect, with operational condition showing the smallest separation. The rare-category sensitivity analysis showed that the initiating-cause association remained substantial after sparsity was reduced, although its magnitude decreased. Zhang et al. [
28] also analyzed a large HIAD 2.1 dataset using human, machine, job and management factors, but focused on time-varying risk coupling rather than the initiating system taxonomy examined here.
The central interpretive limitation is shared curator inference. The official HIAD schema does not define the compared fields as synonymous. The event initiating system identifies whether the sequence began in a hydrogen system, a hydrogen-containing system, or a non-hydrogen system; initiating cause asks why the affected component failed; and supply chain stage identifies the hydrogen activity involved [
12]. Published guidance does not state that initiating system is calculated deterministically from either of the other fields. However, it also does not provide a detailed coding algorithm, and the fields were generally inferred by the same curators from the same source narratives. Consequently, the large associations with initiating cause and supply chain stage may partly reflect the coherent application of related coding decisions. They demonstrate within-database profile separation and taxonomy coherence, not the independent discovery of causal structure or validation of the initiating system field. That narrower result remains useful when the database is used to retrieve cases for different hazard-review questions, provided the labels and their limits are explicit [
1,
2].
4.2. Comparison with Earlier HIAD Research
Earlier HIAD work primarily described aggregate incident distributions, lessons, material failures, value-chain stages or specific applications [
16,
17,
18,
19,
20,
22]. More recent HIAD 2.1 studies have used physics-informed Bayesian networks for refueling-station risk, preliminary hazard analysis for pipeline and storage hazards, and transformer or large language model methods for prediction and data enhancement [
23,
24,
25,
26]. These studies show active methodological development around HIAD but ask different questions. The present study focuses on how the updated three-category initiating system organizes HIAD 2.4 when examined jointly with the structured initiating factor and contextual descriptors. Its novelty lies in that descriptor combination and the accompanying sparse-table, effect-size, sensitivity and adjusted-association analyses, rather than in the general idea of statistically analyzing an incident database.
The comparison of the main findings also shows both continuity and added resolution. The 66.8% hydrogen system share in HIAD 2.4 is close to the 69.8% reported by Sk et al. [
22], while the prominence of job, human, and management factors in their analysis is also evident in the present root cause profiles, although several of these contrasts attenuated after adjustment or restriction to higher-quality records. Relative to Wen et al. [
16], whose lessons emphasized system design, manufacturing and installation, human factors, and emergency response, the present analysis adds separation by initiating system category, particularly the distinct process-gas/rupture-with-ignition profile of hydrogen-containing system records and the impact/crash and unintended-hydrogen-generation profile of non-hydrogen system records.
Li et al. [
21] asked whether a failure mechanism depends on hydrogen’s physicochemical properties. The initiating system category asks where the recorded sequence begins. The two dimensions can cross: a hydrogen system event may arise from a conventional installation error, and a non-hydrogen collision may later release hydrogen. Future work could combine the two taxonomies, but the current study intentionally preserves their distinction.
4.3. Process-Safety Interpretation
Safety-barrier and bow-tie methods distinguish initiating threats and preventive barriers from top events and consequence-mitigation barriers [
7,
8,
9]. On that basis, the observed HIAD profiles suggest different questions for incident review; they do not demonstrate that particular barriers were absent, ineffective or necessary in every event. The following recommendations are therefore practice-oriented interpretations of the observed profiles rather than direct empirical findings about barrier performance.
For hydrogen system initiation, the observed profile suggests that incident reviews should examine the hydrogen boundary and its immediate controls: material compatibility, component and joint integrity, installation quality, inspection and maintenance, purging, pressure protection, leak detection, isolation and ignition control. This interpretation is supported by the prominence of material degradation, inadequate purge, installation error and both ignited and unignited release modes. It is consistent with earlier HIAD analysis of inspection and maintenance failures [
17].
The hydrogen-containing system category represents an interface context in which the initiating process system contains hydrogen but is not classified as dedicated hydrogen equipment. Here, process interface denotes that wider technical and organizational boundary between the hydrogen-containing process and adjacent plant systems. Its concentration in process-gas and petrochemical service, startup conditions and rupture with ignition, together with the higher unadjusted prevalence of management-factor labels, suggests that reviews should examine composition changes, startup/shutdown procedures, management of change, process control, relief and isolation, escalation between units and organizational ownership across technical boundaries. These are review priorities inferred from the profile, not evidence that the controls were missing in each event. The management factor contrast should be interpreted cautiously because it was less robust after multivariable adjustment and sensitivity analysis.
For non-hydrogen system initiation, the observed over-representation of impact/rollover/crash, accidental hydrogen formation, runaway reactions, conventional fires, damage without release and near misses suggests beginning the review outside the hydrogen boundary. Relevant topics include external impact protection, vehicle and route controls, reactive chemistry assessment, separation and fire exposure, emergency decision-making, and barriers that preserve containment under external threats. The higher unadjusted human factor prevalence also suggests examining task design, communication and decision support, although this contrast was less robust in some adjusted and higher-quality analyses, while avoiding the simplistic attribution of complex events to individual error.
4.4. Implications for Taxonomy and Incident Learning
Incident databases are most useful when a query retrieves cases that are comparable for the decision at hand [
2]. The HIAD initiating system descriptor can serve as an initial triage variable: did the event begin within hydrogen equipment, at an interface where the initiating system contains hydrogen, or in another system? Combined with initiating cause, failure mode and supply chain stage, it supports the selection of comparable cases for process hazard analysis, bow-tie development, barrier audits and training, before returning to the underlying narratives for case-specific interpretation. The same profiles may also help structure hydrogen safety training: hydrogen system cases can place greater emphasis on equipment integrity and release control, hydrogen-containing system cases on process interfaces and startup conditions, and non-hydrogen system cases on external impacts, conventional hazards, and unintended hydrogen generation. It can also prevent two opposite errors: treating every HIAD record as evidence of hydrogen-specific equipment weakness or overlooking whether hydrogen subsequently changed the event or remained contained after another system initiated the sequence.
The sensitivity analyses add an important qualification. Supply chain stage, initiating cause, failure mode, physical effect, consequence and application remained distinguishable in high-quality and recent records, whereas operational condition differences did not persist in the high-quality subsets. Some root cause differences also did not persist among quality-label 4–5 records, highlighting the dependence of broad causal labels on source detail and historical coding. Database users should therefore treat initiating system, initiating cause and failure mode primarily as retrieval variables, then return to narrative and original investigation when making case-specific causal judgments. This is consistent with research showing that effective learning depends on the quality and completeness of incident information and on how lessons are translated into broader organizational action [
4,
5,
6].
4.5. Strengths and Limitations
Strengths include use of the complete downloadable HIAD 2.4 snapshot; a recorded checksum; the explicit accounting of unavailable values; the preservation of consequence–sequence direction; unpooled omnibus tests with fixed-margin Monte Carlo p-values for sparse tables; effect sizes and adjusted standardized residuals; the separate treatment of multi-label root causes and Unknown; sensitivity analyses across all seven structured descriptors; and both a primary multinomial model and a full-record sensitivity model. The analysis and aggregate outputs are reproducible from the frozen source file.
Several limitations constrain interpretation. HIAD lacks exposure denominators and is affected by geographic, sectoral, temporal, and severity-related reporting patterns [
11,
13,
15]. The findings cannot be converted into accident rates, component failure probabilities or comparisons of technology safety. The main limitation is that initiating system and most compared descriptors were interpreted by the same curators from the same narratives and process context. Their association is therefore not independent evidence of causal mechanisms or classification validity and may partly describe coding behavior. The study used curator labels without any manual re-coding or review of original sources; therefore, inter-curator reliability could not be assessed and remains a limitation. The hydrogen-containing system category contains only 99 records, so its percentages have wider uncertainty and should not be treated as stable population proportions. Category labels can change as HIAD evolves. Dates sometimes represent ranges or approximate periods; the first reported year was used for sensitivity analysis, and the year-2000 cutoff is a pragmatic boundary between older and more recent records. The primary multinomial model conditions on having at least one root cause class other than Unknown, although the full-record sensitivity model produced materially stable root cause estimates. Multinomial associations can still be influenced by omitted descriptors and correlated classifications. Accordingly, the lower adjusted odds for material/manufacturing error should be interpreted as lower recorded prevalence of that curator-assigned label, not as evidence that the underlying mechanism was intrinsically less common; differences in source detail or coding may also contribute. Finally, the dataset is a time-specific public snapshot, and later downloads will differ.
These limitations are compatible with the descriptive objective. The study evaluates how the current HIAD taxonomy organizes its own reported records. It does not claim that the categories represent mutually exclusive physical mechanisms, that one initiating system causes an outcome, or that the observed shares represent real-world incidence.