1. Introduction
With the advancement of carbon peaking and carbon neutrality targets, the large-scale integration of high-penetration distributed energy resources and emerging AC/DC sources and loads into distribution networks has introduced severe randomness and volatility into system power flows. Traditional medium-voltage distribution networks operating in an open-loop mode based on mechanical switches lack global active regulation and power-sharing capabilities, making it difficult to cope with local heavy loading and spatio-temporal power imbalances [
1]. To break through this bottleneck, equal-frequency AC–AC flexible interconnection devices based on modular multi-level converter technology have emerged as core equipment for the flexible transformation of modern active distribution networks, owing to their advantages of transformerless direct connection to the MV grid, continuous power-flow regulation, and strong multi-port scalability [
2]. Recent studies have further demonstrated that SOP-based flexible interconnection can support stepwise power transfer and coordinated operation in active distribution networks [
3].
Furthermore, to enhance the system capacity for high-penetration renewable energy integration and operational resilience, integrating energy-storage systems (ESSs) with flexible interconnection devices to construct energy-storage-type flexible interconnection systems has become a current research hotspot. For medium-voltage, high-capacity, equal-frequency AC–AC interconnection scenarios, a modular multi-level AC–AC converter with distributed energy storage provides a practical device form that combines converter-based power-flow control with energy buffering. Considering the requirements of MV high-capacity scenarios for a high power density and high conversion efficiency, a distributed integration scheme that directly parallels the energy-storage units with the MMC submodule capacitors has attracted significant attention [
4]. Recent studies have systematically evaluated candidate MMC-BESS submodule topologies and developed state-of-charge-balancing control strategies for grid-connected MMC-BESS systems, further confirming the suitability of distributed battery integration for medium-voltage applications [
5,
6]. This hybrid architecture can not only achieve precise active-power-flow distribution and reactive-power compensation among multiple feeders, but also effectively smooth power fluctuations and provide emergency support for critical loads under extreme operating conditions, relying on the energy time-shifting characteristics of the ESS.
Although energy-storage-integrated modular multi-level AC–AC converters offer considerable potential for equal-frequency flexible interconnection, their system-level coordinated control under variable source–load conditions remains insufficiently developed. Existing studies have investigated feeder-load balancing and flexible interconnection [
7], cooperative operations of medium- and low-voltage distribution networks [
8,
9], voltage and reactive-power regulation using soft open points (SOPs) [
10], coordinated planning of SOPs and energy-storage systems [
11], and robust operations under high photovoltaic penetration [
12]. Uncertainty-aware scheduling and coordinated voltage regulation methods have also demonstrated the ability of SOP-based systems to improve renewable-energy accommodation and voltage profiles [
13,
14,
15]. Nevertheless, these studies mainly address scheduling, voltage regulation, or feeder-level power exchange and do not fully consider the coupled operating boundaries of multi-port converters, distributed energy storage, and supporting feeders under equal-frequency AC–AC interconnection conditions.
Under abnormal operating conditions, SOP-assisted load support and network reconfiguration have been investigated to improve restoration capability and distribution-network resilience [
16,
17,
18], while broader assessment frameworks have been developed to quantify the operational flexibility of active distribution networks with high penetration of distributed generation [
19]. However, several gaps remain. First, the coupling between feeder-loading states, net-load balance, and SOC-dependent ESS charge/discharge limits has not been systematically incorporated into a unified converter-level coordination framework. Second, existing MMC-BESS studies have primarily focused on submodule topology and internal SOC balancing, with limited consideration of feeder-level operating-zone transitions and fault-restoration requirements. Third, post-fault support strategies seldom coordinated islanded-load restoration with the loading margins of the remaining healthy feeders and the transfer of the DC-voltage-control responsibility. Consequently, secondary overloading of supporting feeders and the loss of the DC-voltage reference may arise during severe source–load fluctuations or master-feeder faults.
To address these gaps, this paper proposes an operating-zone-based coordinated power control strategy for an energy-storage-integrated modular multi-level AC–AC converter under equal-frequency flexible interconnection conditions. The main contributions are threefold. First, feeder connection states, net-load balance, feeder-loading limits, and SOC-dependent ESS power boundaries are incorporated into a unified state-to-command mapping, covering normal operation, single and multiple slave-feeder faults, and a master-feeder fault. Second, coordinated port-power allocation, ESS buffering, PV curtailment, and non-critical load shedding are applied according to the available feeder and storage margins, enabling feeder-overload mitigation and active-power balancing without relying on an iterative optimization procedure. Third, a hierarchical fault-support and master–slave reconfiguration mechanism is developed to restore islanded loads, transfer the DC-voltage control responsibility, and prevent sustained overloading of the remaining healthy feeders.
The proposed strategy is evaluated using electromagnetic-transient simulations covering four representative operating zones and is further compared with a conventional SOP benchmark using quantitative indices, including response time, feeder-loading rate, loading-excess integral, off-grid-load restoration ratio, power-tracking error, and DC-bus voltage deviation. As summarized in
Table 1, the principal distinction of this work is the explicit coupling of ESS state-dependent power boundaries with feeder operating conditions and fault-induced control-mode transitions rather than the simple addition of energy storage to a conventional flexible interconnection device.
2. Topology and Basic Principles of Energy-Storage-Integrated Flexible Interconnection Devices
2.1. Topology of Energy-Storage-Type Flexible Interconnection Devices
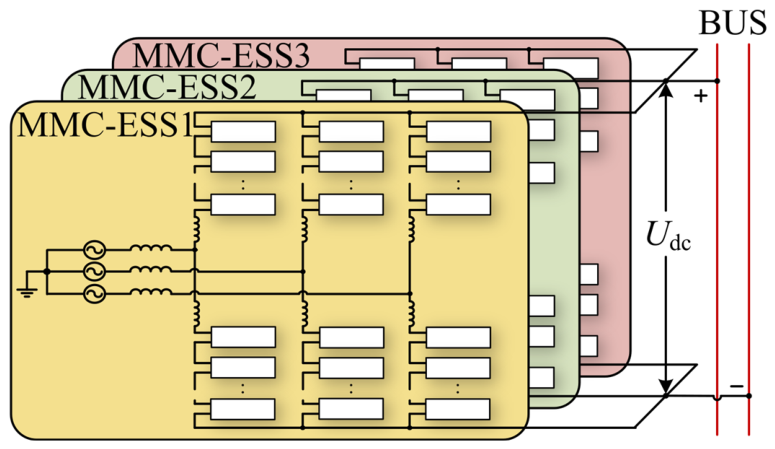
To address the coordinated control of flexible interconnection systems and the power-flow mutual assistance among multiple distribution network feeders, this study develops an energy-storage-integrated flexible interconnection system based on back-to-back MMCs, as shown in
Figure 1. The system uses an MMC-ESS with integrated distributed energy-storage units as the core power module; the DC side of each port converges at a common DC bus, while the AC sides are connected to different distribution feeders.
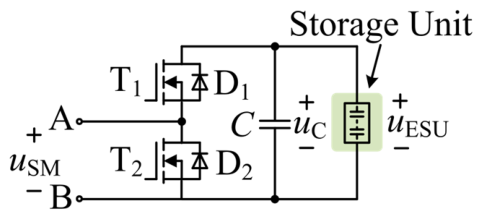
In the idealized topology shown in
Figure 2, the battery branch is connected to the submodule DC link without an actively controlled DC/DC conversion stage. In a practical implementation, however, the battery is not connected to the DC-link capacitor through an unprotected conductor. The battery branch includes a passive DC reactor, fuses, DC contactors, a pre-charge resistor, current and voltage sensors, and battery-management-system protection. These components provide current-ripple suppression, safe energization, electrical isolation, and fault protection but do not perform active-power conversion. Consequently, the battery stack and the submodule capacitor share approximately the same DC-link voltage during normal operation, and the battery-stack voltage must be matched to the admissible submodule-voltage range.
When the submodule is inserted into the corresponding MMC arm, the arm current exchanges energy with the submodule DC link. The capacitor primarily buffers switching-frequency and transient power components, whereas the battery supplies or absorbs the lower-frequency average energy component through the passive DC reactor. When the submodule is bypassed, the DC link is removed from the arm-current path, while the battery remains connected to the capacitor within the internal DC branch. Therefore, the average battery power is regulated indirectly through the submodule insertion pattern and the inter-phase, inter-arm, and submodule-level energy-balancing commands rather than through an independent DC/DC duty ratio. This arrangement reduces the number of active-power conversion stages and improves power density, although it also requires appropriate battery-voltage matching, pre-charge coordination, current-ripple limitation, and BMS protection.
2.2. Converter Control Modes and Energy-Storage Control
To achieve flexible power scheduling and energy routing for the multi-port FID-ESS under complex operating scenarios, the lower-level control layer should decouple the regulation of AC converter stations from that of the distributed energy-storage system. This paper designs corresponding basic control modes for the MMC port converters and the distributed energy-storage system, respectively.
To coordinate the energy flow among the ports, the bottom layer of the system adopts a master–slave control architecture: the master station control (constant Udc-Q mode) is responsible for maintaining a constant common DC bus voltage, providing a power balance node for the system. The slave station control (constant P-Q or constant V-f mode) operates in the constant P-Q mode under normal grid-connected conditions to independently regulate the active and reactive powers of each feeder; when a feeder fault causes a port to go off-grid, it transitions to the constant V-f mode to provide rigid voltage support for the critical islanded loads. Furthermore, to prevent the distributed energy storage from prematurely exiting operation due to inconsistent charging and discharging, a hierarchical state-of-charge (SOC)-balancing control is configured at the bottom layer. By superimposing DC and fundamental frequency voltage bias components at the inter-phase, inter-arm, and submodule levels, the dynamic consistency of the SOC among the massive internal energy-storage units is achieved, thereby providing reliable capacity support for the upper-layer, system-level coordinated regulation.
It should be emphasized that the SOC-balancing correction is an internal power-allocation term rather than an additional system-level active-power command. For a prescribed station-level ESS power reference, the correction redistributes the required energy exchange among phases, arms, and submodules by superimposing the corresponding DC and fundamental-frequency voltage-bias components. Ideally, the balancing corrections satisfy a zero-sum condition across the participating storage units; therefore, they do not change the total active power delivered or absorbed by the converter station. Their function is to make storage units with relatively high SOC contribute more discharge power or absorb less charging power, while units with relatively low SOC contribute less discharge power or absorb more charging power. Consequently, the internal SOC dispersion is reduced without disturbing the external active-power, reactive-power, or DC-voltage control objective.
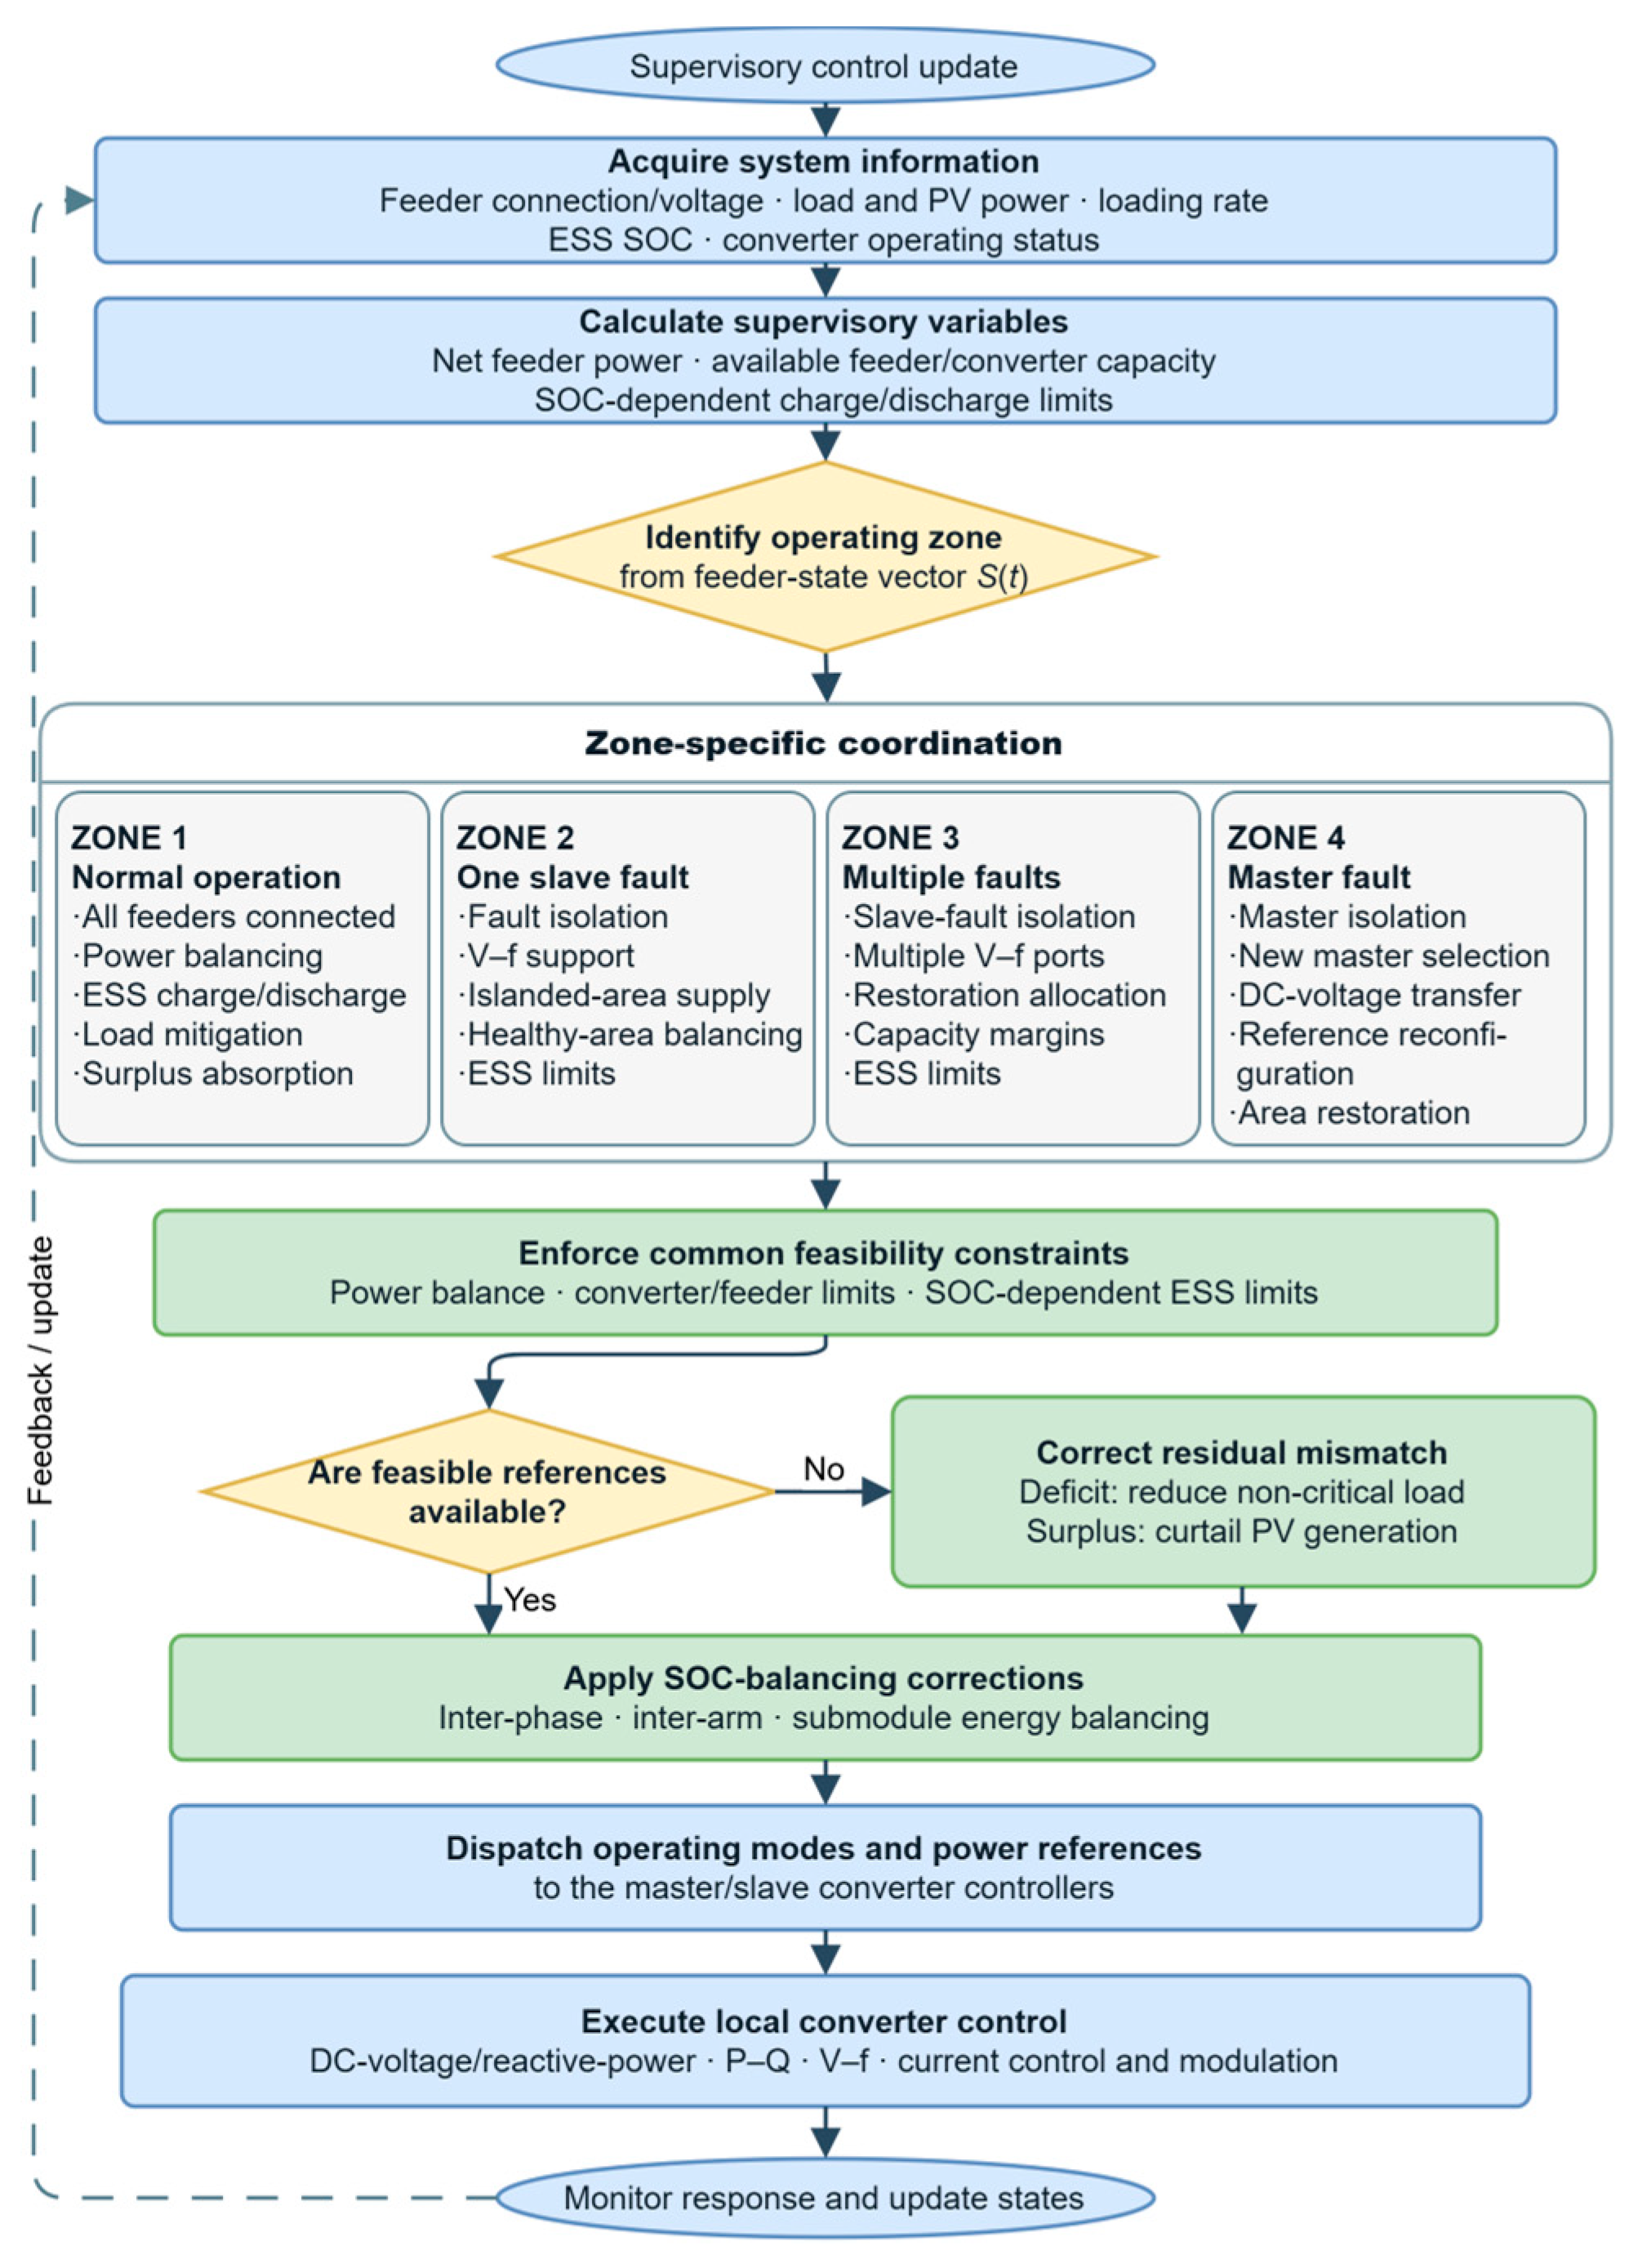
4. Coordinated Power Control Strategy Based on Operating Zone Division
4.1. Operating Zone 1: Normal Feeder Conditions
When all feeders remain grid-connected, the FID-ESS operates in Zone 1. The supervisory objective is to redistribute active power among the feeders while minimizing unnecessary ESS operation. The aggregate loading condition is evaluated using the capacity-weighted average feeder-loading rate
where
PL,n,
PDG,n, and
Pnet,n denote the load power, DG output power, and equivalent net-load power of feeder
n, respectively;
Pnet is the total system net load; and
Sr,n is the rated capacity of feeder
n. All DG units considered in this study are represented by PV generation systems. A positive
Pnet indicates an overall power deficit, whereas a negative value indicates a power surplus.
The average loading rate is used as a supervisory feasibility indicator rather than as the final security criterion for each feeder. Under proportional power redistribution, the target grid-side power of feeder
n is assigned according to its rated capacity:
Accordingly, an initially overloaded feeder is relieved through controllable power exchange among the converter ports. Because an average value may conceal a residual overload on an individual feeder, the actual maximum feeder-loading rate and the loading-excess integral defined in Equation (28) are also used in the performance assessment.
The feeder-loading threshold is set to 80% as an engineering operating limit. This value retains approximately 20% of the feeder capacity for load disturbances, renewable-generation uncertainty, and post-fault support. It is not treated as a universally optimal value and may be adjusted in practical applications according to feeder thermal ratings, contingency requirements, forecast uncertainty, and the required operating reserve. Based on Pnet, Lavg1, and ESS SOC, Zone 1 is divided into the following five subzones. The zero-net-load boundary is assigned to the non-surplus branch to ensure a complete operating-zone partition.
(1) Operating Zone 1-1: When
Pnet ≥ 0 and
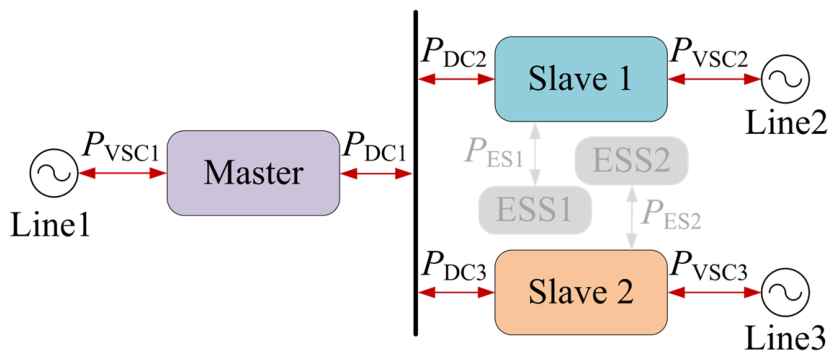
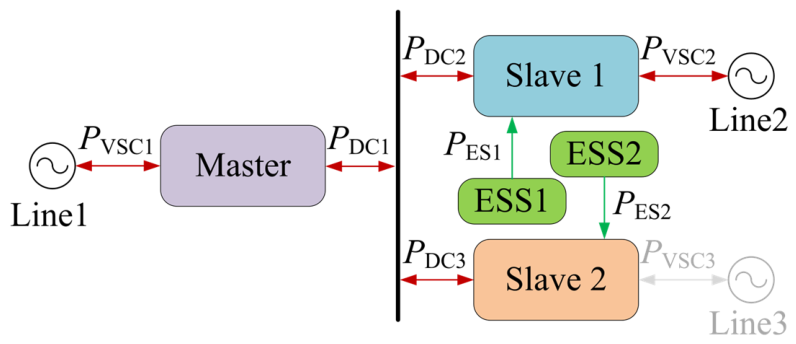
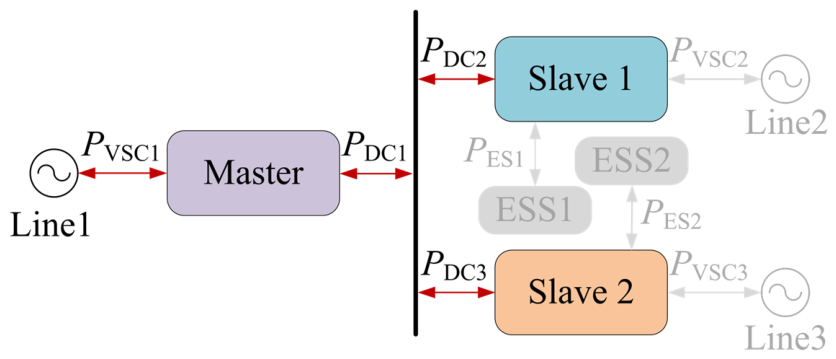
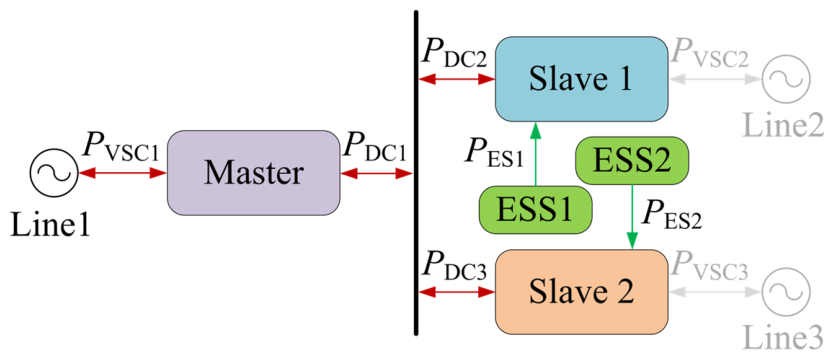
Lavg1 ≤ 80%, the system has no feeder-loading violation. The ESS remains in standby, and the PV units operate in maximum power point tracking (MPPT) mode. The FID-ESS redistributes active power among the feeders according to their real-time net loads so that the feeder-loading rates approach the proportional targets defined by Equation (10). The corresponding power-flow direction and power-balance relationships are shown in
Figure 4 and Equation (11), respectively.
(2) Operating Zone 1-2: When
Pnet > 0,
Lavg1 > 80%, and
SOC >
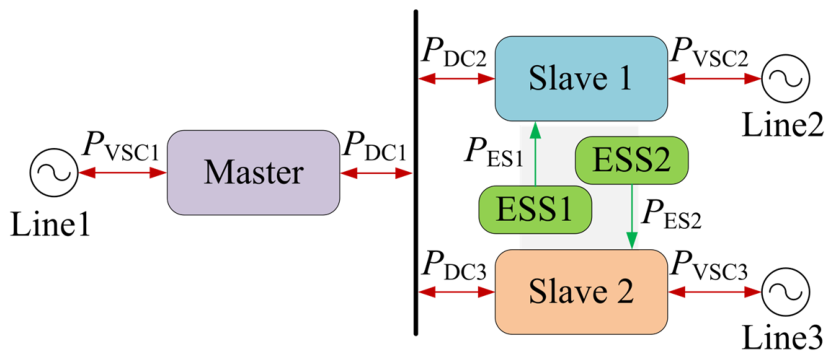
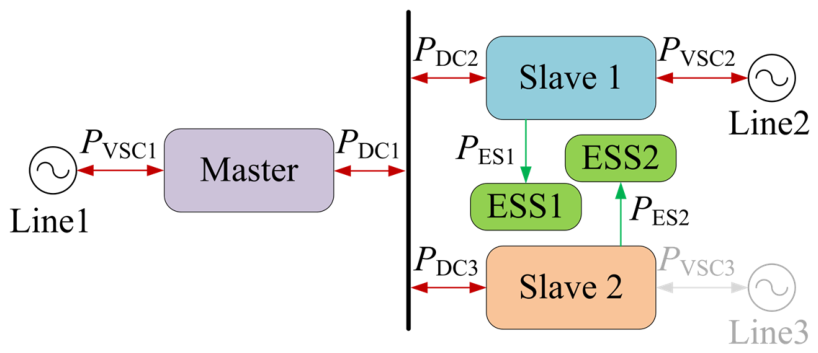
SOCmin, power redistribution alone is insufficient to satisfy the feeder-loading limit. The ESS therefore discharges within the SOC-dependent power boundary defined in
Section 3.1, while the PV units remain in MPPT mode. The ESS power is distributed through the converter ports to mitigate the loading of the heavily loaded feeders, and the internal SOC-balancing controller coordinates the power contribution of the individual storage units.
Figure 5 and Equation (12) present the corresponding power-flow and power-balance relationships.
(3) Operating Zone 1-3: When
Pnet > 0,
Lavg1 > 80%, and
SOC ≤
SOCmin, ESS discharge is blocked. If the feeder-loading constraint cannot be satisfied through converter-port power redistribution, non-critical load reduction is activated while the PV units remain in MPPT mode. The converter ports continue to redistribute the available power among the feeders, giving priority to the critical loads. The corresponding power-balance relationships are given by Equation (13), and the power-flow direction is the same as that shown in
Figure 4.
where
PcriL,n denotes the critical load power retained on feeder
n after non-critical load reduction.
(4) Operating Zone 1-4: When
Pnet < 0 and
SOC <
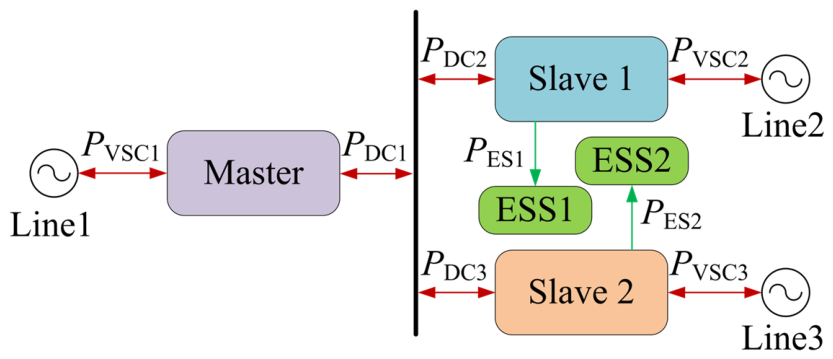
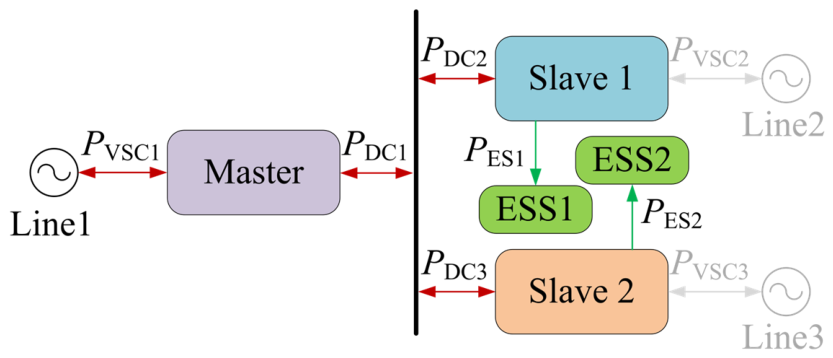
SOCmax, the system has surplus generation and sufficient ESS charging capacity. The grid-side feeder-power references are set to zero, the PV units remain in MPPT mode, and the surplus power is transferred through the converter ports to charge the ESS. The internal SOC-balancing controller distributes the charging power among the storage units without changing the station-level power reference.
Figure 6 and Equation (14) show the associated power-flow and power-balance relationships.
(5) Operating Zone 1-5: When
Pnet < 0 and
SOC ≥
SOCmax, ESS charging is blocked. The PV outputs are therefore curtailed to match the local load demand while maintaining zero grid-side power exchange. The FID-ESS continues to redistribute power among the feeders to eliminate local power mismatches. The corresponding power-balance relationships are given by Equation (15), and the power-flow direction is consistent with
Figure 4.
where
PDGlim,n denotes the curtailed PV output power of feeder
n.
4.2. Operating Zone 2: Single Slave Station Feeder Fault Conditions
When the feeder connected to one slave station is faulted, the corresponding grid-side connection is isolated and the affected converter port changes to
V-
f control to support the islanded load. Taking a fault on the feeder connected to slave station 2 as an example,
Pg,3 = 0, while feeders 1 and 2 remain grid-connected. Because the total system demand must now be supplied through the two healthy feeders, the ESS, and the available PV generation, the capacity-weighted loading rate of the healthy feeders is defined as
Zone 2 retains the five net-power and SOC states defined for Zone 1 but additionally considers islanded-load restoration and evaluates the loading condition using only the healthy feeders. The common ESS, PV, and load-boundary actions are therefore not repeated below; only the fault-specific power-allocation rules are described.
(1) Operating Zone 2-1: When
Pnet ≥ 0 and
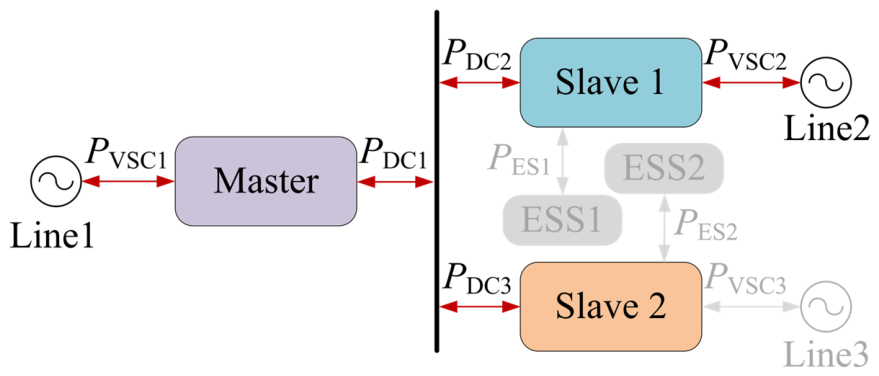
Lavg2 ≤ 80%, the two healthy feeders have sufficient capacity to support the islanded feeder without ESS discharge. The ESS remains in standby, the PV units maintain MPPT operation, and the FID-ESS transfers power to the faulted feeder while balancing the loading rates of the healthy feeders. The corresponding power-flow and power-balance relationships are shown in
Figure 7 and Equation (17).
(2) Operating Zone 2-2: When
Pnet > 0,
Lavg2 > 80%, and
SOC >
SOCmin, support from the healthy feeders alone would violate the prescribed loading limit. The ESS therefore discharges within its SOC-dependent boundary to supply part of the islanded demand and reduce the loading of the healthy feeders. The PV units remain in MPPT mode, and the internal SOC-balancing controller coordinates the ESS power allocation.
Figure 8 and Equation (18) show the corresponding power-flow and power-balance relationships.
(3) Operating Zone 2-3: When
Pnet > 0,
Lavg2 > 80%, and
SOC ≤
SOCmin, ESS discharge is unavailable. Non-critical load reduction is consequently activated to prevent sustained overloading of the healthy feeders, while the converter ports continue to transfer the available power to the islanded feeder and the PV units remain in MPPT mode. The associated power-balance relationships are given by Equation (19), and the power-flow direction is consistent with
Figure 7.
(4) Operating Zone 2-4: When
Pnet < 0 and
SOC <
SOCmax, the available PV generation is sufficient to support the connected and islanded loads and provide surplus power for ESS charging. The grid-side feeder-power references remain zero, and the surplus power is transferred to the ESS through the converter ports.
Figure 9 and Equation (20) present the corresponding power-flow and power-balance relationships.
(5) Operating Zone 2-5: When
Pnet < 0 and
SOC ≥
SOCmax, ESS charging is blocked. The PV outputs are curtailed so that the available generation matches the total demand of the grid-connected and islanded feeders while the grid-side power exchange remains zero. The corresponding power-balance relationships are given by Equation (21), and the power-flow direction is consistent with
Figure 7.
4.3. Operating Zone 3: Multi-Slave Station Feeder Fault Conditions
When the feeders connected to both slave stations are faulted,
Pg2 =
Pg3 = 0, the corresponding ports are isolated from the grid and operate in
V-
f mode to support their islanded loads. In this condition, the master feeder is the only remaining grid-connected power source. The FID-ESS, distributed ESS units, and available PV generation must therefore coordinate to restore the islanded loads without causing sustained overloading of the master feeder. The relevant loading indicator is the master-feeder-loading rate
Lmain, as defined by Equation (22).
where
Sr,1 is the rated capacity of the master feeder.
Zone 3 follows the same five-state mapping as Zone 2. The principal differences are that both slave feeders are islanded and Lmain replaces Lavg2 as the loading criterion. Accordingly, Zones 3-1 to 3-5 correspond to Zones 2-1 to 2-5, with all external grid support supplied through the master feeder.
(1) Operating Zone 3-1: When
Pnet ≥ 0 and
Lmain ≤ 80%, the master feeder has sufficient capacity to support both islanded feeders without ESS discharge. The ESS remains in standby, the PV units operate in MPPT mode, and the FID-ESS transfers power from the master feeder to the two islanded feeders. The associated power-flow and power-balance relationships are shown in
Figure 10 and Equation (23).
(2) Operating Zone 3-2: When
Pnet > 0,
Lmain > 80%, and
SOC >
SOCmin, the ESS discharges to supply part of the islanded demand and reduce the loading stress on the master feeder. The PV units remain in MPPT mode, and the ESS units execute internal SOC balancing while following their station-level power references.
Figure 11 and Equation (24) show the corresponding power-flow and power-balance relationships.
(3) Operating Zone 3-3: When
Pnet > 0,
Lmain > 80%, and
SOC ≤
SOCmin, ESS discharge is blocked. Non-critical load reduction is therefore activated to prevent sustained overloading of the master feeder while preserving the supply of critical loads in the islanded areas. The corresponding power-balance relationships are given by Equation (25), and the power-flow direction is consistent with
Figure 10.
(4) Operating Zone 3-4: When
Pnet < 0 and
SOC <
SOCmax, the combined PV generation exceeds the total load demand. The surplus power is transferred through the FID-ESS to charge the ESS, while the grid-side power of the master feeder is maintained at zero. This state follows the same SOC and charging-power boundaries as Zone 2-4, and its power-flow direction is shown in
Figure 12.
(5) Operating Zone 3-5: When
Pnet < 0 and
SOC ≥
SOCmax, ESS charging is blocked and the PV outputs are curtailed to match the total load demand. The master-feeder grid-side power remains zero, and the FID-ESS distributes the available PV power among the connected and islanded areas. This state follows the same power-balance rule as Zone 2-5, and its power-flow direction is consistent with
Figure 10.
4.4. Operating Zone 4: Master Station Feeder Fault Conditions
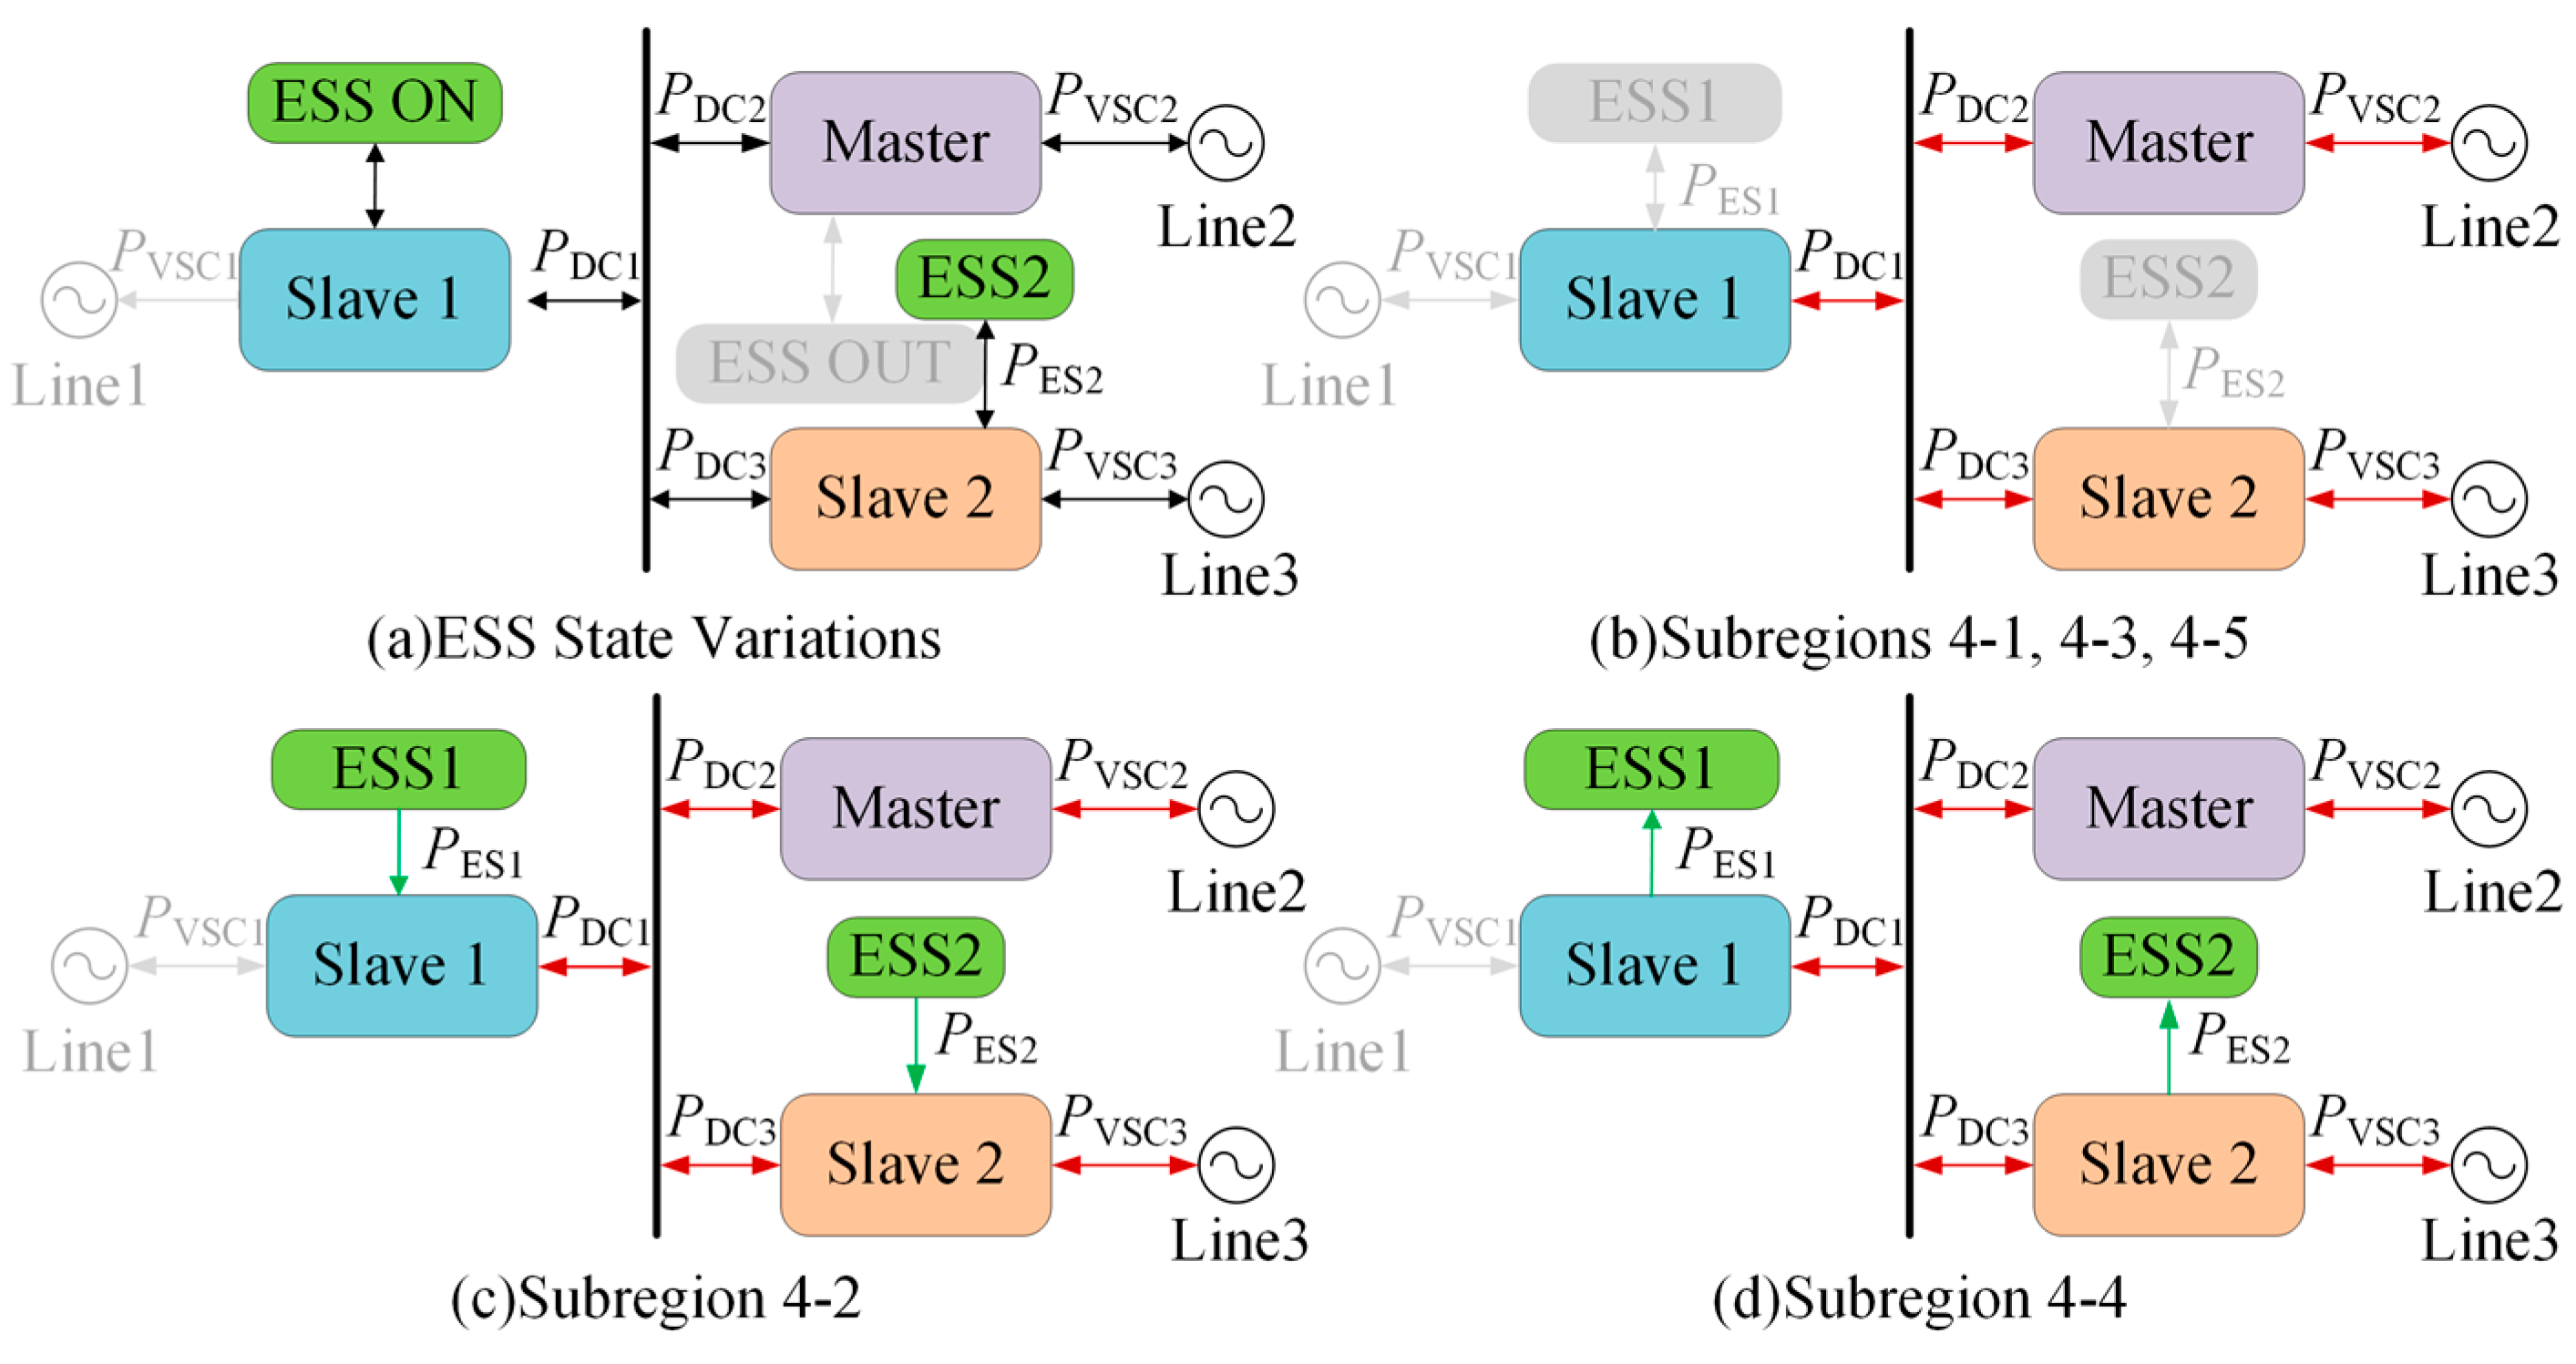
When the feeder connected to the original master station is faulted, i.e., Pg,1 = 0, the faulted grid-side connection is isolated, and the feeder-state signal is transmitted to the supervisory controller. Because the original master-side converter can no longer maintain the common DC-bus voltage, the system initiates master–slave reconfiguration. Among the remaining healthy slave stations, the station with the largest available power-support margin is selected as the new master station. Its converter control mode is changed from P-Q control to Udc-Q control to rebuild the DC-voltage reference. Simultaneously, the converter connected to the isolated original master feeder changes to V-f control to establish the voltage and frequency of the islanded load, and the relevant ESS units are activated according to their SOC-dependent power limits. The supervisory controller then recalculates the port-level active-power references using the remaining healthy-feeder capacity, islanded-load demand, available PV generation, and ESS charge/discharge margins.
During the finite reconfiguration interval, the local voltage, current, modulation, and SOC-balancing control loops remain active. The proposed sequence is therefore intended to prevent a sustained loss of the DC-voltage reference and restore the isolated load as rapidly as possible. Nevertheless, the transition involves fault isolation, operating-mode switching, and reference redistribution and should not be interpreted as an ideal zero-disturbance or mathematically bumpless transfer.
Figure 13a illustrates the ESS-state and converter-control-mode transitions during master–slave reconfiguration, whereas
Figure 13b–d presents representative post-reconfiguration power-flow patterns. After the DC-voltage control responsibility has been transferred, the remaining coordinated power allocation follows the five-state logic defined for Zone 2, with the feeder-loading rate recalculated using the remaining healthy feeders and the updated master–slave configuration. Under a power deficit, the healthy feeders first support the islanded load through the FID-ESS; ESS discharge is activated when the prescribed feeder-loading limit would otherwise be exceeded, and non-critical load reduction is used when the ESS reaches its lower SOC boundary. Under a power surplus, the ESS absorbs the excess power until its upper SOC boundary is reached, after which PV curtailment maintains the system power balance. Because these SOC and power-boundary actions are identical to those defined in
Section 4.2, the corresponding Zone 4 subzones are not repeated individually.
5. Results and Discussion
5.1. Simulation Setup and Evaluation Indices
A detailed MATLAB/Simulink model was developed based on the energy-storage-integrated flexible interconnection topology shown in
Figure 1. The FID-ESS master station was connected to feeder 1, whereas the two slave stations were connected to feeders 2 and 3. The principal model parameters are listed in
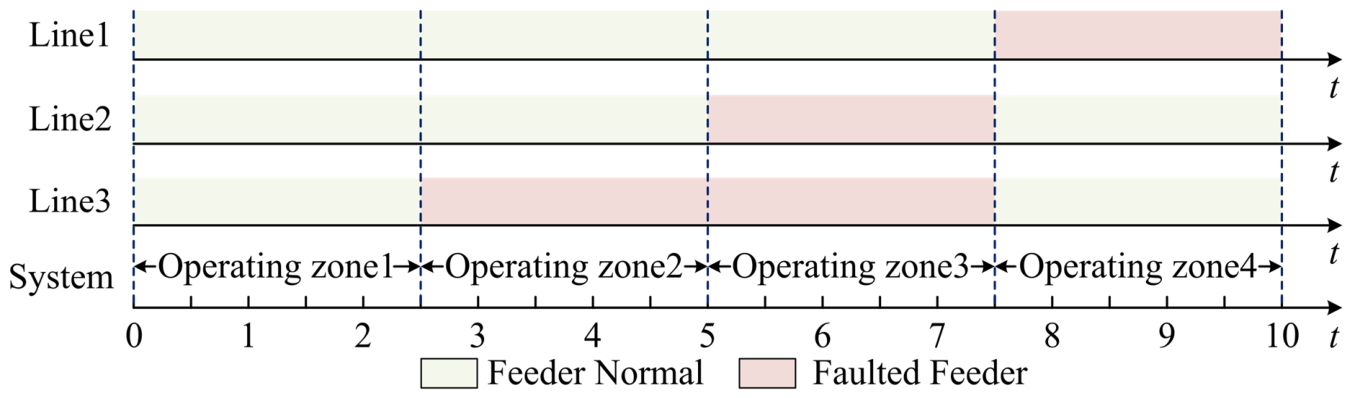
Table 3. Four cases were evaluated separately according to the following timeline: normal interconnected operation in Zone 1 from 0 to 2.5 s; a single slave-feeder fault in Zone 2 from 2.5 to 5.0 s; simultaneous faults of two slave feeders in Zone 3 from 5.0 to 7.5 s; and a master-feeder fault followed by master–slave reconfiguration in Zone 4 from 7.6 to 8.5 s. The corresponding operating-zone sequence is illustrated in
Figure 14.
The following indices were used to quantify dynamic and operational performance. The control or reconfiguration time
was measured from the occurrence of a control or fault event to the establishment of the corresponding steady operating state. For a faulted feeder, the load-restoration ratio and power-tracking error were calculated as
where
is the off-grid net demand and
is the power supplied through the FID-ESS during the post-transition evaluation interval. The maximum DC-bus voltage deviation was defined as
The DC-bus recovery time
denotes the longest time required for the DC voltage to return to and remain within the
band around its reference. In addition, the accumulated feeder-loading violation was evaluated using
where
is expressed in percentage-point seconds. Because the electromagnetic-transient simulation interval is much shorter than the natural SOC evolution time of the ESS, the SOC was intentionally brought to its prescribed limits at selected instants in Zones 1–3 to exercise the boundary-handling logic. Therefore, the resulting load-shedding and PV-curtailment values are used to verify the control sequence within the compressed test windows and should not be interpreted as long-term energy-performance estimates.
The three-feeder configuration is employed as a representative functional model of a medium-voltage multi-terminal flexible interconnection system rather than as a reproduction of a specific distribution network. Four scenario-specific time-domain source–load datasets are considered, corresponding to the four operating zones described above. The feeder ratings and the 50% energy-storage capacity ratio are adopted as control-validation parameters to provide sufficient power-buffering capability and to exercise the SOC-dependent boundary-handling logic; they are not intended as universally optimal planning values. In practical applications, the feeder and ESS capacities should be determined according to the actual load level, renewable-energy variability, required restoration duration, permissible depth of discharge, operating reserve, battery degradation, and economic constraints.
The per-device carrier frequency was set to 2 kHz in all four electromagnetic-transient models. At the fundamental frequency, the corresponding carrier ratio is
The phase-shifted-carrier PWM distributes the carriers uniformly among the 50 submod-ules in each arm, resulting in an arm-voltage waveform whose apparent ripple frequency is substantially higher than the switching frequency of an individual device. The power system and control sampling times were set to 20 and 40 μs, respectively, providing suffi-cient numerical resolution within the 500 μs switching period. Per-device switching fre-quencies of approximately 1–2 kHz have been reported for medium-voltage and mul-ti-megawatt MMC applications [
23,
24]. Therefore, 2 kHz was selected as a representative switching-level simulation parameter. It was not obtained through device-specific loss or thermal optimization; practical selection would additionally require consideration of semiconductor switching and conduction losses, junction-temperature limits, cooling ca-pability, harmonic requirements, insulation coordination, and the selected submod-ule-voltage rating.
5.2. Performance of the Proposed Coordinated Control Strategy
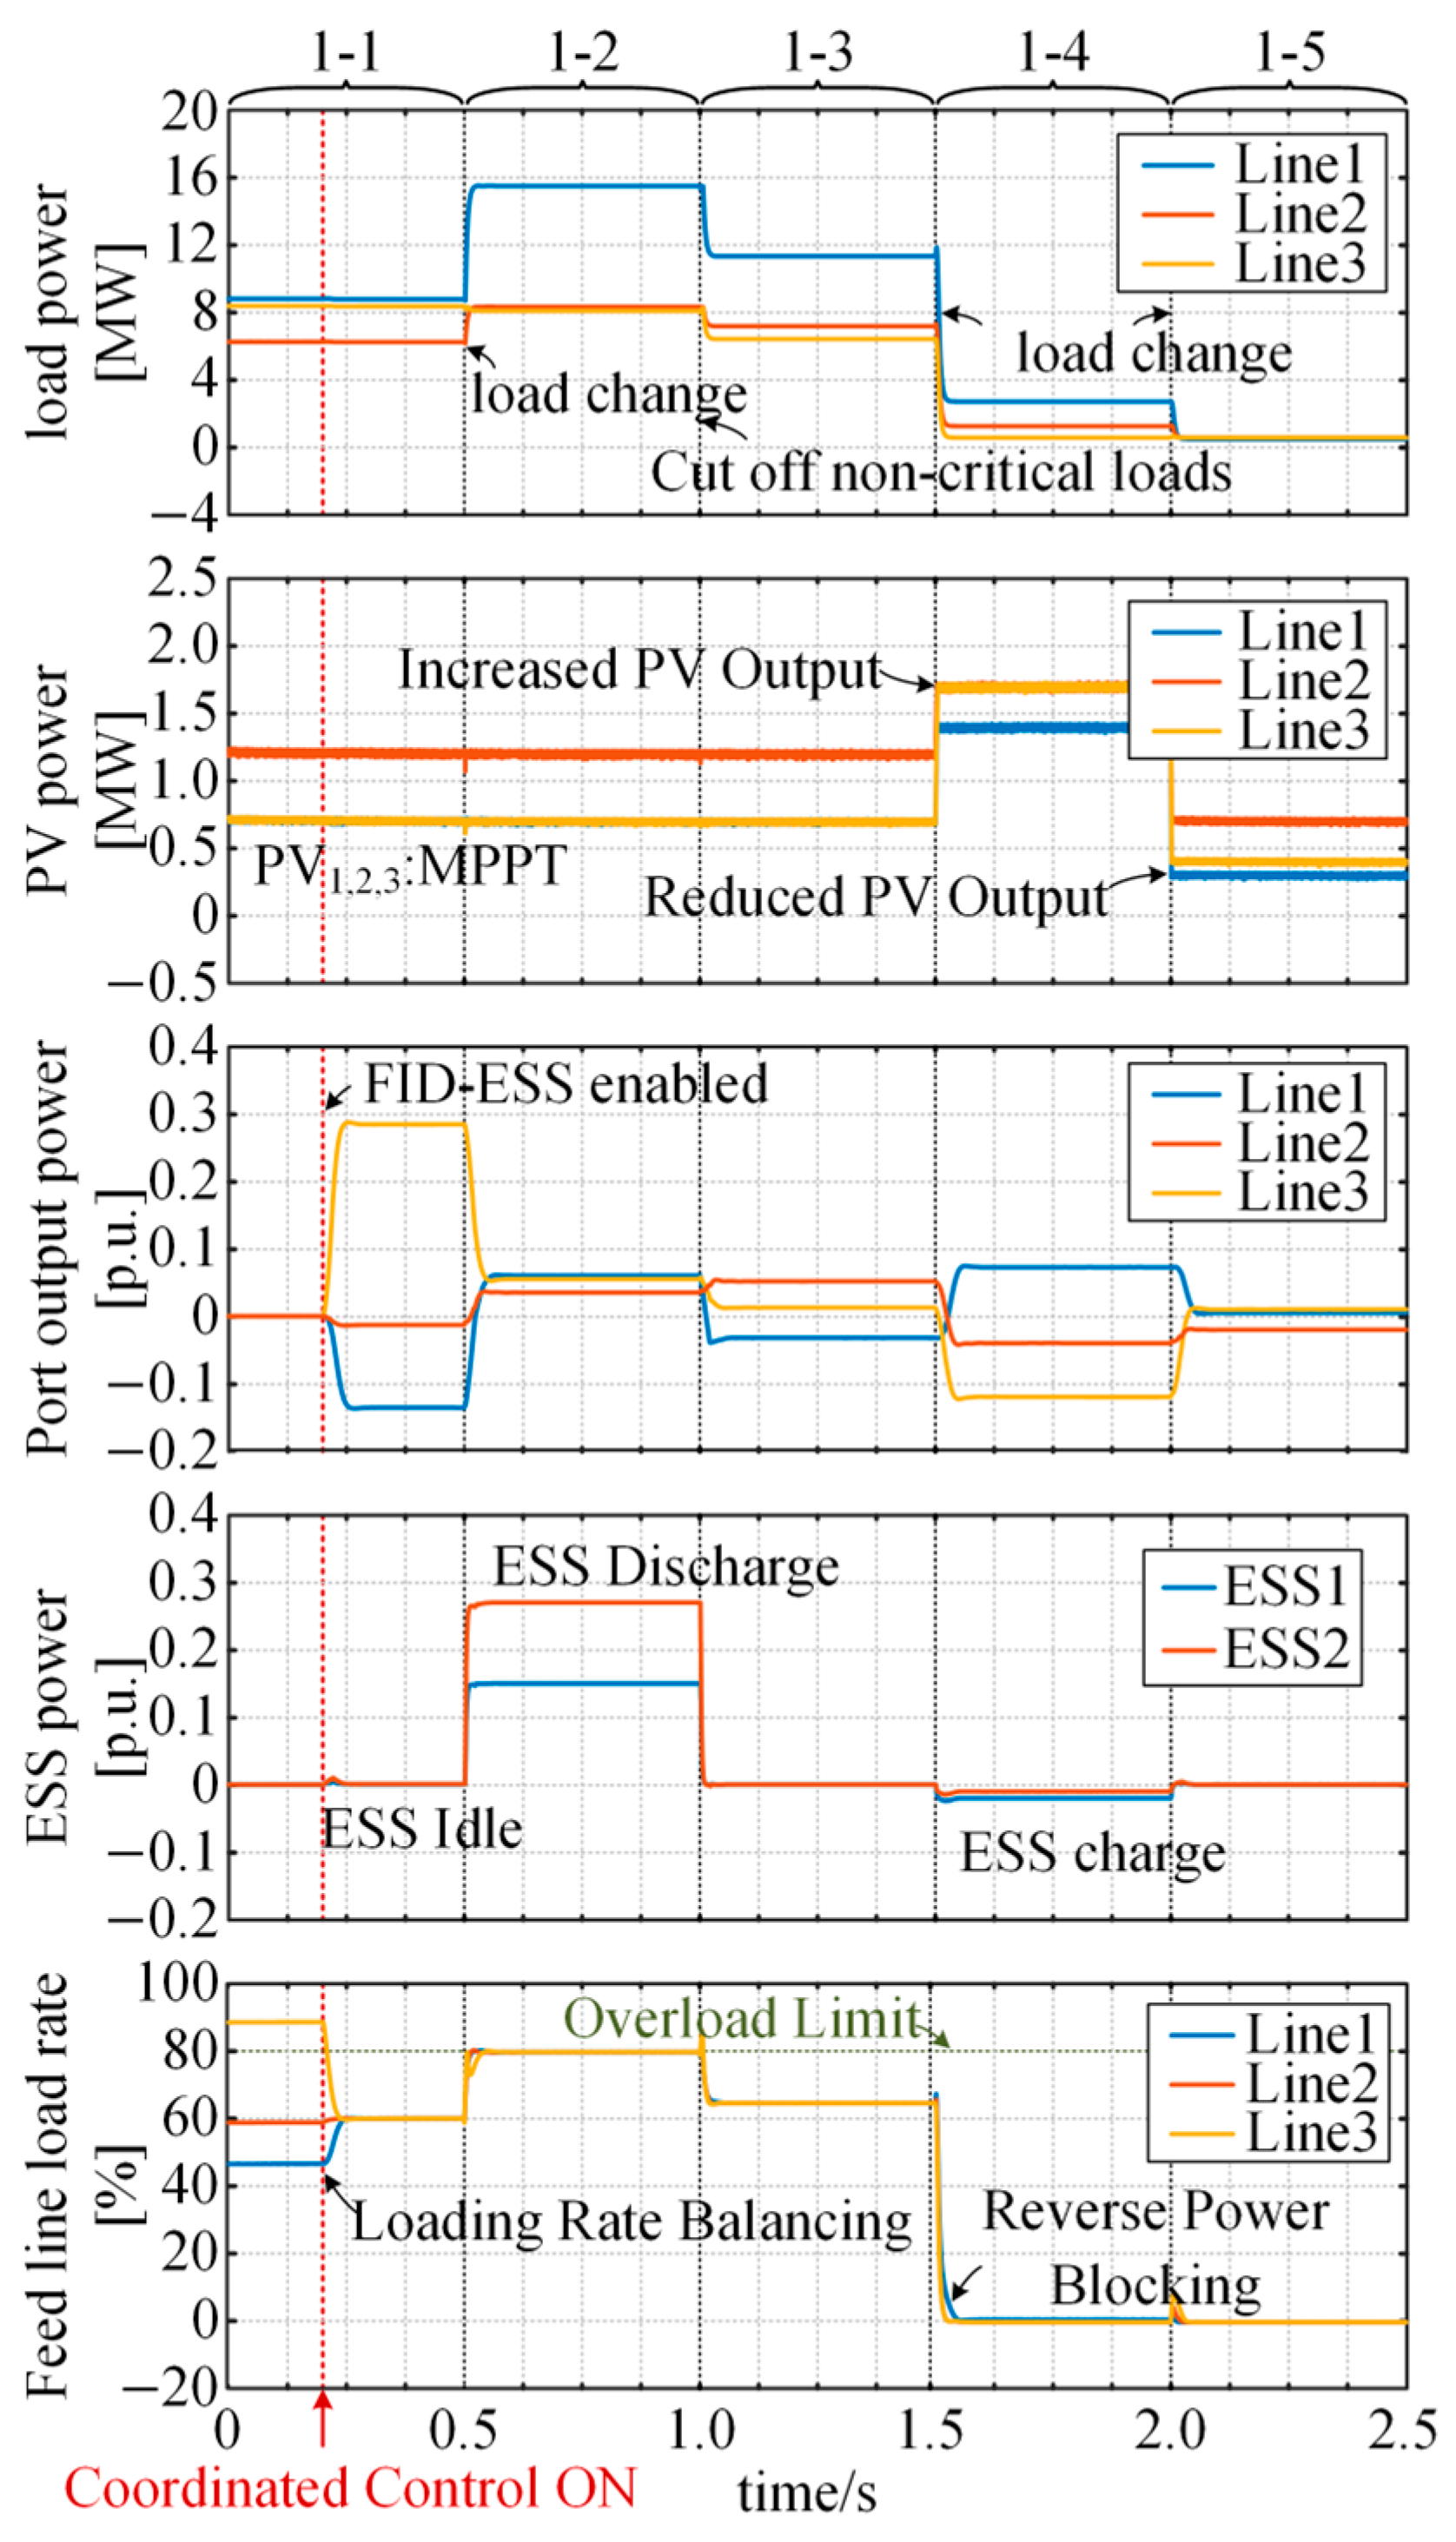
In Zone 1, the coordinated control strategy was activated at 0.2 s, as shown in
Figure 15. The initial feeder-loading imbalance was eliminated within 39.9 ms. During the subsequent heavy-load stage, the transient and steady-state maximum feeder-loading rates were limited to 80.65% and 80.09%, respectively, and the loading-excess integral was
. When the ESS reached its lower SOC boundary at 1.0 s, non-critical load reduction was activated, with a maximum command of 8.139 MW. After the system entered the power-surplus state, the ESS changed to charging operation; when the upper SOC boundary was reached at 2.0 s, the maximum PV-curtailment command was 3.388 MW. The maximum DC-bus voltage deviation was 0.975%, and the longest recovery time to the
band was 29.7 ms.
Figure 15.
Simulation results under Zone 1.
Figure 15.
Simulation results under Zone 1.
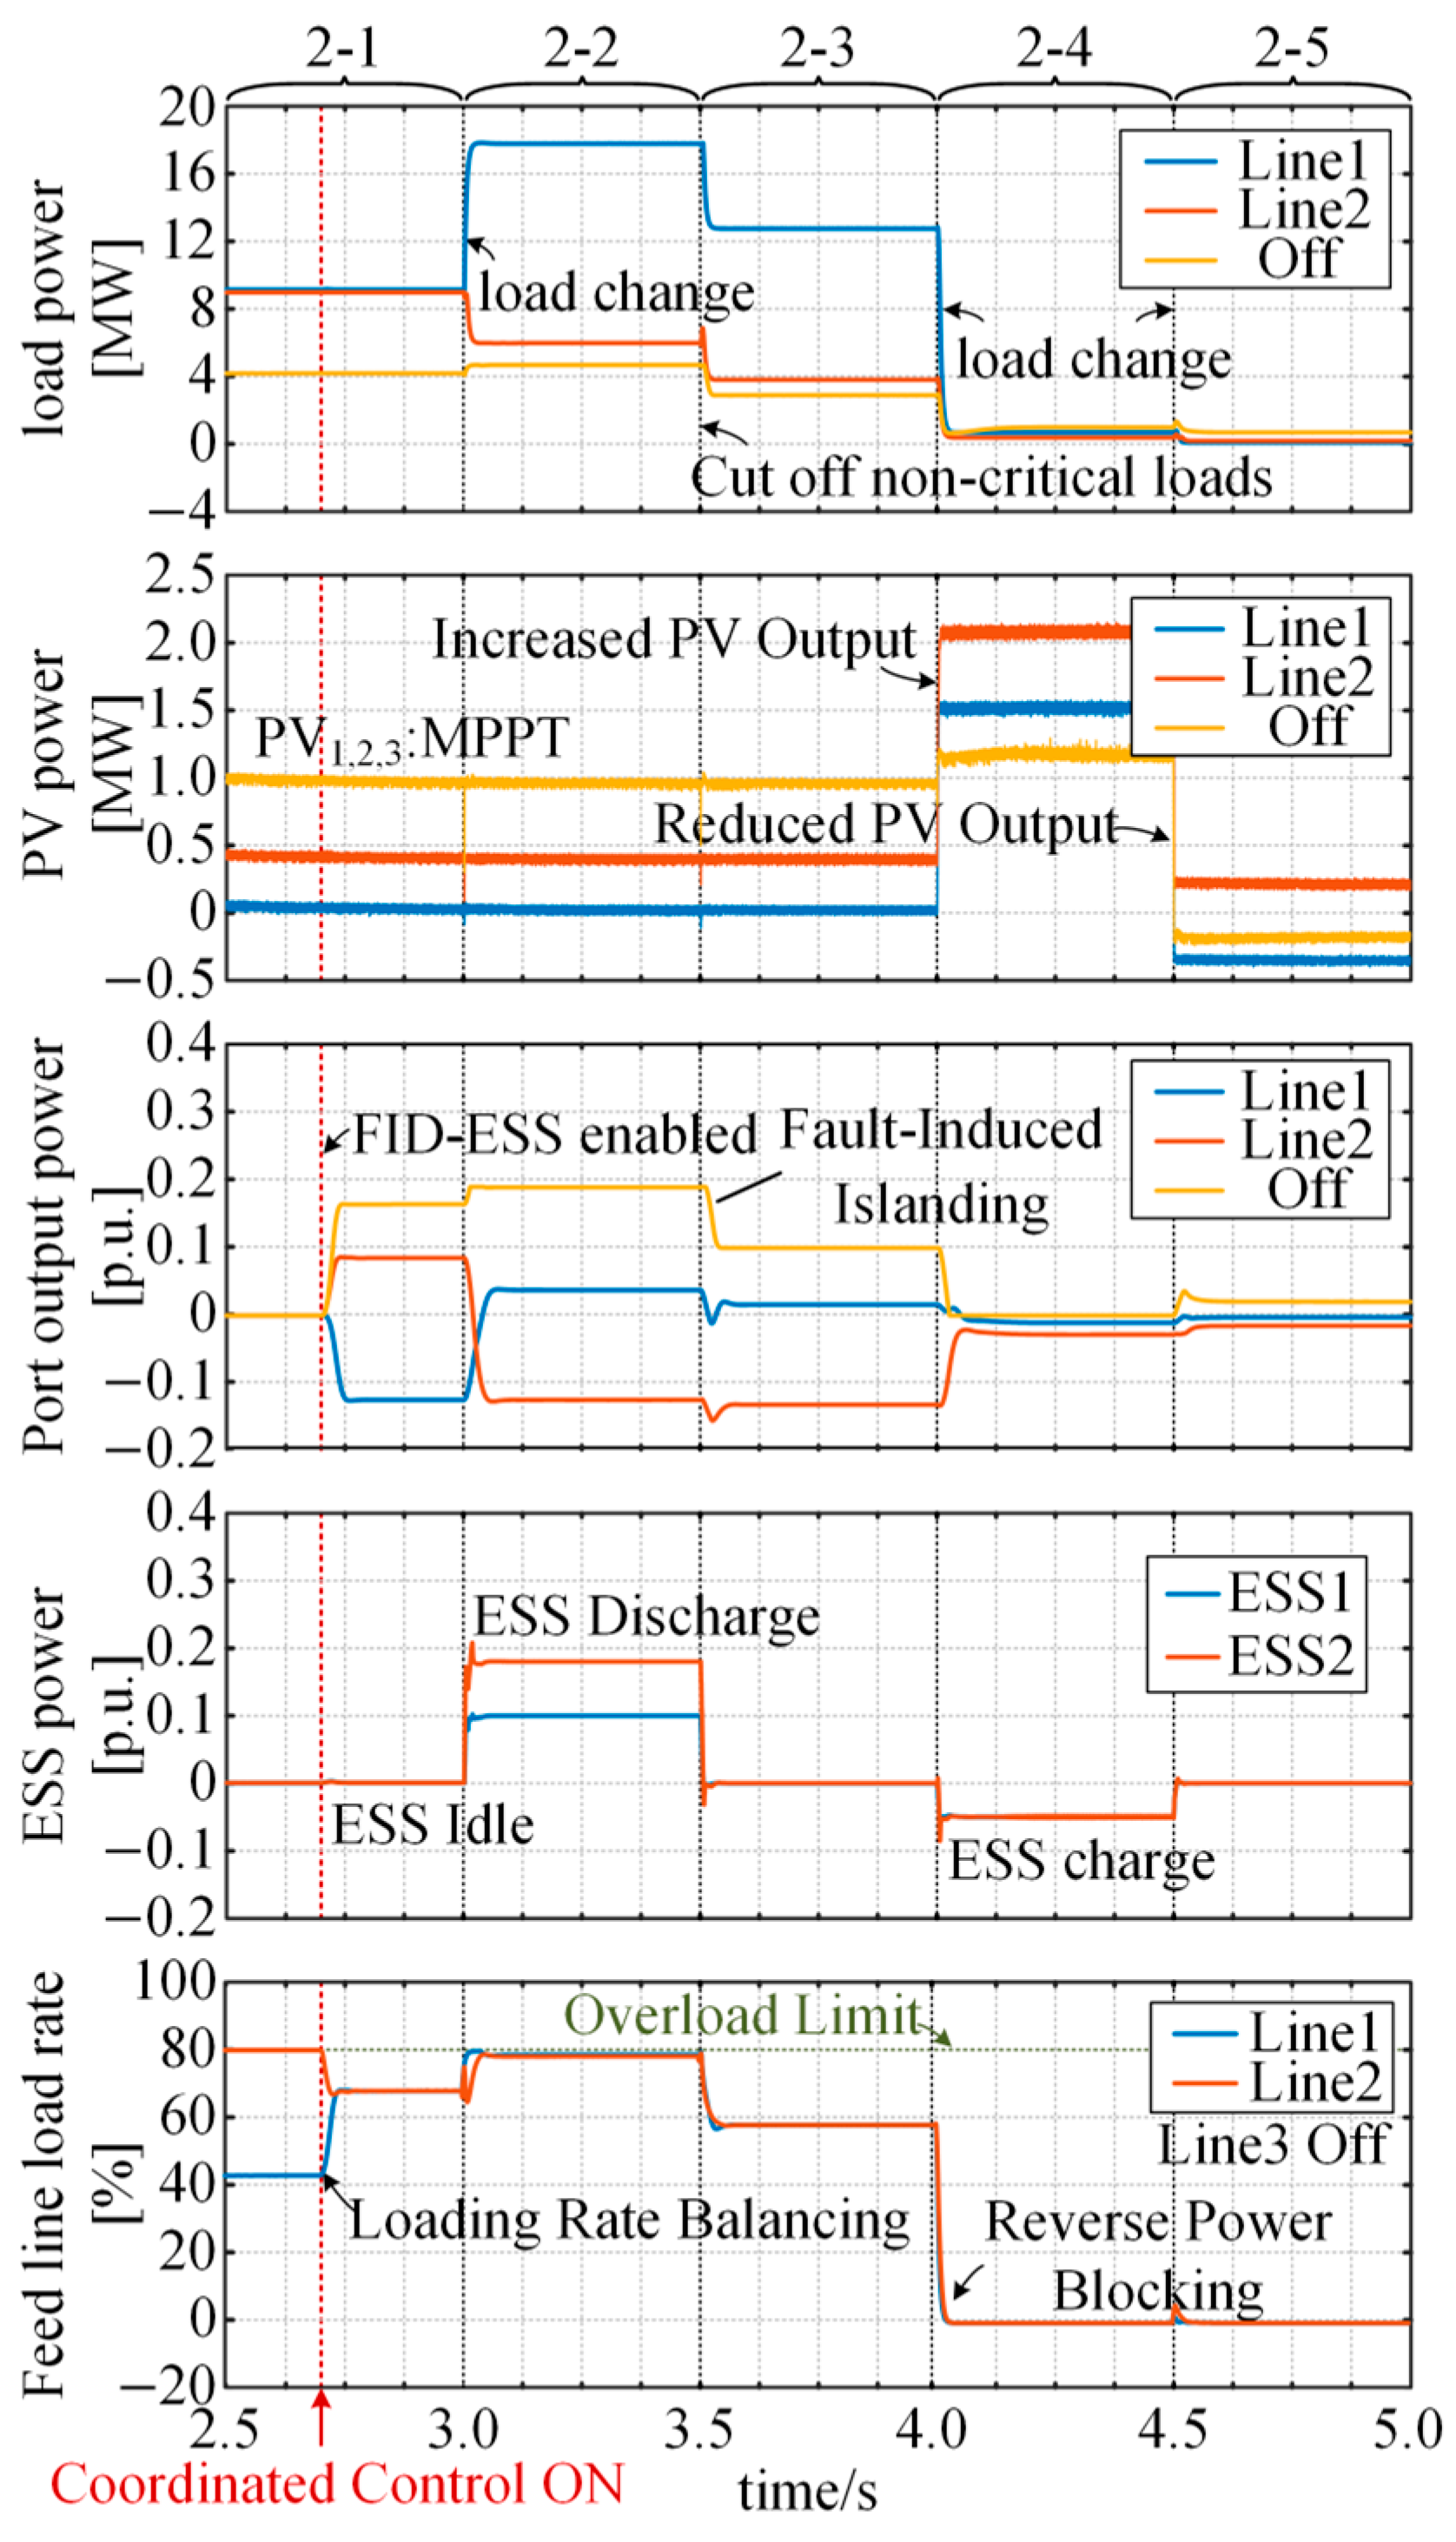
In Zone 2, feeder 3 was disconnected at 2.7 s, as shown in
Figure 16. Power support for the isolated feeder was established within 37.0 ms. Of the 3.293 MW off-grid net demand, 99.96% was restored, with a steady-state tracking error of 0.040%. Following the load increase at 3.0 s, the feeder-loading rate reached a transient maximum of 80.50% and subsequently settled at 79.48%. The maximum DC-bus voltage deviation and longest recovery time were 1.867% and 35.5 ms, respectively. The maximum non-critical load-reduction and PV-curtailment commands during the compressed test window were 8.997 and 2.707 MW.
Figure 16.
Simulation results under Zone 2.
Figure 16.
Simulation results under Zone 2.
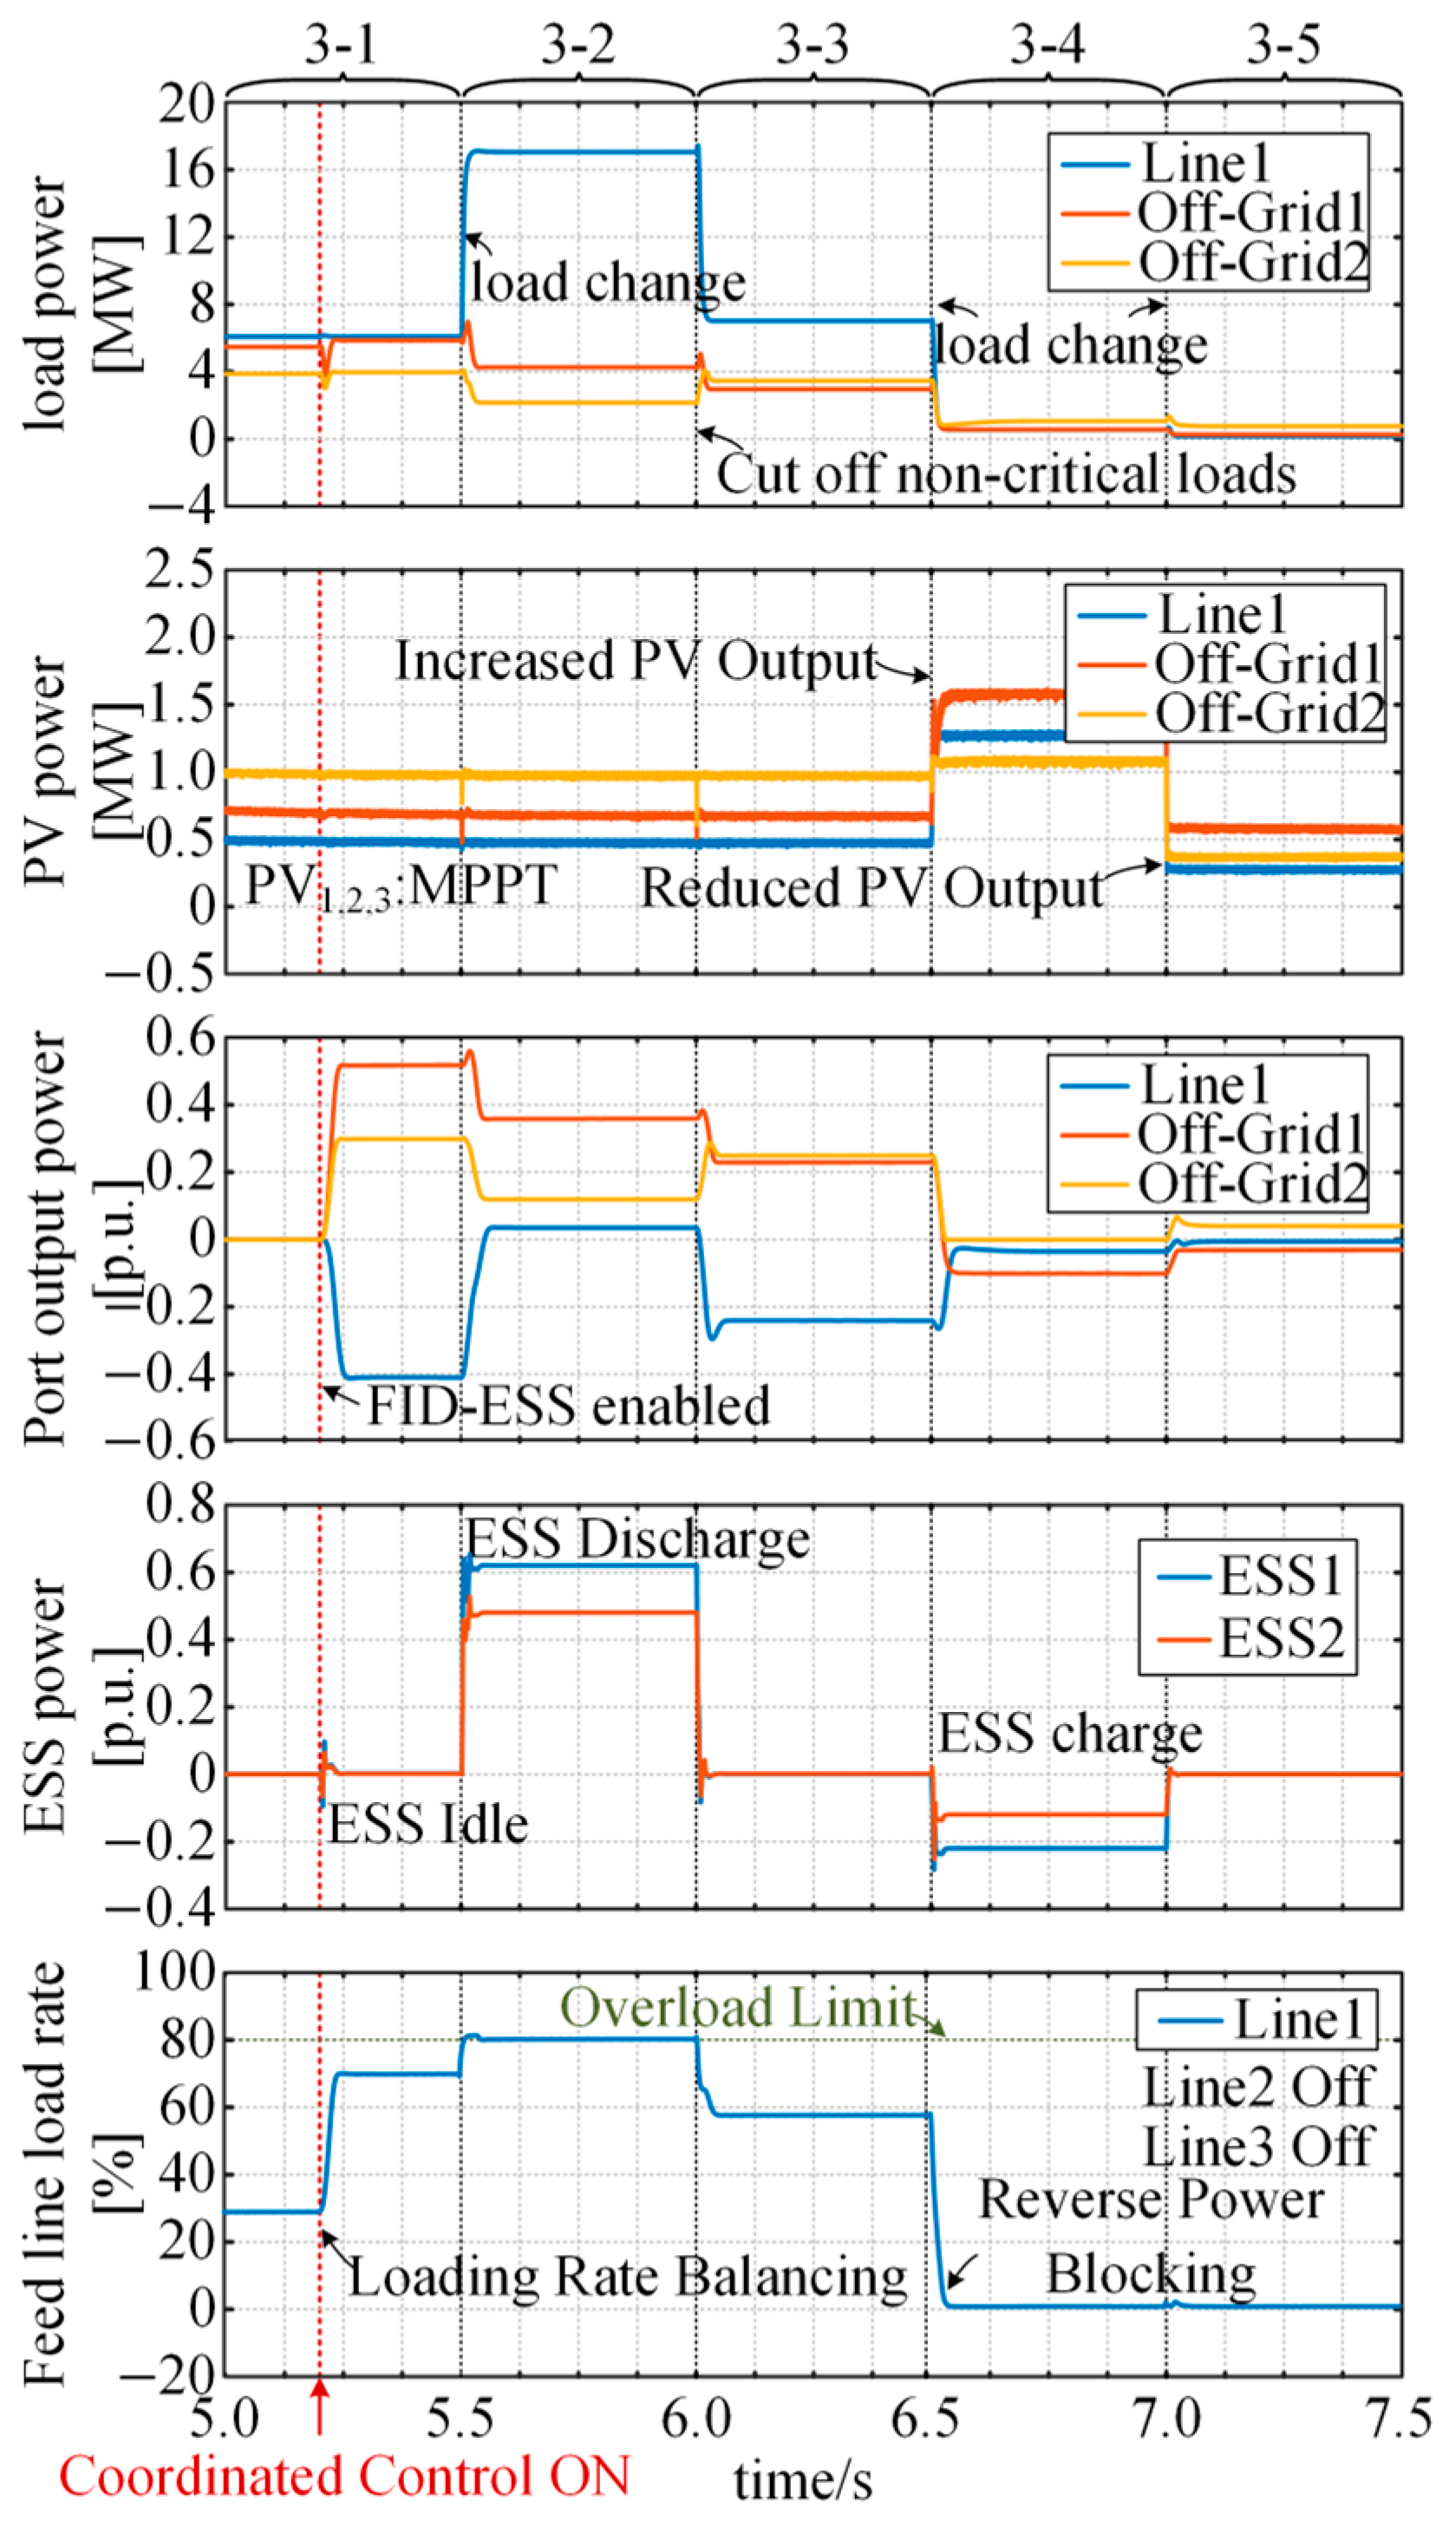
In Zone 3, feeders 2 and 3 were disconnected simultaneously at 5.2 s, as shown in
Figure 17. Coordinated support for the two isolated feeders was established within 40.0 ms. The total off-grid net demand was 8.173 MW, of which 99.96% was restored, with a tracking error of 0.042%. After the load disturbance at 5.5 s, the master-feeder-loading rate reached a transient maximum of 80.48% and settled at 79.39%. Although this case produced the largest DC-bus voltage deviation, its maximum value remained 3.323%, and the voltage recovered to the prescribed band within 37.4 ms. The maximum non-critical load-reduction and PV-curtailment commands were 10.025 and 2.703 MW, respectively.
Figure 17.
Simulation results under Zone 3.
Figure 17.
Simulation results under Zone 3.
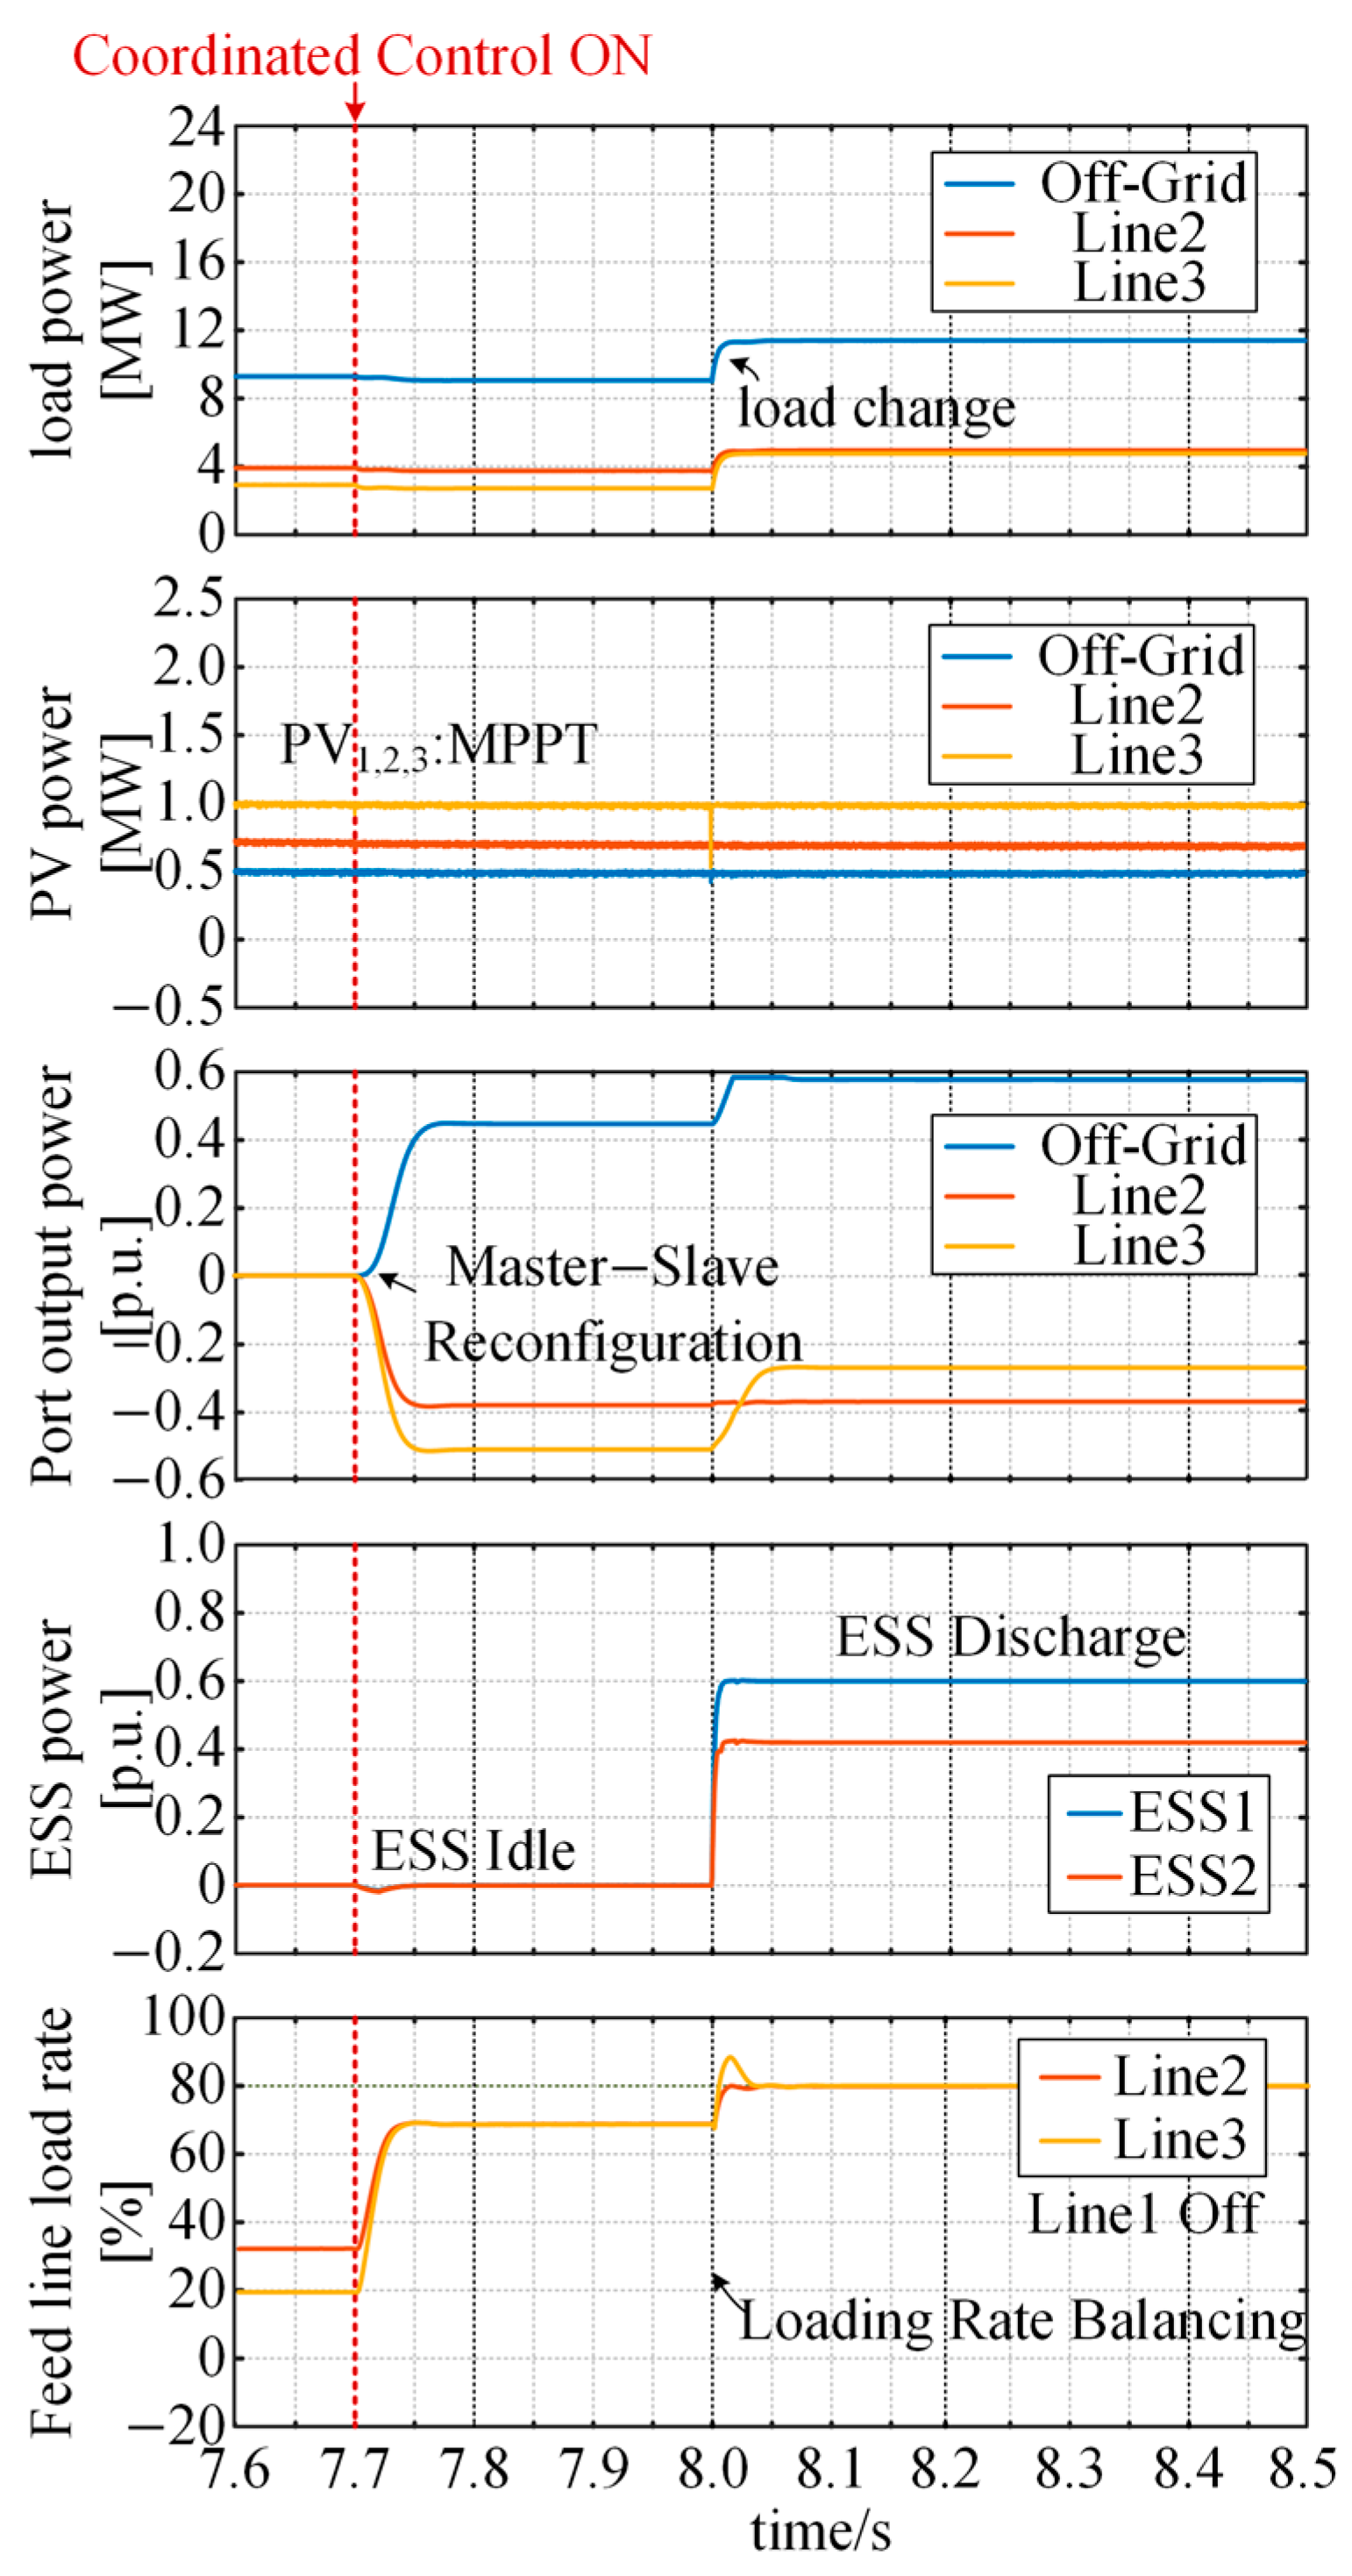
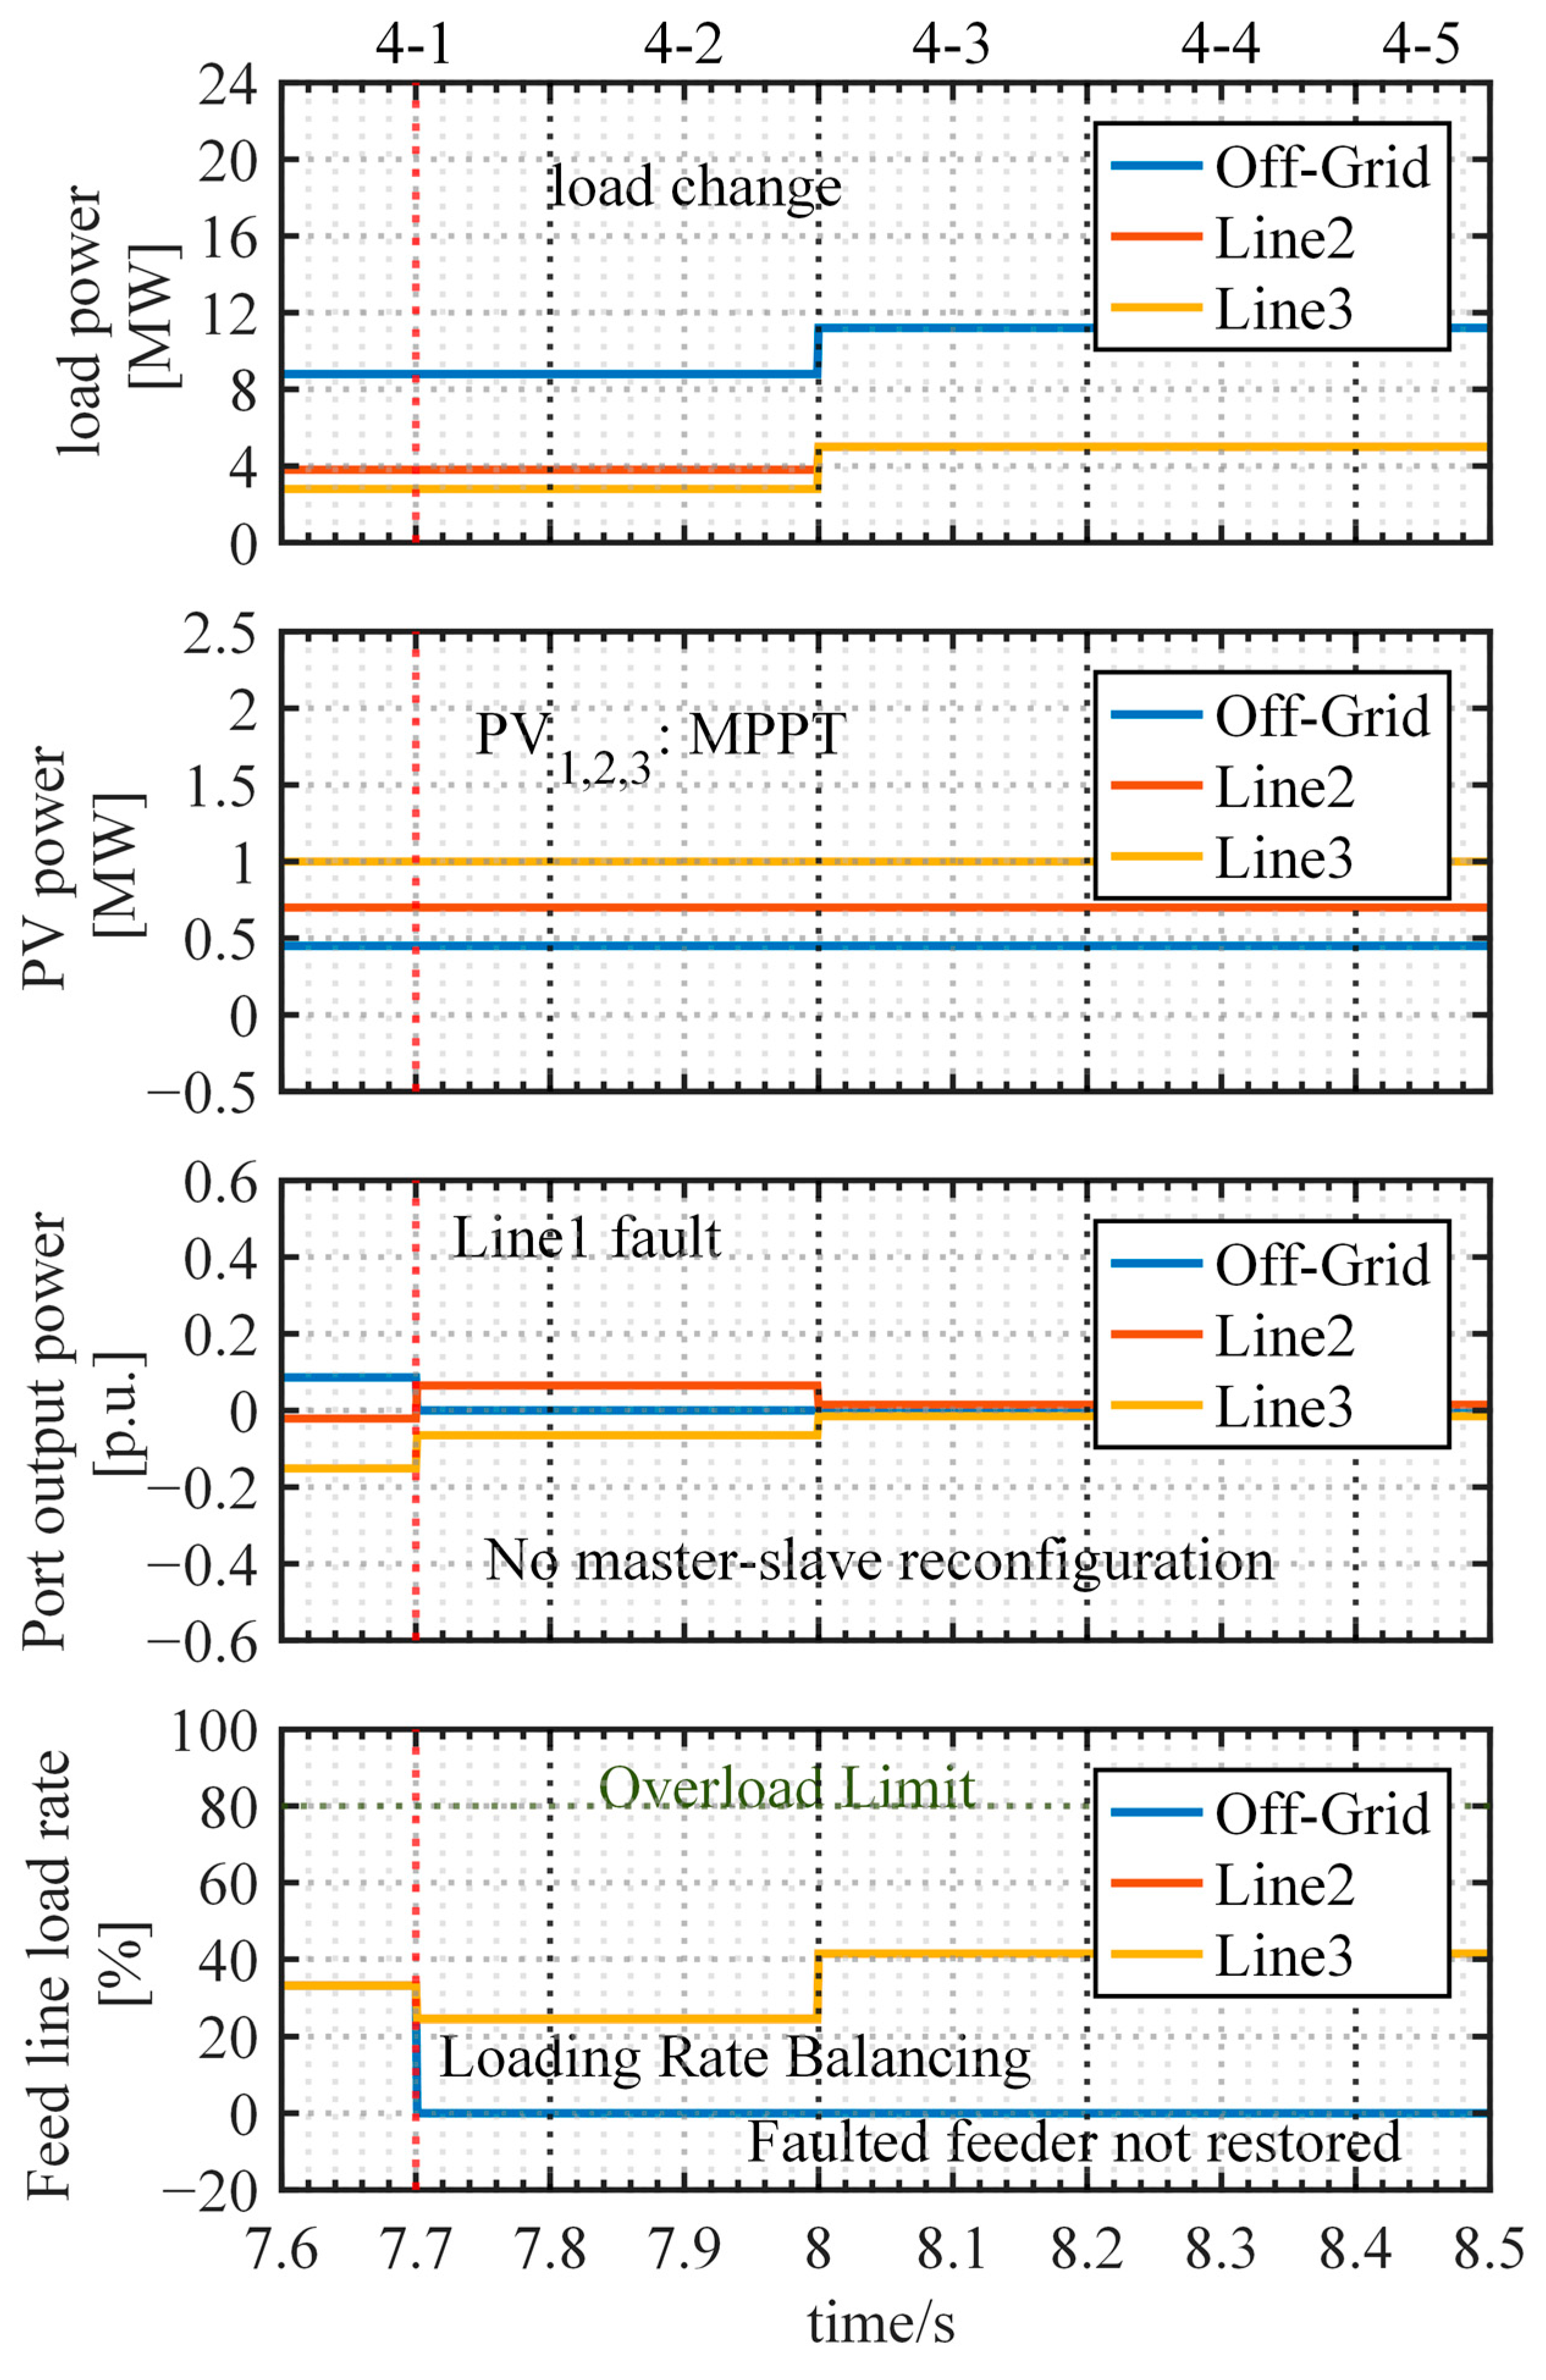
In Zone 4, feeder 1 was disconnected at 7.7 s, triggering the master–slave reconfiguration shown in
Figure 18. Slave station 2 was selected as the new master station and assumed DC-voltage control. The reconfiguration and off-grid power-support process was completed within 62.0 ms. The entire 8.604 MW off-grid net demand was restored. The restoration ratio, capped at 100%, was therefore 100%, whereas the mean tracking error was 3.479% because of transient power over-injection during control-mode transfer. The DC-bus voltage deviation directly attributable to the reconfiguration was 0.567%; the maximum deviation over the complete case was 2.158% after the subsequent load step, with the longest recovery time of 43.1 ms. The healthy-feeder loading rate briefly reached 88.55% during reconfiguration and subsequently decreased to approximately 80.18%.
Figure 18.
Simulation results under Zone 4.
Figure 18.
Simulation results under Zone 4.
5.3. Comparison with the Conventional SOP Control
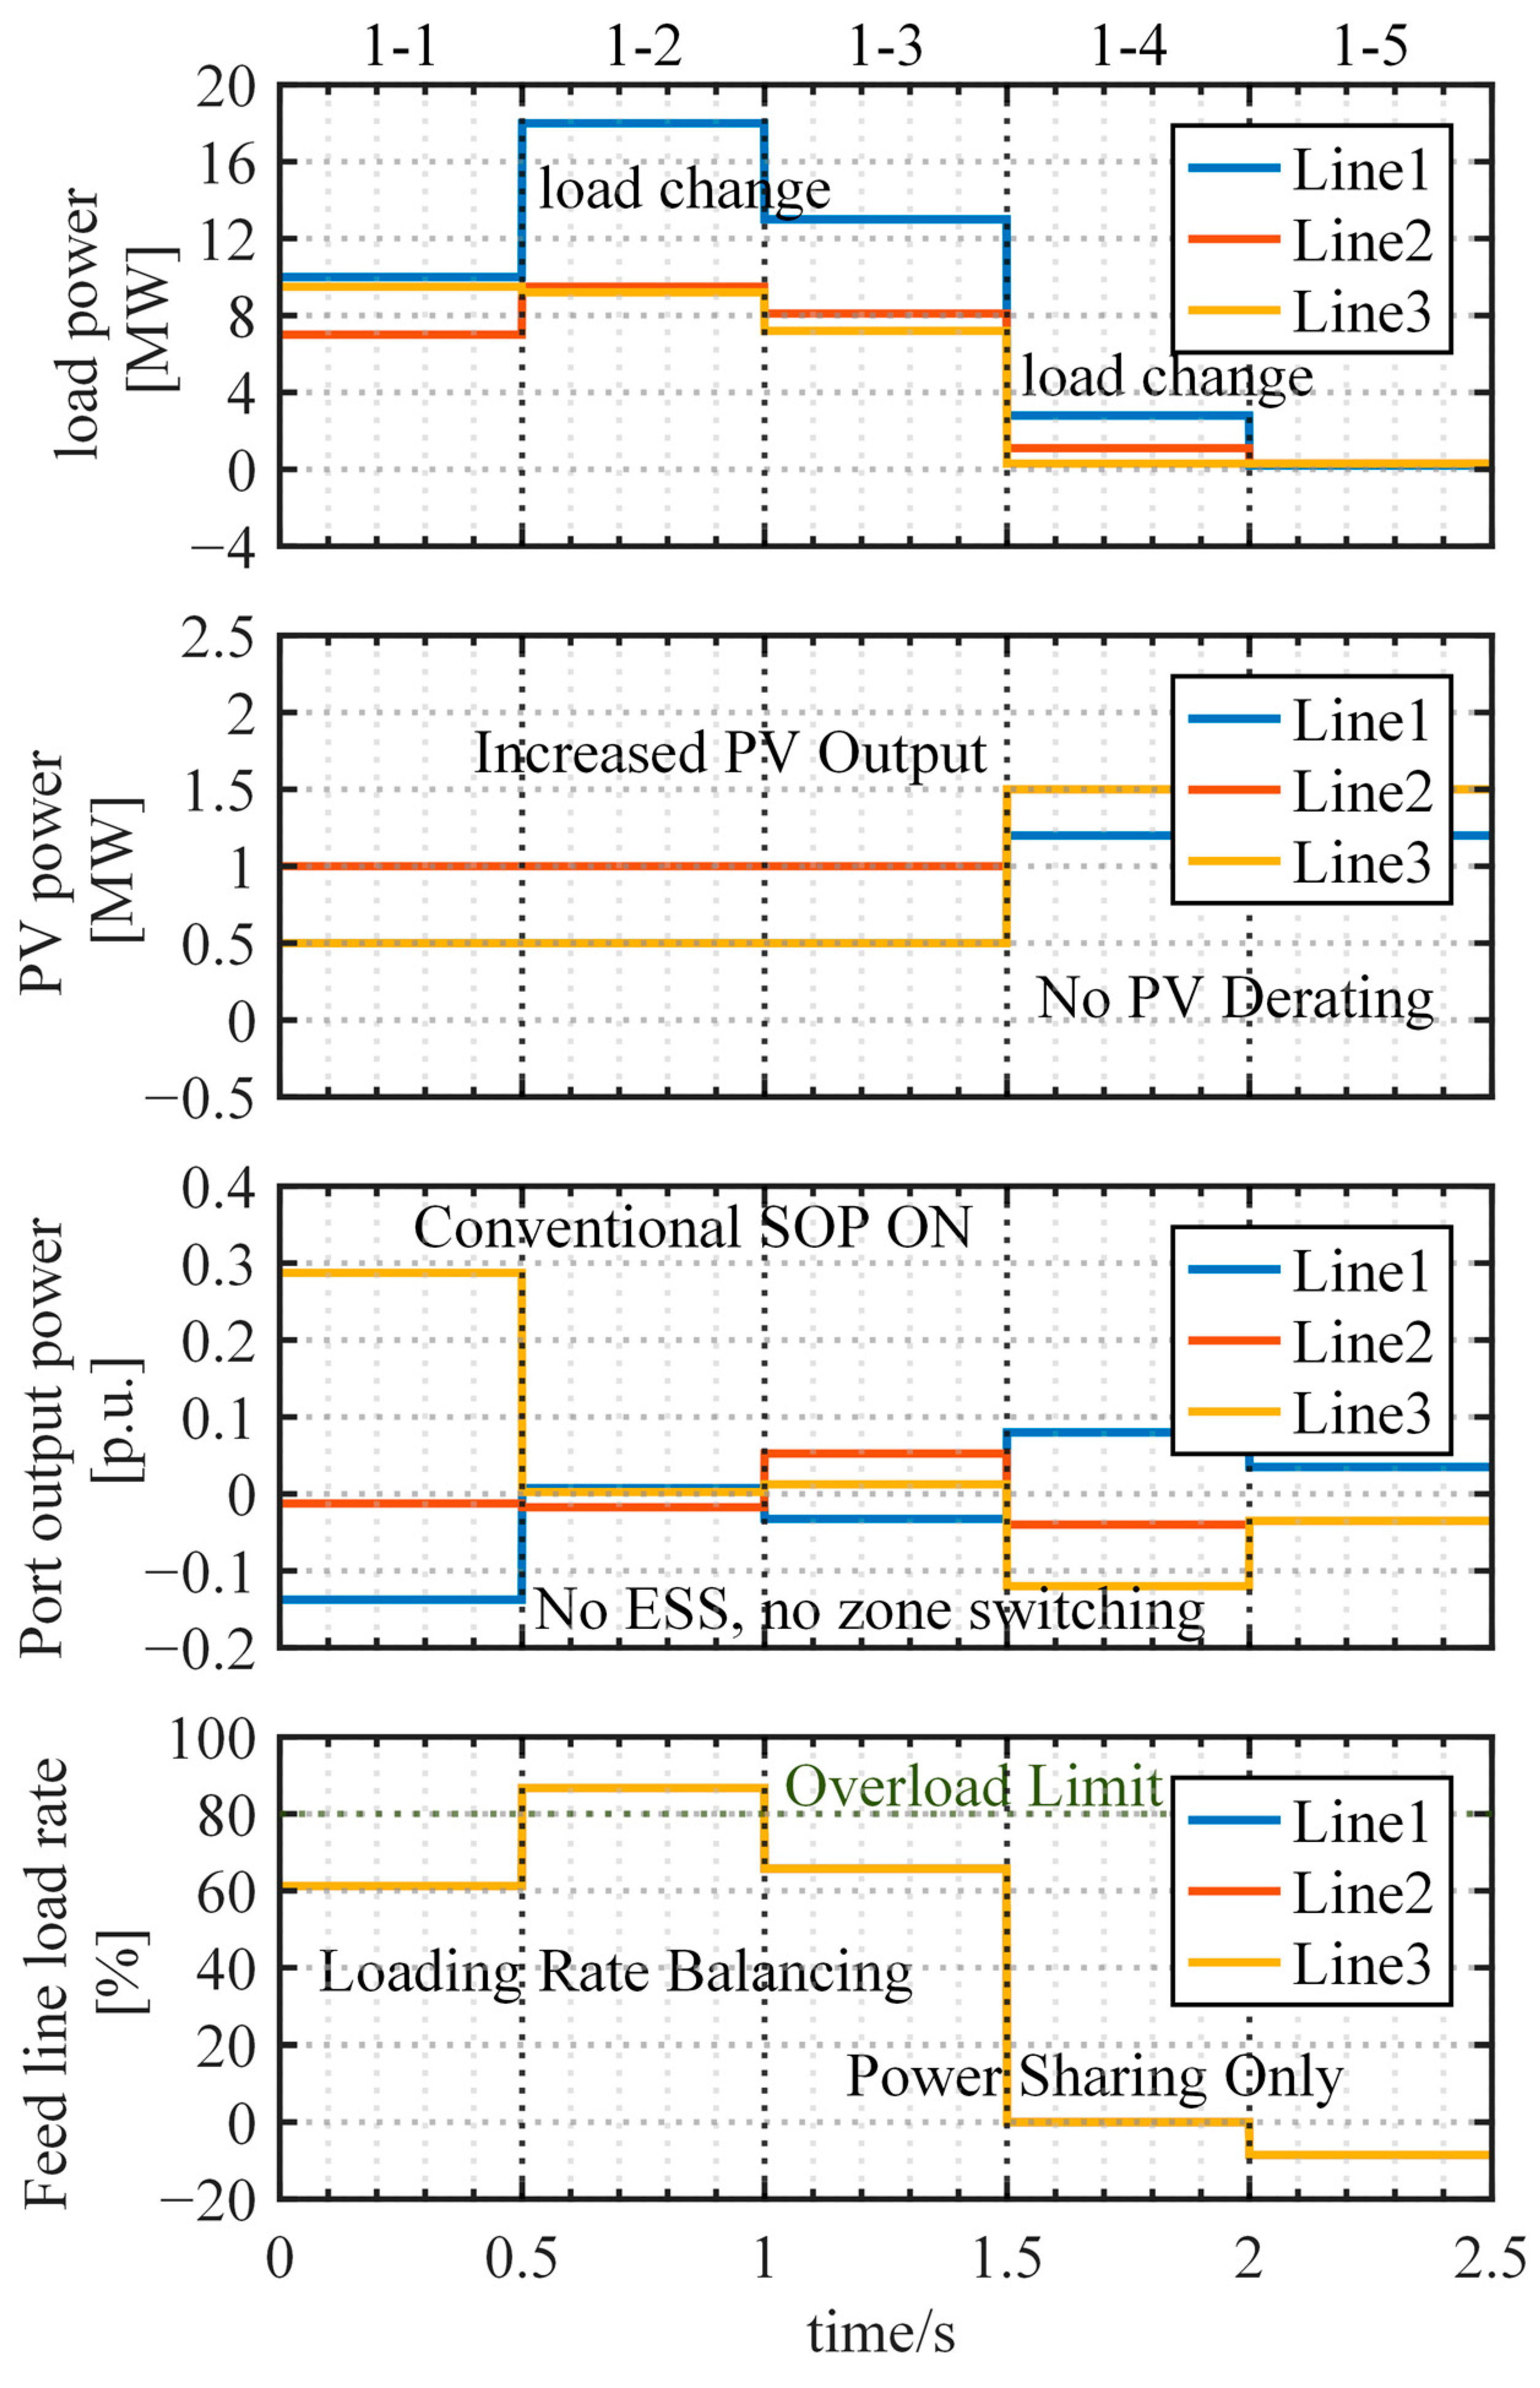
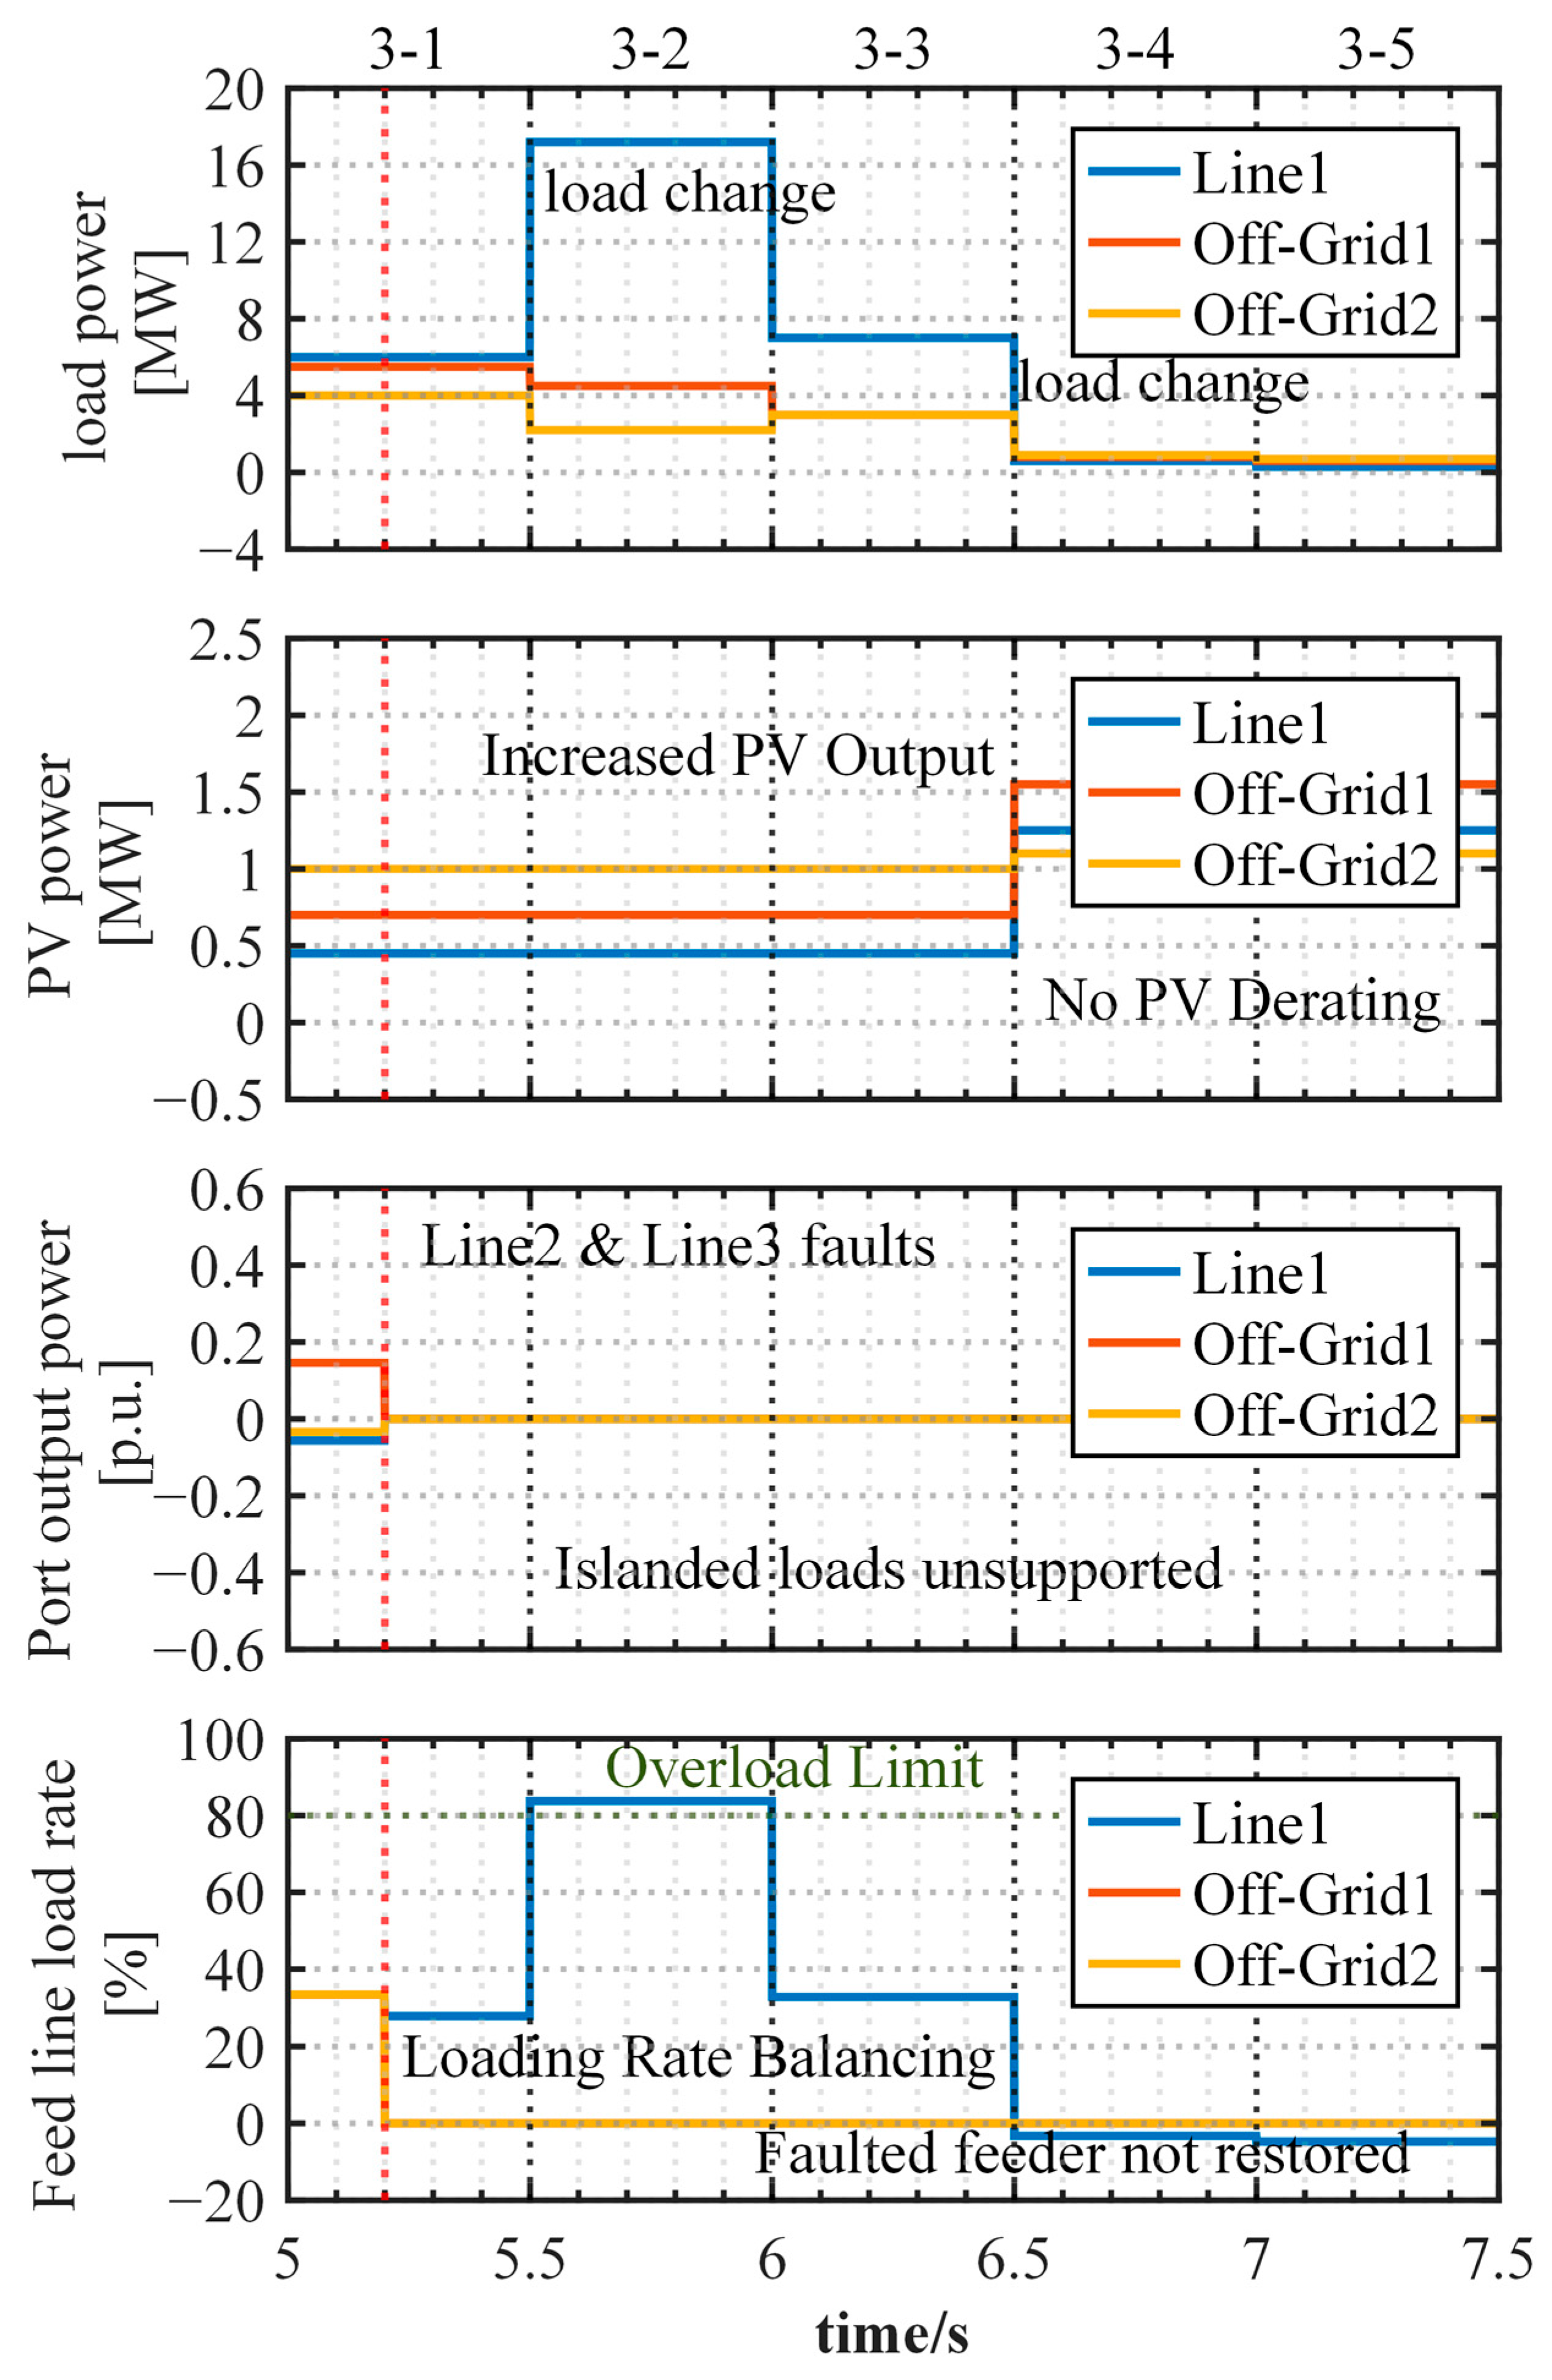
To quantify the additional benefits provided by ESS and operating-zone-dependent coordination, a conventional SOP without ESS integration or operating-zone switching was implemented as a system-level functional benchmark. The benchmark adopted the same four case definitions and event times as the proposed-strategy cases. Its sources and load profiles were reconstructed from the corresponding profiles in
Figure 15,
Figure 16,
Figure 17 and
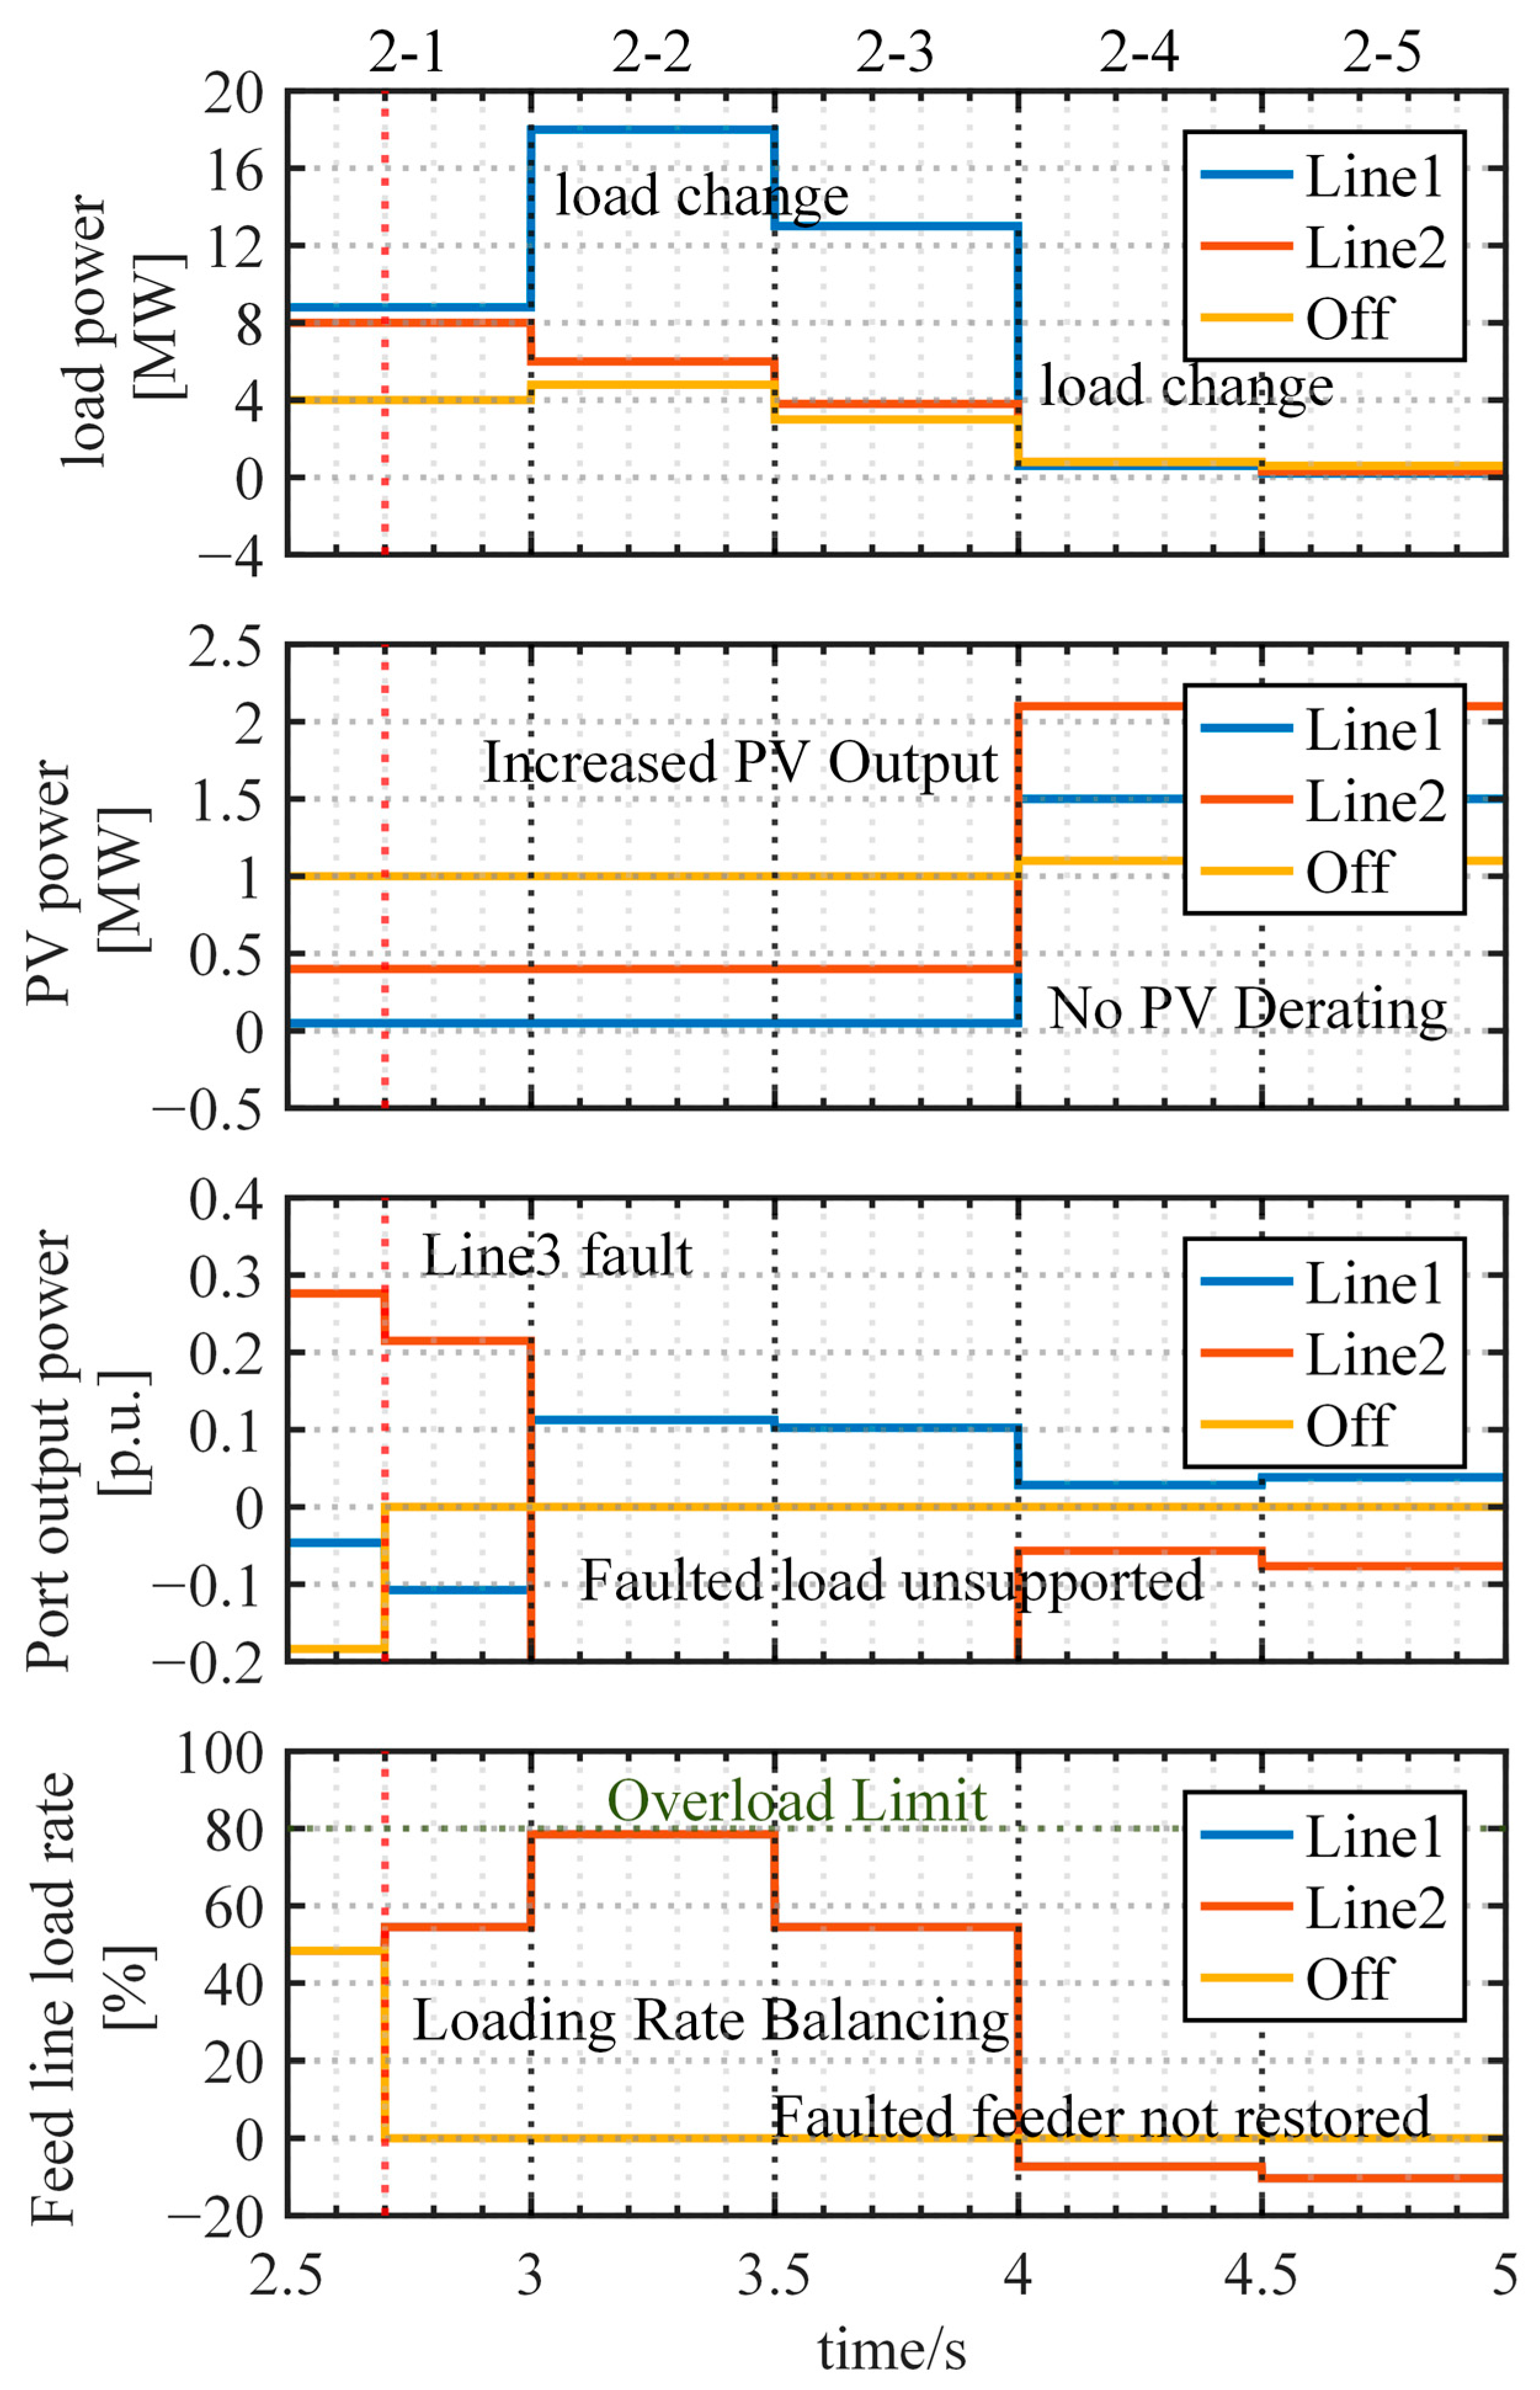
Figure 18, and the same conventional port-power redistribution rule was applied in all operating conditions. After feeder isolation, the conventional SOP could redistribute power only among the remaining grid-connected feeders; demand connected to the isolated feeders was therefore recorded as unsupported load. The corresponding conventional control waveforms are provided in
Figure A1,
Figure A2,
Figure A3 and
Figure A4, and the comparison is summarized in
Table 5.
In Zone 1, the maximum feeder-loading rate under conventional control reached 86.75%, whereas the proposed strategy limited the transient and steady-state values to 80.65% and 80.09%, respectively. This corresponds to a reduction of 6.10 percentage points in the peak loading rate. More importantly, the loading-excess integral decreased from to , representing a reduction of 98.23%.
Under the feeder-fault conditions, the principal difference was the ability to maintain the supply of the isolated loads. The conventional SOP left maximum unsupported demands of 3.80, 7.80, and 10.75 MW in Zones 2, 3, and 4, respectively. Their corresponding unsupported energies within the simulated intervals were 3.80, 6.99, and 7.877 MJ. In contrast, the proposed FID-ESS restored 99.96%, 99.96%, and 100% of the off-grid demands in these three cases. In Zone 3, the proposed strategy additionally reduced the transient maximum loading rate from 83.75% to 80.48% and reduced the loading-excess integral by 99.66%.
The conventional benchmark exhibited lower healthy-feeder loading rates than the proposed strategy in certain parts of Zones 2 and 4. This result should not be interpreted as superior loading performance because the conventional system did not supply the isolated loads during these intervals. The proposed strategy intentionally utilized the available capacity of the healthy feeders and ESS to restore the off-grid demand, causing the supporting-feeder loading rate to approach the 80% operating threshold. Therefore, feeder loading and load-restoration capability must be considered jointly when assessing the two methods.
5.4. Discussion
The results demonstrate two complementary functions of the proposed strategy: feeder-overload mitigation during normal interconnected operation and service restoration following feeder faults. In Zone 1, coordinated converter-port power exchange and ESS support reduced both the magnitude and duration of feeder overloading. In Zones 2–4, the remaining feeder, ESS, and PV capacity margins were coordinated to restore the isolated loads instead of merely redistributing power among grid-connected feeders. Zone 4 produced the most pronounced transient because fault isolation, transfer of the DC-voltage control responsibility, and off-grid load restoration occurred within the same reconfiguration interval. Nevertheless, the DC bus recovered without a sustained loss of voltage control, and the post-transient feeder loading returned to approximately the prescribed operating range. The detailed indices are reported in
Table 4, while the functional comparison with the conventional SOP is summarized in
Table 5.
Two limitations should be considered when interpreting the comparison and energy-management results. First, the conventional SOP benchmark is a system-level model reconstructed from the source–load profiles of the four proposed-strategy cases. It is therefore intended to provide a functional comparison of feeder loading and unsupported demand rather than a strict controller-to-controller dynamic comparison using identical converter switching models. Second, the SOC transitions were deliberately accelerated so that all charge/discharge boundary actions could be verified within a short electromagnetic-transient simulation. Consequently, the reported load-reduction, PV-curtailment, and energy values characterize the prescribed test windows and should not be interpreted as long-term operational or economic performance.
The time-domain simulations verify active-power sharing, feeder-loading regulation, off-grid load support, and DC-bus voltage recovery, but they do not constitute a broadband small-signal or formal hybrid-system stability proof. The SOC-dependent power boundaries are continuous within the derating intervals, and SOC varies much more slowly than the converter inner-loop states, thereby reducing abrupt SOC-induced reference changes. However, the present model assumes ideal measurements and communication and does not include measurement noise, communication delays, or a dedicated hysteresis band. In practical implementation, the hysteresis width and minimum mode-retention time should be selected according to the measurement accuracy, supervisory update rate, and communication delay. Moreover, the AC output admittance of a grid-connected ESS may be affected by grid impedance and frequency-coupling effects, and neglecting these effects can result in an inaccurate stability-margin assessment. A virtual-perturbation-based black-box admittance measurement method has been validated through simulation and hardware-in-the-loop experiments [
25] and provides a suitable basis for future stability assessment of the proposed system.
A complete parameter-sensitivity analysis was not conducted because the SOC thresholds and the 80% feeder-loading threshold are treated as configurable engineering criteria rather than optimized decision variables. Variations in these thresholds primarily affect the operating-zone transition time, usable ESS energy margin, and retained feeder reserve but do not change the structure of the proposed state-to-command mapping. Similarly, a device-level current-surge value is not reported because the present model does not contain the detailed circuit-breaker, contactor, cable, pre-charge, gate-drive, and stray-inductance models required for a reliable semiconductor or switchgear-surge assessment. The reconfiguration transient is therefore evaluated at the system level using response time, power-tracking error, feeder-loading peak, DC-bus voltage deviation, and recovery time.
From an implementation perspective, the supervisory strategy mainly involves operating-state classification, threshold comparison, feeder-power summation, and algebraic power-reference allocation. For a system with
n converter ports, its principal supervisory computational complexity scales approximately as
O(
n), and no iterative optimization solver is required. The voltage, current, modulation, and submodule SOC-balancing loops are executed locally at the converter stations. Supervisory coordination requires the exchange of feeder active-power or loading rates, feeder connections and fault status, ESS SOC and available charge/discharge power, port-level power references, and operating-mode commands. Communication latency, packet loss, controller execution delay, and time-synchronization errors have not been quantified in the present electromagnetic-transient model. In addition, the 2 kHz value reported in
Table 3 is the converter switching frequency rather than the digital-controller sampling frequency; the latter must be selected according to the target processor, discretization method, measurement interface, and required control bandwidth.
Battery degradation is represented only through the SOC-dependent power-derating intervals and charge/discharge cutoff constraints described in
Section 3.1. Because the simulated cases cover only several seconds, they cannot provide reliable estimates of long-term capacity fade or internal-resistance growth without additional cycling and calendar-aging models. Cybersecurity is also outside the scope of the present electromagnetic model because a meaningful assessment requires a defined communication protocol and threat model, including false-data injection, replay, and denial-of-service scenarios. Future work will therefore include extended-duration simulations with natural SOC evolution and battery-aging models, converter-level benchmark comparisons, admittance-based stability analysis, and real-time hardware-in-the-loop implementation. The real-time platform will be used to evaluate computational resource requirements, admissible sampling and communication delays, packet loss, abnormal measurements, parameter uncertainty, grid-impedance variations, and frequency-coupling effects.
6. Conclusions
This paper proposed an operating-zone-based coordinated power control strategy for an energy-storage-integrated modular multi-level AC–AC converter used in equal-frequency flexible interconnection systems. Feeder connection states, net-load balance, feeder-loading limits, and SOC-dependent ESS power boundaries were incorporated into a unified state-to-command mapping, which covered normal operation, single and multiple slave-feeder faults, and a master-feeder fault. The strategy coordinates converter-port power exchange, ESS charging and discharging, PV curtailment, and non-critical load reduction and transfers the DC-voltage control responsibility when the original master feeder is disconnected.
Electromagnetic-transient simulations showed that load balancing, fault support, or master–slave reconfiguration was completed within 37.0–62.0 ms. The maximum DC-bus voltage deviation remained below 3.323%, and 99.96–100% of the off-grid demand was restored in the three fault cases. Compared with the conventional SOP benchmark, the proposed strategy reduced the Zone 1 loading-excess integral by 98.23% and eliminated the 3.80–10.75 MW maximum unsupported demand observed under conventional control during feeder faults. These results verify the effectiveness of the proposed strategy in mitigating feeder overloading, coordinating SOC-constrained energy storage, and restoring isolated loads under the investigated operating conditions. Future work will focus on converter-level benchmark validation, extended-duration battery-aging studies, broadband stability assessment, and real-time hardware-in-the-loop implementation.