Article

Enrichment Characteristics and Technical Strategies for Development of Natural Gas: A Case Study of the Mizhi–Qingjian Block in the Ordos Basin

1
PetroChina Research Institute of Petroleum Exploration & Development, Beijing 100083, China
2
No.2 Gas Production Plant, Changqing Oilfield Branch, PetroChina, Yulin 719000, China
3
School of Energy Resources, China University of Geosciences (Beijing), Beijing 100083, China
4
College of Geoscience, China University of Petroleum (Beijing), Beijing 102249, China
5
School of Petroleum Engineering, Xi’an Shiyou University, Xi’an 710065, China
*
Author to whom correspondence should be addressed.
Processes 2026, 14(18), 2898; https://doi.org/10.3390/pr14182898
Submission received: 8 August 2026 / Revised: 28 August 2026 / Accepted: 8 September 2026 / Published: 11 September 2026
(This article belongs to the Section Petroleum and Low-Carbon Energy Process Engineering)

Abstract

The eastern Ordos Basin holds substantial natural gas resources, yet its development performance varies considerably across different areas, and the underlying causes merit close attention. Taking the Mizhi–Qingjian Block as a case study, this paper integrated petrophysical tests, well-logging interpretation, and volumetric resource estimation to characterize the development of TSM (tight sandstone methane) and deep CBM (coalbed methane) reservoirs in the BX Fm (Benxi Formation) to H8 Mb (He 8 Member) interval. The results indicate that the H8 Mb effective sandstones exhibit the best reservoir development. The No. 8 coal seam is markedly thicker than the No. 5 coal seam. Water-bearing zones are extensively distributed in the Qingjian Block. Resource potential assessment shows that the TSM resources in the BX Fm–H8 Mb interval total 1962.72 × 108 m3, of which Class I + II amount to 905.47 × 10⁸ m3. The deep CBM resources of the No. 5 and No. 8 coal seams together reach 9974.31 × 108 m3, with Class I + II accounting for 5503.83 × 108 m3. On this basis, a synergistic co-production technology has been developed to enable efficient and coordinated extraction of both TSM and deep CBM resources. Northern Mizhi is identified as the primary development target, while the Qingjian area requires cautious planning due to high water content.

1. Introduction

In recent years, the global energy structure has been continuously transitioning toward a green and low-carbon direction. As an energy source with low emissions, natural gas plays an important role in steadily adjusting the energy mix and achieving large-scale carbon reduction on a global scale [1,2]. Since China first proposed the goals of “carbon peaking and carbon neutrality” in 2020, both natural gas consumption and production have shown rapid growth. In 2025, China’s natural gas consumption reached 4319.2 × 108 m3, a year-on-year increase of 2.3%; natural gas production reached 2619 × 108 m3, a year-on-year increase of 6.0%, marking the ninth consecutive year of production growth exceeding 100 × 108 m3 [3]. In the future, the share of natural gas in China’s fossil energy consumption will continue to increase, and it will continue to serve as a “stabilizer” and “regulator” in the adjustment of the energy structure [4,5].
As important components of natural gas resources, China has abundant geological reserves of CBM (coalbed methane) and TSM (tight sandstone methane). In 2023, the proven geological reserves reached 3246 × 108 m3 and 6.96 × 10¹² m3, respectively, accounting for approximately one-third of the country’s total proven natural gas reserves [6,7]. Deep CBM and TSM have made significant contributions to China’s natural gas production growth. In 2024, China’s annual production of deep CBM and TSM reached 27 × 108 m3 and 620 × 108 m3, respectively, representing about one-quarter of the national natural gas output [5,8]. Among all regions, the Ordos Basin is currently the main contributor to deep CBM and TSM production, accounting for over 80% of the national total output of these two resources. The Ordos Basin is not only the current core area for deep CBM and TSM development in China, but will also remain the primary region for their future production.
Substantial progress has been made in understanding the reservoir characteristics and resource potential of TSM and CBM in the Ordos Basin. Previous studies have extensively investigated the sedimentary facies, diagenetic evolution, and pore structure of tight sandstone reservoirs [9,10,11], as well as the adsorption–desorption mechanisms and permeability behavior of CBM [12]. However, several critical gaps remain. First, most existing studies have treated TSM and CBM as separate research subjects, with limited systematic comparative analysis of their co-development potential within the same stratigraphic interval. Second, the influence of water-bearing zones—particularly in the eastern part of the basin—on gas reservoir development has not been adequately addressed, despite its recognized significance in reducing gas productivity and complicating production strategies. Third, while the Mizhi–Qingjian Block has been identified as a newly explored area with proven and controlled geological reserves of 1211.6 × 108 m3, detailed reservoir characterization and resource potential evaluation for this specific block remain insufficient, severely constraining cost-effective production build-up.
The eastern area of the Ordos Basin possesses substantial natural gas reserves, with proven reserves of 0.91 × 10¹² m3, making it a key area for accelerating development in the Changqing gas province. This region mainly covers five gas fields/blocks—Yulin, Zizhou, Shenmu, Mizhi, and Qingjian, exhibiting a development pattern characterized by “three stable-production fields, one field under construction, and one field under evaluation”. As a newly explored area in the eastern Ordos Basin, the Mizhi–Qingjian Block is still in the construction and evaluation phases of development. The Mizhi–Qingjian Block is characterized by multiple gas-bearing intervals and multiple gas reservoir types. Currently, the TSM reservoirs in this area exhibit thin effective thickness, strong heterogeneity, and rapid spatial variations. In particular, the Qingjian Block is severely affected by water. Furthermore, deep CBM is still in the development and evaluation stage, and the enrichment characteristics of natural gas and the resource potential remain unclear, which severely constrains the cost-effective production build-up in this block.
This paper takes the TSM and deep CBM in the BX Fm (Benxi Formation)–H8 Mb (He 8 Member) of the Mizhi–Qingjian Block in the Ordos Basin as the research objects. It focuses on the detailed characterization of reservoirs, resource potential evaluation, and delineation of favorable enrichment zones, and establishes technical strategies for the cost-effective development of multi-layer superimposed gas reservoirs, aiming to provide support for the efficient production build-up in the study area.

2. Geological Setting

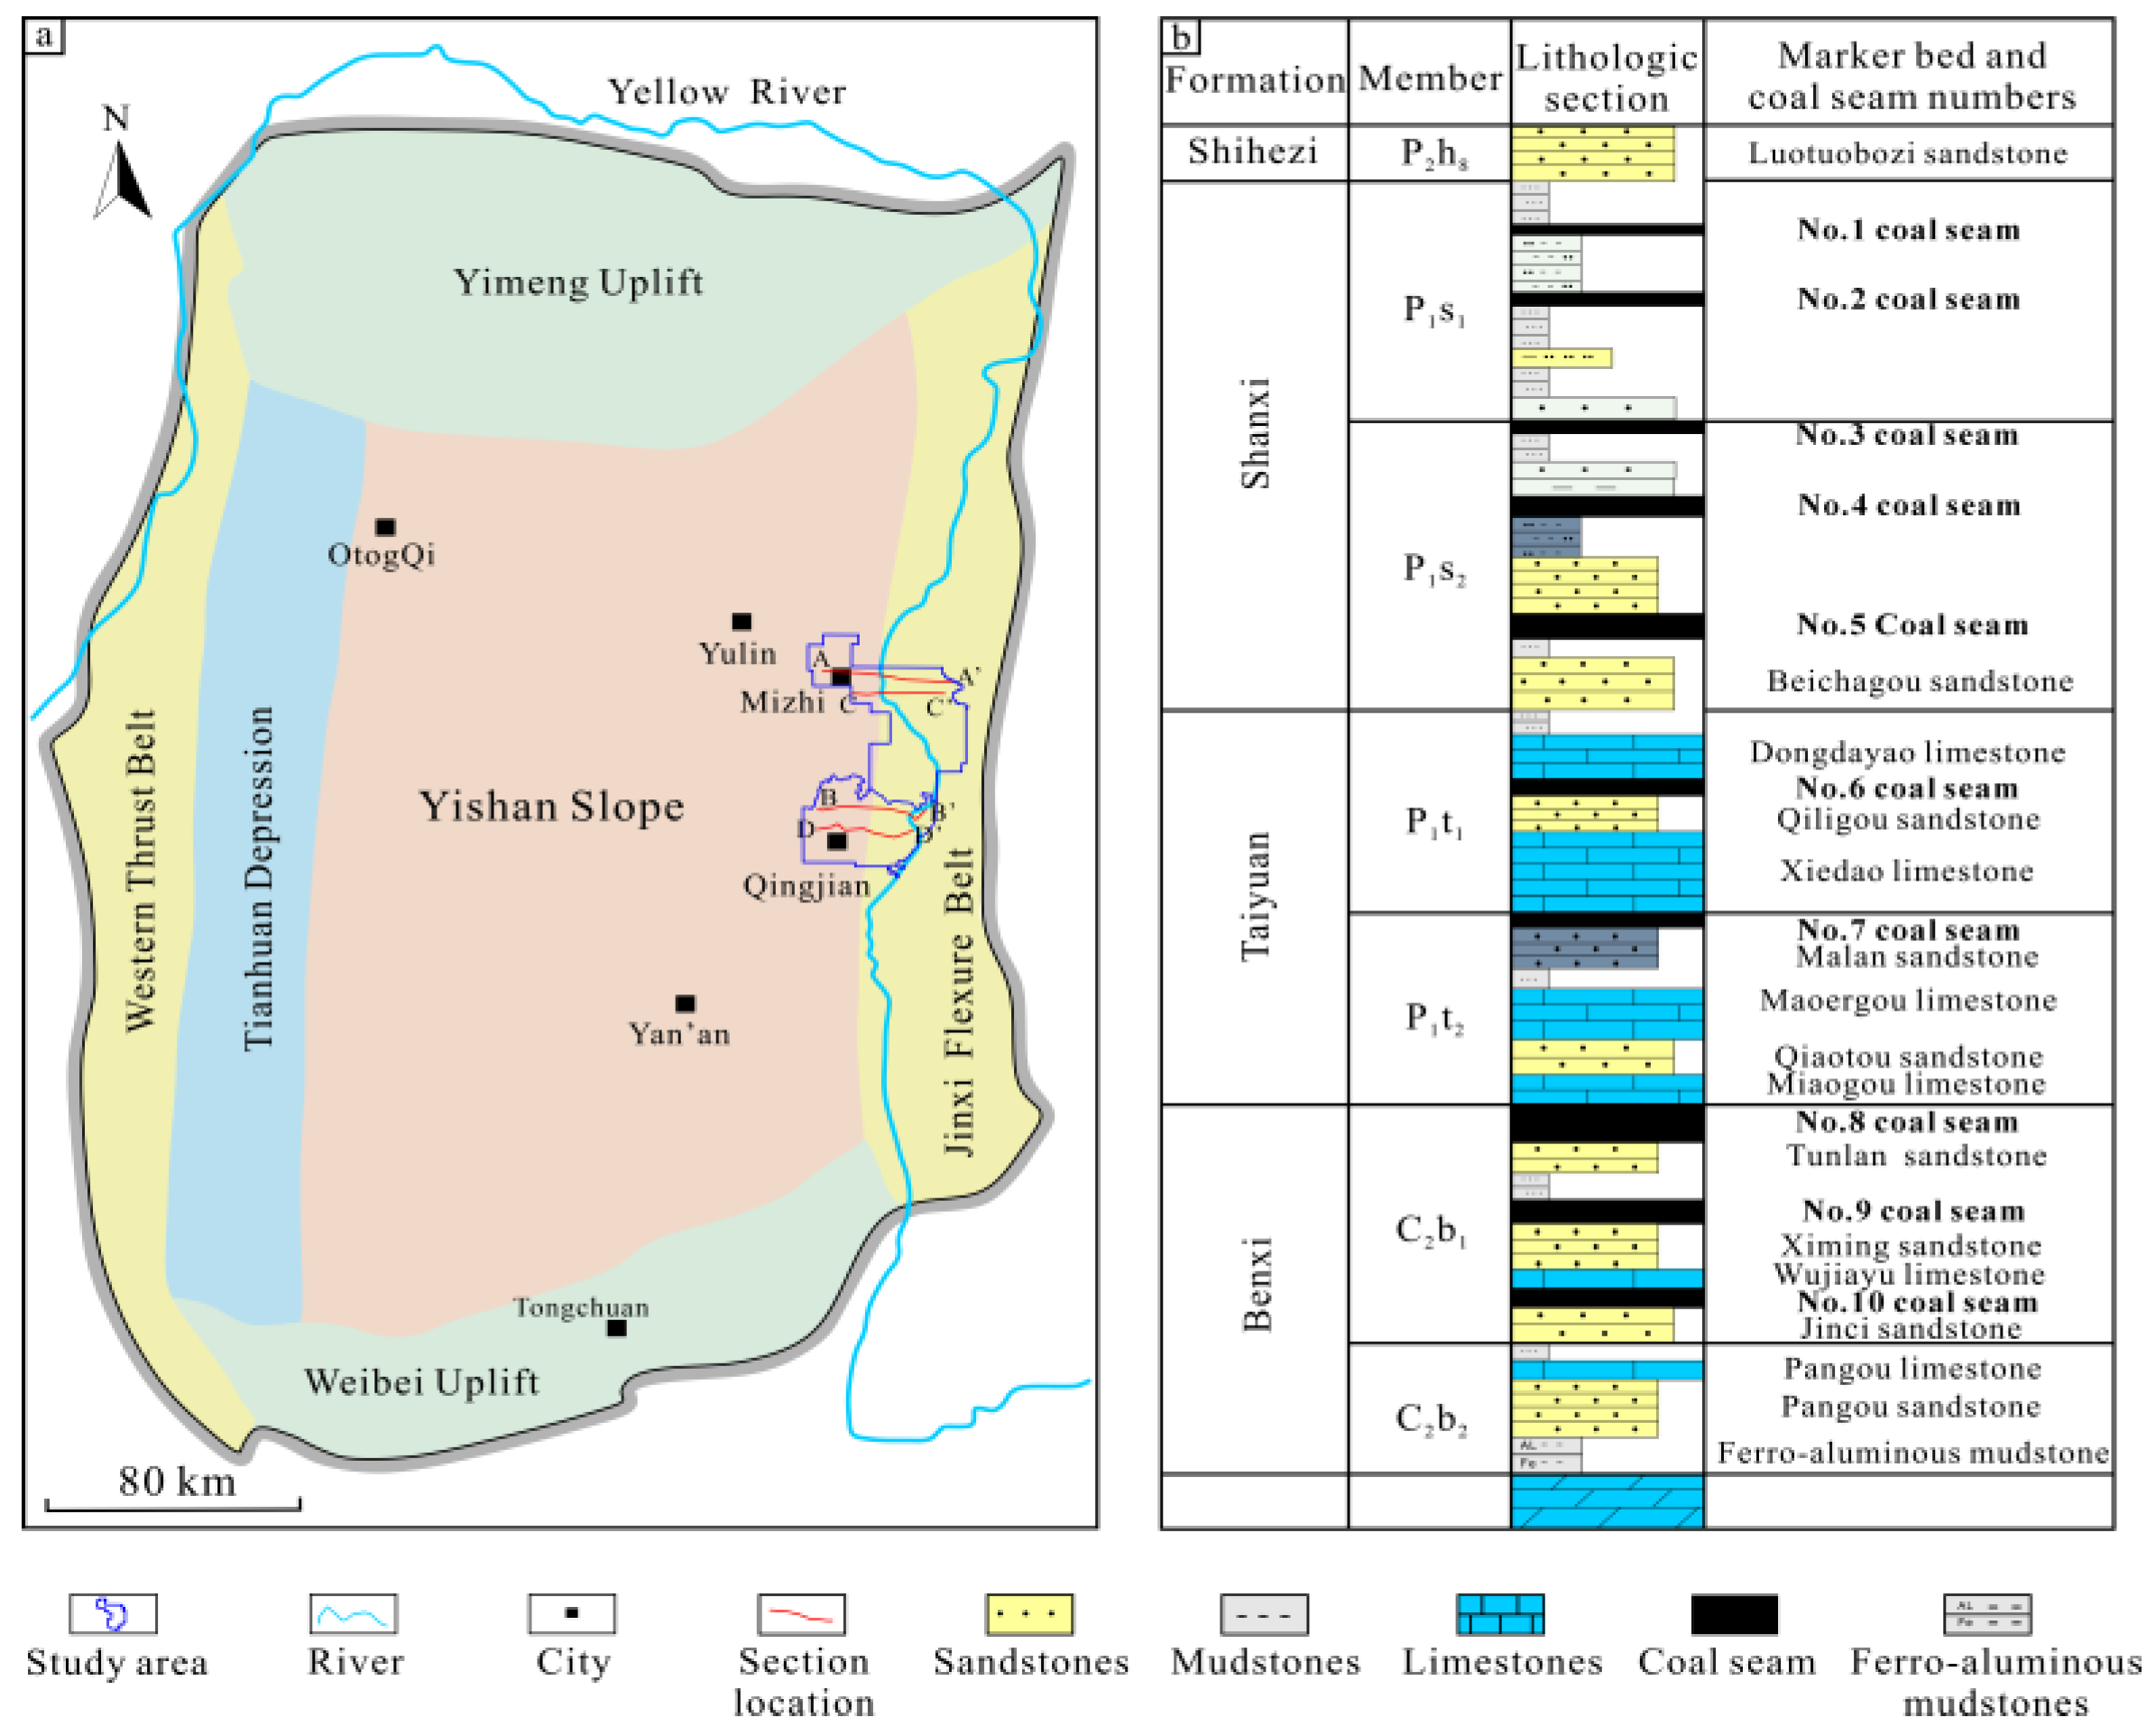
The Ordos Basin is located in central-western China, covering an area of approximately 25 × 104 km2 [13]. It is a large-scale superimposed basin developed atop the North China Craton [14]. The basin has undergone multiple tectonic cycles, including the Lvliang, Jinning, Caledonian, Hercynian, Indosinian, Yanshan, and Himalayan orogenies, resulting in a tectonic framework characterized by a stable interior, active margins, uplift in the north and south, and westward thrusting with eastward tilting [13,15]. The present-day basin structure consists of six first-order tectonic units: the Yimeng Uplift, Weibei Uplift, Western Margin Thrust Belt, Tianhuan Depression, Yishan Slope, and Jinxi Flexure Belt (Figure 1a) [16,17,18,19,20]. The Mizhi–Qingjian Block is situated in the eastern area of Ordos Basin, tectonically adjacent to the Yishan Slope to the west and the Jinxi Flexure Belt to the east, covering an area of 4048.1 km2. The eastern area of the block is characterized by fault development, and the overall structure is a west-dipping monocline with significant stratigraphic relief. The Upper Paleozoic succession in the Mizhi–Qingjian Block contains multiple gas-bearing intervals, exhibiting characteristics of multi-layer superimposed gas accumulation. From bottom to top, these intervals include the Upper Carboniferous BX Fm, the Lower Permian TY Fm (Taiyuan Formation) and SX Fm (Shanxi Formation), the Middle Permian Lower SHZ Fm (Shihezi Formation), the Upper SHZ Fm, and the Upper Permian SQF Fm (Shiqianfeng Formation) (Figure 1b). Among these, the BX Fm, SX Fm, and H8 Mb are the primary gas-bearing intervals, which are also the main target layers of this study.
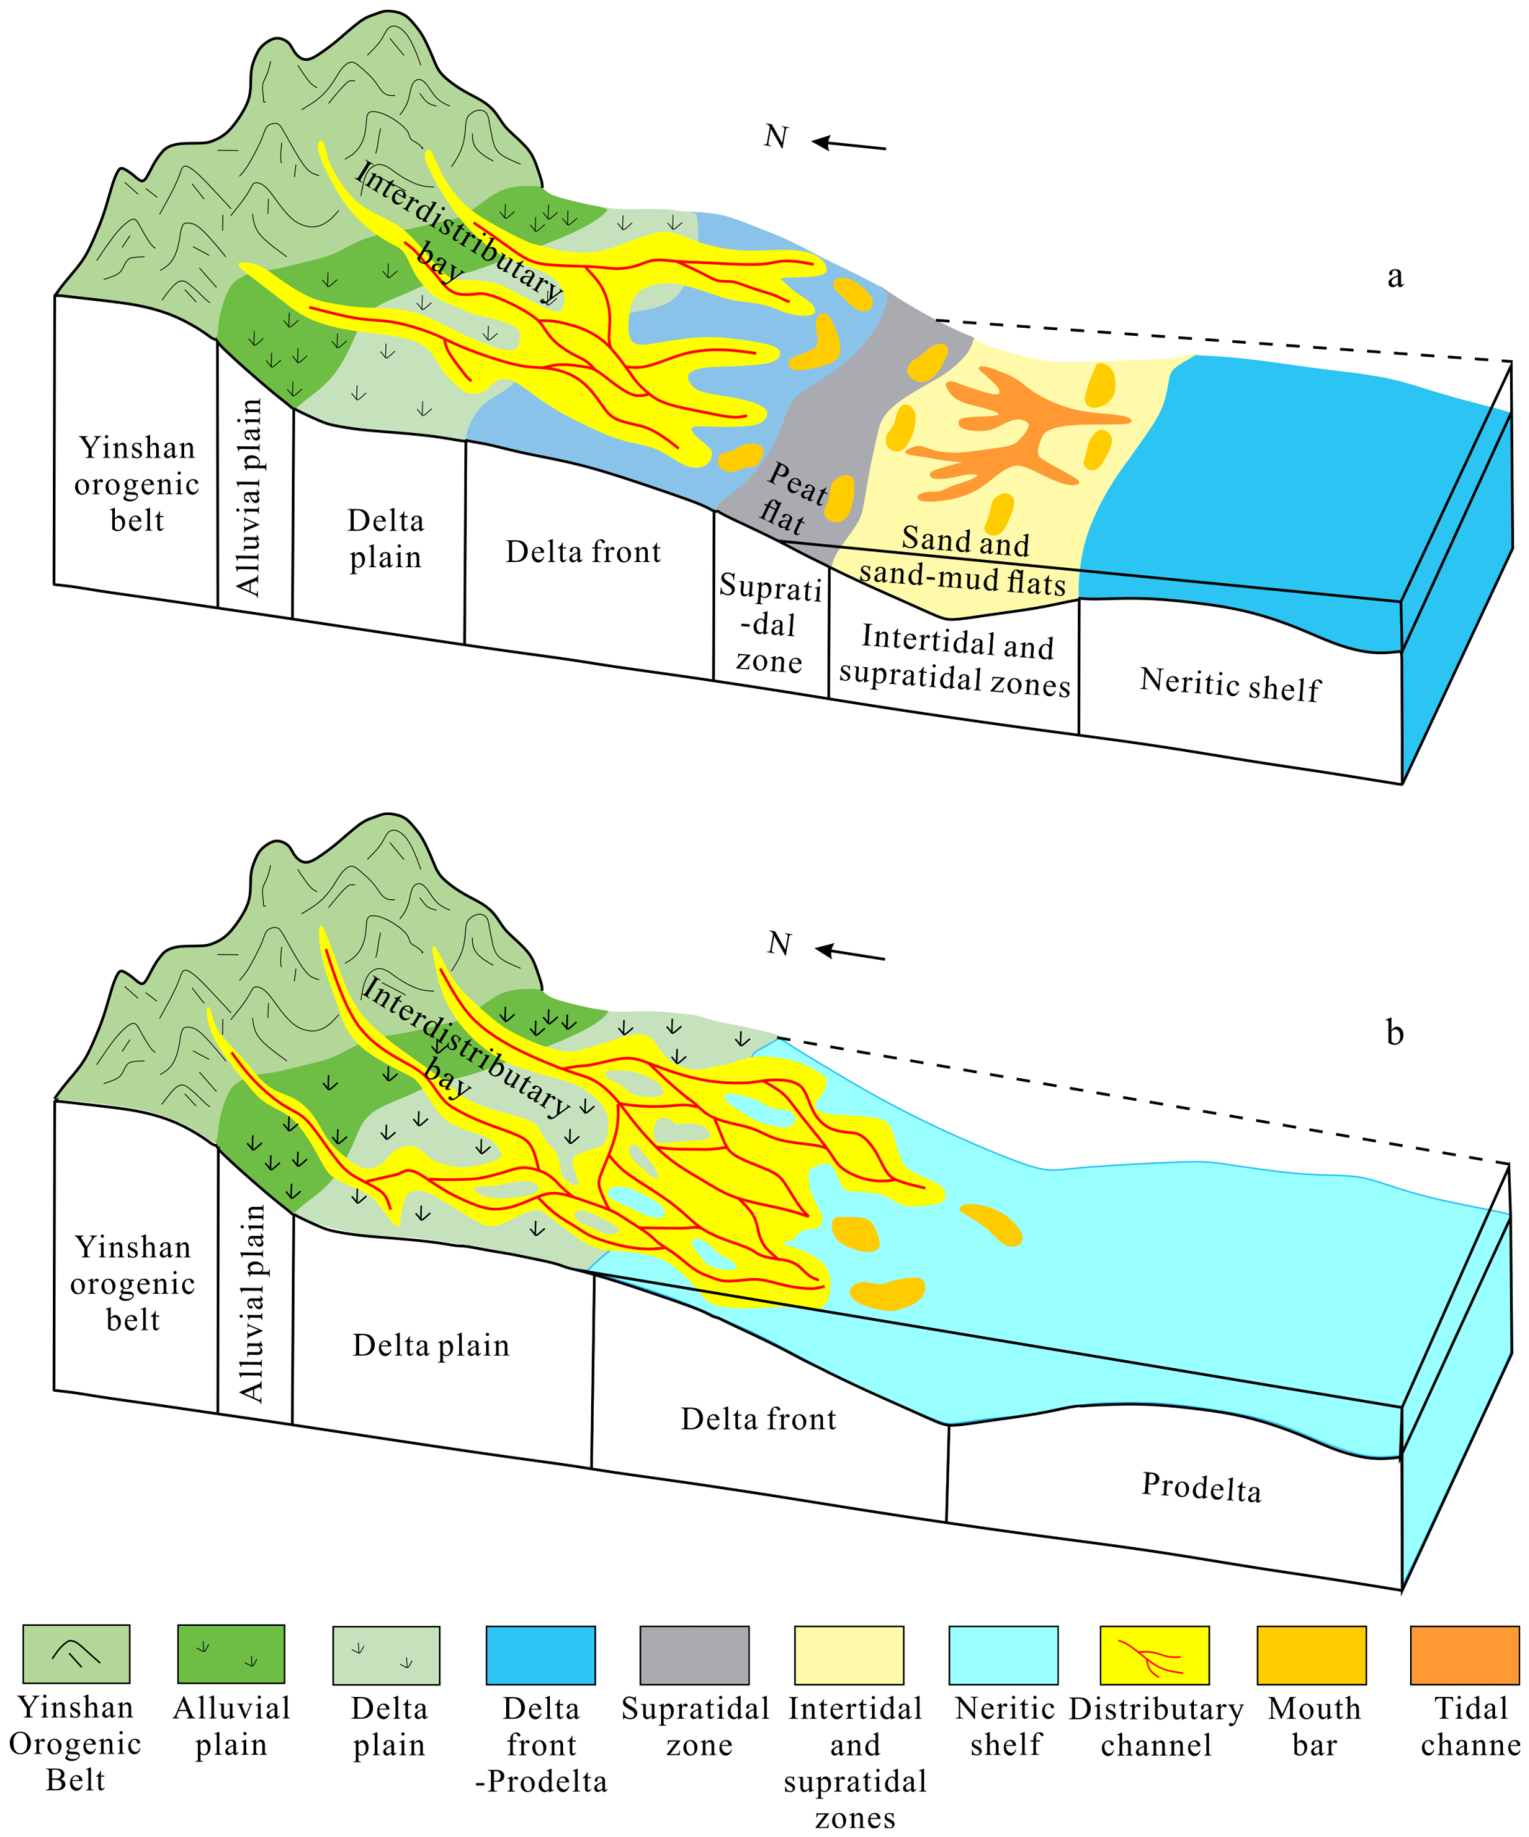
During the depositional period from the BX Fm–H8 Mb, the Mizhi–Qingjian Block was primarily influenced by sediment provenance from the northern area of the basin. It mainly developed sedimentary systems such as marine-continental transitional, continental fluvial, and deltaic environments. Distributary channels, barrier islands, and mouth bars constitute the reservoir sandstones of the TSM reservoirs [22,23]. The BX Fm–TY Fm developed a delta–barrier coast–shallow shelf sedimentary system, which is further divided into sedimentary microfacies including tidal sand bars, lime mud flats, subaqueous distributary channels, and interdistributary bays (Figure 2a). Among these, subtidal channels and sand flats are the main sedimentary framework and also represent important types of sand body within this system, with lithologies dominated by dark gray sandstones, gray-black mudstones, micritic limestones, and coal seams [24]. During the deposition of SX Fm–H8 Mb, influenced by the continuous southward subduction of the Paleo-Asian Ocean, this study area experienced significant uplift, with seawater gradually retreating southward, entering an evolutionary stage dominated by continental sedimentation. The sedimentary environment transitioned to extensive continental fluvial–delta–lacustrine systems, with sedimentary microfacies mainly including distributary channels, interdistributary bays, and mouth bars (Figure 2b) [25,26,27]. The lithologies are primarily light gray sandstones, silty mudstones, and coal seams.

3. Methods

In this study, the reservoir distribution characteristics were delineated and described based on well-logging and core data by statistically analyzing the thicknesses of sandstone, effective sandstone (thickness > 0.2 m), and coal seam in each layer of every well, using Petrel software 2021 in conjunction with the sedimentary facies development characteristics of the study area.
The recoverable resources of TSM and deep CBM are evaluated as following formulas [28,29,30,31]:
G = 0.01 × A × h × Φ × Sgi/Bgi
Gi = 0.01 × A × h × D × C
where G is the resource volume of TSM, 108 m3; A is the gas-bearing area, km2; h is the effective thickness, m; Φ is the effective porosity, %; Sgi is the initial gas saturation, %; Bgi is the initial gas formation volume factor; Gi is the resource volume of deep CBM, 108 m3; D is the density of coal seam, t/m3; and C is the CBM content, m3/t. It is worth noting that the volumetric method has certain limitations when applied to tight gas resource assessment, as the strong heterogeneity and ambiguous gas–water boundaries typical of tight sandstones require high precision in parameter determination. The resource estimates presented in this study are therefore approximate in nature, though they are generally consistent with current production data from the Mizhi–Qingjian area and are provided for reference purposes.
This study integrates three categories of indicators (geological (sedimentary characteristics, effective reservoir cross-sectional patterns, superimposed effective thickness, and abundance), dynamic (first-year daily production), and economic (EUR (Estimated Ultimate Recovery) and rate of return) to define the Class I + II resources with effective thickness > 10 m, EUR > 1414 × 104 m3, and internal rate of return > 6% as the enrichment areas of TSM in the Mizhi area. Meanwhile, based on comprehensive parameters including effective reservoir thickness, proportion of effective reservoir thickness, microstructure, reservoir physical properties, and thickness of major source rocks, the cost-effective development threshold for TSM in the Qingjian Block is defined as superimposed effective thickness > 10 m, proportion of effective reservoir thickness > 80%, reservoir porosity > 7%, permeability > 0.3 mD, thickness of major coal seams > 5 m, and location in structurally high positions away from fault systems.

4. Results

4.1. Development Characteristics of Sandstones

4.1.1. Drilling Penetration Characteristics of Sandstones

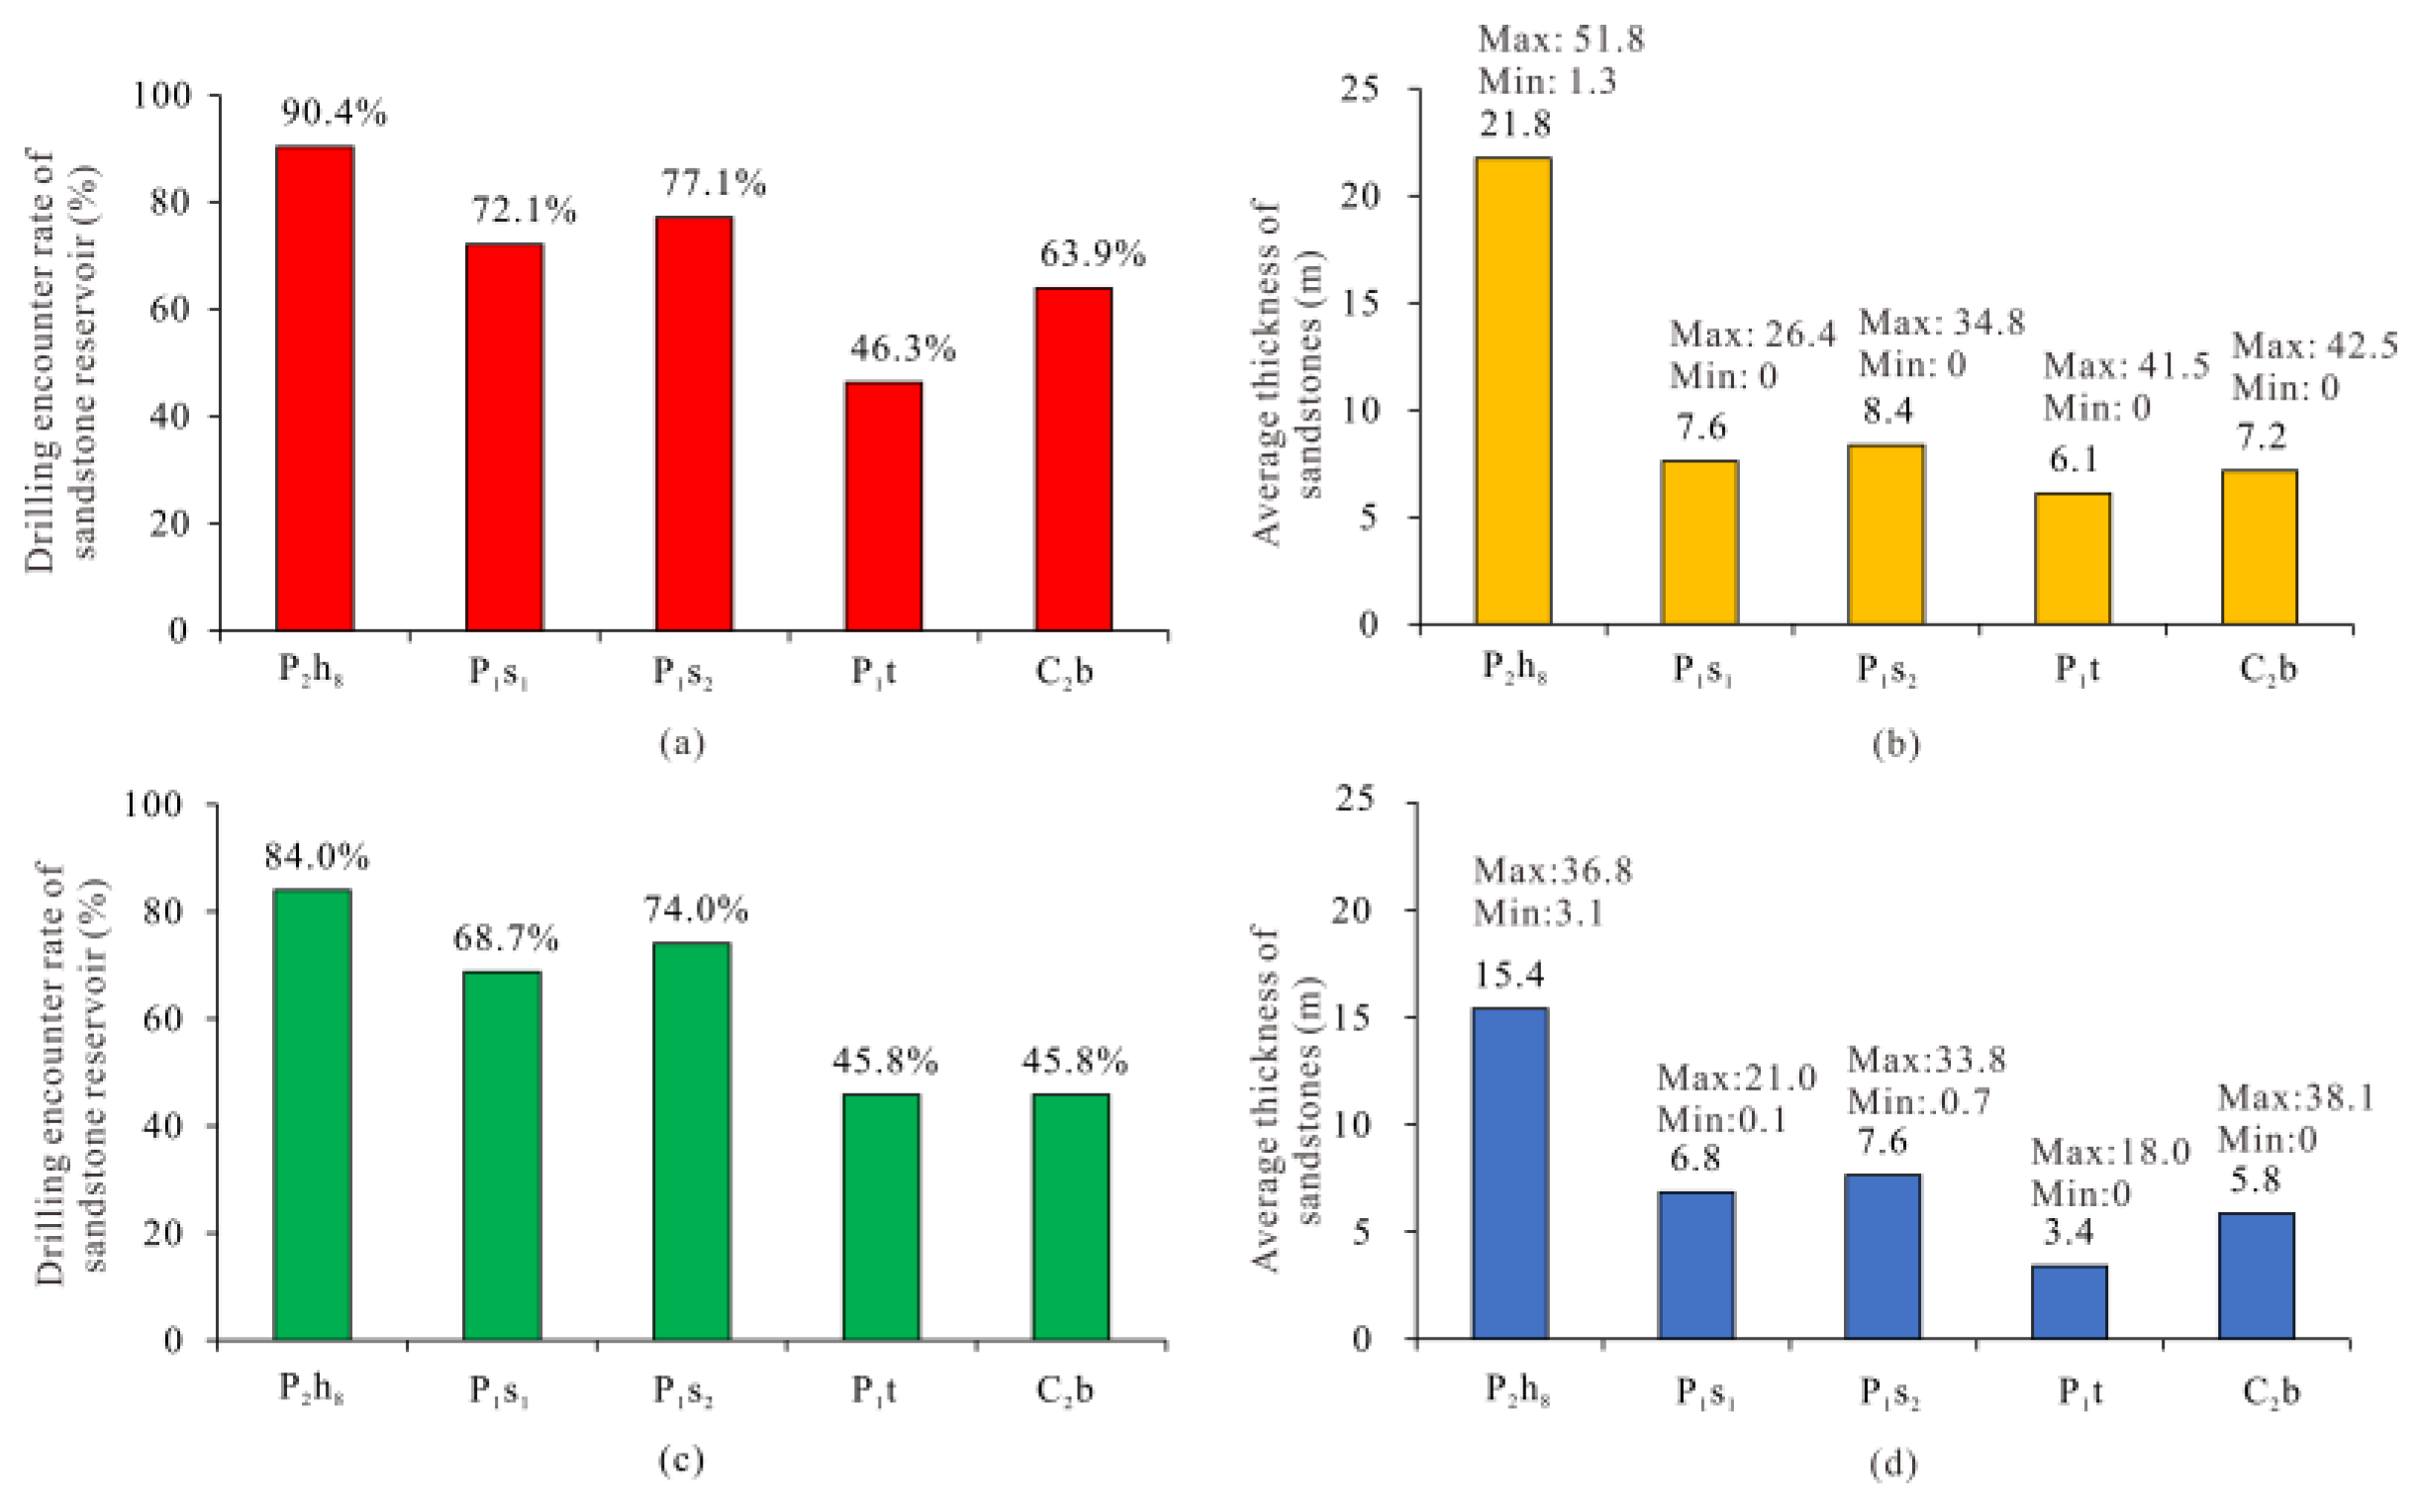
In both the Mizhi and Qingjian Blocks, the H8 Mb sandstones exhibit the best development, followed by the S2 Mb (Shan 2 Member), S1 Mb (Shan 1 Member), and BX Fm, with the TY Fm showing the poorest development (Figure 3). Compared with the Qingjian Block, the Mizhi area has significantly higher penetration rates and average thicknesses of sandstones. In the Mizhi area, the penetration rate of H8 Mb sandstones is 90.4%, with an average thickness of 21.8 m; the penetration rates of S2 Mb, S1 Mb, and BX Fm sandstones are 72.1%, 77.1%, and 63.9%, respectively, with average thicknesses of 7.6 m, 8.4 m, and 7.2 m, respectively; the TY Fm sandstones have a penetration rate of 46.3% and an average thickness of 6.1 m (Figure 3a,b). In the Qingjian Block, the penetration rate of H8 Mb sandstones is 84.0%, with an average thickness of 15.4 m; the penetration rates of S2 Mb, S1 Mb, and BX Fm sandstones are 74.0%, 68.7%, and 45.8%, respectively, with average thicknesses of 7.6 m, 6.8 m, and 5.8 m, respectively; the TY Fm sandstones have penetration rate of 45.8% and average thickness of 3.4 m (Figure 3c,d).

4.1.2. Distribution Characteristics of Sandstones

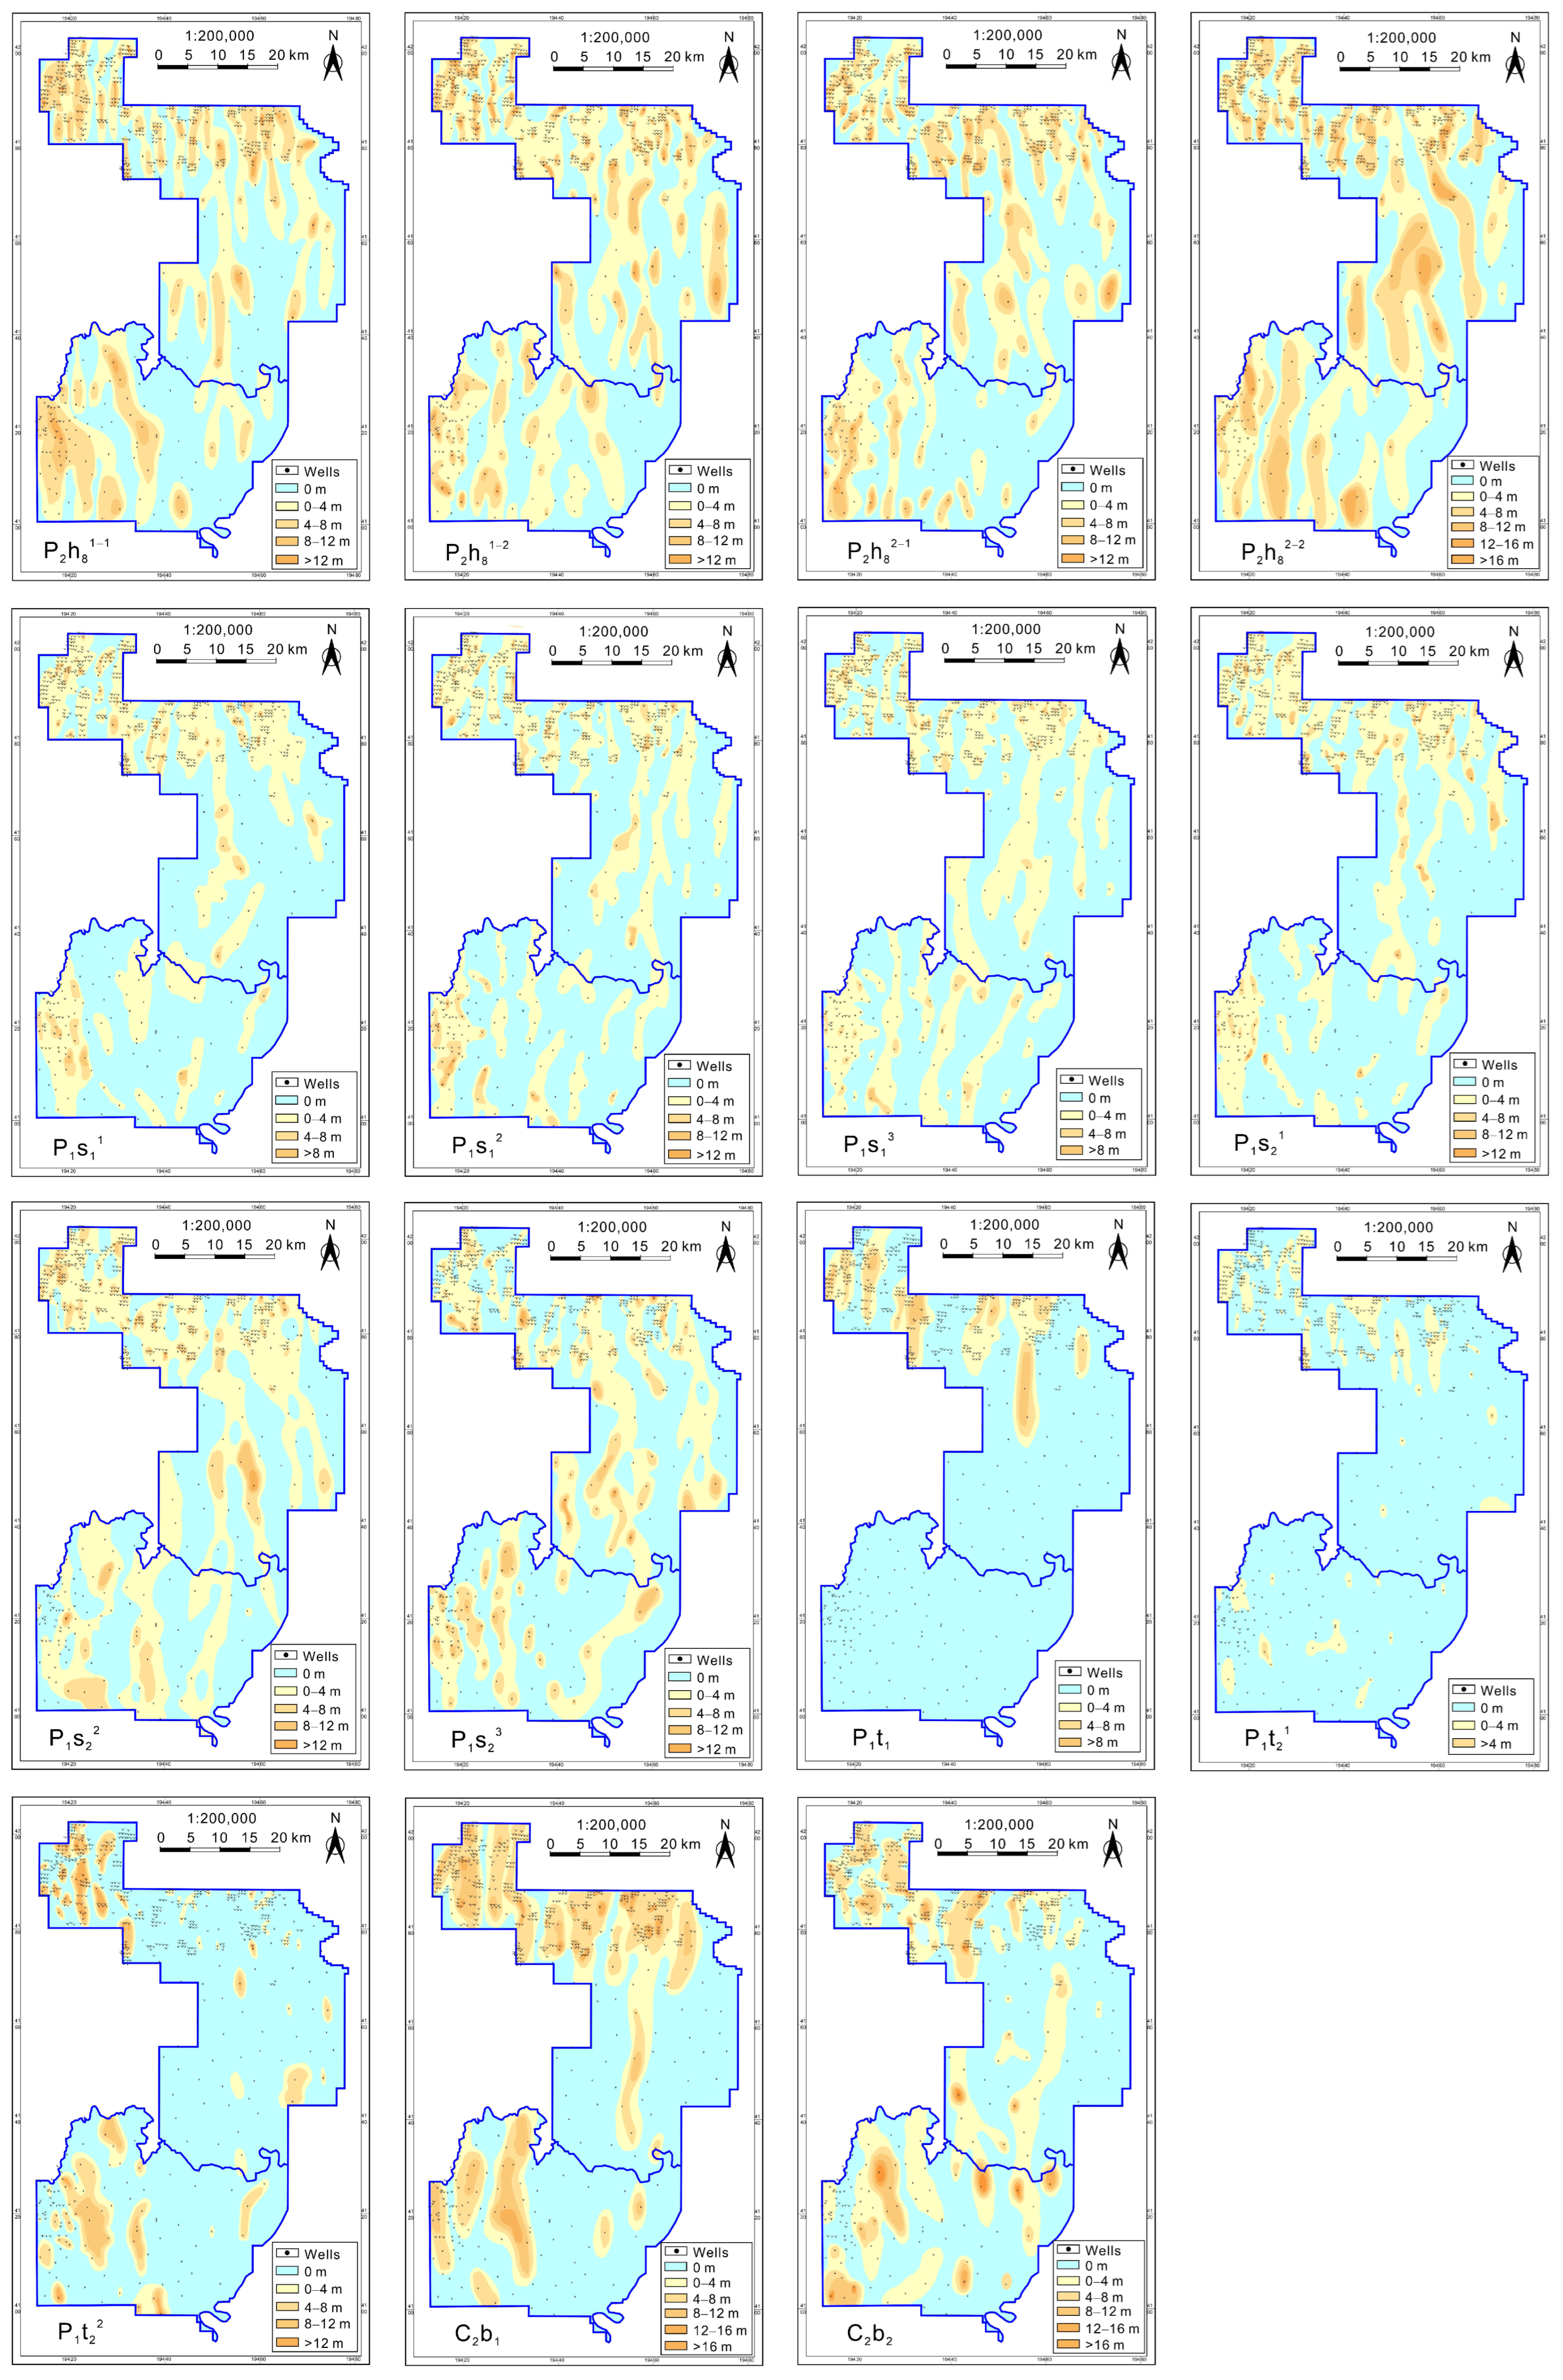
The sandstone distribution characteristics of different intervals in the Mizhi–Qingjian Block exhibit certain differences, but they generally display a narrow, north–south trending banded distribution (Figure 4). Among them, the H8 Mb sandstones are generally thick, with thicknesses mainly ranging from 4 m to 8 m, locally > 12 m. The S1 Mb, S2 Mb, and BX Fm sandstones are relatively thin, with thicknesses predominantly between 0 and 4 m, locally > 8 m. The TY Fm sandstones are generally poorly developed, occurring only sporadically in the northern and southwestern areas, with thicknesses mainly between 0 and 4 m. Compared with the Mizhi area, the distribution area and scale of sandstones in the Qingjian Block are significantly smaller and are primarily located in the western area.
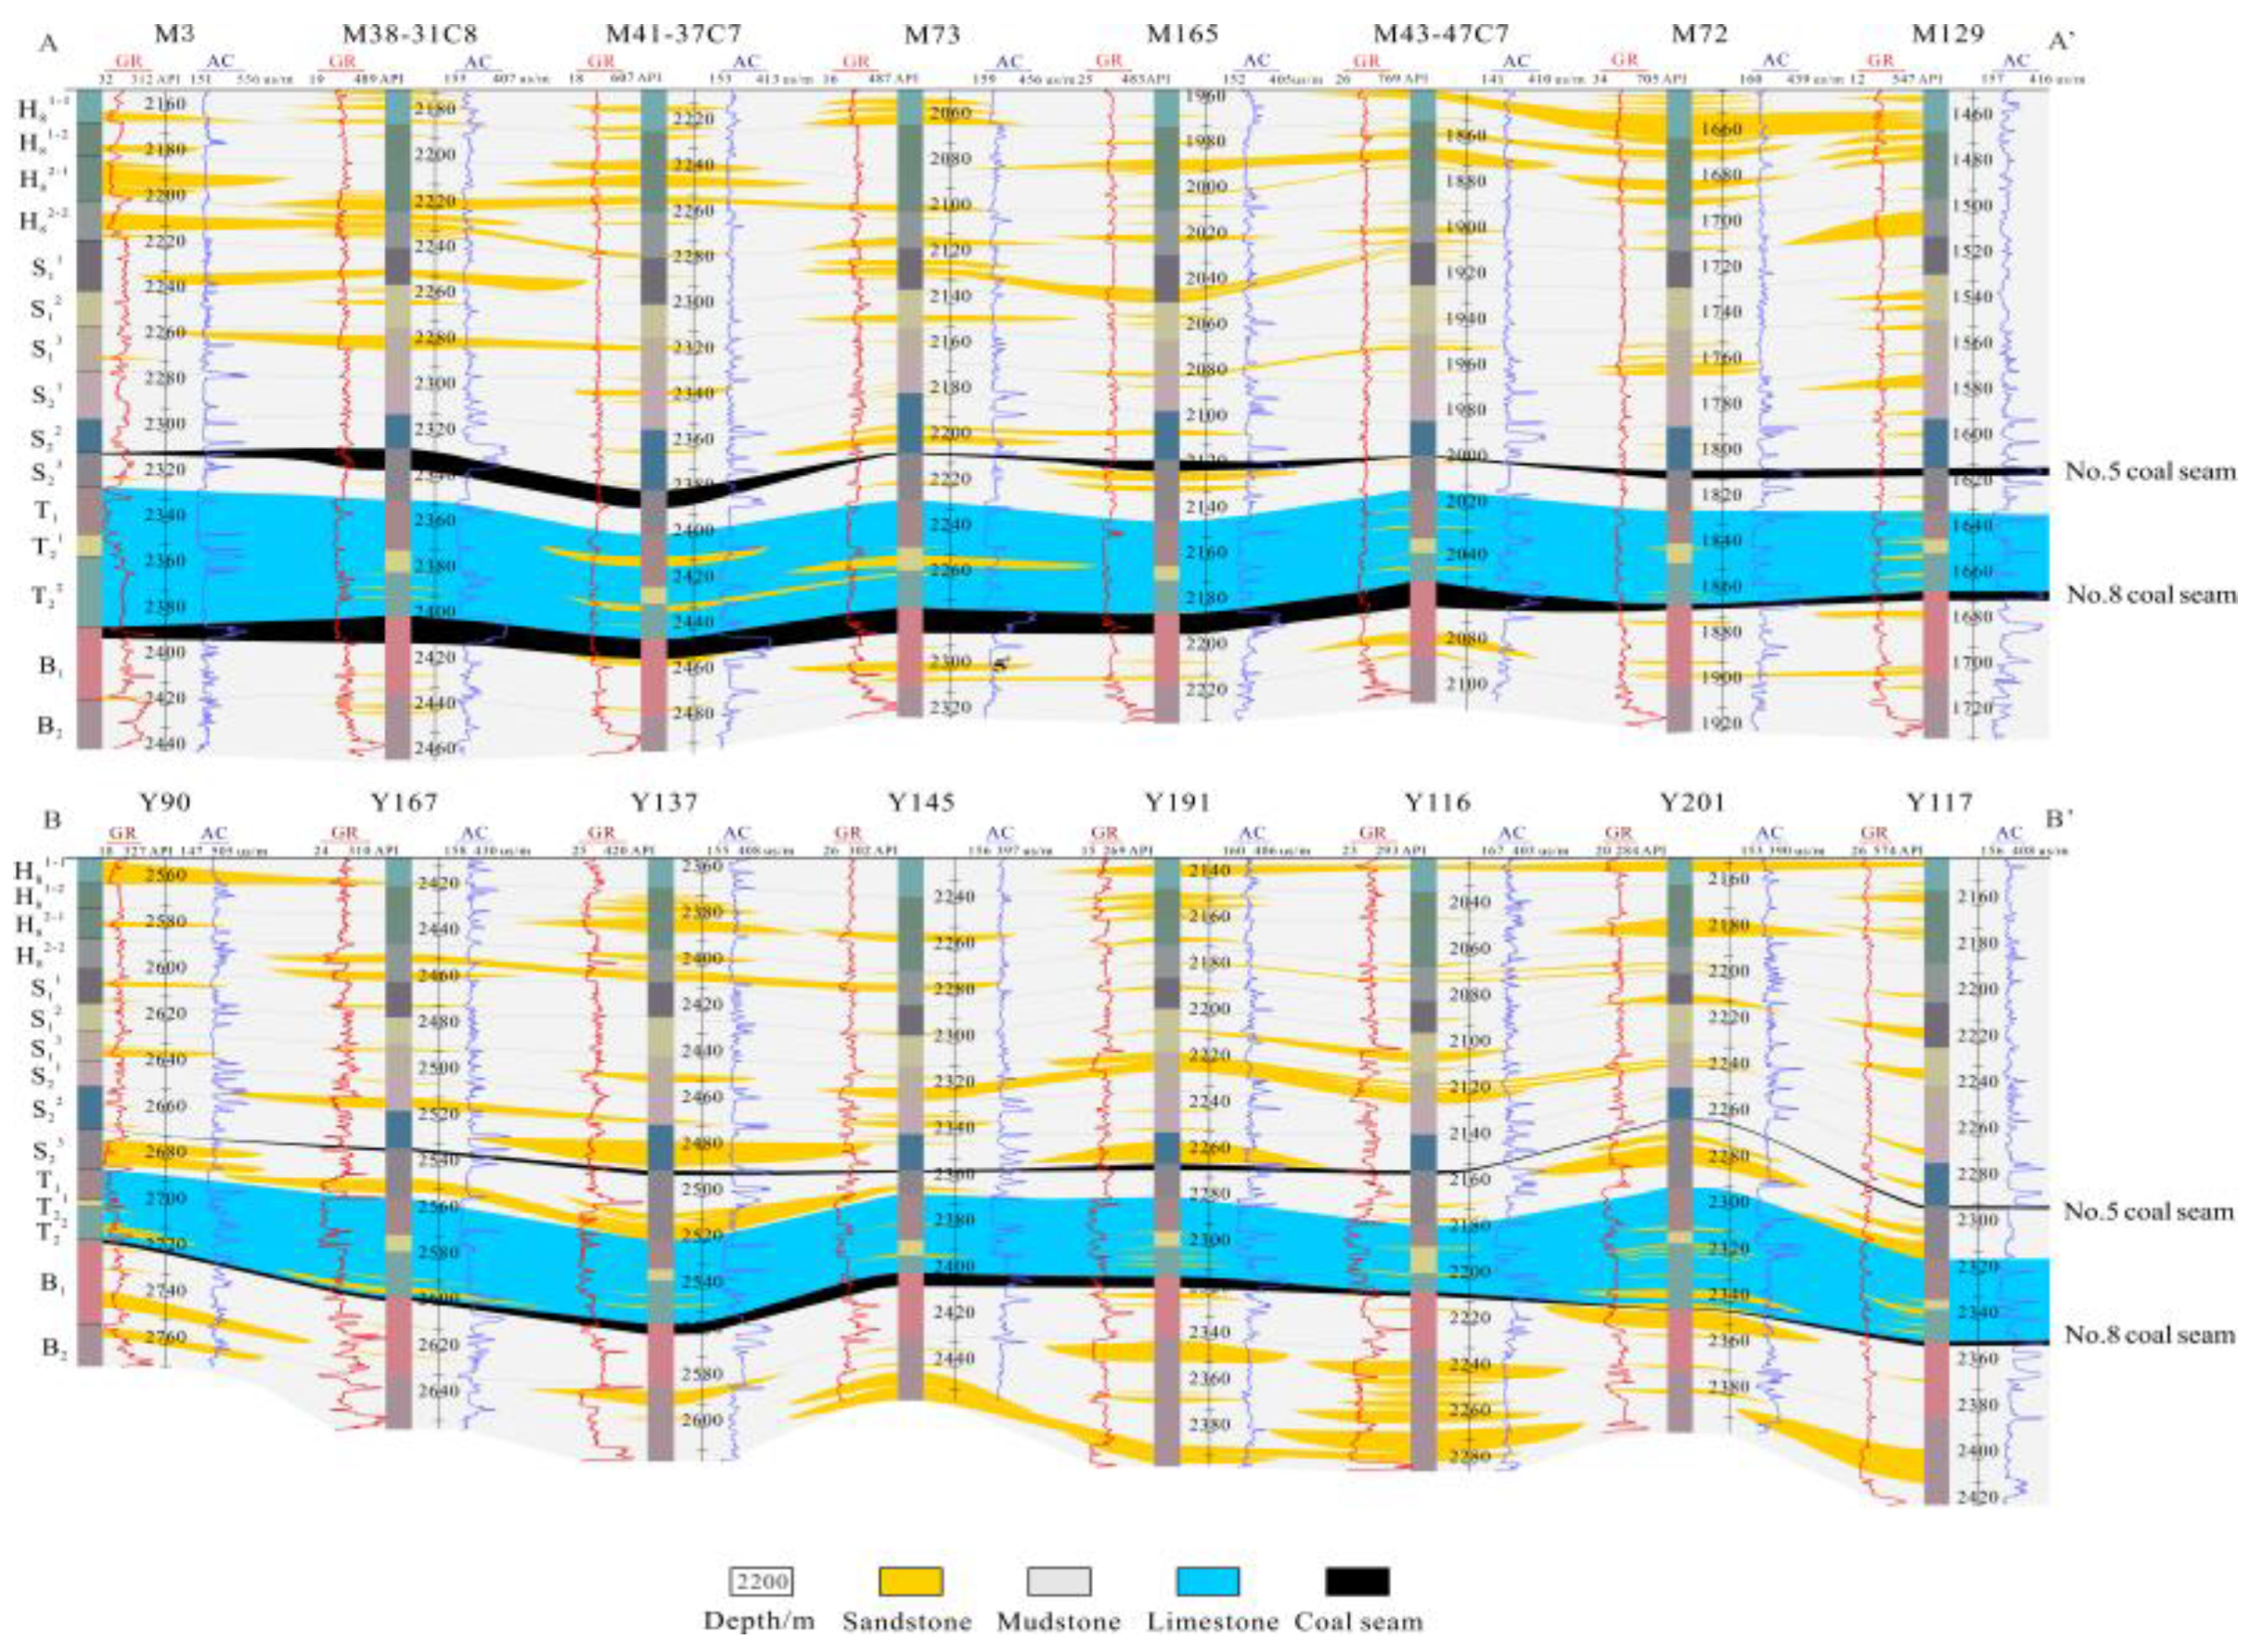
The BX Fm–H8 Mb in the Mizhi–Qingjian Block is primarily dominated by distributary channel microfacies deposits. The degree of sandstone development gradually weakens from west to east and from the upper to lower sections (Figure 5). Sandstones deposited during the same period exhibit different reservoir capacities depending on the type of sedimentary microfacies. The sandstones in the main subaqueous distributary channels of the target intervals experienced stronger hydrodynamic conditions. The clastic rocks in the section are mainly lithic quartz sandstones and coarse quartz sandstones, with relatively coarse grain sizes, and commonly contain carbonaceous laminae, mud clasts, and muddy bands. The sandstones show moderate to poor sorting, with obvious scouring surfaces at the bottom. In contrast, sandstones in small branching channels, channel flanks, and interdistributary bays have finer grain sizes and are interbedded with mudstones, often exhibiting lenticular bedding and horizontal bedding, with colors predominantly gray-black, relatively dense, and poor physical properties [32]. In vertical sections, the muddy deposits of interdistributary bays often surround the subaqueous distributary channel sand bodies, displaying a “mud-wrapped sand” characteristic. In summary, the SX Fm and H8 Mb sandstones in the Mizhi–Qingjian Block exhibit vertical stacking of multiple channel stages, forming clastic sandstones with significant composite thicknesses and large-scale distributions, providing a favorable spatial foundation for the development of high-quality reservoirs.
Figure 4. Distribution characteristics of BX Fm–H8 Mb sandstones in the Mizhi–Qingjian Block.
Processes 14 02898 g004
Figure 5. East–west sedimentary cross-sections of Mizhi (AA’) and Qingjian (BB’) areas.
Processes 14 02898 g005

4.2. Development Characteristics of Effective Sandstones

4.2.1. Drilling Penetration Characteristics of Effective Sandstones

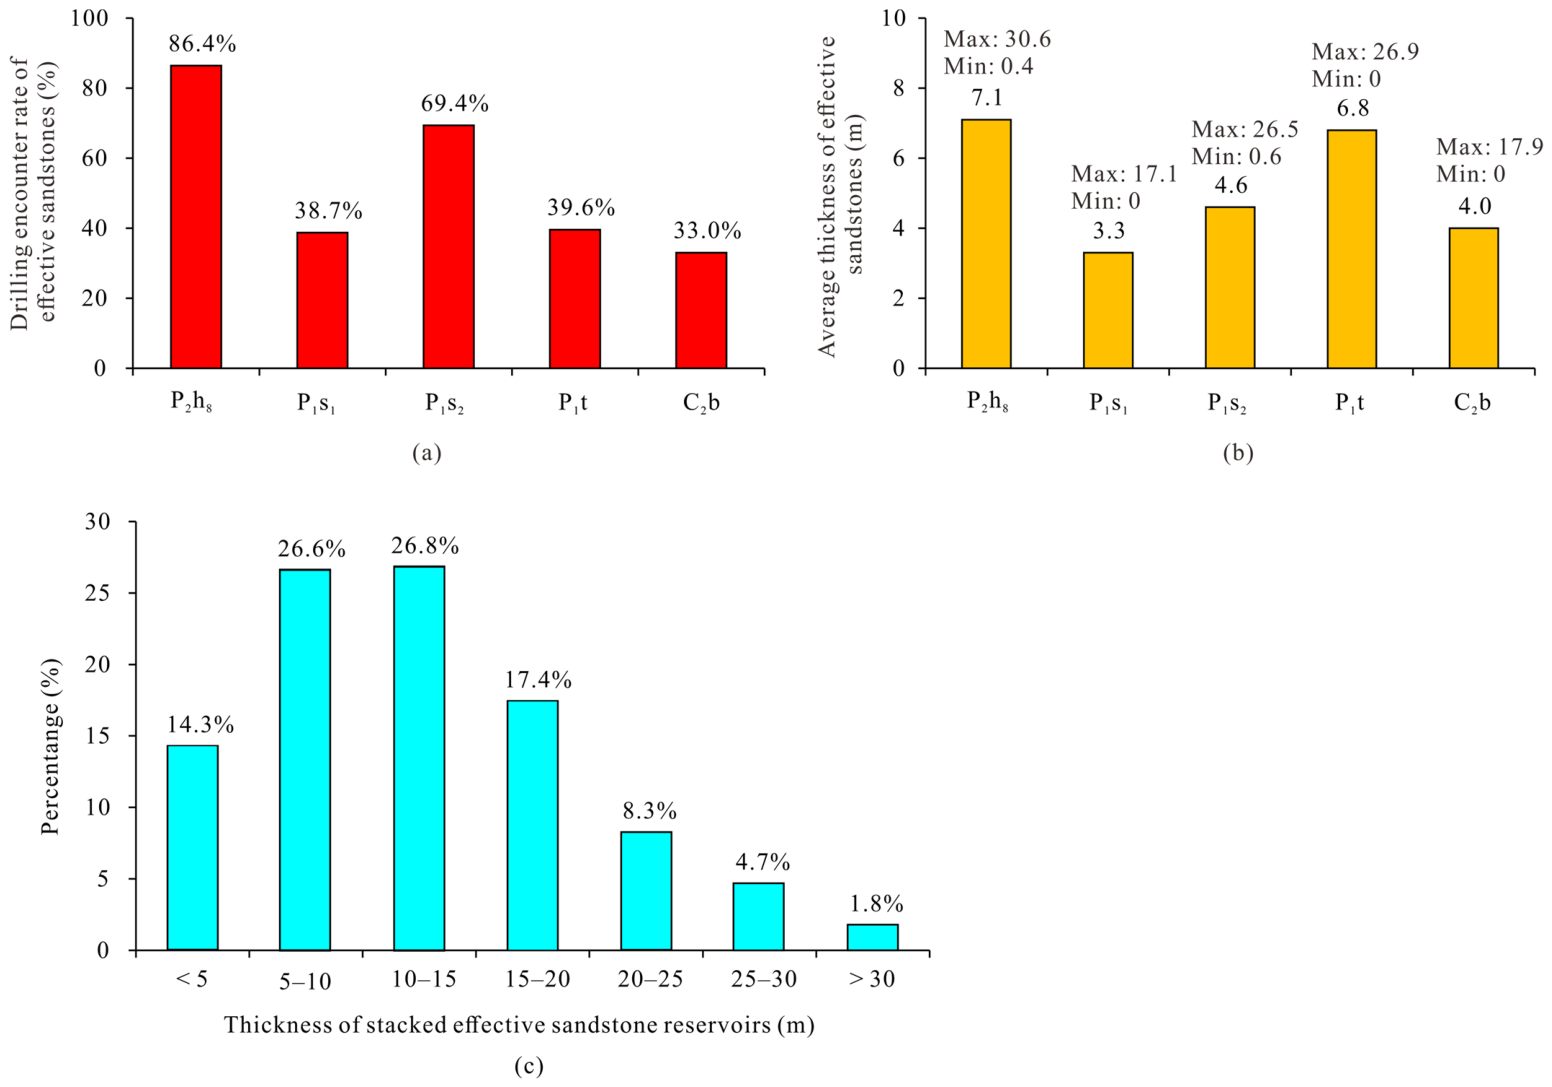
Figure 6 shows the drilling penetration rates and average thicknesses of BX Fm–H8 Mb effective sandstones in the Mizhi Block, which differ from the distribution characteristics of total sandstones. It can be observed that the H8 Mb effective sandstones exhibit the best development, followed by the S2 Mb, TY Fm, and BX Fm, while the S1 Mb shows the poorest development. Specifically, the penetration rates of H8 Mb, S2 Mb, TY Fm, BX Fm, and S1 Mb effective sandstones are 86.4%, 69.4%, 39.6%, 33.0%, and 38.7%, respectively, and their average thicknesses are 7.1 m, 4.6 m, 6.8 m, 4.0 m, and 3.3 m, respectively (Figure 6a,b). Furthermore, the penetration rate of BX Fm–H8 Mb superimposed effective sandstone in the Mizhi area is 91.7%, with the superimposed effective sandstone thickness ranging mainly from 3.8 m to 18.1 m (average = 12.4 m) (Figure 6c).
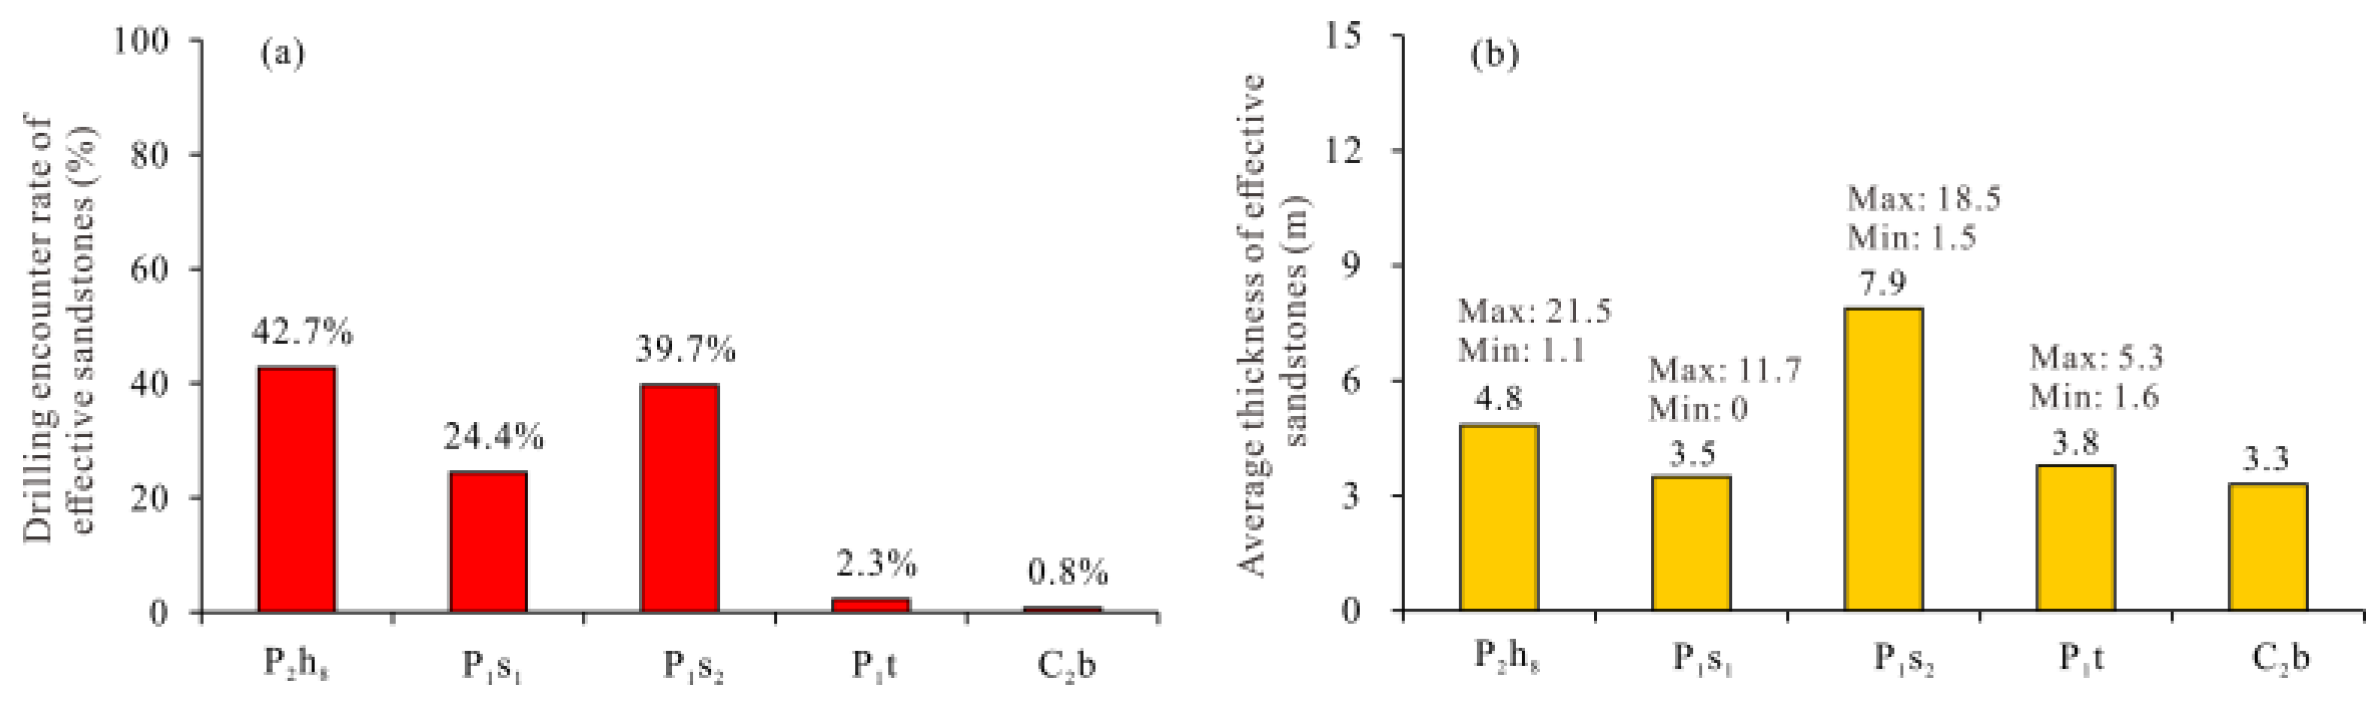
Figure 7 shows the drilling penetration rates and average thicknesses of BX Fm–H8 Mb effective sandstones in the Qingjian Block. It can be observed that the H8 Mb effective sandstones exhibit the best development, followed by the S2 and S1 Mbs, while the TY and BX Fms are almost undeveloped. Specifically, the penetration rates of H8 Mb, S2 Mb, S1 Mb, TY Fm, and BX Fm are 42.7%, 39.7%, 24.4%, 2.3%, and 0.8%, respectively, and their average thicknesses are 4.8 m, 7.9 m, 3.5 m, 3.8 m, and 3.3 m, respectively (Figure 7a,b). Compared with the Mizhi area, the penetration rates of effective sandstones in the Qingjian Block are significantly lower, and the effective thicknesses are also notably reduced in all intervals except the S2 and S1 Mbs.
Figure 6. (a) Penetration rates, (b) average thicknesses, and (c) superimposed thickness distribution of BX Fm–H8 Mb effective sandstones in the Mizhi area.
Processes 14 02898 g006
Figure 7. (a) Penetration rates and (b) average thicknesses of BX Fm–H8 Mb effective sandstones in the Qingjian Block.
Processes 14 02898 g007

4.2.2. Distribution Characteristics of Effective Sandstones

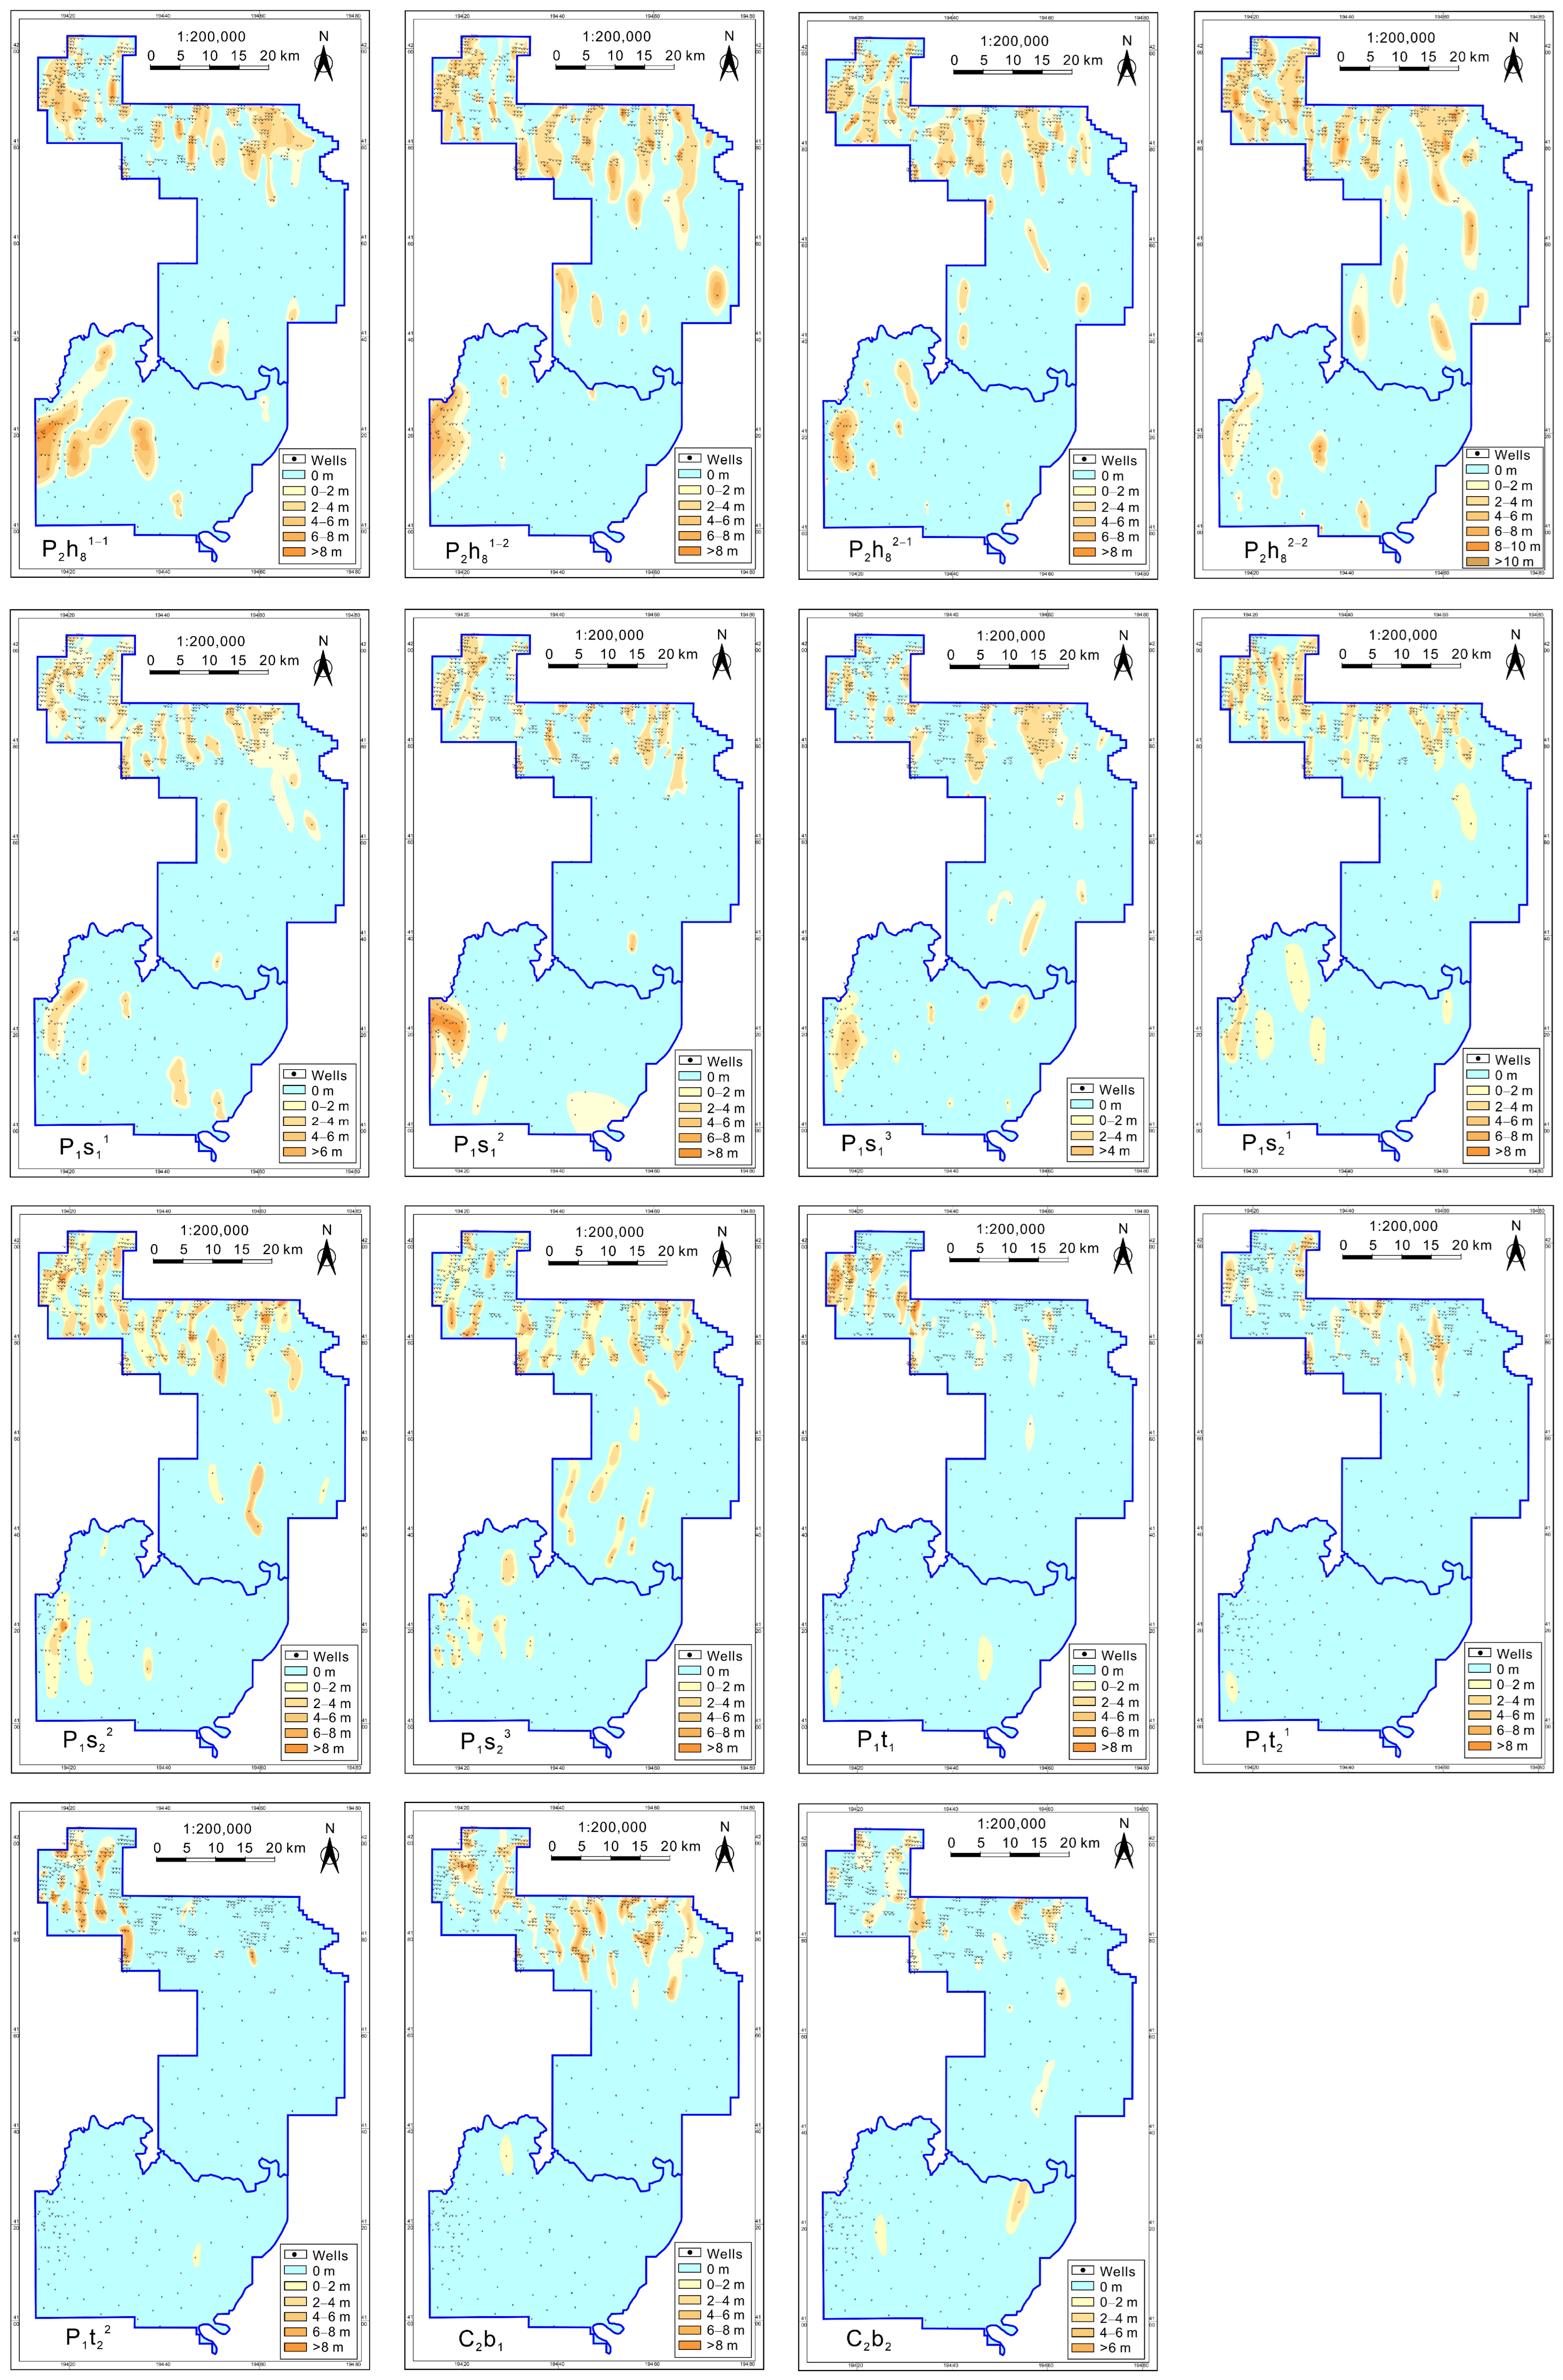
Laterally, the H8 and S2 Mbs effective sandstones in the Mizhi area are widely developed throughout the study area. The effective sandstone thicknesses of each sub-member of these two intervals mainly range from 2 m to 4 m, locally >10 m. The S1 Mb and BX Fm effective sandstones are moderately developed, mainly distributed in the northern area, with sporadic development in the southern area. The effective sandstone thicknesses of each sub-member of these intervals are mainly between 2 m and 4 m, locally > 8 m. The TY Fm effective sandstones are relatively poorly developed, occurring only sporadically in the northwestern area, with no development in the southern area (Figure 8). In contrast, effective sandstones in the Qingjian Block are only locally developed in the central and western areas of the block, with small areal extent and thin thicknesses. In particular, TY and BX Fms effective sandstones are almost absent.
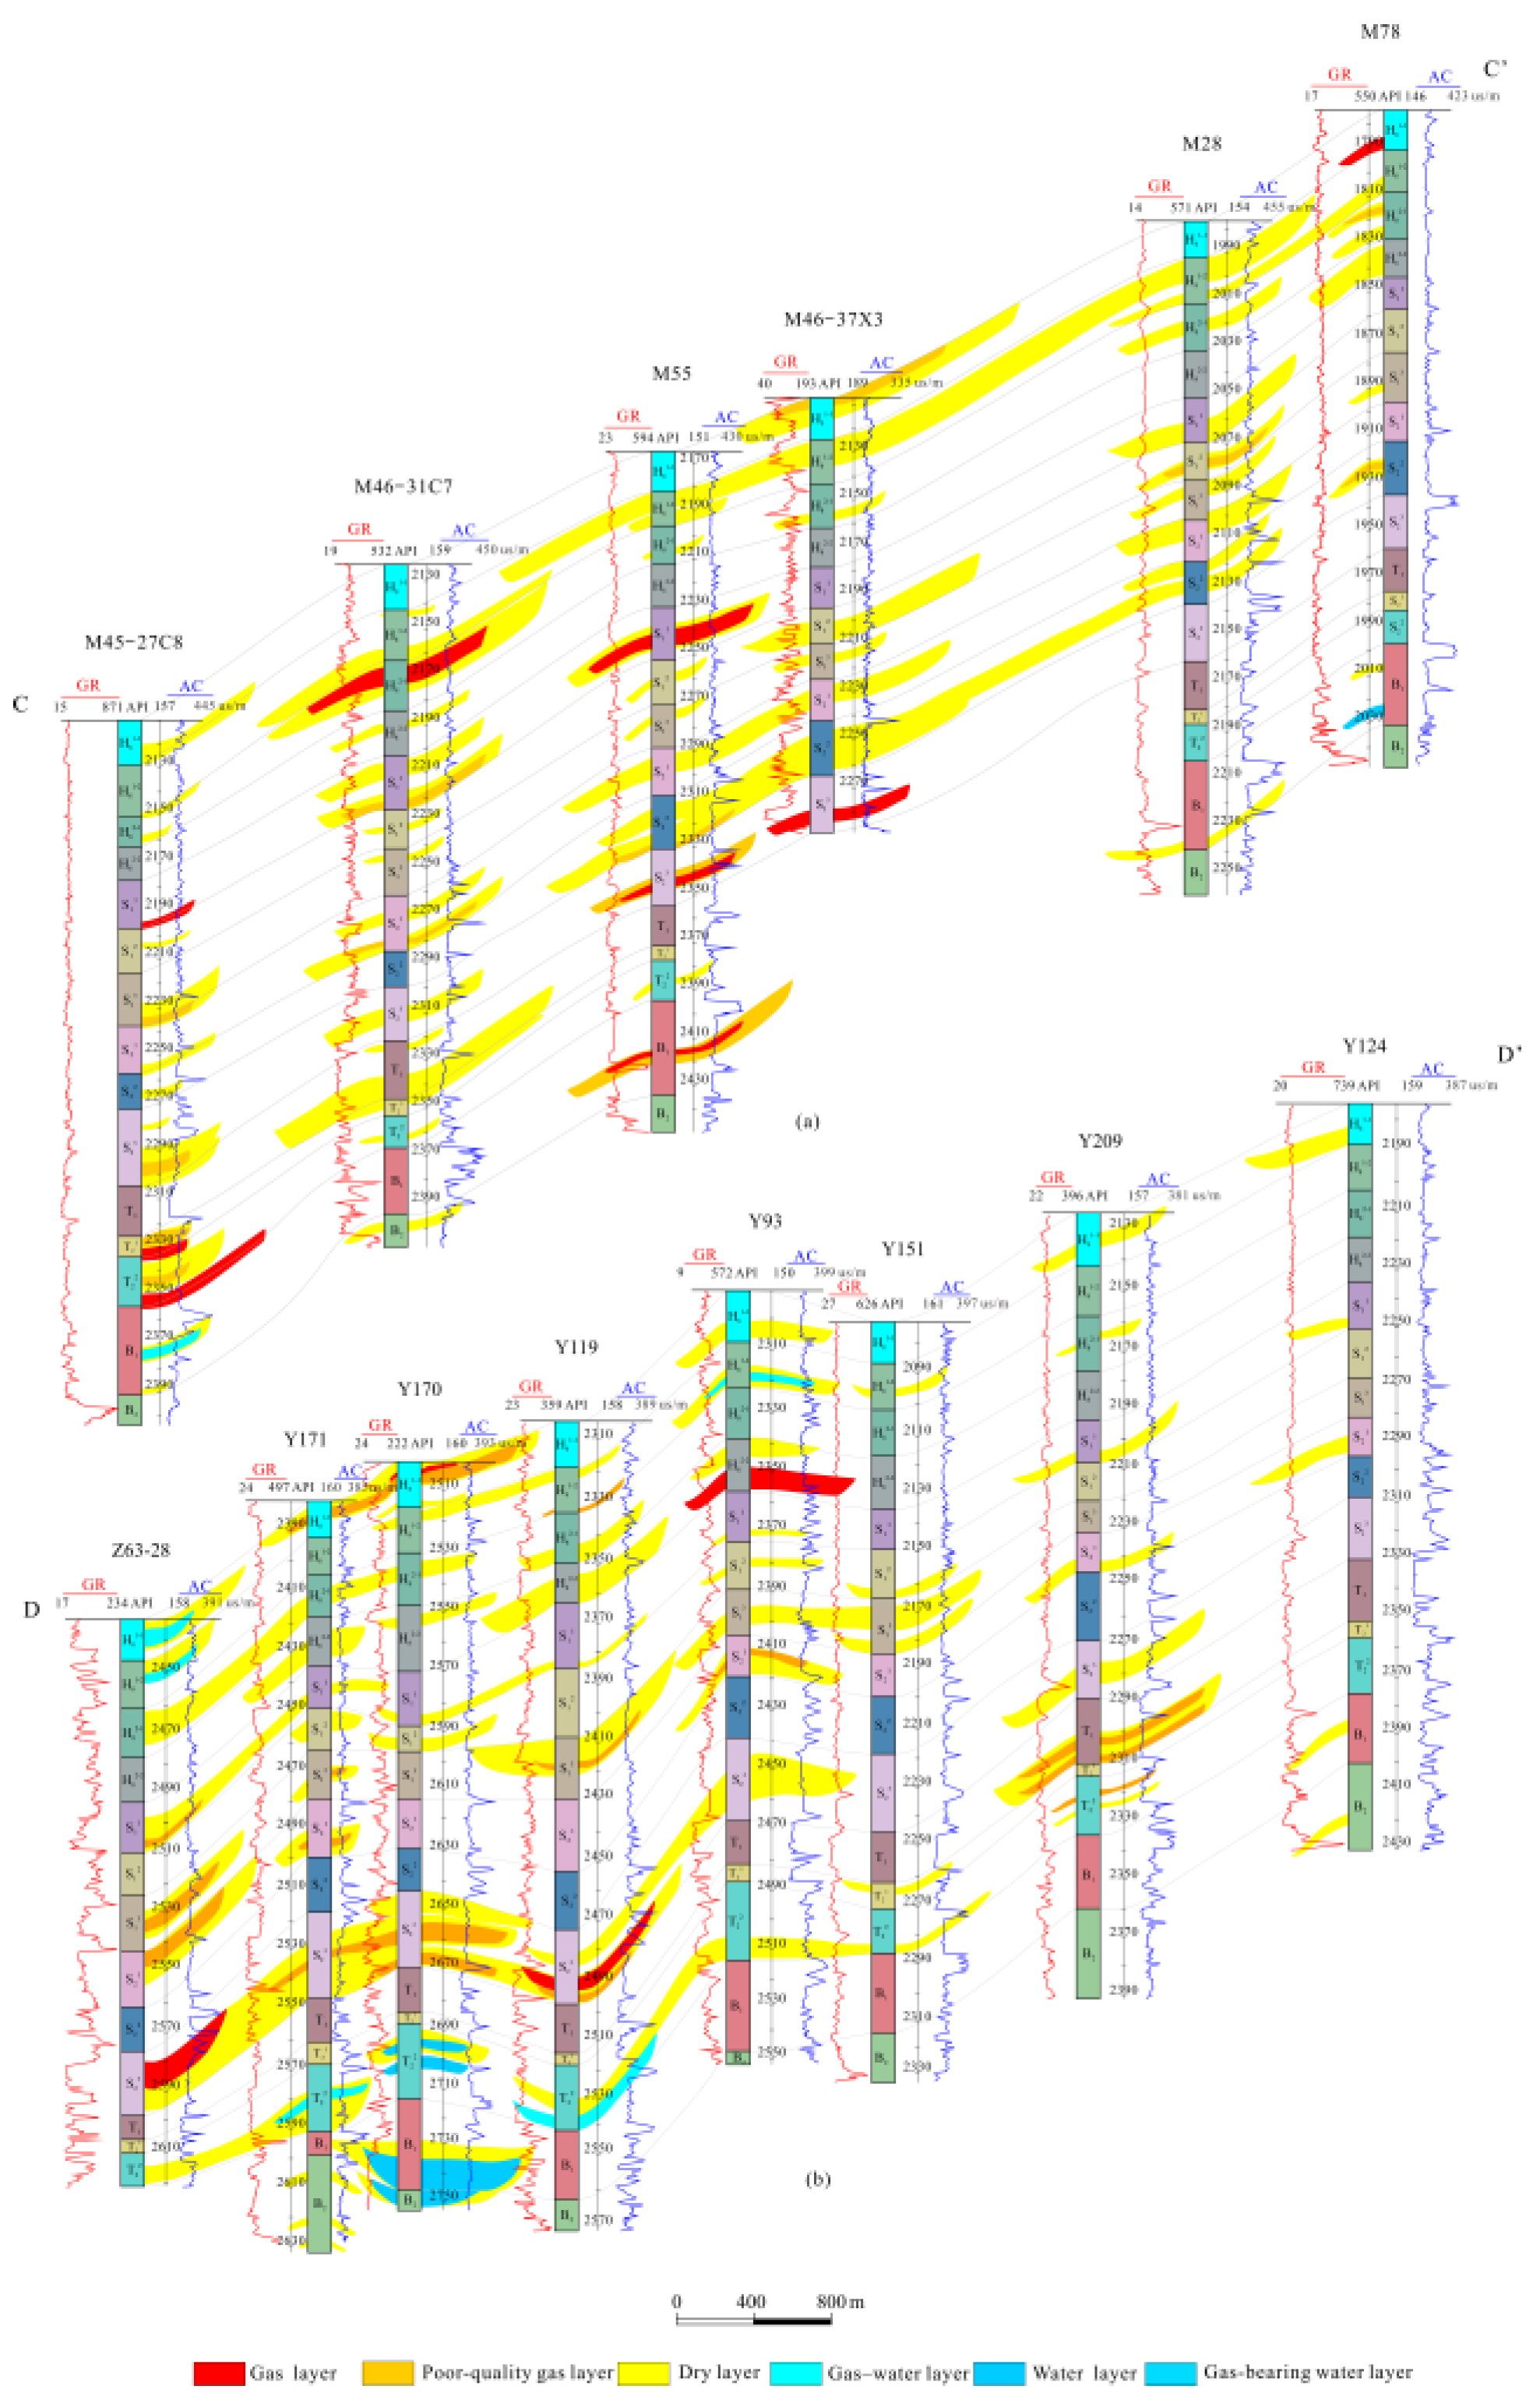
In cross-section, the Mizhi area exhibits vertically stacked gas-bearing layers across multiple intervals. The number of vertically developed layers in the BX Fm–H8 Mb mainly ranges from 3 to 12, with an average of 5.4 layers. Each sub-layer displays a lenticular shape with no inter-well connectivity. The effective thickness primarily ranges from 0.5 m to 4.5 m (average = 2.4 m) (Figure 9a). Compared with the Sulige Gas Field and the Shenmu Gas Field, the scale of effective sandstones in the Mizhi area is smaller, and the proportion of poor-quality gas layers is higher. The effective sandstone width mainly ranges from 450 m to 500 m, and the length mainly ranges from 550 m to 650 m. Among the effective reservoirs, the average thickness of poor-quality gas layers is 6.1 m, accounting for 49%.
In contrast to the Mizhi area, the Qingjian Block exhibits the co-development of gas layers (including poor-quality gas layers) and water zones (including gas–water transition zones and gas-bearing water layers), with localized differentiation. The effective sandstone width mainly ranges from 300 m to 500 m, and the length mainly ranges from 200 m to 600 m (Figure 9b).

4.3. Development Characteristics of Coal Seam

4.3.1. Distribution Patterns of Coal Seam

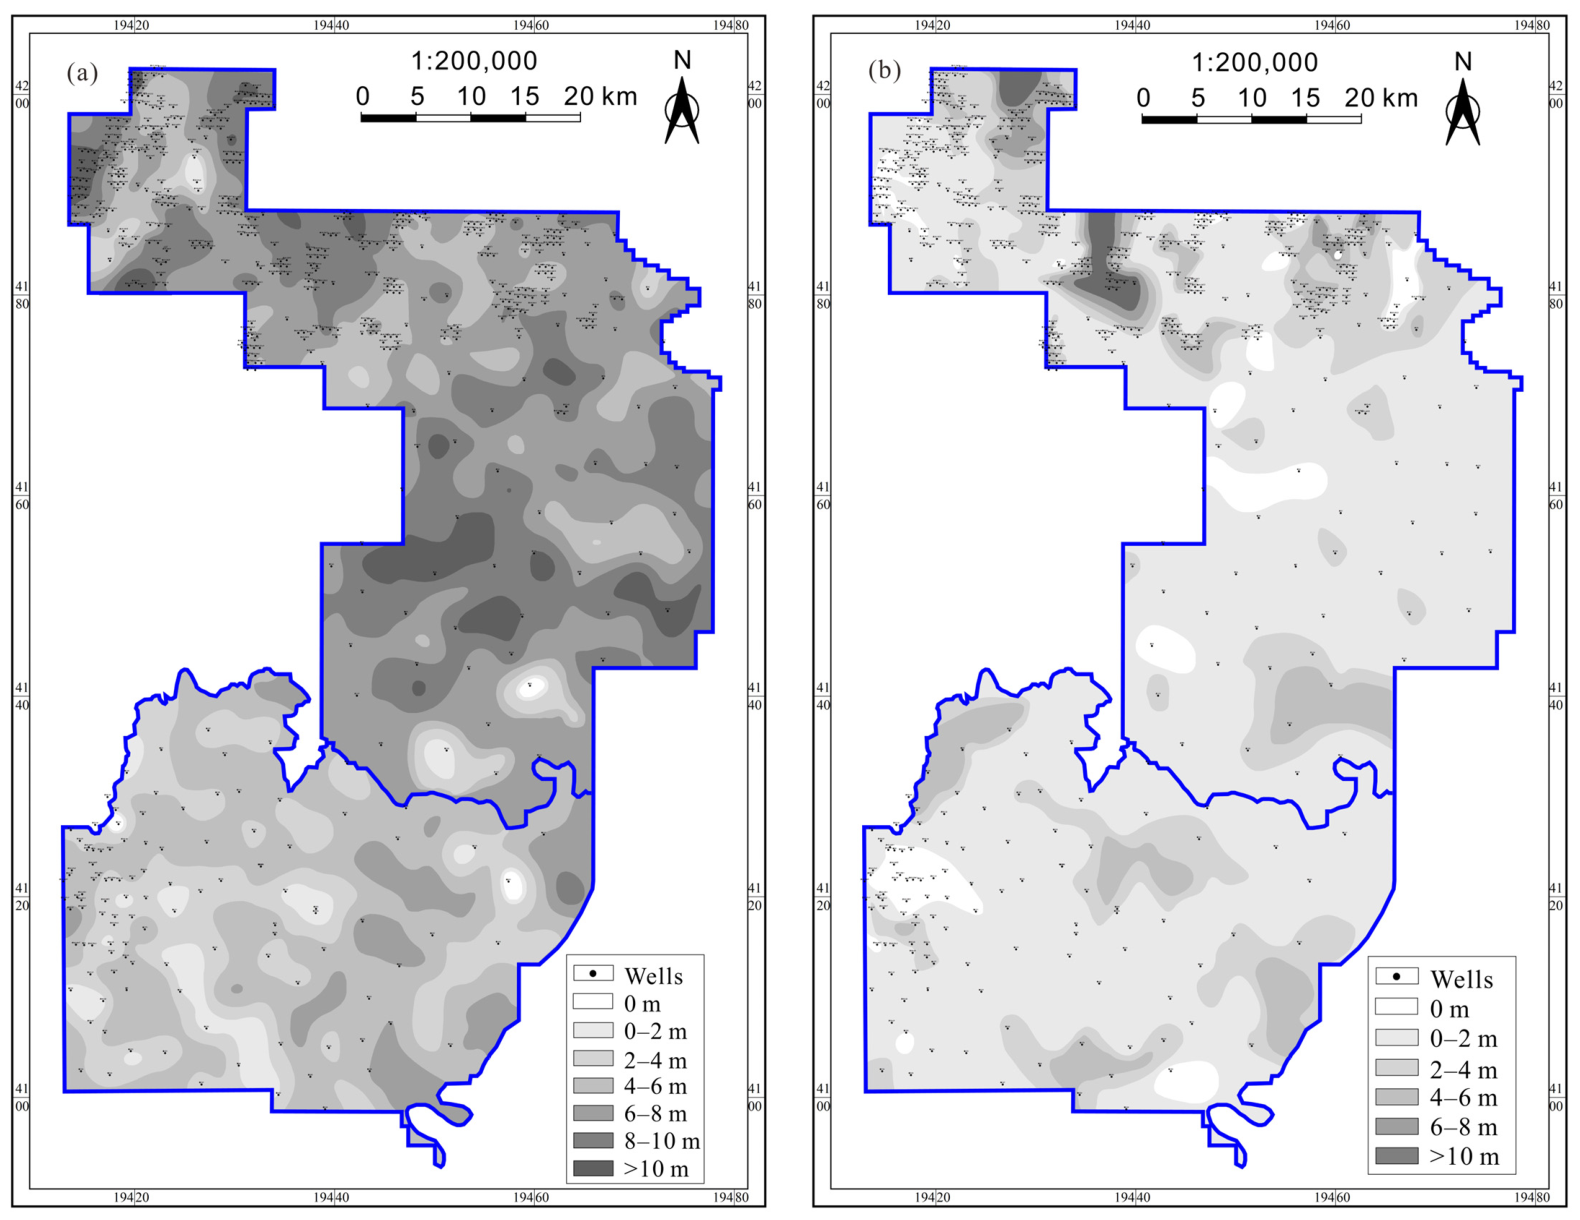
During the Late Carboniferous to Middle Permian, the Ordos Basin experienced a warm and humid paleoclimate, with gentle paleotopography, lush vegetation, and well-developed peat swamps, resulting in widely distributed marine-continental transitional coal seams [19,24,33]. From top to bottom, ten coal seams have been developed, among which the BX Fm No. 8 coal seam and the SX Fm No. 5 coal seam are the main coal seams and also the primary exploration targets for deep CBM in the basin (Figure 5). As shown in Figure 10, the thickness of the No. 8 coal seam in the Mizhi–Qingjian Block is significantly greater than that of the No. 5 coal seam. The former mainly ranges from 4 m to 10 m, locally >10 m (Figure 10a), while the latter is predominantly distributed between 0 and 6 m (Figure 10b). Furthermore, the development of both the No. 8 and No. 5 coal seams in the Mizhi area is generally better than that in the Qingjian Block, with greater coal seam thicknesses concentrated in the northern and central areas.

4.3.2. Splitting Patterns and Reservoir–Caprock Assemblage Characteristics

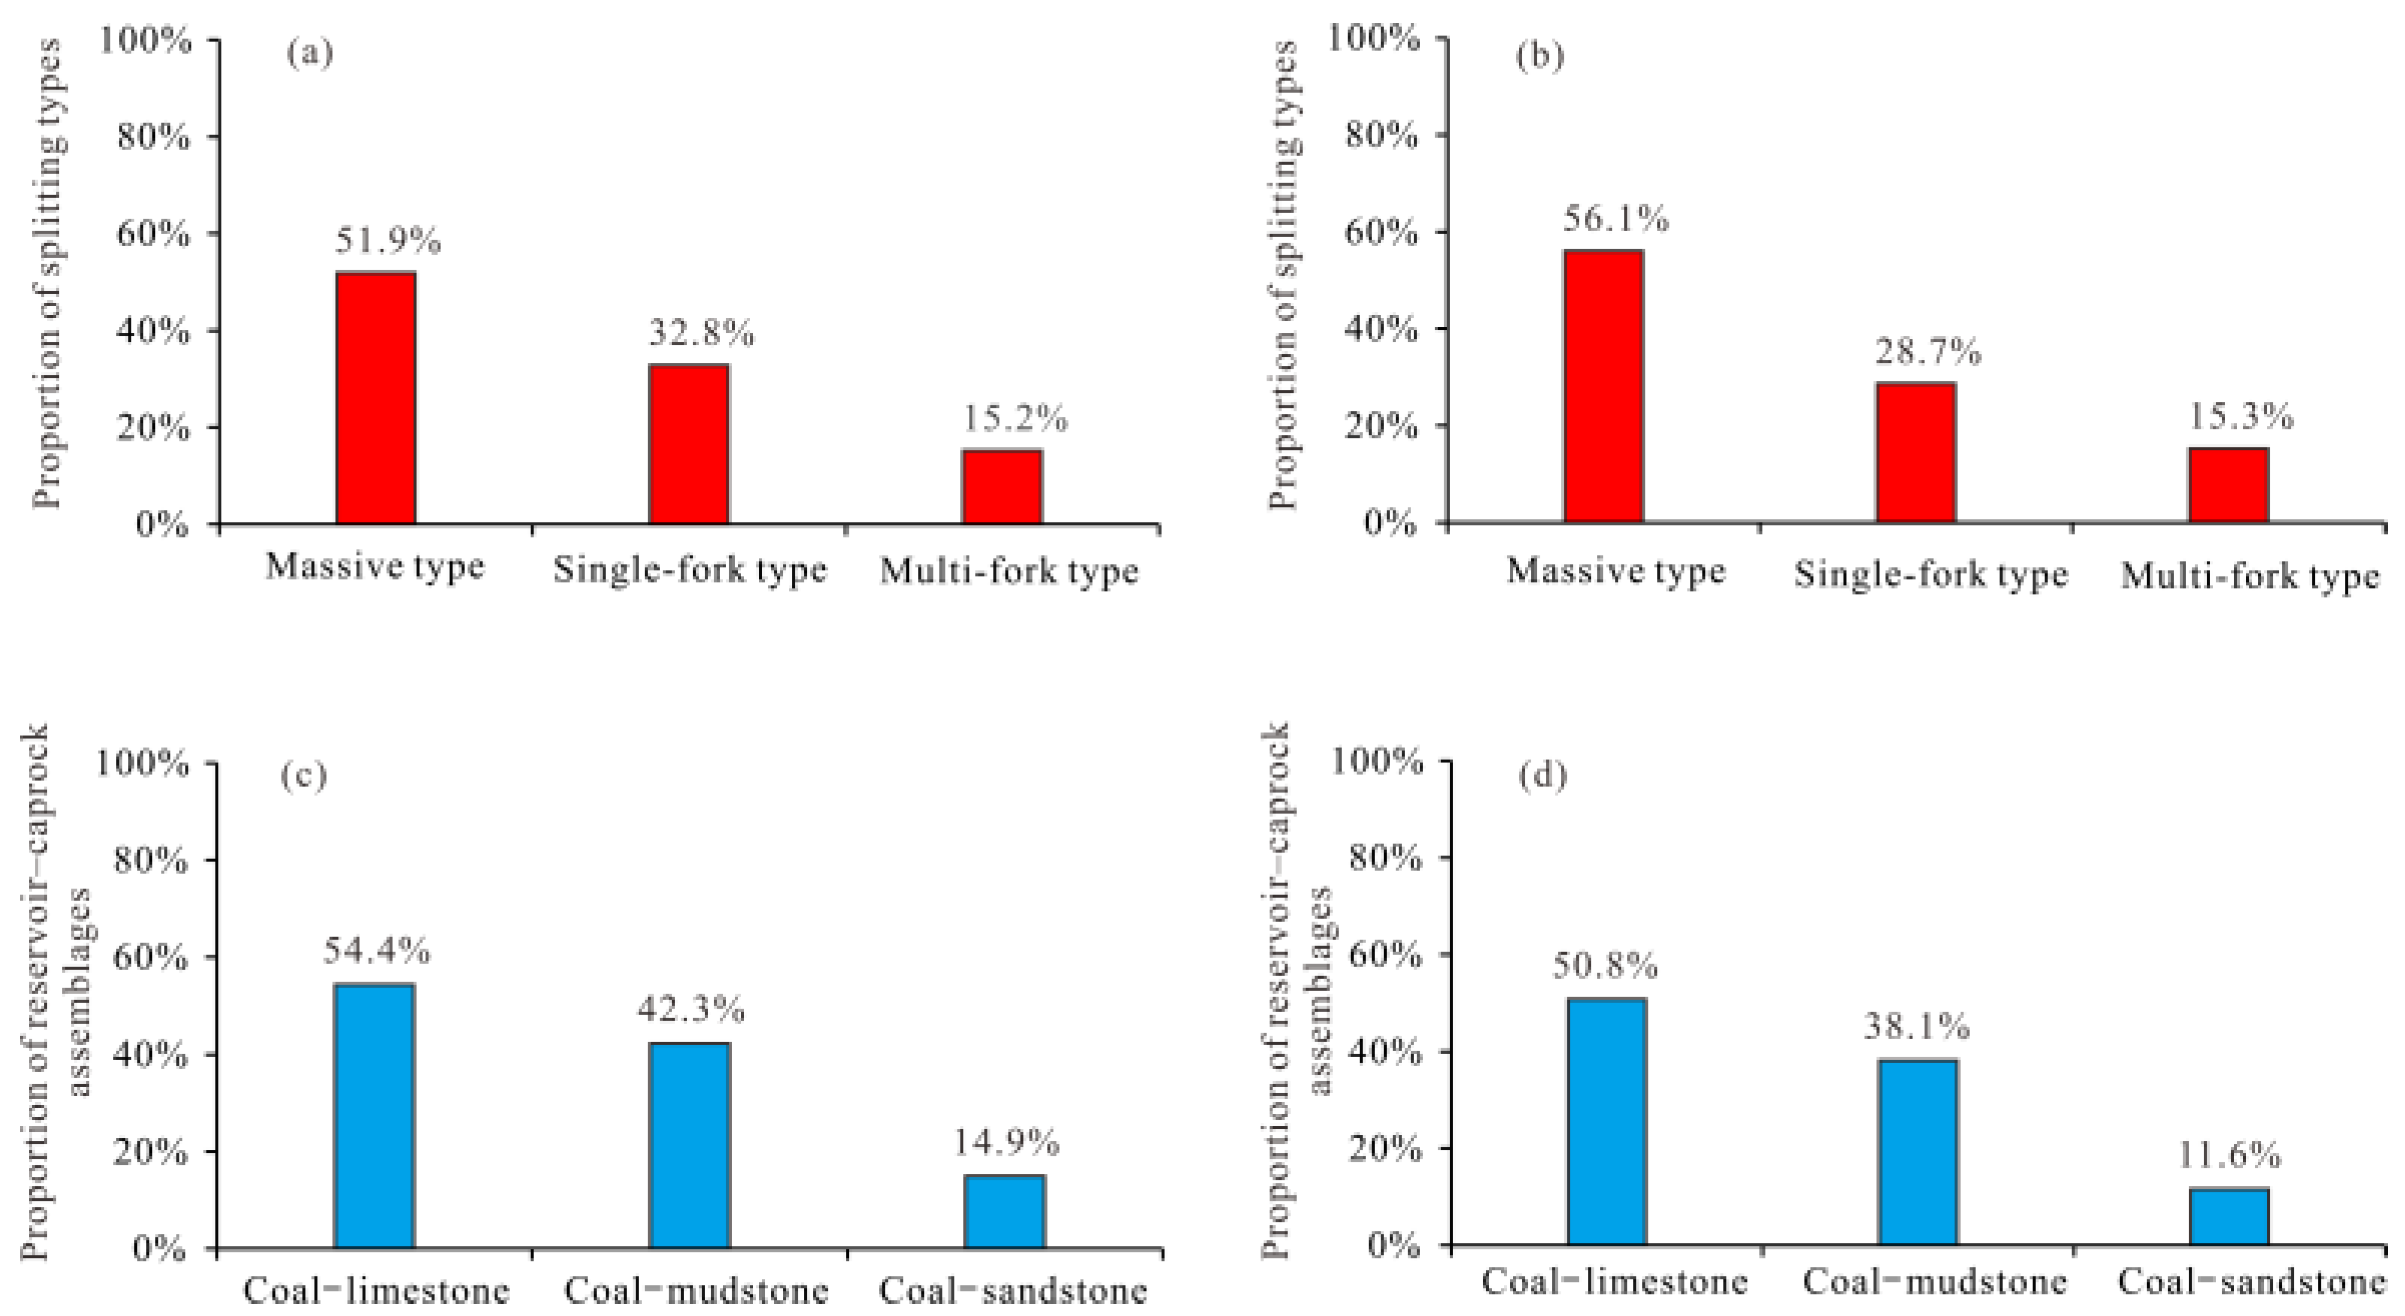
Based on well-logging data, this study statistically analyzed the 5# and 8# coal seam typing characteristics and reservoir-seal assemblages for each well in the Mizhi–Qingjian area. The coal seam types were classified into three categories: massive type (the coal seam occurs as a single integrated block), single-fork type (the coal seam is separated into two distinct blocks), and multi-fork type (the coal seam is separated into more than two distinct blocks). The reservoir-seal assemblages were classified into three types: coal-shale (direct contact between coal seam and shale), coal–mudstone (direct contact between coal seam and mudstone), and coal-sandstone (direct contact between coal seam and sandstone). The proportions of each type are shown in Figure 11.
The splitting patterns of coal seams in the Mizhi–Qingjian Block are relatively simple. The splitting structures of No. 8 and No. 5 coal seams are predominantly massive (accounting for 51.9% and 56.1%, respectively), followed by single-fork type (32.8% and 28.7%, respectively), with multi-fork type being the least common (15.2% and 15.3%, respectively) (Figure 11a,b). In addition, the reservoir–caprock assemblages of No. 8 and No. 5 coal seams are also dominated by coal–limestone assemblages (accounting for 54.4% and 50.8%, respectively), followed by coal–mudstone assemblages (42.3% and 38.1%, respectively). Coal–sandstone assemblages are only locally developed (14.9% and 11.6%, respectively) (Figure 11c,d).

4.4. Distribution Patterns and Models of Gas and Water

Due to the complex geological structure of the Qingjian Block, the TSM reservoirs are thin, sandstones are poorly developed, and each sub-layer exhibits varying degrees of water content, which poses significant adverse effects on natural gas development. Therefore, the most important aspect of natural gas development in the Qingjian Block is how to identify gas layers versus water zones. Taking the Qingjian Block as an example, this section describes the gas–water distribution characteristics and analyzes its genesis.

4.4.1. Identification of Gas and Water Layers

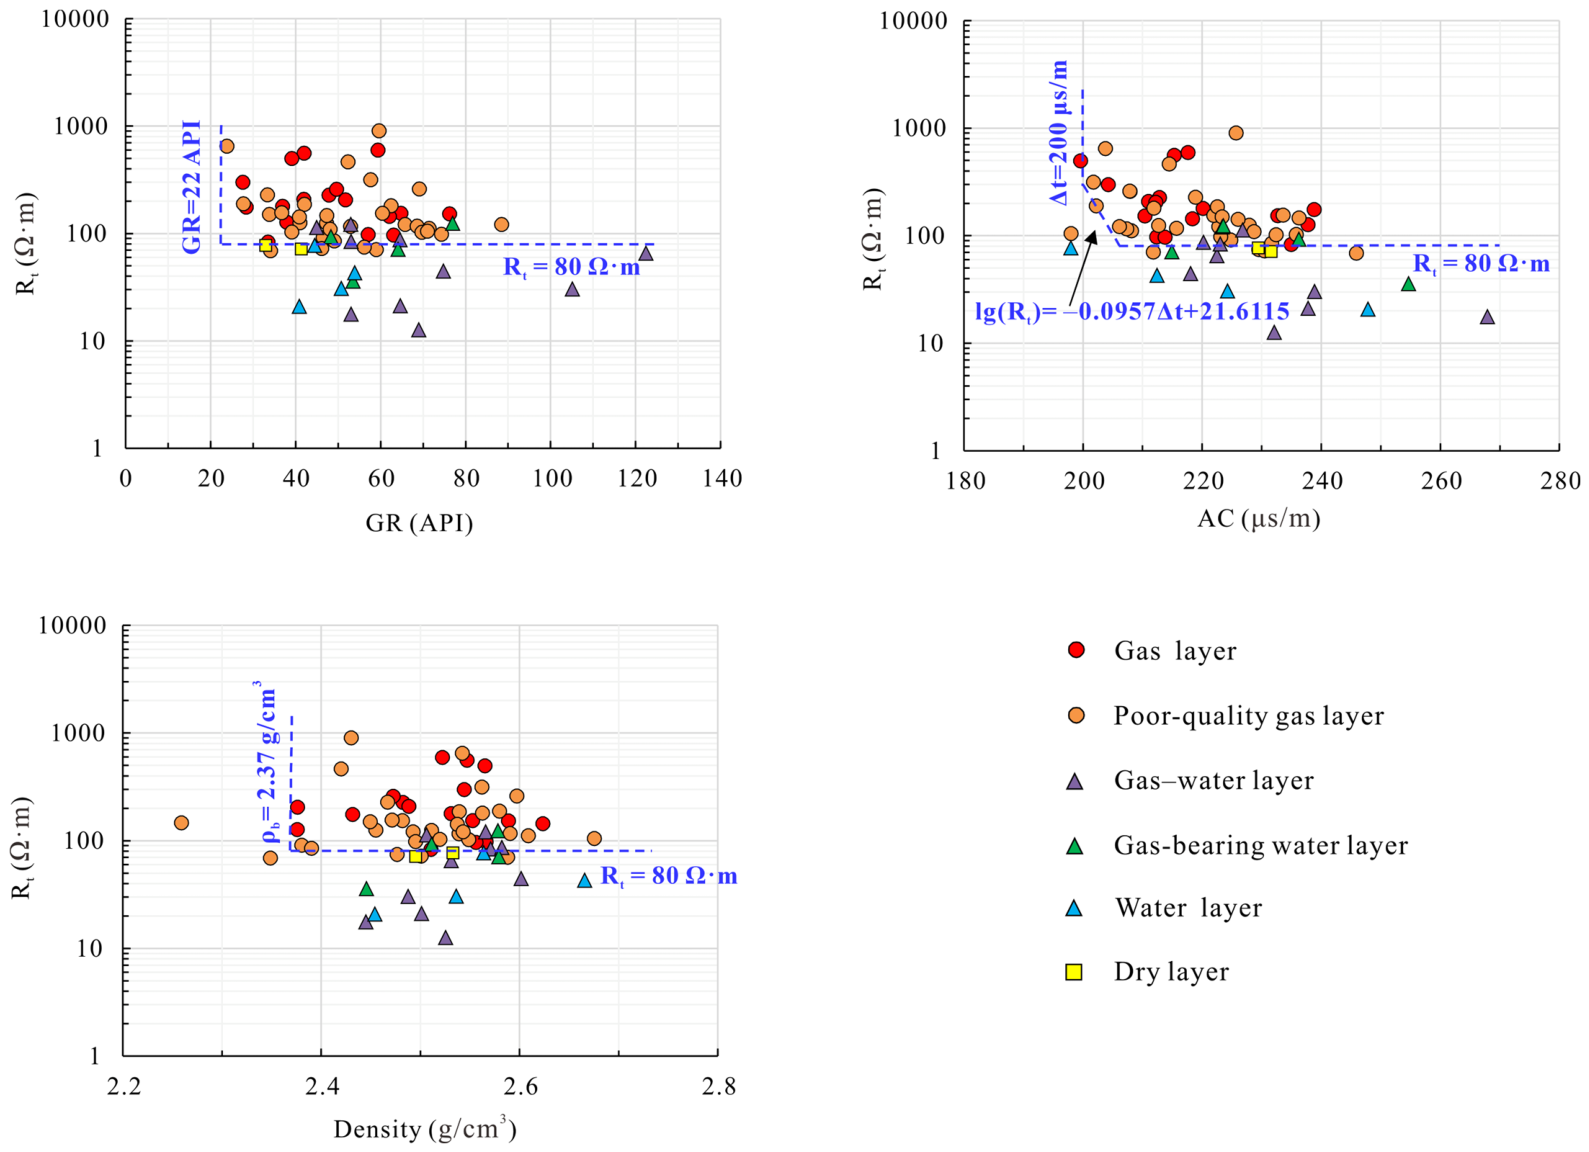
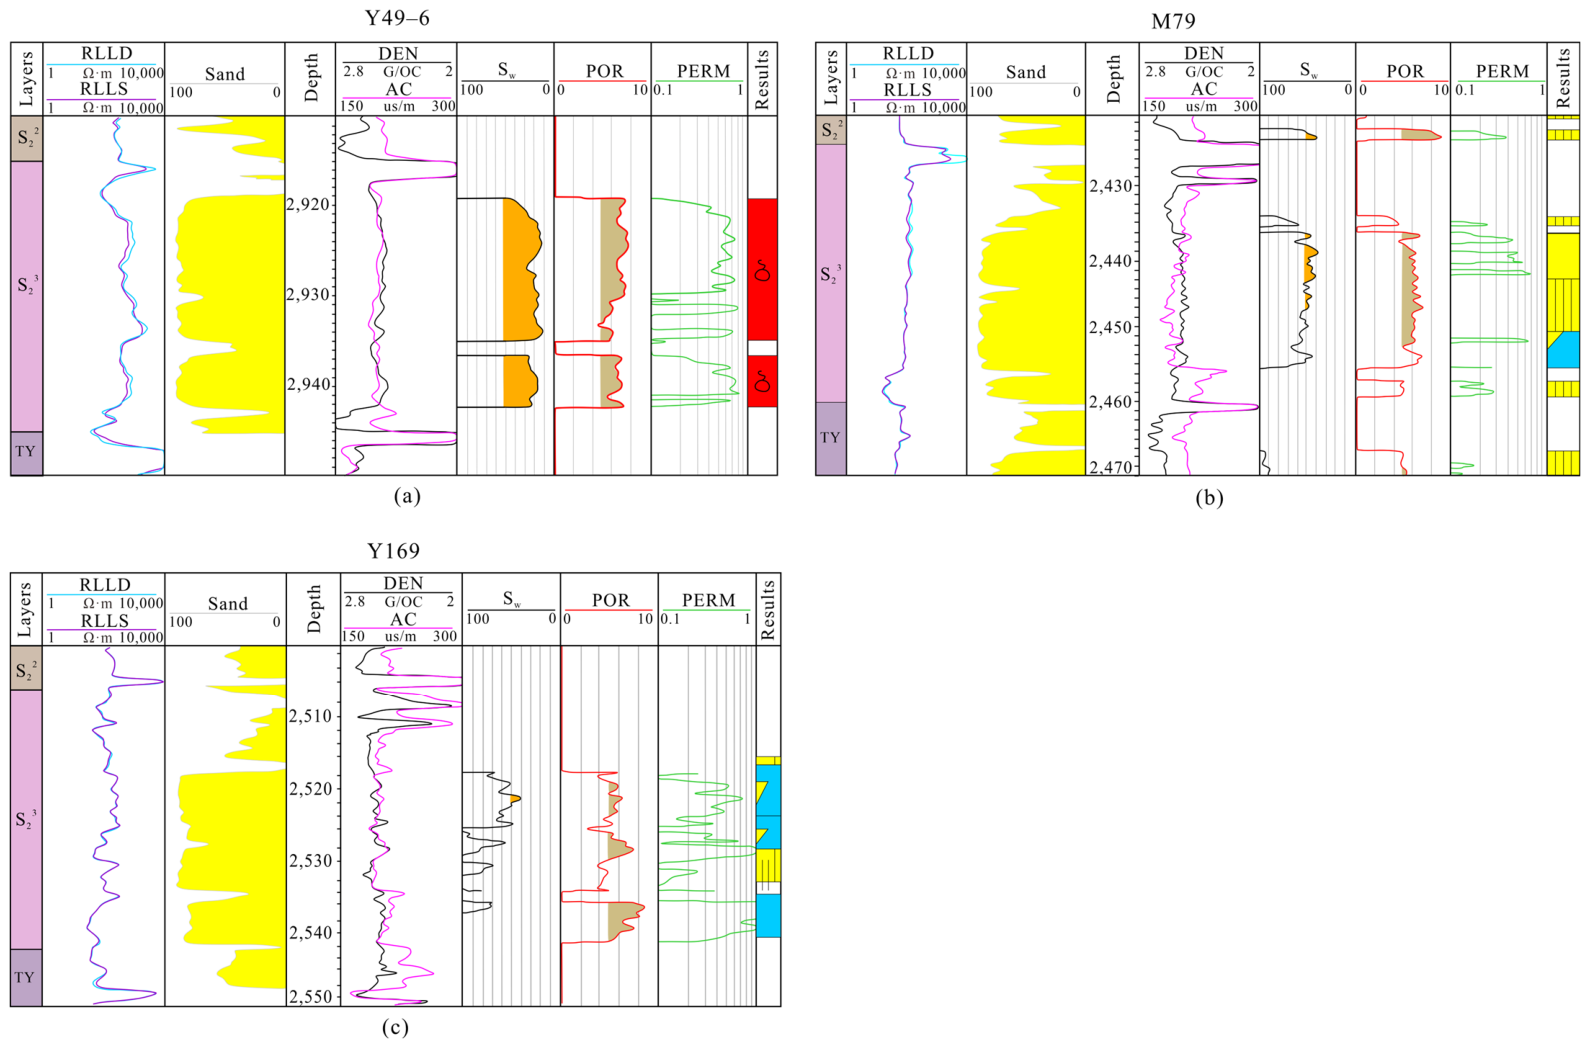
The identification of gas and water layers can provide reliable perforation intervals for new development wells, and improving the accuracy of gas–water layer identification is key to effective production and enhanced recovery. Using well-test data, logging data, and dynamic data, the BX Fm–H8 Mb samples in the Qingjian Block were selected. Cross-plot methods were employed to identify gas layers (poor-quality gas layers) versus water zones (gas–water transition zones and gas-bearing water layers). As shown in Figure 12, gas layers: Rt ≥ 80 Ω·m, GR ≥ 22 API, ρb ≥ 2.37 g/cm3, Sw ≤ 45%. When the acoustic travel time is between 200 μs/m and 210 μs/m, the condition requires lg Rt ≥ 21.6115 − 0.0957Δt. Water zones: Rt ≤ 80 Ω·m, GR ≤ 22 API, ρb ≤ 2.37 g/cm3, Sw ≥ 55%. When the acoustic travel time is between 200 μs/m and 210 μs/m, the condition requires lg Rt ≤ 21.6115 − 0.0957Δt. For water zones, Sw ≥ 80%.

4.4.2. Distribution Characteristics and Models of Gas and Water

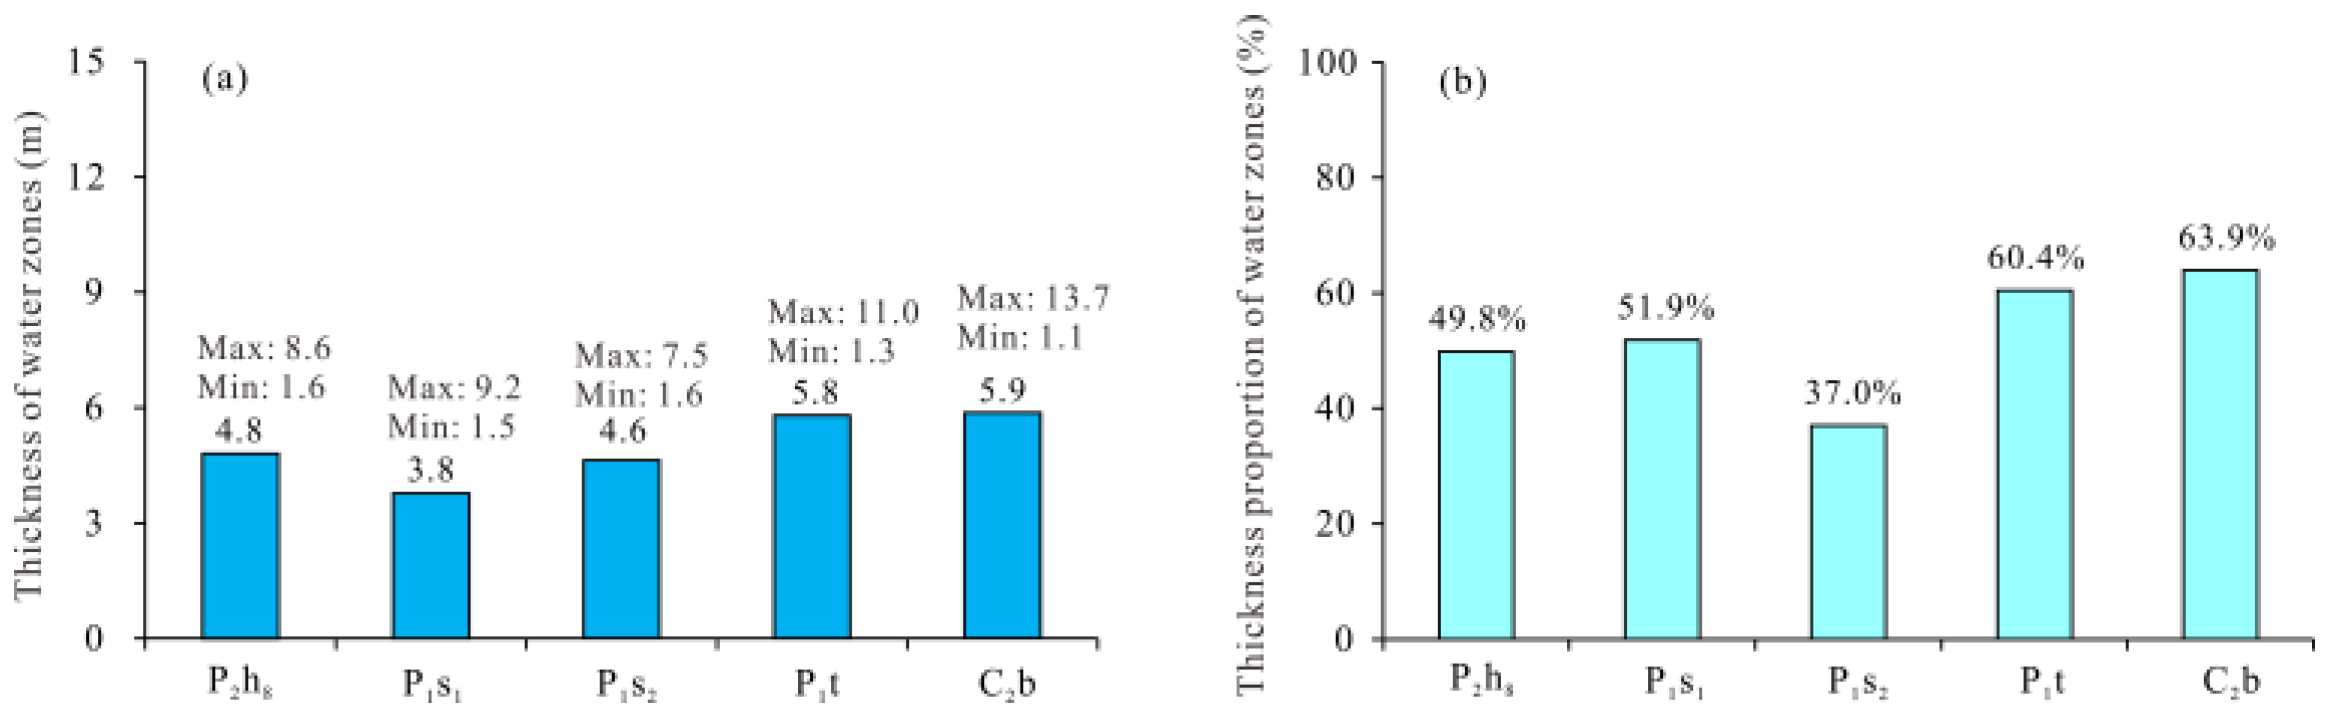
Statistical data show that in the Qingjian Block, the water zones in the TY and BX Fms are not only thick but also account for a high proportion. The average thicknesses of water zones in the TY and BX Fms are 5.8 m and 5.9 m, respectively, with thickness proportions of 60.4% and 63.9%, respectively. In the H8, S1, and S2 Mbs, the average thicknesses of water zones are 4.8 m, 3.8 m, and 4.6 m, respectively, with thickness proportions of 49.8%, 51.9%, and 37.0%, respectively (Figure 13).
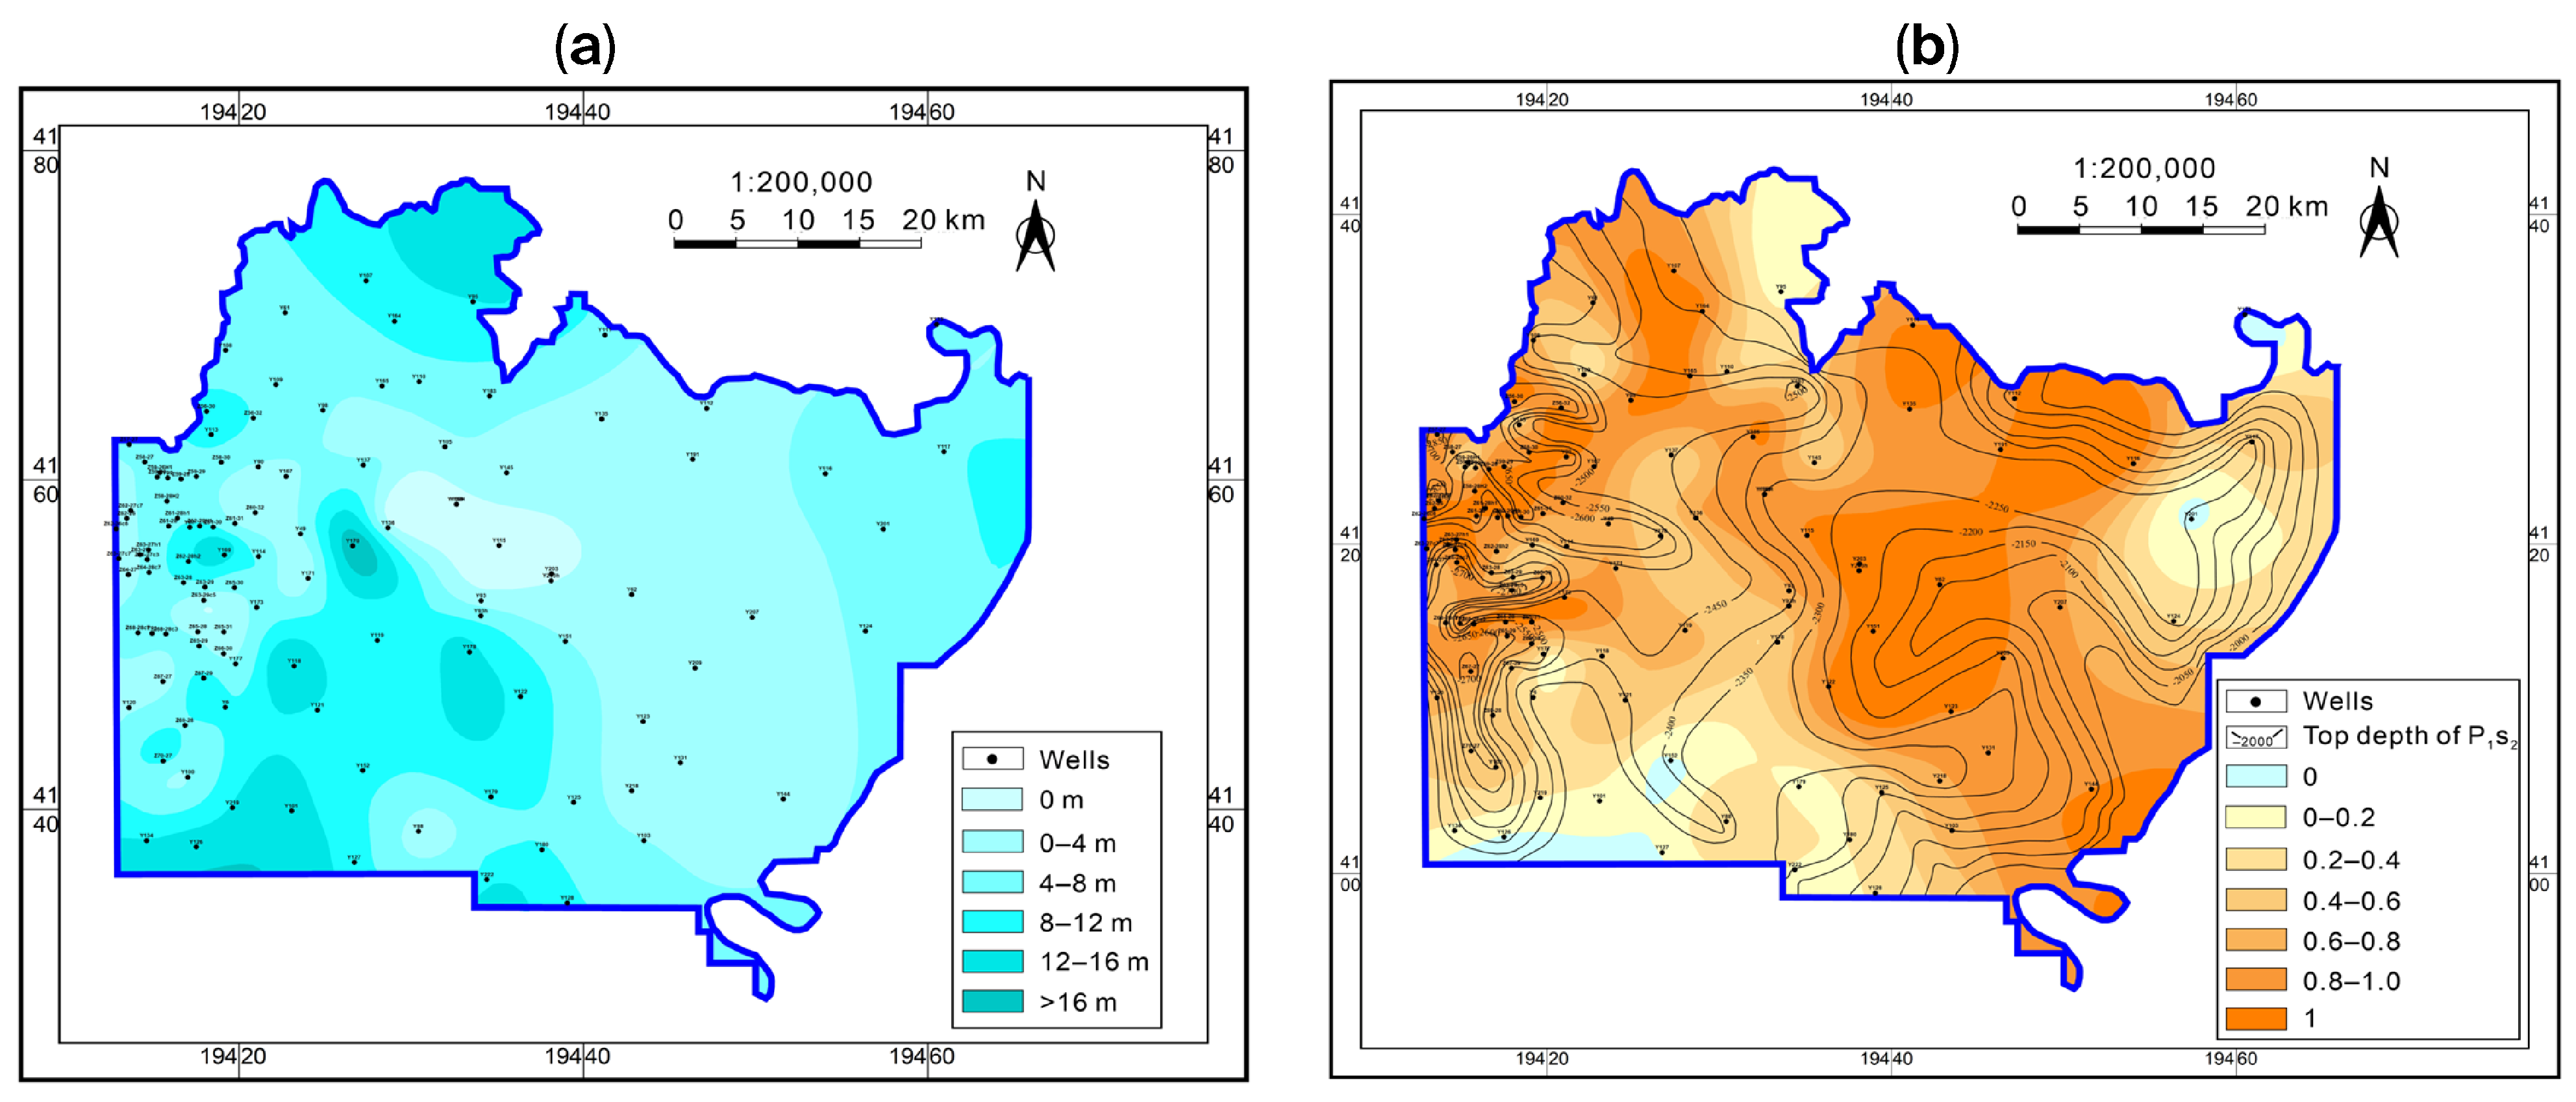
Water zones are widely distributed in the Qingjian Block, with thicknesses predominantly ranging from 4 m to 8 m. In the southwestern area, thicknesses are greater, locally > 16 m (Figure 14a). The proportion of gas layers is mainly distributed between 40% and 60%, and only falls below 20% in localized areas such as the southern and northeastern areas (Figure 14b). Microstructures play a significant controlling role in the development of effective reservoirs in the Qingjian Block. At relatively structurally high positions within the area, effective reservoirs are more developed (Figure 14b). Therefore, under current technological conditions, nose-like structural highs developed in water-bearing TSM reservoir areas should be considered as preferred targets for well placement [34].
Based on the gas–water distribution patterns in the Qingjian Block, three types of gas–water distribution models are summarized in this paper: high gas content, multi-type coexistence, and high water content spatial distribution models (Figure 15). In the high gas content distribution model, the thickness proportion of gas layers plus poor-quality gas layers exceeds 80%. This model occurs in areas where multiple factors converge, including structurally high positions, favorable reservoir physical properties, high source rock hydrocarbon generation intensity, and long distances from fault systems. Such areas are target zones for favorable production development (Figure 15a). In the multi-type coexistence model, the thickness proportion of gas layers plus poor-quality gas layers ranges from 20% to 80% (average = 50%). This model occurs in zones between the pure gas area and the high water content area, where gas layers, gas–water layers (including gas-bearing water layers), and water layers are intermingled in a complex distribution, presenting high development risks and difficulties (Figure 15b). In the high water content model, the thickness proportion of water layers + gas–water layers (including gas-bearing water layers) exceeds 80%. This model occurs in areas characterized by structurally low positions, poor reservoir physical properties, low source rock hydrocarbon generation intensity, and proximity to fault systems, and has no development value (Figure 15c).

5. Discussion

5.1. Resource Potential

Based on Equation (1), the TSM resources of each interval can be calculated. As shown in Table 1, the total identified recoverable TSM resources in the five intervals (H8 Mb, S1 Mb, S2 Mb, TY Fm, and BX Fm) of the Mizhi–Qingjian Block are 1962.72 × 108 m3, with a superimposed gas-bearing area of 2090.63 km2 and an average abundance of 0.94 × 10⁸ m3/km2. Among these, the H8 Mb has identified recoverable TSM resources of 972.82 × 10⁸ m3/km2, a superimposed gas-bearing area of 1753.17 km2, and an average abundance of 0.55 × 10⁸ m3/km2; the S1 Mb has 285.94 × 10⁸ m3, 872.69 km2, and 0.33 × 10⁸ m3/km2; the S2 Mb has 360.01 × 10⁸ m3, 695.34 km2, and 0.52 × 10⁸ m3/km2; the TY Fm has 221.60 × 10⁸ m3, 380.50 km2, and 0.56 × 10⁸ m3/km2; the BX Fm has 121.59 × 10⁸ m3, 358.75 km2, and 0.34 × 10⁸ m3/km2. Compared with the TY and BX Fms, the H8 Mb and SX Fm have significantly higher TSM resources, indicating greater development potential.
Furthermore, compared with the Mizhi Block, the Qingjian Block has significantly lower TSM resources and abundances in each interval. The Mizhi area has total identified recoverable TSM resources of 1519.44 × 108 m3, a superimposed gas-bearing area of 1402.28 km2, and an average abundance of 1.08 × 10⁸ m3/km2; the Qingjian Block has total identified recoverable TSM resources of 443.28 × 10⁸ m3, a superimposed gas-bearing area of 688.35 km2, and an average abundance of 0.64 × 10⁸ m3/km2.
Based on Equation (2), the total deep CBM resources of No. 5 and No. 8 coal seams in the Mizhi–Qingjian block are estimated to be 9974.31 × 108 m3. Among them, the CBM resources of the No. 8 seam are considerably higher than those of the No. 5 seam, with the No. 8 seam accounting for 7857.44 × 108 m3 and the No. 5 seam accounting for 2116.87 × 108 m3 (Table 2). In addition, the CBM resources in the Mizhi area are also significantly higher than those in the Qingjian area. In the former, the CBM is mainly distributed in the 6–10 m interval, with resources of 6971.15 × 108 m3, while in the latter, it is mainly distributed at depths shallower than 6 m, with resources of 3003.16 × 108 m3 (Table 2).

5.2. Enrichment Areas

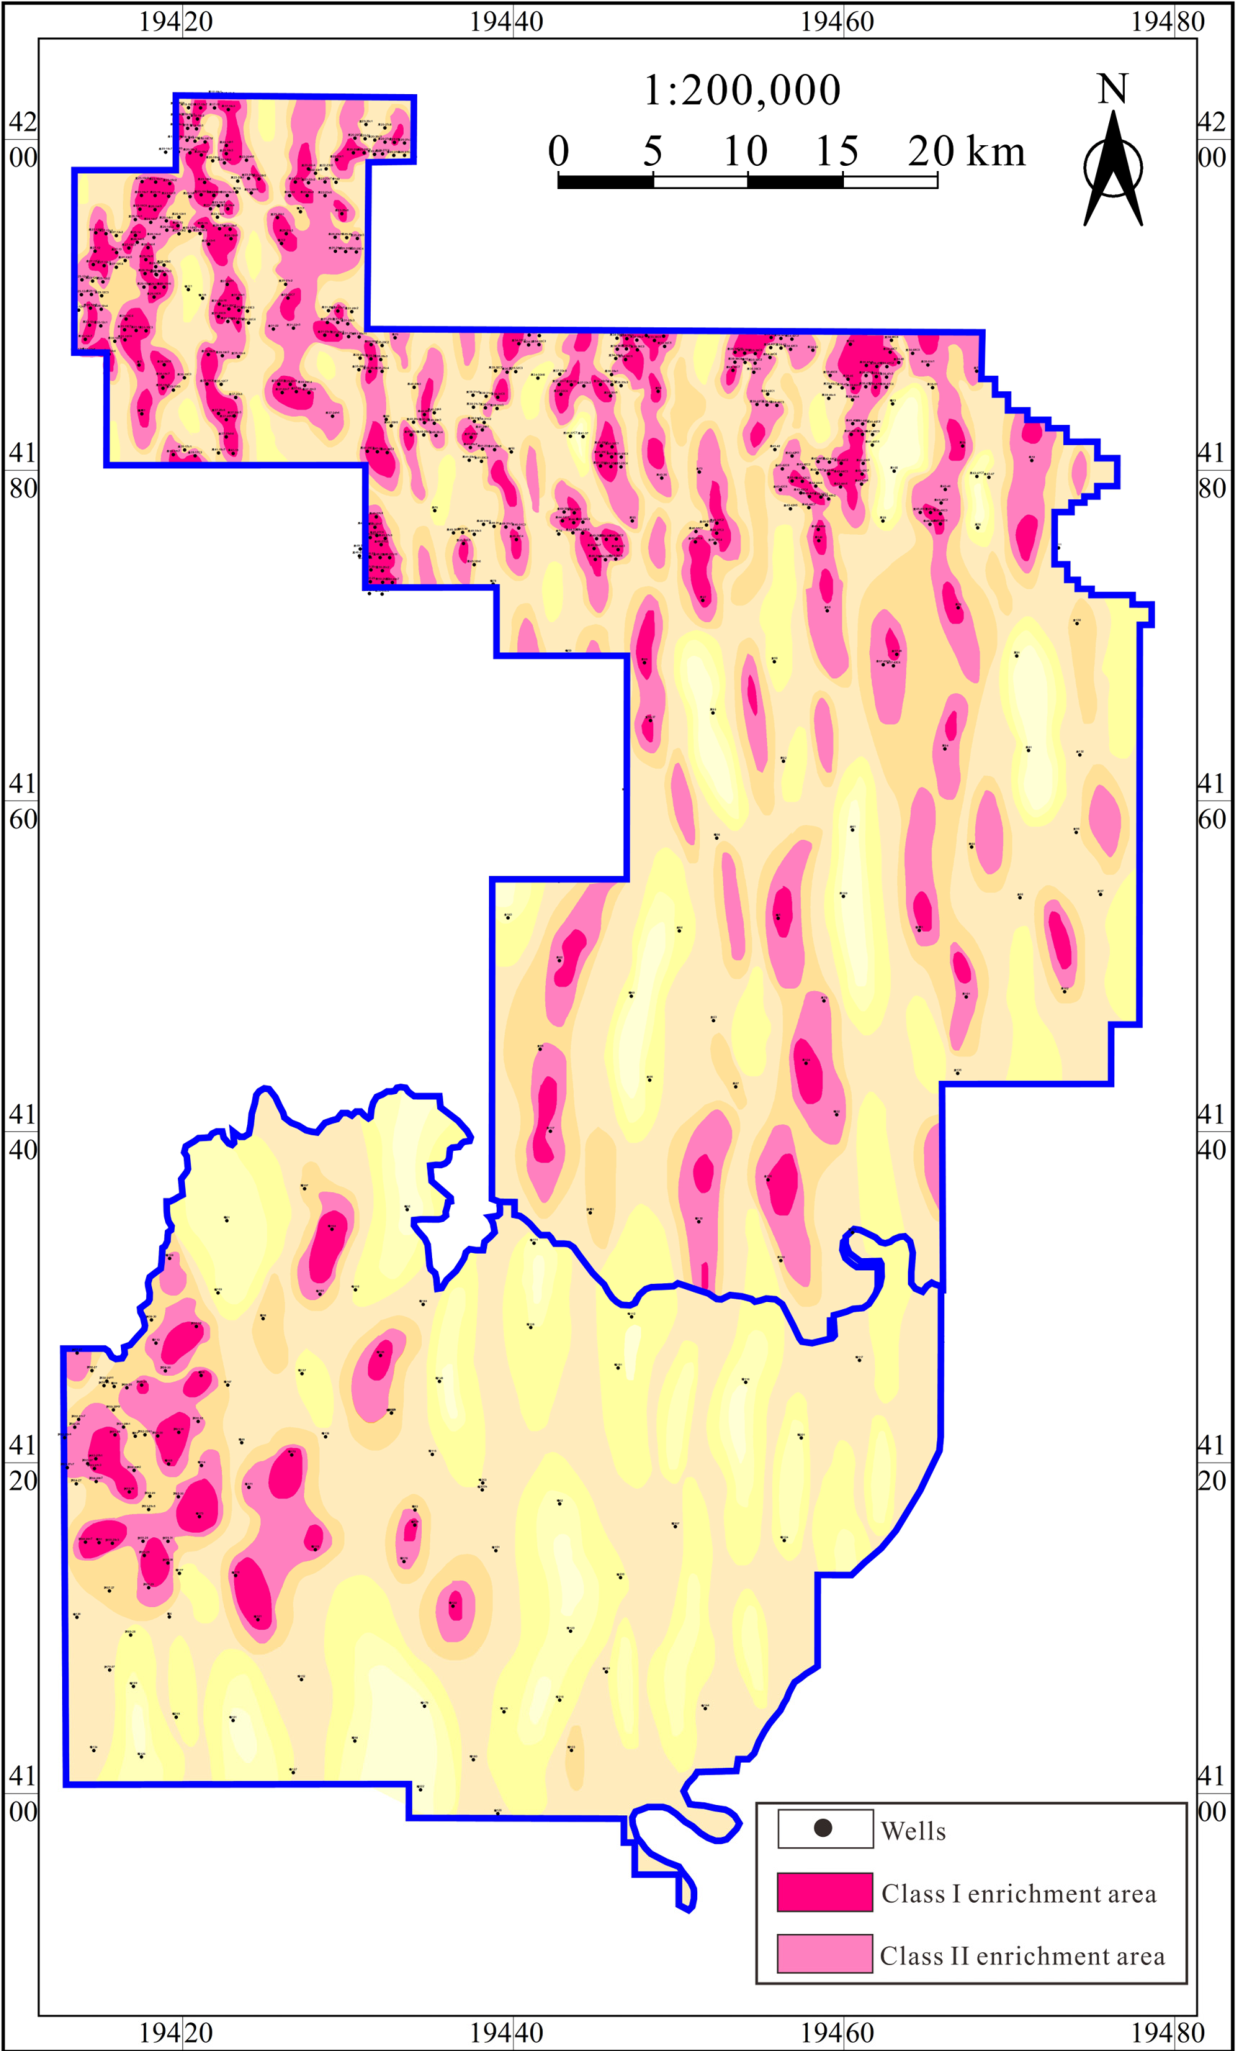
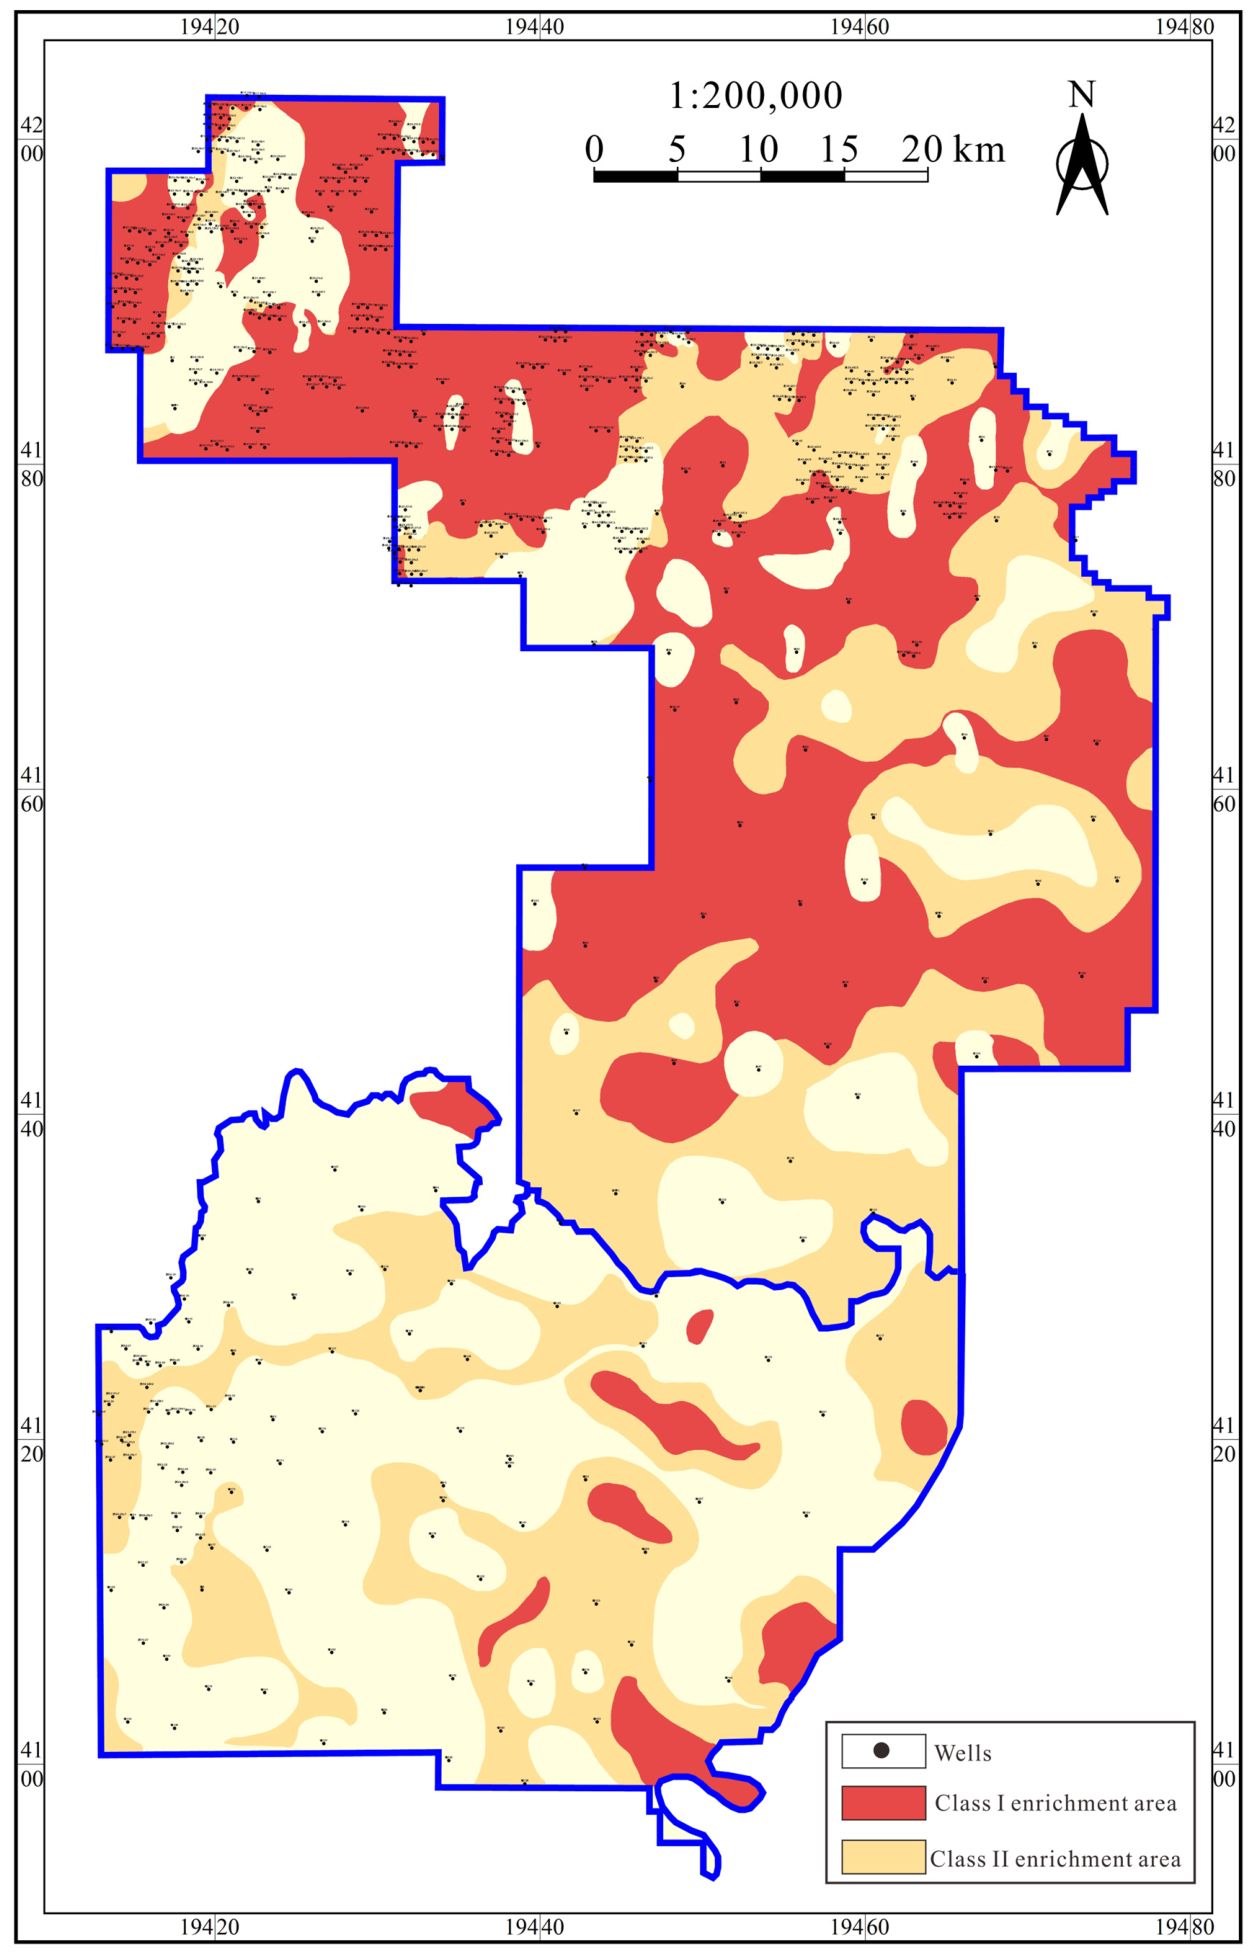
The enrichment areas of BX Fm–H8 Mb TSM in the Mizhi–Qingjian Block are shown in Figure 16. It can be observed that the enrichment areas of TSM are mainly distributed in the northern area of Mizhi Block, while relatively few are found in the Qingjian Block. Based on Equation (1), the TSM resources of Class I and Class II enrichment areas in the Mizhi–Qingjian Block were evaluated. The results show that in the Mizhi–Qingjian Block, the Class I TSM has a resource volume of 301.23 × 10⁸ m3, an area of 209.16 km2, and an abundance of 1.44 × 10⁸ m3/km2; the Class II TSM has a resource volume of 604.24 × 10⁸ m3, an area of 576.94 km2, and an abundance of 1.05 × 10⁸ m3/km2 (Table 3). Furthermore, compared with the Mizhi area, the TSM resources of the enrichment area in the Qingjian Block are significantly lower. In the Mizhi area, the total of Class I + II TSM has a resource volume of 733.24 × 10⁸ m3, an area of 626.37 km2, an abundance of 1.17 × 10⁸ m3/km2; in the Qingjian Block, the Class I + II TSM has a resource volume of 172.23 × 10⁸ m3, an area of 159.73 km2, an abundance of 1.08 × 10⁸ m3/km2.
Furthermore, based on the thickness of the No. 8 coal seam in the Mizhi–Qingjian Block, the degree of thermal evolution, average gas content, and porosity, combined with reservoir–caprock assemblage characteristics, an evaluation standard for favorable areas of No. 8 deep CBM is established (Table 4), classifying the favorable areas into Class I and Class II favorable areas.
The enrichment areas of No. 8 deep CBM in the Mizhi–Qingjian Block are shown in Figure 17. It can be observed that the enrichment areas of deep CBM are mainly distributed in the northern and central areas of Mizhi Block, while only sporadic occurrences are found in the Qingjian Block. Based on Equation (2), the resources of Class I and Class II deep CBM in the Mizhi–Qingjian Block were evaluated. The results show that in the Mizhi–Qingjian Block, the Class I enrichment area has a resource volume of 3180.74 × 108 m3, an area of 1221.79 km2, and an abundance of 2.57 × 10⁸ m3/km2; the Class II enrichment area has a resource volume of 2323.09 × 108 m3, an area of 1238.51 km2, and an abundance of 1.90 × 10⁸ m3/km2 (Table 3). Furthermore, compared with the Mizhi area, the No. 8 deep CBM in the Qingjian Block is significantly lower. In the Mizhi area, the total Class I + II No. 8 deep CBM volume is 4384.32 × 108 m3, covering an area of 1854.76 km2, with an abundance of 2.36 × 10⁸ m3/km2; in the Qingjian Block, the Class I + II No. 8 deep CBM volume is 1119.51 × 108 m3, covering an area of 605.54 km2, with an abundance of 1.85 × 10⁸ m3/km2.

5.3. Stacking Patterns and Synergistic Development Strategies of Sandstones and Coals

Deep CBM and TSM share the same source but occur in different reservoirs, and can accumulate in stacked form across different strata within the same block [35]. Deep CBM is generally characterized by integrated source–reservoir accumulation, containing both adsorbed gas and free gas, but dominated by adsorbed gas. In contrast, TSM accumulates through near-source migration and is dominated by free gas [36,37,38,39,40,41]. Zhao et al. [42] and Yang et al. [43] suggest that before large-scale gas expulsion, natural gas mainly occurs in coal seams and carbonaceous mudstones in adsorbed and compressed free states. When tectonic uplift, stratigraphic denudation, or tectonic thermal events occur, the temperature–pressure system of the coal measures undergoes strong changes, triggering large-scale desorption of adsorbed gas, which then migrates in the free state through volumetric flow and diffusion into tight sandstones to form accumulations. Therefore, in areas with high-quality coal-measure source rocks, favorable conditions such as high hydrocarbon generation intensity, high expulsion capacity, and good preservation can lead to the formation of not only deep CBM enrichment areas but also TSM enrichment areas with development value.

5.3.1. Stacking Patterns of Sandstone–Coal Seams

In the Mizhi area, TSM reservoirs have low water content, deep CBM reservoirs are thick, and the overall resource quality is relatively high. However, in the Qingjian Block, TSM reservoirs are extensively water-bearing, deep CBM reservoirs are relatively thin, and the overall resource volume is low. By co-producing TSM and deep CBM, the natural gas production per well can be significantly increased compared to single-production modes, thereby maximizing economic and resource benefits. Taking the No. 8 coal seam as an example, this paper classifies the stacking patterns of TSM and deep CBM into two major categories and eight types. In the Mizhi area, the dominant pattern is the high-gas-content TSM–high-quality deep CBM stacking pattern, which is further subdivided into four subtypes: TSM–deep CBM dual enrichment, TSM-only enrichment, deep CBM-only enrichment, and TSM–deep CBM dual non-enrichment stacking patterns. In the Qingjian Block, the dominant pattern is the high-water-content TSM–low-quality deep CBM stacking pattern, further subdivided into four subtypes: TSM–deep CBM dual enrichment, water-bearing TSM-only enrichment, deep CBM-only enrichment, and TSM–deep CBM dual non-enrichment stacking patterns (Table 5). Based on the stacking patterns described above, differentiated and efficient synergistic deployment strategies are proposed, and cost-effective co-production development technologies for sandstone and coal seam reservoirs are explored.

5.3.2. Well Pattern Deployment Mode

In response to the above stacking patterns, differentiated and efficient synergistic deployment strategies are proposed, and cost-effective co-production development technologies for sandstone and coal seam reservoirs are explored.
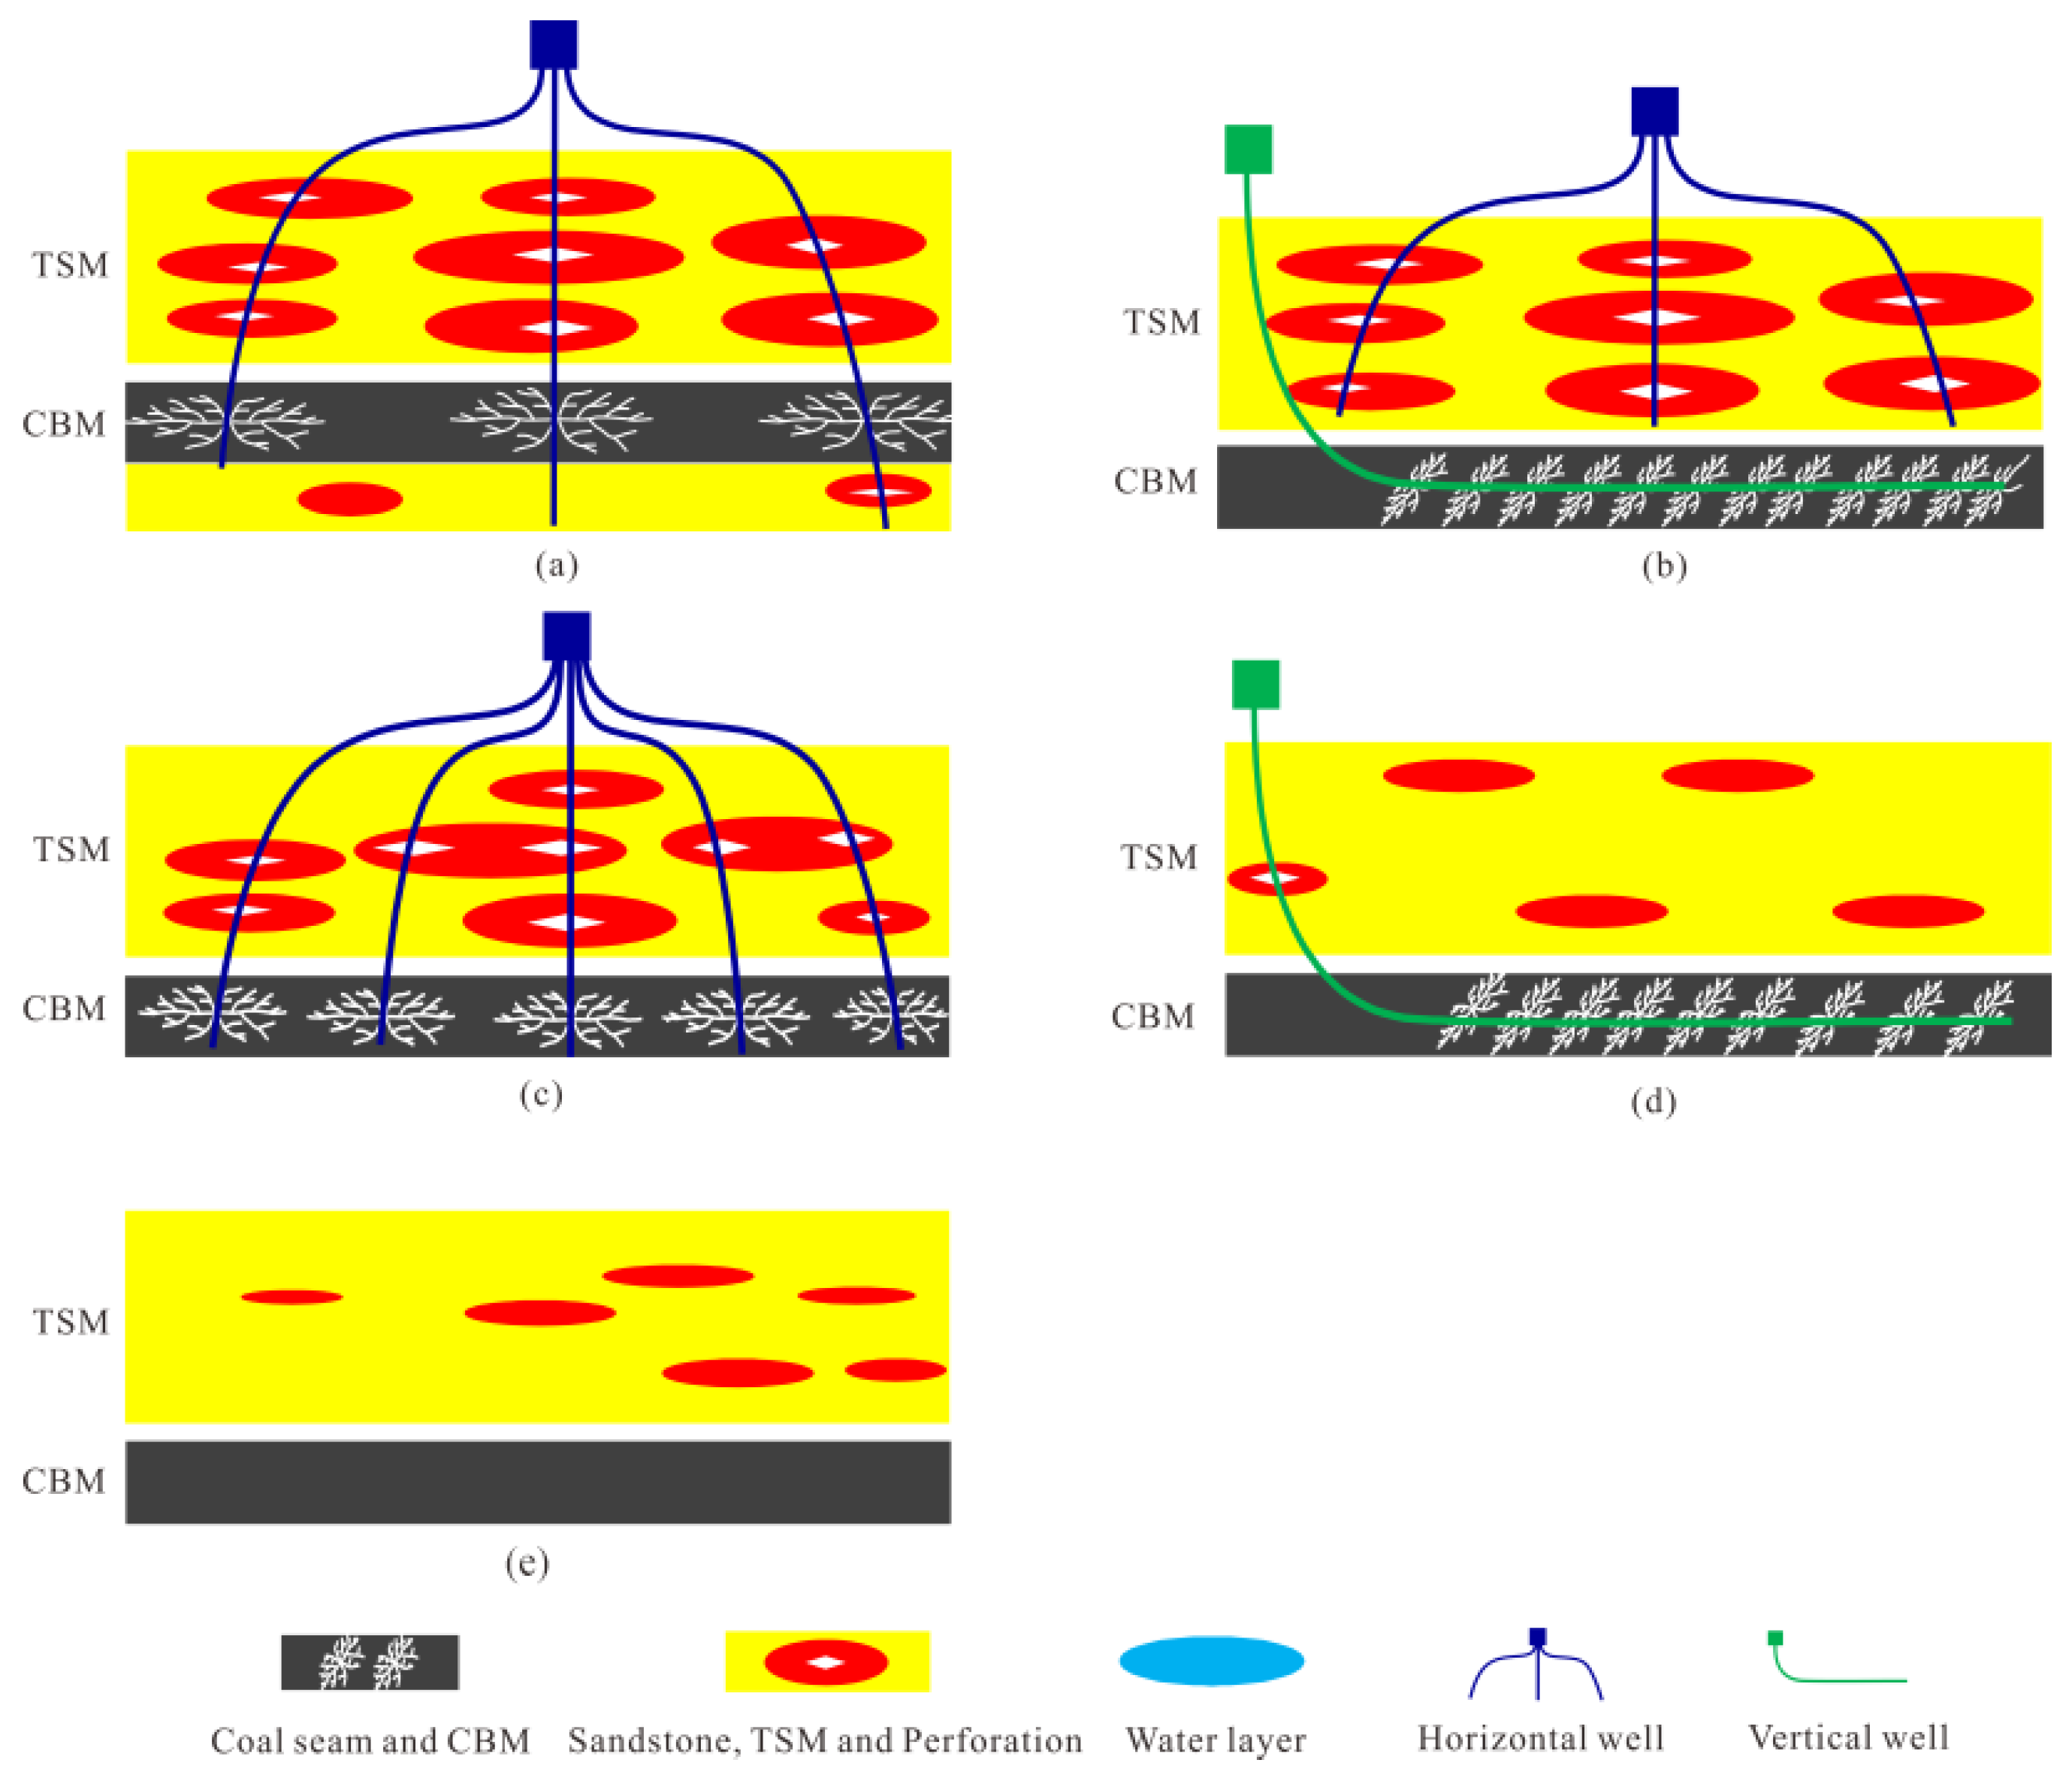
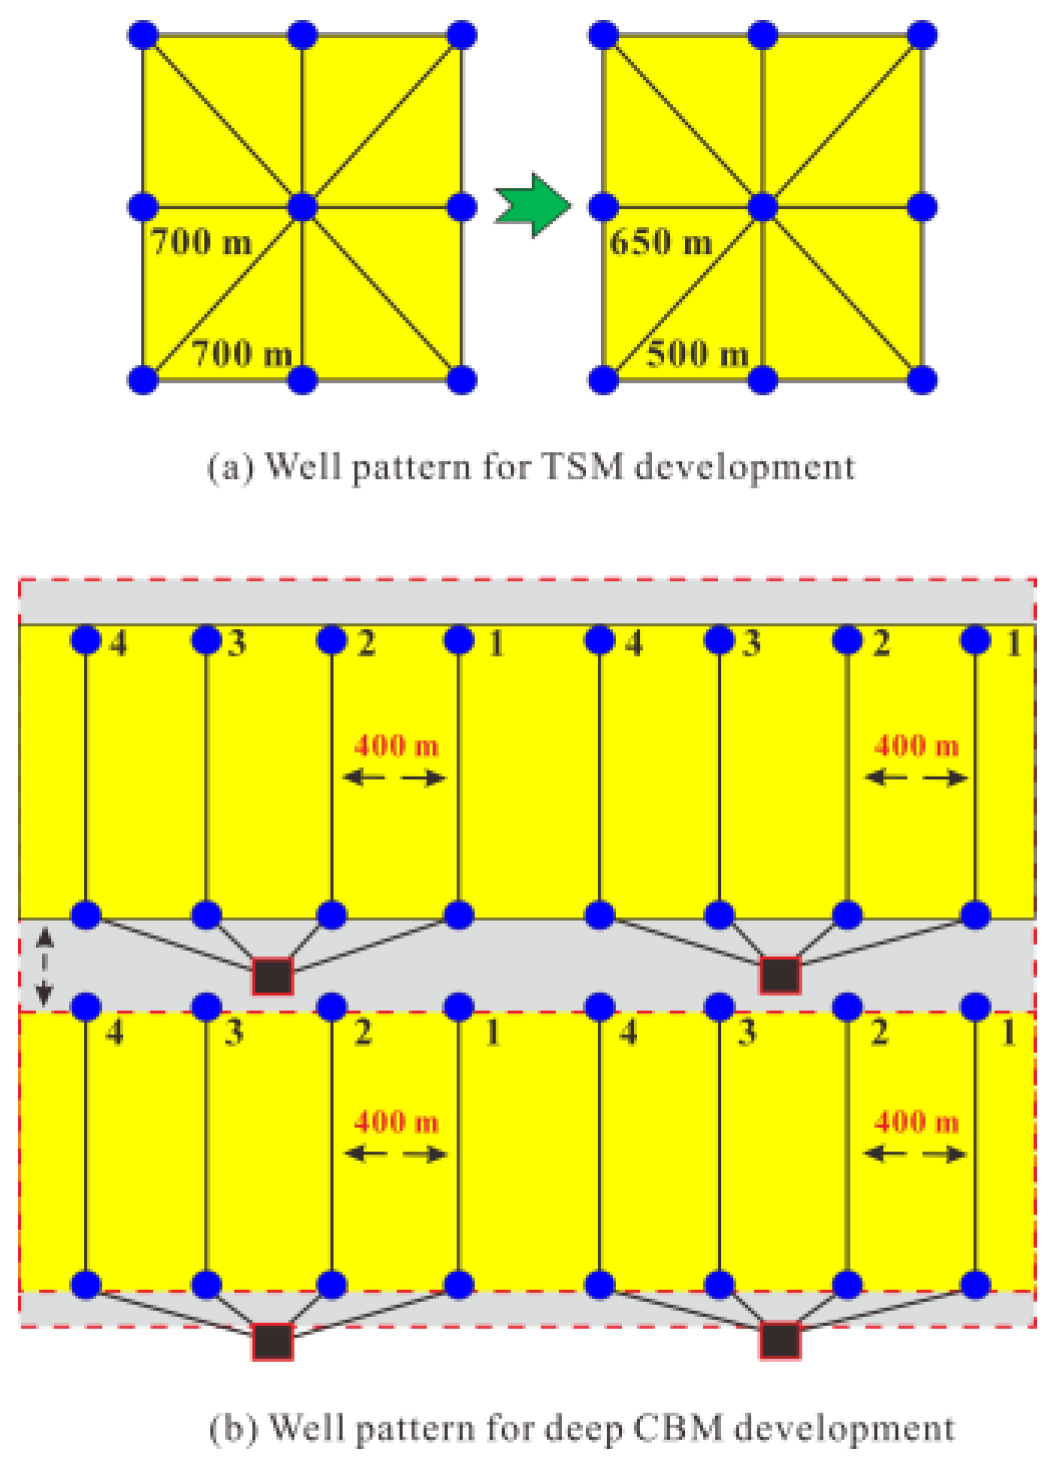
In the Mizhi area, the TSM–deep CBM dual enrichment zone accounts for 22% of the area, with effective superimposed sandstone thickness all >10 m (average = 16.5 m) and No. 8 coal seam thickness all > 5 m (average = 8.0 m) (Table 5). Based on the well pattern deployment status, the TSM–deep CBM dual enrichment zone can be divided into two types: areas where the No. 8 coal seam has already been developed and areas where it has not yet been developed. Statistics show that over 80% of development wells in the Mizhi area have drilled through the No. 8 coal seam. Therefore, in already developed areas, the TSM well pattern is relatively well established, mainly consisting of vertical and directional wells. When TSM well production approaches the abandonment rate, the existing TSM well pattern is utilized to produce the No. 8 coal seam (Figure 18a). For undeveloped areas, it is recommended to adopt two separate well patterns to develop TSM and deep CBM, respectively. TSM is developed using vertical and directional wells with a 500 × 650 m spacing, achieving a recovery factor of 35%. Meanwhile, deep CBM is developed using horizontal wells, and by optimizing well spacing and reducing row spacing, a recovery factor of 35% can also be achieved (Figure 18b and Figure 19).
In the Mizhi area, the TSM-only enrichment zone accounts for 7% of the area, with effective superimposed sandstone thickness all > 10 m (average = 19.7 m), and No. 8 coal seam thickness all < 5 m (average = 3.8 m) (Table 5). In this type of enrichment pattern, it is recommended to use vertical and directional wells for three-dimensional TSM development, while appropriately taking into account deep CBM production. The deep CBM well pattern density is 4–6 wells/km2, with a single-well deep CBM EUR of 516 × 104 m3 and a TSM EUR of 1313 × 104 m3, resulting in a total abundance of 1.96 × 10⁸ m3/km2. Under a deployment pattern with a well density of 5 wells/km2, the recovery factor can exceed 47% (Figure 18c).
In the Mizhi area, the deep CBM-only enrichment zone accounts for 58% of the area, with effective superimposed sandstone thickness all < 10 m (average = 6.6 m), and No. 8 coal seam thickness all > 5 m (average = 8.0 m) (Table 5). In this type of enrichment pattern, it is recommended to primarily develop deep CBM while appropriately taking into account TSM. Horizontal well patterns are adopted for deep CBM development, with a well spacing of 400 m and a horizontal section length of 1500 m. The single-well EUR ranges from 4500 × 104 m3 to 4800 × 104 m3, and the recovery factor ranges from 35% to 40%. The vertical sections of the horizontal wells are used to produce the TSM encountered during drilling (Figure 18d).
In the Mizhi area, the TSM–deep CBM dual non-enrichment zone accounts for 13% of the area, with effective superimposed sandstone thickness all < 10 m (average = 4.8 m), and No. 8 coal seam thickness all < 5 m (average = 3.4 m) (Table 5). The single-well recovery levels are 516 × 104 m3 for deep CBM and 505 × 104 m3 for TSM. The single-well EUR falls below the 6% internal rate of return standard, making development and production infeasible (Figure 18e).
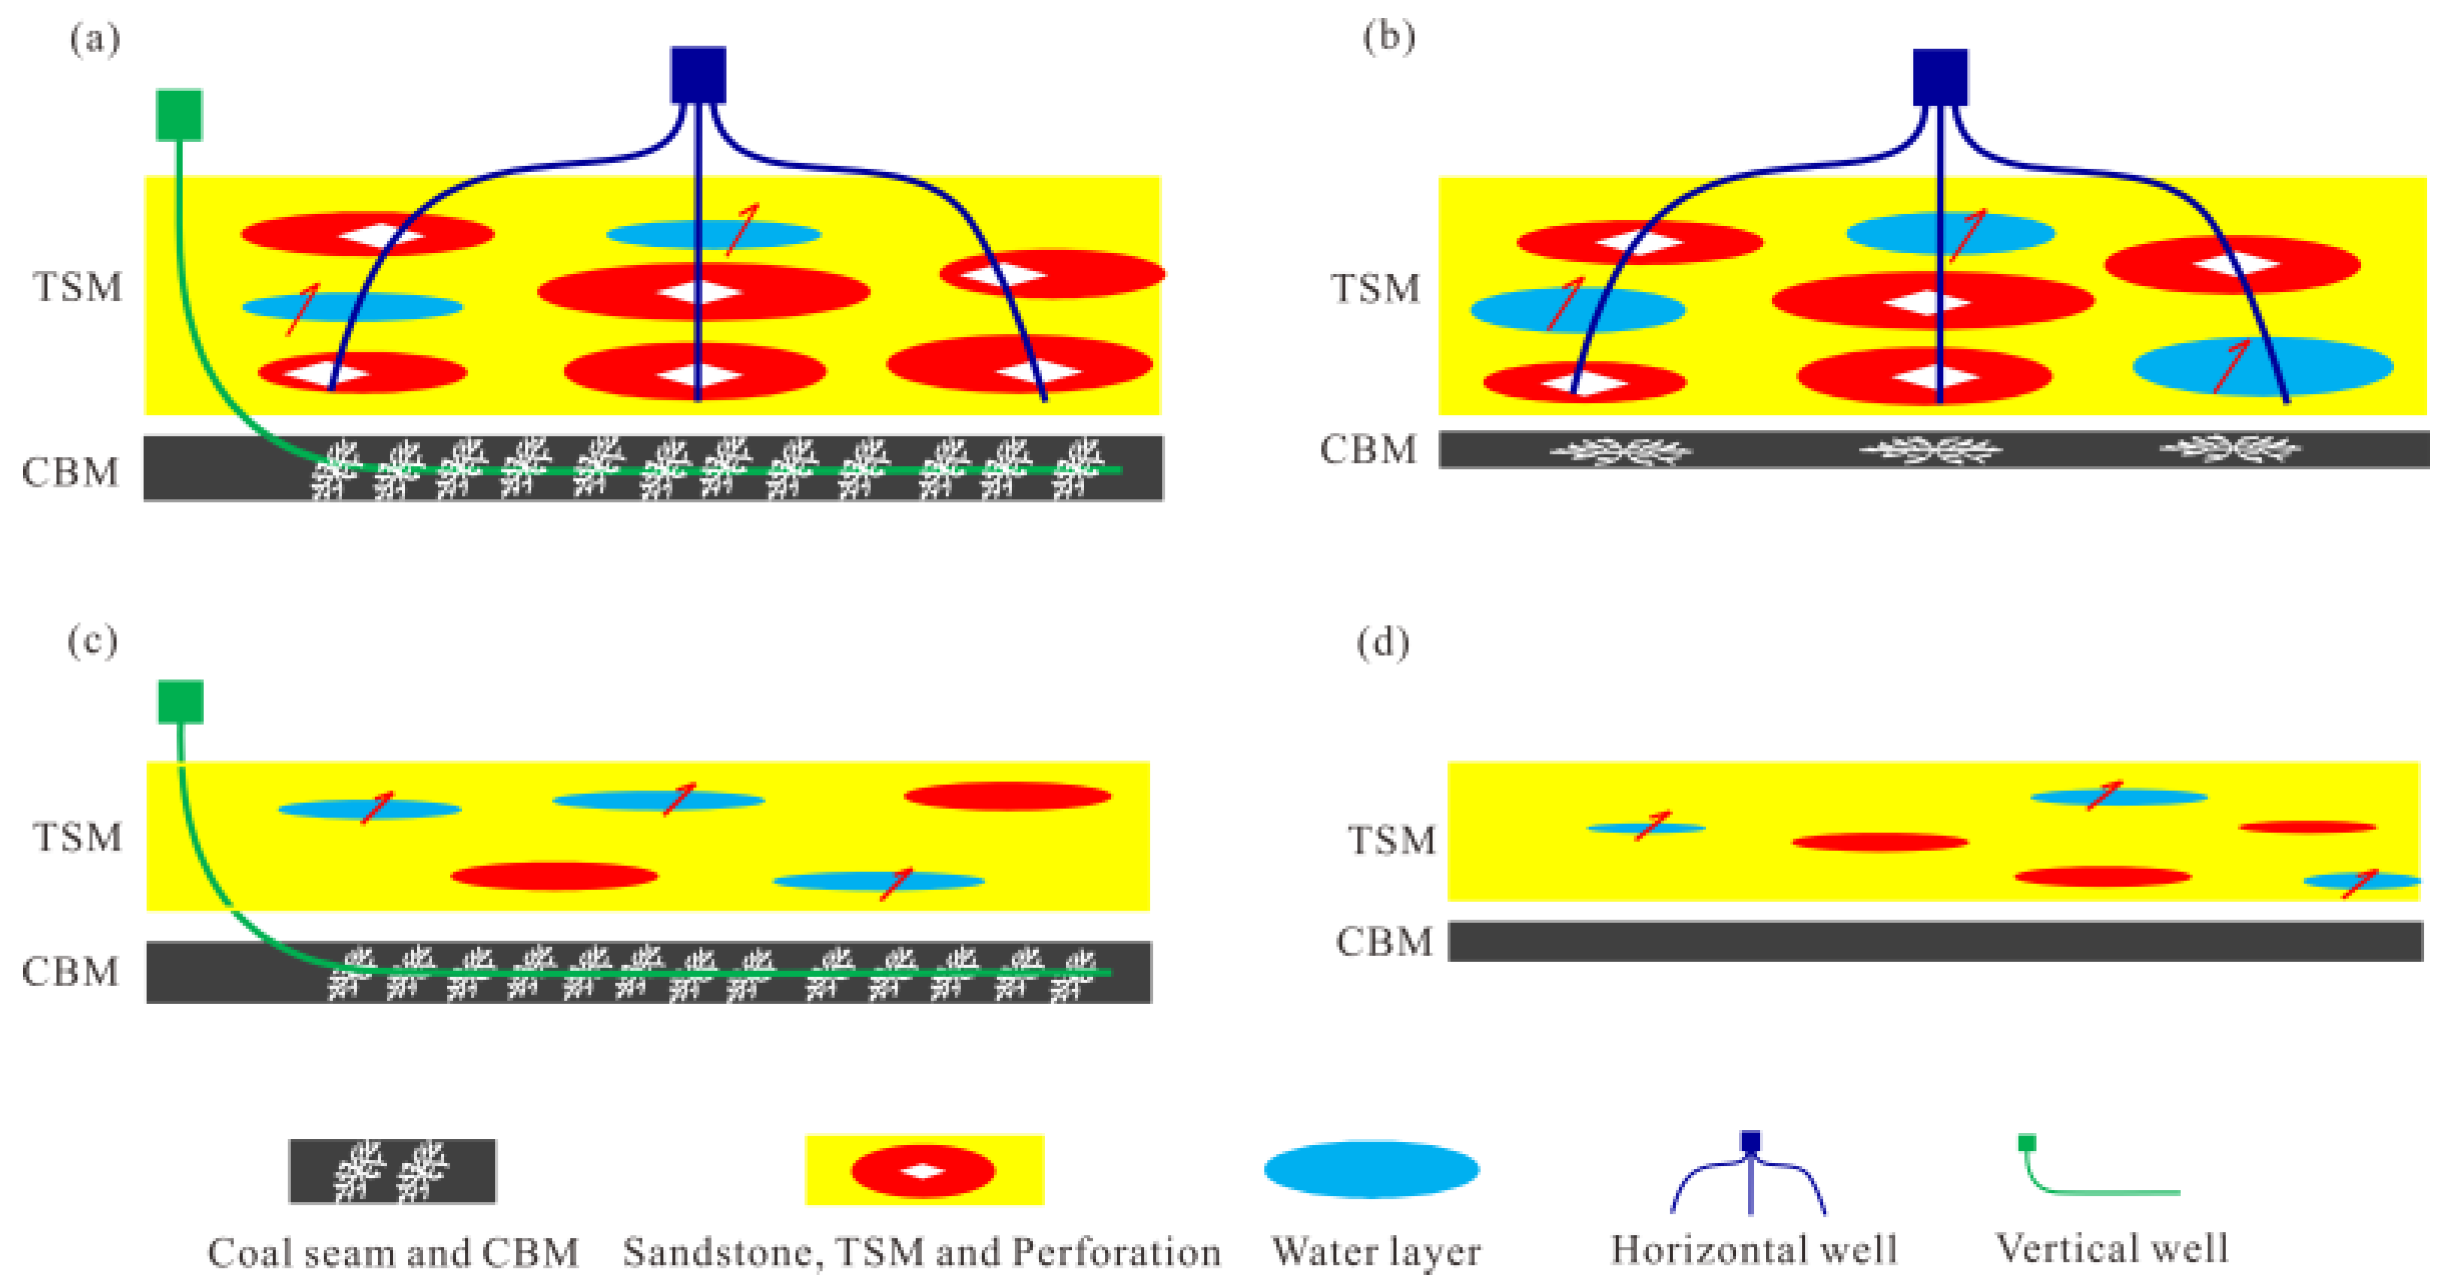
In the Qingjian Block, the TSM–deep CBM dual enrichment zone accounts for 3% of the area, with effective superimposed sandstone thickness all > 10 m (average = 15.3 m), and No. 8 coal seam thickness all > 5 m (average = 5.4 m) (Table 5). It is recommended to adopt a two-well-pattern three-dimensional deployment approach, using vertical and directional wells for TSM development and horizontal wells for deep CBM development. However, due to the thin coal seam thickness, which is close to the lower limit of the enrichment zone, there are certain risks associated with high-intensity development stimulation to improve single-well EUR (Figure 20a).
In the Qingjian Block, the water-bearing TSM-only enrichment zone accounts for 7% of the area, with effective superimposed sandstone thickness all > 10 m (average = 14.3 m), and No. 8 coal seam thickness all < 5 m (average = 2.6 m) (Table 5). It is recommended to adopt vertical and directional wells for sandstone–coal co-production to increase single-well EUR and achieve cost-effective development (Figure 20b).
In the Qingjian Block, the deep CBM-only enrichment zone accounts for 33% of the area, with effective superimposed sandstone thickness all < 10 m (average = 5.4 m), and No. 8 coal seam thickness all > 5 m (average = 5.0 m) (Table 5). Horizontal well deployment for deep CBM development is being explored, and improvement strategies are being refined (Figure 20c).
In the Qingjian Block, the TSM–deep CBM dual non-enrichment zone accounts for 57% of the area, with effective superimposed sandstone thickness all < 10 m (average = 4.9 m), and No. 8 coal seam thickness all < 5 m (average = 3.1 m) (Table 5). Cost-effective development is difficult to achieve (Figure 20d).
It is worth noting that, although the findings of this study provide a preliminary understanding for the synergistic development of TSM and CBM in the Mizhi–Qingjian area, the above limitations should be carefully considered when applying these results to practical development planning. Future research should focus on increasing well density to improve spatial characterization accuracy; incorporating dynamic production data to validate favorable zone predictions; updating economic parameters in response to changing market and technological conditions; and conducting pilot tests to further refine geological understanding and optimize development strategies, ultimately achieving large-scale cost-effective production build-up in this area.

6. Conclusions

Through the study of natural gas enrichment characteristics and cost-effective synergistic development technologies in the Mizhi–Qingjian Block of Ordos Basin, the following main conclusions are obtained:
(1)
In the Mizhi–Qingjian Block, the H8 Mb effective sandstones exhibit the best development, with effective sandstone penetration rates of 86.4% and 42.7%, and average thicknesses of 7.1 m and 4.8 m, respectively. The thickness of the No. 8 coal seam is significantly greater than that of the No. 5 coal seam; the former mainly ranges between 4 m and 10 m, while the latter is predominantly distributed between 0 and 6 m.
(2)
The BX Fm–H8 Mb TSM resources in Class I + II enrichment areas are 905.47 × 10⁸ m3, with an average reserve abundance of 0.94 × 10⁸ m3/km2. The No. 5 and No. 8 deep CBM resources in Class I + II enrichment areas are 5503.83 × 108 m3, with an average reserve abundance of 2.24 × 10⁸ m3/km2.
(3)
High-gas-content TSM–high-quality deep CBM and high-water-content TSM–low-quality deep CBM constitute the two major types of stacking patterns in the Mizhi–Qingjian Block. Among these, deep CBM-only enrichment is the dominant stacking type in the Mizhi area, while TSM–deep CBM dual non-enrichment is the dominant stacking type in the Qingjian Block.
(4)
The northern part of Mizhi is identified as a key area for future tight gas and coal-rock gas development. In the Qingjian area, due to its high water content, the western part exhibits some potential for tight gas development, but its coal-rock gas potential is relatively limited. Future production capacity construction in this area should therefore be approached with caution.

Author Contributions

Writing—original draft preparation, Z.L.; writing—review and editing, R.C.; conceptualization, G.W. and G.T.; software, Z.W.; validation, Z.H.; formal analysis, J.F.; methodology, Y.F.; investigation, W.X.; resources, Y.D.; data curation, Y.Z.; visualization, M.W. All authors have read and agreed to the published version of the manuscript.

Funding

This research was financially supported by the China National Science and Technology Major Project on New-Type Oil and Gas Exploration and Development (Grant Nos. 2025ZD1400800 and 2025ZD1403904); PetroChina Science and Technology Project (Grant No. 2023ZZ07).

Data Availability Statement

The original contributions presented in this study are included in the article. Further inquiries can be directed to the corresponding author.

Conflicts of Interest

Author Guoyong Tian was employed by the No. 2 Gas Production Plant, Changqing Oilfield Branch, PetroChina. The remaining authors declare that the research was conducted in the absence of any commercial or financial relationships that could be construed as a potential conflict of interest. The authors declare that this study received funding from PetroChina. The funder was not involved in the study design, collection, analysis, interpretation of data, the writing of this article or the decision to submit it for publication.

Abbreviations

The following abbreviations are used in this manuscript:
TSMTight Sandstone Methane
CBMCoalbed Methane
SQF FmShiqianfeng Formation
SHZ FmShihezi Formation
H8 MbHe 8 Member
S1 MbShan 1 Member
S2 MbShan 2 Member
SX FmShanxi Formation
TY FmTaiyuan Formation
BX FmBenxi Formation
EUREstimated Ultimate Recovery

References

  1. Li, G.; Wang, G.T.; Feng, N.C.; Chen, F.X.; Feng, Y.; Lu, C.G.; Tan, Y.N. Deep Coal-rock Gas in China: A Review of Distribution, Geological Characteristics, and Its Enrichment Conditions. ACS Omega 2025, 10, 23472−23491. [Google Scholar] [CrossRef] [Scilit] [PubMed]
  2. Li, G.; Wang, G.T.; Xiong, W.; Feng, N.C.; Chen, F.X.; Bi, R.; Pan, Y.W.; Zheng, J.; Feng, Y.; Lu, C.G.; et al. Lower Cambrian Shale Gas in Southern China: A Review of Distribution, Geochemical Characteristics, and Its Genesis Mechanism. ACS Omega 2025, 10, 51848−51868. [Google Scholar] [CrossRef] [Scilit] [PubMed]
  3. Gao, Y.; Wang, B.; Hu, Y.D.; Yu, Z.B.; Hu, A.L.; Wang, Y.J. Review of the Chinese natural gas industry’s development in 2025 and outlook for 2026. Int. Pet. Econ. 2026, 34, 39–51. [Google Scholar] [CrossRef]
  4. Feng, Y.; Xiao, X.M.; Wang, E.Z.; Gao, P.; Lu, C.G.; Li, G. Gas storage in shale pore system: A review of the mechanism, control and assessment. Pet. Sci. 2023, 20, 2605–2636. [Google Scholar] [CrossRef] [Scilit]
  5. Jia, A.L.; Wang, G.T.; Li, Y.L. Natural gas development in China: Present situation and prospect. Nat. Gas Ind. 2025, 45, 31–42. [Google Scholar] [CrossRef]
  6. Li, G.X.; Zhang, S.C.; He, H.Q.; He, X.X.; Zhao, Z.; Niu, X.B.; Xiong, X.Y.; Zhao, Q.; Guo, X.J.; Hou, Y.T.; et al. Coal-rock gas: Concept, connotation and classification criteria. Pet. Explor. Dev. 2024, 51, 783–795. [Google Scholar] [CrossRef] [Scilit]
  7. Zhu, R.K.; Li, G.X.; Cui, J.W.; Huang, F.X.; Lu, X.S.; Guo, Z.; Cao, Z.L. Geological accumulation conditions and exploration prospects of tight oil and gas in China. Acta Pet. Sin. 2025, 46, 17–32. [Google Scholar] [CrossRef]
  8. Li, G.X.; Zhang, B.; Zhang, J.F.; Zhao, Q. Major basic scientific issues and research directions for exploration and development of deep coal-rock gas in China. Acta Pet. Sin. 2025, 46, 1025–1036. [Google Scholar] [CrossRef]
  9. Li, S.L.; Zhang, Y.X.; Yu, X.H.; Fu, C.; Ma, X.B. Sedimentary elements of heterogeneity evaluation and sweet spot prediction strategies on sedimentary facies controlled tight gas reservoirs in coal-bearing intervals: Examples from the Ordos Basin. Earth Sci. Front. 2025, 32, 389–403. [Google Scholar] [CrossRef]
  10. Liu, Y.C.; Mei, X.H.; Tian, J.J.; Liu, B.Y.; Yuan, Y.; Wang, D.X. Reservoir characteristics, diagenesis and main controlling factors for coal measure tight sandstone gas in Shenfu block, Ordos Basin. China Pet. Explor. 2025, 30, 39–55. [Google Scholar] [CrossRef]
  11. Wu, H.; Liu, R.E.; Ji, Y.L.; Zhang, C.L.; Zhou, Y.; Zhang, Y.Z. Classification of pore structures in typical tight sandstone gas reservoir and its significance: A case study of the He 8 Member of Upper Palaeozoic Shihezi Formation in Ordos Basin, China. Nat. Gas Geosci. 2016, 27, 835–843. [Google Scholar] [CrossRef]
  12. Tian, W.G.; Deng, Z.; Zhang, Z.; Chen, H.; Cao, Y.M.; Shen, J. Dynamic evolution laws of free gas and adsorbed gas in deep coal reservoirs and its geological controls: A case study of Daning-Jixian Block, Ordos Basin. Earth Sci. 2026, 51, 2582–2595. [Google Scholar] [CrossRef] [Scilit]
  13. Jiang, F.J.; Jia, C.Z.; Pang, X.Q.; Jiang, L.; Zhang, C.L.; Ma, X.Z.; Qi, Z.G.; Chen, J.Q.; Pang, H.; Hu, T.; et al. Upper Paleozoic total petroleum system and geological model of natural gas enrichment in Ordos Basin, NW China. Pet. Explor. Dev. 2023, 50, 250–261. [Google Scholar] [CrossRef] [Scilit]
  14. Xi, S.L.; Yan, W.; Liu, X.S.; Zhang, C.L.; Yin, L.L.; Dong, G.D.; Jing, X.H.; Wei, L.B. New fields, new types and resource potentials of natural gas exploration in Ordos Basin. Acta Pet. Sin. 2024, 45, 33–51. [Google Scholar] [CrossRef]
  15. Li, J.; Zhang, C.L.; Jiang, F.J.; Pei, Y.; Wang, J.Y.; Wang, X.R.; Zhang, J.Q. Main factors controlling the enrichment of Upper Carboniferous Benxi Formation tight gas in the Ordos Basin. Nat. Gas Ind. 2021, 41, 30–40. [Google Scholar] [CrossRef]
  16. Zhao, J.Z.; Fu, J.H.; Yao, J.L.; Liu, X.S.; Wang, H.E.; Cao, Q.; Wang, X.M.; Ma, Y.P.; Fan, Y.F. Quasi-continuous accumulation model of large tight sandstone gas field in Ordos Basin. Acta Pet. Sin. 2012, 33, 37–52. [Google Scholar]
  17. Liu, C.; Zhang, D.M.; Li, C.; Lu, Y.Y.; Yu, S.S.; Guo, M.Q. Upper Paleozoic tight gas sandstone reservoirs and main controls, Linxing block, Ordos Basin. Oil Gas. Geol. 2021, 42, 1146–1158. [Google Scholar] [CrossRef]
  18. Niu, X.B.; Zhao, W.B.; Shi, Y.H.; Hu, X.Y.; Du, X.W. Natural gas accumulation conditions and exploration potential of Benxi Formation in Ordos Basin. Acta Pet. Sin. 2023, 44, 1240–1257. [Google Scholar] [CrossRef]
  19. Niu, X.B.; Zhang, H.; Wang, H.C.; Hu, J.L.; Wu, C.J.; Zhao, W.B.; Pan, B. Characteristics and genesis of vertical heterogeneity in a coal seam of the Carboniferous Benxi Formation, eastern Ordos Basin: A case study of well M172. Oil Gas. Geol. 2024, 45, 1577–1589. [Google Scholar] [CrossRef]
  20. Zhao, Z.; Xu, W.L.; Zhao, Z.Y.; Yi, S.W.; Yang, W.; Zhang, Y.Q.; Sun, Y.S.; Zhao, W.B.; Shi, Y.H.; Zhang, C.L.; et al. Geological characteristics and exploration breakthroughs of coal rock gas in Carboniferous Benxi Formation, Ordos Basin, NW China. Pet. Explor. Dev. 2024, 51, 234–247. [Google Scholar] [CrossRef] [Scilit]
  21. Wang, Z.Y.; Zhou, N.W.; Lu, S.F.; Liu, Y.C.; Lin, L.M.; Liu, Y.; Song, B. Generation, accumulation, and distribution of Upper Paleozoic tight sandstone gas in the northeastern margin of the Ordos Basin. Mar. Pet. Geol. 2023, 156, 106463. [Google Scholar] [CrossRef] [Scilit]
  22. Zhu, S.Y.; Liu, L.; Wang, L.L.; Wang, Z.W.; Hu, J.L.; Zhang, J.Q.; Zhang, C.G.; Zhao, J.X.; Chen, H.G. Provenance signature and tectono-sedimentary setting of the Permian Shihezi formation (Ordos basin, China): Insights from geochemistry and detrital zircon U-Pb dating. Mar. Pet. Geol. 2024, 165, 106901. [Google Scholar] [CrossRef] [Scilit]
  23. Ju, Y.W.; Wang, W.; Ren, Z.L.; Yang, Z.; Liu, K.Y.; Hou, B.; Xiao, L. Multi-stage evolution of the Ordos Basin: Its coupled basin-mountain systems and energy resources. Sci. China Earth Sci. 2025, 68, 2426–2473. [Google Scholar] [CrossRef] [Scilit]
  24. Liu, X.S.; Huang, D.J.; Hu, J.L.; Zhou, G.X.; Du, X.W.; Dai, X.D. Reservoir characteristics of Carboniferous Benxi Formation coal-rock gas in the central and eastern Ordos Basin. Nat. Gas Ind. 2024, 44, 51–62. [Google Scholar] [CrossRef]
  25. Guo, Y.Q.; Li, W.H.; Guo, B.C.; Zhang, Q.; Chen, Q.; Wang, R.G.; Liu, X.; Ma, Y.; Li, Z.C. Sedimentary systems and palaeogeography evolution of Ordos Basin. J. Palaeogeogr. 2019, 21, 293–320. [Google Scholar] [CrossRef]
  26. He, F.Q.; Wang, F.B.; Guo, L.G.; An, C. Evolution of prototype basin and change of tectonic-sedimentary pattern in Paleozoic, Ordos Basin. Pet. Geol. Exp. 2022, 44, 373–384. [Google Scholar] [CrossRef]
  27. Guo, Y.Q.; Li, B.Q.; Li, B.; Li, W.H.; Cao, H.X.; Liao, Y.; Wu, Z.Z.; Fei, S.X.; Zhang, Q.; Chen, Q.; et al. Sedimentary system and palaeogeographic evolution of Ordos Basin, northern China. J. Palaeogeogr. 2025, 14, 501–534. [Google Scholar] [CrossRef] [Scilit]
  28. Jia, A.L.; Wang, G.T.; Wan, N.; Meng, D.W. Development indicators evaluation and technical optimization direction for deep coal-rock gas: A case study of Ordos Basin, NW China. Pet. Explor. Dev. 2025, 52, 1377–1387. [Google Scholar] [CrossRef] [Scilit]
  29. Niu, X.B.; Fan, L.Y.; Yan, X.X.; Zhou, G.X.; Zhang, H.; Jing, X.Y.; Zhang, M.B. Enrichment conditions and resource potential of coal-rock gas in Ordos Basin, NW China. Pet. Explor. Dev. 2024, 51, 972–985. [Google Scholar] [CrossRef] [Scilit]
  30. Chen, X.Z. Study on the reserve calculation method of tight gas. China Min. Mag. 2018, 27, 167–172. [Google Scholar] [CrossRef]
  31. Li, J.B.; Li, Y.; Zhang, J.; Yang, T.B.; Fan, A.P.; Yang, R.C.; Cui, M.M. Resource evaluation method and influence factors of its parameters for tight sand gas reservoir in southwestern Sulige gas field. Oil Gas. Geol. 2020, 41, 730–743+762. [Google Scholar] [CrossRef]
  32. Ma, S.W. Study of Geological Conditions of Tight Gas Reservoir in the Upper Paleozoic of Wubu Area; Northwest University: Kirkland, WA, USA, 2020. [Google Scholar]
  33. Li, M.R.; Shi, Y.H.; Fan, L.Y.; Dai, X.D.; Jing, X.Y.; Zhang, Y. Comparison of main reservoir characteristics between deep coal-rock gas of the No.8 coal seam of the Upper Paleozoic Benxi Formation and tight sand gas reservoirs, Ordos Basin. Oil Gas. Geol. 2024, 45, 1590–1604. [Google Scholar] [CrossRef]
  34. Yang, Y.; Lai, Y.T.; Zhang, X.Y.; Gong, X.K.; Han, J.C. Characteristics, development risks and effective producing countermeasures of water-bearing tight gas reservoir: A case study of water-bearing area in Sulige Gasfield. China Pet. Explor. 2023, 28, 121–133. [Google Scholar] [CrossRef]
  35. Li, H.; Ma, Z.J.; Wang, X.D.; Zhang, H.F. Characteristics of spatial superimposition between sandbody and coal seam and its implications to commingling production for coal-bed methane and tight gas in the southern Qinshui Basin. Sci. Technol. Eng. 2019, 19, 70–77. [Google Scholar]
  36. Dai, J.X.; Zou, C.N.; Tao, S.Z.; Liu, Q.Y.; Zhou, Q.H.; Hu, A.P.; Yang, C. Formation and main controls of large gas fields in China. Nat. Gas Geosci. 2007, 18, 473–484. [Google Scholar]
  37. Guo, Z.Q.; Wang, B.; Dong, C.Y.; Li, L.; Pang, Z.L.; Chen, X.Y.; Ma, D.B. Geological characteristics of Jurassic coal rock gas and evaluation of favorable zones in the northern structural belt of the Kuqa Depression, Tarim Basin. Nat. Gas Geosci. 2025, 36, 953–972. [Google Scholar] [CrossRef]
  38. Pu, X.G.; Dong, X.Y.; Chai, G.Q.; Li, H.J.; Li, H.D.; Lv, D.S.; Yu, C.; Meng, R.; Shao, Y.; He, C. Accumulation conditions and exploration orientation of coal measure gas in the Upper Paleozoic in Huanghua Depression. China Pet. Explor. 2024, 29, 60–70. [Google Scholar] [CrossRef]
  39. Sun, L.D.; Yang, L.; Xu, J.S.; Liu, J.J.; Li, X.M.; Li, G.Z. Gas accumulation conditions and exploration orientation of coal measure gas in Shahezi Formation in Xujiaweizi Fault Depression. China Pet. Explor. 2024, 29, 71–81. [Google Scholar] [CrossRef]
  40. Shu, H.L.; Zhang, C.; Cheng, Q.S.; Su, Z.H.; Zhang, H.B.; Guo, N.; Meng, Y. Geological characteristics and exploration prospects of coal measure gas in the Upper Permian Longtan Formation in Da’an area in western Chongqing. China Pet. Explor. 2024, 29, 97–108. [Google Scholar] [CrossRef]
  41. Wen, L.; Luo, B.; Sun, H.F.; Zhang, B.J.; Ming, Y.; Chen, X.; Zhang, X.H.; Zhang, W.J.; Xu, C.; Xu, L. Geological characteristics and resources potential of deep coal-rock gas reservoir in the Upper Permian Longtan Formationof the Sichuan Basin. Nat. Gas Ind. 2024, 44, 22–32. [Google Scholar] [CrossRef]
  42. Zhao, W.Z.; Bian, C.S.; Xu, Z.H. Similarities and differences between natural gas accumulations in Sulige gas field in Ordos basin and Xujiahe gas field in central Sichuan Basin. Pet. Explor. Dev. 2013, 40, 400–408. [Google Scholar] [CrossRef] [Scilit]
  43. Yang, H.; Fu, J.H.; Liu, X.S.; Meng, P.L. Accumulation conditions and exploration and development of tight gas in the Upper Paleozoic of the Ordos Basin. Pet. Explor. Dev. 2012, 39, 295–303. [Google Scholar] [CrossRef] [Scilit]
Figure 1. Tectonic unit divisions of the Ordos Basin (a) and a comprehensive stratigraphic column of the Upper Paleozoic in the Mizhi–Qingjian Block (b) (modified from Wang et al. [21]).
Processes 14 02898 g001
Figure 2. (a) Delta–barrier coast–shallow shelf and (b) continental fluvial–delta–lacustrine sedimentary systems in the Mizhi–Qingjian Block (modified from Liu et al. [17]).
Processes 14 02898 g002
Figure 3. Penetration rates and average thicknesses of BX Fm–H8 Mb sandstones in the (a,b) Mizhi area and (c,d) Qingjian Block.
Processes 14 02898 g003
Figure 8. Planar distribution characteristics of BX Fm–H8 Mb effective sandstones in the Mizhi–Qingjian Block.
Processes 14 02898 g008
Figure 9. Cross-section of gas reservoirs along wells in the (a) Mizhi Block and (b) Qingjian Block
Processes 14 02898 g009
Figure 10. Thickness distribution of (a) BX Fm No. 8 coal seam and (b) SX Fm No. 5 coal seam in the Mizhi–Qingjian Block.
Processes 14 02898 g010
Figure 11. Statistics of (a,b) splitting types and (c,d) reservoir–caprock assemblages of the BX Fm No. 8 coal seam and SX Fm No. 5 coal seam in the Mizhi–Qingjian Block. (a,c): No. 8 coal seam; (b,d): No. 5 coal seam.
Processes 14 02898 g011
Figure 12. Cross-plot for identifying gas layers and water zones in the Qingjian Block.
Processes 14 02898 g012
Figure 13. (a) Thickness and (b) proportion of water zones in the Qingjian Block.
Processes 14 02898 g013
Figure 14. (a) Thickness contour map of water zones, and (b) contour maps of gas layer thickness proportion and structure at the top of S2 Mb in the Qingjian Block.
Processes 14 02898 g014
Figure 15. Gas–water distribution models in the Qingjian Block. (a) High gas content distribution model; (b) multi-type coexistence model; (c) high water content model.
Processes 14 02898 g015
Figure 16. Distribution of favorable enrichment areas of BX Fm–H8 Mb TSM in the Mizhi–Qingjian Block.
Processes 14 02898 g016
Figure 17. Distribution of favorable enrichment areas of the No. 8 deep CBM in the Mizhi–Qingjian Block.
Processes 14 02898 g017
Figure 18. Synergistic development deployment patterns for TSM and No. 8 deep CBM in the Mizhi area. (a) TSM–deep CBM dual enrichment, already developed area; (b) TSM–deep CBM dual enrichment, undeveloped area; (c) TSM-only enrichment; (d) deep CBM-only enrichment; (e) TSM–deep CBM dual non-enrichment.
Processes 14 02898 g018
Figure 19. Well pattern development model and deployment map for the TSM–deep CBM dual enrichment undeveloped area in the Mizhi–Qingjian Block.
Processes 14 02898 g019
Figure 20. Synergistic development deployment patterns for TSM and No. 8 deep CBM in the Qingjian Block. (a) TSM–deep CBM dual enrichment; (b) water-bearing TSM-only enrichment; (c) deep CBM-only enrichment; (d) TSM–deep CBM dual non-enrichment.
Processes 14 02898 g020
Table 1. Evaluation results of BX Fm–H8 Mb TSM resources in the Mizhi–Qingjian Block.
BlockLayerSub-
Member
Gas-Bearing Area (km2)Resources
(×108 m3)
Abundance
(×108 m3/km2)
MizhiP2h8H81-1535.35170.230.32
H81-2646.31193.980.30
H82-1541.70163.980.30
H82-2538.62190.130.35
P1s1S11214.6242.660.20
S12254.1750.960.20
S13266.8346.400.17
P1s2S21191.23145.520.76
S22200.7852.870.26
S23168.3751.120.30
P1tT1157.3341.110.26
T2199.4527.770.28
T22217.41150.040.69
C2bB1268.40104.420.39
B282.2015.700.19
Subtotal 1519.44
QingjianP2h8H81-1460.48142.410.31
H81-2142.9439.350.28
H82-1193.4647.430.25
H82-2102.8025.310.25
P1s1S11301.4453.860.18
S12158.3233.980.21
S13408.2458.080.14
P1s2S2174.8116.950.23
S2239.5210.400.26
S23174.1283.150.48
P1tT111.972.310.19
T213.160.370.12
T222.510.760.30
C2bB15.491.060.19
B23.220.410.13
Subtotal 443.28
Total 1962.72
Table 2. Evaluation results of No. 5 and No. 8 deep CBM resources in the Mizhi–Qingjian Block.
BlockDepth
(m)
No. 5 Coal SeamNo. 8 Coal Seam
Gas-Bearing Area (km2)Resources
(×108 m3)
Abundance
(×108 m3/km2)
Gas-Bearing Area (km2)Resources
(×108 m3)
Abundance
(×108 m3/km2)
Mizhi0–21683.09420.70.2520.884.560.22
2–4439.60404.80.9270.1175.421.08
4–6110.88171.21.54362.66593.231.64
6–876.68168.92.201087.892412.92.22
8–1070.08200.72.86700.981980.592.83
>10000153.54538.273.51
Subtotal2380.331366.180.572396.065604.972.34
Qingjian0–21250.12300.610.24108.5343.610.40
2–4271.92233.160.86504.32464.340.92
4–6147.76216.931.47842.921301.501.54
6–8000206.52416.892.02
>80007.5126.143.48
Subtotal1669.80750.690.451669.802252.471.35
Total4050.132116.870.524065.867857.441.93
Table 3. Evaluation results of TSM and deep CBM resources in the enrichment areas of Mizhi–Qingjian Block.
BlockResource TypeType of
Enrichment Area
Gas-Bearing Area (km2)Resources
(×108 m3)
Abundance
(×108 m3/km2)
MizhiTSMI150.16234.251.56
II476.21498.991.05
I + II626.37733.241.17
No. 8 deep CBMI1117.882934.162.62
II736.881450.151.97
I + II1854.764384.322.36
QingjianTSMI59.0066.981.14
II100.73105.251.04
I + II159.73172.231.08
No. 8 deep CBMI103.91246.582.37
II501.63872.941.74
I + II605.541119.511.85
Table 4. Classification and evaluation of favorable areas of the BX Fm No. 8 coal seam in the Mizhi–Qingjian Block.
Evaluation ParameterType IType II
Coal seam thickness (m)≥75–7
Ro (%)≥1.6≥1.2
Average gas content (m3/t)≥1814–18
Porosity (%)≥64–6
Reservoir–caprock assemblageCoal–limestone, Coal–mudstoneCoal–limestone,
Coal–mudstone
Table 5. The stacking relationships between sandstones and coal seams in the Mizhi–Qingjian Block.
Stacking Relationship Between Sandstones and Coal SeamsKey Parameters
Geological
Characteristics
Area
Proportion
Effective Superimposed Sandstone ThicknessNo. 8 Coal Seam Thickness
High-gas TSM—high-quality deep CBM stacking (Mizhi area)TSM–deep CBM dual enrichmentTSM is enriched, deep CBM is also enriched22%>10 m, avg = 16.5 m>5 m, avg = 8.0 m
TSM-only enrichmentTSM is enriched, deep CBM is not enriched7%>10 m, avg = 19.7 m<5 m, avg = 3.8 m
deep CBM-only enrichmentDeep CBM is enriched, TSM is not enriched58%<10 m,
avg = 6.6 m
>5 m, avg = 8.0 m
TSM–deep CBM dual non-enrichmentTSM is not enriched, deep CBM is also not enriched13%<10 m,
avg = 4.8 m
<5 m, avg = 3.4 m
High-water TSM—low-quality deep CBM stacking (Qingjian Block)TSM–deep CBM dual enrichmentTSM is enriched but locally water-affected; deep CBM is also enriched but with lower coal seam thickness than Mizhi3%>10 m, avg = 15.3 m>5 m, avg = 5.4 m
Water-bearing TSM-only enrichmentTSM is enriched but locally water-affected; coal seam is thin and not enriched7%>10 m, avg = 14.3 m<5 m, avg = 2.6 m
deep CBM-only enrichmentTSM is not enriched due to extensive water influence; deep CBM is enriched but with lower coal thickness than Mizhi33%<10 m,
avg = 5.4 m
~5 m, avg = 5.0 m
TSM–deep CBM dual non-enrichmentTSM is not enriched due to extensive water influence; coal seams are thin and also not enriched57%<10 m, avg = 4.9 m<5 m, avg = 3.1 m
Disclaimer/Publisher’s Note: The statements, opinions and data contained in all publications are solely those of the individual author(s) and contributor(s) and not of MDPI and/or the editor(s). MDPI and/or the editor(s) disclaim responsibility for any injury to people or property resulting from any ideas, methods, instructions or products referred to in the content.