Article

Numerical Simulation Analysis of the Impact of Forest Wildfire on Buried Pipelines
1
School of Petroleum Engineering, Chongqing University of Science and Technology, Chongqing 401331, China
2
Sichuan Changning Natural Gas Development Co., Ltd., Yibin 644000, China
3
Chongqing Gas Group Co., Ltd., Chongqing 400020, China
*
Authors to whom correspondence should be addressed.
Processes 2026, 14(17), 2848; https://doi.org/10.3390/pr14172848
Submission received: 23 June 2026 / Revised: 29 August 2026 / Accepted: 2 September 2026 / Published: 4 September 2026
(This article belongs to the Section Materials Processes)

Abstract

In recent years, forest fires have occurred frequently, and extremely high temperatures can easily cause plastic deformation of buried pipelines. To clarify the temperature-stress variation law of natural gas pipelines under wildfire action, this study, based on heat transfer theory and using the finite element method, constructs a numerical model of a buried pipeline and analyzes the thermo-mechanical sequential coupling behavior of the pipe–soil system. It elucidates the influence patterns of key factors such as burial depth, outer diameter, internal fluid pressure, soil thermal conductivity, and fire duration on the temperature-stress fields of the pipe and surrounding soil and investigates pipeline deformation under fire. The results show that burial depth is the most sensitive factor: when it increases from 0.2 m to 0.8 m, the maximum pipe temperature decreases from 291.4 °C to 32.4 °C, and the maximum von Mises stress decreases from 507 MPa to 236 MPa. Furthermore, increasing pipe outer diameter and soil thermal conductivity both exacerbate pipe temperature rise and stress accumulation. Meanwhile, the longer the duration, the more pronounced the soil heat storage lag. Additionally, when internal pressure increases from 2 MPa to 8 MPa, the pipe’s maximum stress increases by up to 10.8%. The analysis results can provide a theoretical basis for identifying high-risk pipeline sections and guiding route selection and protective measure optimization for pipelines crossing forested areas.

1. Introduction

Climate warming has led to more frequent extreme weather, and forest fires have shown a high incidence trend. All 33 districts and counties of Chongqing are high-risk areas for forest fires. Oil and gas pipelines buried in forested areas are subject to thermal damage from the high temperatures of wildfires, endangering operational safety. When intense surface forest fires occur, the sustained and extreme surface heat load is rapidly conducted downward through the soil medium, significantly altering the temperature-field distribution around pipelines. This abrupt temperature rise not only weakens the mechanical properties of the pipe material itself but also, when thermal expansion of the pipeline is fully constrained, generates self-equilibrating longitudinal compressive stresses internally. Once these compressive stresses exceed critical values, buckling and folding may occur at weak points, potentially causing pipeline rupture or even explosion [1,2,3]. Therefore, studying the variation laws of the temperature and stress fields of buried natural gas pipelines under mountainous forest conditions is of important engineering significance for ensuring the safe operation of energy networks and for formulating fire prevention and firefighting strategies.
At present, for long-distance transmission pipelines, most researchers focus on mechanical impacts caused by changes in seismic activity, landslides, debris flows, tunnel excavation, and permafrost engineering characteristics [4]. Jiao et al. [5] analyzed the seismic response of pipelines with large elevation differences using shaking table tests. Zhang et al. [6] investigated the effects of fault displacement on pipeline structural response. Ye et al. [7] studied the deformation behavior of polyethylene pipelines under earthquake-induced landslides. Wu and Li [8] examined the impact of debris flows on semi-exposed pipelines, while Wang et al. [9] analyzed the effects of tunnel excavation on buried pipelines using finite element methods. These studies have established comprehensive frameworks for evaluating pipeline integrity under single-hazard scenarios. However, none of these investigations addressed the effects of extreme transient high-temperature heat sources, such as forest wildfires, on buried pipelines.
In recent years, the thermo-mechanical response of pipelines and soils induced by temperature variations has received increasing attention. Fu et al. [10] investigated the temperature field and thawing characteristics of soil around pipelines in permafrost regions using FLUENT. Dimitrakopoulos [11] solved the Fourier heat conduction equation for different boundary conditions and concluded that surface heat flux and surface temperature are the decisive parameters for soil temperature distribution. Richter et al. [12] established a one-dimensional transient heat conduction model to examine the effects of surface heat flux, surface temperature, heating duration, thermal diffusivity, and burial depth on subsurface soil temperatures. Pamuk [13] analyzed the transient variation characteristics of soil temperature during large-scale forest fires using COMSOL. Janssens [14] further developed an improved calculation method that explicitly accounts for the effect of moisture on conduction heat transfer through soil.
Despite these advances, several critical gaps remain unaddressed in the studies reviewed above. First, most existing models are limited to one- or two-dimensional heat conduction analyses that focus on soil temperature prediction without quantifying the thermal stresses in the pipe itself. For X80 steel pipelines, however, stress accumulation during a fire is what ultimately governs structural safety. Second, the coupled effects of multiple parameters, namely, pipe diameter, internal pressure, and soil thermal conductivity, have not been systematically investigated under wildfire conditions, leaving their relative importance unclear. Third, the post-fire delayed temperature rise has been reported, but its implications for stress evolution and the onset of plastic deformation have received little attention. Finally, the critical fire duration beyond which an X80 high-strength steel pipe transitions from elastic to plastic deformation has yet to be established. Therefore, this study focuses on buried pipelines under fire exposure, with the main research objectives as follows: (1) To establish a three-dimensional pipe–soil thermal-mechanical coupling model using finite element simulation software, and to reveal the evolution patterns of the temperature field and thermal stress in the pipe and soil under high-temperature loads from forest fires; (2) to comprehensively investigate the coupled effects of multiple parameters, this study covers burial depth (0.2–0.8 m), pipe outer diameter (1.067–1.422 m), internal pressure (2–8 MPa), soil thermal conductivity (1.0–3.5 W/(m·K)), and fire duration (up to 120 h), with quantitative sensitivity ranking via orthogonal analysis; (3) to observe the deformation behavior of the pipeline during the various stages of wildfire burning and to analyze the underlying deformation mechanisms; and (4) to explore the effects of burial depth and fire duration on the plastic deformation of buried pipelines and to determine the critical fire duration below which no plastic strain occurs in the pipeline. Ultimately, this study aims to provide quantitative references for the fire resistance safety assessment and protective design of pipelines.

2. Materials and Methods

2.1. Experimental Materials

The soil model depth is set to 5 m and the width to 10 m. To accurately simulate axial heat conduction along the pipe, the soil model length is set to 20 m. The initial damaged pipe is specified as Φ1219 × 18.4 mm, with an external anti-corrosion layer thickness of 3.3 mm, a burial depth of 0.25 m (note on burial depth definition: In this study, the burial depth (or H) is uniformly defined as the vertical soil cover thickness from the ground surface to the pipe crown. This definition is applied consistently across all parametric simulations, including those involving variations in pipe outer diameter), a pipe length of 20 m, and a transported natural gas temperature of 20 °C at a pressure of 8 MPa. The initial soil temperature surrounding the pipe is T0 = 20 °C. Other operating parameters include pipe diameters of 1067–1422 mm, burial depths of 0.2–0.8 m, anti-corrosion coating thickness of 3.0–3.3 mm, and gas transmission pressures of 2–8 MPa.
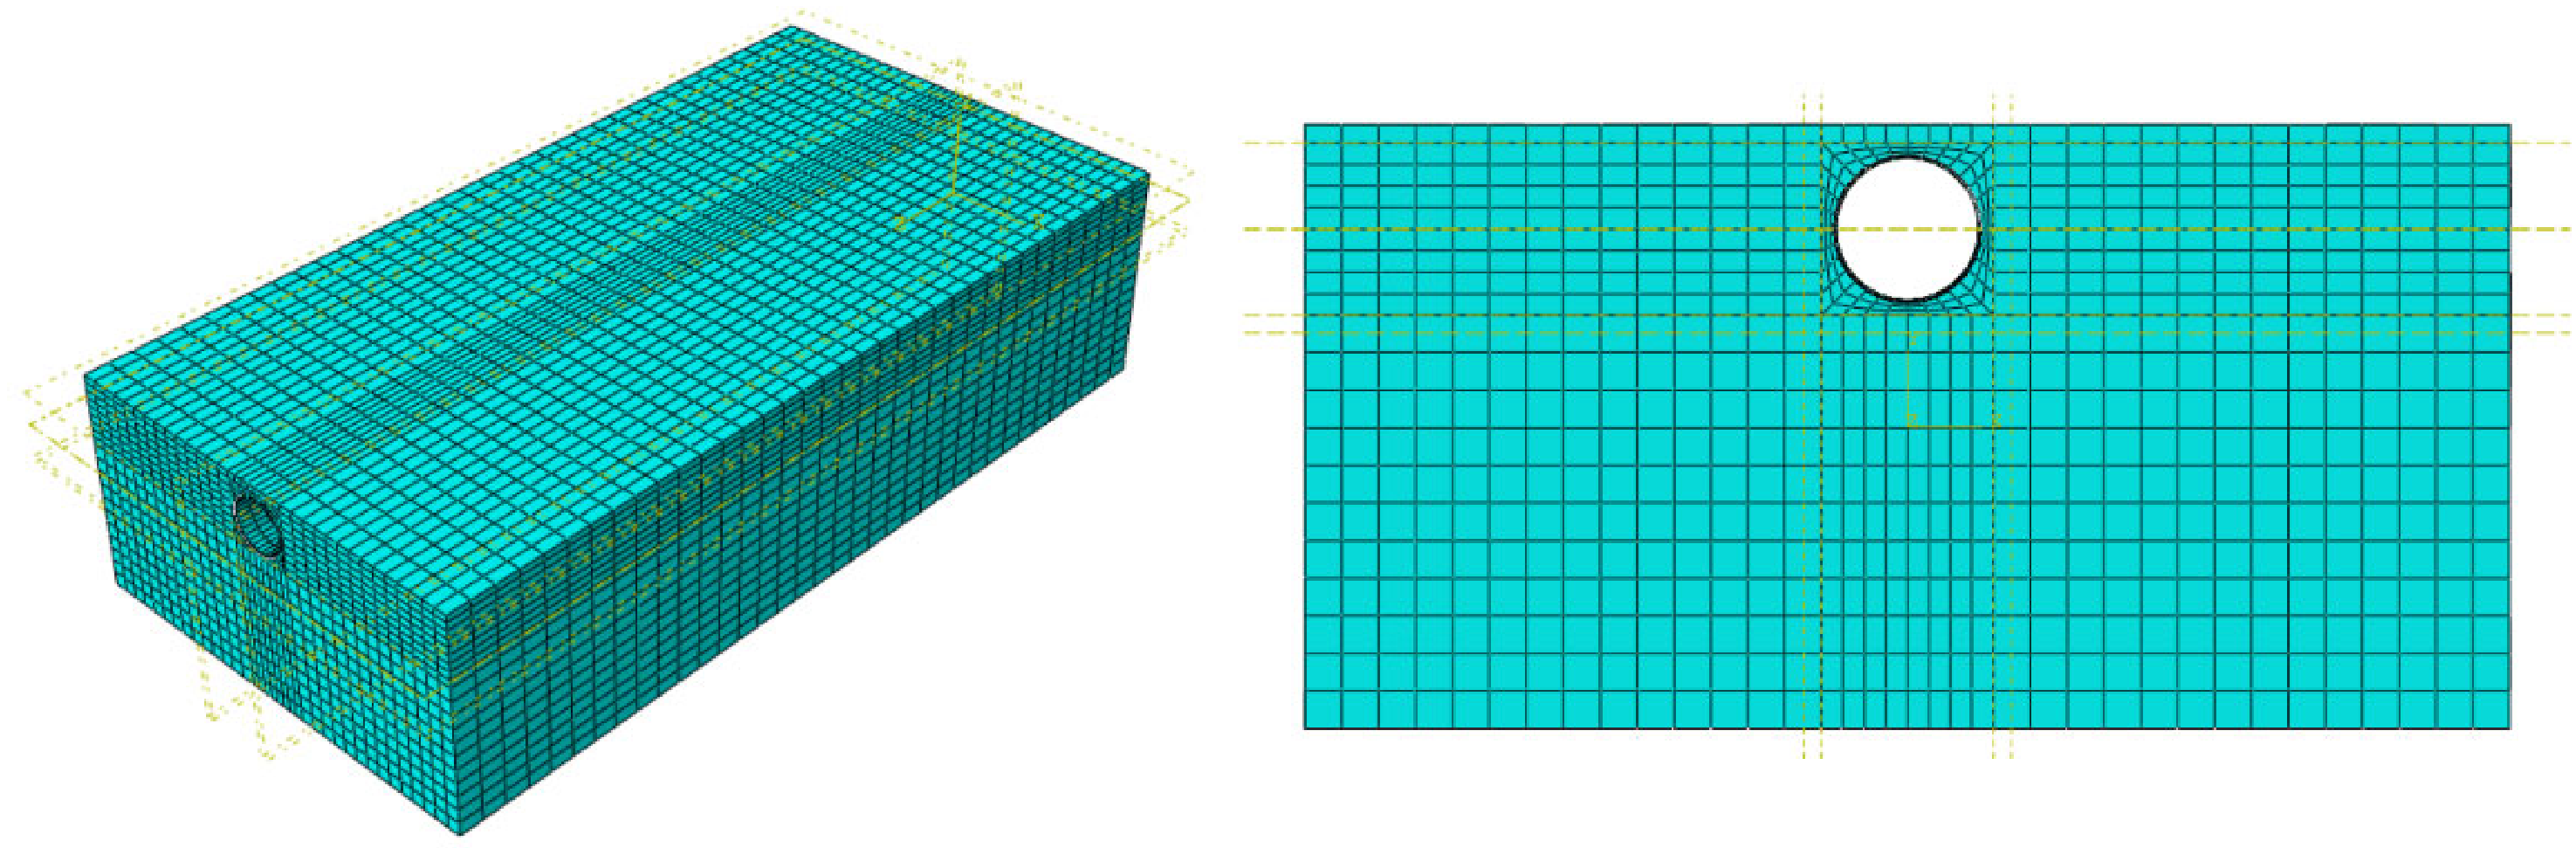
During the heat conduction process, the pipe–soil model uses eight-node linear thermal hexahedral elements (DC3D8) for mesh division, with mesh refinement at the pipe contact areas. Five groups of finite element models with different mesh densities were set up, with mesh counts ranging from 18,644 to 46,012. The maximum temperature at the top of the pipe for each group was extracted as shown in Table 1. Compared with the temperature calculation results corresponding to 31,360 elements, the errors are all less than 1%, indicating good mesh independence. A finer mesh incurs higher computational cost; therefore, it is particularly important to select an appropriate mesh size while ensuring the accuracy of the analysis results [15]. The subsequent analysis in this paper sets 31,360 as the mesh division standard, and in the sequential coupling step, the element type is changed to eight-node linear hexahedral elements (C3D8R). In addition to the mesh independence verification, a domain size sensitivity analysis was conducted to ensure that the boundary conditions do not interfere with the temperature and stress distributions around the pipeline. Using the case (burial depth 0.25 m, pipe diameter 1.219 m, fire duration 11 h) as the baseline, we tested a series of widths (6, 10, 20 m), depths (3, 5, 10 m), and lengths (10, 20, 40 m), monitoring the maximum pipe crown temperature as the convergence metric. The results are summarized in Table 2. The maximum deviation in all directions is less than 1%, confirming that the adopted domain dimensions (5 m depth × 10 m width × 20 m length) have reached a stable plateau and adequately approximate a semi-infinite space. The boundary settings, therefore, do not affect the reliability of the results. The final pipe–soil mesh model is shown in Figure 1.

2.2. Experimental Device and Method

2.2.1. Pipeline Materials

The pipe–soil model is divided into three parts: the PE anti-corrosion layer, the pipe, and the soil. Material parameters are shown in Table 3. Among these, the Young’s modulus of the PE coating (400 MPa) is approximately 1/500 of that of X80 steel (2.07 × 10⁵ MPa), contributing negligibly to the overall stiffness of the pipe–soil system. In addition, its thermal conductivity is considerably lower than that of both the soil and the steel pipe, while its thickness is much smaller than both the pipe wall thickness and the soil cover depth, thereby limiting its influence on the transient temperature field through thermal storage. Therefore, the PE coating was modeled using constant material properties, and its thermal degradation and mechanical deterioration at elevated temperatures were neglected. For the X80 pipeline steel, however, temperature-dependent thermophysical and mechanical properties were adopted to account for material degradation at elevated fire temperatures. These properties are listed in Table 4 and Table 5, respectively, with values at intermediate temperatures obtained by linear interpolation during the finite element analysis.

2.2.2. Heat Transfer Settings

During a wildfire, heat is transferred to the surrounding environment by hot air through convection and radiation. To facilitate numerical convergence, tie constraints were employed to couple the thermal contact interfaces between the pipe and the anti-corrosion coating, as well as between the coating and the surrounding soil. Although this modeling strategy may lead to slightly conservative predictions of the thermal response, it is considered acceptable for the purpose of assessing the safety margin of buried pipelines under extreme fire conditions. In this study, the buried pipeline segment has a length of 20 m, and the design flow velocity of natural gas ranges from 10 to 15 m/s. Correspondingly, the residence time of the gas flowing through this segment is only 1.3 to 2.0 s. Within such an extremely short duration, the temperature variation of natural gas can be disregarded. Therefore, a constant convective heat transfer coefficient of 1865.2 W/(m2·K) was assigned to the pipe–gas interface in the thermal model.
In this study, the soil medium can be idealized as an isotropic homogeneous material. Given the burial depths of 0.2–0.8 m, field measurements from 55 wildfires compiled by Doerr et al. [16] indicate that extreme heating is largely confined to the top few centimeters of the soil, with temperatures rarely exceeding 300 °C below 0.5 cm. Moreover, Janssens [14] showed that neglecting moisture evaporation in soil heat conduction models yields conservative temperature predictions, which is appropriate for a parametric sensitivity study. This limitation has been acknowledged in Section 5. The initial temperature of the soil and pipes is set to 20 °C. The bottom of the soil, because heat cannot be transferred away, is set to a constant temperature of 20 °C. The soil surface is set according to the ISO 834 [17] temperature rise curve, which serves as a standardized conservative design thermal load rather than a realistic wildfire temperature history [18]. This conservative treatment follows the engineering practice of adopting design-basis loads for infrastructure integrity assessment and is consistent with recent wildfire soil-heating studies that employed conservative surface thermal boundaries to evaluate upper-bound subsurface temperature rise [12]. Given these considerations, the use of the ISO 834 curve as a conservative thermal boundary is considered acceptable for the parametric investigation presented in this study.

2.2.3. Setting the Duration of Fire on the Soil Surface

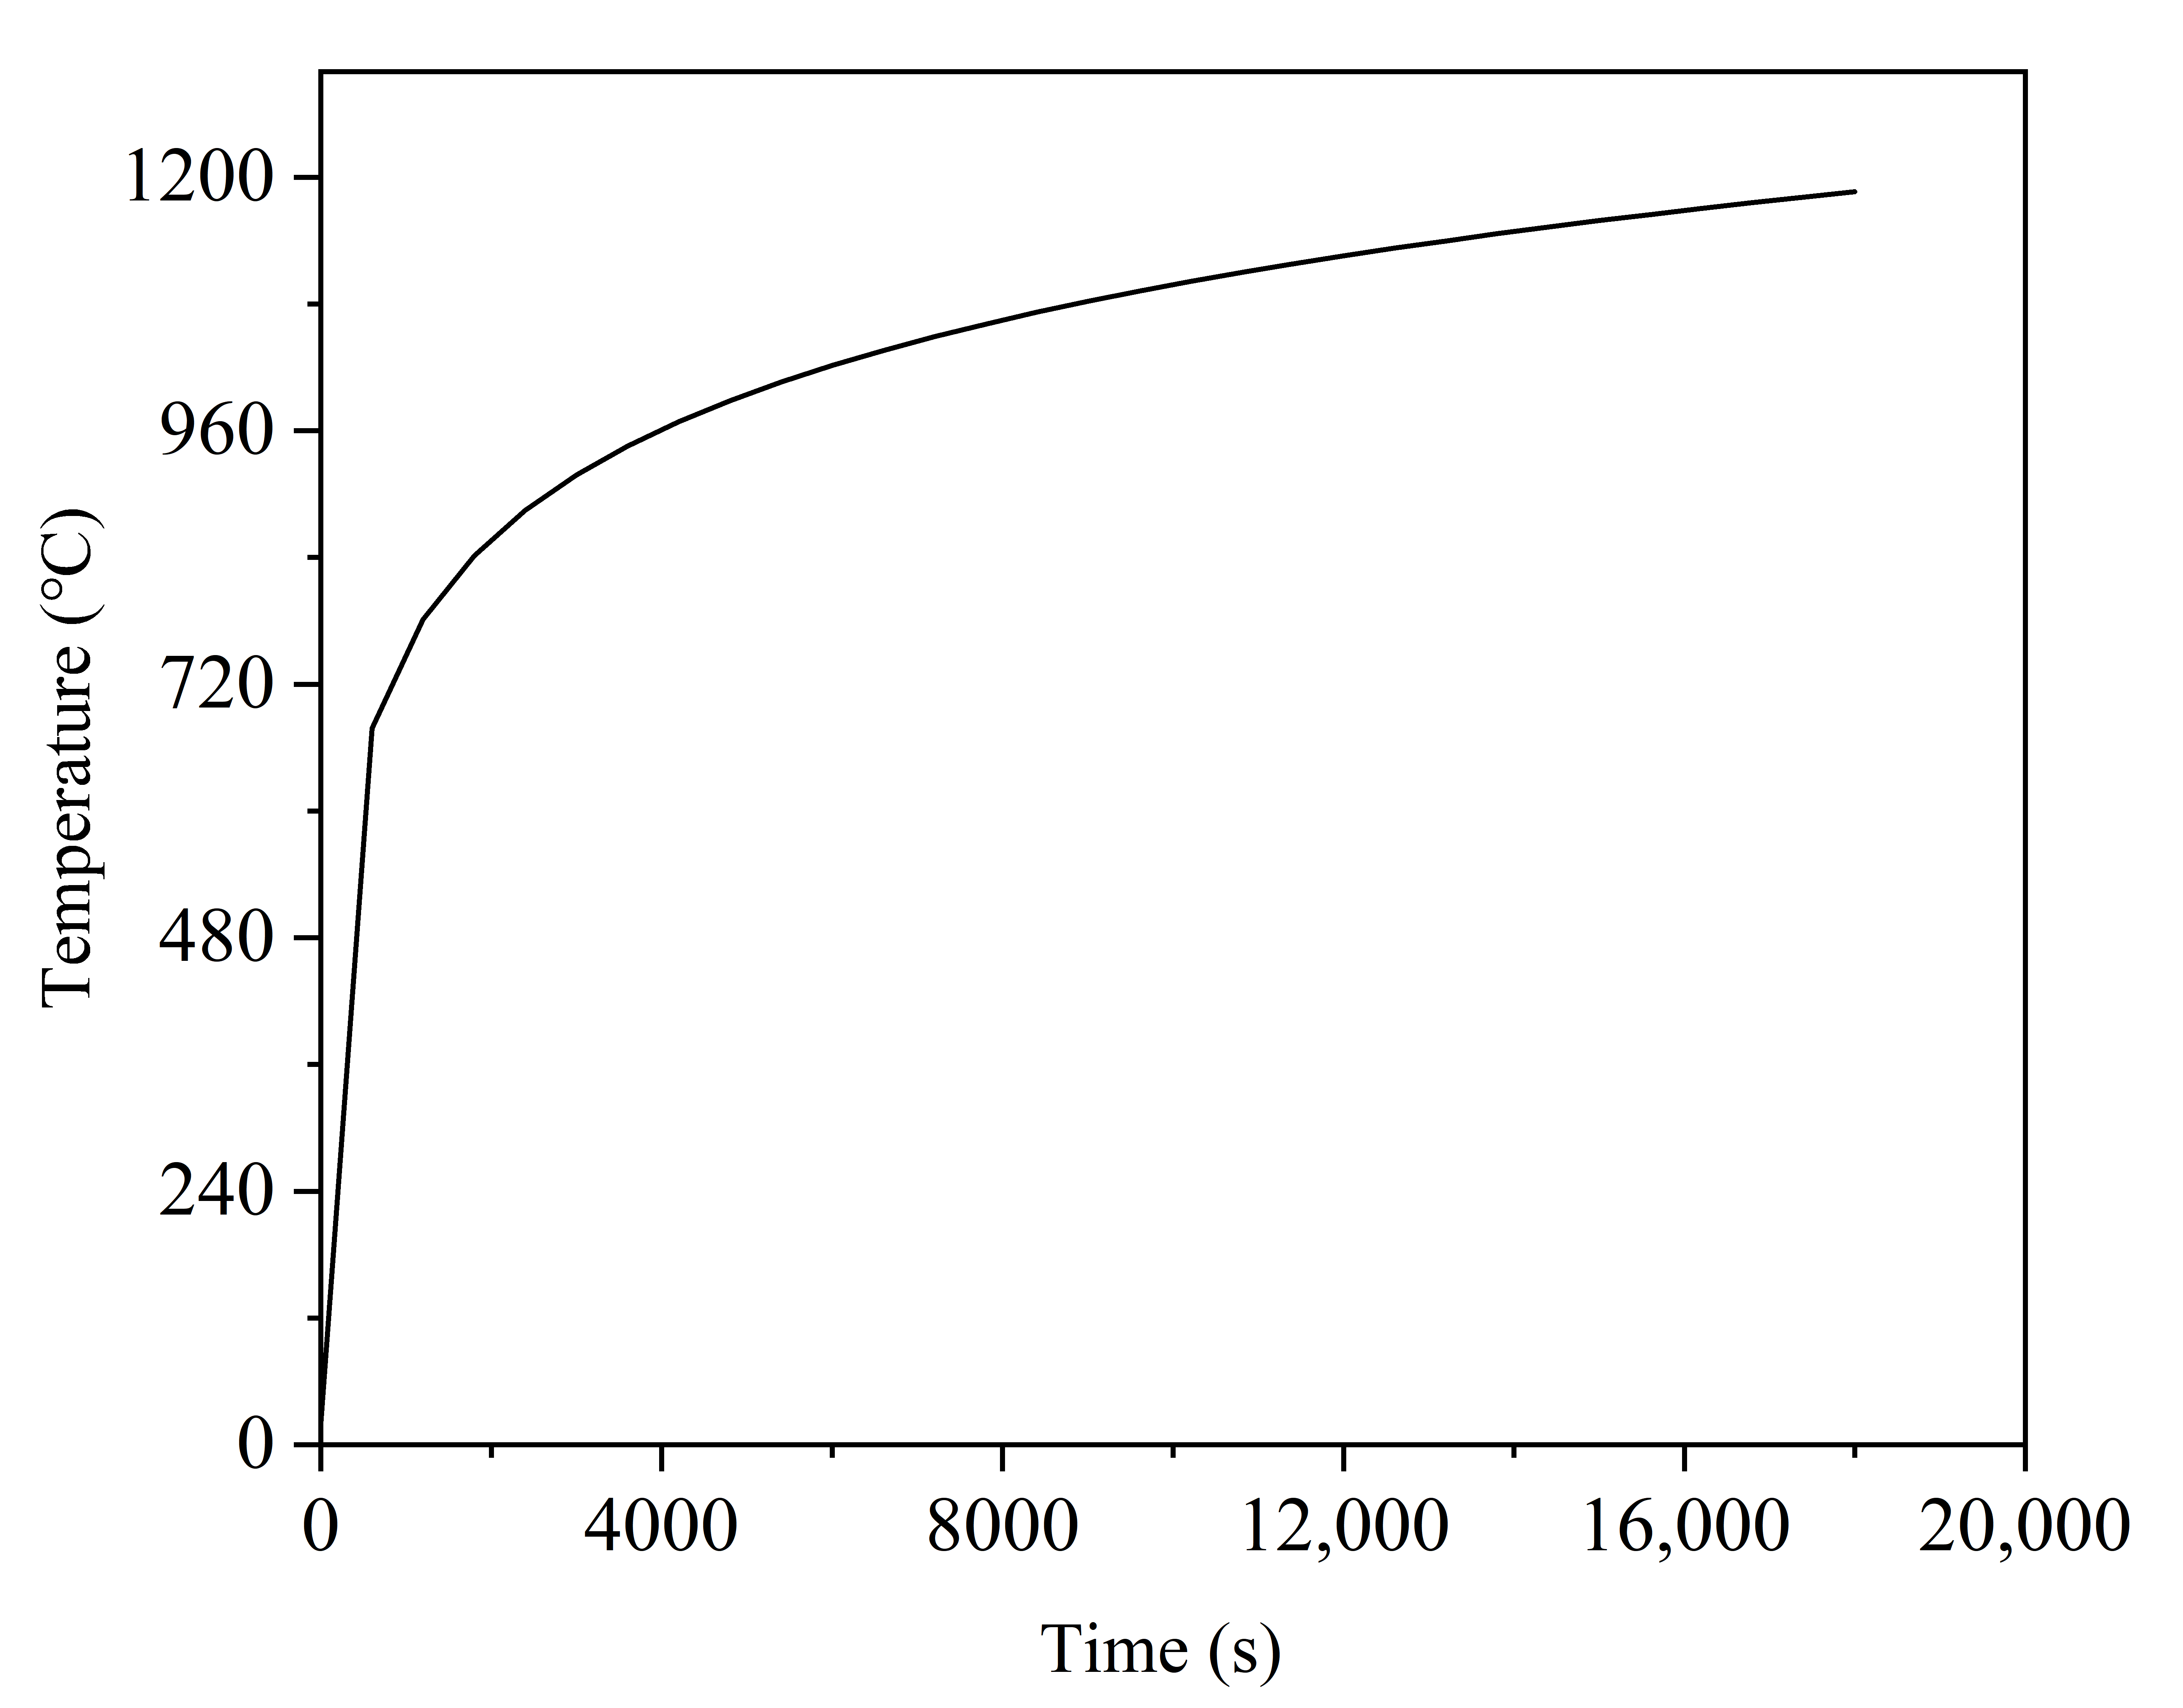
Among the various fire temperature–time curves, the ISO834 curve balances standardization and generality, avoiding the drawbacks of other curves that are highly scenario-specific and have narrow applicability. Its parameters are simple and have clear physical meaning, requiring no complex calibration and fitting multiple fire types [19,20,21]. Therefore, in this simulation experiment, the ISO834 curve is applied to the soil surface. Its mathematical expression is as follows:
T g = 20 + 345 log 10 ( 8 t + 1 )
where Tg is the gas temperature at time t, °C; t is the flame burn duration, minute; and log10 represents the logarithm with base 10.
The ISO 834 standard temperature–time curve shown in Figure 2 is selected. It is assumed that during the wildfire from 0 to 17,999 s, the soil surface temperature gradually increases to a maximum of 1186 °C. At 18,000 s, the fire is extinguished. From 17,999 to 39,600 s, the soil surface temperature decreases linearly from 1186 °C to the ambient temperature of 20 °C. From 39,600 to 86,400 s, the heat in the upper soil gradually transfers and diffuses toward the bottom.

2.2.4. Static Analysis Setup

The X80 pipeline steel is modeled using the classical metal plasticity model. The material follows the von Mises yield criterion with isotropic hardening. The initial yield stress of the steel is set to 552 MPa and varies with temperature, with the yield strength reduction factors referenced to Eurocode 3 [22]. In the thermal-stress analysis of this study, a tie constraint was applied to simulate the interaction between the pipeline and the anti-corrosion coating, while a friction coefficient of 0.12 [23] with hard contact (allowing separation) in the normal direction was defined for the coating–soil interface. When performing thermal–mechanical coupling, gravity, pipe pressure, boundary conditions, and predefined fields must be applied to the finite element model. In this model, a downward gravitational acceleration of 9.8 m/s2 along the Y direction is first applied to the pipe–soil model, and an internal pipe wall pressure of 8 MPa is applied. Then, to define displacement/load constraints, the model’s spatial degrees of freedom are constrained in this step. Because the model is in a semi-infinite space, Z-direction constraints are applied to the two faces at the front and back of the pipe axis and to the two front and back faces of the soil, while the bottom surface of the soil is fully constrained and X-direction constraints are applied to the left and right faces of the soil [24]. Finally, the temperature field results from the heat transfer analysis are imported as a predefined field into the static analysis step.

2.2.5. Simulation Scheme and Approach

First, perform a finite element analysis of the temperature changes in the pipe–soil model under fire conditions and then use the temperature field as the predefined field for a stress analysis to carry out a sequentially coupled analysis of thermal stress under fire action. Employ the control variable method to study the effects of various influencing parameters on the pipeline temperature field and mechanical performance and finally design an orthogonal experiment to evaluate the sensitivity patterns of thermal stress on buried X80 pipelines under forest fire conditions.
The numerical simulation schemes are shown in Table 6. Schemes 1–4 study the effect of pipeline burial depth on the pipeline temperature field and stress. The pipe outer diameter is 1.219 m, the internal pipe pressure is 8 MPa, the soil thermal conductivity is 1.5 W/(m·K), the fire duration is 11 h, and the range of pipeline burial depth for the fire is 0.200–0.800 m. Schemes 5–8 study the effect of changes in pipe outer diameter on the pipeline temperature field and stress. The initial natural gas pressure inside the pipe is 8 MPa, the pipeline burial depth is 0.250 m, the soil thermal conductivity is 1.5 W/(m·K), the fire duration is 11 h, and the range of pipe outer diameter is 1.067–1.422 m. For the parametric study, the wall thickness for each outer diameter was determined in accordance with GB 50251-2015 [25], based on the baseline pipe of Φ1219 × 18.4 mm and maintaining a constant diameter-to-thickness ratio. The corresponding wall thicknesses are 16.0 mm for Φ1067 mm, 16.8 mm for Φ1118 mm, and 22.4 mm for Φ1422 mm. Schemes 9–12 study the effect of internal pipe pressure. The pipeline burial depth is 0.250 m, the pipe outer diameter is 1.219 m, the soil thermal conductivity is 1.5 W/(m·K), the fire duration is 11 h, and the range of initial natural gas pressure inside the pipe is 2.00–8.00 MPa. Schemes 13–16 study the effect of soil thermal conductivity. The pipe outer diameter is 1.219 m, the internal pipe pressure is 8 MPa, the pipeline burial depth for the fire is 0.250 m, the fire duration is 11 h, and the soil thermal conductivity is 1–3.5 W/(m·K). Schemes 17–36 study the effect of fire duration on the pipeline. The pipe outer diameter is 1.219 m, the internal pipe pressure is 8 MPa, the soil thermal conductivity is 1.5 W/(m·K), the pipeline burial depth for the fire is 0.500–1.500 m, and the fire duration is 24–120 h. The parameter ranges in Table 6 were determined based on engineering practice and literature precedents. The burial depth range (0.2–0.8 m) covers the typical installation depths of gas pipelines in mountainous forested areas in China, as documented in field surveys of the China–Myanmar pipeline. The pipe diameters (1067–1422 mm) and internal pressures (2–8 MPa) follow GB 50251-2015. The ranges of soil thermal conductivity (1.0–3.5 W/(m·K)) and fire duration (up to 120 h) are consistent with previous numerical studies on wildfire-induced soil heating [12].

2.3. Model Validation

Direct experimental validation was difficult to conduct in this study due to the lack of appropriate fire-testing facilities and the practical challenges associated with deploying and maintaining temperature sensors at multiple depths within the soil during a high-temperature wildfire event. To address the absence of experimental fire test data, the present numerical model was quantitatively benchmarked against the classical one-dimensional transient heat conduction solution for a semi-infinite solid subjected to a step-change in surface temperature, as formulated by Carslaw and Jaeger [26]. The benchmark was performed using a bare soil model without the buried pipeline, with soil properties as given in Table 3 and the same fire temperature history as in the subsequent pipe–soil simulations. Analytical temperatures at four representative depths (0.2, 0.4, 0.5, and 0.8 m) were calculated at t = 24 h and compared with the corresponding finite element predictions. As summarized in Table 7, the relative deviations between the analytical and numerical results range from 7.1% to 13.7%, with a mean absolute relative deviation of approximately 10.6%. These differences are considered acceptable for engineering-oriented parametric studies involving complex transient thermal boundary conditions. The satisfactory agreement across the four burial depths indicates that the numerical model can reasonably reproduce the transient heat conduction response of the soil under the prescribed fire-heating conditions.

3. Factors Affecting Temperature-Stress Fields in Buried Pipelines

3.1. Influence of Pipeline Burial Depth

3.1.1. Temperature Field Analysis

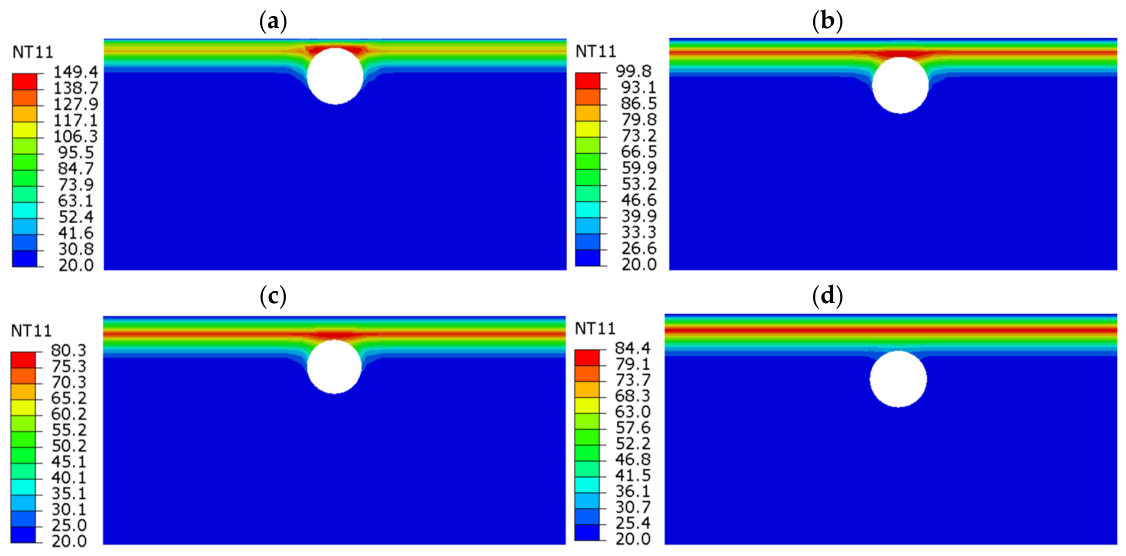
Set the pipeline burial depths to 0.2 m, 0.4 m, 0.5 m, and 0.8 m, and analyze the variation of the pipeline temperature-stress field. The temperature distribution is shown in Figure 3. From the figure, when t = 86,400 s (24 h) and H = 0.2 m, the soil temperature near the pipeline reaches a maximum of 149 °C. When t = 86,400 s (24 h) and H = 0.4 m, the maximum nearby soil temperature is 99.8 °C. When t = 86,400 s (24 h) and H = 0.5 m, the maximum nearby soil temperature is 80.3 °C. When t = 86,400 s (24 h) and H = 0.8 m, the pipeline almost does not affect heat transfer in the soil, and the maximum nearby soil temperature is 84.4 °C. As the burial depth increases, the region of highest soil temperature observed at the final simulation time (24 h) shifts farther away from the pipeline. The final soil heat distribution also varies with burial depth because the thermal conductivity of the X80 steel pipe differs significantly from that of the surrounding soil. At a burial depth of 0.8 m, the pipeline has almost no influence on the soil heat transfer. In contrast, a shallower pipe, such as that at 0.5 m, absorbs more heat from the surrounding soil, slightly reducing the nearby soil temperature. This explains why the 24 h soil temperature for a burial depth of 0.8 m (84.4 °C) is slightly higher than that for 0.5 m (80.3 °C). In general, the closer the pipeline is to the soil surface, the greater its thermal impact on the surrounding soil; the deeper it is buried, the less it affects the soil temperature field.
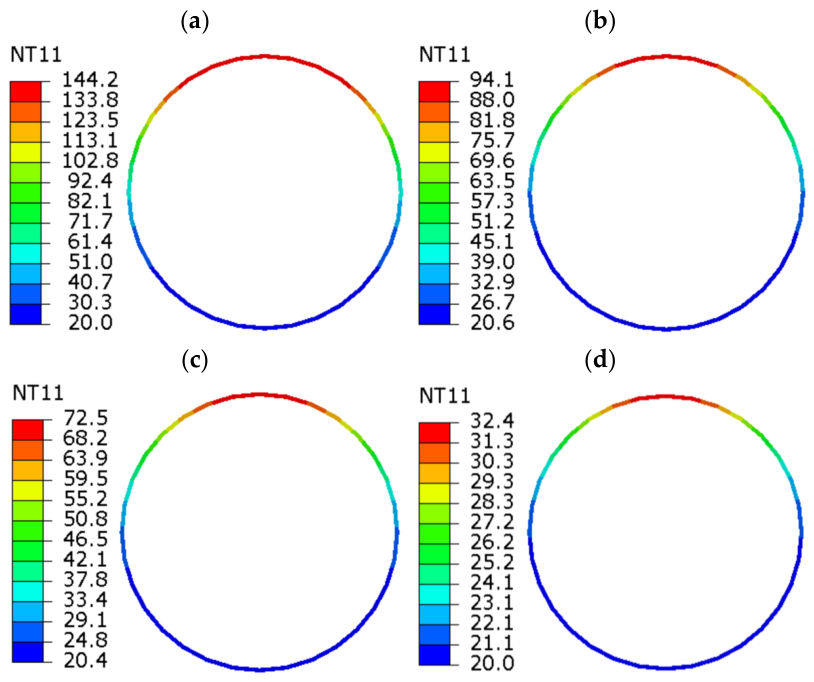
At 86,400 s (24 h), the pipeline temperature cloud maps at different depths are shown in Figure 4. From the figure, when the pipeline is buried at 0.2 m, the highest temperature at the pipeline surface transmitted from the surface fire through the soil is 144.2 °C. The high-temperature region is mainly distributed directly above the pipeline, with temperature decreasing downward; the lowest temperature is at the bottom of the pipeline, 21.9 °C. When the pipeline burial depths are 0.4 m, 0.5 m, and 0.8 m, the maximum temperatures experienced by the pipeline are 94.1 °C, 72.5 °C, and 32.4 °C, respectively. Therefore, as burial depth increases, the temperature distribution pattern remains basically unchanged, and the pipeline’s maximum temperature gradually decreases. When a surface fire occurs, the temperature distribution of a buried pipeline is not uniform: The pipe crown, being closer to the heat source, exhibits a higher temperature, whereas the invert, farther from the source, remains cooler and is less affected by the fire.
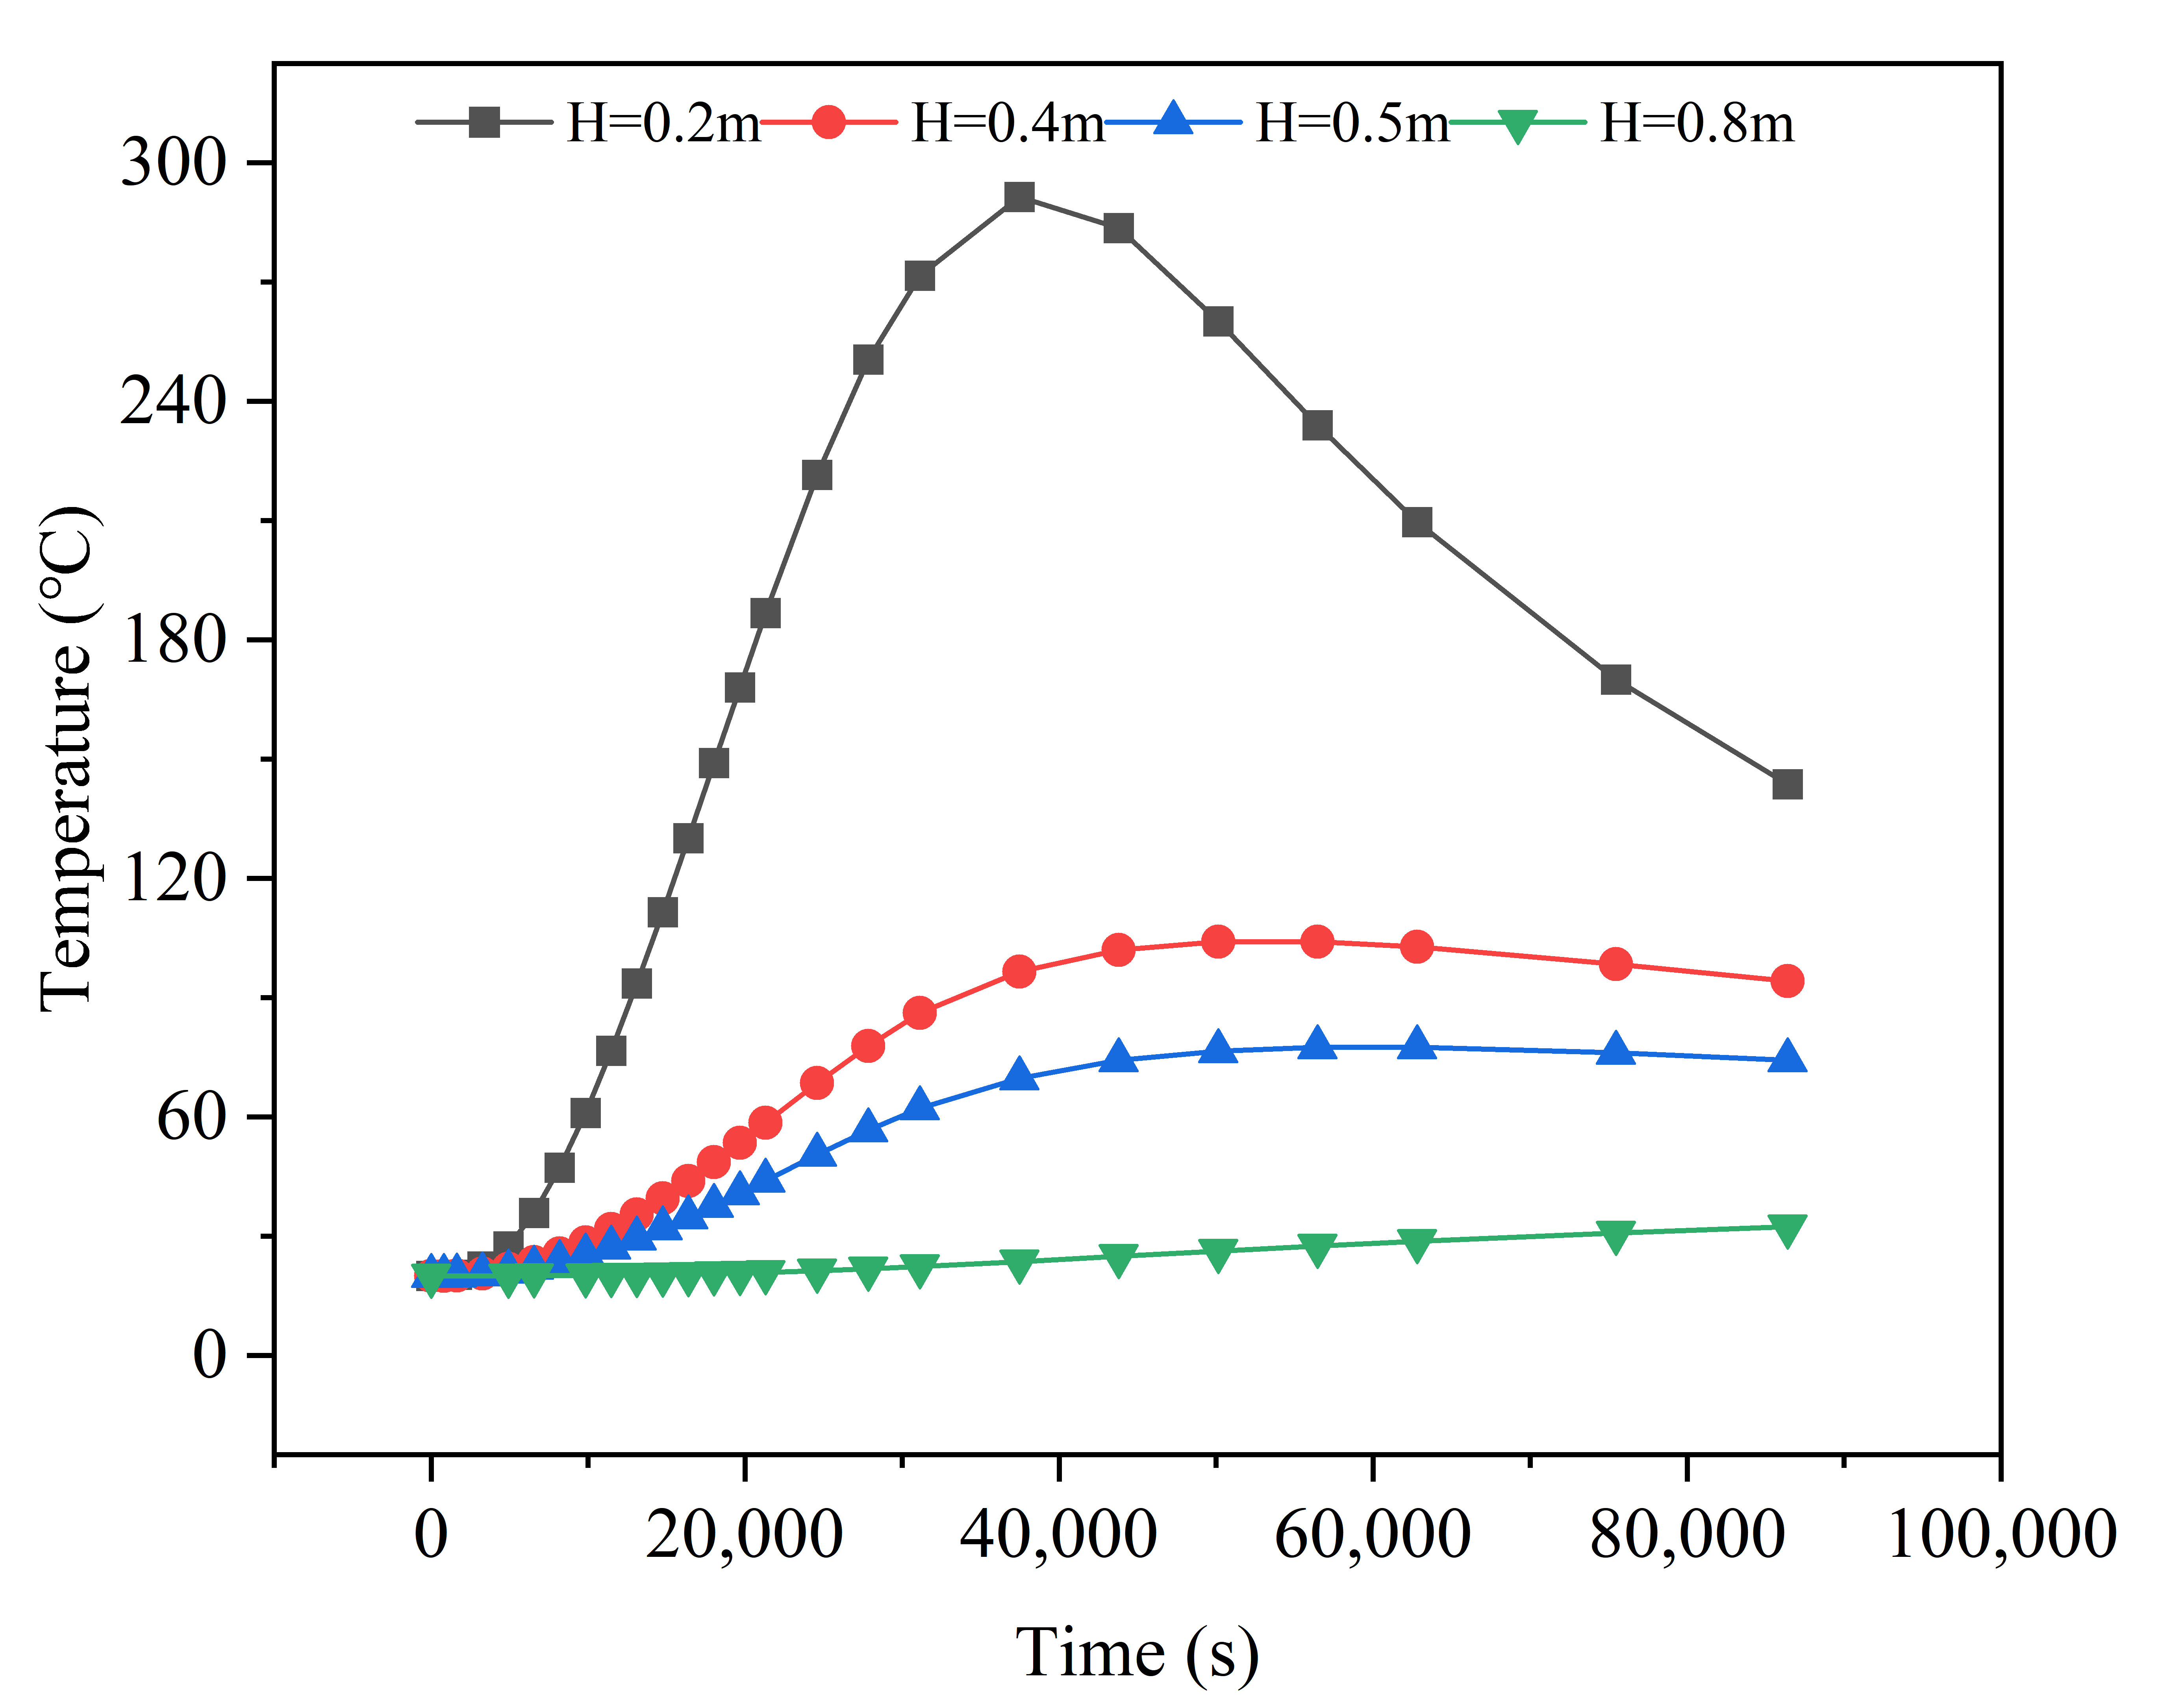
To observe how pipeline temperature changes over time, temperature variation data at the top of the pipe for different burial depths were extracted, as shown in Figure 5. When the pipe burial depth is 0.2 m, the highest temperature occurs at 37,465 s (10.41 h), reaching 291.4 °C, and then it steadily decreases over time, dropping to 144.2 °C at 86,400 s (24 h). The surface fire peaks at 18,000 s (5 h) and returns to ambient temperature at 39,600 s (11 h), but the pipe’s maximum temperature does not occur at either of these times, indicating that residual heat continues to propagate downward after the surface fire is extinguished. At a burial depth of 0.4 m, the maximum temperature occurs at 50,136 s (13.93 h), reaching 104.05 °C, and it falls to 94.1 °C at 86,400 s (24 h). At 0.5 m depth, the peak occurs at 65,536 s (18.2 h), with a maximum of 75.1 °C, decreasing to 72.55 °C at 86,400 s (24 h). At 0.8 m depth, the highest temperature occurs at 86,400 s, with a maximum of 32.4 °C. This temperature is significantly different from the maximum at 0.2 m depth, indicating that burial depth has a large effect on the impact of surface fire temperatures on the pipe.

3.1.2. Stress Field Analysis

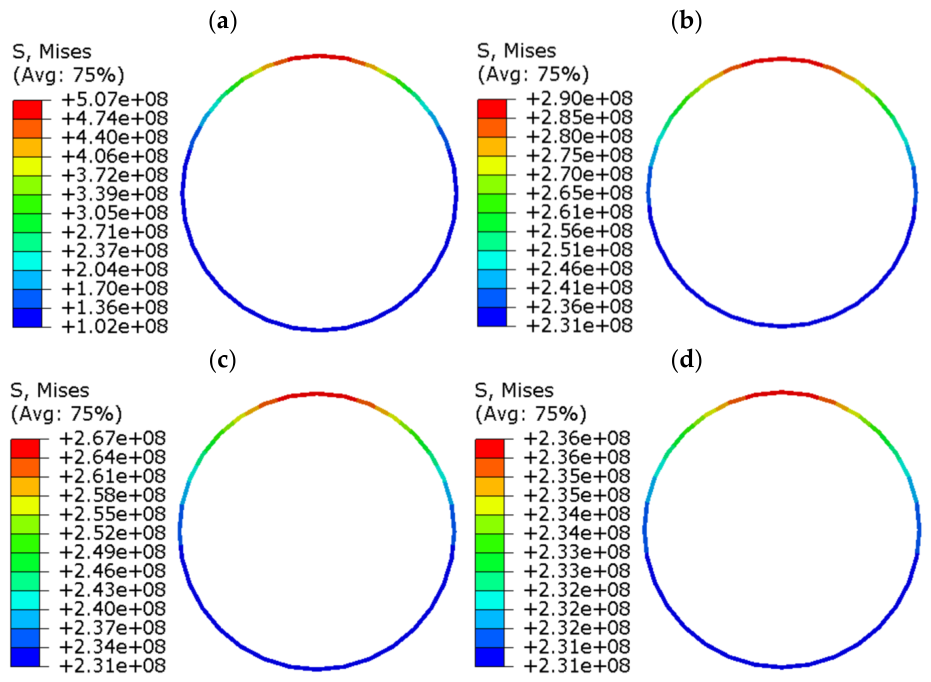
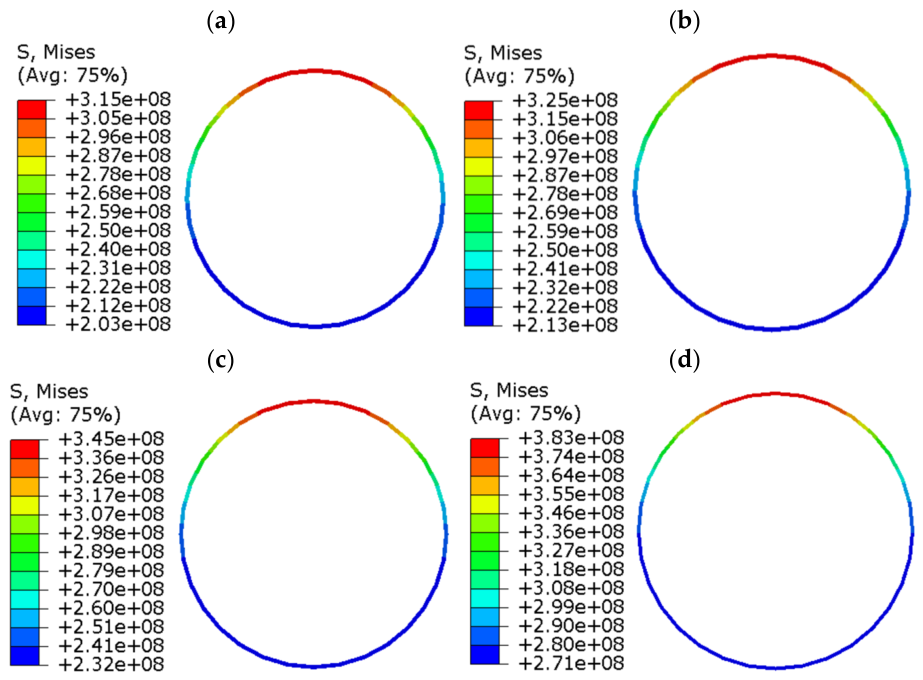
Figure 6 presents the peak von Mises stress contours of the pipeline for different burial depths. Under fire conditions, the stresses on the pipe differ with burial depth. At a burial depth of 0.2 m, the pipe’s maximum stress is 507 MPa. The maximum stress is distributed directly above the pipe and gradually decreases downward, with the minimum stress being 232 MPa at the bottom of the pipe. When the burial depths increase to 0.4 m, 0.5 m, and 0.8 m, the corresponding maximum stresses borne by the pipe are 290 MPa, 267 MPa, and 236 MPa, respectively. From the above analysis, it can be seen that the variation in pipe stress is due to the different temperatures experienced at different burial depths. The pipe at 0.2 m experiences higher temperatures and thus larger stresses. As burial depth increases, the temperature experienced by the pipe decreases and so does the stress. At 0.8 m, the pipe temperature shows no obvious change, and the stress differs from that at 0.2 m by about 118 MPa, indicating that thermal loads have a significant effect on pipe stress.
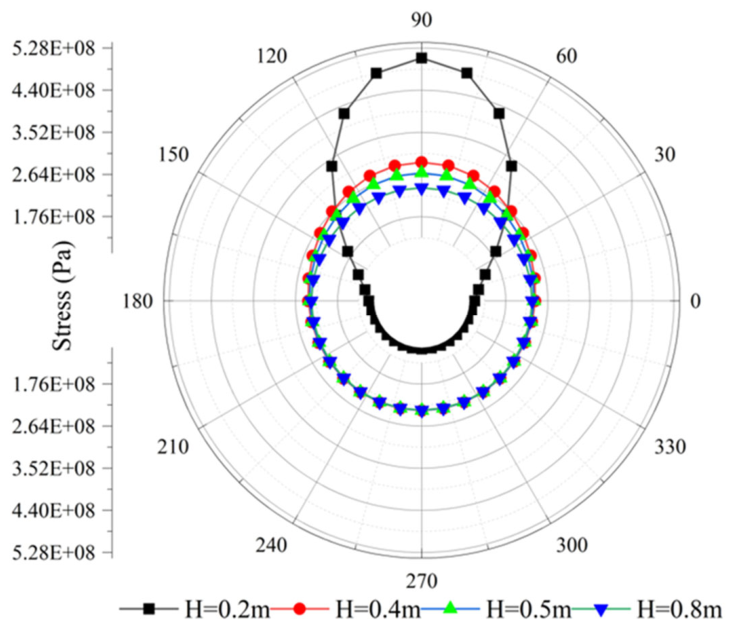
The circumferential stress distributions along the pipe wall at different burial depths are presented in Figure 7. For the 0.2 m depth, the peak stress occurs at 38,350 s; for the other depths, it occurs at 86,400 s due to the soil’s thermal buffering effect. At 0.2 m, the crown-to-invert temperature difference reaches ~270 °C, causing significant upward bending of the cross-section, which partially relieves the stress at the sidewalls and invert. By contrast, at 0.4 m, 0.5 m, and 0.8 m, the circumferential temperature differences drop to 74 °C, 52 °C, and 12 °C, respectively, allowing nearly uniform thermal expansion under soil confinement with no effective stress relief at the sidewalls and invert—resulting in higher stresses there than in the 0.2 m case. Overall, increasing burial depth leads to more uniform circumferential stress distributions and lower peak stresses. This non-uniform circumferential stress distribution reflects the effect of burial depth on cross-sectional stability. Burial depths below 0.3 m significantly increase the risk of sectional distortion and local buckling under fire conditions, which is particularly critical in fire-resistant pipeline design.

3.2. Influence of Pipe Outer Diameter

3.2.1. Temperature Field Analysis

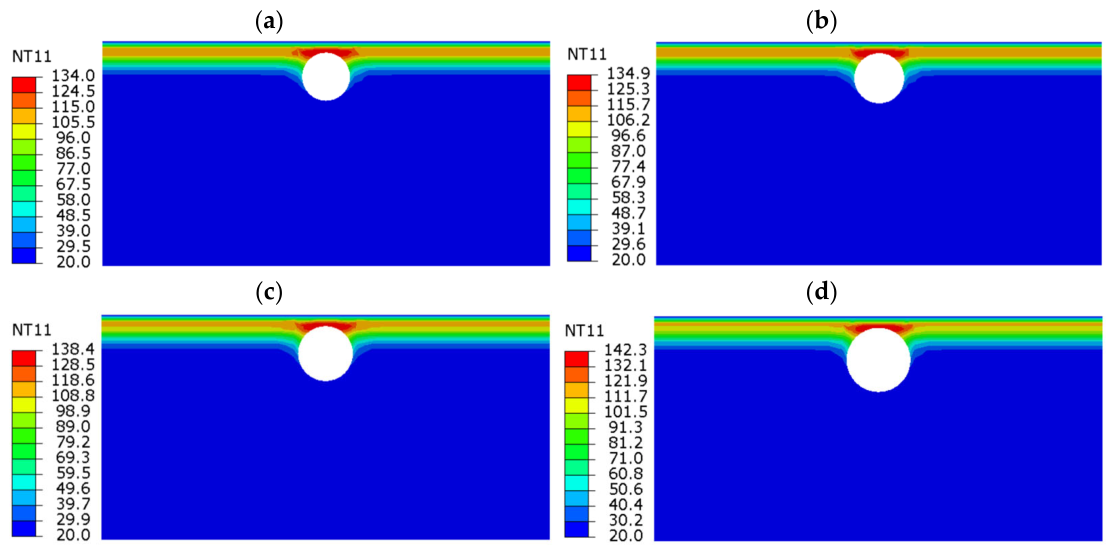
Figure 8 shows the soil temperature contours around the pipeline for different outer diameters at 24 h. When the distance between the pipe and the ground is the same, changes in pipe diameter will affect the temperature distribution of the soil and the pipe. When the pipe diameter is 1.067 m, the highest soil temperature near the pipe is 134 °C. When the diameter increases to 1.118 m, 1.219 m, and 1.422 m, the highest soil temperatures near the pipe are 134.9 °C, 138.4 °C, and 142.3 °C, respectively. From this, it can be seen that under the same burial depth conditions, the larger the pipe outer diameter, the higher the soil temperature nearby.
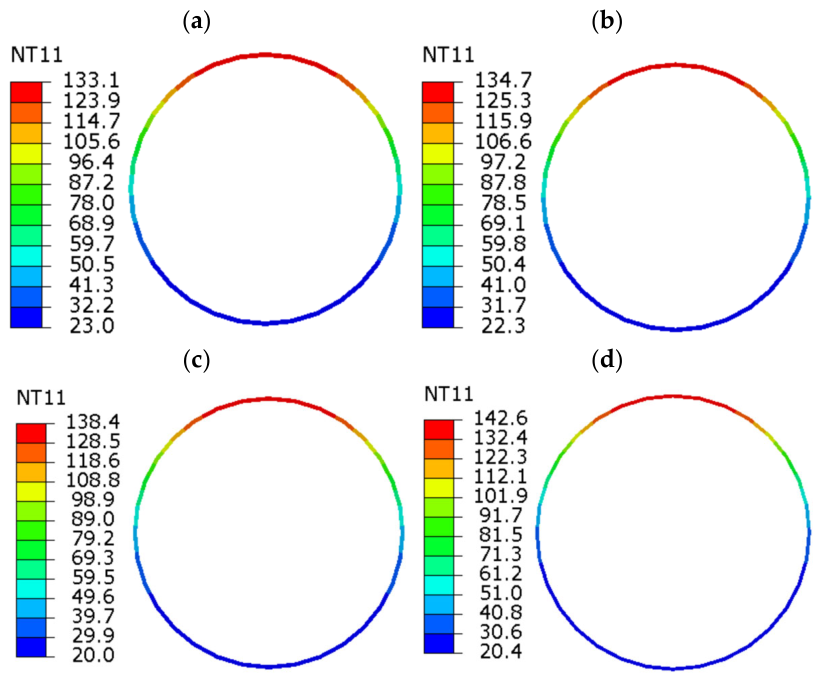
Figure 9 shows the temperature contours of the pipeline for different pipe diameters at 24 h. When the pipe diameter is 1.067 m, the maximum pipe temperature is 133.1 °C, located directly above the pipe, and the minimum temperature is 23.0 °C, located directly below the pipe. When the diameter is 1.118 m, the maximum and minimum temperatures are 134.7 °C and 22.3 °C, respectively. When the diameter is 1.219 m, the maximum and minimum temperatures are 138.4 °C and 20 °C, respectively. When the diameter is 1.422 m, the maximum and minimum temperatures are 142.6 °C and 20.4 °C, respectively. From this, it can be seen that as the outer pipe diameter increases, the heating effect at the top becomes more pronounced, the maximum temperature steadily rises, and the minimum temperature at the bottom continues to fall. With the surface fire location unchanged, increasing the pipe diameter keeps the vertical distance between the pipe top and the fire source surface essentially constant, enhancing the heat accumulation effect. The heat transfer path from the fire source to the bottom of the pipe is lengthened, increasing heat loss as it is conducted through the soil, causing larger diameters to exhibit more obvious bottom heat dissipation and an overall lower temperature.

3.2.2. Stress Field Analysis

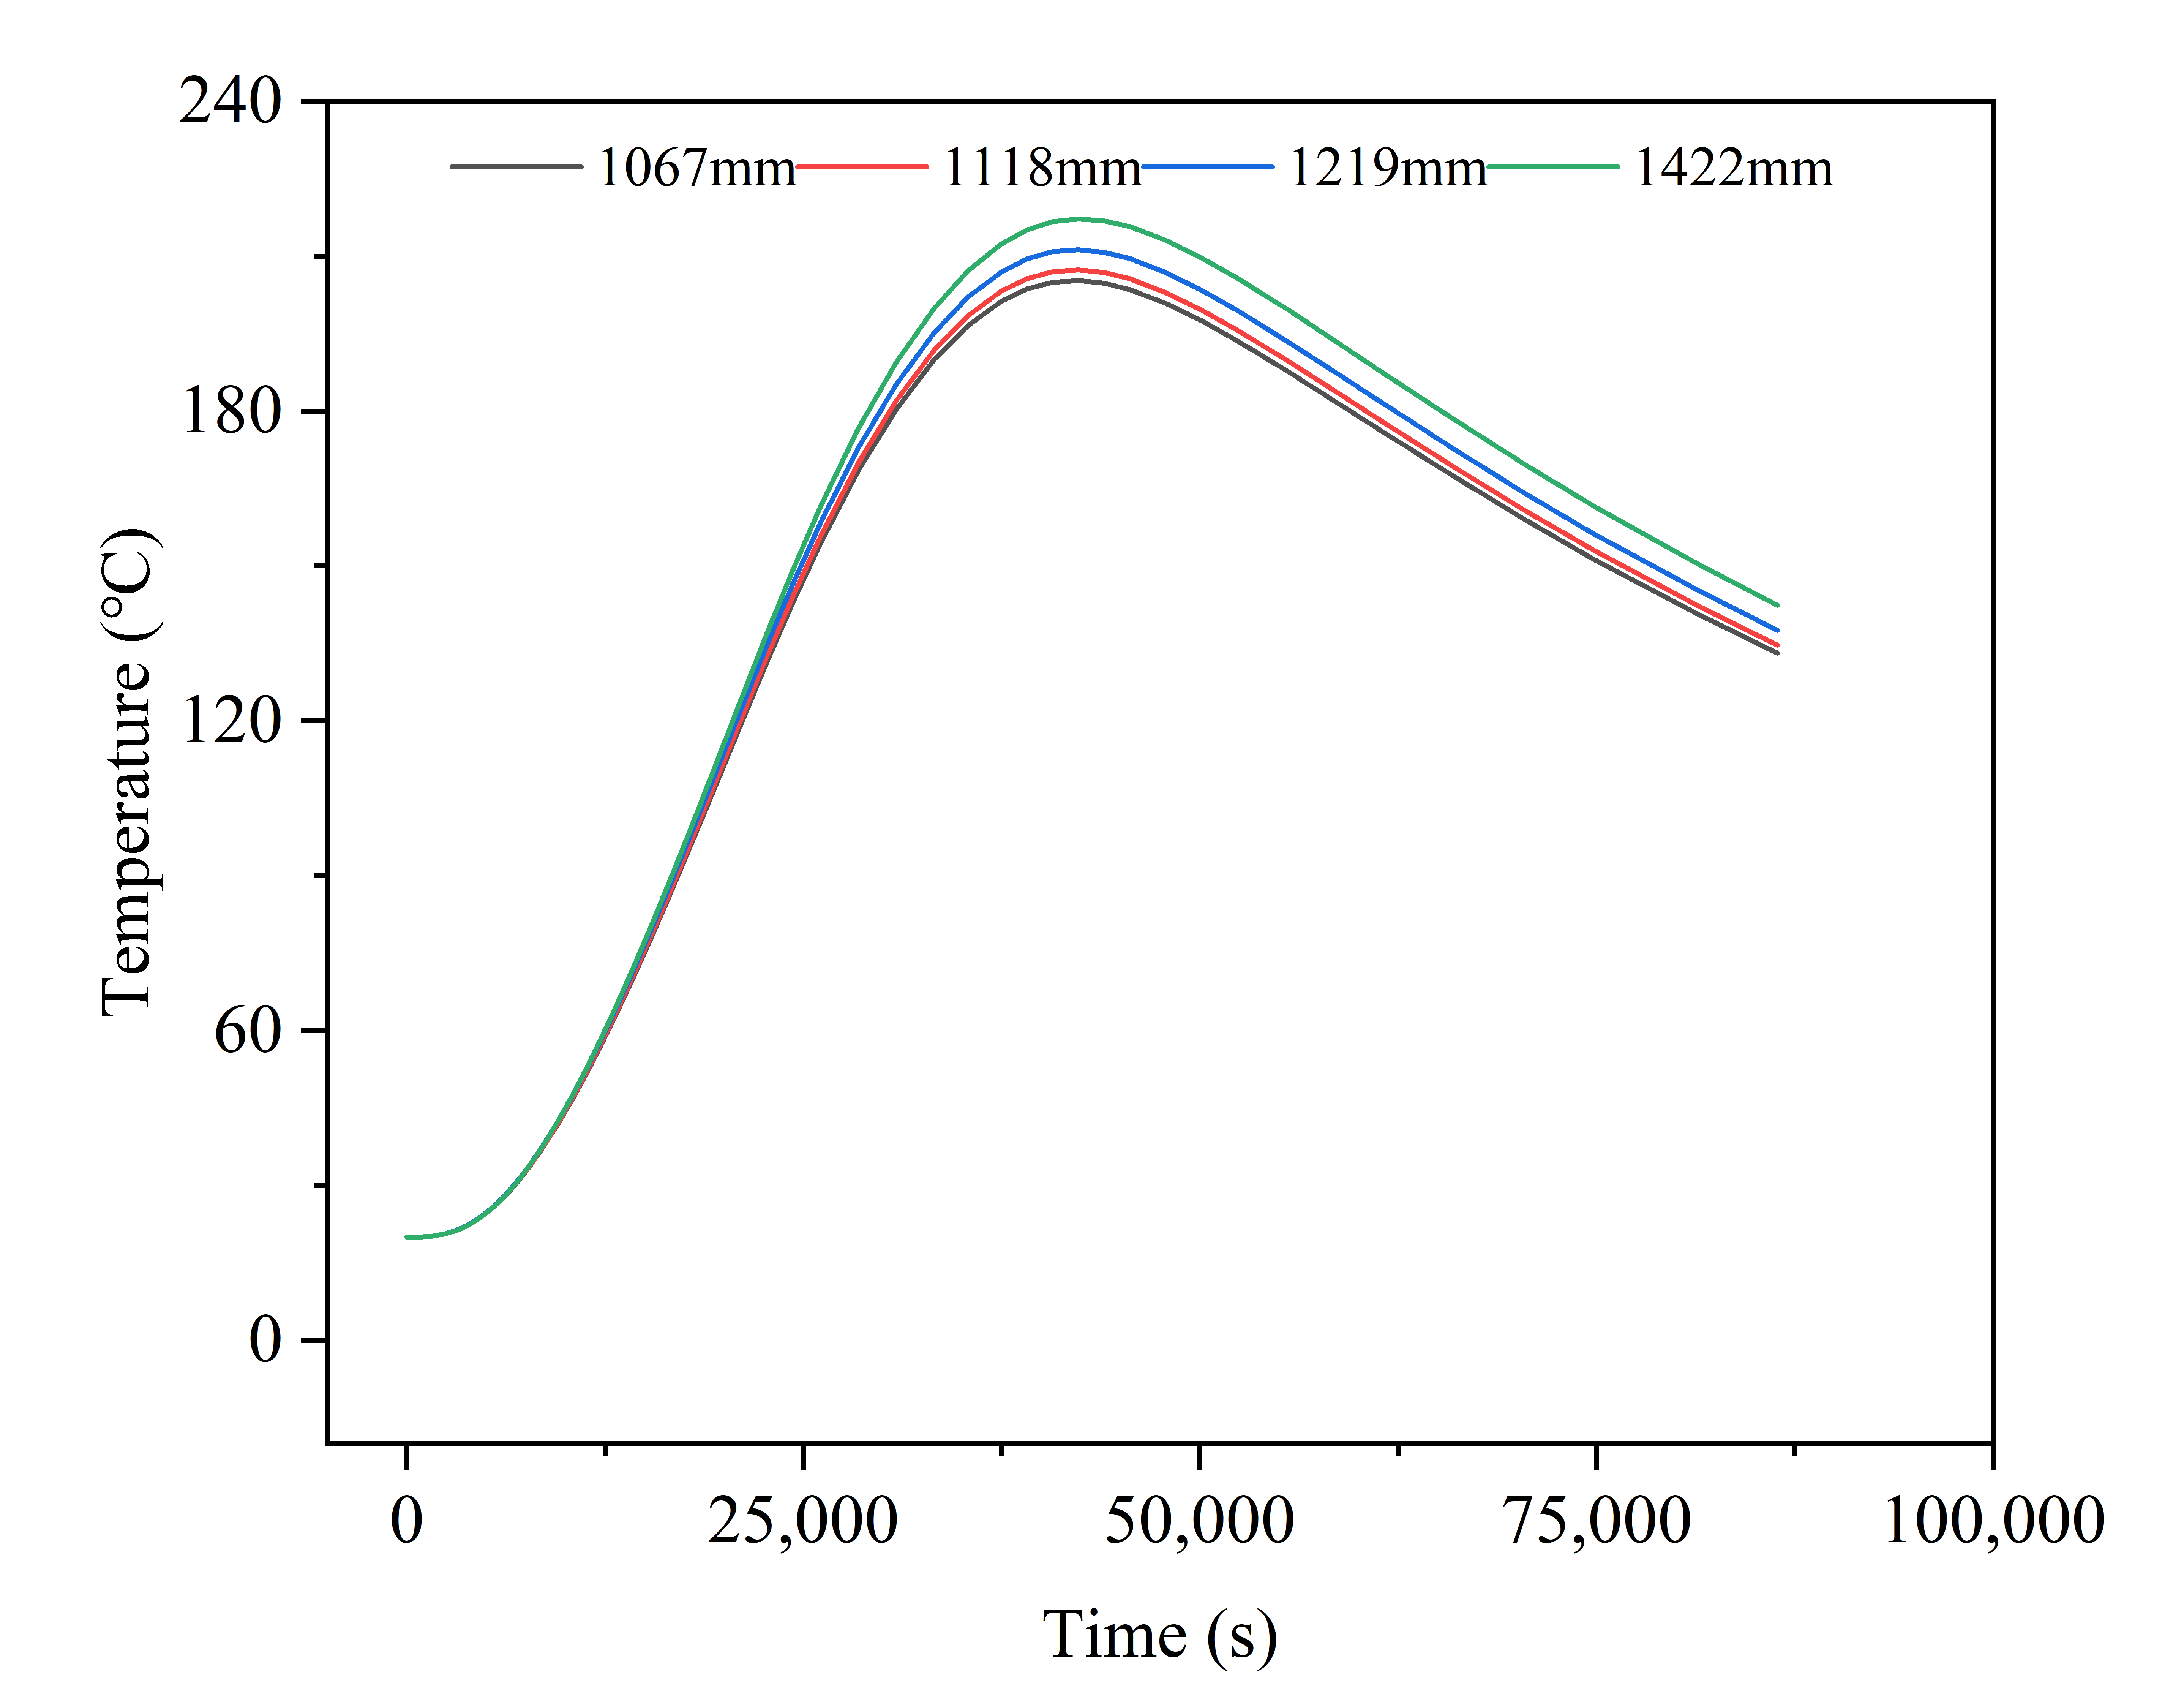
As shown in Figure 10, this is the variation trend of pipeline temperature with time for different pipe diameters. The figure shows that the temperature variation trends for the four diameters are highly consistent. During the fire action phase, the pipe temperature rises rapidly, reaches a peak at 40,000 s (11.11 h), and then gradually falls. The highest peak temperature occurs for the 1422 mm outer diameter, while the lowest is observed for the 1067 mm outer diameter. Compared with different burial depth conditions, the temperature curves for different outer diameters are more similar, indicating that the influence of pipe outer diameter on the temperature field is weaker than that of burial depth, indicating that burial depth is a more sensitive factor.
When the burial depth and fire duration are fixed, the peak von Mises stress contours of the pipeline for different outer diameters are shown in Figure 11. As can be seen, when the pipeline outer diameters are 1.067 m, 1.118 m, 1.219 m, and 1.422 m, the maximum stresses experienced by the pipe are 315 MPa, 325 MPa, 345 MPa, and 383 MPa, respectively. Under the same burial depth and fire duration, the overall stress on the pipeline increases with increasing outer diameter. The maximum stress is mainly distributed directly above the pipe, and the minimum stress is mainly distributed directly below the pipe. When the pipe outer diameter is increased by 33%, the maximum stress of the pipe body increases by 21.6%, and the minimum stress increases by 33.5%, indicating that changes in outer diameter have a significant effect on the overall stress distribution of the pipe and that larger-diameter pipelines carry a higher mechanical load risk under fire conditions.

3.3. Effect of Internal Pressure on the Pipeline

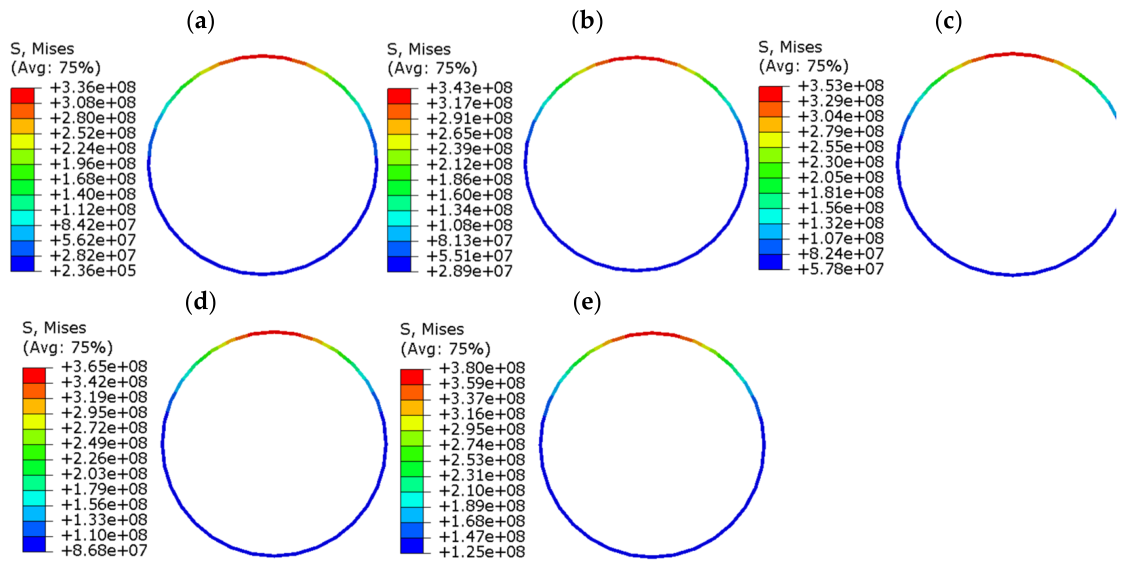
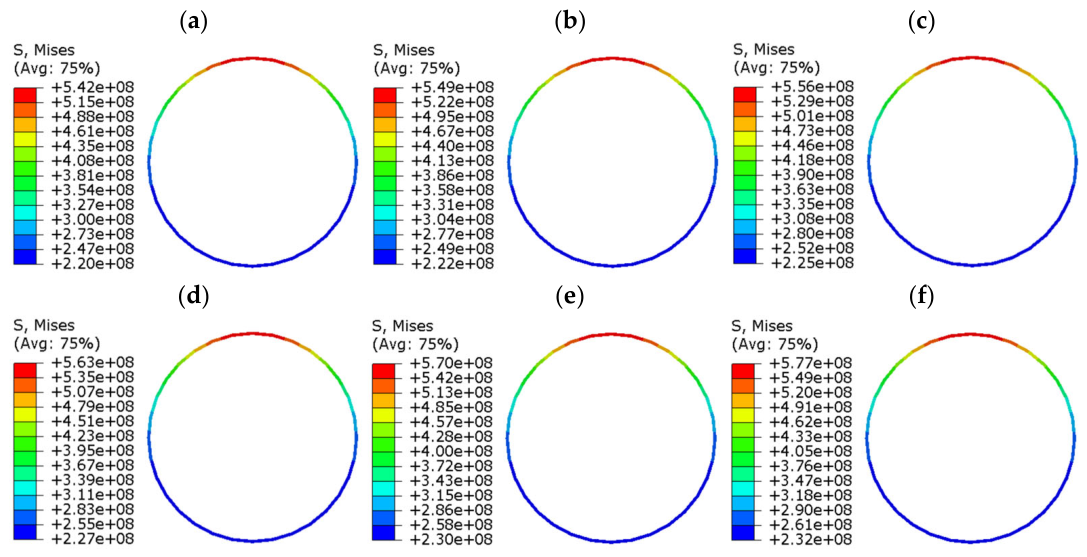
Natural gas transmission pipelines have internal pressure, which affects the pipe’s stress and deformation. Accordingly, based on pipeline operating conditions, the burial depth was set to 0.25 m, and a single-factor analysis was used to select internal fluid pressures of 2 MPa, 4 MPa, 6 MPa, and 8 MPa for the study. Peak von Mises stress contours of the pipeline under different internal pressures are shown in Figure 12. When the internal pressure increases from 2 MPa to 8 MPa, the peak von Mises stress increases from 336 MPa to 343 MPa, 353 MPa, 365 MPa, and 380 MPa.
To separate the pressure-induced contribution from the total von Mises stress, the pipe crown stress was evaluated at the same representative instant t = 12 h under varying internal pressures from 0 to 8 MPa, with all other thermal and boundary conditions held constant. Under the conditions of Schemes 9–13, the peak thermal stress consistently occurs at approximately 12 h across all pressure levels, allowing a meaningful decomposition of the total stress into its pressure- and fire-induced components. As shown in Table 8, when the internal pressure increases from 0 to 8 MPa, the pressure-induced stress increment rises from 0 to 44 MPa, corresponding to a relative increase of approximately 13.1%. This modest variation confirms that internal pressure plays a secondary role compared with thermal loading. The total von Mises stress comprising both pressure- and fire-induced contributions is, therefore, retained as a consistent indicator for scenario comparison, while the pressure effect is separately quantified in Table 8. This relatively modest increase confirms that internal pressure has a secondary influence on the peak stress during fire exposure compared with burial depth and pipe outer diameter.

3.4. Influence of Soil Thermal Conductivity

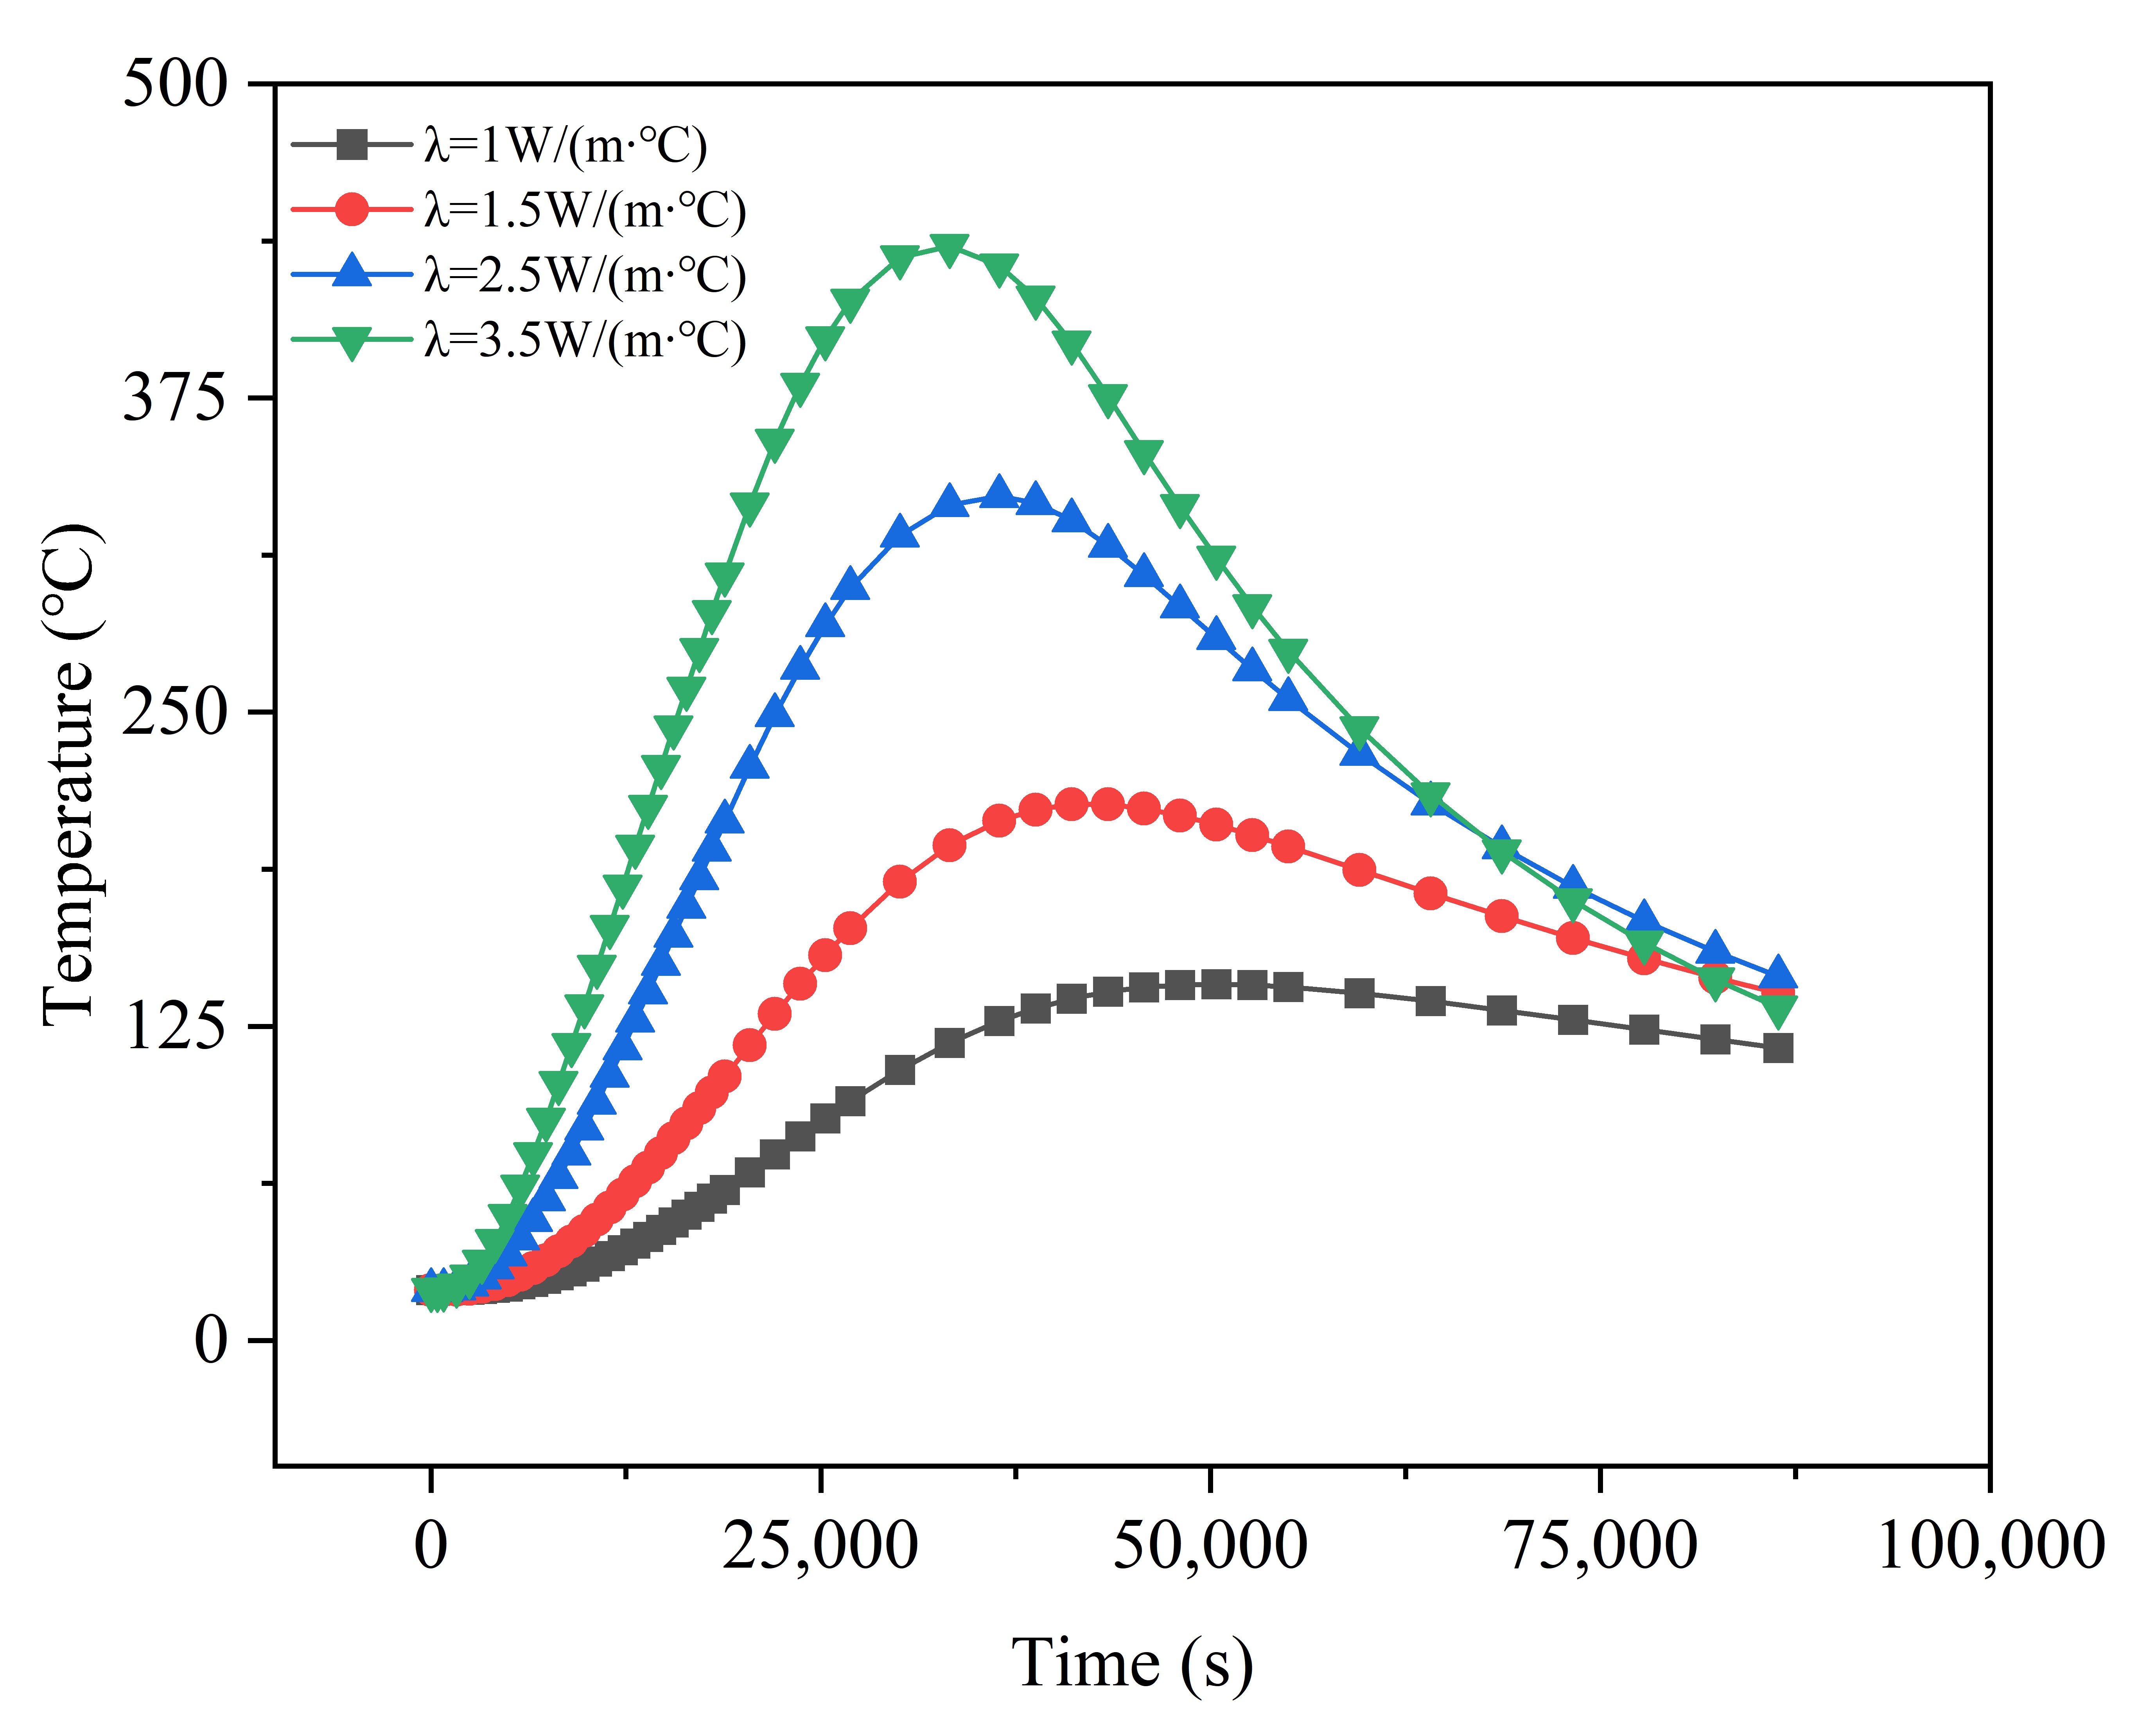
Thermal conductivity is defined as the amount of heat transferred per unit time through a unit area of material under a unit temperature gradient. It is an important parameter characterizing a material’s heat transfer capability, directly determining the soil’s heat transfer ability and thus affecting the temperature change in buried pipelines. Thermal conductivity values of 1.0, 1.5, 2.5, and 3.5 W/(m·K) were selected for the parametric study. These values cover the typical ranges for sands, silts, clays, and loams documented in ASHRAE [27] and Abu-Hamdeh and Reeder [28] and are representative of common backfill soils under different moisture and compaction conditions. Figure 13 shows the variation of the pipeline top temperature with time under different soil thermal conductivities. As shown, when the thermal conductivity λ = 3.5 W/(m·°C), the pipeline top reaches its maximum temperature of 435.4 °C at about 33,269 s (9.24 h). With λ = 2.5 W/(m·°C), the pipeline top reaches its maximum temperature of 336 °C at about 36,460 s (10.13 h). With 1.5 W/(m·°C), the pipeline top reaches its maximum temperature of 213.3 °C at about 41,092 s (11.41 h). When the thermal conductivity is 1 W/(m °C), the pipeline top reaches its maximum temperature of 141.4 °C at about 52,672 s (14.63 h). Comparing the temperature variation of the pipeline top under different soil thermal conductivities shows that the higher the soil thermal conductivity, the faster the pipeline temperature rises, and the greater the heat transferred from the soil to the pipeline. Therefore, in areas with high soil thermal conductivity, fires should be extinguished promptly to prevent rapid conduction of fire heat to the pipeline.

3.5. Influence of Fire Duration

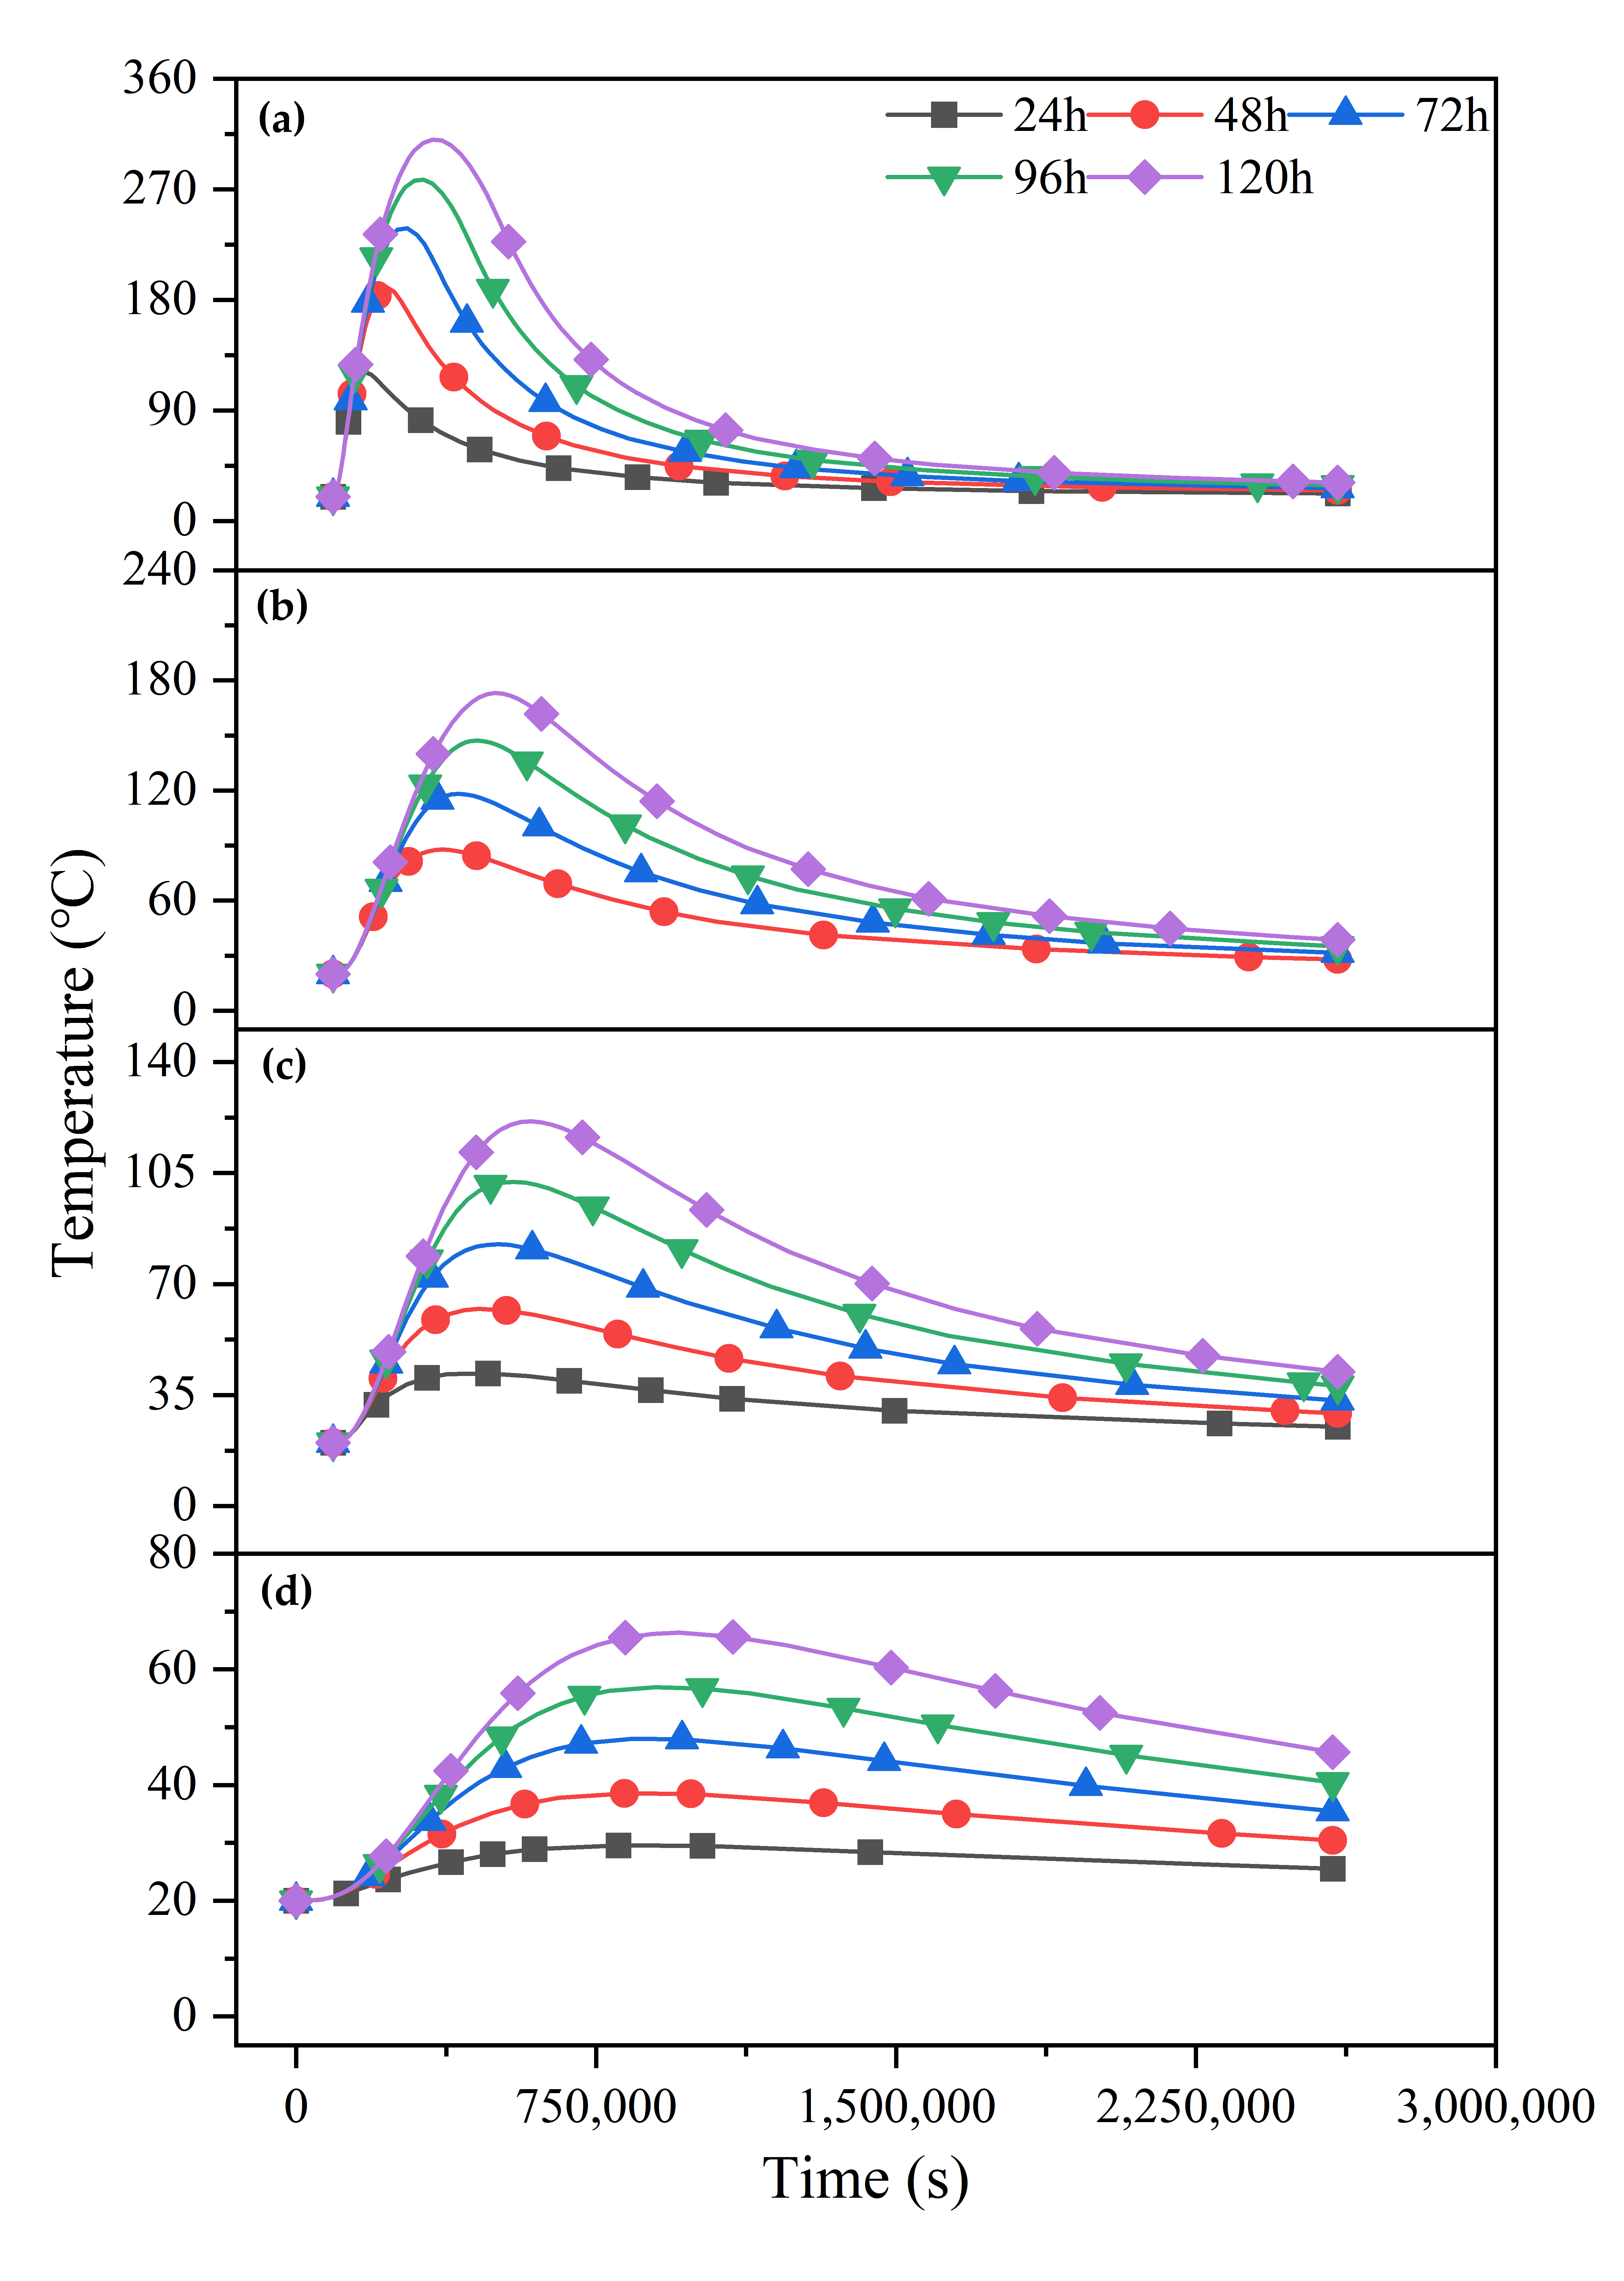
To investigate the effect of fire duration on the soil temperature field around the pipe, burial depths (soil cover above the pipe crown) of 0.5 m, 0.8 m, 1 m, and 1.5 m were selected as burial depth variables, and fire durations of 24 h, 48 h, 72 h, 96 h, and 120 h before extinguishment were set as time variables. Through numerical simulation, the evolution of the pipe temperature field within 720 h was analyzed, focusing on differences in peak pipe temperature, cooling rate, and thermal influence range under different conditions.
Figure 14 shows the pipe temperature variation under different fire durations for burial depths of 0.5 m, 0.8 m, 1 m, and 1.5 m. As can be seen from the figure, the pipe temperature variation can also be divided into three stages.
The first stage is the heating period under fire action, covering the entire process from the occurrence of the fire to its extinguishment. In this stage, the pipe temperature shows a continuous and rapid rise. This is because the intense surface fire releases substantial heat, generating a steep temperature gradient that drives rapid downward conduction through the soil. This heat reaches the buried pipe wall within a short time, causing a sharp temperature rise. Moreover, the longer the fire duration and the shallower the burial depth, the more pronounced the rate and magnitude of the temperature rise.
The second stage is the post-fire delayed temperature rise period. After the fire is fully extinguished, the pipe temperature does not immediately begin to decrease. On the contrary, it continues to rise for a period of time. This is the most engineering-significant phase of the entire temperature evolution process. The core reason lies in the heat storage effect of the shallow soil: during the fire, the shallow soil continuously absorbs and accumulates a large amount of heat. When the fire source is extinguished, the shallow soil no longer continues to absorb heat and instead becomes a “heat source,” slowly releasing heat to the deeper soil. This subsequently released heat continues to act on the pipeline, causing the pipe temperature to keep rising after extinguishment until it reaches a peak.
The third stage is the slow cooling period. After the pipe temperature rises to its peak, it enters a gradual decline phase, and the cooling rate progressively slows over time. The essence of this phenomenon is that the driving force for heat exchange between the pipe and the surrounding soil gradually weakens. As heat continuously diffuses into deeper soil layers and the atmosphere, the temperature difference between the pipe and the surrounding soil diminishes, reducing the driving force for heat conduction. At the same time, the soil’s own thermal conductivity is limited, preventing the pipe from rapidly releasing the accumulated heat; it can only approach the environment at a very slow rate, ultimately manifesting as a flattened temperature decline curve and a gradual return to the initial ambient temperature level.
Taking the burial depth of 0.5 m as an example, when the fire lasts 24 h, the pipe’s maximum temperature is 96 °C, whereas when it lasts 120 h, the peak temperature rises to 307.8 °C. It can be seen that shallow-buried pipelines are not easily damaged by short-duration fires, but prolonged fire duration can cause a rapid rise in pipe temperature and greatly increase the risk of failure. Therefore, early fire monitoring and firefighting should be strengthened to control the fire as much as possible before heat is conducted to the pipeline. At the same time, the pipeline must continue to be monitored after the fire is extinguished to guard against pipeline damage caused by delayed temperature rise.

3.6. Orthogonal Analysis

To assess the sensitivity of thermal stress in buried X80 pipelines under the influence of wildfires, five key parameters were selected as variables for the orthogonal analysis: burial depth (0.2–0.8 m), outer diameter of the pipeline (1067–1422 mm), soil thermal conductivity (1.0–3.5 W/(m·°C), fire duration (24–120 h), and internal operating pressure of the pipeline (2–8 MPa). The maximum von Mises stress of the pipeline obtained from numerical simulation was used as the primary evaluation metric. Based on this, an orthogonal array with five factors and four levels was designed, and range analysis was conducted. Multiple groups of different condition combinations were set up to complete the simulation calculations. The operating conditions corresponding to each parameter set and the resulting maximum von Mises stress from the simulations are detailed in Table 9.
If maximum von Mises stress is taken as the criterion, the experimental condition combination to be used is No. 4, namely, a burial depth of 0.2 m, a pipe outer diameter of 1422 mm, a thermal conductivity of 3.5 W/(m·°C), a duration of 345,600 s, and a pipeline internal pressure of 8 MPa. The range analysis table using maximum von Mises stress as the evaluation index is shown in Table 10. The ranges R, sorted from largest to smallest, are burial depth, fire duration, thermal conductivity, pipe outer diameter, and pipeline internal pressure. The order of influence of each factor on pipeline thermal stress is burial depth > fire duration > thermal conductivity > pipe outer diameter > pipeline internal pressure. Therefore, under the influence of wildfire, the thermal stress of buried pipelines is primarily controlled by the burial depth, while the effect of internal pressure is negligible. This is consistent with the conclusions of Richter et al. [12], ensuring the accuracy of the simulation results.
The numerical model was validated against the Carslaw and Jaeger [26] analytical solution for transient heat conduction and benchmarked against the validated model of Richter et al. [12], yielding consistent predictions under identical input conditions. The predicted physical trends, including the post-fire delayed temperature rise due to soil heat storage documented by Deng et al. [29] and Pei et al. [30], and the dominance of burial depth as the primary controlling factor identified by Richter et al. [12], are consistent with independent numerical studies on wildfire-induced soil heating. These validations collectively establish the physical validity of the numerical framework.

4. Mechanical Properties of Buried Pipelines

4.1. Pipeline Failure Criteria

Pipeline failure originates from external loads, causing internal forces in the pipe to exceed limits or producing deformations that prevent continued service. Various failures of high-temperature pipelines induced by internal pressure are typically classified under strength control. In the analysis, pipeline failure is determined when stresses or strains in the pipeline reach critical values under external loading.
According to “Code for design of oil transportation pipeline engineering” GB 50253-2014 [31] and “Code for design of gas transmission pipeline engineering” GB 50251-2015, the equivalent stress combining axial and circumferential stresses for buried straight pipe segments must be less than 90% of the minimum yield strength of the pipe material, and the design strength of pipeline fittings shall not be less than the design strength of the connected straight pipe segments . Their mathematical expressions are:
σ e = σ h σ L < 0.9 σ s
σ L = μ σ h + E α ( t 1 t 2 )
σ h = P d 2 δ n
where σe is the equivalent stress, MPa; σs is the minimum yield strength of the pipeline as stipulated by the standard, MPa; σh is the circumferential stress in the pipeline produced by internal pressure, MPa; σL is the axial tensile stress of the pipeline, MPa; μ is the equivalent stress, MPa; E is the elastic modulus of the pipeline, MPa; α is the linear thermal expansion coefficient of the pipeline steel, °C−1; t1 is the temperature during trench backfilling of the pipeline, °C; t2 is the operating temperature of the pipeline, °C; P is the design internal pressure of the pipeline, MPa; d is the diameter of the pipeline, mm; and δn is the nominal pipe wall thickness, mm.

4.2. Evolution of Pipe Deformation

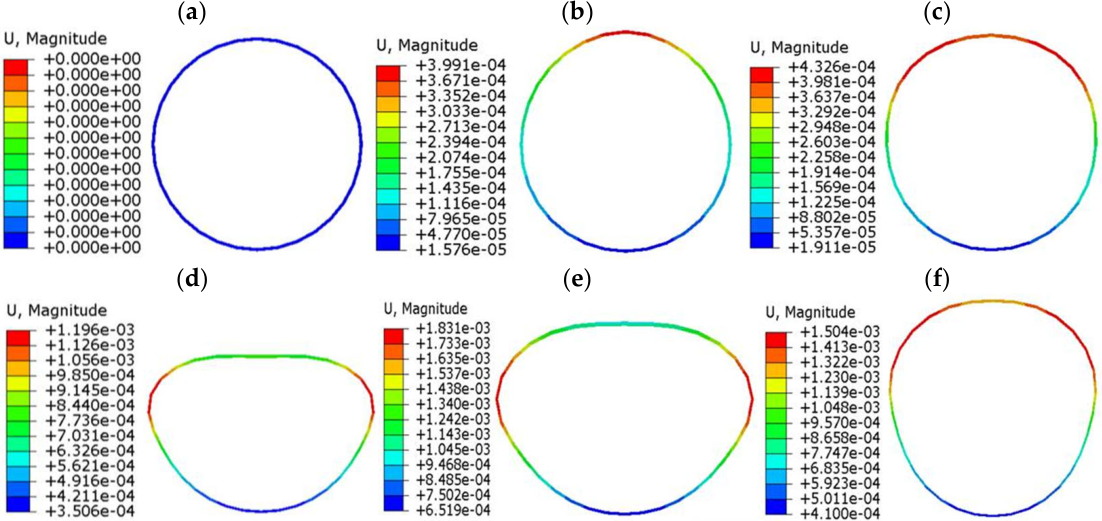
To facilitate observation of pipe deformation, Figure 15 shows the pipe displacement at different time points with the model deformation scaled up by a factor of 200. As shown, from t = 0 s to 11,363 s (3.16 h), heat transfers through the soil to the top of the pipe. The upper soil expands with heat and exerts an upward force, causing the pipe to bend under the uneven temperature field, with the crown displacement significantly greater than the lower region, producing an overall upward-arched shape. From t = 17,044 s (4.73 h) to 38,350 s (10.65 h), heat transfers from the crown to the middle and lower parts, expanding the heated region and continuously increasing thermal stress. High temperatures cause thermal expansion of the steel, while lateral soil restraint limits free deformation of the pipe, leading to a redistribution of sectional stresses. Significant displacement occurs in the upper-middle region, and the pipe cross-section flattens axially with outward bulging on both sides. Thermal expansion together with restraint leads to sectional distortion, and the stress concentration zone extends from the crown toward the sidewall, reaching maximum deformation. After t = 38,350 s (10.65 h), as the soil surface temperature returns to ambient, the pipe undergoes noticeable thermal contraction, and overall displacements decrease compared with the high-temperature stage. Influenced by surrounding soil restraint, the pipe undergoes non-uniform contraction during cooling and stresses redistribute, so the section changes from a pronounced horizontal bulge to a more uniform elliptical shape, finally forming a stable residual deformation state.

4.3. Factors Affecting Plastic Deformation of the X80 Pipeline

The orthogonal analysis in Section 3.6 identified burial depth and fire duration as the two dominant factors affecting the maximum von Mises stress in the pipeline. Pipe diameter, internal pressure, and soil thermal conductivity primarily influence the magnitude of stress through temperature field modification or mechanical superposition, rather than governing the onset of plastic deformation. Therefore, this section focuses specifically on burial depth and fire duration to establish the critical failure thresholds for X80 steel pipelines under wildfire conditions.
The yield strength of X80 pipeline steel significantly decreases at high temperatures based on the reduction relationship for steel yield strength at elevated temperatures provided in the “Eurocode 3-Design of Steel Structures-Part 1-2: Structural Fire Design” EN 1993-1-2: 2024 [22]. The yield strength of the X80 pipeline at different temperatures is calculated in Table 11.

4.3.1. Duration

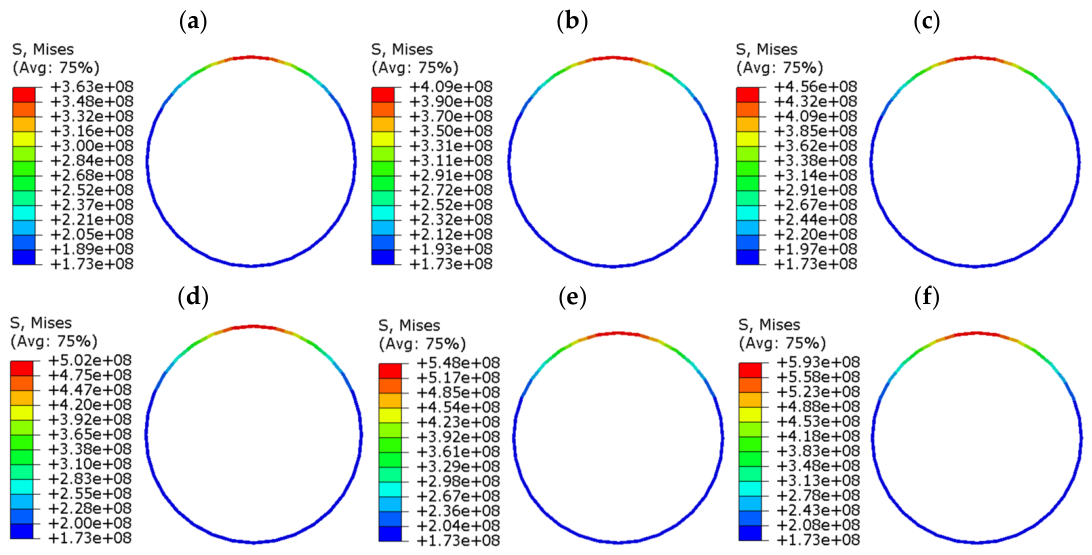
Figure 16 shows the von Mises stress distribution contours of the pipeline under different fire durations. When the fire lasts 8–10 h, the stress at the top of the pipe gradually increases over time, with peak values of 363.4 MPa, 409.4 MPa, and 455.9 MPa, respectively, all below the room temperature yield strength of 552 MPa. The stress concentration region remains at the top of the pipe, and the middle and lower parts maintain low stress levels. The overall stress distribution gradient is significant, and the pipeline is in the elastic deformation stage, with deformations fully recoverable after the fire ends. When the fire lasts 11–12 h, the top stress further rises to 502.2 MPa and 548.0 MPa, exceeding the code-allowed maximum equivalent stress and approaching the yield strength. Considering the temperature reduction effect, the reduction factor in this stage is 1, and the maximum pipeline temperature has not yet caused significant changes to the material yield strength, so the actual yield strength remains at its room temperature level. Therefore, the pipeline as a whole is still in elastic service and has not undergone plastic strain. When the fire duration reaches 13 h for the 0.25 m burial depth, the crown temperature rises to approximately 310 °C. According to the yield strength reduction factors specified in Eurocode 3 (Table 11), the material retains its full ambient temperature yield strength (552 MPa) up to 400 °C. Therefore, the observed stress level of 592.9 MPa (exceeding 552 MPa) directly induces plastic deformation, without synergistic degradation from temperature-induced softening. In summary, based on the evolution results of the temperature and stress fields of the affected pipeline at a burial depth of 0.25 m, and taking the maximum stress exceeding the yield strength as the criterion for plastic strain, the critical fire duration for the pipeline to undergo plastic deformation is 12–13 h. Beyond this critical value, the pipeline’s load-bearing capacity and long-term service performance will suffer permanent damage.
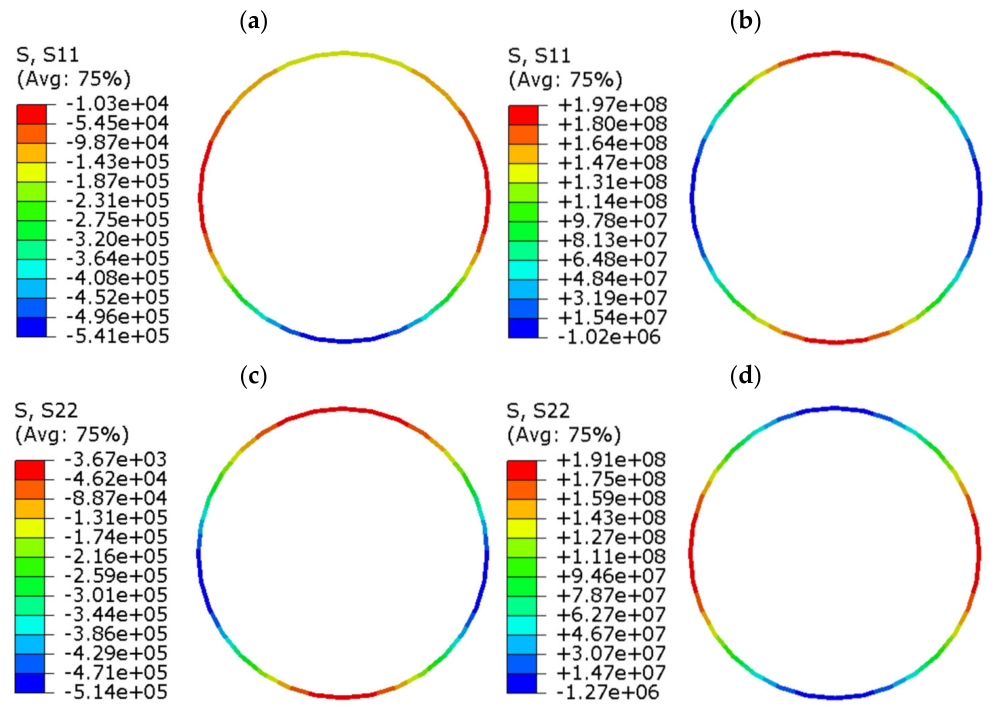
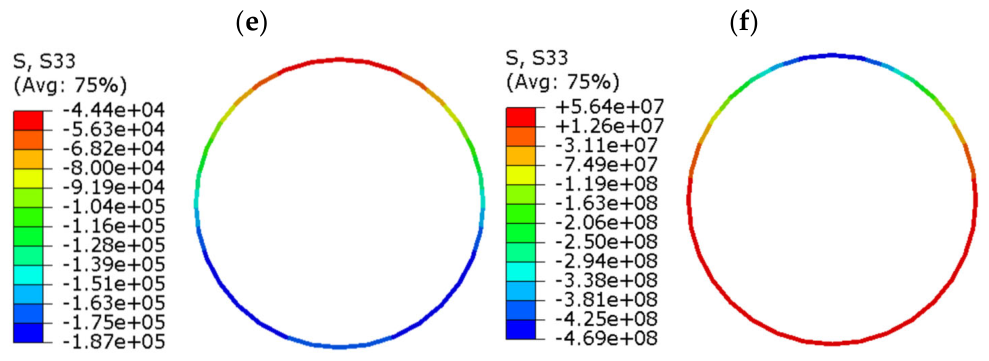
Figure 17 shows the S11, S22, and S33 contours of the pipeline when the burial depth is 0.25 m. At the initial state (t = 0 s), the through-thickness stress (S11) ranges from approximately −0.54 MPa to −0.01 MPa, the hoop stress (S22) ranges from approximately −0.51 MPa to −0.004 MPa, and the longitudinal stress (S33) ranges from approximately −0.19 MPa to −0.04 MPa, indicating that the initial stress is primarily governed by internal pressure-induced hoop tension. At the peak thermal state (t = 13 h, 0.25 m burial depth), the stress magnitudes increase substantially: S11 ranges from approximately −0.01 MPa to 197 MPa, S22 ranges from approximately −1.27 MPa to 191 MPa, and S33 ranges from approximately −469 MPa to 56.4 MPa. At the initial state, the hoop stress is larger in magnitude than the through-thickness stress and the longitudinal stress, confirming that the initial stress is dominated by internal pressure-induced hoop tension. At the peak thermal state, both the hoop stress and the longitudinal stress increase substantially, while the through-thickness stress remains comparatively small except for localized tensile concentrations. The von Mises stress is, therefore, governed primarily by the hoop and longitudinal components under wildfire conditions.

4.3.2. Burial Depth

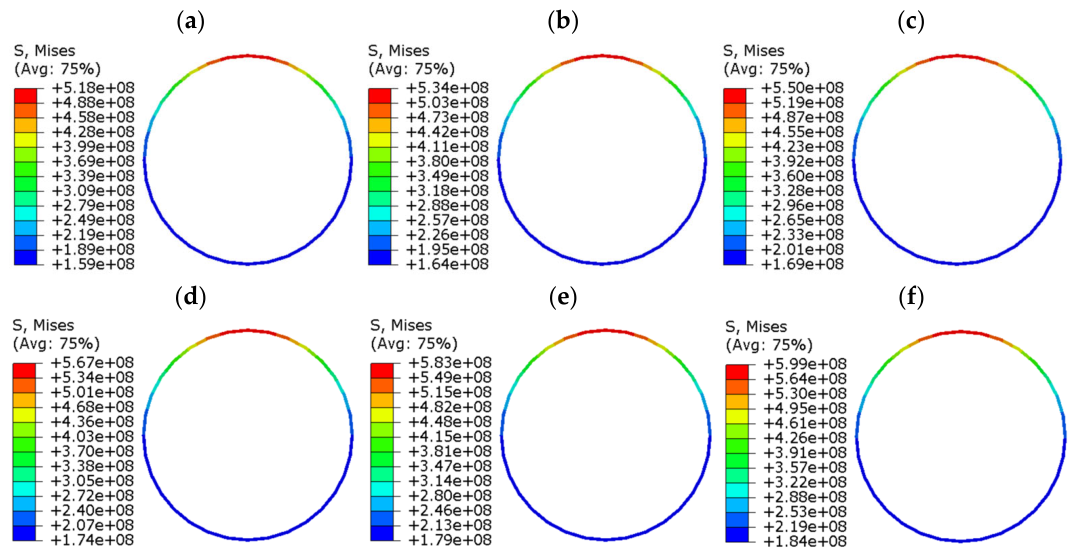
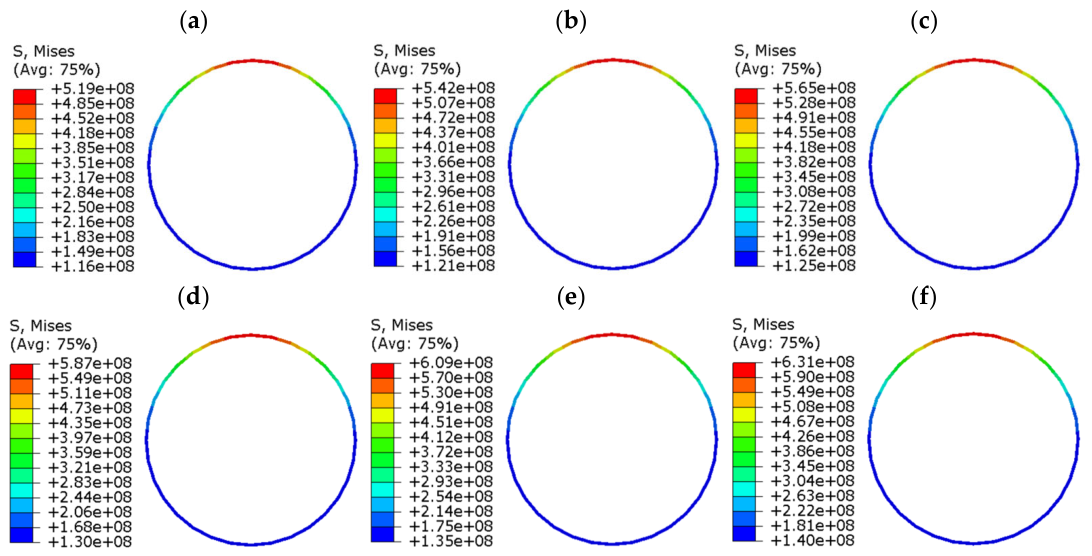
To investigate the critical time for plastic deformation of the pipe at different burial depths, burial depths of 0.4 m, 0.5 m, and 0.8 m were set, and the critical times for plastic deformation at each burial depth were predicted by numerical simulation. Figure 18 shows the stress distribution contours of the pipeline for a burial depth of 0.4 m when the fire lasts 24–29 h. At a burial depth of 0.4 m, the pipeline is closer to the ground surface, the heat transfer path is short, thermal conduction efficiency is high, the pipeline’s thermal response is more pronounced, and the onset of plastic deformation is advanced. When the fire lasts 24–25 h, the peak stresses at the crown are 518.9 MPa and 541.9 MPa, respectively, exceeding the code-allowed maximum equivalent stress but still below the room temperature yield strength. The pipeline is in the elastic deformation stage, the stress concentration region is confined to a small area at the crown, stress levels in the middle and lower parts are low, and the overall stress gradient is significant. When the fire lasts 26 h, the crown stress rises to 564.6 MPa, breaking through the room temperature yield strength and initiating plastic deformation. The corresponding crown temperature range is 307–319 °C. Within this temperature range, the material yield strength does not show a significant reduction, so the plastic deformation is mainly caused directly by the accumulation of thermal stress.
Compared with the burial depth of 0.25 m, the critical fire duration is significantly extended. When the fire lasts 27–29 h, the crown stress further rises to 587.0 MPa, 609.2 MPa, and 631.0 MPa, the stress concentration region expands laterally from the crown, stress levels in the middle and lower parts rise simultaneously, stress distribution becomes more uniform, and the plastic deformation region continues to enlarge. In this stage, the material strength slightly deteriorates with increasing temperature, the difference between the stress and the reduced material strength continues to grow, and the irreversibility of plastic deformation intensifies.
Figure 19 shows stress distribution contours of the pipeline for different fire durations at a burial depth of 0.5 m. As shown, when the fire lasts 32 h and 34 h, the peak stress at the pipe crown is 518.2 MPa and 534.3 MPa, respectively, which are below the room temperature yield strength. The pipeline is in the elastic deformation stage. When the fire lasts 35 h, the pipe crown stress rises to 550.5 MPa, which is about to exceed the room temperature yield strength and enter the plastic deformation stage. At that time, the corresponding pipe crown temperature was 312 °C, the material yield strength had not degraded, and the plastic deformation was mainly driven directly by the accumulation of thermal stress without synergistic effects from temperature-induced degradation.
When the fire lasts 36–38 h, the pipe crown stress should climb to 598.9 MPa, and the stress concentration region slowly expands from the crown toward both sides. The stress levels in the middle and lower parts rise synchronously, and the plastic deformation region continues to enlarge. Compared with the 0.4 m burial condition, at 0.5 m burial the critical fire duration for pipeline plastic deformation is significantly prolonged, reflecting the thermal protection gain from increased burial depth and providing a quantitative basis for fire safety design of pipelines at different burial depths.
Figure 20 shows stress distribution contours of the pipeline for fire durations of 90–95 h at a burial depth of 0.8 m. At a burial depth of 0.8 m, the soil cover is thick, the thermal protection effect is significant, and the heat transfer path is long with large losses, so the overall pipeline heating rate is slow, and the stress evolution process is delayed. When the fire lasts 90–91 h, the peak pipe crown stresses are 542.1 MPa and 549.1 MPa, respectively, below the room temperature yield strength. The pipeline is in the elastic deformation stage. When the fire lasts 92 h, the pipe crown stress rises to 556.2 MPa, exceeding the room temperature yield strength, and the pipeline locally enters the plastic deformation stage. The corresponding pipe crown temperature is 285 °C, and the material yield strength has not degraded. When the fire lasts 93–95 h, the pipe crown stress further rises to 563.2 MPa, 570.3 MPa, and 577.3 MPa, and the plastic deformation region continues to expand. Compared with the 0.25 m condition, at a burial depth of 0.8 m, the critical fire duration for pipeline plastic deformation is extended by nearly seven times, demonstrating the strong thermal protection effect of deep burial and providing a key parameter basis for pipeline fire safety protection design.
The critical fire duration for each burial depth was determined by linear interpolation between adjacent simulation time points, based on the von Mises yield criterion. The resulting critical durations are summarized in Table 12. From Table 12, it can be seen that the greater the burial depth, the stronger the soil’s thermal resistance effect, the greater the heat transfer losses, the slower the pipe heating rate, and the longer the critical time for plastic deformation.

5. Conclusions

This study established a three-dimensional sequentially coupled thermo-mechanical finite element model to investigate the temperature and stress response of buried X80 gas pipelines under wildfire exposure. The main findings are summarized as follows.
(1) Burial depth is the most influential factor controlling pipe temperature and thermal stress. In the present simulations, increasing the burial depth from 0.2 m to 0.8 m reduces the peak pipe temperature from 291.4 °C to 32.4 °C and the maximum von Mises stress from 507 MPa to 236 MPa. The post-fire delayed temperature rise due to soil heat storage was also captured. The delay between fire extinguishment and peak pipe temperature is approximately 5.4 h at 0.2 m burial depth, 8.9 h at 0.4 m, 13.2 h at 0.5 m, and 19.0 h at 0.8 m.
(2) Orthogonal analysis reveals that the five factors rank by sensitivity to peak thermal stress as: burial depth > fire duration > soil thermal conductivity > outer diameter > internal pressure. The critical fire duration for plastic deformation, determined through linear interpolation based on the von Mises yield criterion, was found to be 12.09 h at 0.25 m, 25.44 h at 0.40 m, 35.12 h at 0.50 m, and 91.43 h at 0.80 m.
(3) Unlike previous one-dimensional thermal analyses that focused primarily on soil temperature, this study provides direct numerical predictions of stress, deformation, and plastic failure of the pipeline through three-dimensional thermo-mechanical coupling with temperature-dependent material properties. The quantitative ranking of influencing factors and the characterization of post-fire delayed effects constitute the primary novel contributions of this work. These results are derived from a numerical model with idealized assumptions, but they provide a systematic basis for identifying key parameters and guiding more refined future investigations.

6. Limitations and Future Work

This study has several limitations. First, experimental validation of the numerical model was not realized in the present work due to limitations in experimental conditions, the difficulty of thermal stress measurements, and the challenges of response observation. Second, the soil was idealized as a homogeneous medium with constant thermal properties, and the effect of moisture evaporation on heat conduction was not explicitly modeled. This simplification may lead to conservative temperature predictions. Third, the Tie constraints at the pipe–coating and coating–soil interfaces assume perfect thermal contact, which may slightly overestimate heat transfer to the pipeline. Fourth, the pipeline steel is modeled as a homogeneous material with uniform properties, whereas actual pipelines contain significant material and geometric heterogeneities, including the base metal, weld metal, and heat-affected zone (HAZ) with distinct microstructures, coating layers, local wall thickness variations, residual stresses, and potential defects. Studies have shown that welding-induced microstructural modifications, such as the formation of acicular ferrite, variations in grain boundary characteristics, and the presence of carbon vacancies in cementite, can significantly affect the mechanical response and hydrogen embrittlement resistance of pipeline steels [32,33]. These local variations may govern the onset of yielding, buckling, or failure, particularly under severe thermal loading where localized stress concentrations can develop. In addition, the surrounding soil support is assumed to be spatially uniform. The present model does not account for these heterogeneous features.
Future work should prioritize the collection of experimental data from controlled fire tests on buried pipelines, the incorporation of temperature- and moisture-dependent soil properties, and the quantification of Tie constraint-induced errors through comparative analyses using alternative contact formulations. A more refined model incorporating heterogeneous pipeline properties, including separate material definitions for the base metal, weld metal, and heat-affected zone, along with representative wall thickness imperfections and non-uniform pipe–soil interaction, is also recommended to capture the effects of local heterogeneities on the fire-induced thermal-mechanical response.

Author Contributions

Conceptualization, X.C. and J.M.; methodology, X.C., P.H. and H.Y.; software, X.C. and P.H.; validation, J.M. and Q.H.; formal analysis, J.M. and P.H.; investigation, X.C. and X.M.; resources, J.M. and P.H.; data curation, X.C. and X.M.; writing—original draft preparation, X.C. and X.M.; writing—review and editing, X.C., J.M. and H.Y.; visualization, X.C.; supervision, Q.H.; funding acquisition, J.M. All authors have read and agreed to the published version of the manuscript.

Funding

This research was funded by the Graduate Science and Technology Innovation Program Project of Chongqing University of Science and Technology (No. YKJCX2520124).

Data Availability Statement

Data available upon request due to restrictions (due to laboratory confidentiality policies and the fact that this data is reserved for future research).

Conflicts of Interest

Author Xue Min was employed by the company Chongqing Gas Group Co., Ltd. The remaining authors declare that the research was conducted in the absence of any commercial or financial relationships that could be construed as a potential conflict of interest.

References

  1. Einsfeld, R.A.; Murray, D.W.; Yoosef-Ghodsi, N. Buckling Analysis of High-Temperature Pressurized Pipelines with Soil-Structure Interaction. J. Braz. Soc. Mech. Sci. Eng. 2003, 25, 164–169. [Google Scholar] [CrossRef] [Scilit]
  2. Sun, J.; Shi, H.; Jukes, P. Upheaval Buckling Analysis of Partially Buried Pipeline Subjected to High Pressure and High Temperature. In Proceedings of the International Conference on Offshore Mechanics and Arctic Engineering; ASME: New York, NY, USA, 2011; Volume 44366, pp. 487–494. [Google Scholar]
  3. Liu, P.; Wu, S.Y.; Kang, L. Upheaval Buckling Analysis of Buried Offshore Pipelines under High Temperature and High Pressure. Adv. Mater. Res. 2014, 919, 292–295. [Google Scholar] [CrossRef] [Scilit]
  4. Wang, F.; Wu, G.; Chen, D.; Li, G.; Qian, Y.; Xi, F.; Wang, L. Mechanical Response of a Buried Pipeline to Permafrost Thawing Based on Sequential Coupling Method. Atmosphere 2023, 14, 620. [Google Scholar] [CrossRef] [Scilit]
  5. Jiao, W.; Xu, J.; Tian, J.; Xie, X.; Du, G. Seismic Response Analysis of Buried Pipelines with the High Drop. Int. J. Press. Vessel. Pip. 2021, 191, 104379. [Google Scholar] [CrossRef] [Scilit]
  6. Zhang, R.; Wang, C.; Li, S.; Zhang, J.; Liu, W. Numerical Simulation Study on the Performance of Buried Pipelines under the Action of Faults. Appl. Sci. 2023, 13, 11266. [Google Scholar] [CrossRef] [Scilit]
  7. Ye, M.; Qin, X.; Liu, J.; Li, J.; Ni, P.; Lin, C. An Analytical Solution for Landslide Impact on Buried Continuous Pipelines. Tunn. Undergr. Space Technol. 2023, 142, 105385. [Google Scholar] [CrossRef] [Scilit]
  8. Wu, Y.; Li, J. Finite Element Analysis on Mechanical Behavior of Semi-Exposed Pipeline Subjected to Debris Flows. Eng. Fail. Anal. 2019, 105, 781–797. [Google Scholar] [CrossRef] [Scilit]
  9. Wang, Y.; Shi, J.; Ng, C.W.W. Numerical Modeling of Tunneling Effect on Buried Pipelines. Can. Geotech. J. 2011, 48, 1125–1137. [Google Scholar] [CrossRef] [Scilit]
  10. Fu, Z.; Yu, B.; Zhu, J.; Li, W. Thaw Characteristics of Soil around Buried Pipeline in Permafrost Regions Based on Numerical Simulation of Temperature Fields. J. Therm. Sci. Technol. 2012, 7, 322–333. [Google Scholar] [CrossRef] [Scilit]
  11. Dimitrakopoulos, A. Measuring and Modeling Heat Transfer into Forest Soil during Wildland Fires. Ph.D. Thesis, University of California, Berkeley, CA, USA, 1988. [Google Scholar]
  12. Richter, E.G.; Fischer, E.C.; Metz, A.; Wham, B.P. Simulation of Heat Transfer Through Soil for the Investigation of Wildfire Impacts on Buried Pipelines. Fire Technol. 2022, 58, 1889–1915. [Google Scholar] [CrossRef] [Scilit]
  13. Pamuk, M.T. Numerical Analysis of Transient Soil Temperature Variation during Wildfires. Environ. Res. Technol. 2024, 7, 578–587. [Google Scholar] [CrossRef] [Scilit]
  14. Janssens, M.L. Predicting Temperature Profiles in Soil and the Effect of Heat Conduction on Buried Thermoplastic Pipes During a Wildfire. Fire Mater. 2025, 49, 575–584. [Google Scholar] [CrossRef] [Scilit]
  15. Zhang, W.; Guo, Y.; Dai, W.; Hui, Y.; Tian, Y. Research on Seismic Capacity of Buried Pipelines Based on ABAQUS. In Proceedings of the 2022 3rd Asia-Pacific Conference on Image Processing, Electronics and Computers (IPEC 2022), Dalian, China, 14–16 April 2022. [Google Scholar]
  16. Doerr, S.H.; Girona-García, A.; Sanchez-Garcia, C.; Badía-Villas, D.; Bryant, R.; Dickinson, M.; Hsieh, R.; Mataix-Solera, J.; Miesel, J.; Robichaud, P.; et al. Soil Heating during Wildfires and Prescribed Burns: A Global Evaluation. Int. J. Wildland Fire 2025, 34, WF25103. [Google Scholar] [CrossRef] [Scilit]
  17. ISO 834-1:2025; Fire-Resistance Tests—Elements of Building Construction—Part 1: General Requirements. International Organization for Standardization: Geneva, Switzerland, 2025.
  18. Wang, X.; Zhang, S.; Wan, Z. Charring Rate and Temperature Distribution of Timber in Fire: The Role of Fire-Retardant Treatments, Moisture, and Tree Species. In Proceedings of the Structures; Elsevier: Amsterdam, The Netherlands, 2025; Volume 75, p. 108676. [Google Scholar]
  19. Zheng, X.; Lou, G.-B.; Fei, C.; Wang, Y.-B. Axial Compression Behavior of High-Strength Fire-Resistant Steel Columns in Fire. J. Constr. Steel Res. 2025, 235, 109822. [Google Scholar] [CrossRef] [Scilit]
  20. Stochino, F.; Cotza, M.; Andriotto, D.; Cecchinato, D.; Zucca, M. Thermomechanical Analysis of X-Braces in Steel Structures Under Fire Conditions. Struct. Eng. Int. 2026, 36, 121–129. [Google Scholar] [CrossRef] [Scilit]
  21. Zhang, L.; Liu, L.; Xiong, X. Analysis of Steel Plate Concrete Module’s Thermal Response Under Fire Condition in Reactor Building Based on FDS-ABAQUS. In Proceedings of the International Conference on Nuclear Engineering; Springer: Berlin/Heidelberg, Germany, 2025; pp. 557–572. [Google Scholar]
  22. EN 1993-1-2: 2024; Eurocode 3—Design of Steel Structures—Part 1–2: Structural Fire Design. European Committee for Standardization: Brussels, Belgium, 2024.
  23. Gemperline, M.C.; Rinehart, R.V. Soil-Pipe Interface Friction Coefficients for Buried PE4710 Pipe; Report Prepared for the Plastics Pipe Institute; MCG Geotechnical Engineering Inc.: Morrison, CO, USA, 2018. [Google Scholar]
  24. Zhu, X.; Gao, Q.; Wang, Y.; Yu, M. The Finite Element Simulation Study on Thermal Deformation of Ground Heat Exchange Pipe. In Proceedings of the 2nd International Conference on Electronic and Mechanical Engineering and Information Technology; Atlantis Press: Dordrecht, The Netherlands, 2012. [Google Scholar]
  25. GB 50251-2015; Code for Design of Gas Transmission Pipeline Engineering. Standards Press of China: Beijing, China, 2015.
  26. Carslaw, H.S.; Jaeger, J.C. Conduction of Heat in Solids, 2nd ed.; Oxford University Press: Oxford, UK, 1959. [Google Scholar]
  27. American Society of Heating, Refrigerating and Air-Conditioning Engineers. 2005 ASHRAE Handbook—Fundamentals; ASHRAE: Atlanta, GA, USA, 2005. [Google Scholar]
  28. Abu-Hamdeh, N.H.; Reeder, R.C. Soil thermal conductivity: Effects of density, moisture, salt concentration, and organic matter. Soil Sci. Soc. Am. J. 2000, 64, 1285–1290. [Google Scholar] [CrossRef] [Scilit]
  29. Deng, S.S.; Yang, L.Y.; Jiao, G.W.; Feng, J.; Shu, D. Study on Heat Transfer Influence of Surface Fire on Buried Oil Pipeline. Shiyou Kuangchang Jixie 2008, 37, 10–13. (In Chinese) [Google Scholar]
  30. Pei, B.; Deng, F.L.; Chen, P.; Yang, Y.F.; Yang, S. Numerical Simulation on Influence of Forest Fire on Buried Gas Pipeline. Tianranqi Yu Shiyou 2016, 34, 30–33. (In Chinese) [Google Scholar]
  31. GB 50253-2014; Code for Design of Oil Transportation Pipeline Engineering. Standards Press of China: Beijing, China, 2014.
  32. Safyari, M.; Moshtaghi, M. Welding Design of API 5L X65 Pipeline Steel: Effects of Robotic Hybrid Laser Arc Welding versus GMAW on Fracture Toughness Evaluated by SENT Tests in Air and Hydrogen. Mater. Des. 2025, 254, 113950. [Google Scholar] [CrossRef] [Scilit]
  33. Safyari, M.; Horvath, D.; Kivimäki, M.; Tulonen, J.; Virolainen, E.; Suikkanen, P.; Moshtaghi, M. Fracture Toughness of High-Frequency Induction-Welded X70 Pipelines for High-Pressure Gaseous Hydrogen Transport. Mater. Des. 2026, 267, 116336. [Google Scholar] [CrossRef] [Scilit]
Figure 1. Pipe–soil grid model diagram.
Processes 14 02848 g001
Figure 2. IS0834 standard heating curve.
Processes 14 02848 g002
Figure 3. Soil temperature contours around the pipeline for different burial depths at 24 h: (a) 0.2 m; (b) 0.4 m; (c) 0.5 m; (d) 0.8 m (Schemes 1–4).
Processes 14 02848 g003
Figure 4. Temperature contours of the pipeline for different burial depths at 24 h: (a) 0.2 m; (b) 0.4 m; (c) 0.5 m; (d) 0.8 m (Schemes 1–4).
Processes 14 02848 g004
Figure 5. Temperature change trend of pipeline with time at different depths.
Processes 14 02848 g005
Figure 6. Peak von Mises stress contours of the pipeline for different burial depths: (a) 0.2 m; (b) 0.4 m; (c) 0.5 m; (d) 0.8 m (Schemes 1–4).
Processes 14 02848 g006
Figure 7. Distribution of von Mises stress along the circumferential path of the pipeline for different burial depths at the peak stress state (Schemes 1–4).
Processes 14 02848 g007
Figure 8. Soil temperature contours around the pipeline for different outer diameters at 24 h: (a) 1.067 m; (b) 1.118 m; (c) 1.219 m; (d) 1.422 m (Schemes 5–8).
Processes 14 02848 g008
Figure 9. Temperature contours of the pipeline for different pipe diameters at 24 h: (a) 1.067 m; (b) 1.118 m; (c) 1.219 m; (d) 1.422 m (Schemes 5–8).
Processes 14 02848 g009
Figure 10. Temperature change trend of the pipeline under different pipe diameters.
Processes 14 02848 g010
Figure 11. Peak von Mises stress contours of the pipeline for different outer diameters: (a) 1.067 m; (b) 1.118 m; (c) 1.219 m; (d) 1.422 m (Schemes 5–8).
Processes 14 02848 g011
Figure 12. Peak von Mises stress contours of the pipeline under different internal pressures: (a) 0 MPa; (b) 2 MPa; (c) 4 MPa; (d) 6 MPa; (e) 8 MPa (Schemes 9–13).
Processes 14 02848 g012
Figure 13. The change rule of the temperature at the top of the pipeline with time under different thermal conductivities.
Processes 14 02848 g013
Figure 14. Trend chart of temperature change on the pipe wall at different burial depths: (a) 0.5 m; (b) 0.8 m; (c) 1 m; (d) 1.5 m.
Processes 14 02848 g014
Figure 15. Pipe displacement conditions: (a) 0.00 h; (b) 3.16 h; (c) 4.73 h; (d) 7.10 h; (e) 10.65 h; (f) 24 h.
Processes 14 02848 g015
Figure 16. Stress distribution contour map of pipeline under different fire durations: (a) 8 h; (b) 9 h; (c) 10 h; (d) 11 h; (e) 12 h; (f) 13 h.
Processes 14 02848 g016
Figure 17. Stress component distributions of the pipeline at the initial state and peak thermal state for the 0.25 m burial depth case: (a) S11 at t = 0 h; (b) S22 at t = 0 h; (c) S33 at t = 0 h; (d) S11 at t = 13 h; (e) S22 at t = 13 h; (f) S33 at t = 13 h.
Processes 14 02848 g017aProcesses 14 02848 g017b
Figure 18. Stress distribution contour of pipeline under different fire durations at a burial depth of 0.4 m: (a) 24 h; (b) 25 h; (c) 26 h; (d) 27 h; (e) 28 h; (f) 29 h.
Processes 14 02848 g018
Figure 19. Stress distribution contour of the pipeline under different fire durations at a burial depth of 0.5 m: (a) 32 h; (b) 34 h; (c) 35 h; (d) 36 h; (e) 37 h; (f) 38 h.
Processes 14 02848 g019
Figure 20. Stress distribution contour of the pipeline at a burial depth of 0.8 m under different fire durations: (a) 90 h; (b) 91 h; (c) 92 h; (d) 93 h; (e) 94 h; (f) 95 h.
Processes 14 02848 g020
Table 1. Mesh independence verification analysis.
Mesh Independence Verification
(Note: The Reference Metric Is the Temperature at the Top of the Pipe)
Mesh count18,64425,47231,36040,30046,012
Temperature (°C)138.286138.261138.024138.066138.088
Error0.19%0.17%Benchmark0.03%0.05%
Table 2. Domain size sensitivity analysis results.
DirectionTested Values (m)Baseline (m)Max. Deviation
Width6, 10, 20100.45%
Depth3, 5, 1050.96%
Length10, 20, 40200.51%
Table 3. Material parameters of the pipe–soil model.
MaterialX80Anti-Corrosion LayerSoil
Density (kg/m3)78969501830
Specific heat (J/(kg·K))45025121840
Conductivity (W/(m·K))46.20.481.5
Young’s modulus (MPa)2.07 × 1054007
Poisson’s ratio0.30.450.4
Coefficient of thermal expansion (1/°C)8.5 × 10−61.8 × 10−41.300 × 10⁻⁶
Table 4. Temperature-dependent thermophysical properties of X80 steel.
Temperature (°C)Density (kg/m3)Thermal Conductivity (W/(m·K))Specific Heat (J/(kg·K))
20782050.0460
200778047.7476
500761040.0530
700756229.6646
1000749030.0670
1200743432.0666
Table 5. Temperature-dependent mechanical properties of X80 steel.
Temperature (°C)Poisson’s RatioYoung’s Modulus (MPa)Coefficient of Thermal Expansion (1/°C)Yield Stress (MPa)
200.291.9 × 1051.30 × 10−5552
2000.291.6 × 1051.41 × 10−5552
5000.291.2 × 1051.59 × 10−5429
7000.294 × 1041.55 × 10−5127
10000.292 × 10−51.53 × 10−522
12000.291.9 × 10−51.53 × 10−50
Table 6. Numerical simulation schemes.
SchemeBurial Depth (m)Diameter (m)Internal Pressure
(MPa)
Conductivity
(W/(m·K))
Duration (h)
Scheme 10.2001.21981.511
Scheme 20.4001.21981.511
Scheme 30.5001.21981.511
Scheme 40.8001.21981.511
Scheme 50.2501.06781.511
Scheme 60.2501.11881.511
Scheme 70.2501.21981.511
Scheme 80.2501.42281.511
Scheme 90.2501.21901.511
Scheme 100.2501.21921.511
Scheme 110.2501.21941.511
Scheme 120.2501.21961.511
Scheme 130.2501.21981.511
Scheme 140.2501.2198111
Scheme 150.2501.21981.511
Scheme 160.2501.21982.511
Scheme 170.2501.21983.511
Scheme 180.5001.21981.524
Scheme 190.8001.21981.524
Scheme 201.0001.21981.524
Scheme 211.5001.21981.524
Scheme 220.5001.21981.548
Scheme 230.8001.21981.548
Scheme 241.0001.21981.548
Scheme 251.5001.21981.548
Scheme 260.5001.21981.572
Scheme 270.8001.21981.572
Scheme 281.0001.21981.572
Scheme 291.5001.21981.572
Scheme 300.5001.21981.596
Scheme 310.8001.21981.596
Scheme 321.0001.21981.596
Scheme 331.5001.21981.596
Scheme 340.5001.21981.5120
Scheme 350.8001.21981.5120
Scheme 361.0001.21981.5120
Scheme 371.5001.21981.5120
Table 7. Quantitative comparison between analytical and numerical soil temperatures at t = 24 h.
Depth (m)Analytical Solution (°C)Finite Element Prediction (°C)Error
0.20101.54 °C115.4413.7%
0.4078.38 °C83.947.1%
0.5054.13 °C47.8811.5%
0.8022.23 °C24.4710.1%
Table 8. Effect of internal pressure on the peak von Mises stress at t = 12 h.
Internal Pressure
(MPa)
Von Mises Stress
(MPa)
Increase Relative to 0 MPa (MPa)Relative Increase (%)
033600
234372.1
4353175.1
6365298.6
83804413.1
Table 9. Comparison of maximum von Mises stress on pipes in different experimental systems.
Sequence NumberBurial Depth
(m)
Diameter
(mm)
Conductivity
(W/(m·°C))
Duration(h)Internal Pressure
(MPa)
Maximum Von Mises Stress
(MPa)
10.210671.0242445.8
20.211181.5484838.8
30.212192.57261218.0
40.214223.59681465.0
50.410671.5728488.8
60.411181.0966267.8
70.412193.5244557.0
80.414222.5482613.3
90.510672.5964339.9
100.511183.5722615.5
110.512191.0488191.9
120.514221.5246204.3
130.810673.5486296.4
140.811182.5248117.9
150.812191.5962221.9
160.814221.0724142.2
Table 10. Range analysis table with maximum von Mises stress as the evaluation index.
LevelBurial Depth (m)Diameter
(mm)
Conductivity
(W/(m·°C))
Duration
(s)
Internal Pressure
(MPa)
K13967.601570.901325.001047.701896.50
21926.901840.001940.401753.801912.90
31351.602188.802294.602289.101986.50
4778.402424.802464.502933.902263.60
Kavg1991.90392.73331.25261.93474.13
2481.72460.00485.10438.45480.47
3337.90547.20573.65572.27496.63
4194.60606.20616.13733.48565.90
Best level 14444
R 797.30213.48284.88471.5591.77
Table 11. Yield strength of the X80 pipeline at different temperatures.
Temperature (°C)Reduction FactorYield Strength (MPa)
201552
1001552
2001552
3001552
4001552
5000.78429
6000.47259
7000.23127
8000.1161
9000.0633
10000.0422
11000.0211
120000
Table 12. Critical fire duration for plastic deformation at different burial depths.
Burial Depth (m)Adjacent Simulation Times (h)Interpolated Critical Time (h)
0.2512–1312.09
0.425–2625.44
0.535–3635.12
0.891–9291.43
Disclaimer/Publisher’s Note: The statements, opinions and data contained in all publications are solely those of the individual author(s) and contributor(s) and not of MDPI and/or the editor(s). MDPI and/or the editor(s) disclaim responsibility for any injury to people or property resulting from any ideas, methods, instructions or products referred to in the content.