Article

Optimized Control of Power Self-Balancing in Distribution Networks Based on Virtual Power Plant Aggregation

1
The State Grid Shanghai Municipal Electric Power Company, Shanghai 200000, China
2
State Grid Integrated Energy Service Group Co., Ltd., Beijing 466321, China
3
Electrical and Electronic Engineering College, Shandong University of Technology, Zibo 255000, China
*
Author to whom correspondence should be addressed.
Processes 2026, 14(17), 2819; https://doi.org/10.3390/pr14172819
Submission received: 22 July 2026 / Revised: 25 August 2026 / Accepted: 31 August 2026 / Published: 1 September 2026
(This article belongs to the Special Issue Power System Operation, Energy Management, and Control)

Abstract

To address the voltage violation problem in distribution networks with large-scale distributed generators (DGs), this paper proposes an optimized control strategy for power self-balancing in distribution networks based on virtual power plant (VPP) aggregation. An optimized control architecture for power self-balancing is constructed, comprising a VPP aggregation layer, an independent optimization control layer for individual VPPs, a coordinated optimization control layer for multiple VPPs, and an emerging benefits allocation layer. Then, at the VPP aggregation layer, a VPP aggregation method is proposed considering VPP benefit coupling degree, resource adequacy, and coordination interaction degree. At the independent optimization control layer, an independent optimization control model incorporating active and reactive power regulation of DGs is established for each VPP to achieve power self-balancing for voltage control within the VPP. At the coordinated optimization control layer, a multi-VPP coordination optimization model is constructed based on a linking matrix to achieve coordination among multiple VPPs during the power self-balancing control process and obtain emerging benefits. At the emerging benefits allocation layer, an allocation model based on the contribution degree of each VPP is established to ensure fair distribution of the emerging benefits. Finally, the effectiveness of the proposed method is validated using an actual 10 kV feeder system in Zhejiang Province, China.

1. Introduction

With the proposal of the “dual carbon” strategic goals, distributed generators (DGs) such as photovoltaics (PVs) have developed rapidly [1]. However, as the penetration rate of DGs in distribution networks continues to increase, the scale in some local areas exceeds the network’s carrying capacity, posing unprecedented challenges to power balance control. This leads to frequent issues such as voltage fluctuations, frequency deviations, and power flow congestion, severely threatening the security, stability, and power supply reliability of the grid [2].
Traditional distribution network power balance control strategies primarily rely on the regulation capability of large synchronous generator units. However, with the continuous increase in DG penetration, limitations such as slow response speed and high regulation costs are becoming increasingly prominent [3]. Simultaneously, demand-side resources exhibit characteristics of fragmentation and dispersion, making effective integration and coordinated control difficult [4,5]. As a novel operational mode, the virtual power plant (VPP) aggregates dispersed resources such as DGs and energy storage systems (ESSs) into a unified, controllable resource cluster through information and communication technology (ICT) and control strategies [6,7,8,9]. Acting as an independent entity, the VPP participates externally in power system operation and dispatch as a whole, fully utilizing the coordinated complementarity of distributed resources to achieve rational resource optimization and utilization. Internally, it functions as a comprehensive energy management system with multiple capabilities, such as self-coordination, self-management, and self-control [10,11,12].
VPPs integrate various distributed resources, which can be coordinated through centralized or distributed control methods. In centralized control, a hybrid centralized, adaptive, data-driven Volt-VAR and Volt-Watt control framework was developed in reference [13] to coordinate multiple DERs (OLTC, DG, BESS, capacitors, and demand response) for distribution system voltage regulation, with recursive sensitivity adaptation enabling efficient real-time control validated on an IEEE 34-bus system. Reference [14] proposed a hybrid centralized Volt-VAR and Volt-Watt control framework that coordinates multiple DERs via real-time sensitivity updates for distribution system voltage regulation. However, as the number of distributed energy resources continues to grow, centralized control schemes face significant computational burdens and may suffer from the curse of dimensionality, making it difficult to meet the real-time operational requirements. Distributed control methods offer a solution to these problems [15,16]. Within distributed control, reference [17] proposed a collaborative optimization control strategy for VPPs comprising electric vehicles (EVs) and thermostatically controlled loads (TCLs), achieving fast and economical response through their coordinated operation. Reference [18] constructed a novel VPP model organically combining EVs and distributed energy resources, effectively suppressing distribution network voltage fluctuations. Reference [19] designed a VPP dispatch model involving multiple aggregators from the perspective of distributed aggregators, building an optimization framework based on aggregator structural characteristics, market clearing mechanisms, and individual benefit allocation to achieve overall benefit balance.
Although existing distributed control methods reduce model dimensionality, simplify the optimization process through decomposition and coordination among agents, and can achieve control effects close to global centralized optimization, most studies still assume that the distribution network has absolute dispatching authority over DGs, with maximizing the power company’s profit as the core objective. In actual operation scenarios, DGs are often assets belonging to the user side, and power companies do not have direct control authority. The traditional regulation mode oriented towards maximizing grid revenue is difficult to adapt to the new grid environment of multi-VPP coordinated operation [20,21]. Establishing a fair and reasonable coordination and interaction mechanism to fully mobilize the enthusiasm of various market participants in distribution network regulation has become a critical issue to be resolved.
Addressing the above problems, this paper proposes an optimized control strategy for power self-balancing in distribution networks based on VPP aggregation. While modern active distribution networks face uncertainties from renewable generation, this paper establishes a deterministic optimization model as a foundational baseline to focus on the core physical and economic mechanisms of hierarchical VPP partitioning and aggregation. Unlike existing hierarchical VPP strategies, the proposed architecture uniquely integrates a multi-dimensional VPP aggregation method with a dynamic “emerging benefits allocation” model. Specifically, the main contributions are as follows:
(1)
Multi-dimensional VPP Aggregation Architecture: An optimized control architecture is constructed comprising a VPP aggregation layer, independent/coordinated optimization layers, and an emerging benefits allocation layer. The aggregation algorithm considers benefit coupling degree, resource adequacy, and coordination interaction degree to achieve optimal hierarchical division.
(2)
Multi-VPP Coordinated Optimization: A multi-VPP coordination optimization model based on a linking matrix is established, effectively reducing unnecessary DG active power curtailment while regulating voltage.
(3)
Fair Emerging Benefits Allocation Mechanism: A dynamic allocation model based on the operational contribution degree of each VPP is established. This ensures a fair economic distribution of the emerging benefits generated by coordinated interaction, preventing the “free-rider” problem in reactive power support and incentivizing VPP participation.

2. Architecture for Optimized Power Self-Balancing Control with Multiple VPPs

The proposed multi-VPP power self-balancing optimized control architecture comprises a VPP aggregation layer, independent optimization layer, coordinated optimization layer, and emerging benefits allocation layer, as shown in Figure 1.
(1)
VPP Aggregation Layer: Based on VPP benefit coupling degree, resource adequacy, and coordination interaction degree, distribution network VPP aggregation indices are constructed, and VPPs are generated via a VPP aggregation algorithm.
(2)
VPP Independent Optimization Layer: Building upon the aggregation layer, a power self-balancing optimized control model is established for each VPP to achieve voltage regulation control.
(3)
Multi-VPP Coordinated Optimization Layer: The linking situation between VPPs is represented using a linking matrix. A multi-VPP coordination and interaction model is established to perform coordinated optimization based on independent optimization, yielding emerging benefits.
(4)
Emerging Benefits Allocation Layer: An emerging benefits allocation model is established to distribute the emerging benefits according to the contribution degree of each VPP.

3. Distribution Network VPP Aggregation Methodology

VPPs are formed by aggregating user-side resources such as DGs, ESSs, and adjustable loads. Corresponding aggregation indices are established, and multiple VPPs are formed through an aggregation algorithm.

3.1. Aggregation Indices for Multiple VPPs in Distribution Networks

3.1.1. Benefit Coupling Degree Index

A VPP has its own independent significance and autonomous operation capability. Driven by its own objectives or benefits, it can independently analyze and judge its functions, capabilities, resources, and working environment and make effective or even optimal decisions. For the distribution network, the independence of a VPP manifests as each VPP’s ability to independently solve voltage violation problems and achieve self-management. When performing voltage regulation in a specific area of the distribution network, certain specific nodes can achieve the voltage regulation purpose with minimal adjustment, possessing stronger voltage regulation capability for that area. This implies that these nodes have a high voltage sensitivity to that area and can complete the regulation task with minimal cost. At this time, these voltage regulation nodes with high sensitivity exhibit a high degree of benefit coupling and tend to be aggregated into the same VPP.
The voltage sensitivity matrix can be obtained by matrix inversion of the power system load flow Jacobian matrix:
Δ δ Δ V = K P δ K Q δ K PV K QV Δ P Δ Q
where Δ δ and Δ V represent the changes in node voltage phase angle and magnitude; ΔP and ΔQ represent the changes in active and reactive power injection at the node, respectively; and the voltage sensitivity matrix composed of K P δ , K PV , K Q δ , and K QV represents the relationship between changes in node voltage phase angle/magnitude and changes in node power injection. Sensitivity factors K PV and K P δ represent the change in node voltage magnitude and phase angle per unit of active power injected; K QV and K Q δ represent the change in node voltage magnitude and phase angle per unit of reactive power injected.
From Equation (1), the change in distribution network node voltage magnitude ΔV satisfies the following relationship with the changes in active and reactive power ΔP and ΔQ:
Δ V = K PV Δ P + K QV Δ Q
To transform the relationship between node voltage change and power change into a relationship between node voltage change and node regulation cost, this paper assumes that the cost per unit of active power regulation is cP, the cost for regulating ΔP active power is CP, the cost per unit of reactive power regulation is cQ, and the cost for regulating ΔQ reactive power is CQ. Equation (2) can then be converted to
Δ V = C P c P K PV + C Q c Q K QV
Let EPV = K PV /cP and EQV = K QV /cQ; the relationship between distribution network node voltage change and node regulation cost is then given by
Δ V = E PV C P + E QV C Q
where E PV and E QV are the node regulation cost coupling matrices, whose elements represent the change in voltage magnitude per unit voltage regulation cost at the node.
Based on the above analysis, this paper proposes the benefit coupling degree index α for nodes within the distribution network possessing adjustable resources:
α = 1 N i Π i β i , Π i + 1 β i , Π Π i
where N represents the total number of nodes in the distribution network; Π represents the set of all VPPs in the distribution network; Π i represents the VPP to which node i belongs; and β i , Π i represents the sum of regulation cost coupling between node i and all nodes within VPP Π i , expressed as
β i , Π i = 1 E j Π i W i j
E = i Π j Π \ E i j
where E represents the sum of regulation cost coupling between all nodes in the distribution network; and Eij represents the regulation cost coupling between node i and node j, expressed as
E i j = 1 4 E PV , i j + E PV , j i + E QV , i j + E QV , j i
where E PV , i j , E PV , j i , E QV , i j and E QV , j i are elements of the node regulation cost coupling matrices E PV and E QV , respectively.

3.1.2. Resource Adequacy Index

The basic units within a distribution network VPP should possess the fundamental functions required to achieve the VPP’s objectives. Therefore, a VPP not only needs strong benefit coupling but also sufficient adjustable capacity to meet the demands of optimized operation, ensuring the participation capability of each VPP in optimization control.
Based on the above, this paper proposes the resource adequacy index γ :
γ = 1 M k = 1 M μ k
where M represents the current number of aggregated VPPs in the distribution network; and μ k represents the resource adequacy of the k-th VPP, expressed as
μ k = R k , s R k , n R k , s < R k , n 1 R k , s R k , n
Here, R k , n represents the total amount of resources meeting requirements within the k-th VPP; and R k , s represents the total amount of self-adjustable resource capacity within the k-th VPP. The VPP resource adequacy index γ ranges from [0, 1]. A higher value indicates more abundant adjustable resources for the VPP in its current aggregated state.

3.1.3. Coordination Interaction Degree Index

The coordination interaction degree index refers to the direct or indirect interaction channels and capabilities between agents. Any two agents must engage in material or information exchange through their interaction channels to carry out cooperation. For distribution networks, VPPs interact via communication networks and participate in power management and trading through the electrical network. The coordination interaction degree of VPPs is represented using an improved modularity function. A higher coordination interaction degree index indicates tighter connections between VPPs; a lower index indicates looser connections.
For a system with n nodes, the electrical distance based on the active power–voltage sensitivity matrix is expressed as
d i j PV = ( K PV , i 1 K PV , j 1 ) 2 + .... + ( K PV , i n K PV , j n ) 2
where K PV , i j is the element in row i, column j of the active power–voltage sensitivity matrix, representing the relationship between injecting unit reactive power at node j and the voltage change at node i.
Similarly, the electrical distance d i j QV based on the reactive power–voltage sensitivity matrix can be derived. Considering that node voltage is affected by changes in both active and reactive power, the electrical distance based on the sensitivity matrix is expressed as
d i j = d i j PV + d i j QV 2
The weight νij of the edge connecting node i and node j is inversely related to the electrical distance: a larger edge weight implies a smaller electrical distance. The mathematical expression between edge weight and electrical distance is
v i j = 1 d i j d i j , max
where d i j , max is the maximum element in the electrical distance matrix dij.
Therefore, this paper proposes the coordination interaction degree index λ reflecting the VPP network connections:
λ = 1 2 θ i Π j Π ( v i j φ i φ j 2 σ )
where θ is the sum of the weights of all edges in the network; and φi and φj are the sums of the weights of all edges connected to nodes i and j, respectively.
θ = i Π j Π v i j 2
φ i = j Π v i j
Integrating the above indices, this paper proposes the comprehensive aggregation index ζ for multiple VPPs in the distribution network.
ζ = 1 3 α + γ + λ

3.2. Multi-VPP Aggregation Algorithm in Distribution Networks

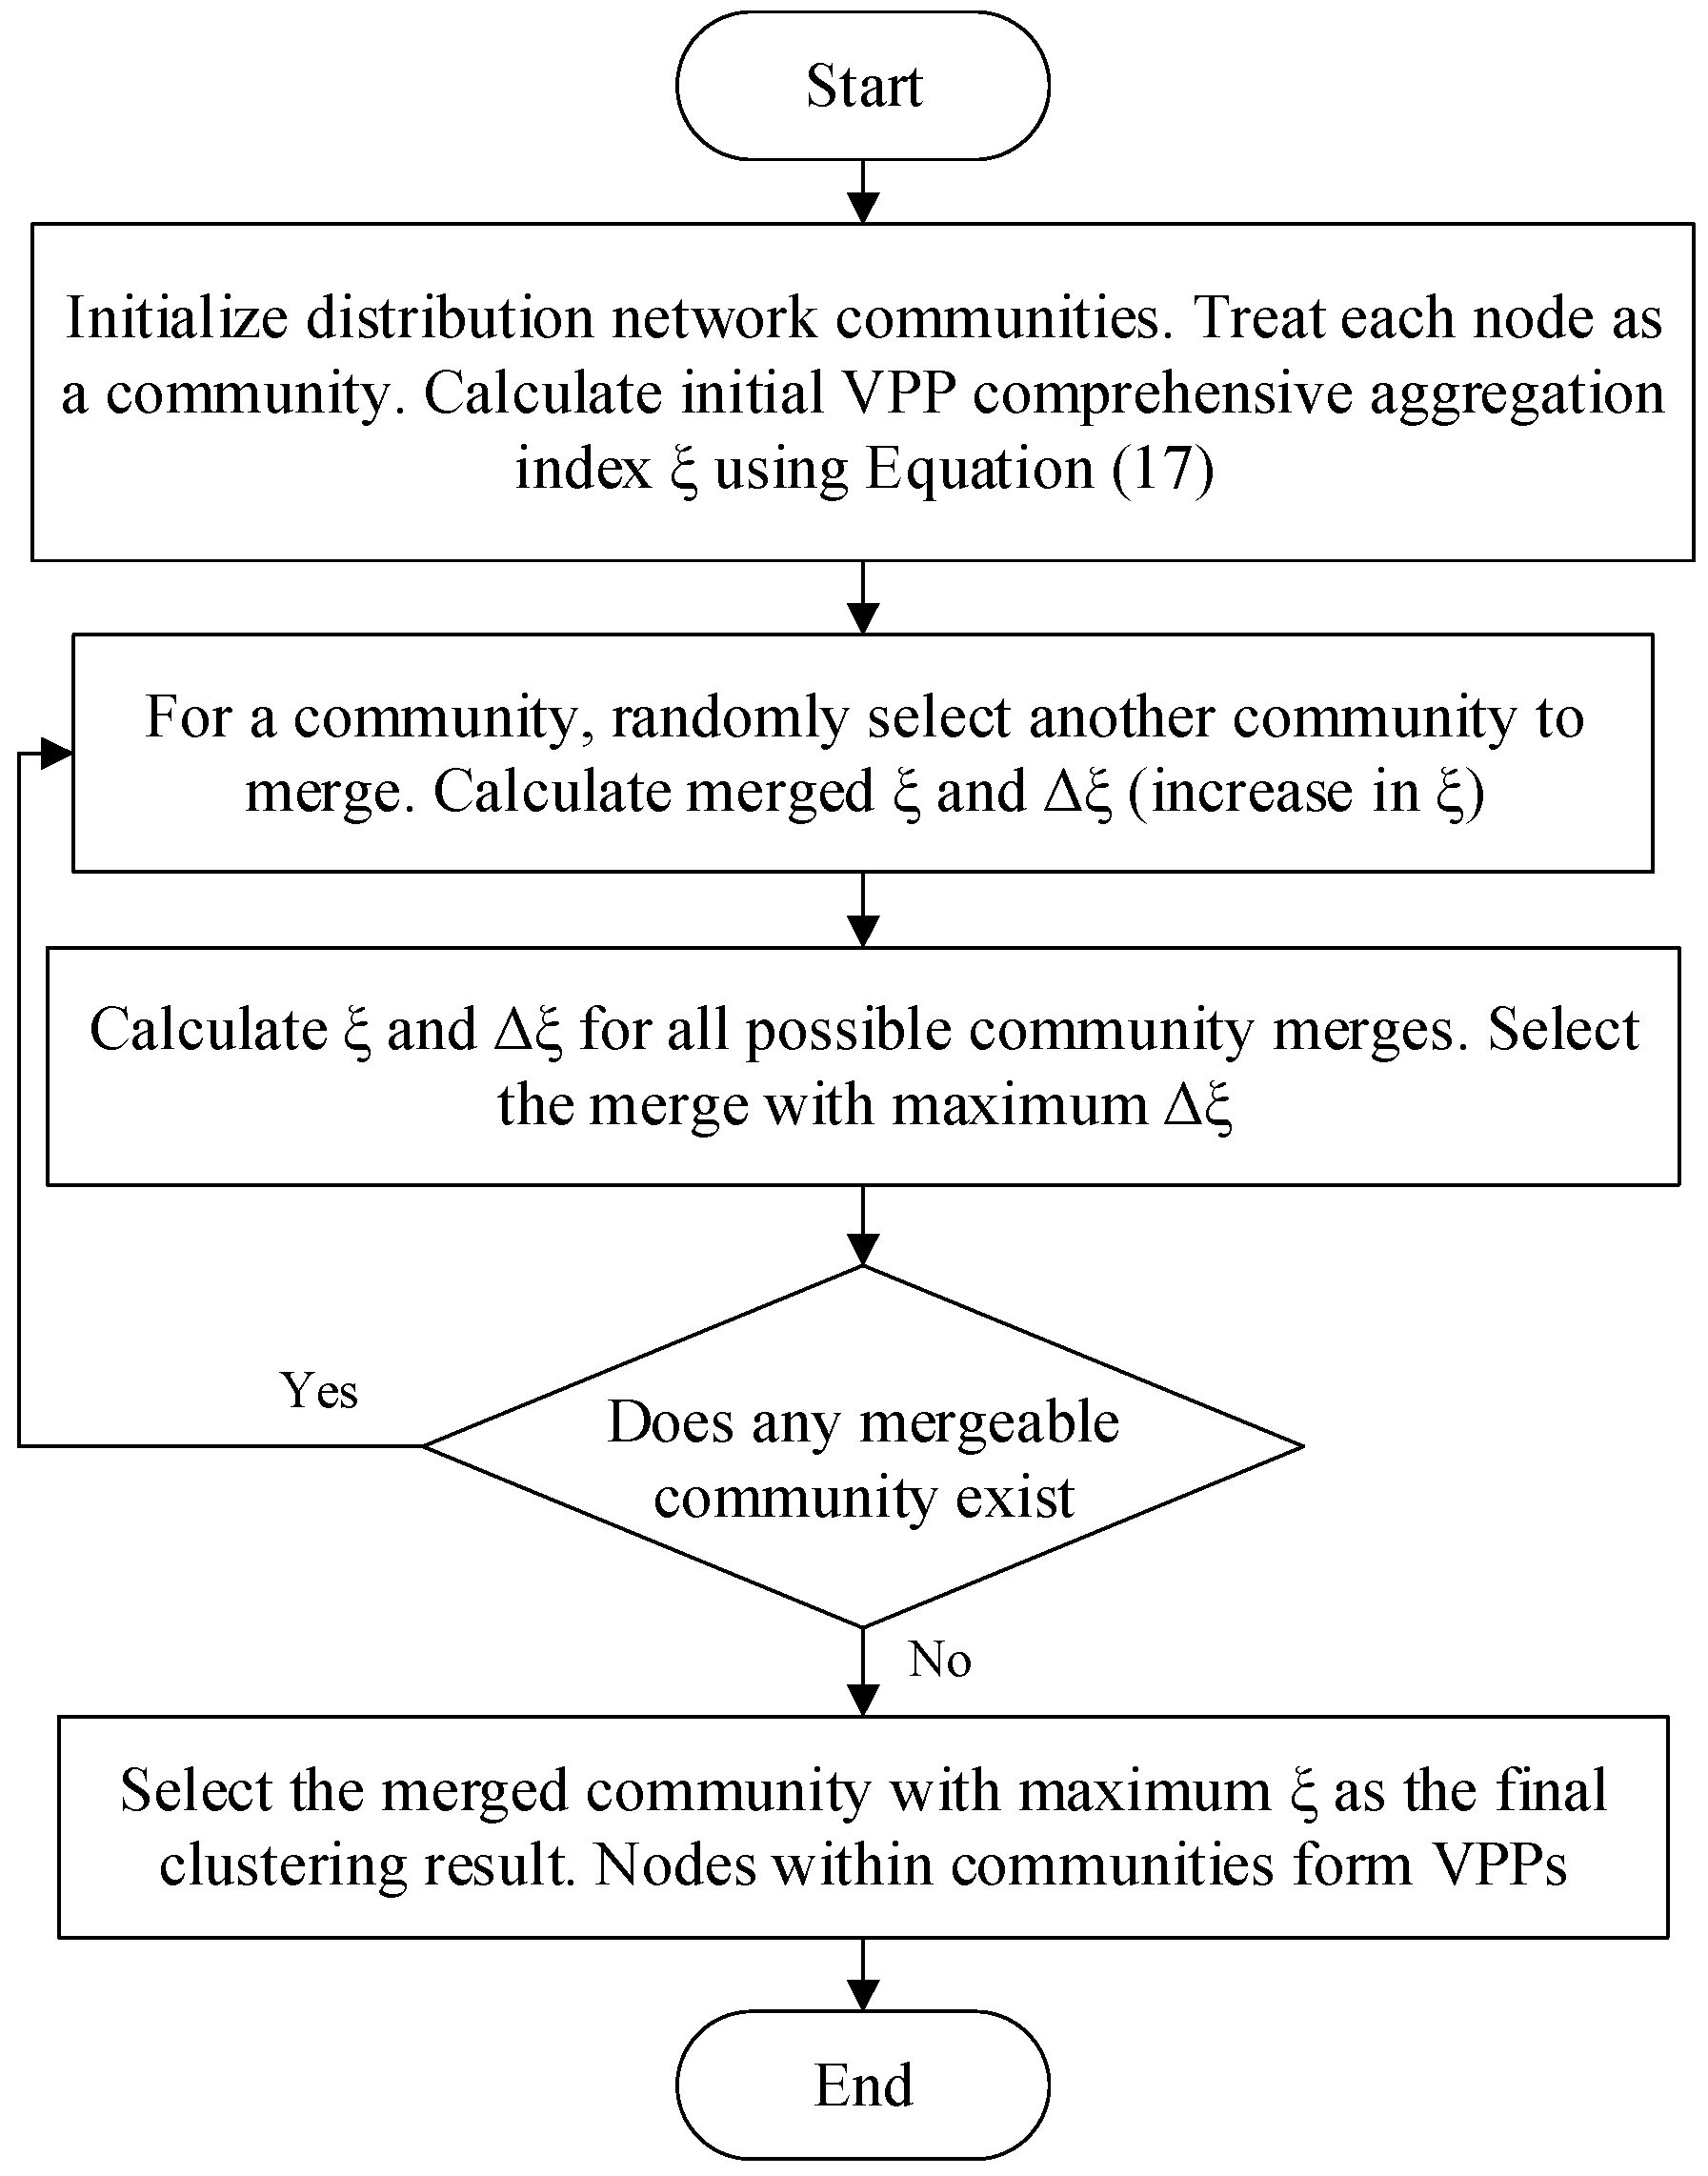
Community detection algorithms are proposed for systems with complex network structures in practice, aiming to resolve the community structures within complex networks [22]. Based on the aforementioned comprehensive aggregation index for multiple VPPs, this paper employs a community detection algorithm to detect communities within the distribution network nodes. The generated “communities” correspond to the VPPs within the distribution network. The algorithm flowchart is shown in Figure 2.

4. Optimized Power Self-Balancing Control Model for Multiple VPPs

4.1. VPP Independent Optimization Model

VPPs primarily rely on regulating DG inverters, controlling their active/reactive power output and ESS charging/discharging to achieve power self-balancing. Their operational costs mainly include loss cost due to active power regulation, inverter loss cost due to reactive power regulation, ESS charging/discharging equipment loss cost, and network loss cost.

4.1.1. VPP Independent Optimization Objective Function

Aiming to minimize the operational cost of each VPP, this paper establishes the following objective function for independent power self-balancing optimized control of a VPP.
min F St , k = F P , k + F Q , k + F Es , k + F Net , k
where F St , k is the total operational cost of VPP Π k under independent optimized control; F P , k is the loss cost due to active power regulation in VPP Π k ; F Q , k is the inverter loss cost due to reactive power regulation in VPP Π k ; F Es , k is the ESS equipment loss cost due to charging/discharging in VPP Π k ; and F Net , k is the network loss cost in VPP Π k .
(1)
Loss Cost due to Active Power Regulation
F P , k = f RES j Π k P j DG , act P j DG
where f RES is the active power curtailment cost coefficient of the DG; P j DG , act is the actual value of active power output from the DG at point j within VPP Π k ; and P j DG is the optimized value of active power output from the DG at point j within VPP Π k .
(2)
Inverter Loss Cost due to Reactive Power Regulation
F Q , k = f Q j Π k Q j DG
where f Q is the inverter reactive power regulation cost coefficient; and Q j DG is the reactive power regulation amount of the DG inverter at point j within VPP Π k .
(3)
ESS Equipment Loss Cost
F ESS , k = j Π k f Es ( P j c h + P j d i s )
where f Es is the loss cost coefficient of the ESS equipment; and P j ch and P j dis are the charging power and discharging power of the ESS equipment at point j within VPP Π k , respectively.
(4)
Network Loss Cost
F Net , k = f Net j Π k , i : i j ( r i j 2 + x i j 2 ) I i j
where f Net is the network loss cost coefficient; rij and xij are the resistance and reactance of line ij; and Iij is the square of the current magnitude on line ij.

4.1.2. VPP Independent Optimization Constraints

(1)
Power Balance Constraints
P j DG + P j dis + i Λ ( j ) ( P i j r i j I i j ) = P j ch + P j L + l Φ ( j ) P j l , j Π k
P j DG * + P j dis * + i Λ ( j ) ( P i j r i j I i j ) = P j ch * + P j L * + l Φ ( j ) P j l , j Π k
Q j DG + i Λ ( j ) ( Q i j x i j I i j ) = Q j L + l Φ ( j ) Q j l , j Π k
Q j DG * + i Λ ( j ) ( Q i j x i j I i j ) = Q j L * + l Φ ( j ) Q j l , j Π k
where Λ(j) is the set of upstream nodes of node j; Φ(j) is the set of downstream nodes of node j; P j DG * is the optimized value of active power output from the DG inverter at node j; P j ch * and P j dis * are the optimized values of ESS charging/discharging power at node j; Q j DG * is the optimized value of DG inverter reactive power regulation amount at node j; Pij and Qij are the active and reactive power transmitted on line ij; and Pjl and Qjl are the active and reactive power transmitted on line jl.
(2)
Node Voltage Constraints
U j = U i 2 ( r i j P i j + x i j Q i j ) + ( r i j 2 + x i j 2 ) I i j
( u min ) 2 U j ( u max ) 2
where Ui, Uj are the squares of the voltage magnitudes at nodes i, j; umin and umax are the minimum and maximum allowable voltage magnitudes for distribution network nodes.
(3)
Second-Order Cone Relaxation Constraint for Line Capacity
2 P i j 2 Q i j I i j U i 2 I i j + U i
(4)
Node Current Constraint
I i j ( i max ) 2
where imax is the maximum allowable current on line ij.
(5)
Distributed Generator Output Constraints
0 P j DG P max , j DG
Q max , j DG Q j DG Q max , j DG
Q max , j DG = tan ( arccos ( 0.95 ) ) P j DG
where P max , j DG is the upper limit of active power output from the DG at node j; and Q max , j DG is the maximum adjustable reactive power of the DG inverter at node j.
(6)
Energy Storage Operation Constraints
0 P j dis D P Es , max
0 P j ch 1 D P Es , max
where P Es , max is the maximum allowable charging/discharging power of the ESS equipment; and D is a 0–1 variable indicating the ESS charging/discharging state (1 for discharging, 0 for charging).

4.2. Multi-VPP Coordination Optimization Model

When voltage violations occur in the distribution network, VPP independent optimization control can eliminate internal voltage violations but cannot dispatch reactive resources outside the VPP, easily leading to unnecessary DG active power curtailment losses. To improve DG hosting capacity and reduce economic losses, this paper proposes a multi-VPP coordination and interaction optimized control strategy based on independent optimization.

4.2.1. VPP Coordination Optimization Objective Function

Compared to VPP independent optimization control, the interaction cost is added. The objective function is
min F MS , k = F P , k + F Q , k + F Es , k + F Net , k + F ex , k
where F MS , k is the total operational cost of VPP Π k under coordinated interactive optimized control; and F ex , k is the interaction cost between VPP Π k and other VPPs.
F ex , k = f Net b Π \ b k P k b 2
where Pkb is the magnitude of power exchanged between VPP Π k and other VPPs. Pkb > 0 indicates that VPP Π k exports power; Pkb < 0 indicates that VPP Π k receives power.

4.2.2. VPP Coordination Optimization Constraints

Based on the constraints of the VPP independent optimization model, multi-VPP coordinated interactive optimization requires adding equality constraints for boundary node voltages and inter-VPP line power to enable independent parallel optimization of each VPP and ensure convergence of the multi-VPP coordination optimization. Equation (38) is the boundary node voltage equality constraint for adjacent VPPs, while Equations (39) and (40) correspond to the power flow equality constraints on lines between adjacent VPPs.
U a = x a , x a = U a *
P a m * = y a m , y a m = P a m a m L B
Q a m * = z a m , z a m = Q a m a m L B
where Ua represents the squared voltage value at boundary node a of the upstream VPP; U a * represents the squared voltage value at the virtual balance node a of the downstream VPP; P a m * and Q a m * represent the virtual active and reactive load power at boundary node a of the upstream VPP; Pam and Qam represent the active and reactive power transmitted on the inter-VPP line am; LB represents the set of inter-VPP lines; and xa, yam and zam represent the global values of the squared voltage magnitude at boundary node a and the active/reactive power transmitted on inter-VPP line am, respectively.

5. Emerging Benefits Allocation for Multiple VPPs

5.1. Definition of Emerging Benefits

This paper defines emerging benefits as the reduction in the total operational cost of the multi-VPP system under coordinated interaction relative to the total cost when each VPP operates independently:
Δ F = k Π F St , k k Π F MS , k
where ΔF is the total emerging benefits generated by the multi-VPP system.

5.2. Emerging Benefits Allocation Process

The emerging benefits obtained by the multi-VPP system need to be fairly allocated to each VPP so that their operational costs are reduced, satisfying the benefit demands of each VPP. During multi-VPP coordinated interaction, the active and reactive regulation amounts of DG inverters within each VPP differ. A contribution degree model for each VPP is constructed based on their active and reactive regulation amounts.
ω k = Δ P k + Δ Q k k Π ( Δ P k + Δ Q k ) × 100 %
where ωk is the contribution degree index of VPP Π k ; ΔPk is the active power curtailment amount within VPP Π k during coordinated interaction; and ΔQk is the reactive power regulation amount within VPP Π k during coordinated interaction. It should be noted that Equation (42) is an empirical scoring index where ΔPk and ΔQk are treated strictly as dimensionless numerical scalars to represent the abstract volume of regulation effort, thereby avoiding physical dimensional inconsistency.
The emerging benefits are allocated according to the contribution degree index of each VPP:
Δ F k = ω k × Δ F
where Δ F k is the emerging benefit allocated to VPP Π k .
Through multi-VPP emerging benefits allocation, the real operational cost of each VPP can be obtained, as shown in Equation (44). Its value is the VPP’s independent operational cost minus the emerging benefit allocated to it.
F k act = F St , k Δ F k
where F k act is the real operational cost of VPP Π k .

5.3. Model Solution

This paper utilizes the MATLAB R2021a platform and employs the Yalmip toolbox to call the Cplex solver for model solution. The specific process is as follows:
Step 1: Initialize the parameters of the equipment within each VPP.
P j DG = P j DG , a c t ,   Q j DG = 0 ,   j Π
P j ch = 0 ,   P j dis = 0 ,   j Π
Step 2: Perform VPP aggregation on the distribution network at the VPP aggregation layer and transmit the aggregation results to the VPP independent optimization layer.
Step 3: At the VPP independent optimization layer, calculate the optimized control cost within each VPP based on the equipment regulation amounts, denoted as Fst,k(k = 1, 2, …, n). Solve the independent optimization control models in parallel to obtain the optimization results for each VPP: P j D G (j Π k , q = 1, 2, …, n), Q j D G (j Π k , k = 1, 2, …, n), P j d i s (j Π k , q = 1, 2, …, n), and P j c h (j Π k , k =1, 2, …, n). Transmit the optimization results of each VPP to the VPP coordinated optimization layer and transmit the independent optimization costs to the emerging benefits allocation layer.
Step 4: At the VPP coordinated optimization layer, based on the optimization results of each VPP from the independent optimization layer, calculate the squared voltage magnitude x a 0 at boundary node a and the active power y a m 0 and reactive power z a m 0 transmitted on inter-VPP line am. Solve the coordinated optimization control model to calculate the optimized control cost F Ms , k (k = 1, 2, …, n) within each VPP. Obtain the optimization results for each VPP and update the boundary node voltage and inter-VPP power data: x, y a m q and z a m q (q denotes the iteration number, q = 0, 1, 2, …, c). Set the convergence threshold for the iterative process as ϸ. Let
Δ = max x a q + 1 x a q , y a m q + 1 y a m q , z a m q + 1 z a m q
If Δ ≤ ϸ, stop the iteration, return the optimal solution, and transmit the control cost from VPP coordinated optimization to the emerging benefits allocation layer. Otherwise, perform a new round of solving the coordinated interactive optimization control model until convergence.
Step 5: At the emerging benefits allocation layer, calculate the total emerging benefits of the multi-VPP system according to Equation (41). Then, allocate the emerging benefits according to Equations (42)–(44) to calculate the final real operational control cost for each VPP.

6. Case Study

6.1. Case Parameter Description

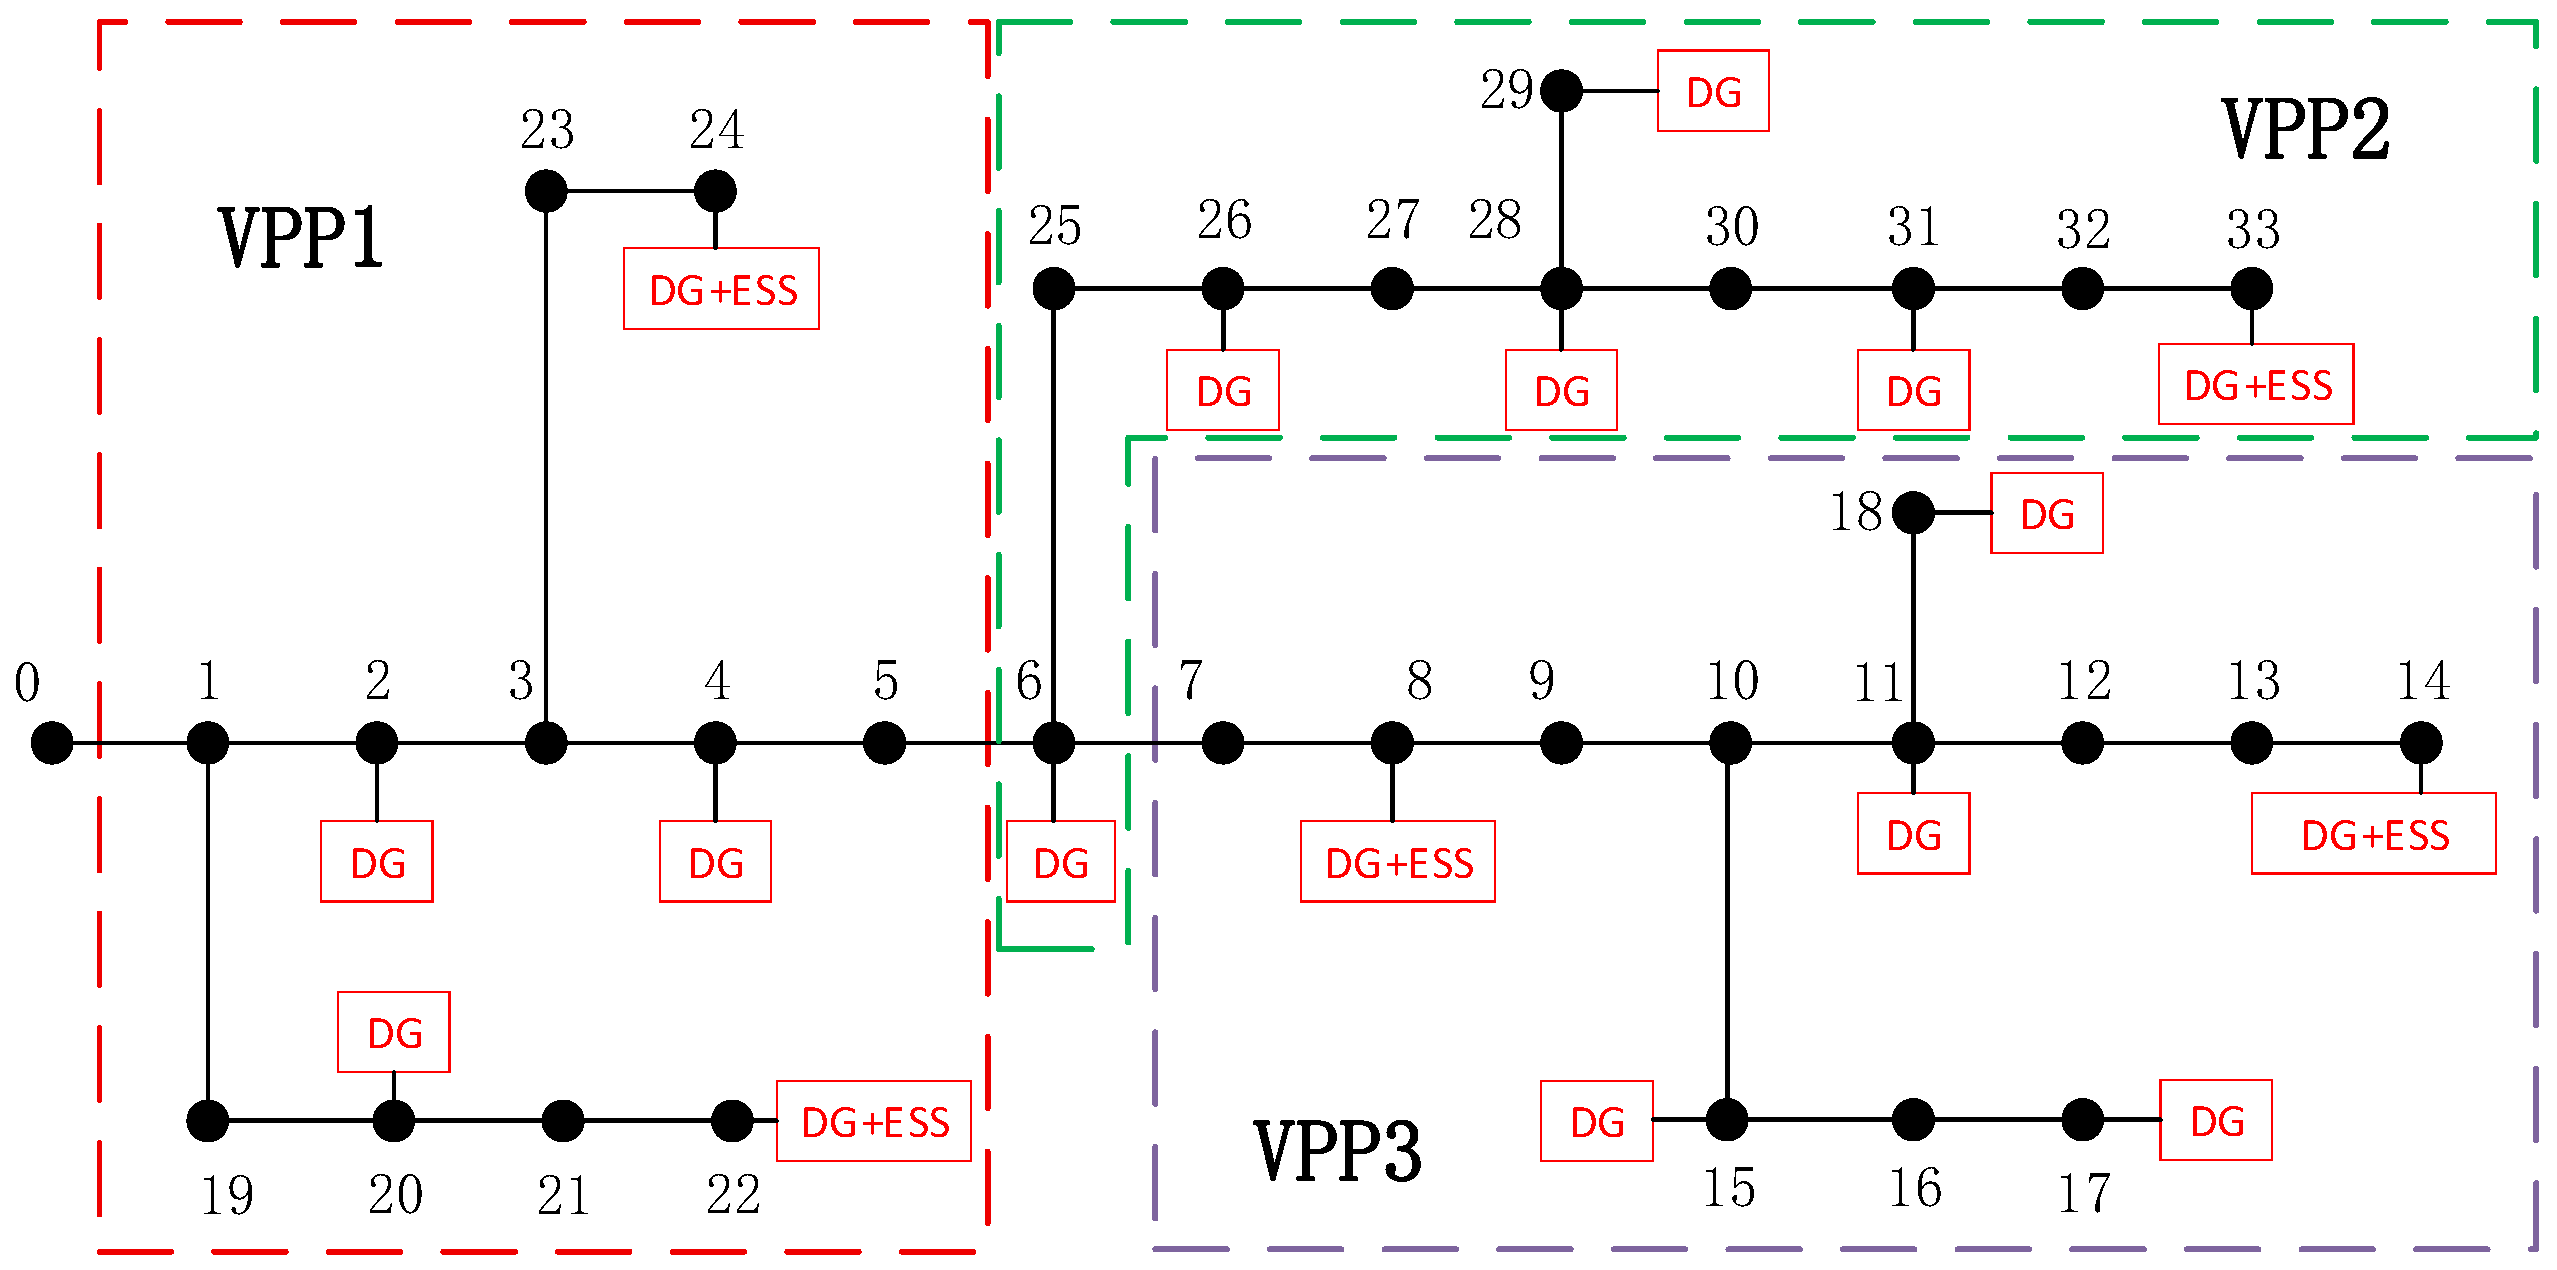
This paper uses an actual 10 kV line in Zhejiang Province, China, to validate the effectiveness of the proposed method. The topology of the line and the installation nodes of DGs and ESSs are shown in Figure 3. Specific line parameters and node load parameters are provided in Appendix A, Table A1 and Table A2. The total installed DG capacity is 2.9 MW, distributed across 17 nodes. The total ESS capacity is 0.6 MW, distributed across five nodes. Specific parameters are given in Appendix A, Table A3. Set fRES = 0.8 ¥/kW, fQ = 0.4 ¥/kvar, fEs = 0.4 ¥/kW, and fNet = 0.2 ¥/kW. It is worth noting that, while this study utilizes a specific 10 kV practical line, the proposed VPP aggregation algorithm relies on power–voltage sensitivity matrices. These matrices intrinsically adapt to the physical power flow equations, making the proposed methodology applicable and highly scalable to other topologies, including radial, backbone, and mixed networks.

6.2. Multi-VPP Aggregation Analysis for Distribution Network

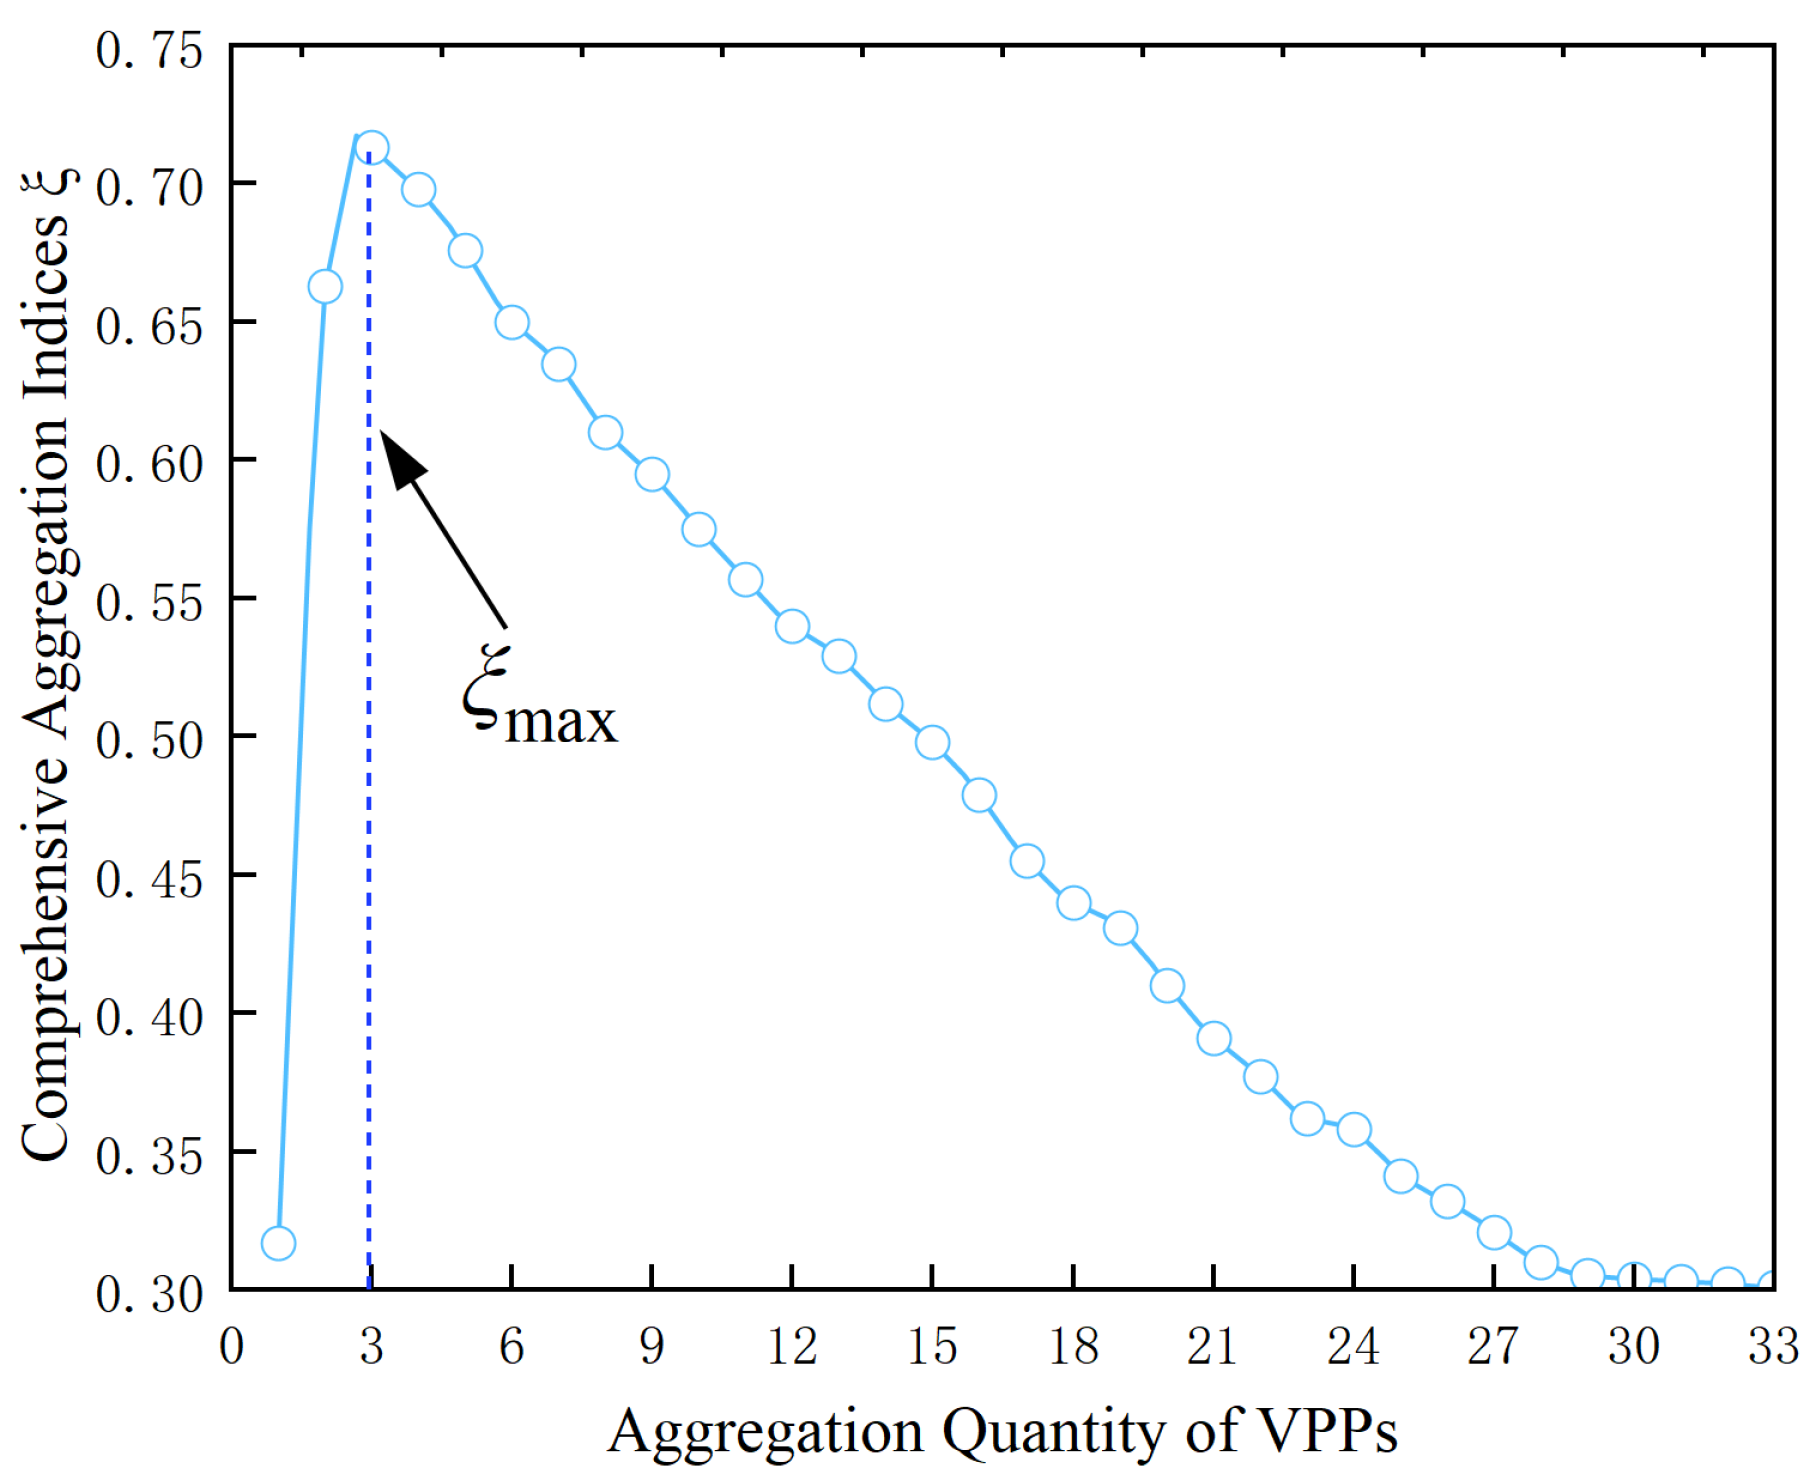
The first step of the proposed optimized control strategy is VPP aggregation, the effectiveness of which directly impacts the overall performance of subsequent optimized control. Using the proposed VPP aggregation method, aggregation analysis was performed on this 10 kV line. During the multi-VPP aggregation process, the comprehensive aggregation index ζ changes as different VPPs are aggregated, as shown in Figure 4. The results indicate that when the distributed resources of this line are aggregated into three VPPs, the comprehensive aggregation index ζ reaches its maximum value of 0.713, indicating that this VPP aggregation is the most reasonable. The VPPs are composed of nodes with adjustable resources enclosed within the dashed boxes in Figure 3.

6.3. Analysis of Coordinated Voltage Optimization Control

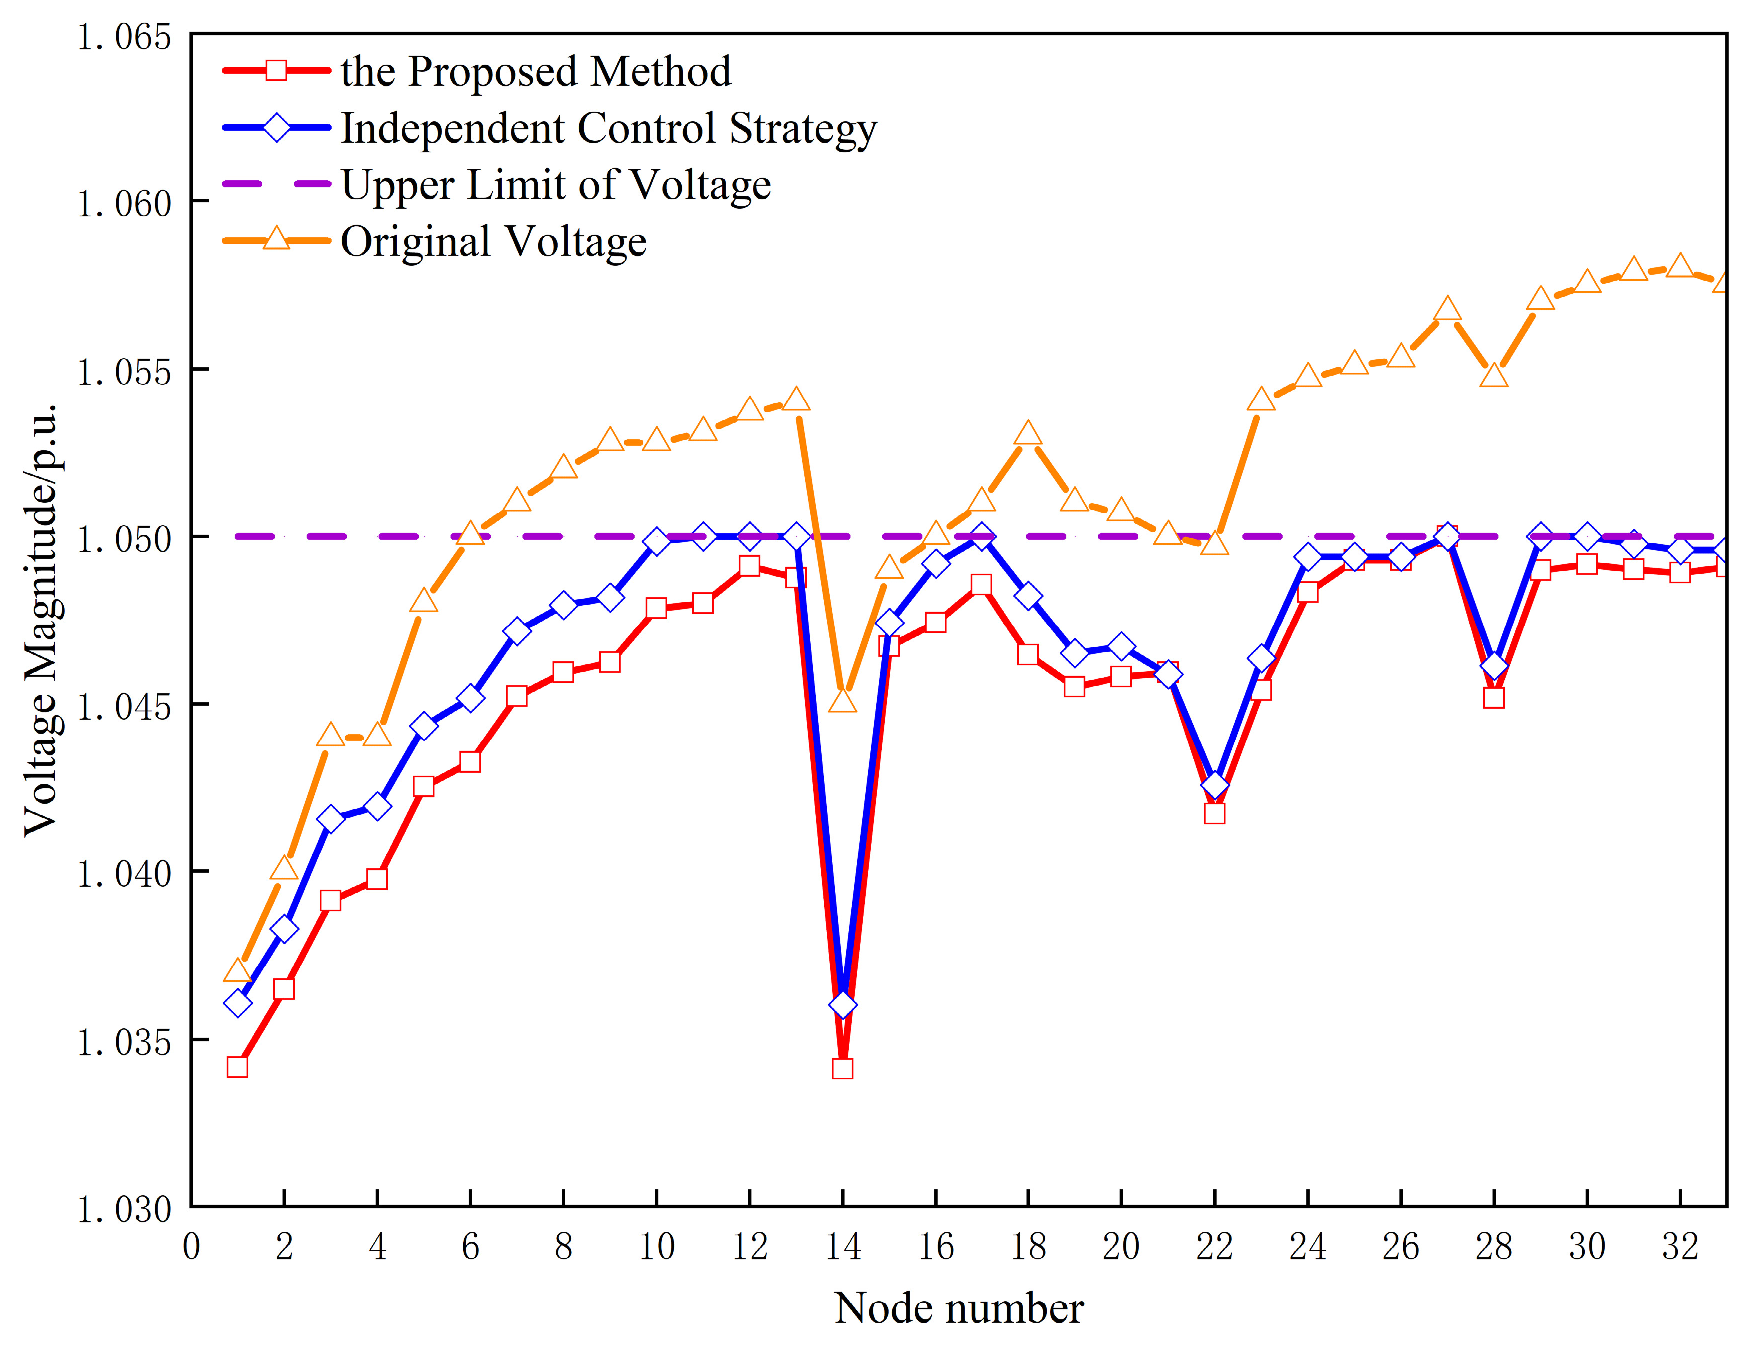
At noon, without control measures, severe overvoltage occurs on this line. The proportion of nodes with voltage magnitudes exceeding 1.05 p.u. reaches 66.7%. The voltage profile at this time is shown in Figure 5, indicating the need for corresponding control measures to resolve the voltage violation problem.
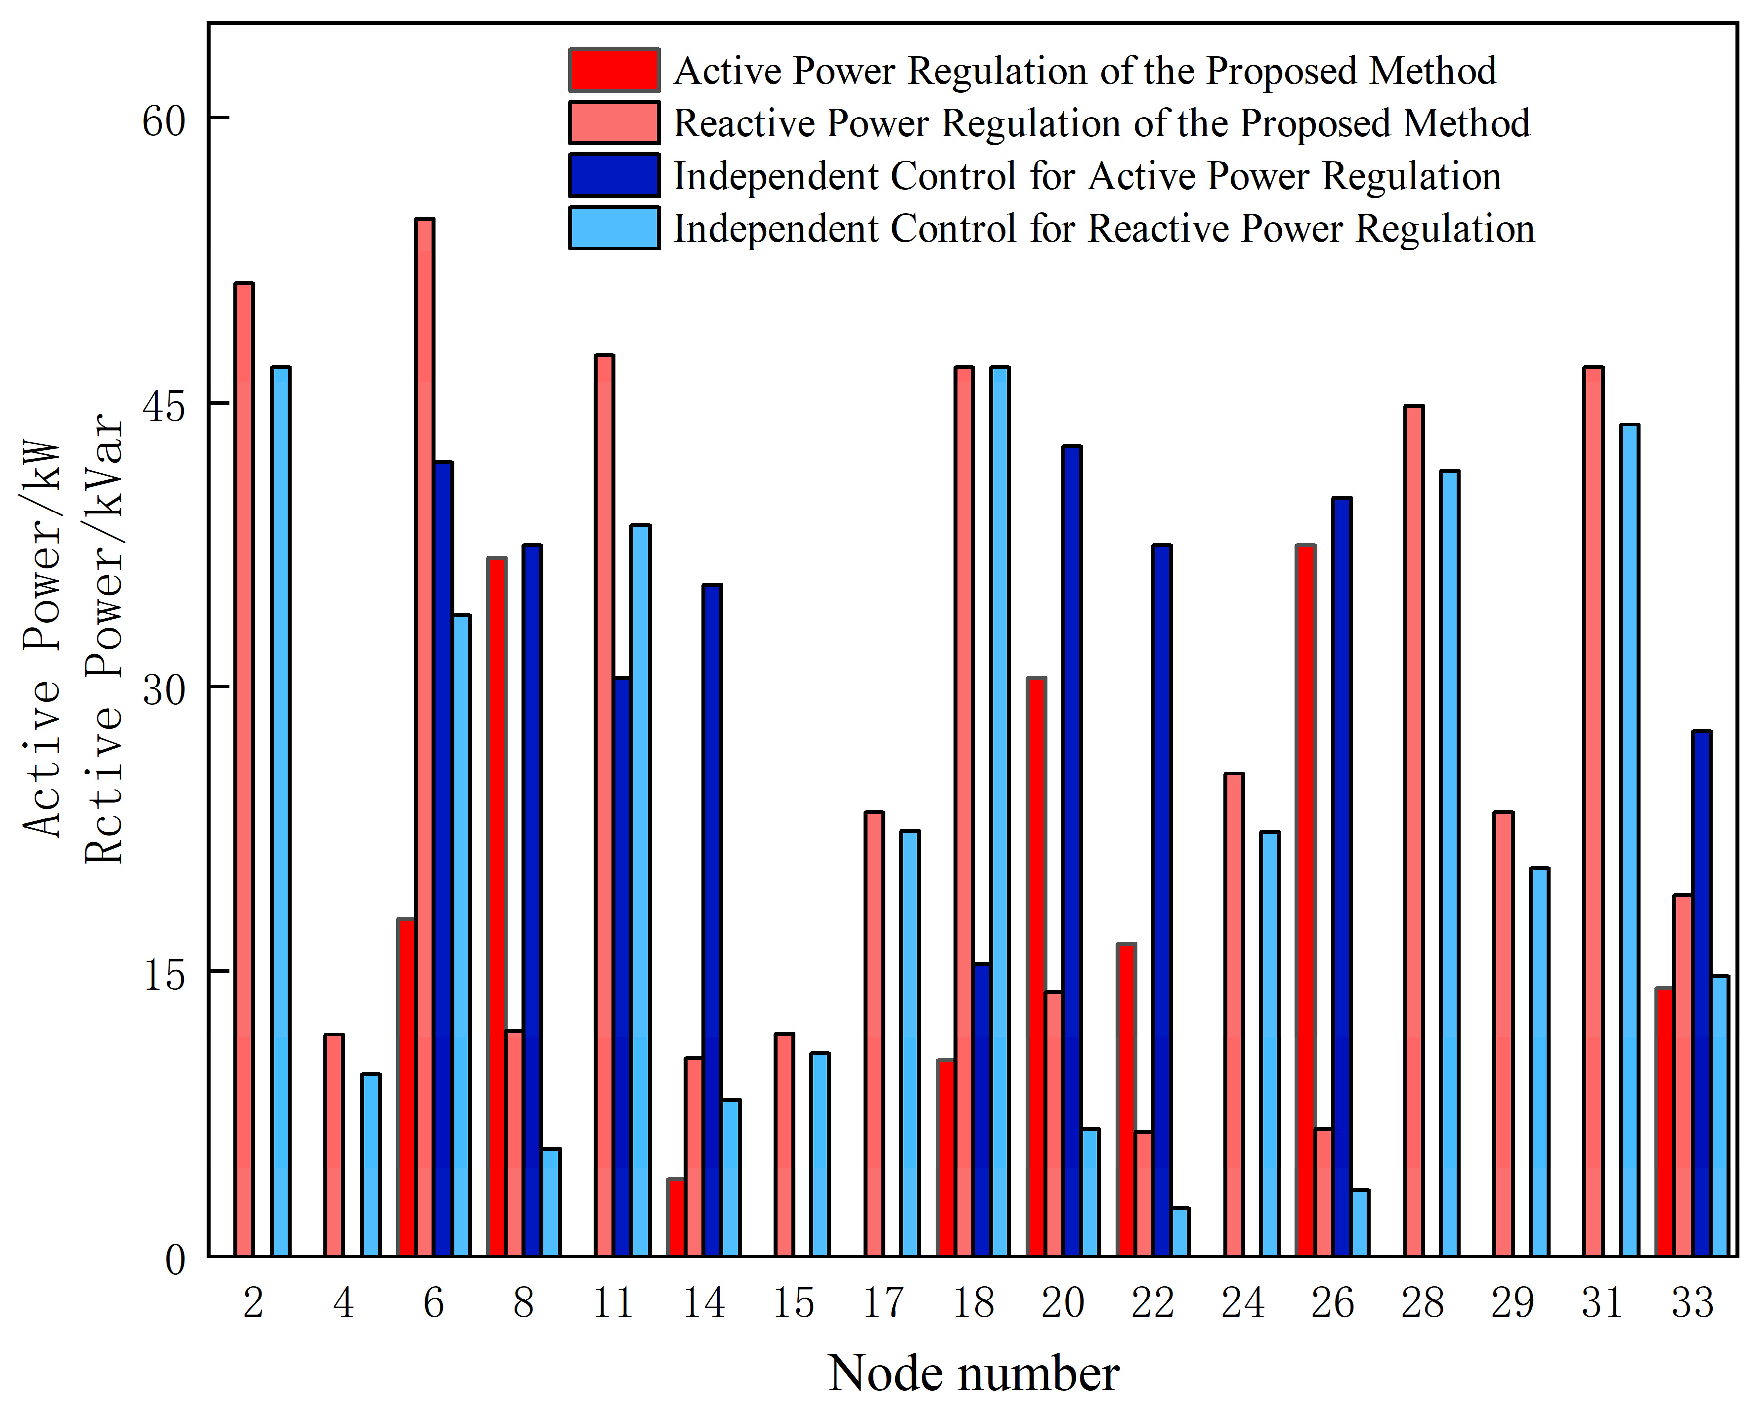
To analyze the voltage optimization control performance of the proposed method, a comparison is made with the VPP independent control method. The voltage distribution profiles of the distribution network under both methods are shown in Figure 5. The active and reactive regulation amounts of the DG inverters under the two methods are shown in Figure 6.
Comprehensive analysis of the results under the two control methods shows that both methods can regulate the node voltages to within the normal operating range after applying their respective control strategies. However, when operating independently, a VPP can only control its own internal equipment and utilize internal resources. By regulating inverters to curtail DG active power and absorb reactive power, VPP independent optimization control can eliminate distribution network voltage violations but cannot dispatch external reactive resources, easily leading to unnecessary DG generation curtailment losses. In contrast, the proposed method performs coordination and interaction based on the independent optimization control of each VPP, enabling the joint completion of the control task. This allows the resources of each VPP to be fully utilized, reduces the DG active power curtailment amount, and increases the DG hosting capacity.
To further analyze the effectiveness of the proposed method, a comprehensive comparison is made with traditional centralized control and independent control methods. The traditional centralized control method treats all nodes in the distribution network as a single VPP for regulation control. The total DG inverter reactive regulation amount QDG, total active regulation amount PDG, ESS charging power Pch, and optimization time T under these three methods are shown in Table 1.
From Table 1, it can be seen that, for DG inverter reactive regulation, the proposed method has the highest total reactive regulation amount, while the independent control method has the least. This indicates that the proposed method can maximize the utilization of reactive power. For DG inverter active regulation, the independent control method has the highest total active curtailment, while the centralized control method has the least, meaning centralized control best guarantees DG hosting. For ESS charging, the independent control method has the highest charging amount, while the other methods have the same charging amount. Regarding optimization time, independent control has the shortest time, and centralized control has the longest time, meaning independent control has the best computational performance.
Further analysis shows the following: (1) Independent control has better computational performance than the proposed method. However, because independent control can only utilize internal reactive resources, it needs to curtail more DG active power to regulate the distribution network voltage within the safe operating range. The proposed method enables coordination among multiple VPPs, fully utilizes reactive resources, and requires less active power curtailment to achieve voltage regulation. (2) The centralized control method has a slight advantage over the proposed method in DG inverter active regulation. However, the results show only minor deviations in the total reactive and active regulation amounts between these two methods, which are essentially the same. The optimization time for centralized control is 310.4 s, while for the proposed method it is 40.7 s, representing a speedup of 6.62 times. With the same optimization effect, the proposed method is faster, and its computational performance is far superior to centralized control.
The simulated scenario (noon time) represents the worst-case condition with maximum PV output and low load, which is most susceptible to severe overvoltage. Under other typical operational conditions, such as the peak load mode or night mode (minimum PV), the voltage violation risks are naturally mitigated. In these scenarios, the multi-VPP system seamlessly transitions to basic energy self-balancing, where DG curtailment approaches zero, and the coordination mechanism dynamically schedules ESS and reactive resources to maintain system stability. This confirms the robustness of the proposed strategy across diverse load behaviors.

6.4. Control Cost Analysis for Multi-VPP in Distribution Network

Under the proposed control strategy, the contribution degree of VPP1 is 24.99%, VPP2 is 42.48%, and VPP3 is 32.53%. The detailed calculation and analysis process for VPP contribution degrees and final real control costs are provided in Appendix B.
To further illustrate the superiority of the proposed method regarding control cost, based on the VPP aggregation results of this paper, the control cost results of the multi-stakeholder interactive game optimization control method from reference [23] are compared with those of the proposed method. The control cost results under the two methods are shown in Table 2.
From Table 2, the total control cost required by the proposed method is 676.37¥, while that of the Ref. [23] method is 696.44¥. Compared with the Ref. [23] method, the proposed method has a lower total control cost. Moreover, because the proposed method incorporates an emerging benefits allocation mechanism linking cost allocation to the actual contribution of each VPP, VPP2 and VPP3 under the proposed method, having higher contribution degrees, bear less cost. Therefore, their control costs are lower than those in the Ref. [23] method. However, VPP1 under the proposed method has the lowest contribution degree and consequently bears the highest allocated control cost, making its control cost higher than that in the Ref. [23] method. The inclusion of the multi-VPP emerging benefits allocation process significantly improves the fairness and rationality of cost allocation, thereby fully mobilizing the enthusiasm of each VPP to participate in distribution network regulation.
In summary, the proposed optimized control strategy is more aligned with the development trend of future large-scale DG integration into distribution networks.

6.5. Sensitivity Analysis of Cost Coefficients

To validate the robustness of the proposed methodology under varying market pricing scenarios, a sensitivity analysis was conducted on the key economic parameters. Specifically, the active power curtailment cost coefficient (fRES) and the inverter reactive power regulation cost coefficient (fQ) were varied by ±20%. The simulation results indicate that, while the absolute monetary values of the total operational costs fluctuate correspondingly with the price variations, the proposed comprehensive VPP aggregation index $\zeta$ consistently reaches its maximum under the identical structural partition (the three-VPP structure). Furthermore, the contribution-based emerging benefits allocation mechanism remains effective, ensuring that all individual VPPs achieve cost reductions compared to independent operation across all tested price scenarios. This confirms that the proposed hierarchical VPP aggregation and coordination strategy is highly robust against market price volatility.

7. Conclusions

7.1. Research Work Summary

This paper proposed an optimized control strategy for power self-balancing in distribution networks based on VPP aggregation. Validated on an actual 10 kV line in Zhejiang, China, the main conclusions are as follows:
(1)
The proposed methodology successfully achieves global energy optimization through a hierarchical VPP aggregation architecture. It efficiently regulates over-limit voltages back into the safe operating range while minimizing DG active power curtailment and increasing DG hosting capacity.
(2)
The optimization results of the proposed coordinated control are essentially identical to traditional centralized control, but it drastically improves computational performance, achieving a speedup of 6.62 times. This makes it highly adaptable to the fast-response requirements of future large-scale DG integration.
(3)
Economically, compared to the uncoordinated independent control, the proposed strategy reduces the overall operational cost of the multi-VPP system by 14.23%. The newly established contribution degree model guarantees a fair distribution of these emerging benefits, ensuring that every participating VPP reduces its individual control cost, thereby fully satisfying the independent benefit demands of all stakeholders.

7.2. Outlook for Follow-Up Work

This paper establishes a solid deterministic framework for multi-VPP physical partition and economic aggregation. However, the current model has limitations regarding the stochastic nature of renewable generation. Future work will expand on this research in two main directions:
(1)
Handling Uncertainties: We will incorporate robust optimization and probabilistic models (such as Monte Carlo simulations) to explicitly account for the statistical characteristics and forecasting errors of large-scale DG output and load variations, utilizing correlation tools to handle the spatial and temporal uncertainties between multiple generation sources.
(2)
Advanced Distributed Solvers: We plan to explore the integration of advanced distributed optimization algorithms, such as Alternating Direction Method of Multipliers (ADMM) or game-theoretic multi-agent models, into the current aggregation architecture to further enhance data privacy and inter-VPP communication efficiency.

Author Contributions

Z.D.: Responsible for program compilation and writing—original draft. C.Z.: Responsible for writing—review and editing. X.Z.: Responsible for methodology and project administration. R.W.: Responsible for resources and formal analysis. C.X.: Responsible for resources, formal analysis sources, and formal analysis. All authors have read and agreed to the published version of the manuscript.

Funding

State Grid Shanghai Municipal Electric Power Company “Research on the Collaborative Optimization Planning Technology of Distributed Power Sources and Distribution Networks Considering the Operation Mode of Virtual Power Plants” (SGSHPD00ZSJS2410110).

Data Availability Statement

The original contributions presented in this study are included in the article. Further inquiries can be directed to the corresponding author.

Conflicts of Interest

Authors Zhenlan Dou and Chunyan Zhang are employed by State Grid Shanghai Municipal Electric Power Company. Author Xichao Zhou is employed by State Grid Integrated Energy Service Group Co., Ltd. The remaining authors declare that the research was conducted in the absence of any commercial or financial relationships that could be construed as potential conflicts of interest. The funder was not involved in the study design, collection, analysis, interpretation of data, the writing of this article or the decision to submit it for publication.

Appendix A

Table A1. Parameters of lines within network.
From BusTo BusLine Impedance (Ω)From BusTo BusLine Impedance (Ω)
010.3943 + j0.185521220.64 + j1.29
120.2149 + j0.10113231.58 + j2.46
230.2266 + j0.106623240.743 + j1.061
340.0829 + j0.03910152.7 + j3.79
450.3979 + j0.187315160.64 + j1.29
560.2949 + j0.138816174.396 + j6.172
670.7579 + 0.356611180.515 + j0.219
780.4316 + j0.20316250.43 + j0.657
891.68 + j0.9725263.13 + j6.482
9100.299 + j0.82326270.8302 + j0.3906
10110.12 + j0.47127280.592 + j0.364
11120.186 + j0.26128291.0317 + j0.4855
12130.21 + j0.7328300.9943 + j0.4679
13140.9 + j0.80430311.1375 + j0.5352
1190.731 + j1.29831320.0843 + j0.0396
19203.773 + j5.29732330.2364 + j0.1083
20212.7 + j3.79
Table A2. Parameters of node load.
BusActive Power Load/kWReactive Power Load/kVarBusActive Power Load/kWReactive Power Load/kVar
00017101.652.9
147.223.51870.834.2
234.71719110.354.4
362.531.8205628
441.82021104.251.3
559.329.42289.544
683.142236632.3
75025.224115.758.6
894.446.7258140
973362696.447.8
1068.733.12778.238
1152.326.628120.560.8
1286.943.52936.331
13773930108.953.2
1465.532.43157.628.5
1592.1483271.536.8
1653263355.817.6
Table A3. Installation location and capacity of DG and energy storage equipment.
Adjustable ResourcesNodeCapacity/kW
ESS8, 14, 22100
24, 33150
DG2, 6, 11, 15, 18, 24, 31100
4, 14, 17, 20, 22, 28, 29, 33200
8, 26300

Appendix B

First, the total emerging benefits of the multi-VPP system, ΔF, are calculated to be 112.25¥ using Equation (41), based on the total cost required for VPP independent control and the total cost required for VPP coordinated interaction. Details of the control costs for each VPP are shown in Table A4.
Second, the contribution degree of each VPP during coordinated interaction is calculated using Equation (42) based on their DG inverter active and reactive regulation amounts. The calculation results are shown in Table A5.
Table A4. VPP control costs.
Control MethodVPP1VPP 2VPP 3Total Cost
Independent229.52¥280.71¥278.39¥788.62¥
Coordinated201.11¥253.72¥221.54¥676.37¥
Table A5. Contribution degree of each VPP.
Regulation AmountVPP1VPP2VPP3
Regulation Amount155.83264.89202.82
Contribution Degree (%)24.9942.4832.53
Finally, the emerging benefits are allocated according to each VPP’s contribution degree using Equation (43). The real control cost for each VPP is calculated using Equation (44). The results are shown in Table A6.
From Table A6, it can be seen that the real control costs for VPP1, VPP2, and VPP3 are 201.46¥, 233.03¥, and 241.88¥, respectively. All are lower than the costs under independent control, satisfying the demand that VPPs joining the multi-VPP system can enhance their own benefits.
Table A6. Emerging benefit distribution and VPP real control costs.
TypeVPP1VPP2VPP3
Independent Cost229.52¥280.71¥278.39¥
Allocated Benefit28.06¥47.68¥36.51¥
Real Cost201.46¥233.03¥241.88¥

References

  1. Wang, H. National People’s Congress Representative Li Shengquan: Accelerating the construction of a new power system to serve the “dual carbon” goals and the construction of a beautiful China. China Energy News, 11 November 2024; p. 7, (In Chinese). [CrossRef]
  2. Bie, Z.; Ren, Y.; Li, G.; Yan, Z.; Wang, Y.; Sun, S. Morphological structure and development path of urban energy system for carbon emission peak and carbon neutrality. Autom. Electr. Power Syst. 2022, 46, 3–15. (In Chinese) [Google Scholar] [CrossRef]
  3. Zhu, Y.; Yu, H.; Zhang, X. Control Method of Grid-Connected Power Balance under Distributed Rooftop Photovoltaic Access. Power Syst. Clean Energy 2022, 38, 134–140. (In Chinese) [Google Scholar]
  4. Wang, C.; Shi, Z.; Liang, Z.; Li, Q.; Hong, B.; Huang, B.; Jiang, L. Key Technologies and Prospects of Demand-side Resource Utilization for Power Systems Dominated by Renewable Energy. Autom. Electr. Power Syst. 2021, 45, 37–48. (In Chinese) [Google Scholar] [CrossRef]
  5. Pan, C.; Fan, G.; Bao, Y.; Li, R.; Yu, F.; Bao, F. Collaborative Regulation of Demand-Side Resources Participating in Distributed Generation Grid Connection. Acta Energiae Solaris Sin. 2023, 44, 306–315. (In Chinese) [Google Scholar] [CrossRef]
  6. Esfahani, M.; Alizadeh, A.; Cao, B.; Kamwa, I.; Xu, M. Bridging Theory and Practice: A Comprehensive Review of Virtual Power Plant Technologies and Their Real-World Applications. Renew. Sustain. Energy Rev. 2025, 222, 115929. [Google Scholar] [CrossRef] [Scilit]
  7. Kaiss, M.; Wan, Y.; Gebbran, D.; Vila, C.U.; Dragičević, T. Review on Virtual Power Plants/Virtual Aggregators: Concepts, Applications, Prospects and Operation Strategies. Renew. Sustain. Energy Rev. 2024, 211, 115242. [Google Scholar] [CrossRef] [Scilit]
  8. Feng, J.; Ran, L.; Wang, Z.; Zhang, M. Optimal Bidding Strategy for Virtual Power Plant in Multiple Markets Considering Integrated Demand Response and Energy Storage. J. Energy Storage 2025, 124, 116706. [Google Scholar] [CrossRef] [Scilit]
  9. Qin, W.; Li, X.; Jing, X.; Zhu, Z.; Lu, R.; Han, X. Multi-temporal Optimization of Virtual Power Plant in Energy-Frequency Regulation Market Under Uncertainties. J. Mod. Power Syst. Clean Energy 2024, 13, 675–687. [Google Scholar] [CrossRef] [Scilit]
  10. Wang, Y.; Wang, H.; Du, X. Optimized Operation of Multi-Virtual Power Plant for Energy Sharing Based on Nash Multi-Stage Robust. IEEE Access 2024, 12, 169805–169823. [Google Scholar] [CrossRef] [Scilit]
  11. Shayegan-Rad, A.; Badri, A.; Zangeneh, A. Day-ahead scheduling of virtual power plant in joint energy and regulation reserve markets under uncertainties. Energy 2017, 121, 114–125. [Google Scholar] [CrossRef] [Scilit]
  12. Liu, N.; Yu, X.; Wang, C.; Li, C.; Ma, L.; Lei, J. Energy-sharing model with price-based demand response for microgrids of peer-to-peer prosumers. IEEE Trans. Power Syst. 2017, 32, 3569–3583. [Google Scholar] [CrossRef] [Scilit]
  13. Razeghi-Jahromi, M.; Asiedu, S.T.; Choobineh, M.; Melese, A. Centralized Hybrid Voltage Control of Active Distribution Network Using Recursive Least Squares Method for Sensitivity Estimation. IEEE Access 2026, 14, 51328–51341. [Google Scholar] [CrossRef] [Scilit]
  14. Yu, N.; Zhang, S.; Qin, J.; Hidalgo-Gonzalez, P.; Dobbe, R.; Liu, Y.; Dubey, A.; Wang, Y.; Dirkman, J.; Zhong, H.; et al. Data-driven control, optimization, and decision-making in active power distribution networks. Appl. Energy 2025, 397, 126253. [Google Scholar] [CrossRef] [Scilit]
  15. Joshi, A.; Chow, M.-Y. Hierarchical Distributed Consensus-Based Energy Management in Networked Microgrids. IEEE Trans. Ind. Inform. 2025, 22, 1750–1760. [Google Scholar] [CrossRef] [Scilit]
  16. Xiao, C.; Zhao, B.; Zhou, J.; Li, P.; Ding, M. Network partition based cluster voltage control of high-penetration distributed photovoltaic systems in distribution networks. Autom. Electr. Power Syst. 2017, 41, 147–155. (In Chinese) [Google Scholar] [CrossRef]
  17. Qu, F.; Zhao, J.; Cai, Z.; Hu, C.; Dai, S.; Sun, Q. Collaborative Optimization Control Strategy for Virtual Power Plant of Electric Vehicles and Thermostatically Controlled Loads. Proc. CSU-EPSA 2021, 33, 48–56. (In Chinese) [Google Scholar] [CrossRef]
  18. Abbasi, M.H.; Taki, M.; Rajabi, A.; Li, L.; Zhang, J. Coordinated operation of electric vehicle charging and wind power generation as a virtual power plant: A multi-stage risk constrained approach. Appl. Energy 2019, 239, 1294–1307. [Google Scholar] [CrossRef] [Scilit]
  19. Yi, Z.; Xu, Y.; Wang, H.; Sang, L. Coordinated Operation Strategy for a Virtual Power Plant With Multiple DER Aggregators. IEEE Trans. Sustain. Energy 2021, 12, 2445–2458. [Google Scholar] [CrossRef] [Scilit]
  20. Wu, Y.; Tian, X.; Gai, L.; Lim, B.-H.; Wu, T.; Xu, D.; Zhang, Y. Energy management for PV prosumers inside microgrids based on Stackelberg–Nash game considering demand response. Sustain. Energy Technol. Assess. 2024, 68, 103856. [Google Scholar] [CrossRef] [Scilit]
  21. Jin, X.; Xiao, C.; Peng, K. Optimal Control of Power Self-balancing for Distribution Network Based on Decentralized Complex Adaptive System of Systems. Autom. Electr. Power Syst. 2025, 49, 101–109. (In Chinese) [Google Scholar] [CrossRef]
  22. Liu, Z.; Hu, W.; Guo, G.; Wang, J.; Xuan, L.; He, F.; Zhou, D. A Graph-Based Genetic Algorithm for Distributed Photovoltaic Cluster Partitioning. Energies 2024, 17, 2893. [Google Scholar] [CrossRef] [Scilit]
  23. Xiao, C.; Ding, M.; Sun, L.; Chung, C. Network partition-based two-layer optimal scheduling for active distribution networks with multiple stakeholders. IEEE Trans. Ind. Inform. 2020, 17, 5948–5960. [Google Scholar] [CrossRef] [Scilit]
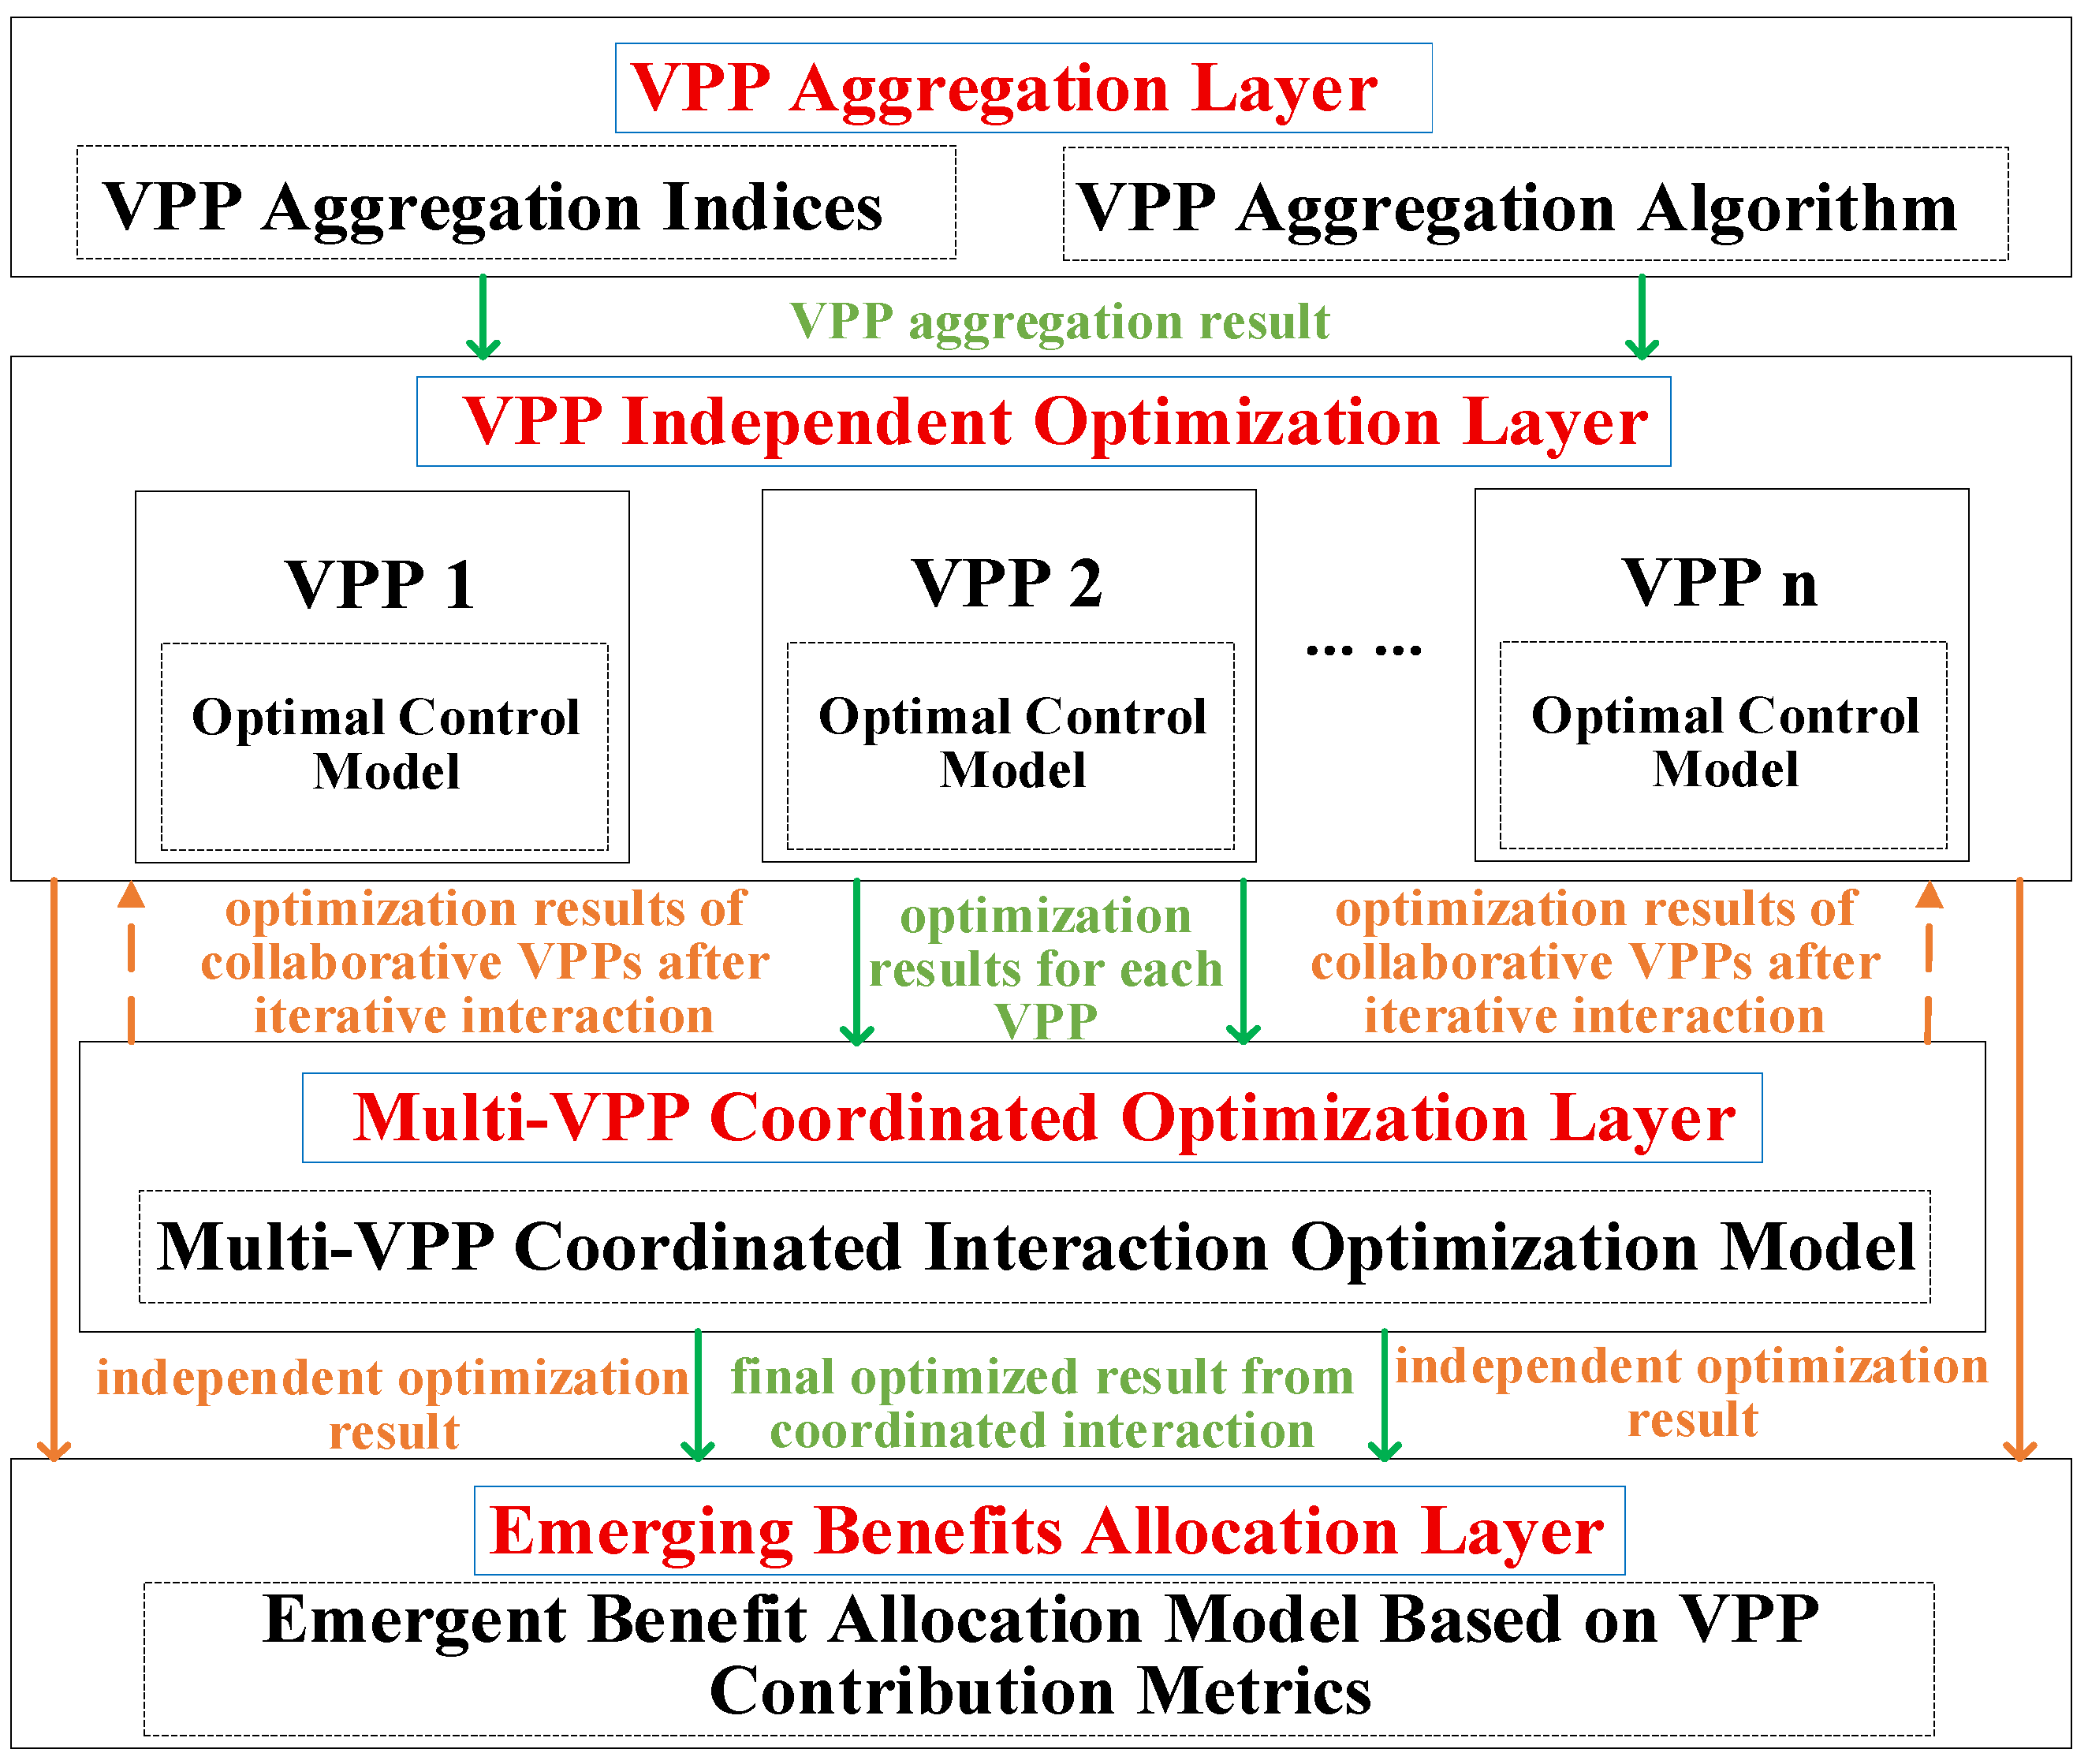
Figure 1. Architecture of control strategy.
Processes 14 02819 g001
Figure 2. Flow chart of VPP aggregation algorithm.
Processes 14 02819 g002
Figure 3. Topology and PVV aggregation results of 10 kV line.
Processes 14 02819 g003
Figure 4. Variation in the multi-VPP comprehensive aggregation index ζ.
Processes 14 02819 g004
Figure 5. Voltage distribution profiles under different methods.
Processes 14 02819 g005
Figure 6. Active and reactive regulation amounts of DGs under the two methods.
Processes 14 02819 g006
Table 1. Comparison of optimization results under three methods.
Control MethodsQDG/kVarPDG/kWPch/kWT/s
Centralized Control453.25166.37500310.4
Independent Control378.51308.5460020.3
Proposed Method456.17167.3850040.7
Table 2. Comparison of control costs under two methods.
MethodControl Cost/¥
VPP1VPP2VPP3
Proposed Method201.46233.03241.88
Ref. [23] Method192.34250.63253.47
Disclaimer/Publisher’s Note: The statements, opinions and data contained in all publications are solely those of the individual author(s) and contributor(s) and not of MDPI and/or the editor(s). MDPI and/or the editor(s) disclaim responsibility for any injury to people or property resulting from any ideas, methods, instructions or products referred to in the content.