Article

Integrating Life Cycle Assessment and Multi-Criteria Decision-Making to Identify Sustainable Cementitious Mixtures for 3D Concrete Printing

by
Maria de Lourdes Xavier de França Neta Alves
1,*,
Marcos Alyssandro Soares dos Anjos
1,2,
Ricardo Filipe Mesquita da Silva Mateus
3,
Camila Macêdo Medeiros
2,
Marcella de Sena Barbosa
4,
Thalita Dayane de Melo Mendes Sabino
4,
José Anselmo da Silva Neto
4,* and
Cinthia Maia Pederneiras
5
1
Postgraduate Program in Civil and Environmental Engineering (PPGECAM), Federal University of Paraíba (UFPB), João Pessoa 58051-900, Brazil
2
Department of Civil Engineering, Federal Institute of Paraiba (IFPB), João Pessoa 58015-430, Brazil
3
Institute for Sustainability and Innovation in Structural Engineering, Advanced Production and Intelligent Systems Associated Laboratory, Department of Civil Engineering, University of Minho, 4800-058 Guimarães, Portugal
4
Postgraduate Program in Materials Science and Engineering (PPCEM), Federal University of Paraíba (UFPB), João Pessoa 58051-900, Brazil
5
Department of Civil Engineering, National Laboratory for Civil Engineering (LNEC), 1700-066 Lisbon, Portugal
*
Authors to whom correspondence should be addressed.
Processes 2026, 14(17), 2723; https://doi.org/10.3390/pr14172723
Submission received: 26 July 2026 / Revised: 22 August 2026 / Accepted: 24 August 2026 / Published: 25 August 2026
(This article belongs to the Section Materials Processes)

Abstract

The growing use of 3D concrete printing has increased the need for cementitious mixtures that combine adequate mechanical performance with lower environmental impacts and production costs. However, these requirements may conflict, making mixture selection a multi-criteria problem. This study assessed nine cementitious mixtures for 3D concrete printing by integrating Life Cycle Assessment (LCA) with the MARS-SC multi-criteria decision-making method. We adopted a cradle-to-gate system boundary and conducted the environmental assessment according to ISO 14040 and ISO 14044 using SimaPro and the Ecoinvent database. We integrated environmental, functional, and economic indicators using the Methodology for the Relative Sustainability Assessment of Building Technologies (MARS-SC) to obtain an overall sustainability score. The mixture containing 40% limestone filler and 10% metakaolin showed the best environmental performance, with a global warming potential of 358 kg CO2 eq/m3. The mixture reduced the GWP by 45.01% and 54.28% compared with two mixtures with higher cement contents and without partial cement replacement. However, this environmental advantage did not result in the highest overall sustainability score because of lower functional and economic performance. When the three dimensions were considered together, Blf30 and Blf40 achieved the highest sustainability scores (NS = 0.66). Although both mixtures had lower mechanical performance than the cement-rich mixtures, their environmental and economic results led to a more favorable overall assessment. The integrated analysis therefore shows that reducing environmental impacts does not, by itself, necessarily produce the most sustainable mix.

1. Introduction

Portland cement plays a significant role in civil construction, given its wide application in different types of projects. Furthermore, its consumption is often adopted as an indicator of a country’s economic activity, as it directly reflects the intensity of operations in the sector [1,2]. In this context, growing demand for infrastructure and urbanization has continued to drive global cement consumption, consolidating it as one of the world’s most widely used materials.
However, this economic prominence brings environmental challenges, since the cement industry produces high carbon dioxide (CO2) emissions during production due to high energy consumption and chemical calcination reactions [2,3,4,5].
In this scenario, new construction technologies have been studied to increase process efficiency and reduce material waste. Among innovative construction techniques, 3D concrete printing (3DCP) has stood out for enabling labor reduction and eliminating formwork compared with conventional methods. Furthermore, this technology allows greater geometric freedom, potential waste reduction, and optimization of the construction process. However, supplying cementitious composites that meet the printing criteria requires a considerably higher volume of cement [6,7,8,9,10].
The properties obtained in the fresh mixtures, including layer deposition and surface finishing, are reflected in the printed material in the hardened state [11]. Higher cement consumption is intrinsically related to the technical and rheological requirements of the extrusion process and to ensuring the stability of the printed layers [12]. Thus, parameters such as extrudability, pumpability, and structural buildability become key factors in developing suitable mixtures for additive manufacturing.
The printed cementitious material must support its own weight and maintain its shape without formwork, while also ensuring strong adhesion between adjacent layers. These structural and rheological requirements increase cement consumption in 3D-printing mixtures [13]. In this context, incorporating supplementary cementitious materials (SCMs) is a promising strategy to reduce Portland cement content while improving the rheological and mechanical properties of the mixtures. Thus, supplementary cementitious materials are used to reduce this consumption and meet the printing criteria [10].
Some studies met these requirements using values between 640.00 and 1014.40 kg/m3 (Table 1), emphasizing the need to develop 3DCP composites with reduced cement content and, consequently, lower environmental impact. This high cement content, often required to meet the rheological and structural demands of 3D printing, highlights a main sustainability challenge for adopting this technology.
In this context, several studies have investigated the composition of mixtures used in additive manufacturing, as shown in Table 1, which presents different ranges of sand-to-cement ratio and cement consumption reported in the literature.
Recent studies have developed new mixtures [22,23,24,25] by incorporating supplementary cementitious materials (SCMs) as a binder fraction in the proportioning of 3DCP composites. This approach, in addition to optimizing the additive manufacturing technique by favoring the rheological properties required for the process, also reduces cement consumption.
Despite technical advances in mixture development, evaluating mechanical and rheological behavior remains essential for performance assessment. However, it also becomes equally important to consider the environmental impacts associated with the mixtures used in 3D printing. In this sense, CO2 emission analyses have been carried out through Life Cycle Assessment (LCA). This methodology allows the quantification of impacts such as energy consumption, resource depletion, emissions, and waste generation [26,27,28].
LCA is regulated by the International Organization for Standardization through ISO 14040 [29], which establishes guidelines for the collection and analysis of data related to the inputs, outputs, and potential environmental impacts of a system or product [30]. This approach allows the systematic evaluation of the environmental performance of materials and processes throughout their entire life cycle, supporting more sustainable decision-making in the construction sector.
In this context, life cycle assessment enables a comprehensive investigation of all stages of the product life cycle, from the extraction and manufacturing of raw materials to subsequent phases, allowing the calculation of environmental impacts and the identification of more sustainable solutions [31].
Given growing concerns regarding climate change and the need to reduce the construction sector’s environmental impact, it is essential to explore mitigation solutions. Beyond environmental assessments, researchers have applied Multi-Criteria Decision-Making (MCDM) methods to cementitious materials. Moro [32] compared Life Cycle Assessment (LCA) and MCDM-based approaches for conventional concrete mixtures, considering mechanical properties, durability, environmental impacts, and costs, while employing various weighting and ranking methods. In the context of 3D concrete printing (3DCP), Alonso-Cañon [33] applied the Weighted Aggregated Sum Product Assessment (WASPAS) and the Technique for Order of Preference by Similarity to Ideal Solution (TOPSIS) methods to select printable mortars based on printability, flexural and compressive strength, cost, and LCA. These studies demonstrate the application of MCDM in mixture selection when different performance requirements are considered simultaneously.
Despite these advances, studies that comprehensively evaluate the sustainability of 3DCP mixtures remain limited [5,27,34]. Furthermore, research is lacking on how varying priorities assigned to environmental, functional, and economic dimensions influence the selection of 3DCP mixtures. Therefore, analyzing how the weights of these dimensions vary makes it possible to determine how different decision criteria can alter the ranking of the mixtures.
In this context, this study evaluates the sustainability of cementitious mixtures for 3D concrete printing, considering environmental, functional, and economic performance. To this end, the study integrates Life Cycle Assessment (LCA) with the MARS-SC multi-criteria method. It uses a sensitivity analysis to examine how variations in the weights assigned to the three dimensions influence mixture selection. This allows assessment of how different environmental, functional, and economic priorities affect mixture ranking and selection.

2. Experimental Program

The experimental program for sustainability analysis is structured in the following stages: goal and scope, inventory analysis, impact assessment, normalization, aggregation, global assessment, sensitivity analysis, and correlation analysis.

2.1. Life Cycle Assessment

To investigate the environmental performance of 3D concrete printing (3DCP) mixtures, we selected nine mixtures from three previous studies by the Construction Innovation and Additive Manufacturing Laboratory (LABIMAC) research group (Table 2), as reported in [22,23,35]. The selection included mixtures that demonstrated printability in the original studies and featured distinct mix proportions and material compositions. When more than one study evaluated equivalent formulations, we included only one to avoid duplication. Therefore, the selected mixtures represent the various printable formulations evaluated in those studies but do not cover the entire design space of cementitious mixtures for 3D concrete printing.
Considering the guidelines of ISO 14040 [29] and ISO 14044 [36] standards, the life cycle assessment comprised the four phases: (1) goal and scope definition; (2) inventory analysis; (3) life cycle impact assessment; and (4) interpretation of results.

2.1.1. Goal and Scope

The study evaluates the environmental impact of nine cementitious mixtures for 3DCP printing, with partial replacements of cement by limestone filler and metakaolin. The functional unit adopted in the analysis is the m3 of mixture. The studies are restricted to the “cradle-to-gate” boundary, considering raw material extraction, transportation to the production site, and mixture production as established in the literature.

2.1.2. Inventory Analysis

In the inventory analysis, emissions from the extraction, supply, and transportation of raw materials were considered, along with the electricity and water consumed in the mixtures.
The mixtures use Portland cement as the main binder, with some incorporating supplementary cementitious materials (such as limestone filler and metakaolin) to reduce cement consumption without compromising the requirements of 3D printing cementitious composites.
Transportation distances were estimated using routes between the suppliers and the IFPB production site. Road freight was considered because we obtained the materials from suppliers located on roads connected to the production site. We adopted a diesel-powered light- to medium-duty truck (3.5–7.5 metric tons) compliant with the EURO 5 emission standard from the Ecoinvent database to represent the transportation of raw materials to the production site. It is commonly used for urban and regional freight transportation. Table 2 presents the inventory of material and energy quantities of the 3DCP mixtures per m3.
The study considers the Federal Institute of Education, Science, and Technology of Paraíba (IFPB) as the manufacturing site. The materials used in the mixtures evaluated in previous studies were obtained from different locations, considering the following average transportation distances: the cement was acquired from a production unit located in Alhandra/PB, approximately 39 km from the point of use; the sand was obtained locally, at about 40 km; and the limestone filler, originating from Campina Grande/PB, at an average distance of 127 km. The metakaolin was supplied by a company located in Ipojuca/PE, approximately 164 km away. We acquired the hydroxypropyl methylcellulose additive (HPMC) from a supplier located in São Paulo/SP, approximately 2768 km away. The superplasticizer (SP) originated from Fortaleza/CE, about 670 km from the production site.
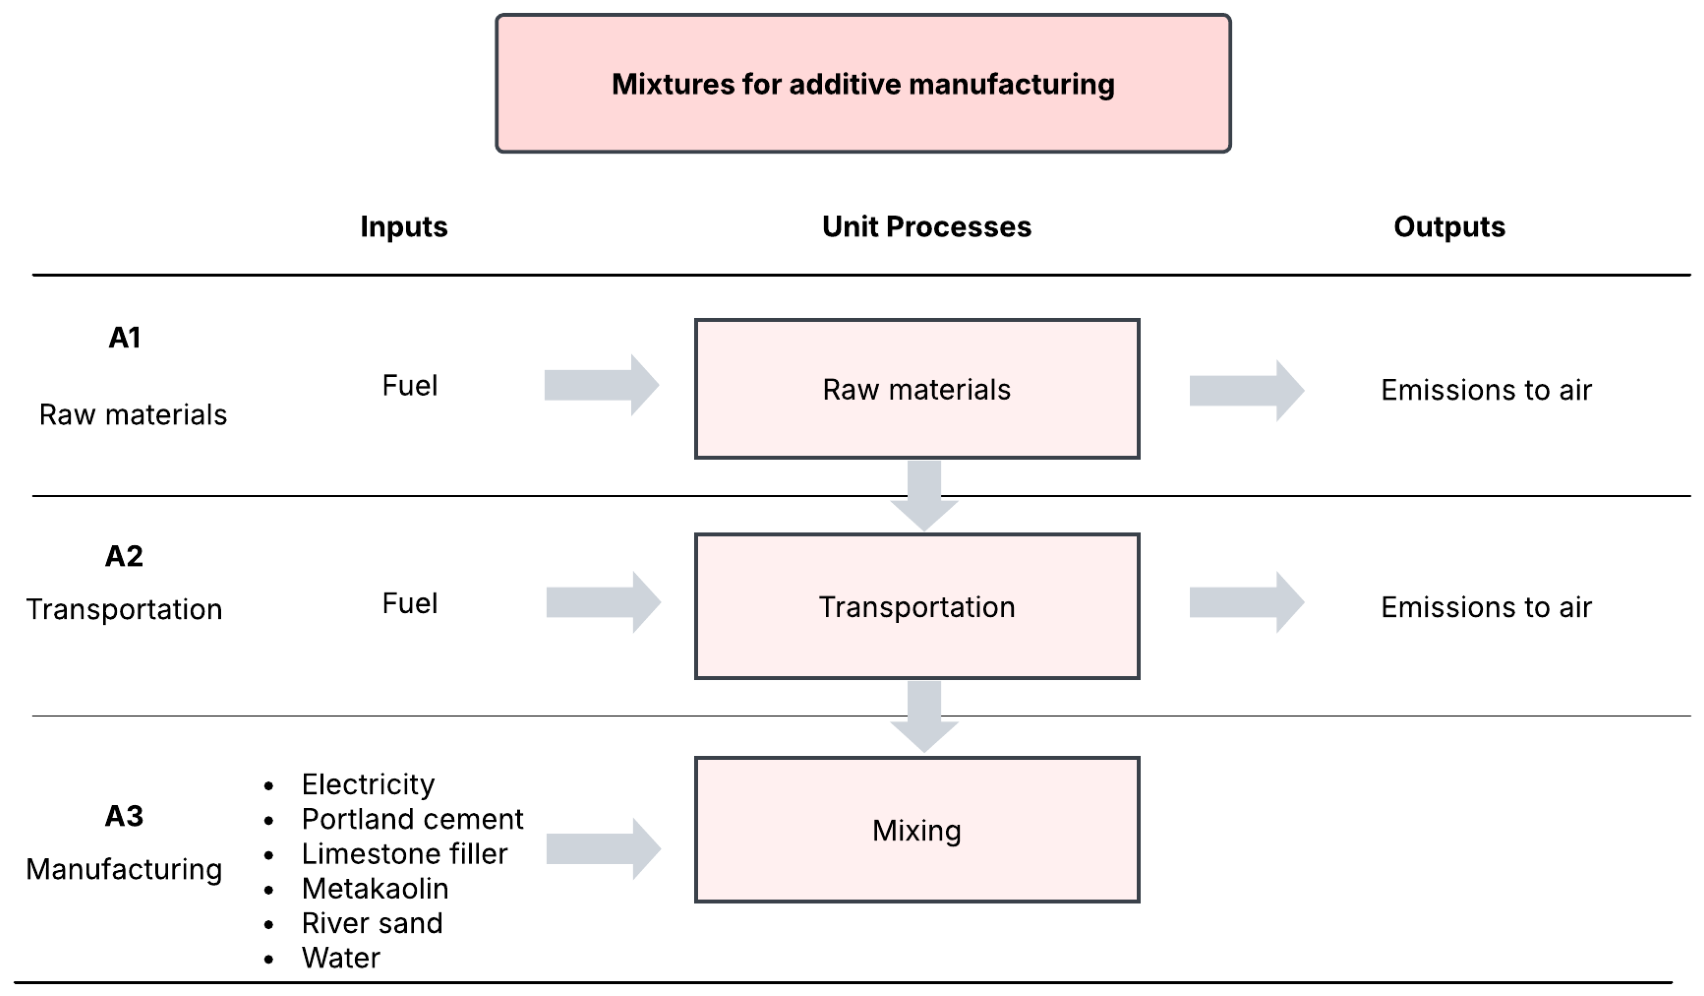
According to the cut-off criteria established by the EN 15804+A2 standard [37], material, energy, and emission flows may be omitted from the inventory provided that they do not exceed 1% of the mass, energy, or environmental impact of each module individually and a maximum of 5% of the total evaluated life cycle. Figure 1 presents the life cycle diagram of mixtures for additive manufacturing, indicating the main stages of raw material extraction.
Module A1 covers the extraction of raw materials and the initial processing of inputs (Portland cement, limestone filler, metakaolin, and river sand). At this stage, fuel is consumed, and greenhouse gas emissions are generated. Module A2 refers to fuel consumption during the transportation of these raw materials to the production unit (IFPB), which also generates emissions. Module A3 covers the manufacturing stage, including mortar mixture preparation, electricity consumption, and inputs, with partial replacement of cement with limestone filler and metakaolin.

2.1.3. Impact Assessment

We categorized the inventory data and converted it into potential environmental impacts. We used SimaPro software (version 10.1.0.3) [38] to model the product inputs. We performed the environmental modeling using the Ecoinvent v3.10 database. When available, we preferentially adopted Brazilian datasets to improve the geographical representativeness of the life cycle inventory. We used Brazilian datasets for Portland cement production, river sand extraction, calcined clay (metakaolin) production, tap water production, electricity supply from the Brazilian northeastern grid, and freight transport by EURO5 trucks. For processes without equivalent Brazilian datasets in Ecoinvent, we adopted Rest-of-World (RoW) datasets, including limestone filler production and polycarbonate production. In addition to the background datasets, we regionalized the foreground inventory by considering actual transportation distances between suppliers and the manufacturing site (IFPB, João Pessoa, Brazil), obtained using Google Maps (version 2026), along with the material consumption of each mixture. This approach improves the assessment’s geographical representativeness while maintaining methodological consistency across all evaluated mixtures.
The environmental impact calculation followed the European standard EN 15804+A2 [37], ensuring methodological conformity for the environmental assessment of construction products. The environmental sustainability analysis aggregated indicators, and the comparative analysis used the multicriteria decision-support methodology, Methodology for the Relative Sustainability Assessment of Building Technologies (MARS-SC) [39].
For the assessment, essential environmental indicators analyzed by the multicriteria decision-support method (MARS-SC) were considered, such as emissions related to global warming (GWP), ozone layer depletion (ODP), acidification of terrestrial and aquatic ecosystems (AP), eutrophication in marine, freshwater, and terrestrial environments (EPM, EPF, EPT), formation of photochemical pollutants (POCP), and consumption of non-renewable fossil resources (ADP_FF).
The selected mixtures had previously demonstrated printability in the original studies [22,23,35]. In these studies, the authors evaluated their printing-related properties.
For the analysis of functional parameters, compressive strength and bond strength were adopted, as they are essential properties for performance analysis of mixtures intended for 3D printing. After verifying that these data were absent in the studies by [22,23,35], experimental reproduction of some mixtures became necessary. The compositions LF40MK10, MK10, and 1:3, which correspond to Nlf40mk10, Mk10, and DCP3 in the present research, were produced following the authors’ guidelines, using the same specified materials.
For each mixture, they determined the compressive strength and interlayer bond strength from three specimens (n = 3). They used the mean values from the original studies and the reproduced mixtures as functional indicators in the multicriteria assessment.
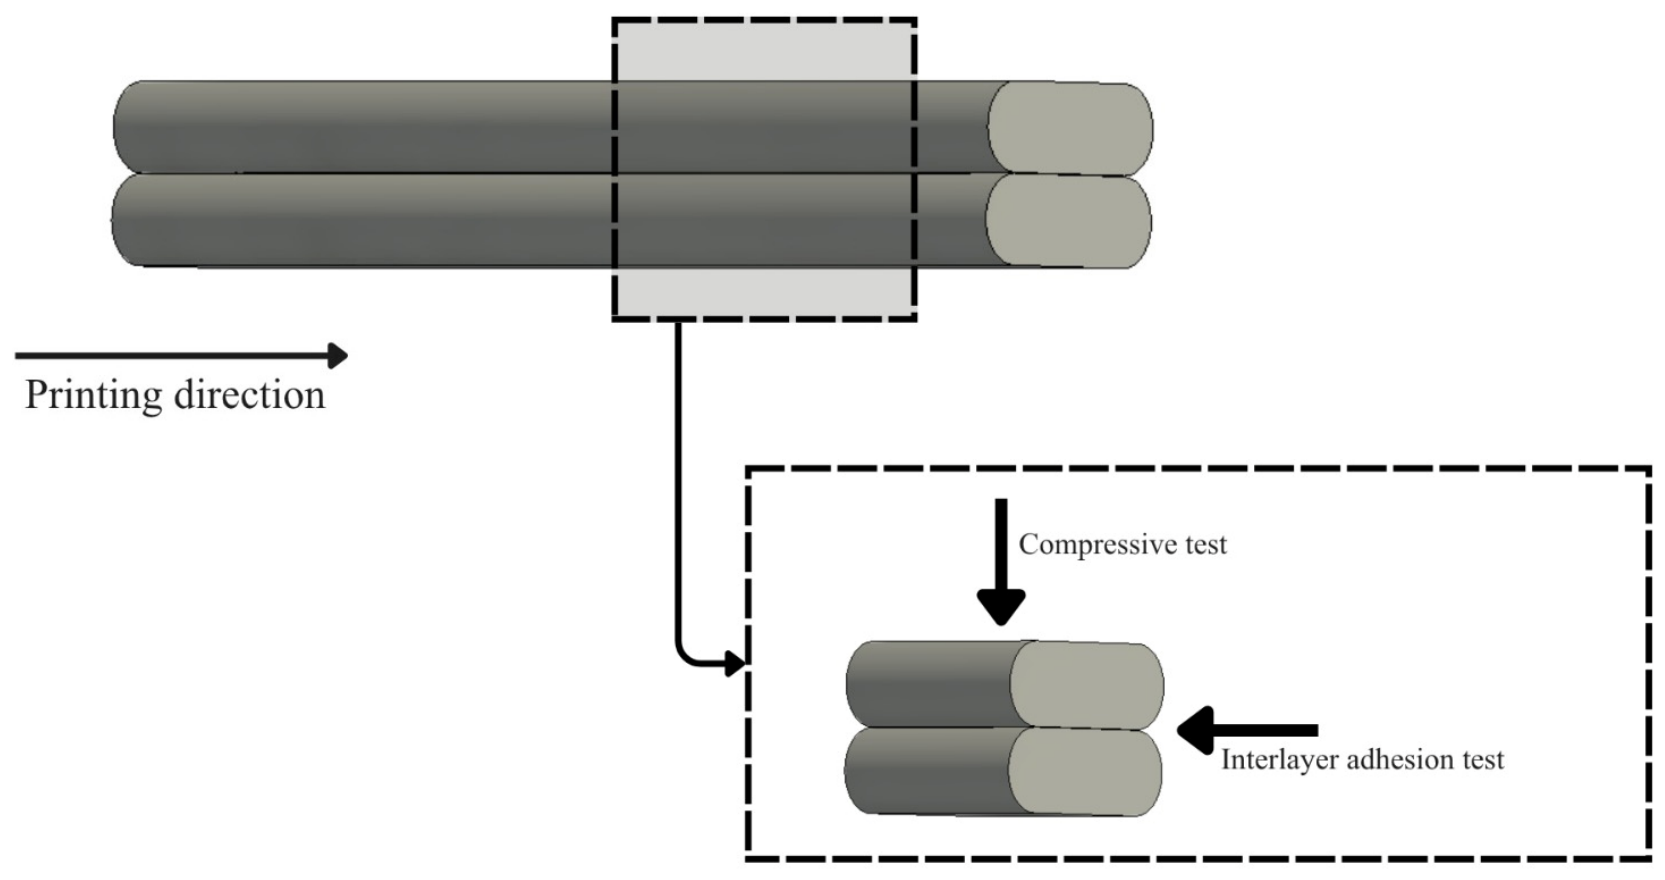
The compressive strength evaluation was carried out according to NBR 13279 (ABNT, 2005) [40]. Given the intrinsic characteristics of the 3DCP mixtures and the standard adopted in the aforementioned studies [22,23,35], the results were considered only in the printing direction (Figure 2).
The interlayer bond strength test also followed the methodology described in studies [22,23,35]. We tested both properties after 28 days of immersion in moist curing.
To evaluate economic performance, we used production cost data per cubic meter (m3) of concrete. We collected price quotations for materials and their respective freight costs directly from suppliers, while obtaining labor-related operational costs through the National System for Research on Construction Costs and Indexes (SINAPI) [41]. Additionally, we estimated the costs of water used in production based on the tariffs charged by the Paraíba Water and Sewage Company, the concessionaire responsible for supply in the municipality of João Pessoa. Electricity consumption was considered and estimated based on the current tariff per kWh charged by Energisa, the utility company responsible for electricity distribution in the region where we conducted the research.
Table 3 presents the quantities of materials and labor required to produce 1 m3 of each evaluated 3DCP mixture. We estimated electrical energy consumption based on the equipment’s rated power and the operating time required to produce 1 m3 of mixture; this does not represent a direct measurement of energy consumption during printing. We did not include printer depreciation and maintenance costs in the economic analysis. Based on a printing flow rate of 0.04 L/s, the estimated operating time was approximately 9 h for printer use and 1.11 h to produce 1 m3 of mixture in a concrete mixer.

2.1.4. Normalization

The objective of normalization is to mitigate distortions arising from different scales and to resolve ambiguity in the performance direction of the metrics, since some indicators are more efficient with higher values. In comparison, others are more efficient with lower values. We normalized the metrics according to Díaz-Balteiro and Romero [42], using Equation (1):
P   ¯ i =   P i P * i P i * P * i  
In this equation, P i represents the parameter value; P i * is the best observed performance; and P * i represents the worst obtained performance.
Normalization, in addition to making the indicators used in the assessment dimensionless, transforms their values into a standardized scale from 0 to 1, where 0 corresponds to the worst performance and 1 to the best performance.

2.1.5. Aggregation

The methodology uses a complete aggregation method for each sustainability dimension (NDj), according to Equation (2):
N D j =   i = 1 n w i   × P i ¯
The NDj indicator corresponds to the weighted average of the normalized indicators that compose the sustainability dimension j, with w i being the weight assigned to the i-ésimos indicators. The sum of the weights is equal to 1. In this study, the standard MARS-SC weights presented in Table 4 were adopted [39]. For the functional dimension, equal weights of 50% were assigned to compressive strength and interlayer bond strength, thereby avoiding the prioritization of either mechanical property in the absence of a specific weighting criterion for 3DCP applications.
This approach allowed us to monitor and compare the overall performance of the different mortar formulations against the reference solution developed in this study, facilitating interpretation of the results and identification of the most sustainable alternative.

2.1.6. Global Assessment

To represent the solution’s overall behavior, the results were combined into a single sustainable performance value using Equation (3):
N S   =   N D A · W A +   N D F · W F +   N D E · W E
where NS—Global sustainability performance score of the solution; W A —Weight of the environmental dimension; N D A —Environmental performance score of the solution; W F —Weight of the functional dimension; N D F —Functional performance score of the solution; W E —Weight of the economic dimension; and N D E —Economic performance score of the solution.
According to MARS-SC, the standard weights assigned to the environmental, functional, and economic dimensions in the overall performance assessment are 40%, 30%, and 30%, respectively. In determining these weights, Mateus and Bragança [43] considered the importance of environmental issues, the balance among sustainability dimensions, and the perspectives of academic experts, construction professionals, and users. In the present study, we adopted this weighting structure as a reference for integrating the environmental, functional, and economic performance of 3DCP mixtures. Because the relative importance of these dimensions can vary depending on the objectives and requirements of a specific application, we evaluated the influence of the weights on mixture selection through a sensitivity analysis.
The results are presented through a “radar” or spider diagram, in which the number of axes in the diagram corresponds to the number of analyzed indicators. Based on the global sustainability performance score, we compared mixtures with partial cement replacements with the reference mixtures, with the mixture that obtained the highest value considered the most sustainable.

2.1.7. Correlation Analysis

We performed Pearson correlation analysis to evaluate the relationships among the environmental impact categories, functional properties, and production cost of the mixtures. The analysis aimed to identify the strength and direction of the linear relationships among the indicators using normalized data. Pearson correlation coefficients (r) range from −1 to +1, where values close to +1 indicate a strong positive correlation, values close to −1 indicate a strong negative correlation, and values close to 0 indicate the absence of a linear relationship. We generated the correlation matrix in RStudio (version 2024.04.2+764). We assessed the statistical significance of the Pearson correlation coefficients using the corresponding p-values, considering p < 0.05 as statistically significant.

2.1.8. Sensitivity Analysis

The final stage of the methodology involved a sensitivity analysis to examine which assumptions most affect the overall assessment result. For this purpose, the Hofstetter Triangle was adopted as a supporting tool. This analysis shows how variations in the weights assigned to each sustainability dimension may affect the final score. In this arrangement, each vertex of the triangle corresponds to one of the three dimensions, while the points distributed within it represent the different possible combinations of these weights.

3. Results and Discussion

This section presents the LCA results for the functional unit of 1 m3 of cementitious mixture for printing. We investigated 8 environmental impact categories. Based on the results reported in this section, we identified the additive manufacturing mixtures that performed best across environmental, functional, and economic aspects.

3.1. Environmental Performance of 3DCP Mixtures

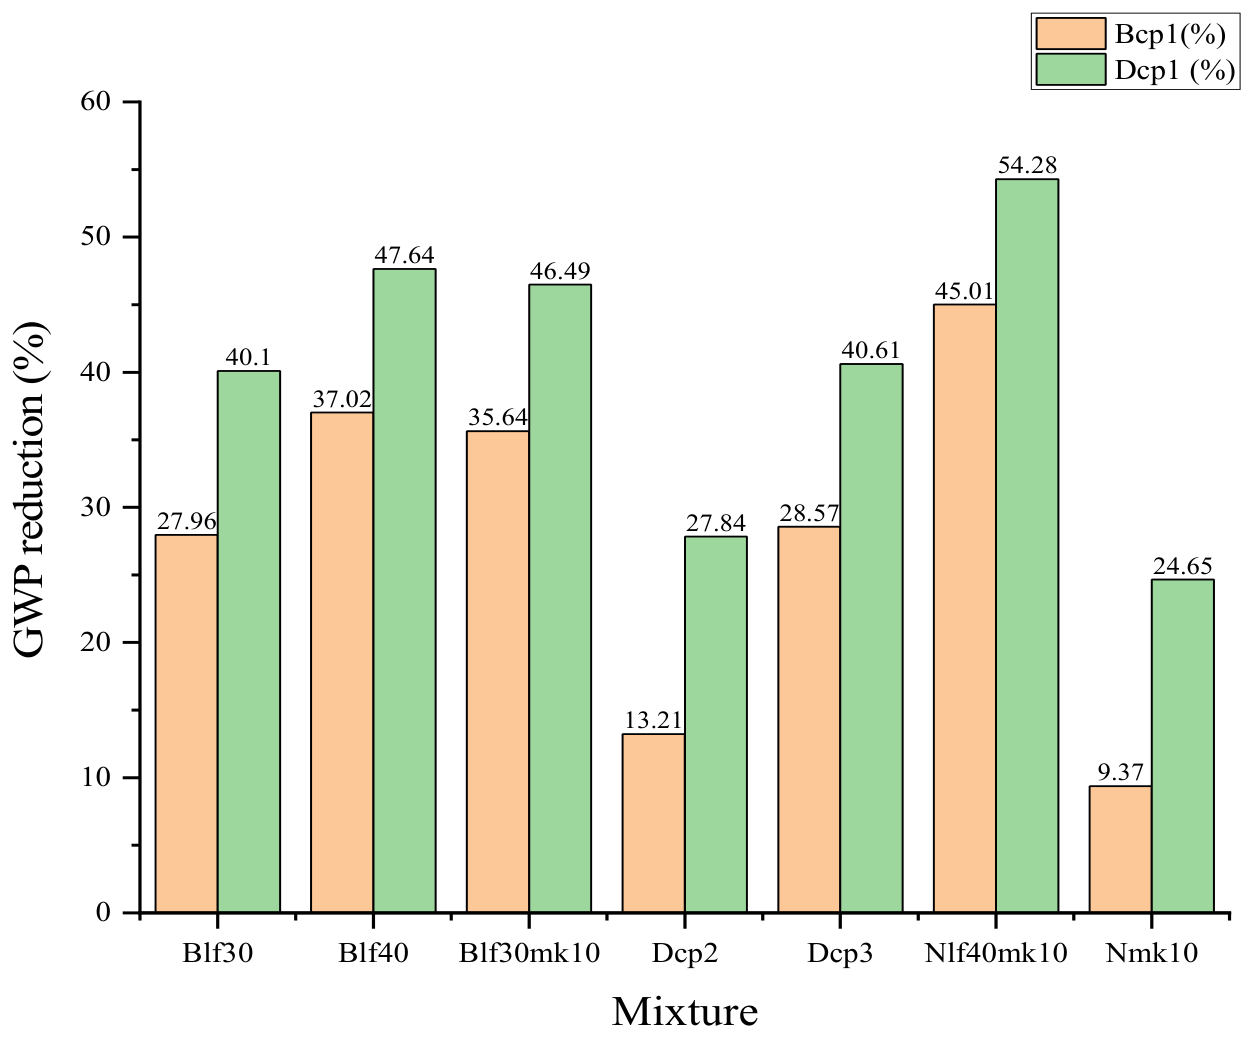
Table 5 presents the environmental impacts associated with producing 1 m3 of each 3DCP mixture, based on the impact categories established in EN 15804 [37]. Dcp1 showed the highest values for most evaluated categories, including a GWP of 783 kg CO2 eq. In contrast, Nlf40mk10 had the lowest GWP (358 kg CO2 eq) and the lowest values for most remaining environmental indicators. As shown in Figure 3, this corresponds to GWP reductions of 45.01% relative to Bcp1 and 54.28% relative to Dcp1. Blf40 also showed substantial reductions, reaching 37.02% and 47.64%, respectively.
Within the Dcp series, the decrease from Dcp1 to Dcp3 was accompanied by reductions of approximately 38–41% in AP, EPM, EPT, POCP, and ADP_FF. A similar response was observed within the Blf series. From Blf30 to Blf40, GWP decreased from 469 to 410 kg CO2 eq, while reductions of approximately 11–12% were observed for AP, EPM, EPT, and POCP, and 9.5% for ADP_FF. Therefore, changes within both formulation groups affected several impact categories simultaneously, although the magnitude of the reductions differed among the indicators.
Comparing mixtures from different formulation groups provides additional information. Blf30 and Dcp3, for example, presented similar environmental profiles, with GWP values of 469 and 465 kg CO2 eq, respectively, and small differences in AP, EPM, EPT, POCP, and ADP_FF. Although it did not contain limestone filler or metakaolin, Dcp3 reduced GWP by 28.57% relative to Bcp1 and 40.61% relative to Dcp1 (Figure 3). In this case, the lower GWP cannot be attributed to cement replacement by these materials, indicating that mixture proportioning, particularly cement consumption per cubic meter, also affected the carbon footprint.
We observed a different response for Blf40 and Blf30mk10. Although their GWP values were similar (410 and 419 kg CO2 eq, respectively), Blf30mk10 presented slightly lower values for AP, EPM, EPT, and POCP. In contrast, its ODP was approximately one order of magnitude higher than that of Blf40 (3.57 × 10⁻⁵ and 3.36 × 10⁻⁶ kg CFC-11 eq, respectively), while ADP_FF increased from 2200 to 2360 MJ eq. Thus, similar carbon footprints did not correspond to similar environmental profiles across all impact categories.
Nlf40mk10 presented the lowest values in seven of the eight environmental impact categories. The only exception was EPF, where Dcp3 showed a slightly lower value (9.69 × 10⁻³ versus 9.91 × 10⁻³ kg P eq), a difference of only 2.3%. Freshwater eutrophication is primarily characterized by phosphorus-related emissions [37], which may account for its different response to changes in mixture composition compared with the other environmental indicators.
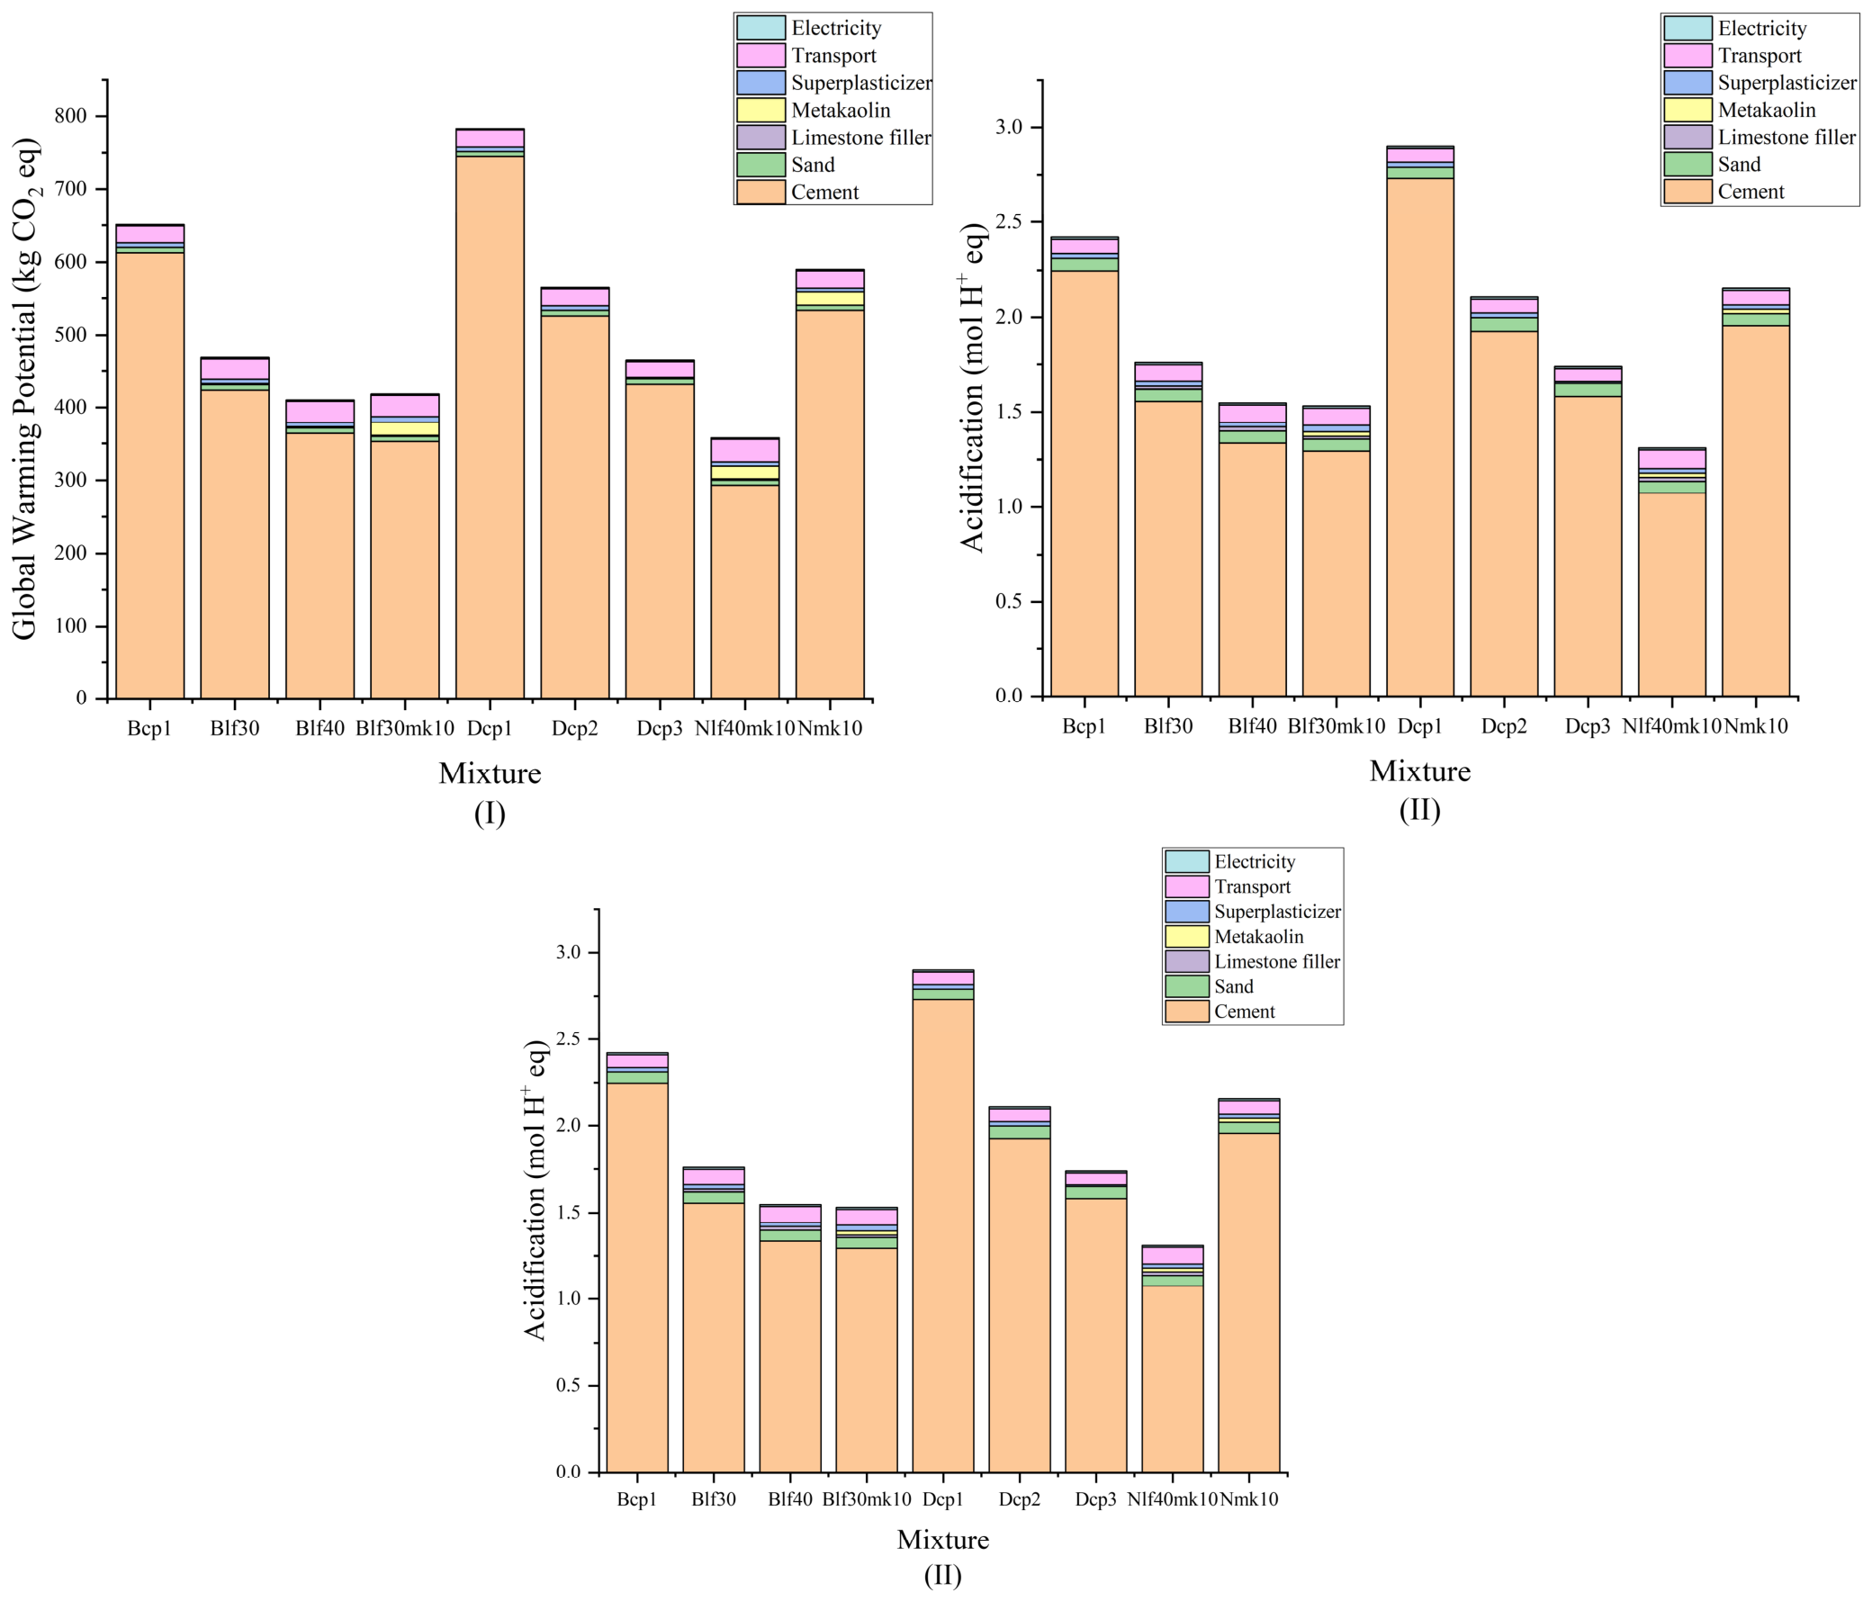
Figure 4 presents the contribution of inventory components to GWP, AP, and ADP_FF. Cement was the main contributor to GWP and AP for all mixtures, while transportation, superplasticizer, metakaolin, electricity, and water accounted for smaller shares. As cement consumption decreased, however, the relative contribution of the other inventory components became more apparent.
ADP_FF showed a more distributed contribution profile than GWP and AP. Transportation accounted for a larger share of ADP_FF, reflecting the fossil fuel consumption associated with raw-material transportation [44]. Metakaolin also contributed more in this category, particularly for Blf30mk10 and Nlf40mk10. Despite this contribution, Nlf40mk10 presented the lowest total ADP_FF among the evaluated mixtures (2080 MJ eq). The greater relative contribution of transportation and metakaolin may also explain why ADP_FF reductions did not occur to the same extent as those observed for GWP. For example, from Blf30 to Blf40, GWP decreased by 12.6%, whereas ADP_FF decreased by 9.5%.
The environmental results presented compare the evaluated mixtures and do not address aspects associated with 3DCP application at the element or construction system scale, such as formwork, waste generation during execution, and integrated optimization, which fall outside the scope of this study.
Consequently, the ranking obtained in the present study is specific to the “cradle-to-gate” boundary. It may change when the construction, use, maintenance, durability, and end-of-life stages are included, as these phases can affect the relative environmental performance of the mixtures [28].

3.2. Functional and Economic Performance

Table 6 presents the functional and economic parameters of the mixtures. Dcp1 achieved the highest compressive strength (72.17 MPa), 28% higher than Bcp1 (56.26 MPa), whereas Bcp1 presented the highest interlayer bond strength (5.73 MPa). Thus, the mixture with the highest compressive strength did not exhibit the highest interlayer bond strength, and the two functional parameters did not follow the same ranking among the mixtures.
In applications where interlayer bond strength is a critical performance requirement, assigning greater weight to this indicator may favor mixtures with superior bonding performance, such as Bcp1, and potentially alter their relative ranking in the multi-criteria evaluation.
Within the Blf series, increasing the limestone filler content from Blf30 to Blf40 reduced the compressive strength from 21.93 to 16.19 MPa and the interlayer bond strength from 4.14 to 3.37 MPa. Despite this reduction, the mixtures maintained the requirements for pumping, extrusion, and buildability, as reported by [22]. Therefore, the reduction in the mechanical properties did not compromise the applicability of these compositions in the 3D printing process, while the production cost decreased only from R$ 1625.92 to R$ 1601.79. The 1.5% cost reduction was therefore small compared with the reductions in compressive strength (26.2%) and interlayer bond strength (18.6%).
Although Blf30 and Blf40 presented lower compressive strengths than the reference mixtures, the suitability of these values depends on the intended application and the structural demands of the printed element. 3DCP can be applied to both load-bearing and non-load-bearing components, and compressive strength alone is insufficient to determine a mixture’s structural suitability for a specific application. Current standardization efforts, such as ISO/ASTM 52939 [45], address qualification and quality assurance for additive construction but do not define a universal minimum compressive strength for 3DCP mixtures. Therefore, assess the applicability of Blf30 and Blf40 based on the performance requirements and design conditions of the intended use.
The comparison between Blf30 and Blf30mk10 also shows that similar mechanical performance can be associated with substantially different costs. Their compressive strengths were nearly identical (21.93 and 21.19 MPa), as were their interlayer bond strengths (4.14 and 4.08 MPa), while the production cost increased by approximately 33%. We can make a similar comparison between Nmk10 and Dcp3. Despite their nearly identical compressive strengths (25.51 and 25.02 MPa, respectively), Nmk10 presented an interlayer bond strength approximately 50% higher than Dcp3. However, this improvement came with a 40.9% higher production cost.
Within the Dcp series, Dcp2 occupied an intermediate position, with a compressive strength of 47.27 MPa, an interlayer bond strength of 4.32 MPa, and a production cost of R$ 1695.37. Dcp3 had the lowest production cost among all mixtures, whereas Dcp1 provided the highest compressive strength. The progressive reduction in cost from Dcp1 to Dcp3 was therefore accompanied by losses in both functional parameters, although at different magnitudes. These comparisons show that no single mixture simultaneously maximized mechanical performance and minimized production cost. Moreover, as discussed in Section 3.1, the mixtures with the lowest environmental impacts were not necessarily those with the highest functional performance or the lowest cost.

3.3. Correlation Among Environmental, Functional, and Economic Parameters

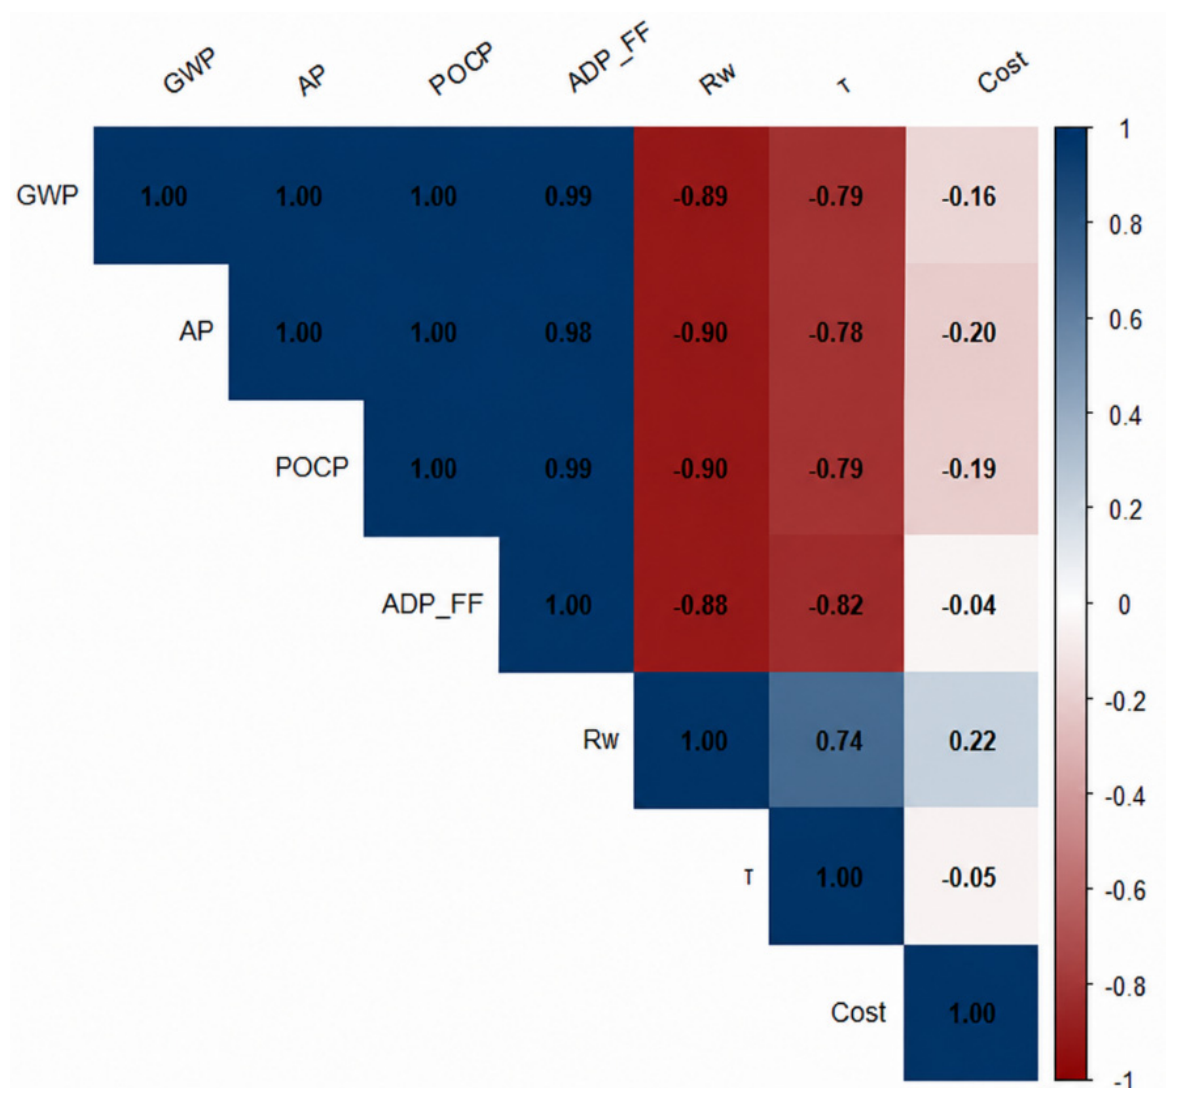
Figure 5 presents the Pearson correlation matrix for the environmental indicators included in the analysis (GWP, AP, POCP, and ADP_FF), together with the functional parameters and production cost. Strong positive correlations were observed among the four environmental indicators (r = 0.98–1.00), showing that their values varied similarly across the evaluated mixtures. This result agrees with the trends observed in Section 3.1, although differences in the relative contribution of the inventory components were identified, particularly for ADP_FF.
Regarding statistical significance, the correlations between the environmental indicators and compressive strength were significant (p = 0.0010–0.0016), as were those between the environmental indicators and interlayer bond strength (p = 0.0067–0.0129). The correlation between compressive strength and interlayer bond strength was also significant (p = 0.0230). In contrast, the correlations involving production cost were not statistically significant (p > 0.05).
Negative correlations were observed between the environmental indicators and compressive strength (r = −0.88 to −0.90) and interlayer bond strength (r = −0.78 to −0.82).
These correlations can be explained by reduced cement consumption and increased use of limestone filler in mixtures with lower environmental impacts. This effect is particularly evident when comparing Bcp1 and Blf40, as the incorporation of 40% limestone filler reduced OPC consumption from 706.6 to 419.81 kg/m3, while compressive strength decreased from 56.26 to 16.19 MPa. Similar trends were observed in the other mixtures with reduced cement content. A reduction in the proportion of reactive cementitious material available for strength development therefore accompanied the environmental benefit associated with lower cement consumption.
On the other hand, the slightly weaker correlations with interlayer bond strength may reflect the additional influence of the interface formed during printing. Interlayer adhesion is affected by mechanisms such as insufficient surface moisture, air entrapment, adverse thixotropy, and low surface roughness, with surface moisture being reported as a dominant factor [46,47]. Despite these additional interfacial effects, compressive strength and interlayer bond strength were positively correlated (r = 0.74), although the differences reported in Table 6 show that the two properties did not vary proportionally across all mixtures.
Production cost showed weak correlations with the environmental indicators (r = −0.04 to −0.20) and with the functional parameters (r = −0.05 to 0.22). This weak association is consistent with the comparisons in Section 3.2, particularly for mixtures containing metakaolin, for which similar mechanical performance was associated with substantially different production costs. The correlation analysis therefore suggests that the environmental, functional, and economic parameters followed different relationships across the evaluated mixtures, supporting their joint consideration in the subsequent assessment.

3.4. Integrated Sustainability Assessment

Table 7 and Table 8 present the normalized environmental, functional, and economic results, which were then aggregated into the environmental ( N D A ), functional ( N D F ), and economic ( N D E ) indices. Table 9 presents the resulting indices and the overall sustainability score (NS). Normalization changed the relative position of the mixtures by dimension, reflecting the differences previously observed among the environmental, mechanical, and economic results.
For the environmental dimension, Nlf40mk10 achieved the highest index ( N D A  = 1.00), followed by Blf40 (0.88) and Blf30mk10 (0.85). The ranking was substantially different for functional performance. Bcp1 and Dcp1 reached the highest (0.86), whereas Blf40 presented the lowest value (0.07). For the economic dimension, Dcp3 achieved the highest index ( N D E  = 1.00), closely followed by Blf40 (0.97), while the mixtures containing metakaolin presented considerably lower values. These rankings show that no mixture ranked most favorably across all three dimensions.
This difference becomes clearer when considering the overall sustainability score. The Blf30 and Blf40 blends achieved the highest NS (0.66), even though neither had the highest functional index. Their final ranking resulted from a more balanced combination of the three dimensions. In contrast, Nlf40mk10, which achieved the highest environmental index, reached an NS of 0.50 because of its lower functional ( N D F = 0.15) and economic ( N D E = 0.17) indices. Dcp1 showed the opposite behavior: its high functional index (0.86) was accompanied by lower environmental and economic indices, resulting in an NS of 0.48.
The comparison between Bcp1 and Blf40 is also relevant. Both mixtures reached similar overall scores (NS = 0.63 and 0.66, respectively), but through markedly different combinations of the three dimensions. Bcp1 combined a high functional index ( N D F   = 0.86) with lower environmental and economic performance, whereas Blf40 combined a low functional index ( N D F = 0.07) with high environmental ( N D A = 0.88) and economic ( N D E = 0.97) indices. Similar overall scores can therefore represent substantially different performance profiles, which should be considered when interpreting the final ranking.

3.5. Sensitivity Analysis

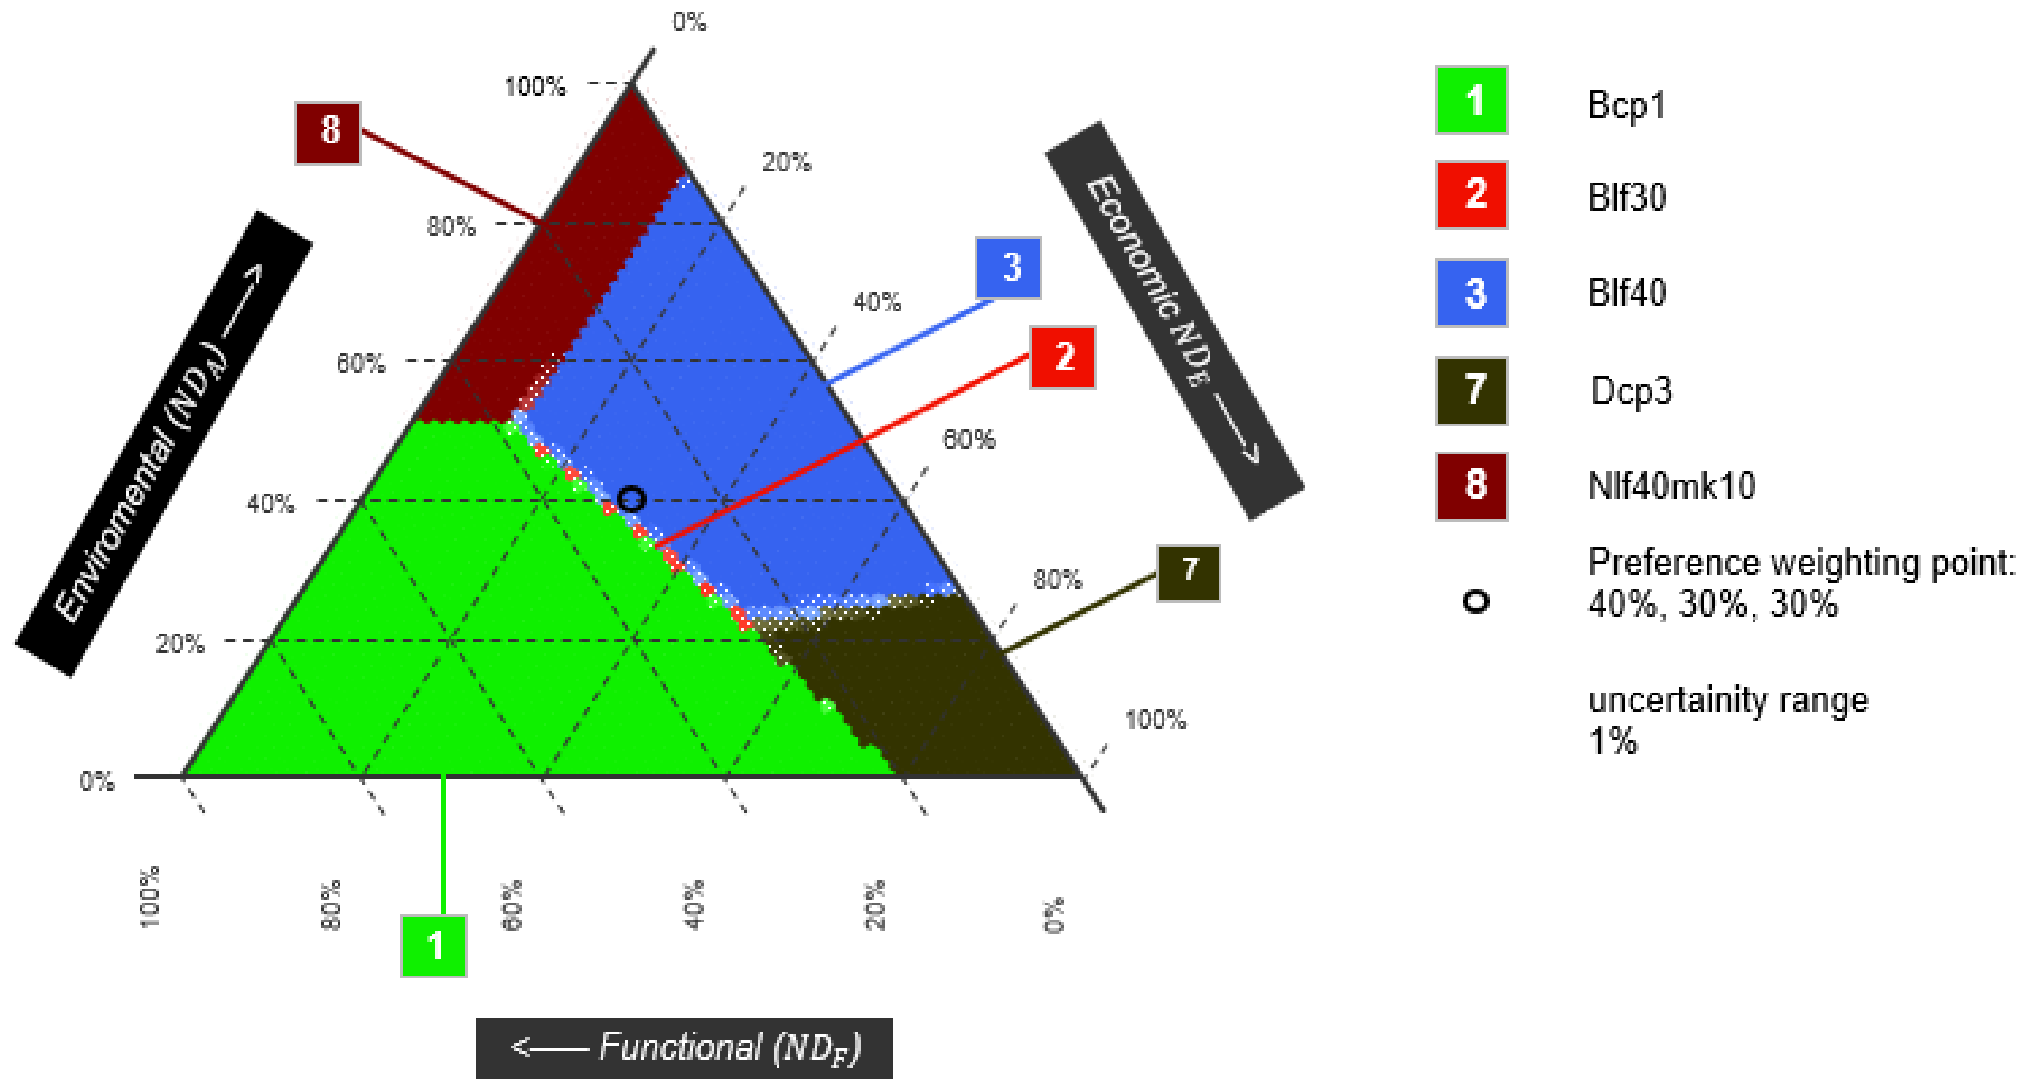
We performed a sensitivity analysis to examine how changes in the weights assigned to the environmental, functional, and economic dimensions affect the selection of the preferred mixture. Figure 6 presents the preference regions obtained for different combinations of these weights. For the weighting adopted in this study (40% environmental, 30% functional, and 30% economic), the preference point was located within the Blf40 region.
The distribution of the preference regions shows distinct profiles among the mixtures. Bcp1 was favored when greater weight was assigned to functional performance, whereas Dcp3 became preferable under higher economic weighting. Nlf40mk10 was selected under combinations that placed greater emphasis on environmental performance. These regions agree with the individual indices reported in Section 3.4: Bcp1 had a high functional index ( N D F = 0.86), Dcp3 had the highest economic index ( N D E = 1.00), and Nlf40mk10 had the highest environmental index ( N D A = 1.00). Their selection was therefore associated with weighting scenarios that favored the dimension in which each mixture performed best.
In contrast, despite its low functional index ( N D F = 0.07), the Blf40 mixture’s high environmental ( N D A = 0.88) and economic ( N D E = 0.97) indices allowed it to remain the preferred option across various weighting combinations that did not prioritize functional performance. Blf30 exhibited the same behavior. The transition between these two mixtures illustrates the trade-off between the functional losses associated with higher calcined material content and the environmental and economic gains projected in Section 3.1 and Section 3.2.
The sensitivity analysis therefore adds an important qualification to the overall sustainability scores. Similar or high aggregate scores do not imply that the alternatives respond equally to changes in decision priorities. Bcp1, Dcp3, and Nlf40mk10 become competitive mainly when the weighting shifts toward their strongest dimension, whereas Blf30 and Blf40 occupy the transition between these performance profiles. This distinction matters when a 3DCP mixture must accommodate different performance requirements rather than a fixed set of criterion weights.
From a practical perspective, the Nlf40mk10 may be prioritized when reducing environmental impact is the primary decision criterion, provided its functional performance meets the intended application’s requirements and its cost is acceptable. On the other hand, when environmental, functional, and economic performance must be considered simultaneously, mixtures with more balanced performance, such as Blf30 and Blf40, may be preferable. Therefore, the selection should reflect the performance requirements and priorities of each application.

4. Conclusions

This study assessed 3DCP mixtures by integrating environmental, functional, and economic parameters using the MARS-SC approach. The main conclusions are as follows.
The largest environmental gains were not restricted to mixtures containing supplementary cementitious materials. Nlf40mk10 achieved the lowest GWP (358 kg CO2 eq) and the lowest impacts in seven of the eight categories, with GWP reductions of 45.01% and 54.28% relative to Bcp1 and Dcp1, respectively. Dcp3 also achieved lower environmental impacts without incorporating limestone filler or metakaolin, showing that differences in mixture proportioning can also help reduce environmental impacts.
Reducing cement content changed environmental, functional, and economic performance. In the Blf series, the production cost decreased by 1.5% from Blf30 to Blf40. However, compressive strength and interlayer bond strength decreased by 26.2% and 18.6%, respectively. Furthermore, incorporating metakaolin increased production costs without proportional benefits in the evaluated functional parameters.
The multicriteria assessment showed that the mixture with the best environmental performance was not necessarily the one with the highest overall sustainability score. Blf30 and Blf40 achieved the highest overall scores when we considered the three dimensions. The sensitivity analysis further showed that mixture selection changed with the relative importance assigned to each dimension: Bcp1 was favored with greater functional weighting, Dcp3 with greater economic weighting, and Nlf40mk10 with greater environmental weighting.
From an engineering perspective, the results show that selecting mixtures for 3DCP requires considering environmental impacts, mechanical performance, and production costs simultaneously. Reducing cement content or incorporating supplementary cementitious materials can lower environmental impacts but may also affect mechanical performance and production costs. Therefore, an integrated assessment provides a basis for selecting mixtures according to performance requirements and the priorities being considered.
The approach adopted aligns with comparing cementitious mixtures for 3D concrete printing (3DCP). However, the scope limits the results to evaluating the mixtures themselves. Consequently, the study did not consider element- or construction-system-scale aspects such as formwork elimination, waste generation during execution, and geometric optimization. Economic results also depend on the cost components and energy consumption estimates adopted in the study. Using Rest-of-World (RoW) datasets for processes without Brazilian equivalents in Ecoinvent also introduces uncertainty related to geographical representativeness. This should be taken into account when interpreting the environmental results. Future studies could consider equipment depreciation and maintenance costs, energy consumption measurements during printing and at other life-cycle stages, and evaluations at the element or construction-system scale.


Author Contributions

M.d.L.X.d.F.N.A.: Writing—review and editing, investigation, formal analysis, visualization, validation, data curation, and conceptualization. M.A.S.d.A.: Writing—review and editing, visualization, validation, supervision, formal analysis, data curation, and conceptualization. R.F.M.d.S.M.: Writing—review and editing, visualization, validation, supervision, formal analysis, data curation, and conceptualization. C.M.M.: Writing—review and editing, visualization, validation, data curation, and conceptualization. M.d.S.B.: Writing—review and editing, visualization, validation, data curation, and conceptualization. T.D.d.M.M.S.: Writing—review and editing, visualization, validation, data curation, and conceptualization. J.A.d.S.N.: Writing—review and editing, investigation, validation, and data curation. C.M.P.: Writing—review and editing, validation, and conceptualization. All authors have read and agreed to the published version of the manuscript.

Funding

This research received no external funding.

Data Availability Statement

The original contributions of this study are contained within the article, and any additional inquiries may be addressed to the corresponding author.

Acknowledgments

The authors express their gratitude to the Coordination for the Improvement of Higher Education Personnel (CAPES: 88887.957798/2024-00). We also thank the Federal University of Paraíba (UFPB) and the Federal Institute of Paraíba (IFPB) for providing the infrastructure essential to executing this project, as well as the Department of Civil Engineering at the University of Minho for access to the software used in the research.

Conflicts of Interest

The authors declare no conflict of interest.

References

  1. Moreira, C.; Rego, J.H.D.S. Efeito do teor de gipsita na resistência à compressão do cimento LC3. Matéria 2020, 25, e-12575. [Google Scholar] [CrossRef] [Scilit]
  2. Uwasu, M.; Hara, K.; Yabar, H. World cement production and environmental implications. Environ. Dev. 2014, 10, 36–47. [Google Scholar] [CrossRef] [Scilit]
  3. Farinha, C.B.; Pederneiras, C.M.; Bastos, D.; Gomes, R.I.; Veiga, R.; Silva, A.S.; Martins, I. CDW as sources of CO2 absorption. In Proceedings of the V International Conference Progress of Recycling in the Built Environment, Weimar, Germany, 10–12 October 2023. [Google Scholar]
  4. Poudyal, L.; Adhikari, K. Environmental sustainability in cement industry: An integrated approach for green and economical cement production. Resour. Environ. Sustain. 2021, 4, 100024. [Google Scholar] [CrossRef] [Scilit]
  5. Tinoco, M.P.; Mendonça, É.M.; Fernandez, L.I.C.; Caldas, L.R.; Reales, O.A.M.; Toledo Filho, R.D. Life cycle assessment (LCA) and environmental sustainability of cementitious materials for 3D concrete printing: A systematic literature review. J. Build. Eng. 2022, 52, 104456. [Google Scholar] [CrossRef] [Scilit]
  6. Zhao, Y.; Cui, K.; He, J.; Zheng, Y.; Shen, P.; Poon, C.S.; Peng, G.; Guo, R.; Xia, D. An innovative strategy for maximizing CO2 reduction in concrete through preparing carbon sequestration precursors by accelerated carbonation. Cem. Concr. Compos. 2024, 152, 105618. [Google Scholar] [CrossRef] [Scilit]
  7. Jin, W.; Caron, J.F.; Ouellet-Plamondon, C.M. Minimizing the carbon footprint of 3D printing concrete: Leveraging parametric LCA and neural networks through multiobjective optimization. Cem. Concr. Compos. 2025, 157, 105853. [Google Scholar] [CrossRef] [Scilit]
  8. Gamage, K.; Fawzia, S.; Zahra, T.; Teixeira, M.B.F.; Ramli Sulong, N.H. Advancement in sustainable 3D concrete printing: A review on materials, challenges, and current progress in Australia. Buildings 2024, 14, 494. [Google Scholar] [CrossRef] [Scilit]
  9. Rollakanti, C.R.; Prasad, C.V.S.R. Applications, performance, challenges and current progress of 3D concrete printing technologies as the future of sustainable construction—A state of the art review. Mater. Today Proc. 2022, 65, 995–1000. [Google Scholar] [CrossRef] [Scilit]
  10. Salifu, N.; Bassuoni, M.T.; Guven, G. Performance evaluation of limestone-blended cement and cellulose nanomaterials in 3D concrete printing. Case Stud. Constr. Mater. 2025, 22, e04758. [Google Scholar] [CrossRef] [Scilit]
  11. Mawas, K.; Maboudi, M.; Gerke, M. A review on geometry and surface inspection in 3D concrete printing. Cem. Concr. Res. 2026, 199, 108030. [Google Scholar] [CrossRef] [Scilit]
  12. Roussel, N. Rheological requirements for printable concretes. Cem. Concr. Res. 2018, 112, 76–85. [Google Scholar] [CrossRef] [Scilit]
  13. Rahman, M.; Rawat, S.; Yang, R.C.; Mahil, A.; Zhang, Y.X. A comprehensive review on fresh and rheological properties of 3D printable cementitious composites. J. Build. Eng. 2024, 91, 109719. [Google Scholar] [CrossRef] [Scilit]
  14. Ye, J.; Cui, C.; Yu, J.; Yu, K.; Xiao, J. Fresh and anisotropic-mechanical properties of 3D printable ultra-high ductile concrete with crumb rubber. Compos. Part B Eng. 2021, 211, 108639. [Google Scholar] [CrossRef] [Scilit]
  15. Zhu, B.; Wang, Y.; Sun, J.; Wei, Y.; Ye, H.; Zhao, H.; Wang, X. An experimental study on the influence of waste rubber particles on the compressive, flexural and impact properties of 3D printable sustainable cementitious composites. Case Stud. Constr. Mater. 2023, 19, e02607. [Google Scholar] [CrossRef] [Scilit]
  16. Bodur, B.; Mecit Işık, M.; Benli, A.; Bayrak, B.; Öz, A.; Bayraktar, O.; Kaplan, G.; Aydın, A. Durability of green rubberized 3D printed lightweight cement composites reinforced with micro attapulgite and micro steel fibers: Printability and environmental perspective. J. Build. Eng. 2024, 90, 109447. [Google Scholar] [CrossRef] [Scilit]
  17. Yang, Y.; Zhang, C.; Liu, Z.; Dong, L.; Yang, T.; Zhao, Q.; Wu, C. Effect of hydration process on the interlayer bond tensile mechanical properties of ultra-high performance concrete for 3D printing. Constr. Build. Mater. 2024, 451, 138902. [Google Scholar] [CrossRef] [Scilit]
  18. Zandifaez, P.; Shen, Z.; Sorgenfrei, R.; Li, Y.; Dias-da-Costa, D.; Zhou, H. Pathways to formulate lightweight and ultra-lightweight 3D printable cementitious composites. Constr. Build. Mater. 2024, 424, 135874. [Google Scholar] [CrossRef] [Scilit]
  19. Ingle, V.V.; Prem, P.R. Acoustic emission examination of 3D printed ultra-high performance concrete with and without coarse aggregate under fresh and hardened states. J. Build. Eng. 2025, 111, 113491. [Google Scholar] [CrossRef] [Scilit]
  20. Li, F.; Xiao, S.; Yang, B.; Li, K.; Zhou, Y.; Li, X.; Liu, G. Mechanical properties and anisotropy of 3D-printed concrete modified with multiscale materials based on optimized printing process design. J. Build. Eng. 2025, 113, 113965. [Google Scholar] [CrossRef] [Scilit]
  21. Tang, B.; Yan, J.; Han, X.; Lin, Y.; Fan, F. Mechanical properties of extrusion-based 3D-printed concrete considering the thickness of the printed layer and printing time interval. Structures 2025, 78, 109225. [Google Scholar] [CrossRef] [Scilit]
  22. Barbosa, M.S.; Anjos, M.A.S.; Cabral, K.C.; Dias, L.S. Development of composites for 3D printing with reduced cement consumption. Constr. Build. Mater. 2022, 341, 127775. [Google Scholar] [CrossRef] [Scilit]
  23. Nunes, G.M.; Anjos, M.A.S.; Lins, A.B.S.M.; Negreiros, A.M.S.; Pessoa, L.R. Evaluation of the mechanical behaviour of representative volumetric elements of 3DCP masonry mixtures with partial replacement of cement by limestone filler and metakaolin. J. Build. Eng. 2023, 78, 107650. [Google Scholar] [CrossRef] [Scilit]
  24. Al-Noaimat, Y.A.; Ghaffar, S.H.; Chougan, M.; Al-Kheetan, M.J. A review of 3D printing low-carbon concrete with one-part geopolymer: Engineering, environmental and economic feasibility. Case Stud. Constr. Mater. 2023, 18, e01818. [Google Scholar] [CrossRef] [Scilit]
  25. Colyn, M.; van Zijl, G.; Babafemi, A.J. Fresh and strength properties of 3D printable concrete mixtures utilising a high volume of sustainable alternative binders. Constr. Build. Mater. 2024, 419, 135474. [Google Scholar] [CrossRef] [Scilit]
  26. Fernandez, L.I.C.; Caldas, L.R.; Mendoza Reales, O.A. Environmental evaluation of 3D printed concrete walls considering the life cycle perspective in the context of social housing. J. Build. Eng. 2023, 74, 106915. [Google Scholar] [CrossRef] [Scilit]
  27. Ramesh, A.; Navaratnam, S.; Rajeev, P.; Sanjayan, J. Thermal performance and life cycle analysis of 3D printed concrete wall building. Energy Build. 2024, 320, 114604. [Google Scholar] [CrossRef] [Scilit]
  28. Olsson, J.A.; Miller, S.A.; Kneifel, J.D. A review of current practice for life cycle assessment of cement and concrete. Resour. Conserv. Recycl. 2024, 206, 107619. [Google Scholar] [CrossRef] [Scilit]
  29. ISO 14040:2006; Environmental Management—Life Cycle Assessment—Principles and Framework. ISO: Geneva, Switzerland, 2006.
  30. Willers, C.D.; Rodrigues, L.B.; Silva, C.A. Life cycle assessment in Brazil: A research in the major national bases scientific. Production 2013, 23, 436–447. [Google Scholar] [CrossRef] [Scilit]
  31. Khan, M.; Ahmed, A.; Ali, T.; Qureshi, M.; Islam, S.; Ahmed, H.; Ajwad, A.; Khan, M. Comprehensive review of 3D printed concrete, life cycle assessment, AI and ML models: Materials, engineered properties and techniques for additive manufacturing. Sustain. Mater. Technol. 2025, 43, e01164. [Google Scholar] [CrossRef] [Scilit]
  32. Moro, C. Comparative analysis of multi-criteria decision making and life cycle assessment methods for sustainable evaluation of concrete mixtures. Sustainability 2023, 15, 12746. [Google Scholar] [CrossRef] [Scilit]
  33. Alonso-Cañon, S.; Blanco-Fernandez, E.; Cuesta-Astorga, E.; Indacoechea-Vega, I.; Salas-Alvarez, J. Selection of the best 3D printing high-performance mortars using multi-criteria analysis. Buildings 2025, 15, 3307. [Google Scholar] [CrossRef] [Scilit]
  34. Abu-Ennab, L.; Dixit, M.K.; Birgisson, B.; Pradeep Kumar, P. Comparative life cycle assessment of large-scale 3D printing utilizing kaolinite-based calcium sulfoaluminate cement concrete and conventional construction. Clean. Environ. Syst. 2022, 5, 100078. [Google Scholar] [CrossRef] [Scilit]
  35. de Souza Dias, L.; Anjos, M.A.S.; Barbosa, M.S.; Bezerra, U.T. Evaluation of mix design parameters based on basic constitutive relationships for 3DCP printing. Cerâmica 2024, 70, eZXBR6170. [Google Scholar] [CrossRef] [Scilit]
  36. ISO 14044:2006; Environmental Management—Life Cycle Assessment—Requirements and Guidelines. ISO: Geneva, Switzerland, 2006.
  37. EN 15804:2012+A2:2019; Sustainability of Construction Works—Environmental Product Declarations—Core Rules for the Product Category of Construction Products. CEN: Brussels, Belgium, 2019.
  38. Pré Sustainability. SimaPro, version 10.1.0.3; PRé Sustainability: Amersfoort, The Netherlands, 2023. Available online: https://simapro.com/ (accessed on 1 November 2025).
  39. Bragança, L.; Mateus, R.; Koukkari, H. Building sustainability assessment. Sustainability 2010, 2, 2010–2023. [Google Scholar] [CrossRef] [Scilit]
  40. ABNT NBR 13279; Mortar for Laying and Rendering Walls and Ceilings—Determination of Flexural Tensile Strength and Compressive Strength. ABNT: Rio de Janeiro, Brazil, 2005.
  41. Caixa Econômica Federal; Instituto Brasileiro de Geografia e Estatística. SINAPI: Sistema Nacional de Pesquisa de Custos e Índices da Construção Civil; Caixa Econômica Federal: Brasília, Brazil, 2025. Available online: https://www.caixa.gov.br/ (accessed on 2 February 2026).
  42. Díaz-Balteiro, L.; González-Pachón, J.; Romero, C. Sustainability as a multi-criteria concept: New developments and applications. Sustainability 2020, 12, 7527. [Google Scholar] [CrossRef] [Scilit]
  43. Mateus, R.; Bragança, L. Sustainability assessment and rating of buildings: Developing the methodology SBToolPT-H. Build. Environ. 2011, 46, 1962–1971. [Google Scholar] [CrossRef] [Scilit]
  44. Turk, J.; Mauko Pranjić, A.; Mladenovič, A.; Cotič, Z.; Jurjavčič, P. Environmental comparison of two alternative road pavement rehabilitation techniques: Cold-in-place-recycling versus traditional reconstruction. J. Clean. Prod. 2016, 121, 45–55. [Google Scholar] [CrossRef] [Scilit]
  45. ISO/ASTM 52939:2023; Additive Manufacturing for Construction—Qualification Principles—Structural and Infrastructure Elements. International Organization for Standardization: Geneva, Switzerland, 2023.
  46. Moelich, G.M.; Kruger, J.; Combrinck, R. Modelling the interlayer bond strength of 3D printed concrete with surface moisture. Cem. Concr. Res. 2021, 150, 106559. [Google Scholar] [CrossRef] [Scilit]
  47. Van Der Putten, J.; Azima, M.; Van Den Heede, P.; Van Mullem, T.; Snoeck, D.; Carminati, C.; Hovind, J.; Trtik, P.; De Schutter, G.; Van Tittelboom, K. Neutron radiography to study the water ingress via the interlayer of 3D printed cementitious materials for continuous layering. Constr. Build. Mater. 2020, 258, 119587. [Google Scholar] [CrossRef] [Scilit]
Figure 1. Diagram of mixtures for additive manufacturing.
Processes 14 02723 g001
Figure 2. Printing direction, specimen extraction direction, and testing direction.
Processes 14 02723 g002
Figure 3. Percentage reduction in Global Warming Potential (GWP) relative to the Bcp1 and Dcp1 mixtures.
Processes 14 02723 g003
Figure 4. Contribution of inventory materials and processes to (I) Global Warming Potential (GWP), (II) Acidification Potential (AP), and (III) Abiotic Depletion Potential—Fossil Fuels (ADP_FF).
Processes 14 02723 g004
Figure 5. Pearson correlation matrix among the environmental impact categories, functional properties, and production cost of the evaluated mixtures.
Processes 14 02723 g005
Figure 6. Sensitivity analysis of the mixture rankings obtained using the MARS-SC method under different combinations of environmental, functional, and economic criterion weights.
Processes 14 02723 g006
Table 1. Research on additive manufacturing with respect to cement consumption.
ReferenceSand/Cement RatioCement Consumption (kg/m3)
Ye et al. (2021) [14]0.25–0.63655.00
Zhu et al. (2023) [15]0.20–1.00881.00–881.40
Bodur et al. (2024) [16]0.22–0.24640.00–800.00
Yang et al. (2024) [17]1.44750.00
Zandifaez et al. (2024) [18]0.23–1.01950.20–1014.40
Ingle & Prem (2025) [19]1.00–1.43768.70–818.85
Li et al. (2025) [20]1.11810.00
Tang et al. (2025) [21]1.07936.00
Table 2. Inventory Analysis.
MixturesMass Proportion Consumption (kg/m3)Transportation (kg·km)
CALFMKW/CCALFMKWHPMCSP
Bcp112.00--0.32706.601413.20--226.110.150.88585,093.55
Blf3012.860.43-0.46489.381399.63210.43-225.110.150.885102,803.78
Blf4013.330.67-0.53419.811397.97281.27-222.500.150.885109,020.83
Blf30mk1013.330.500.170.60406.901354.98203.4569.17244.140.151.20108,469.53
Dcp111.50--0.27859.201288.80--232.000.150.8986,072.30
Dcp212.50--0.38606.301515.80--229.200.150.8985,289.20
Dcp313.00--0.48497.771493.32--238.930.150.3079,762.03
Nlf40mk1014.000.800.200.72338.181352.7270.5467.64243.490.150.80113,699.76
Nmk1012.22-0.110.40615.391367.52-68.38246.150.150.7590,833.03
Legend: C = cement; A = sand; LF = limestone filler; MK = metakaolin; W/C = water/cement ratio; W = water; HPMC = hydroxypropyl methylcellulose; SP = superplasticizer.
Table 3. Cost inventory.
Component
Materials
UnitUnit Cost
(R$/Unit)
Mixtures
Bcp1Blf30Blf40Blf30mk10Dcp1Dcp2Dcp3Nlf40mk10Nmk10
Cement kg0.79558.21386.61331.65321.45678.77478.98393.24267.16486.16
Sand kg0.62871.24862.87861.85835.35794.55934.49920.63833.94843.08
Metakaolin kg9.08---628.03----620.86
Limestone filler kg0.45-94.69126.5791.55---121.74-
HPMC kg318.2547.7447.7447.7447.7447.7447.7447.7447.7447.74
Superplasticizer kg24.5321.7121.7121.7129.4421.8421.847.3619.6318.40
Production
Electricity kwh4.264.264.264.264.264.264.264.264.264.26
Printer operator h189.72189.72189.72189.72189.72189.72189.72189.72189.72189.72
Mixer operator h16.4916.4916.4916.4916.4916.4916.4916.4916.4916.49
Waterkg0.0081.831.821.801.981.881.861.941.971.99
Total (R$)-1711.201625.921601.792166.011755.241695.371581.372116.792228.69
Table 4. Weight of sustainability indicators.
Sustainability DimensionIndicatorUnitWeight (%)
Environmental (NDA)Global Warming Potential (GWP)[kg CO2 eq]38
Ozone layer depletion (ODP)[kg CFC-11 eq]12
Photochemical oxidation (POCP)[kg NMVOC eq]12
Acidification (AP)[mol H+ eq]12
Eutrophication, marine (EPM)[kg N eq]14
Eutrophication, freshwater (EPF)[kg P eq]
Eutrophication, terrestrial (EPT)[mol N eq]
Depletion of abiotic resources-fossil fuels (ADP_FF)[MJ]12
Functional (NDF)Compressive strength ( R W )(MPa)50
Interlayer bond strength ( τ )(MPa)50
Economic (NDE)Production cost[R$]100
Table 5. Results of the quantification of the parameters applied in the assessment of environmental impacts.
MixturesParameters Describing Environmental Impacts
GWPODPAPEPMEPFEPTPOCPADP_FF
(kg CO2 eq)(kg CFC-11 eq)(kg SO2 eq)(kg N eq)(kg P eq)(mol N eq)(kg C2H4)(MJ eq)
Bcp16.51 × 1024.47 × 10−62.42 × 1007.16 × 10−11.36 × 10−27.77 × 1002.28 × 1003.15 × 103
Blf304.69 × 1023.63 × 10−61.76 × 1005.27 × 10−11.13 × 10−25.70 × 1001.69 × 1002.43 × 103
Blf404.10 × 1023.36 × 10−61.55 × 1004.67 × 10−11.06 × 10−25.04 × 1001.50 × 1002.20 × 103
Blf30mk104.19 × 1023.57 × 10−51.53 × 1004.58 × 10−11.14 × 10−24.94 × 1001.49 × 1002.36 × 103
Dcp17.83 × 1025.19 × 10−62.90 × 1008.54 × 10−11.56 × 10−29.29 × 1002.72 × 1003.70 × 103
Dcp25.65 × 1024.01 × 10−62.11 × 1006.26 × 10−11.23 × 10−26.79 × 1002.00 × 1002.78 × 103
Dcp34.65 × 1023.32 × 10−61.74 × 1005.20 × 10−19.69 × 10−35.64 × 1001.66 × 1002.29 × 103
Nlf40mk103.58 × 1023.21 × 10−61.31 × 1003.96 × 10−19.91 × 10−34.26 × 1001.29 × 1002.08 × 103
Nmk105.90 × 1024.27 × 10−62.15 × 1006.37 × 10−11.28 × 10−26.90 × 1002.05 × 1002.99 × 103
Table 6. Quantification of the functional and economic parameters of the mixtures.
MixturesFunctional ParametersEconomic Parameters (R$)
R W   ( M P a ) τ   ( M P a )
Bcp156.265.731711.20
Blf3021.934.141625.92
Blf4016.193.371601.79
Blf30mk1021.194.082166.01
Dcp172.174.951755.24
Dcp247.274.321695.37
Dcp325.022.991581.37
Nlf40mk1024.903.392116.79
Nmk1025.514.482228.69
Table 7. Normalized values of the parameters describing environmental impacts.
MixtureGWPODPAPPOCPADP_FFEPMEPFEPT
Bcp10.310.360.300.310.340.300.340.30
Blf300.740.790.720.720.790.710.730.71
Blf40 0.880.920.850.860.930.850.850.85
Blf30mk100.860.820.860.860.830.860.720.86
Dcp10.000.000.000.000.000.000.000.00
Dcp20.510.600.500.510.570.500.560.50
Dcp30.750.940.730.740.870.731.000.73
Nlf40mk101.001.001.001.001.001.000.961.00
Nmk10 0.450.460.470.470.440.470.480.47
Table 8. Normalized values of the parameters describing functional and economic performance.
MixturesFunctional ParametersEconomic Parameters (R$)
R W (Mpa) τ (Mpa)
Bcp10.721.000.80
Blf300.100.420.93
Blf400.000.140.97
Blf30mk100.090.400.10
Dcp11.000.720.73
Dcp20.560.490.82
Dcp30.160.001.00
Nlf40mk100.160.150.17
Nmk100.170.540.00
Table 9. Normalized data with a radar diagram of the sustainable profile.
Construction TechnologySustainable ProfileParameterSustainability Score
N D A N D F N D E NS
Bcp1Processes 14 02723 i0010.320.860.800.63
Blf30Processes 14 02723 i0020.740.260.930.66
Blf40Processes 14 02723 i0030.880.070.970.66
Blf30mk10Processes 14 02723 i0040.840.240.100.44
Dcp1Processes 14 02723 i0050.000.860.730.48
Dcp2Processes 14 02723 i0060.530.520.820.61
Dcp3Processes 14 02723 i0070.790.081.000.64
Nlf40mk10Processes 14 02723 i0081.000.150.170.50
Nmk10Processes 14 02723 i0090.460.000.360.29
All indicators were normalized to a dimensionless scale ranging from 0 to 1, where values closer to 1 represent better performance.
Disclaimer/Publisher’s Note: The statements, opinions and data contained in all publications are solely those of the individual author(s) and contributor(s) and not of MDPI and/or the editor(s). MDPI and/or the editor(s) disclaim responsibility for any injury to people or property resulting from any ideas, methods, instructions or products referred to in the content.