1. Introduction
Against the backdrop of global climate change and the ongoing pursuit of carbon-peaking and carbon-neutrality goals, gas turbines have become indispensable energy-conversion systems because of their high efficiency, operational flexibility, and relatively clean combustion characteristics. They are widely used in power generation, marine propulsion, and natural gas pipeline compression. Nevertheless, nitrogen oxides (NOx) generated during gas turbine combustion remain a major environmental concern because they contribute to photochemical smog, acid rain, and ozone-related air pollution, thereby posing risks to both ecosystems and human health. As emission regulations become increasingly stringent, achieving ultra-low NOx emissions without compromising gas turbine efficiency has emerged as a central challenge in advanced combustion research. Therefore, establishing accurate and reliable NOx formation prediction models is essential not only for meeting environmental requirements but also for supporting the forward design and optimization of low-emission combustors.
To develop accurate NOx prediction models, it is first necessary to identify the dominant chemical pathways responsible for NO formation under gas turbine combustion conditions because NO generally constitutes the largest fraction of NOx emitted from high-temperature combustion systems. In general, NO is formed through four principal chemical kinetic pathways.
The first is the thermal NO pathway, in which molecular nitrogen from the air is directly oxidized at elevated temperatures, typically above 1800 K. This pathway is highly sensitive to temperature and is commonly described by the extended Zeldovich mechanism [
1,
2]. The second is the prompt NO pathway, which results from rapid reactions between hydrocarbon radicals generated near the flame front and molecular nitrogen. First proposed by Fenimore [
3], this mechanism can contribute significantly under fuel-rich combustion conditions.
The third is the fuel NO pathway, which originates from the oxidation of nitrogen-containing compounds present in the fuel. Its contribution, therefore, depends strongly on the fuel-bound nitrogen content [
4,
5]. In recent years, this pathway has received renewed attention because ammonia has increasingly been considered a carbon-free fuel for gas turbines [
6,
7]. Unlike conventional natural gas, ammonia contains chemically bound nitrogen, and its oxidation proceeds through NH
x-related intermediates that can result in substantial fuel-NO formation [
5,
6,
7]. Recent studies of NH
3/CH
4 co-combustion have shown that NO formation is strongly influenced by fuel composition and equivalence ratio [
8]. Fuel- and air-staging strategies, together with fuel–oxidizer mixing characteristics, can further modify the competition between fuel-NO formation and reduction pathways [
7,
9]. However, the present study considers natural gas represented by CH
4, which contains no fuel-bound nitrogen. Accordingly, fuel-N chemistry is beyond the scope of this work.
The fourth is the N
2O intermediate pathway, in which NO is formed through reactions involving N
2O intermediates under high-pressure and fuel-lean conditions. This pathway is particularly relevant to gas turbines operating with lean premixed combustion technology [
10,
11].
The formation and transport of NO are described by the species transport equation:
where
is the unsteady term, representing the temporal variation in the NO mass fraction;
is the convection term, describing the transport of NO due to bulk fluid motion;
is the diffusion term, accounting for molecular diffusion driven by concentration gradients; and
is the source term, which constitutes the core of the NO modeling framework in this study. It aggregates the rates of all chemical reactions that produce and consume NO, thereby quantifying the net formation of NO. It should be noted that nitrogen oxides (NO
x) in actual combustion emissions mainly consist of nitric oxide (NO) and nitrogen dioxide (NO
2). Since NO generally accounts for more than 95% of the total NO
x in the high-temperature flue gas at the outlet of gas turbine combustors [
12,
13], whereas NO
2 is primarily formed in the downstream low-temperature region and remains at a very low concentration, NO is selected as the target species in all subsequent numerical calculations in this study. During model comparison and validation against field test data, the calculated NO mass fraction or ppm concentration is therefore approximately treated as the NO
x emission concentration for discussion. This simplification has been widely adopted in numerical studies of NO
x emissions from gas turbines [
11,
14,
15].
The formation of thermal NO is described by the following three reversible reactions (the extended Zeldovich mechanism) [
1,
2]:
In this process, the N≡N triple bond in molecular nitrogen (N
2) is extremely stable, with a dissociation energy of 941 kJ/mol. Its cleavage requires a substantial energy input, making reaction (2) the rate-limiting step. This also explains the pronounced temperature dependence of thermal NO formation. When the temperature exceeds 2200 K, the formation rate of thermal NO approximately doubles for every 90 K increase in temperature [
2].
Prompt NO is generally formed under relatively low-temperature, fuel-rich, and short-residence-time conditions. It is commonly observed in surface burners, staged combustion systems, and gas turbines [
16]. In conventional stationary combustion devices, its overall contribution is usually limited. However, as NO emission standards become increasingly stringent and other NO formation pathways are progressively suppressed, the relative importance of prompt NO is expected to increase [
17,
18]. The prompt NO mechanism involves a complex network of elementary reactions, among which the initial and key step is the attack of N
2 by CH radicals [
3]:
In contrast to thermal NO formation, the cleavage of the N
2 triple bond in this pathway is initiated by highly reactive CH radicals rather than by O atoms. Under fuel-rich conditions, CH radicals are readily produced near the flame front, enabling the reaction to occur even at relatively low temperatures. The resulting N atoms and HCN intermediates are then further oxidized to form NO [
19]:
Malte and Pratt [
19] proposed a mechanism in which NO is formed from molecular nitrogen (N
2) through nitrous oxide (N
2O) as an intermediate species. In combustion systems, nitrogen is introduced mainly through combustion air and dilution air. As high-pressure combustion devices, particularly gas turbines, increasingly rely on lower combustion temperatures to suppress thermal NO formation, the relative contribution of the N
2O intermediate pathway becomes more significant. Previous studies have shown that, in such systems, approximately 30% of NO formation may be associated with the N
2O intermediate mechanism [
20]. The role of the N
2O pathway in NO formation has been indirectly confirmed by experiments in various combustion systems and has also been extensively examined through theoretical analyses [
21,
22,
23]. This mechanism is typically activated and may become dominant under the following conditions:
Here, M represents an arbitrary third-body molecule that removes the excess energy released during the reaction, thereby stabilizing the reaction products. Because the first reaction, reaction (9), involves a third-body collision, this pathway is favored under high-pressure conditions. Moreover, since both reactions consume O radicals, oxygen-rich environments are also conducive to this mechanism.
The NO formation and consumption mechanisms described above are primarily derived from laboratory-scale studies conducted under well-controlled conditions in which molecular transport dominates, such as laminar premixed flames and shock-tube experiments. In practical combustion systems, however, the flow field is generally highly turbulent. Turbulent mixing produces temporal fluctuations in temperature and species concentrations, which can substantially affect flame behavior and chemical reaction rates. Because NO formation depends nonlinearly on both temperature and species concentrations, directly applying time-averaged temperature and composition values in the reaction-rate model may lead to considerable errors in the predicted mean NO formation rate [
24]. Therefore, a probability density function (PDF) approach is introduced to account for the effects of turbulent fluctuations in temperature and species concentrations [
25]:
Here, denotes the mean turbulent reaction rate. In the NO post-processing model, it specifically corresponds to the mean source term in the NO transport equation, representing the statistically averaged local net rate of NO formation or consumption under turbulent fluctuations. The term represents the instantaneous reaction rate determined by the selected chemical kinetic mechanism, such as the instantaneous net formation rate of thermal NO. The variables denote the instantaneous quantities controlling the reaction rate, which may include dimensionless temperature, mixture fraction, and the mass fractions of key species. is the joint probability density function of these variables, describing the likelihood that their instantaneous values at a given spatial location in the turbulent flow fall within a specific infinitesimal range. When only one variable is considered, this function reduces to a univariate PDF; when the coupled fluctuations of temperature and species concentrations need to be represented, a multivariate PDF is required. The multiple integral on the right-hand side is taken over the full range of all independent variables. Physically, this formulation represents a probability-weighted average of the instantaneous reaction rate over all possible thermochemical states, thereby providing a statistically consistent mean reaction rate.
A wide range of approaches has been developed to incorporate NO formation chemistry into gas turbine combustion simulations, spanning idealized reactor models, detailed chemical-kinetic calculations, CFD-based post-processing methods, and high-fidelity large-eddy simulations (LES). Early kinetic studies examined the relative contributions of the thermal, prompt, and N
2O pathways under lean premixed conditions, showing that their significance varies considerably with temperature, pressure, and equivalence ratio. Subsequent CFD-based methods employed post-processing techniques or pre-tabulated chemistry to reduce the computational cost associated with directly solving detailed nitrogen chemistry. More recent studies have further accounted for fuel–air unmixedness, turbulent fluctuations, and resolved unsteady flame structures in NO
x predictions. Representative approaches and their principal characteristics are summarized in
Table 1.
As summarized in
Table 1, previous studies have developed several effective approaches for predicting NOx emissions from gas turbine combustion. However, the representative literature also reveals that the combined effects of radical-concentration treatment, individual NO formation pathways, and turbulence–chemistry interaction have rarely been evaluated systematically within a unified industrial gas turbine framework. In particular, the sensitivity of NO predictions to the treatment of O and OH radicals may vary substantially across operating conditions because changes in load and pilot fuel ratio modify the local temperature, equivalence ratio, and radical pool. Furthermore, although several CFD-based studies have been validated against laboratory-scale or combustor-rig measurements, systematic validation over a range of load-ramping conditions and pilot fuel ratios using field data from an operating gas turbine remains comparatively limited. These gaps make it difficult to determine which NO submodels are necessary for reliable engineering predictions across a broad operating range rather than at a single design condition.
To systematically evaluate the effects of the thermal NO, prompt NO, N2O intermediate, and turbulence–chemistry interaction models on NO predictions, this study uses steady-state combustion flow fields for an F-class gas turbine operating at 50% and 100% load as the computational basis. Within a decoupled NO post-processing framework, different combinations of NO formation submodels are compared to determine their effects on the predicted outlet NO concentrations. The model combination providing the most reasonable predictions is subsequently applied to additional operating conditions, including load-ramping cases and variations in the pilot fuel ratio. The calculated results are then compared with measured emissions from the operating gas turbine to assess the applicability and limitations of the proposed NO prediction method under practical operating conditions. The principal sources of prediction error are further analyzed, providing guidance for NO submodel selection, engineering validation, and emissions prediction in practical gas turbine combustors.
3. Comparison of NO Models
3.1. Thermal NO
Based on the three pairs of forward and reverse reactions given in Equations (2)–(4), the net formation rate of thermal NO can be expressed as
As indicated by Equation (12), the calculation of the NO formation rate requires the instantaneous concentrations of several species, including [O], [N2], [N], [O2], [OH], [NO], and [H]. Among these species, N2 and O2 are relatively stable, and their concentrations can be directly obtained from the steady-state combustion flow-field solution. In contrast, N atoms are highly unstable, while O, H, and OH are also reactive radicals; therefore, their concentrations are difficult to determine directly with sufficient accuracy.
To overcome this difficulty, the quasi-steady-state assumption is introduced [
3]. According to this assumption, N atoms are highly reactive, and the N atoms produced through reaction (2) are rapidly consumed by reaction (3). Under oxygen-rich conditions, the consumption rate of N atoms can be regarded as equal to their formation rate. As a result, the N-atom concentration remains approximately constant over very short time and length scales, namely:
By substituting Equation (13) into Equation (12) and performing algebraic rearrangement, the concentration of [N] can be eliminated, yielding an expression for the net NO formation rate.
In Equation (14), the concentrations of the reactive radicals [O] and [OH] remain unknown. To close the model, an additional decoupling assumption is introduced. Since the formation rate of thermal NO is much lower than that of the main combustion reactions, the NO formation process can be treated as decoupled from the main combustion process. Accordingly, the combustion reactions are assumed to have reached chemical equilibrium, and the NO calculation is then performed using the equilibrium-state temperature and species concentrations [
1]. Based on this assumption, the equilibrium concentration of O radicals can be determined from the oxygen dissociation reaction [
32]:
However, experimental studies have shown that the actual concentrations of radicals such as O atoms can be substantially higher than the corresponding chemical-equilibrium values, particularly in the flame-front region. This phenomenon is commonly referred to as radical super-equilibrium [
33]. Direct use of the equilibrium assumption may therefore lead to an underestimation of the thermal NO formation rate. To reduce this error, the influence of the third body M in the O
2 dissociation–recombination reaction is further considered:
Accordingly, by incorporating experimental observations, the O-atom concentration under the partial-equilibrium assumption can be expressed as follows [
34]:
Compared with Equation (16), Equation (18) generally predicts a higher O-atom concentration, which is more consistent with the actual radical state in the flame. For the determination of the OH radical concentration, two common treatments are available. The first is the neglect approach. Under lean combustion conditions, the contribution of reaction (3) to NO formation is much greater than that of reaction (4); therefore, reaction (4) and the corresponding OH concentration can be omitted. The second is the partial-equilibrium approach. Similar to the treatment of O atoms, OH radicals are assumed to reach local partial equilibrium through a series of rapid elementary reactions, allowing their concentration to be estimated from those of relatively stable species. According to Refs. [
35,
36], the OH concentration can be expressed as follows:
In addition, some CFD platforms provide a transient formulation for thermal NO calculation. However, the combustion simulation in this study is based on a PDF combustion model, which assumes infinitely fast chemistry and thermochemical equilibrium. By contrast, the transient formulation is intended to resolve finite-rate reaction effects. These two approaches are therefore inconsistent in their underlying physical assumptions. If the transient NO formulation were applied within the present modeling framework, its theoretical consistency, prediction reliability, and numerical stability could not be ensured. For this reason, the transient solution method is not adopted in this study.
Based on the preceding discussion, this study evaluates three thermal NO model configurations: (1) the equilibrium assumption for O radicals, with OH radicals excluded and reaction (4) neglected; (2) the partial-equilibrium assumption for O radicals, with OH radicals still excluded and reaction (4) neglected; and (3) partial-equilibrium assumptions for both O and OH radicals, with the OH-related reaction pathway included.
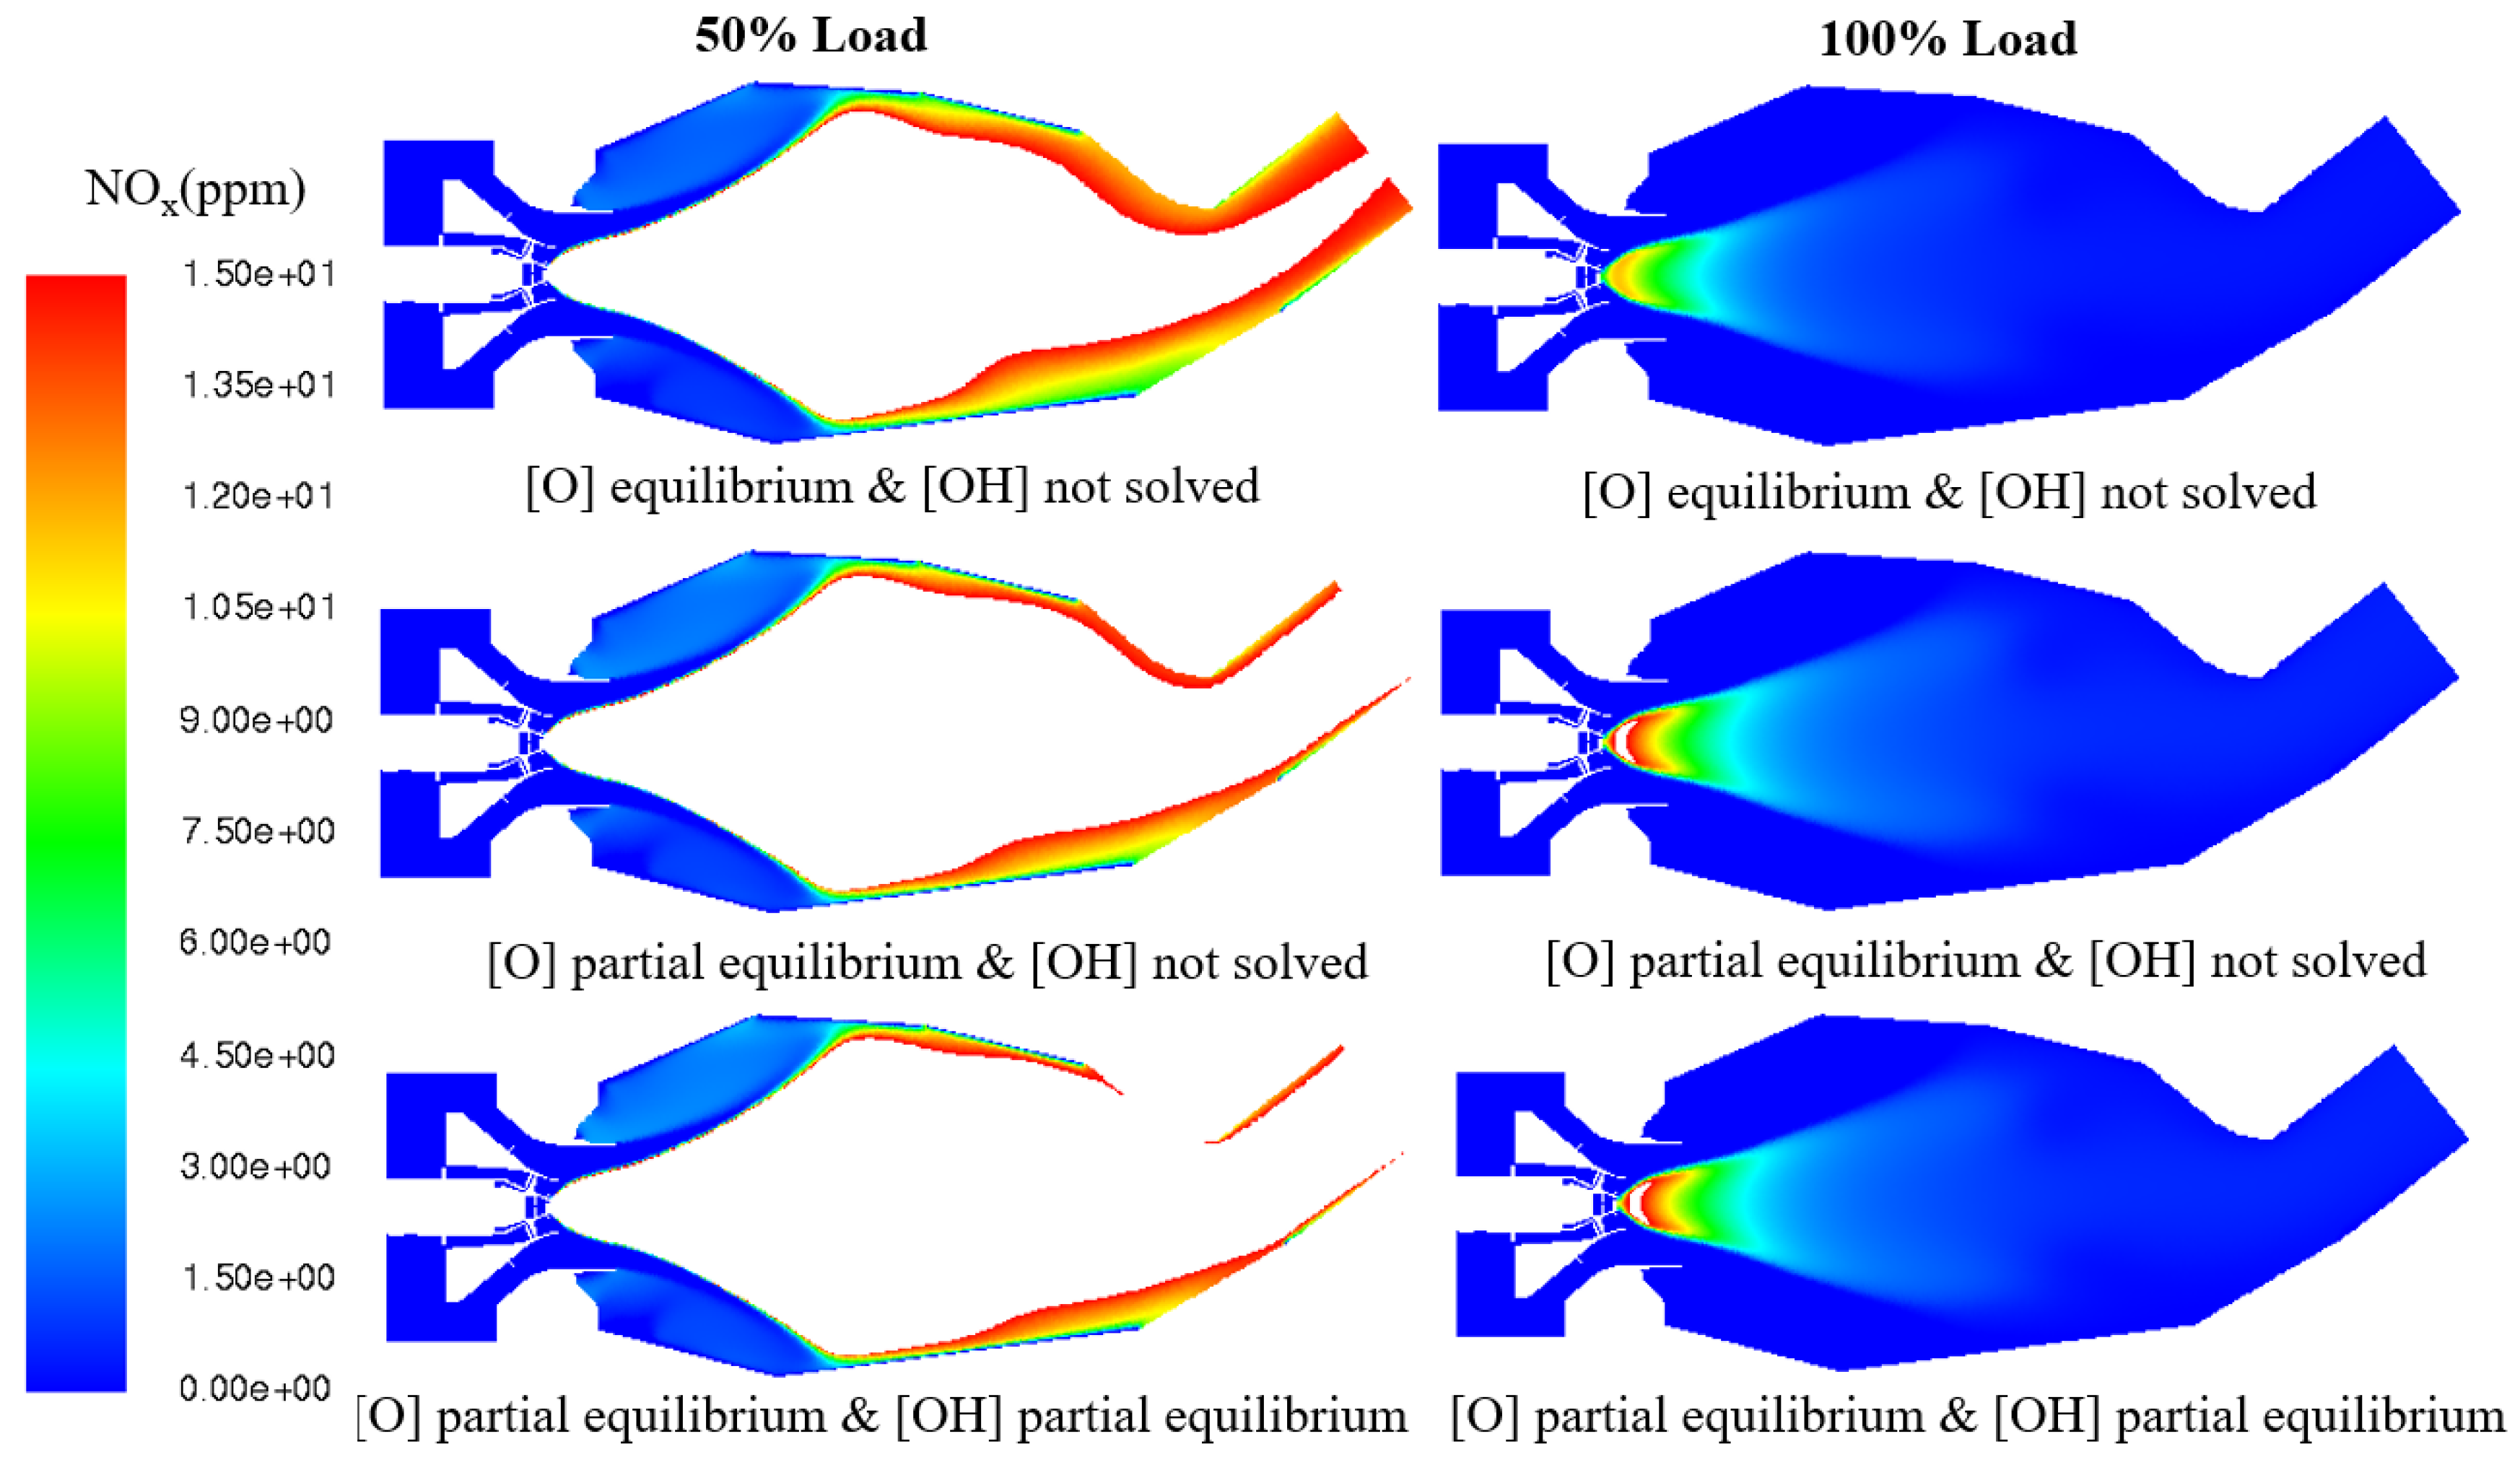
Figure 5 presents the NO concentration contours in the combustor under 50% and 100% load conditions using different calculation approaches. Regions with NO concentrations exceeding the upper limit of the color scale are not displayed. The corresponding outlet NO emission concentrations are summarized in
Table 3. Comparing the two load conditions shows that, for the same NO calculation method, both the spatial distribution range and the concentration level of NO in the combustor are much higher at 50% load than at 100% load. The outlet NO concentration at 50% load is more than 12 times higher than that at full load.
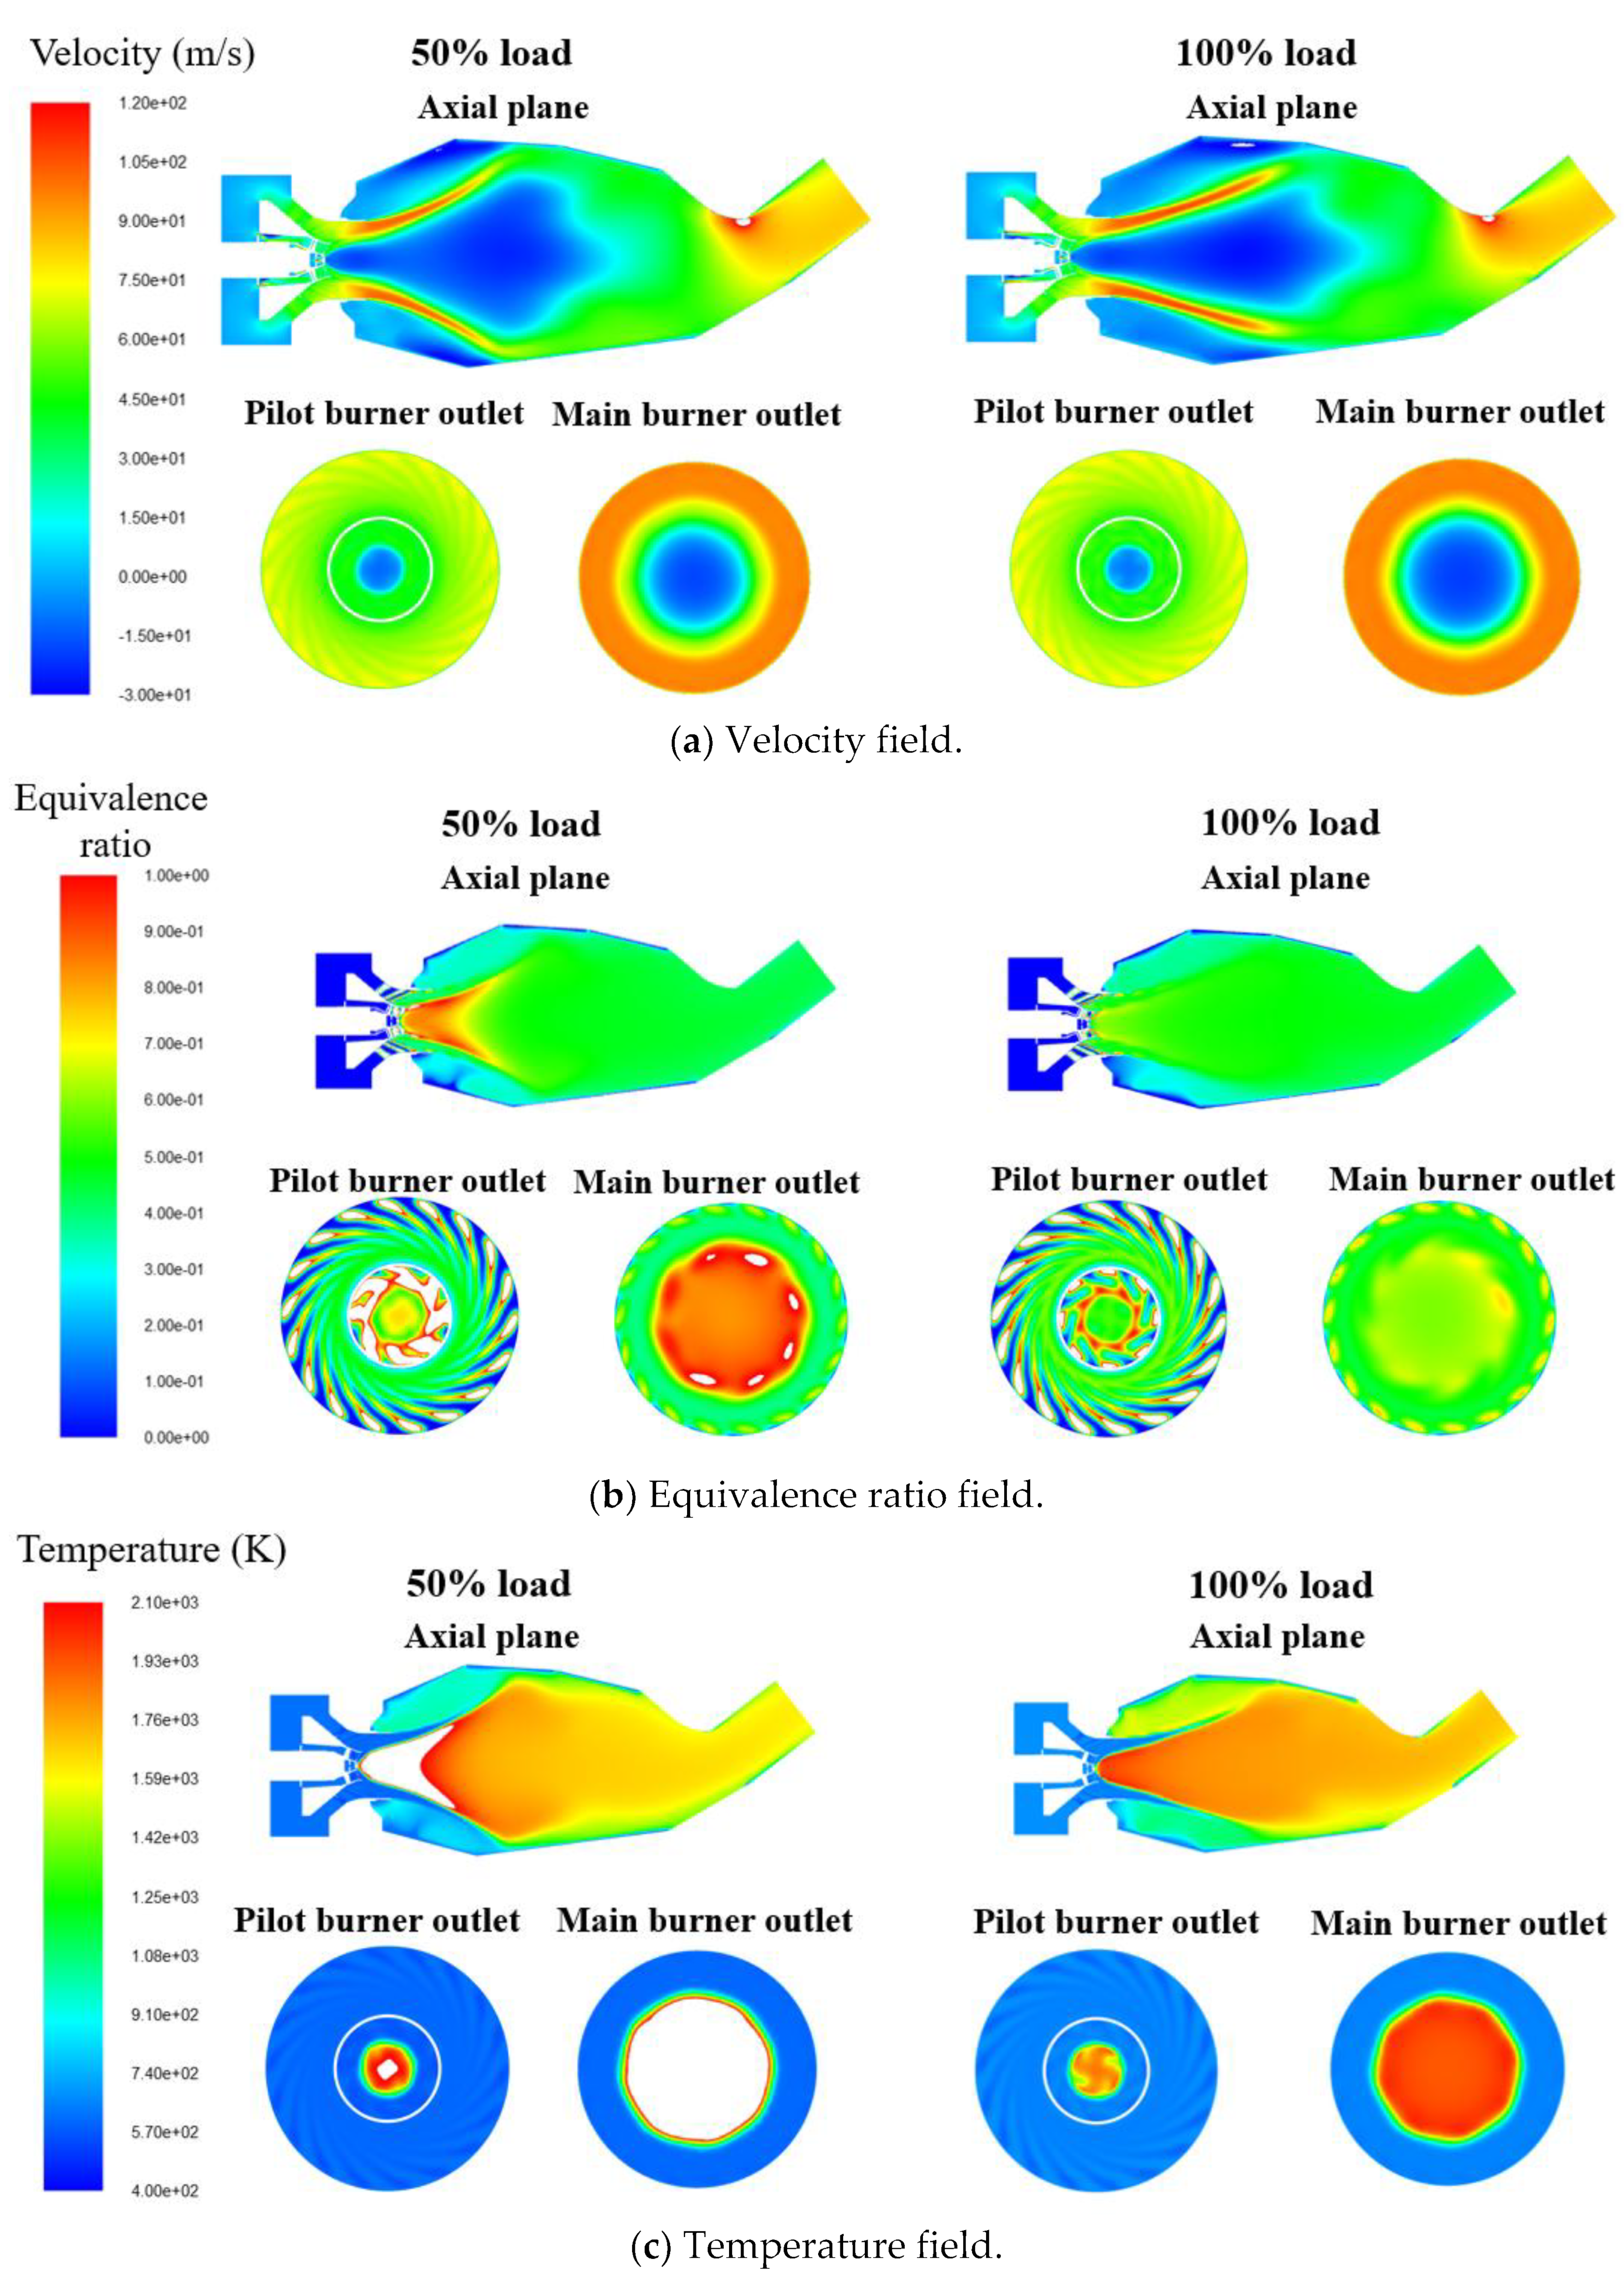
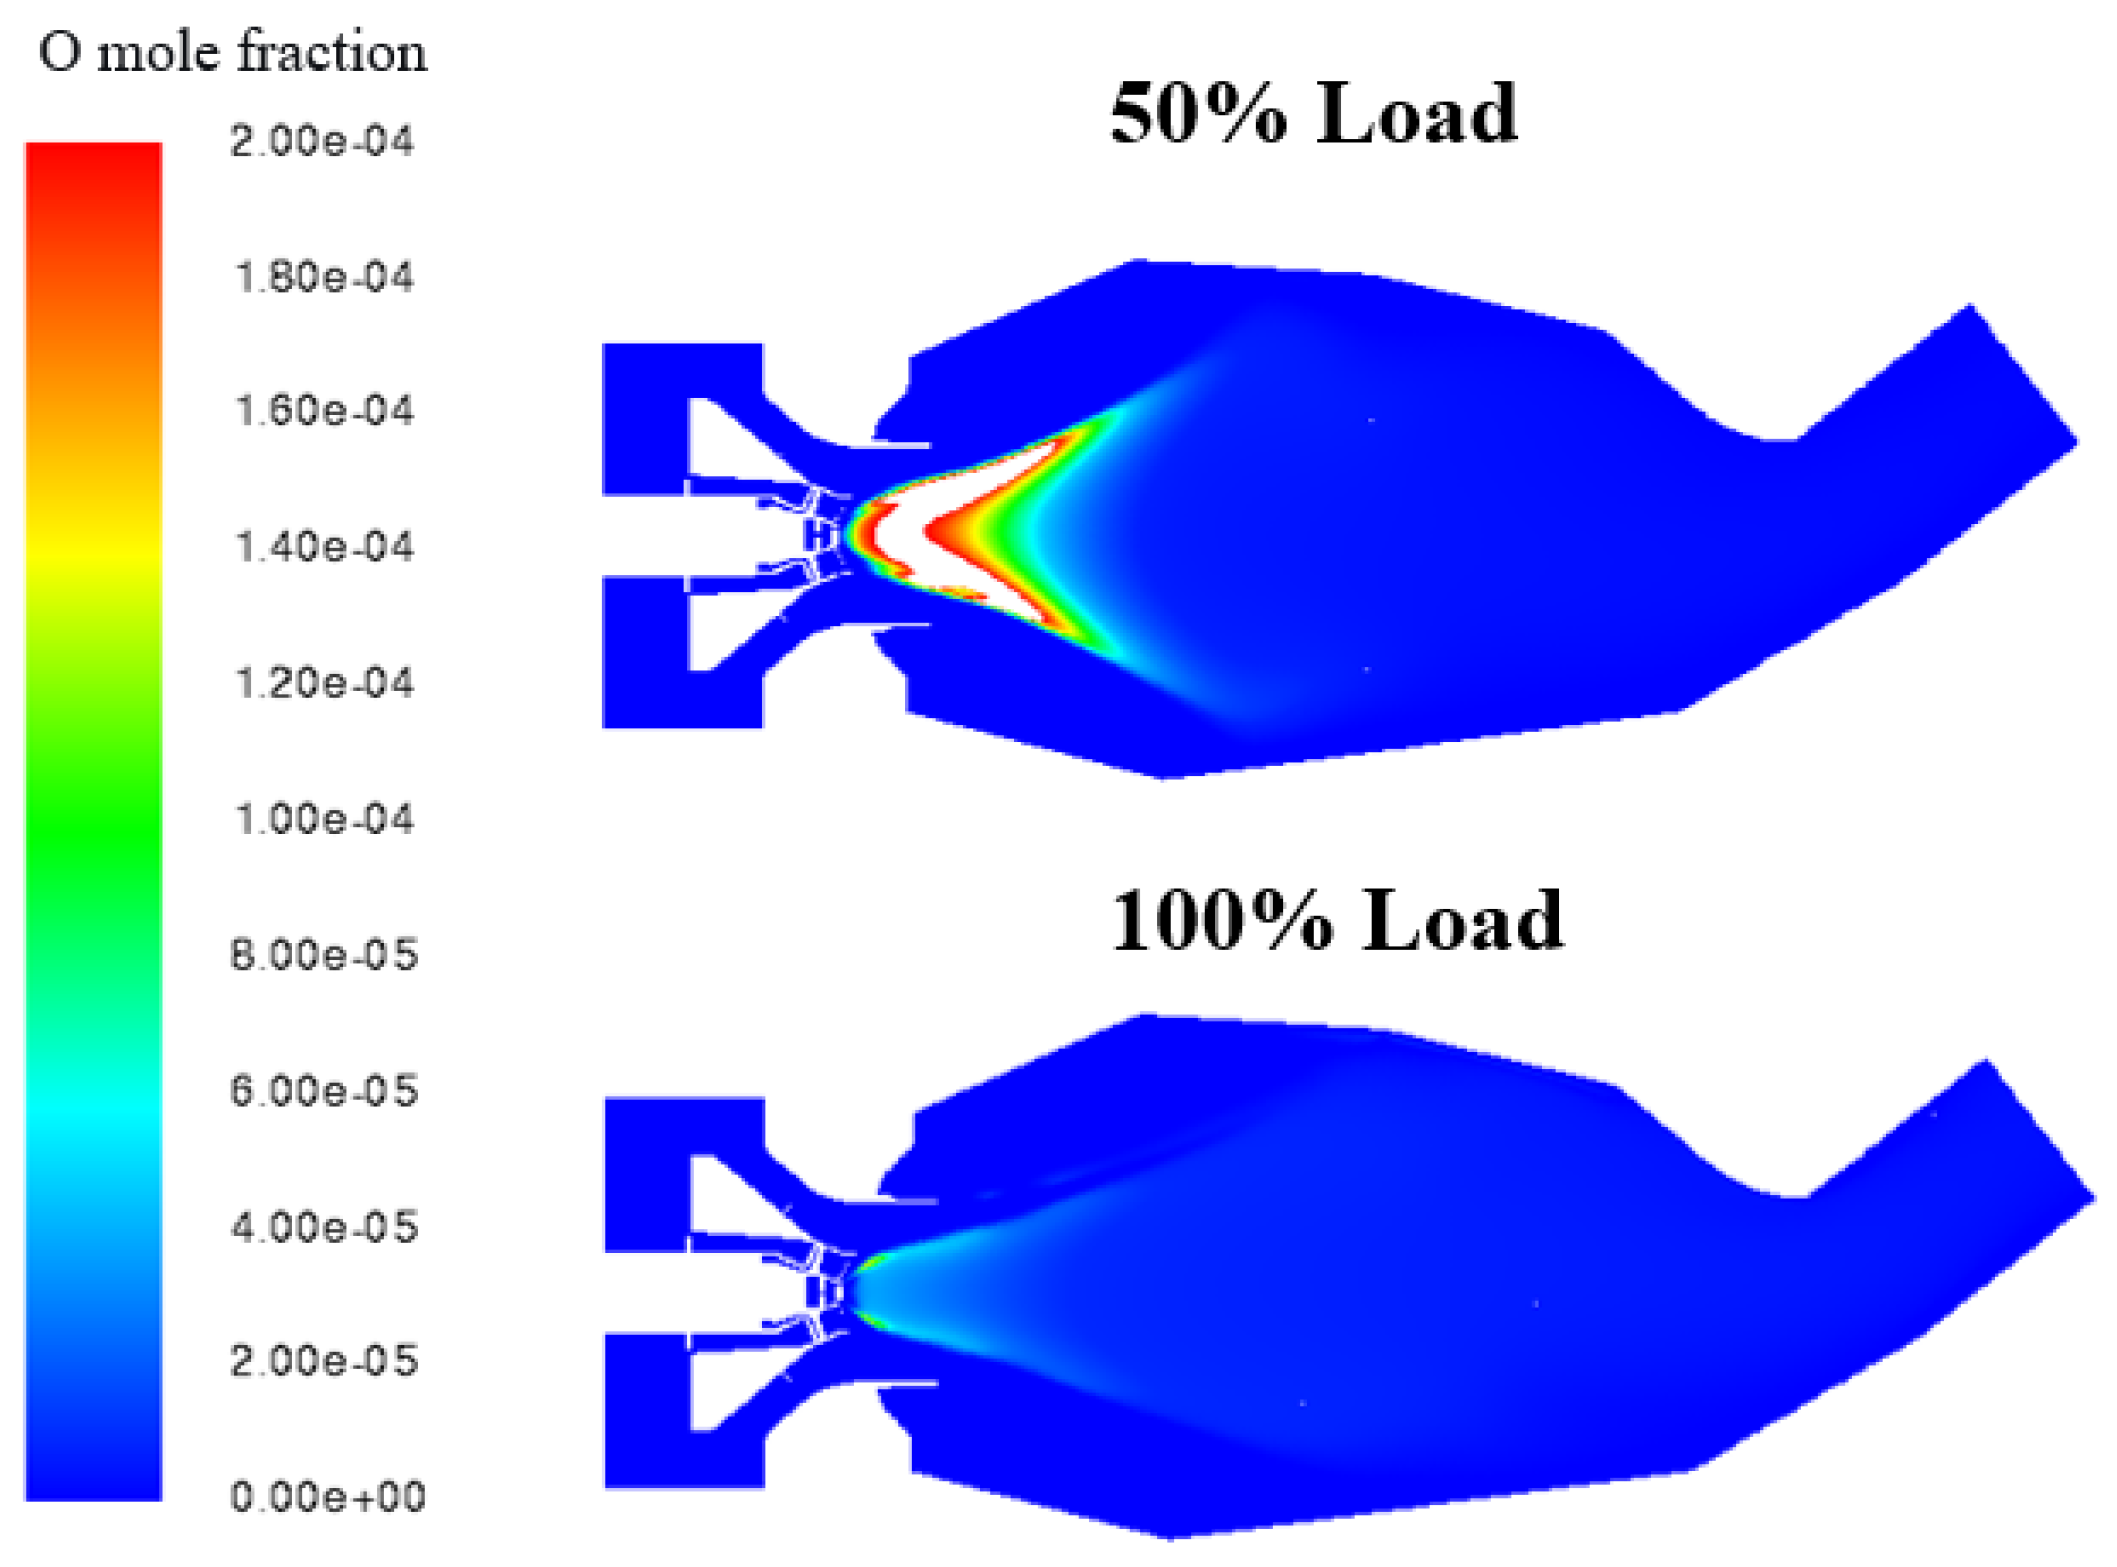
This large difference is mainly caused by the significantly higher pilot fuel ratio used at 50% load to maintain combustion stability under low-load operation. Under this condition, the pilot burner generates a localized fuel-rich, high-temperature core region in the upstream part of the combustor. As indicated by Equation (2), the thermal NO formation rate is exponentially sensitive to temperature. Therefore, once a local high-temperature region is formed, the NO production rate in this region becomes much higher than that in the downstream lower-temperature zones, making it the dominant source of the overall NO emissions from the combustor.
For both load conditions, replacing the equilibrium assumption for O radicals with the partial-equilibrium assumption results in a clear increase in the predicted outlet NO emissions. Specifically, the outlet NO concentration increases by 16.46% at 50% load and by 43.69% at 100% load. This behavior is physically reasonable. By considering the role of the third body M in the O2 dissociation–recombination reaction, as described by Equation (17), the partial-equilibrium assumption compensates for the underprediction of O-atom concentration associated with the equilibrium assumption. As a result, a higher thermal NO formation rate is obtained.
When the partial-equilibrium assumption for OH radicals is further introduced based on the preceding treatment, namely in configuration 3, the predicted NO formation at 50% load increases further. The outlet NO concentration rises from 18.46 ppm to 20.06 ppm, corresponding to an increase of 8.67%. In contrast, under the 100% load condition, the outlet NO concentration remains almost unchanged after the OH partial-equilibrium assumption is included.
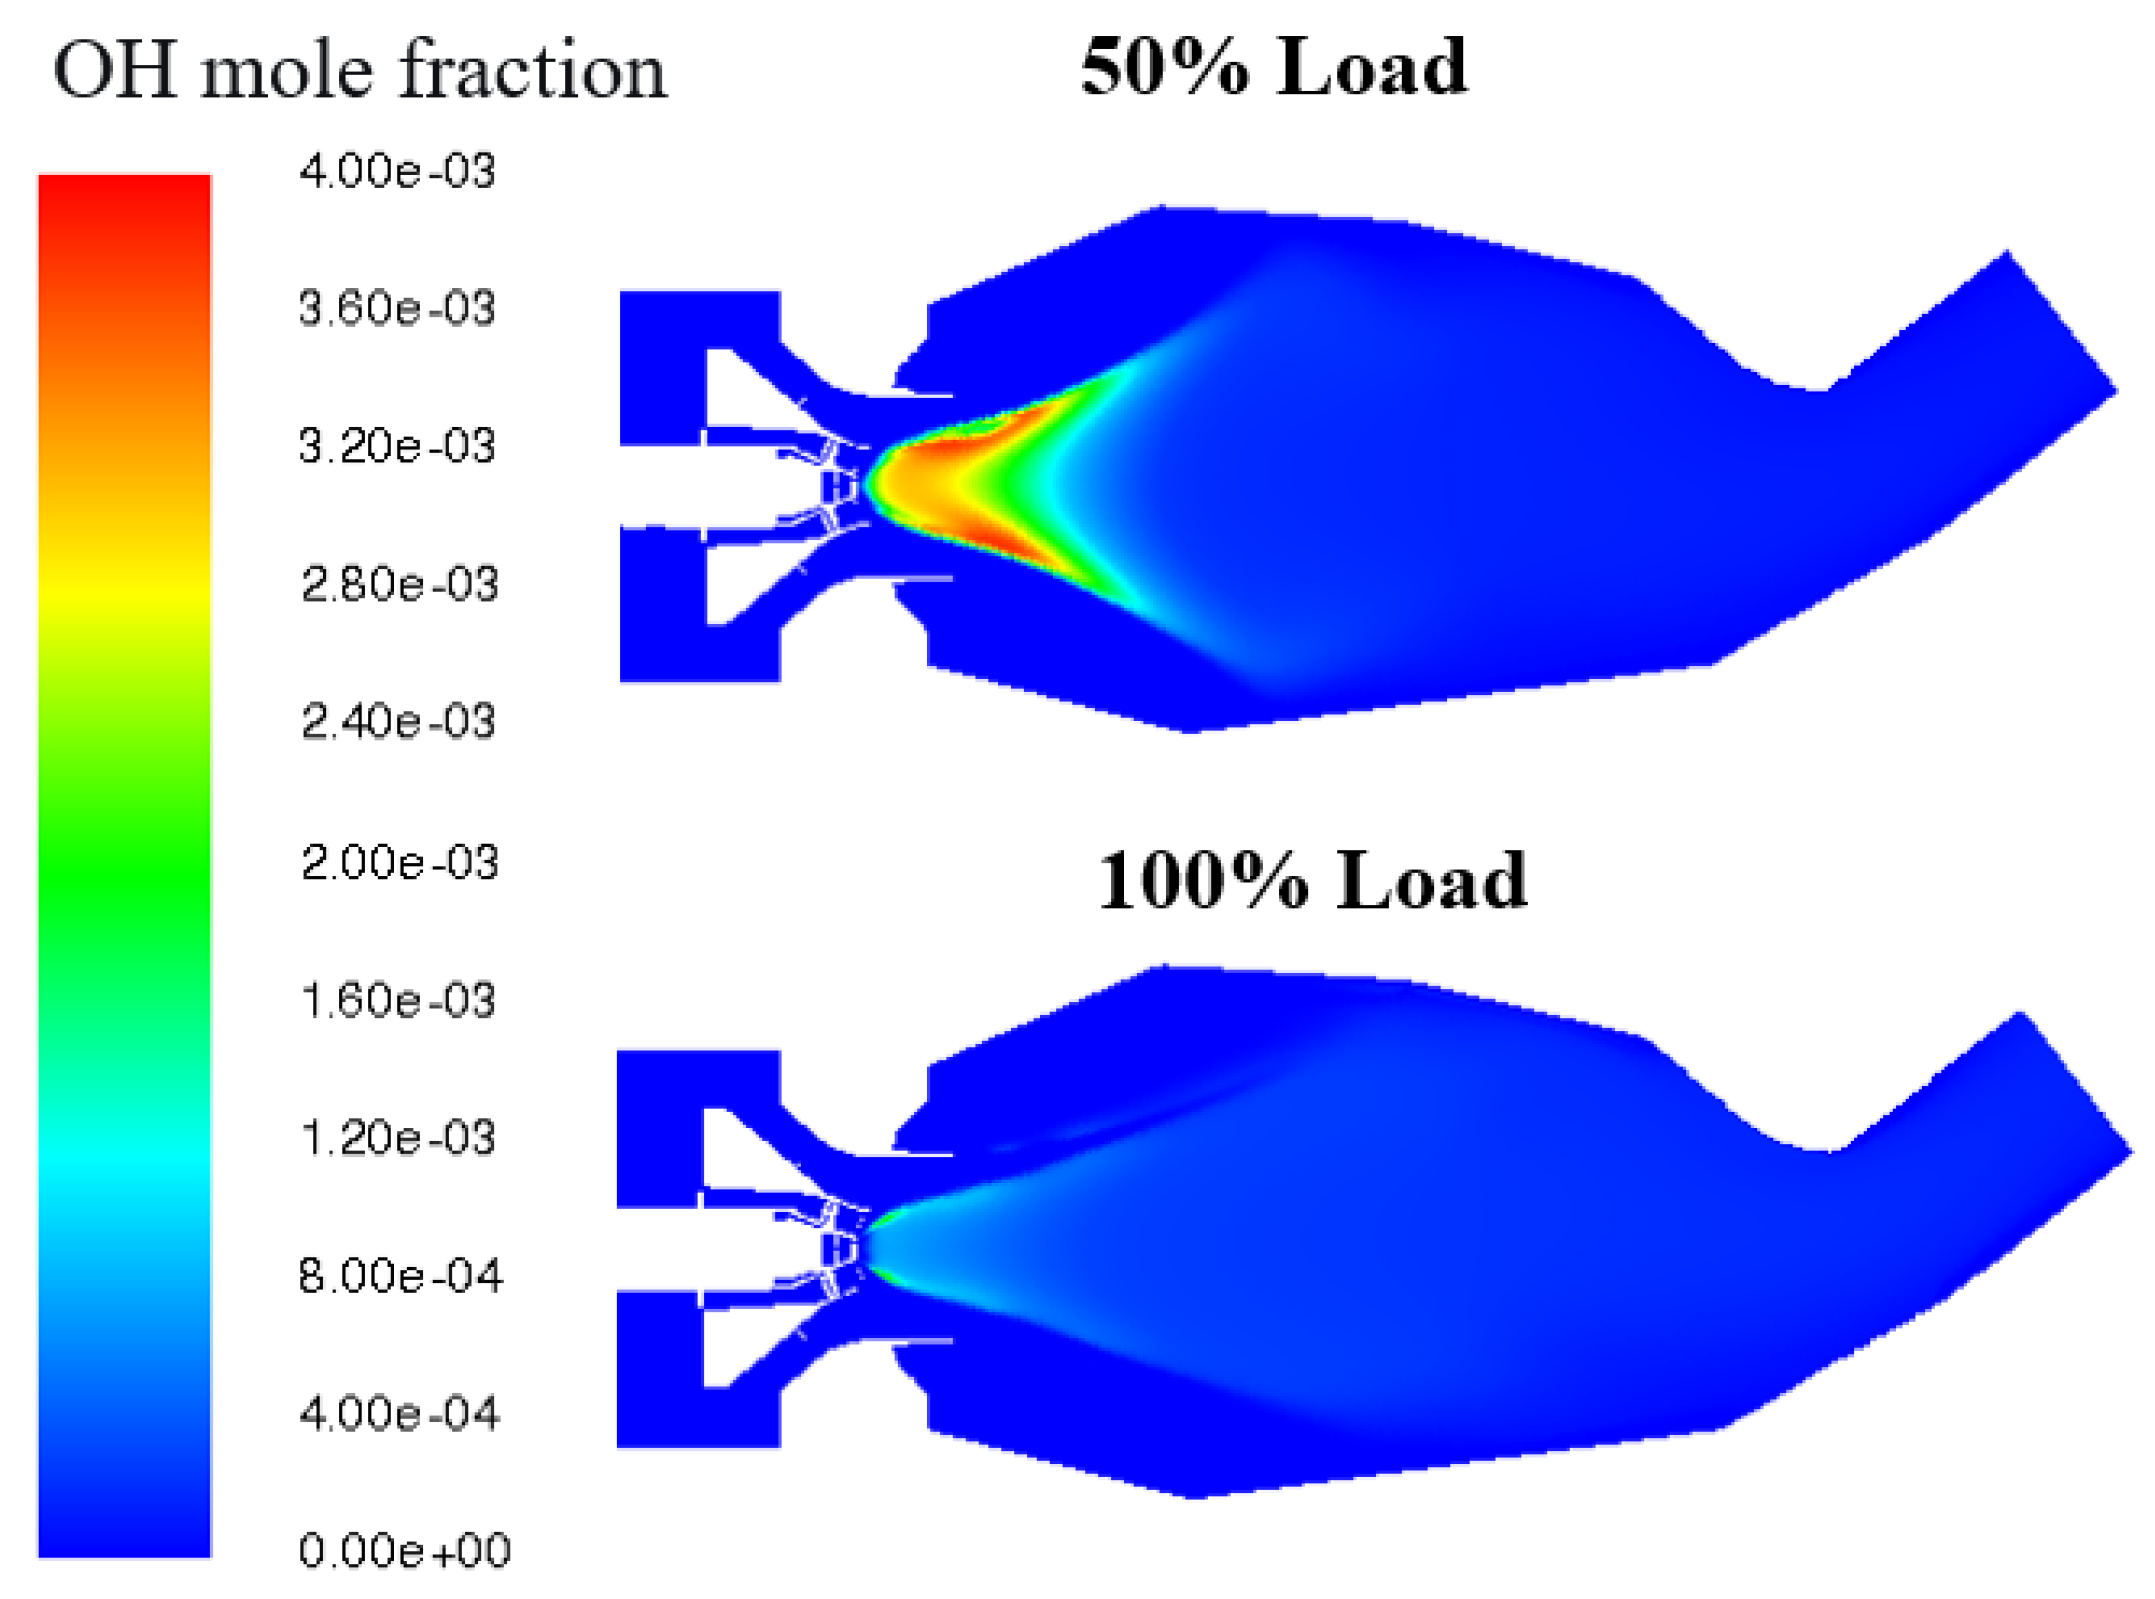
This difference can be directly explained by the OH radical distributions shown in
Figure 6. At 100% load, the overall OH concentration in the combustor is extremely low, and therefore reaction (4), (N + OH ⇌ H + NO), is not effectively promoted. As a result, solving the OH-related pathway has only a negligible effect on the total NO formation. At 50% load, however, the highly reactive region generated by the pilot burner contains abundant OH radicals, with concentrations much higher than those under the 100% load condition. In this region, reaction (4) becomes an important additional route for NO formation. Introducing the OH partial-equilibrium assumption therefore captures this contribution and leads to a significant increase in the predicted NO concentration.
3.2. Prompt NO
As shown in reaction (5), CH radicals act as the initiating species and the key controlling factor in the prompt NO formation pathway. In general, larger fuel molecules containing more carbon atoms can generate more CH fragments through pyrolysis in the flame, thereby providing more reaction channels for prompt NO formation. However, when the total number of carbon atoms per unit volume is kept constant, the overall amount of CH radicals that can be produced is approximately similar. Therefore, prompt NO formation is governed mainly by the carbon content of the fuel rather than by the detailed molecular structure of the parent hydrocarbon [
16]. Based on this understanding, the literature proposed a scaling relationship between the prompt NO formation rate and the concentrations of the key reactants [
17]:
Although Equation (20) is physically well-founded, its direct implementation in CFD simulations is highly challenging. The CH radical concentration is extremely low, its lifetime is very short, and its spatial distribution is mainly confined to the flame-front region. Accurately solving the CH transport equation within the RANS framework would require a highly detailed chemical kinetic mechanism, resulting in prohibitively high computational cost. To avoid this difficulty, De Soete [
18] proposed a global kinetic model. Based on an inductive analysis of extensive experimental data, this model relates the overall prompt NO formation rate directly to several readily available macroscopic quantities, yielding the empirical expression given in Equation (21):
where
,
Ea = 251151 J/mol,
a denotes the reaction order with respect to oxygen,
R is the universal gas constant, and
p represents the pressure. The main advantage of this model is that it avoids the need to resolve detailed intermediate reaction networks. Instead, the effects of complex elementary pathways are incorporated into empirical parameters, thereby greatly improving computational efficiency.
However, experimental data reported by Bachmaier et al. [
33] for different mixture compositions and fuel types show that the original De Soete model exhibits significantly reduced predictive accuracy under high-equivalence-ratio conditions and for hydrocarbons with larger carbon numbers. This discrepancy can mainly be attributed to two factors. First, under fuel-rich conditions, the concentration of CH radicals is much higher than that under lean combustion, and the implicit dependence on oxygen concentration in Equation (21) is no longer sufficient to represent the radical chemistry in the fuel-rich region. Second, the decomposition pathways of larger hydrocarbon molecules are more complex, leading to radical-fragment distributions that differ substantially from those of the smaller fuels used for the original model calibration. As a result, the empirical parameters in the original formulation become less applicable. To reduce these errors and improve the prediction accuracy of prompt NO over a wider range of operating conditions, researchers introduced a correction factor (f) based on experimental data. This factor accounts for the combined effects of fuel type, represented by carbon number, and the equivalence ratio of gaseous aliphatic hydrocarbons [
37], yielding the modified rate expression in Equation (22):
In this formulation, the correction factor
and the equivalent pre-exponential factor
are calculated using Equations (23) and (24), respectively [
37]:
Here, denotes the number of carbon atoms in each molecule of the hydrocarbon fuel, and represents the global equivalence ratio of the flame. The correction factor is applicable within the range . When falls outside this range, the corresponding boundary value is used. The correction factor is expressed as a cubic polynomial of the equivalence ratio. Physically, this formulation captures the non-monotonic dependence of prompt NO formation on equivalence ratio, as observed from experimental data, where the formation rate first increases and then decreases. As the mixture changes from lean conditions toward near-stoichiometric conditions, the concentration of CH radicals increases continuously, thereby enhancing the NO formation rate. Once the mixture enters the fuel-rich regime, however, the CH radical concentration remains high, but the limited oxygen availability suppresses the subsequent oxidation steps, leading to a reduction in net NO formation. Therefore, the polynomial terms involving the equivalence ratio provide a mathematical representation of the competition between CH-radical production and oxygen-limited oxidation.
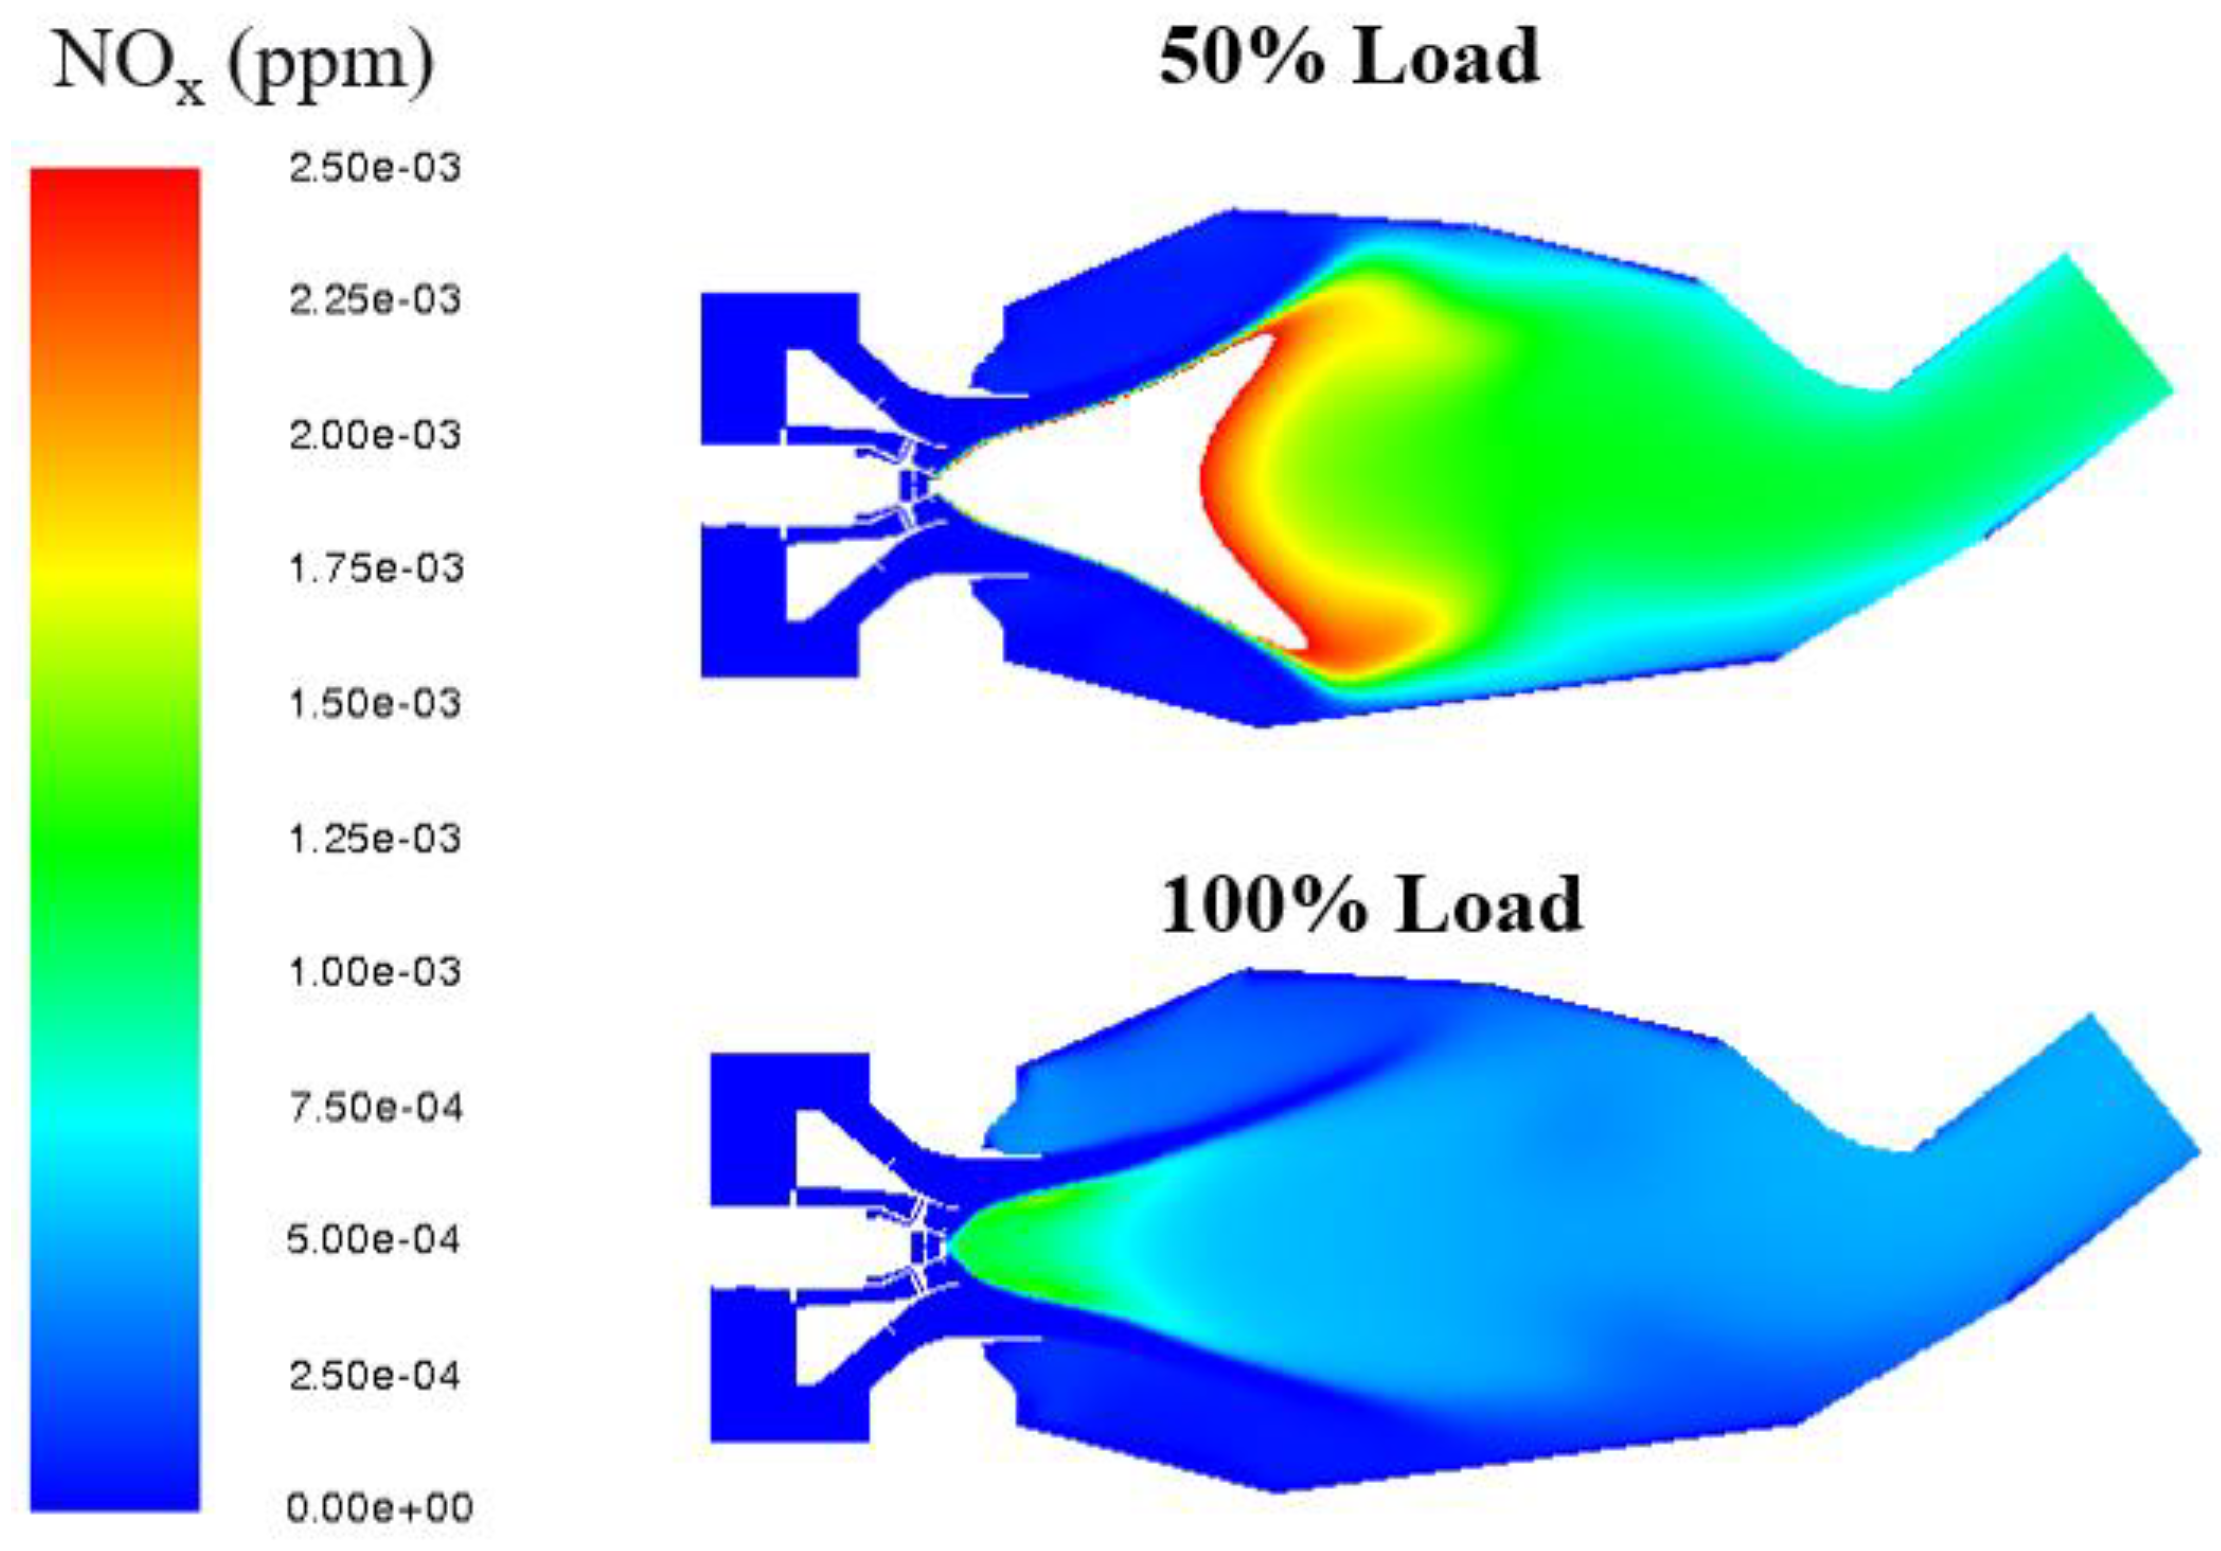
When only the prompt NO model is activated for the 50% and 100% load conditions, the predicted NO formation remains extremely low. The average NO concentrations at the combustor outlet are only 0.0013 ppm and 0.0006 ppm, respectively, which are several orders of magnitude lower than the corresponding thermal NO predictions. The axial distribution of NO concentration in the combustor is shown in
Figure 7. It should be noted that the upper limit of the color scale in
Figure 7 is only 1/1000 of that used in
Figure 5, where only the thermal NO model is considered. These results demonstrate that, under the combustion conditions investigated in this gas turbine, the prompt NO pathway makes a negligible contribution to the total NO emissions.
The extremely low level of prompt NO formation can be attributed primarily to the kinetic limitation of its initiation step. As indicated by reaction (5), prompt NO formation is governed by the reaction between CH radicals and N2. Under the typical operating conditions of the gas turbine investigated in this study, the combustor operates in a globally lean premixed mode, where the CH radical concentration in the flame is very low. CH radicals are mainly produced near the flame front under fuel-rich conditions. In contrast, lean premixed combustion is characterized by thorough premixing between fuel and oxidizer, and the reaction zone does not provide a sufficiently fuel-rich environment. As a result, the amount of CH radicals generated is much lower than that in diffusion flames or fuel-rich premixed flames. Therefore, although the prompt NO pathway is chemically possible, it cannot be effectively activated without sufficient CH radicals, leading to a negligible contribution to overall NO formation.
It should be noted that, although prompt NO is formed only at trace levels under both load conditions, the outlet NO concentration at 50% load is still higher than that at 100% load, with values of 0.0013 ppm and 0.0006 ppm, respectively. This relative trend is consistent with that observed for thermal NO. The difference can also be attributed to the higher pilot fuel ratio adopted at 50% load. Under this condition, the pilot burner creates a localized region with a relatively high equivalence ratio, which provides more favorable conditions for CH radical generation and thus slightly promotes prompt NO formation. Nevertheless, its absolute contribution remains far below that of the thermal NO pathway. Therefore, for the F-class gas turbine investigated in this study, prompt NO is not a dominant emission source and does not require primary attention in the NO prediction model.
3.3. N2O Intermediate Pathway and Turbulence–Chemistry Interaction Models
For the N
2O intermediate mechanism represented by reactions (9) and (10), the net NO formation rate can be written as:
Solving Equation (25) requires the instantaneous concentrations of [O] and [N
2O]. The O-radical concentration can be determined using the approaches described in
Section 3.1, namely the equilibrium or partial-equilibrium assumption. By contrast, N
2O is an intermediate species specific to this pathway and, in principle, should be obtained by solving its full convection–diffusion–reaction transport equation. To reduce computational complexity, the quasi-steady-state assumption is also applied to N
2O. Under this assumption, N
2O is considered to reach a local balance between formation and consumption over a very short time scale; therefore, its net formation rate can be taken as zero:
Based on Equation (26), the algebraic expression for the N
2O concentration can be derived as
The reaction rate constants are given by [
37]
;
;
;
To examine the combined influence of the N
2O intermediate pathway and the turbulence–chemistry interaction model on NO prediction, the thermal and prompt NO models are used as the baseline model in this study. The N
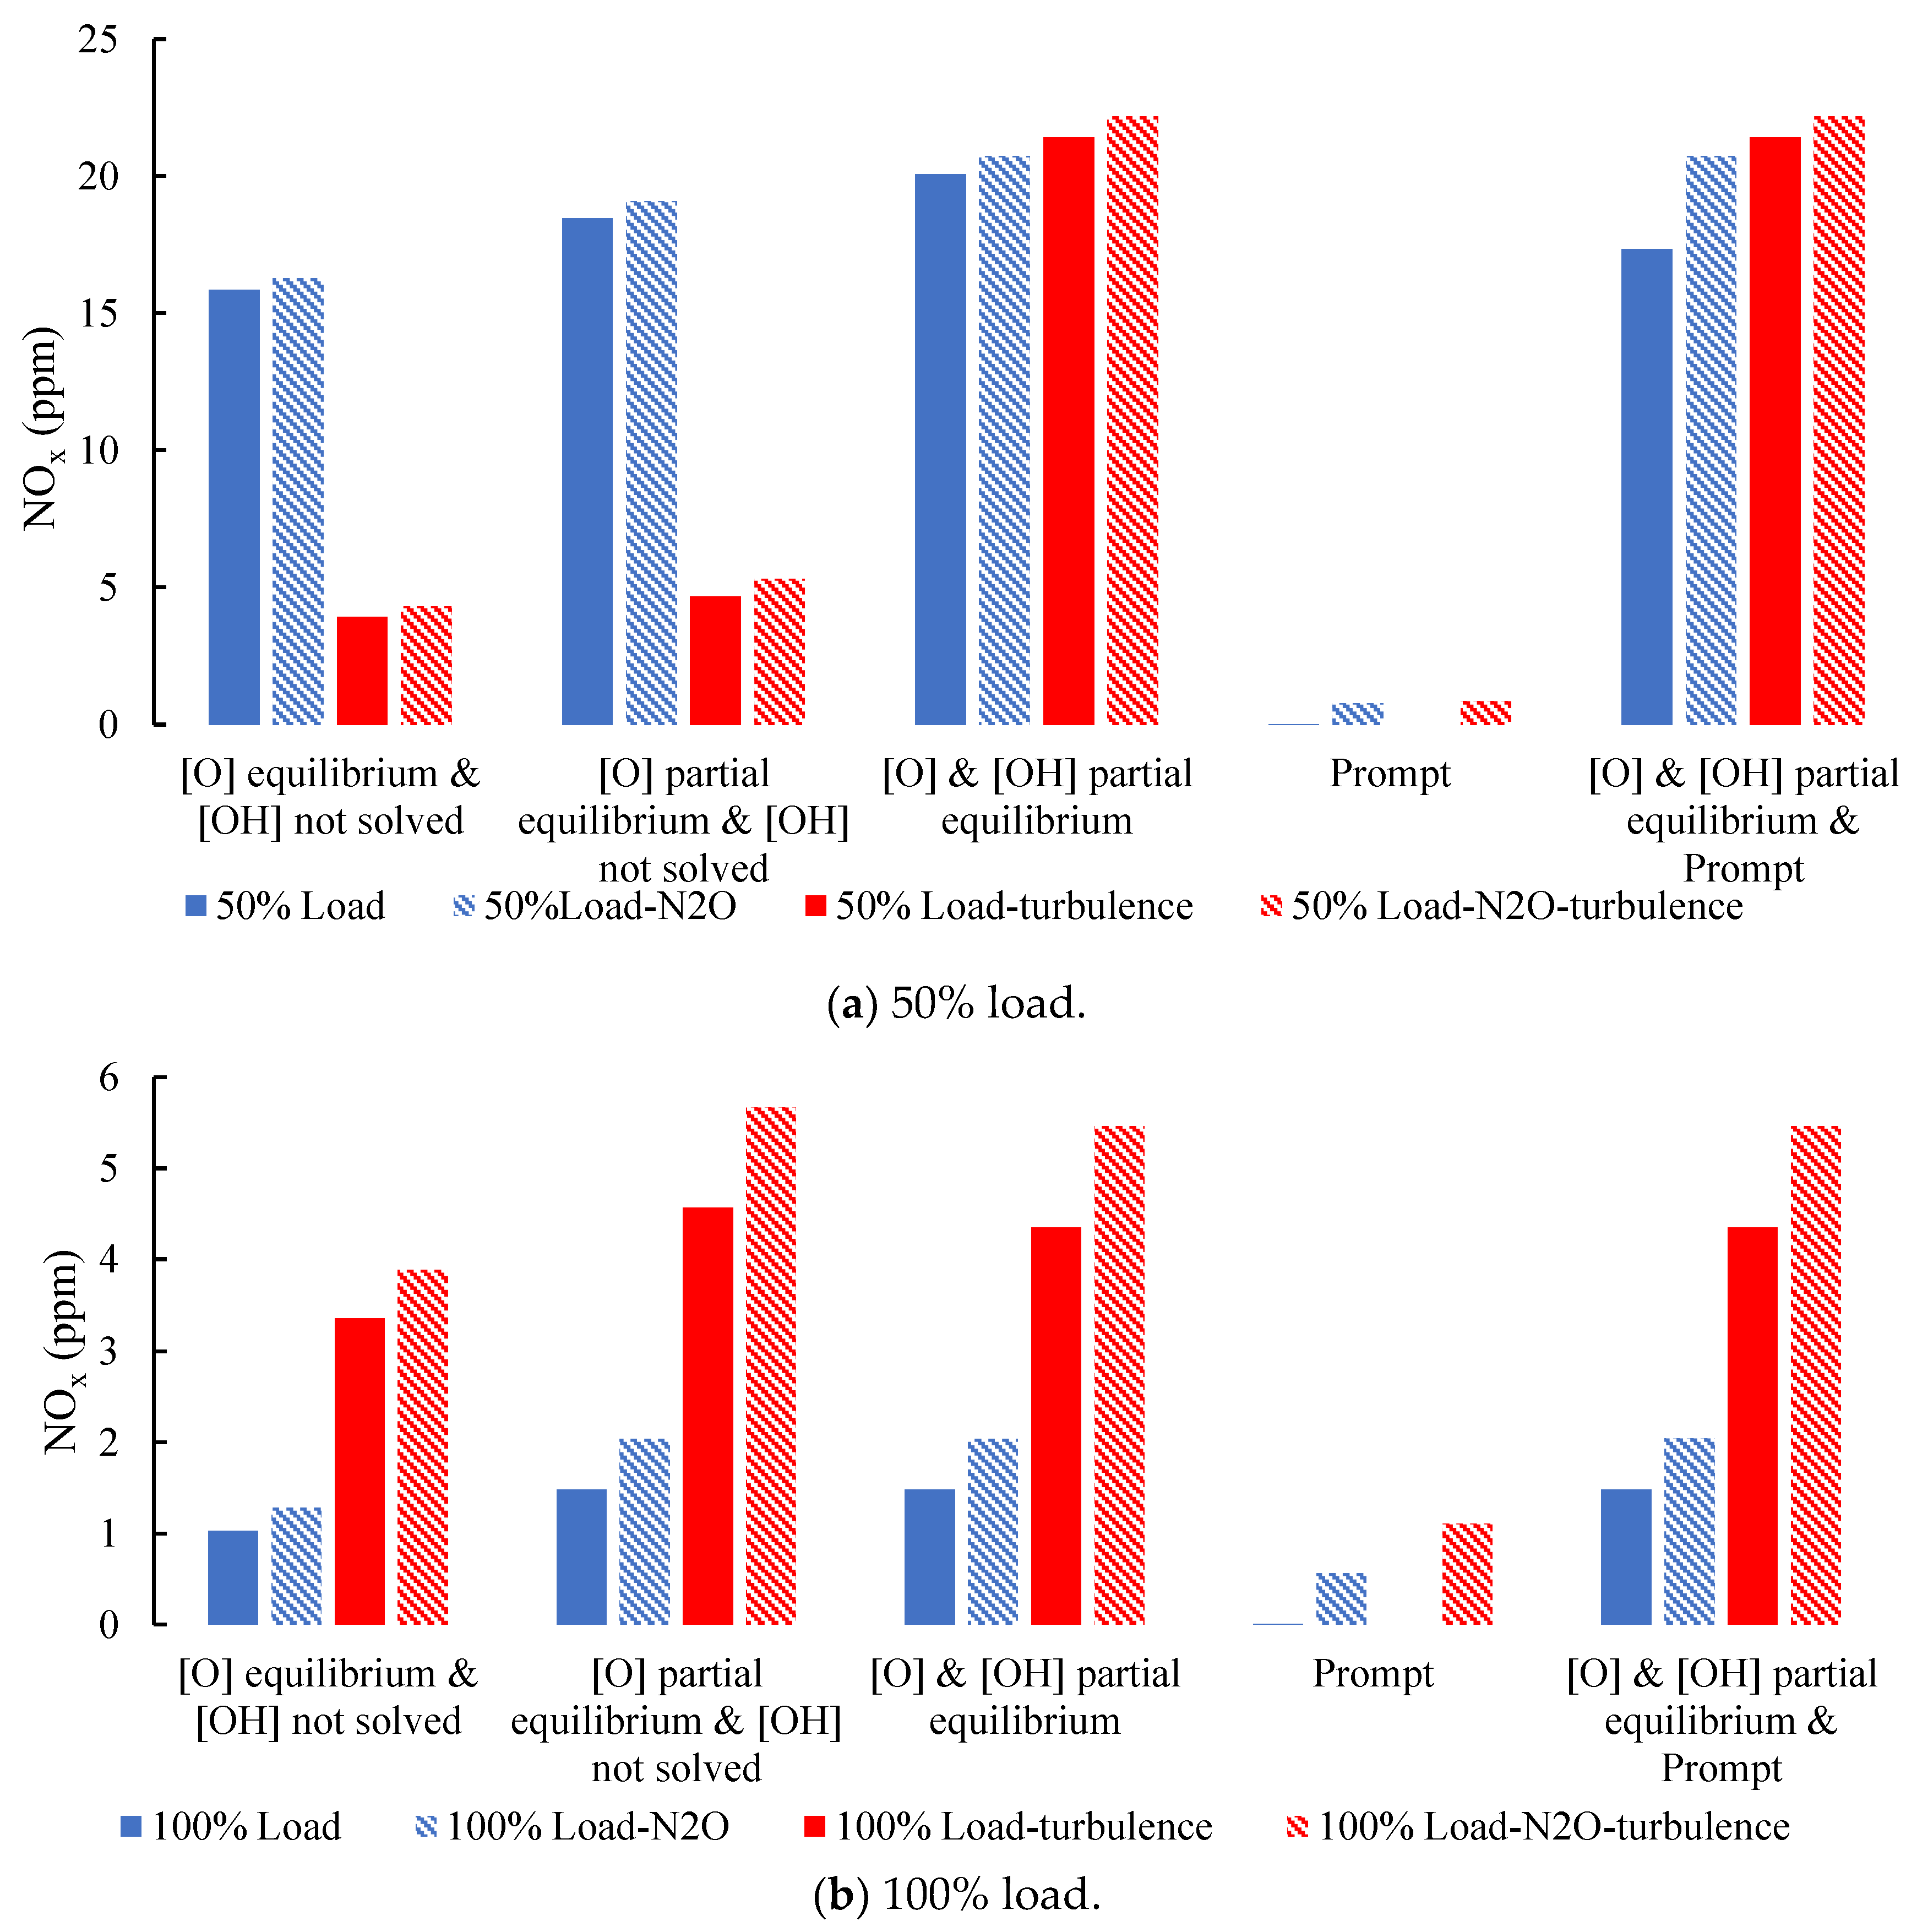
2O intermediate pathway and the turbulence–chemistry interaction model are then introduced as supplementary models. The outlet NO concentrations obtained under different model combinations are compared, and the results are shown in
Figure 8.
Under the 100% load condition, the predicted NO concentration obtained using the partial-equilibrium assumption for O radicals is consistently higher than that obtained using the equilibrium assumption, regardless of whether the prompt NO model is activated, provided that the thermal NO model is included. This is because the combustor operates at an overall high-temperature level under full-load conditions, leading to a pronounced super-equilibrium overshoot of O radicals. By incorporating the third-body effect in the O2 dissociation–recombination process, the partial-equilibrium assumption more accurately captures this overshoot phenomenon and therefore corrects the underestimation of the NO formation rate associated with the equilibrium assumption.
In addition, except for the case in which only the prompt NO model is activated, the supplementary models show a consistent influence on the predicted NO concentration. The lowest NO level is obtained when no supplementary model is included, followed by the case with only the N2O intermediate pathway activated, then the case with only the turbulence–chemistry interaction model activated. The highest NO concentration is predicted when both supplementary models are activated simultaneously. This trend indicates that, under the high-temperature environment at 100% load, the N2O intermediate pathway serves as an important NO formation route. Meanwhile, turbulence–chemistry interaction, represented through the PDF model, captures the enhancement of reaction rates caused by high-temperature fluctuations and is therefore also a key factor contributing to the increase in predicted NO emissions.
However, when the baseline model includes only prompt NO and the N2O intermediate pathway is not activated, the predicted outlet NO concentration is several orders of magnitude lower than that obtained in the conventional model combinations. Even when the N2O pathway is included, the outlet concentration remains only around 1 ppm, representing the lowest prediction level among the considered cases. This is mainly because the initiation of prompt NO depends on the reaction between CH radicals and N2. Under the 100% load condition, the combustor operates closer to a lean premixed combustion mode, resulting in extremely low CH radical concentrations. As a result, the prompt NO pathway cannot be effectively activated.
Once the thermal NO model is included in the baseline model, activating or deactivating the prompt NO model has almost no influence on the predicted results. The fundamental reason is that, under the high-temperature environment at 100% load, thermal NO formation becomes overwhelmingly dominant, and its reaction rate is much higher than that of the prompt NO pathway. Therefore, the contribution of prompt NO is negligible in the total NO formation, and no obvious additive effect is observed between the two models.
Under the 50% load condition, the behavior differs markedly from that observed at 100% load. When the thermal NO model does not solve for the OH radical concentration while the turbulence–chemistry interaction model is activated, the predicted outlet NO concentration decreases sharply to only about 20% of the value obtained when OH is included. This pronounced reduction can be attributed primarily to the characteristics of the locally fuel-rich, high-temperature region generated by the pilot burner. In this region, the OH concentration is much higher than the O concentration, as shown in
Figure 6 and
Figure 9, indicating the presence of a substantial OH radical pool. Under such fuel-rich conditions, the reaction N + OH → H + NO in the extended Zeldovich mechanism becomes increasingly important for NO formation. Therefore, neglecting OH removes an important contribution to thermal NO production. In addition, the PDF-based turbulence–chemistry interaction treatment evaluates the mean NO source term by integrating the nonlinear instantaneous reaction rate over the prescribed distributions of the fluctuating thermochemical variables. Consequently, the resulting mean NO formation rate reflects the combined effects of fluctuations in temperature and local species concentrations rather than the reaction rate evaluated solely at their mean values. In the present 50% load case, this PDF averaging further decreases the predicted NO formation rate when the OH pathway is excluded.
When the thermal NO model includes the solution of the OH radical concentration, the enhancement effect of the two supplementary models on the predicted NO concentration becomes much weaker. At 50% load, activating the N2O intermediate pathway alone, the turbulence–chemistry interaction model alone, and both models simultaneously increases the predicted NO concentration by approximately 11%, 15%, and 19%, respectively. By contrast, under the 100% load condition, the corresponding increases reach 38%, 194%, and 269%, respectively. Although the overall trend remains similar, the contribution of the supplementary models is much smaller at 50% load. This difference can be explained by two main factors. First, under the 50% load condition, NO formation is mainly governed by the OH-related pathway in the localized fuel-rich, high-temperature core region. As a result, the N2O intermediate pathway and the amplification effect caused by high-temperature turbulent fluctuations become secondary contributors. Second, the N2O intermediate pathway is favored under high-pressure and oxygen-rich conditions. In the localized fuel-rich region generated by the pilot burner, the limited oxygen availability suppresses the contribution of this pathway.
4. Comparison with Field Test Data
Based on the above computational results, it can be seen that thermal NO is the absolutely dominant NOx formation mechanism in the present gas turbine and is highly sensitive to operating load. The radical concentration assumption is a key factor affecting the prediction accuracy of thermal NO. When the partial-equilibrium assumption for O radicals is used instead of the equilibrium assumption, the predicted outlet NO increases by 16.46% and 43.69% at 50% and 100% load, respectively, effectively correcting the underestimation of the formation rate. In addition, although the overall OH concentration in the combustor is extremely low at 100% load and this pathway can be neglected, the OH concentration is high in the local fuel-rich region at 50% load. After activating the OH pathway, the predicted NO further increases by 8.67%. Therefore, only when the partial-equilibrium assumptions for both [O] and [OH] radicals are adopted can the significant differences in radical concentrations and reaction pathways caused by variations in pilot ratio under different load conditions be effectively covered, thereby ensuring prediction accuracy over the full operating range. Prompt NO formation is extremely limited under the present lean premixed combustion conditions, remaining on the order of 10−3 ppm, and its contribution to the total emissions can be completely neglected. The N2O intermediate pathway and the turbulence–chemistry interaction model also make non-negligible contributions to NOx formation under the high-temperature full-load condition and should therefore be considered in numerical calculations.
Based on these findings, this study adopts the thermal NO mechanism with partial-equilibrium assumptions for both O and OH radicals as the core framework. The contributions of the N2O intermediate pathway and turbulence–chemistry interaction are also included under the high-temperature full-load condition. Numerical calculations are then conducted for the load-ramping process of this small F-class gas turbine, as well as for common pilot-ratio adjustment conditions at 50% and 100% load. Before comparing the numerical results with the field test data, the measurement basis of the two datasets should be clarified. Both the calculated and measured NOx concentrations discussed in this study are expressed on a dry basis and corrected to a reference oxygen concentration of 15 vol.% O2. Therefore, all NOx concentrations are reported as ppmvd at 15% O2, ensuring a consistent basis for the comparison between numerical predictions and field measurements.
The physical quantity solved in the CFD post-processing is the molar fraction of NO, whereas the measured values from the flue gas analyzer of the gas turbine unit are usually calibrated as NOx, expressed as NO2 equivalent. Since the NO2/NOx volume ratio in gas turbine exhaust is generally lower than 0.05, and the normalization adopted in this study mainly focuses on relative variation trends, the calculated NO concentration is directly treated as the NOx concentration for comparison. This approximation does not affect the normalized trends or the main conclusions of this study.
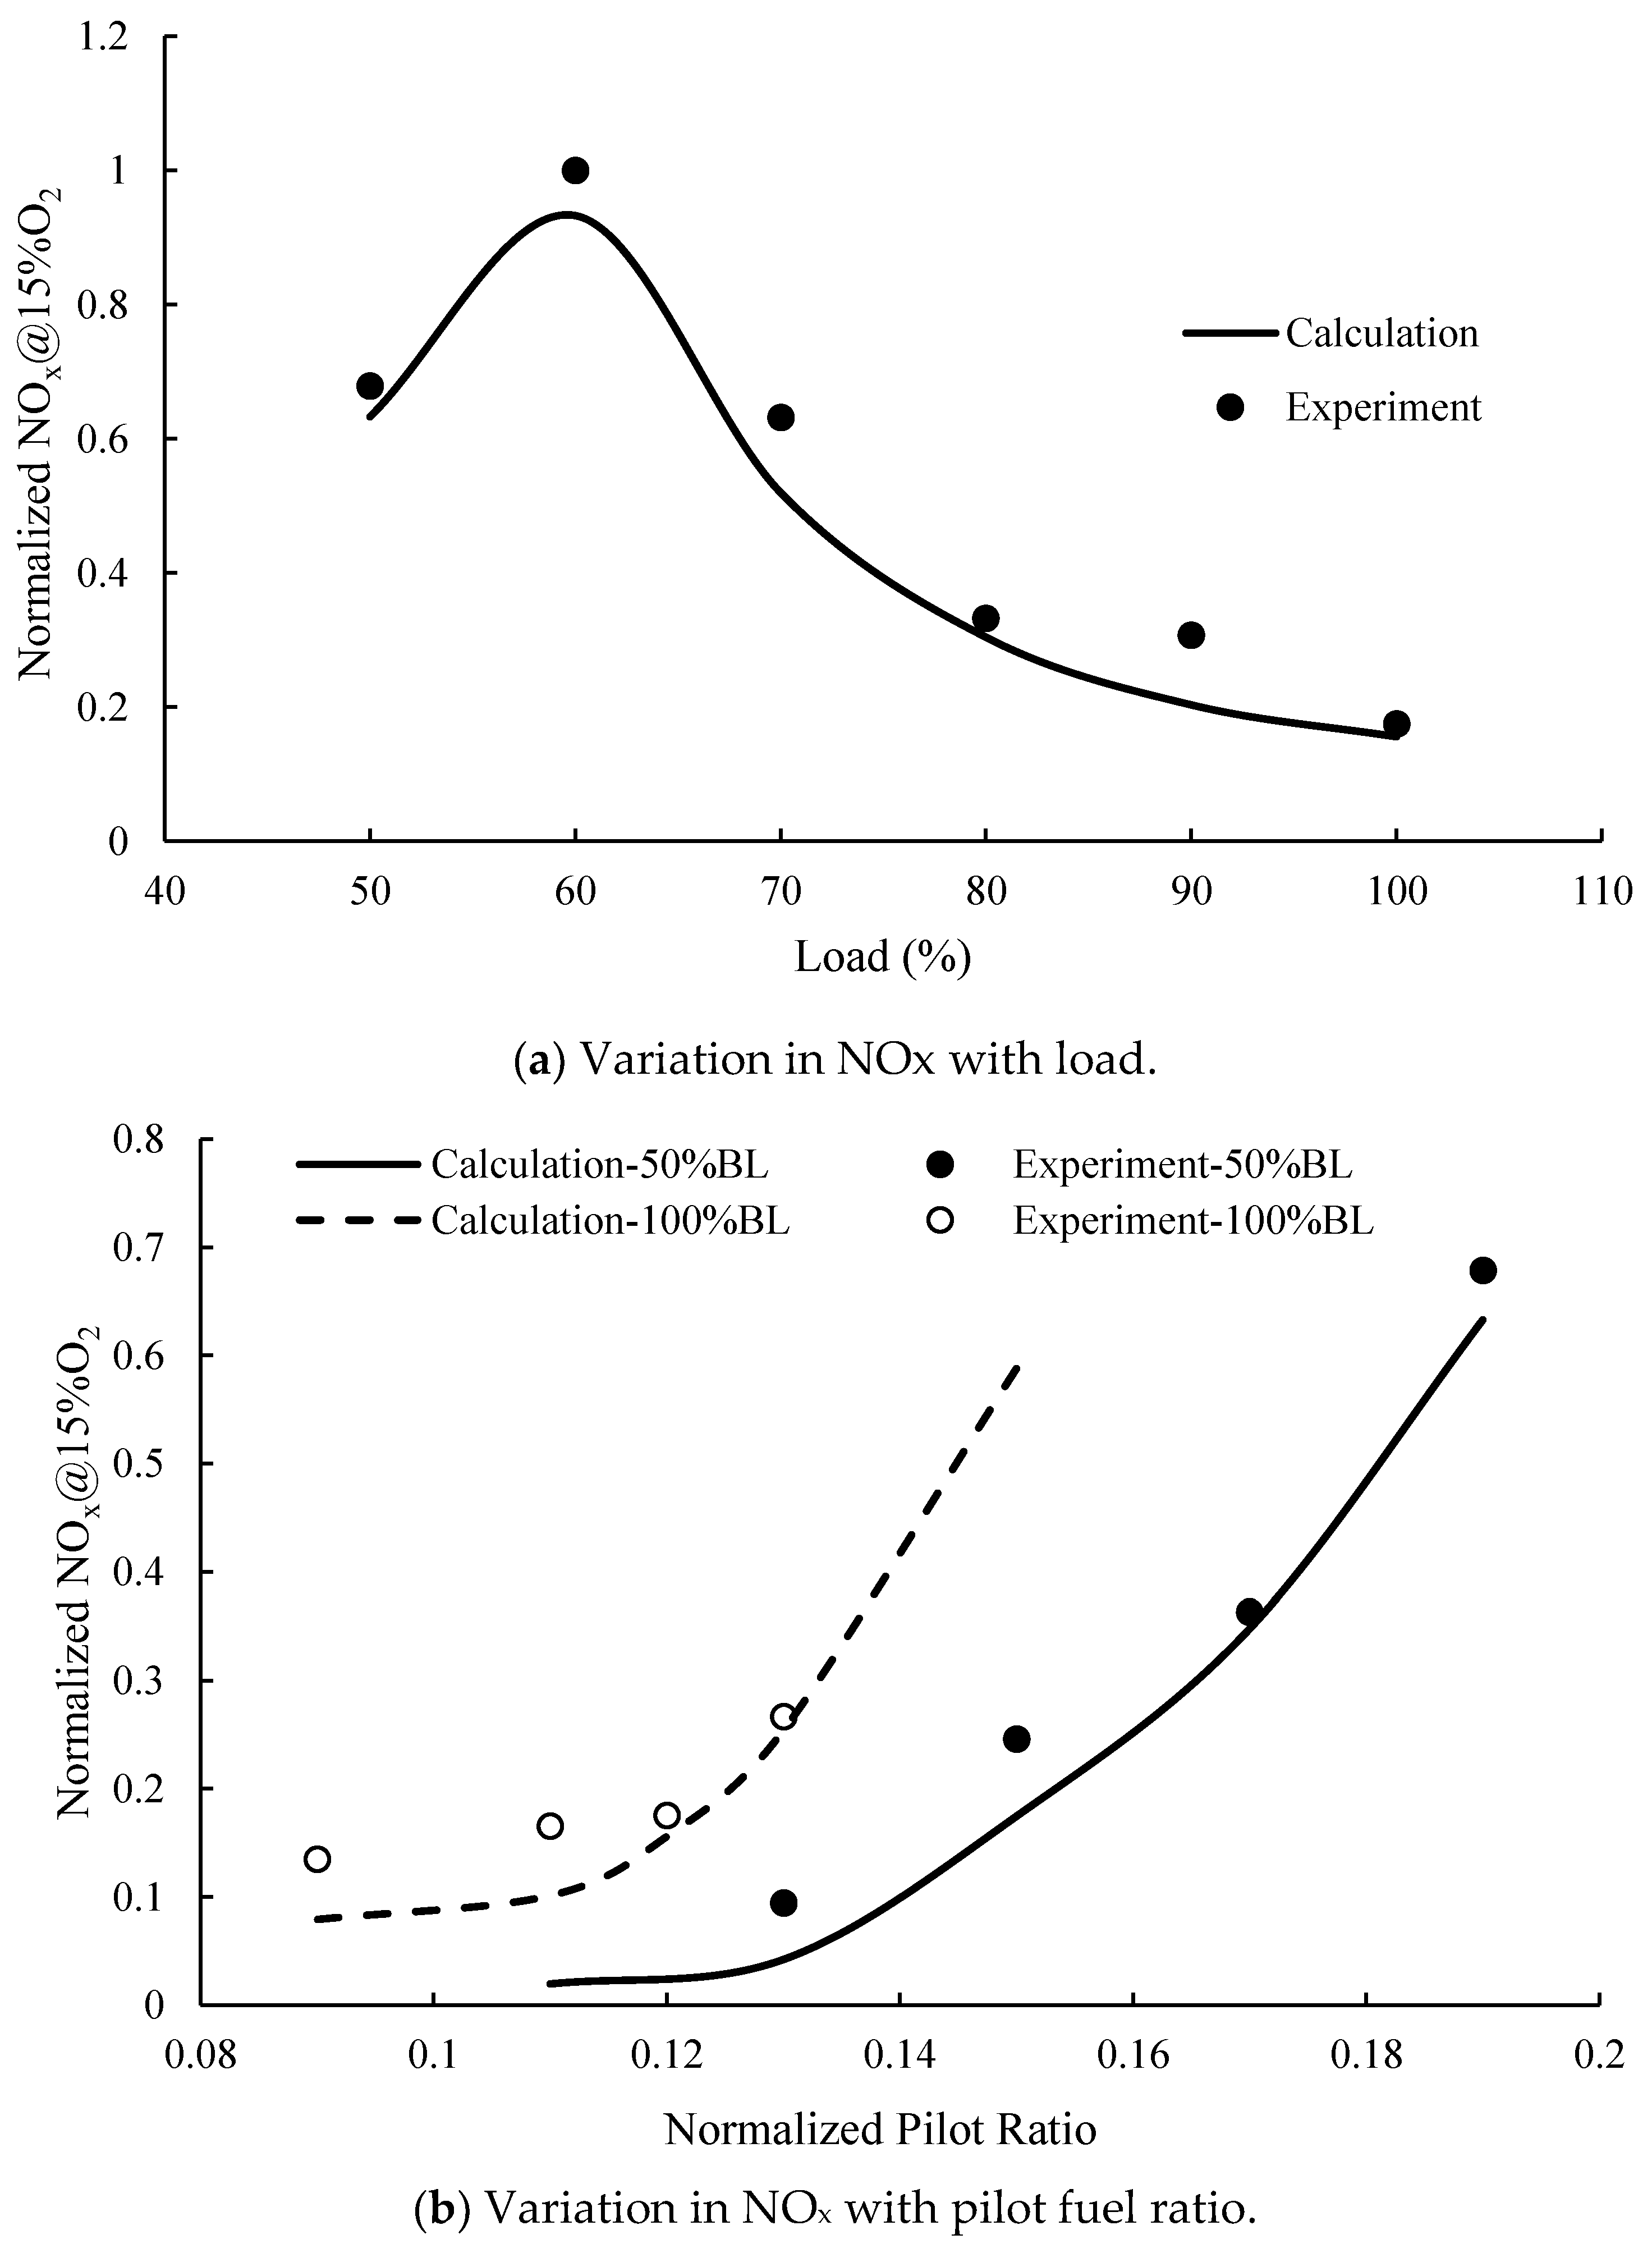
The comparison between the calculated results and the field test data is shown in
Figure 10. All NO
x data are normalized by the maximum value in the figure, namely the measured value of the gas turbine unit at 60% load. It can be seen that, although the recommended model settings described above are adopted, the calculated values under all operating conditions are still systematically lower than the corresponding field test data. This systematic deviation may be attributed to several factors. First, although the partial-equilibrium assumption is superior to the equilibrium assumption, it may still fail to fully capture the super-equilibrium radical concentrations in the high-temperature core region formed by the pilot burner. Second, in engineering measurements, flue gas sampling is usually conducted at the exhaust duct section, whereas the CFD data are extracted from the combustor outlet section. The difference in sampling locations may also introduce a certain systematic deviation. Third, the calculated species is pure NO, while the measured NO
x is usually converted to NO
2 equivalent. This inherent difference in measurement basis is also one reason why the calculated values are lower.
For the load-ramping process, as shown in
Figure 10a, a relatively high pilot fuel ratio was adopted at 60% load due to the actual site conditions during commissioning, resulting in the highest NO
x emission at this load point. As the load further increases and the pilot ratio correspondingly decreases, NO
x emissions gradually decrease, and the normalized NO
x emission at full load does not exceed 0.2. In terms of prediction accuracy, except for the 90% load condition, where the calculation deviation reaches 33.8%, the deviations under all other operating conditions are less than 18%. The relatively large deviation at 90% load occurs in the transition region from a higher pilot ratio to a lower pilot ratio. In this region, the equivalence-ratio distribution and flame structure change significantly. This may enhance local temperature fluctuations and unsteady flame–flow interactions. Thermal NO formation is highly sensitive to temperature. As discussed in
Section 1, its formation rate increases rapidly with increasing temperature. Therefore, unresolved local temperature peaks may result in an underprediction of the mean NO formation rate. The steady RANS approach represents the mean flow and temperature fields but cannot explicitly resolve these transient structures. This limitation may partly contribute to the larger deviation at a 90% load. In contrast, the prediction deviations at the other load conditions remain below 18%, indicating that the present method provides a reasonable engineering approximation for the quasi-steady operating conditions investigated here.
For the variable pilot-ratio conditions, as shown in
Figure 10b, the predicted NO
x values agree well with the measured data under high pilot-ratio conditions, indicating relatively high prediction accuracy. However, after the pilot ratio is reduced, the numerical results become significantly lower than the field test data. The increased deviation under low pilot-ratio conditions can mainly be attributed to the following reasons. At low pilot ratios, the combustion mode becomes closer to homogeneous lean premixed combustion, the peak flame temperature decreases, and the thermal NO
x formation rate is greatly reduced. Under such high-temperature operating conditions, the relative influence of measurement boundary conditions and sampling effects becomes more pronounced. In addition, under low pilot-ratio and high premixing conditions, the partially premixed combustion model may have limitations in describing the flame-front structure and turbulent mixing, leading to a more significant underestimation of NO
x formation.
5. Discussion
This study systematically evaluates the effects of the thermal NO, prompt NO, N2O intermediate, and turbulence–chemistry interaction models on NOx predictions for an F-class gas turbine using a decoupled NO post-processing framework. By comparing different model combinations at 50% and 100% load and subsequently validating the recommended combination against field measurements over a wider range of load and pilot-fuel-ratio conditions, the present analysis provides insight into how the relative importance of individual NO formation mechanisms changes with operating condition.
Thermal NOx is the dominant contributor and is highly sensitive to load variation. Under the 50% load condition, the pilot fuel ratio is much higher than that at 100% load, resulting in the formation of a local high-temperature, fuel-rich core region in the upstream part of the combustor. As a result, the outlet NOx concentration is more than 12 times higher than that under the full-load condition. The modeling approach for radical concentrations directly affects the prediction accuracy. When the partial-equilibrium assumption for O radicals is used instead of the equilibrium assumption, the predicted outlet NOx increases by 16.46% and 43.69% under the 50% and 100% load conditions, respectively, effectively correcting the underestimation of the O-atom overshoot effect by the equilibrium assumption. Further introducing the partial-equilibrium assumption for OH radicals under the 50% load condition increases the predicted NOx by an additional 8.67%. This is because the OH concentration in the fuel-rich pilot region is much higher than the O concentration, making the reaction N + OH → H + NO an important NO formation pathway. In contrast, under the 100% load condition, the overall OH concentration is extremely low, and the contribution of this pathway is negligible. Therefore, only by adopting the partial-equilibrium assumptions for both O and OH radicals can the significant differences in reaction pathways under different load conditions be properly captured.
The contribution of prompt NOx is negligible under lean premixed combustion conditions. Prompt NOx formation is limited by the initiation step CH + N2 → N + HCN, which depends on the concentration of CH radicals. Since the CH concentration is extremely low in lean premixed flames, the prompt NOx formation under both load conditions remains on the order of 10−3 ppm, several orders of magnitude lower than thermal NOx. Although prompt NOx formation at 50% load is slightly higher than that at 100% load due to the relatively higher equivalence ratio in the local fuel-rich pilot region, its absolute contribution remains insignificant from an engineering perspective.
The N2O intermediate pathway and the turbulence–chemistry interaction model make non-negligible contributions under the high-temperature full-load condition. At 100% load, separately activating the N2O pathway and the turbulence interaction model increases the predicted NOx by 38% and 194%, respectively, while activating both simultaneously results in an increase of 269%. At 50% load, however, the corresponding increases are reduced to 11%, 15%, and 19%, respectively. This reduced relative contribution is mainly associated with the dominance of the OH-related thermal-NO pathway in the localized fuel-rich, high-temperature pilot region. In addition, the PDF-based turbulence–chemistry interaction treatment yields a smaller enhancement under this condition because the probability-weighted mean NO source term reflects the combined nonlinear effects of temperature and species fluctuations rather than a simple amplification by temperature fluctuations alone.
Comparison with field test data shows that the recommended model combination has engineering applicability, although systematic deviations remain. Based on the dual-radical partial-equilibrium thermal NOx mechanism, with the N2O pathway and turbulence interaction model also included, the prediction deviation is less than 18% for most operating conditions during the load-ramping process, and good agreement is achieved under high pilot fuel ratio conditions in the variable-pilot-ratio cases. However, all calculated values are systematically lower than the measured data. This may be attributed to the fact that the partial-equilibrium assumption still cannot fully capture the super-equilibrium radical concentrations in the high-temperature core region, as well as the difference between the CFD data extraction location, namely the combustor outlet section, and the flue gas sampling location, namely the exhaust duct section. The deviation reaches 33.8% under the 90% load transition condition. This larger deviation may be partly associated with the limitations of the steady RANS method and the single PDF assumption in representing transient flame-structure variations and local thermochemical fluctuations. In contrast, the deviations remain below 18% at the other load conditions, supporting the engineering applicability of the present method for quasi-steady operation. The increased deviation under low pilot fuel ratio conditions is related to the reduced accuracy of the partially premixed combustion model in describing the flame-front structure and mixing process under strongly premixed conditions.
Despite the overall engineering applicability demonstrated above, several challenges remain in the present modeling framework. First, the steady RANS formulation and single PDF treatment are based on time-averaged thermochemical fields and therefore have limited capability to represent transient flame-structure variations and strongly coupled fluctuations of temperature and species concentrations, particularly during load-transition conditions. Second, although the partial-equilibrium treatment improves the estimation of O and OH radical concentrations, it remains an approximate closure and cannot fully reproduce the radical super-equilibrium occurring in highly reactive regions. Third, the partially premixed combustion model becomes less accurate as the combustion mode approaches strongly premixed conditions at low pilot fuel ratios. In addition, the difference between the numerical extraction location and the field sampling location introduces uncertainty into the quantitative comparison. These limitations indicate that further improvements should focus on unsteady combustion simulation, more advanced multivariate PDF treatments, and improved descriptions of radical chemistry. Additional validation under transitional and strongly premixed operating conditions, together with a more consistent treatment of numerical and experimental sampling locations, would further improve the robustness of the proposed framework.