Article

Vegetation Restoration Beneath High-Clearance Flexible Photovoltaic Panels to Reduce Soil Wind Erosion and Promote Soil Improvement


1
College of Desert Control Science and Engineering, Inner Mongolia Agricultural University, Hohhot 010018, China
2
State Key Laboratory of Water Engineering Ecology and Environment in Arid Area, Inner Mongolia Agricultural University, Hohhot 010018, China
3
Institute of Water Resources Science for Pastoral Area, Ministry of Water Resources, Hohhot 010020, China
4
Inner Mongolia Autonomous Region Field Scientific Observation and Research Station for Ecological Environment Change and Integrated Management in the Yellow River “Jiziwan” Region, Hohhot 010020, China
5
Hohhot City Investment and Construction Group Co., Ltd., Hohhot 010060, China
6
Bureau of Agriculture, Animal Husbandry and Science and Technology of Zhuozi County, Ulanqab 012300, China
*
Author to whom correspondence should be addressed.
Processes 2026, 14(14), 2332; https://doi.org/10.3390/pr14142332
Submission received: 21 June 2026 / Revised: 13 July 2026 / Accepted: 16 July 2026 / Published: 17 July 2026
(This article belongs to the Special Issue Research on Photovoltaic Arrays and Dust Deposition)

Abstract

Clarifying how vegetation restoration regulates wind erosion, sediment redistribution, and soil improvement is essential for ecological management in desert photovoltaic power stations. This study was conducted in a high-clearance flexible-support photovoltaic power station at the edge of the Kubuqi Desert. Three restoration measures were compared: reed mulch combined with Atriplex canescens planting along the panel front edge (M1), A. canescens planting along the panel front edge alone (M2), and reed mulch combined with grass seeding (M3). The panel front-edge zone (QY), under-panel zone (BX), and pedestal zone (JZ) were used as functional units to analyze surface sediment grain-size characteristics, soil moisture, soil nutrients, windbreak efficiency, aerodynamic roughness length, and cumulative sand-fixing efficiency. All restoration measures altered the surface sediment structure, with Mz ranging from 2.005 to 2.364 and D0 from 1.459 to 1.935. Soil moisture ranged from 0.58% to 4.34%, with the highest value occurring in the 20–30 cm layer of QY under M1. M1 also showed higher soil organic matter in QY and JZ, reaching 1.87 and 1.16 g·kg−1, respectively. Windbreak efficiency decreased with height under all measures. M1 maintained the highest and most stable values, decreasing only from 61.16% at 10 cm to 55.52% at 100 cm. The total cumulative sand-fixing efficiency was also highest under M1 (233.66%), while M2 (215.05%) and M3 (214.58%) showed comparable total effects but different zonal responses. Wind-eroded materials shifted from fine-sand dominance toward a higher relative contribution of medium sand, reflecting the reduction in finer transported fractions rather than true grain coarsening. The novelty of this study lies in linking wind-erodible sediment redistribution, soil water and nutrient responses, and windbreak–sand-fixing performance across internal functional zones of a flexible-support photovoltaic array. These results indicate that vegetation restoration in desert photovoltaic power stations should be configured by functional zone, with composite interception at the panel front edge, structural maintenance in the under-panel zone, and cover-based sand trapping in deposition-prone areas.

1. Introduction

Photovoltaic power generation is a major component of low-carbon energy systems [1]. In recent years, photovoltaic development has expanded from industrial and urban land to arid and semiarid regions [2,3]. North Africa and the Sahara margins, West Asia and the Middle East, inland Australia [4], the Southwestern United States, the Atacama Desert of South America [5], and inland Central Asia all have strong solar radiation, frequent sunny days, and long annual periods suitable for power generation [6,7,8]. These regions also provide large contiguous land areas and relatively favorable site accessibility [9,10], which has supported the rapid expansion of large-scale ground-mounted photovoltaic projects [11]. Improvements in module efficiency, support structures, inverter technologies [12], and energy-storage systems, including battery storage and thermal storage, have further increased the feasibility of photovoltaic deployment in desert and Gobi regions [13,14]. As this expansion continues [15], photovoltaic power stations in drylands face a dual demand: maintaining power-generation efficiency while keeping the ground surface stable and ecologically secure [16].
Arid regions are rich in solar resources, but their surface environments are fragile [17]. Sandy and gravelly surfaces dominate these landscapes [18,19], while fine particles, organic matter, and vegetation cover are limited. The ground surface is highly sensitive to disturbance [20]. Wind erosion and strong evaporation remove fine particles and associated nutrients from the surface layer [21], accelerate surface degradation, and increase the difficulty of ecological restoration [22]. In photovoltaic power stations, construction and operation both reshape the original surface structure and local hydrothermal conditions [23]. Surface clearing, excavation, and compaction during construction directly intensify soil disturbance [24]. After installation, panel layout changes shading, rainfall redistribution, and near-surface airflow, which further affect evaporation, sediment transport, and plant growth [25]. In arid environments, photovoltaic power stations function not only as energy facilities but also as artificial surface systems in which engineering operation and ecological stability are closely linked.
Research on desert photovoltaic systems has increasingly focused on microclimate regulation, soil moisture, vegetation recovery, and aeolian sediment transport. Photovoltaic arrays can modify near-surface processes through shading, runoff concentration, and airflow disturbance. Panel shading alters the surface energy balance and reduces evaporation [26,27]. Runoff and drip concentration from panel edges redistribute water input and change the spatial pattern of soil moisture and plant establishment. Panel rows and support structures disturb incoming airflow, modify wind-speed profiles, and affect sediment transport, deposition, and local surface stability. Existing work has mostly examined single processes or whole-station responses. The links among airflow disturbance, soil stability, water redistribution, and vegetation recovery within different parts of the array remain less clear. This gap is more evident in flexible-support photovoltaic systems, where the panel front-edge zone, under-panel zone, and pedestal zone differ in incoming-flow disturbance, sediment deposition, runoff redistribution, and surface exposure. Representative studies on photovoltaic–ecosystem interactions in arid and semiarid regions are summarized in Table 1.
These studies show that photovoltaic arrays can change near-surface microclimate, soil water conditions, vegetation establishment, and aeolian sediment transport. However, most studies have examined either a single ecological process or the overall response of a photovoltaic power station. Less attention has been given to how wind-erodible sediment redistribution, soil moisture, nutrient accumulation, and windbreak–sand-fixing performance are linked across internal functional zones of flexible-support photovoltaic arrays. This gap is important because the panel front-edge zone, under-panel zone, and pedestal zone differ in incoming-flow disturbance, runoff redistribution, surface exposure, and sediment deposition. A zonal analysis is needed to determine how different restoration measures function within the array and to provide a basis for zone-specific vegetation restoration.
Based on these gaps, this study examined three vegetation restoration measures in a high-clearance flexible-support photovoltaic power station at the edge of the Kubuqi Desert. The objectives were to compare surface sediment grain-size characteristics, soil moisture, soil nutrients, windbreak efficiency, aerodynamic roughness length, and cumulative sand-fixing efficiency across the panel front-edge zone, under-panel zone, and pedestal zone; to identify how different restoration measures regulate soil physical structure, soil improvement, and wind–sand protection within the photovoltaic array; and to provide a basis for zone-specific vegetation restoration in desert photovoltaic power stations. The novelty of this study lies in shifting the evaluation of vegetation restoration from a whole-station or single-indicator assessment to a functional-zone framework that links wind-erodible sediment redistribution, soil water and nutrient responses, and windbreak–sand-fixing performance within a flexible-support photovoltaic array.

2. Materials and Methods

2.1. Overview of the Study Area

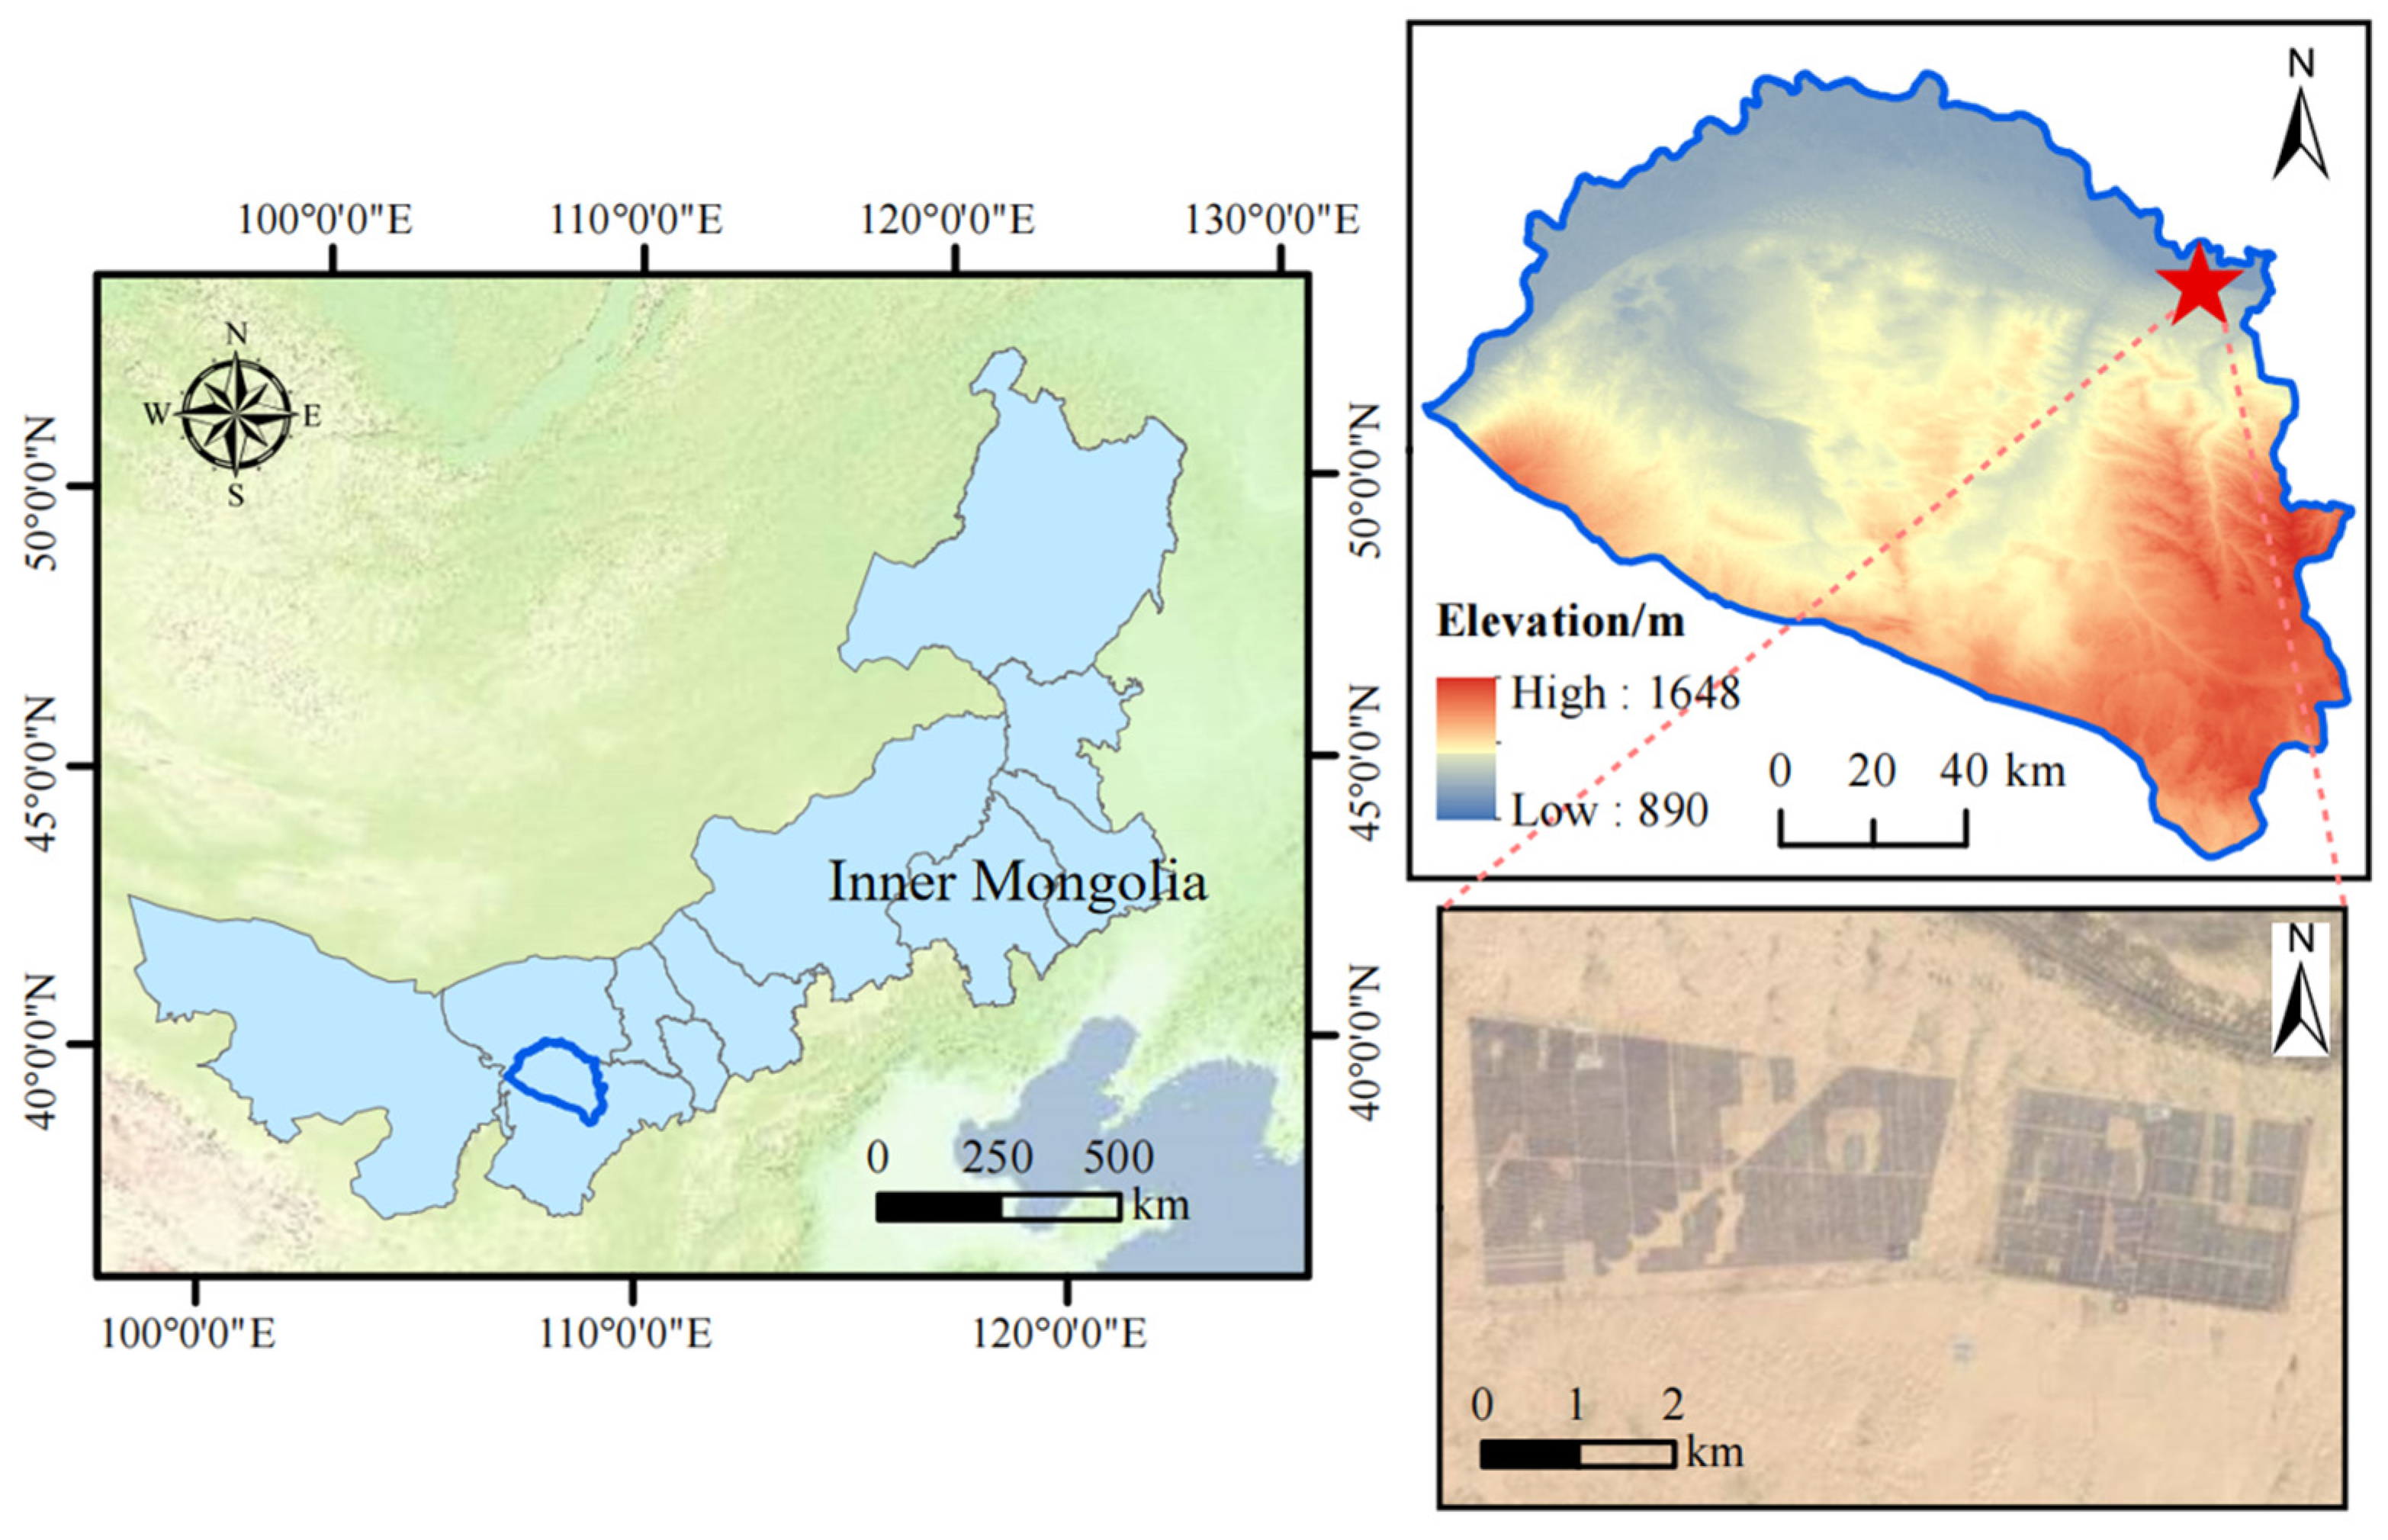
The study area is located in a photovoltaic power station south of the Yanhuang Highway in Duguitala Town, Hanggin Banner, Ordos City, at the edge of the Kubuqi Desert (37°20′–39°50′ N, 107°10′–111°45′ E; ca. 1136 m a.s.l.; Figure 1). The desert slopes from west to east, from the Ordos Plateau to the Yellow River floodplain. Dunes are widely distributed and include barchan dunes, barchan dune chains, grid dune chains, compound dunes, and parabolic dunes, with heights of 10–60 m. The region has a temperate continental monsoon climate, with a mean annual temperature of 5–8 °C, annual precipitation of 150–400 mm, annual evaporation of 2100–2700 mm, and annual total solar radiation of about 597 kJ·cm−2. Rainfall is concentrated from June to September, whereas wind–sand activity is strongest from November to May under prevailing west and northwest winds. The soil is mainly aeolian sandy soil, and the vegetation is dominated by desert shrubs and semi-shrubs, including Salix psammophila, Corethrodendron scoparium, and Caragana korshinskii.

2.2. Experimental Design and Plot Establishment

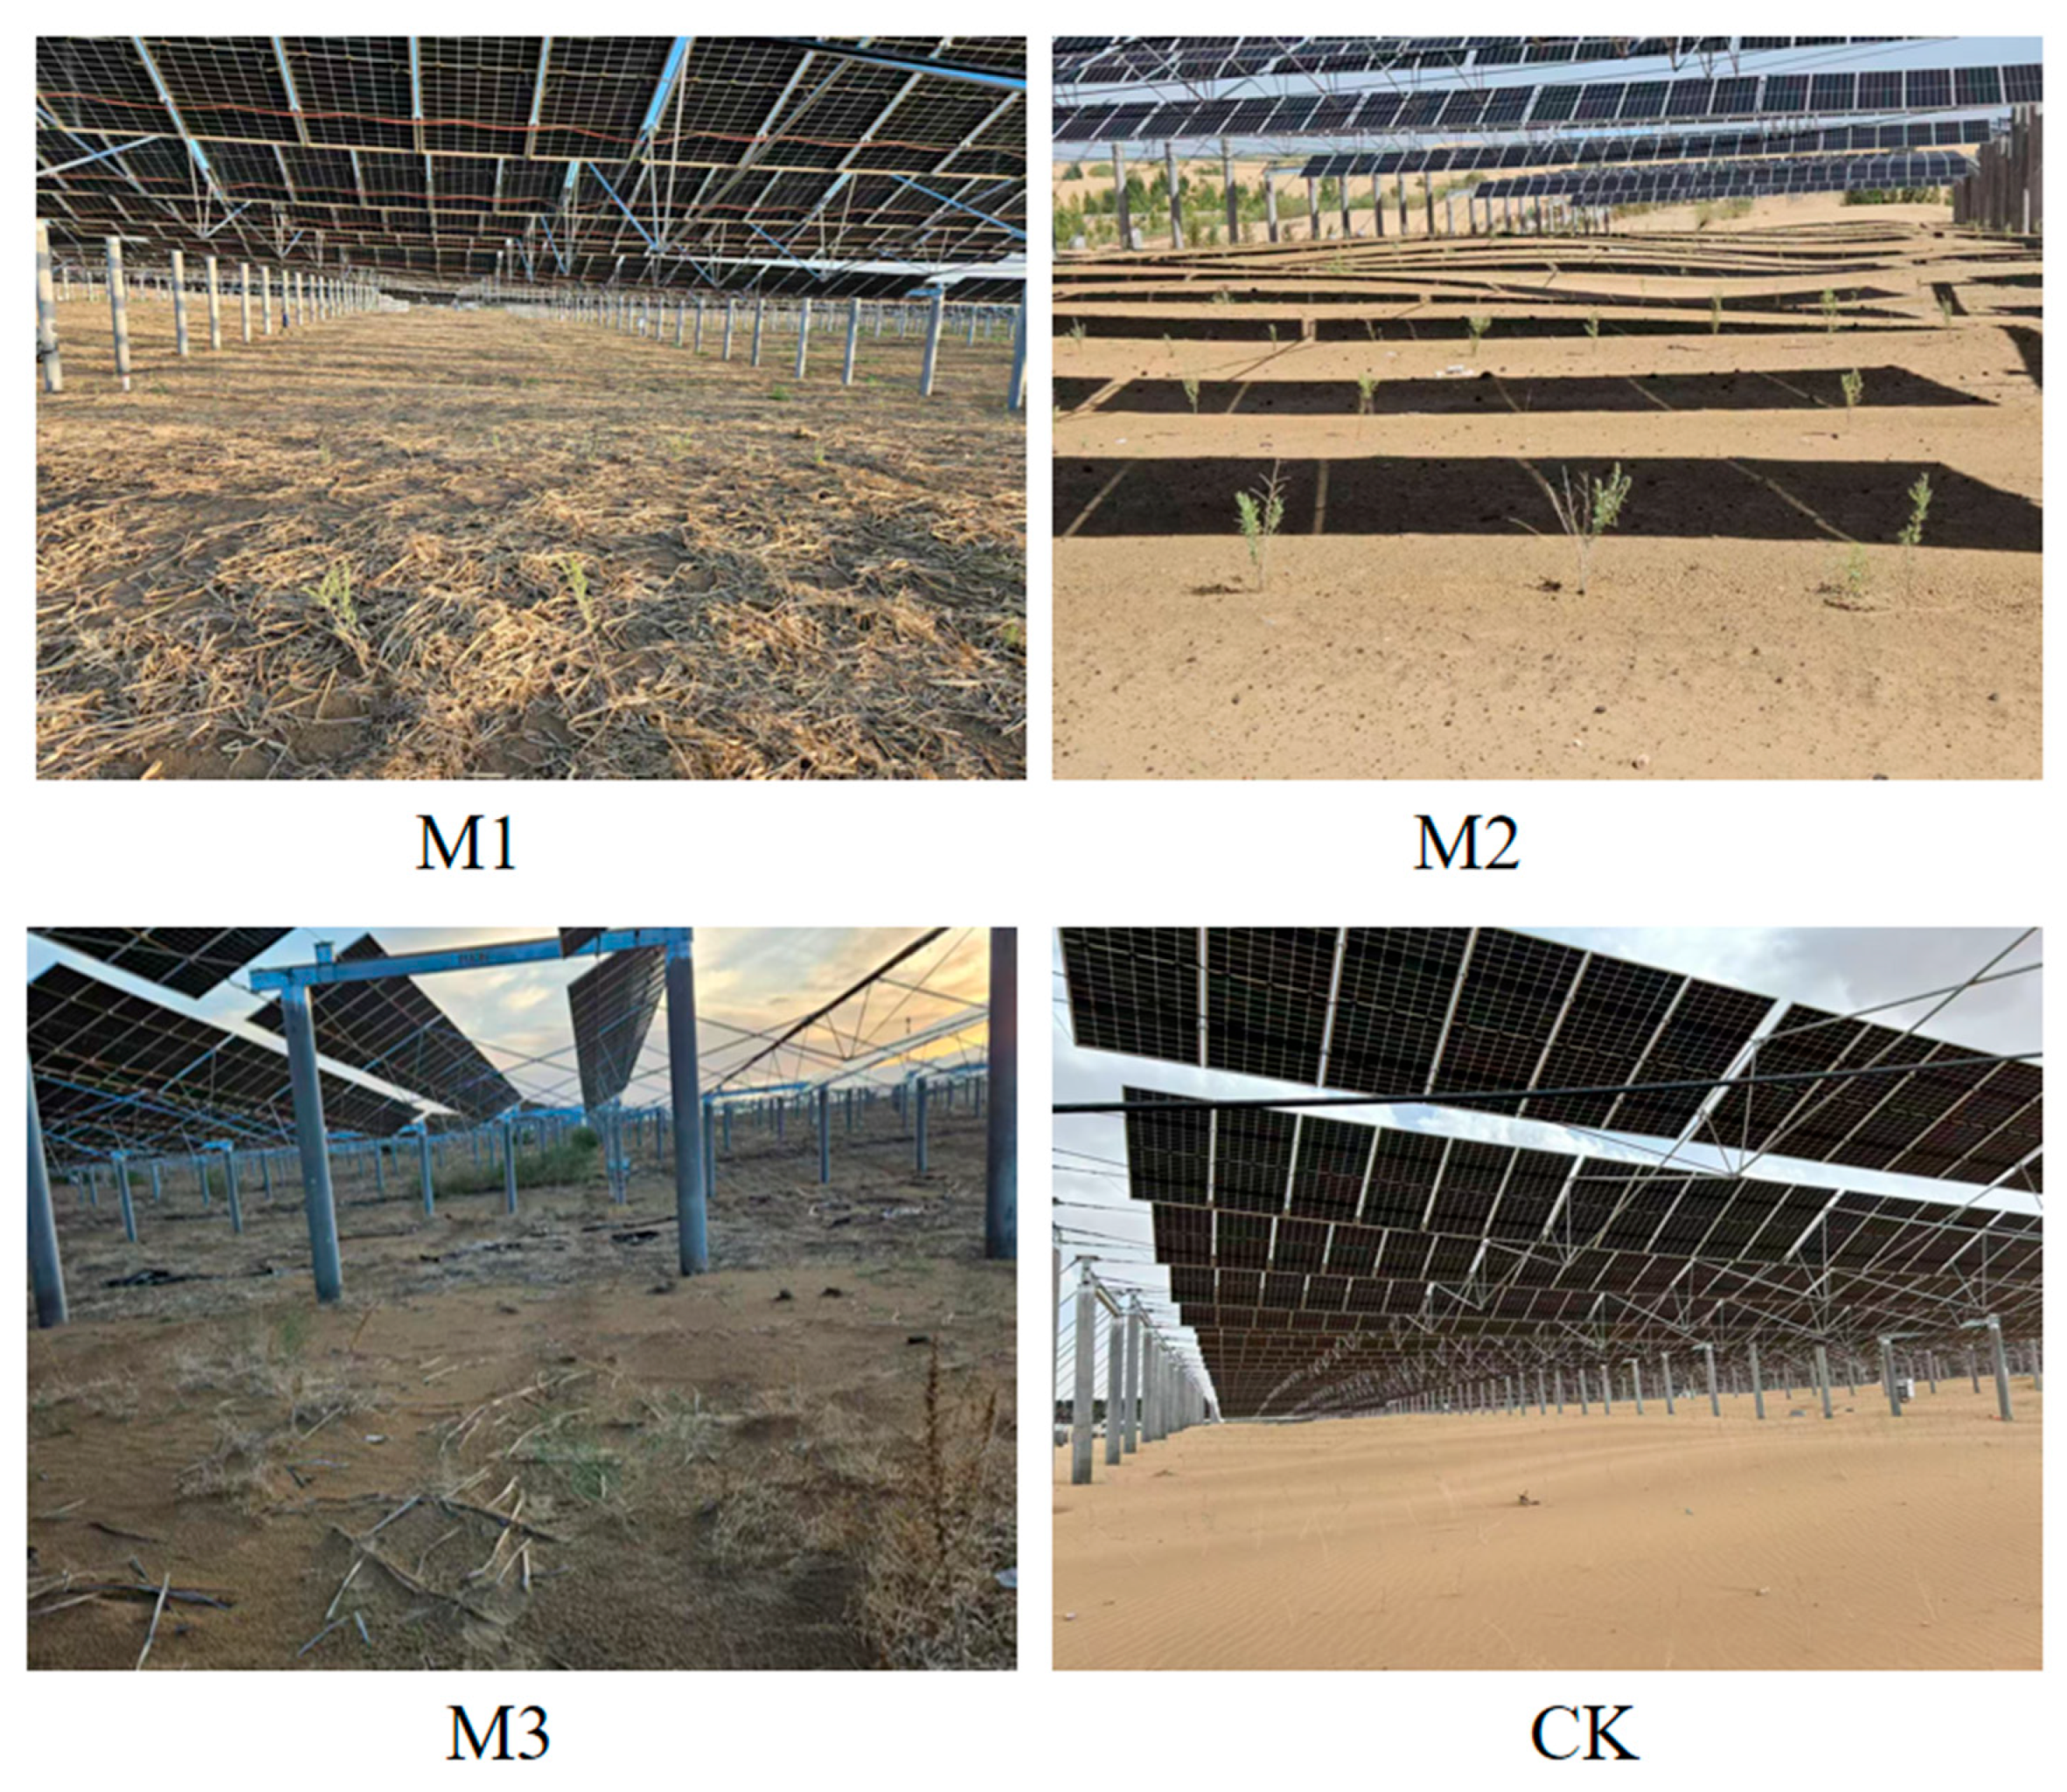
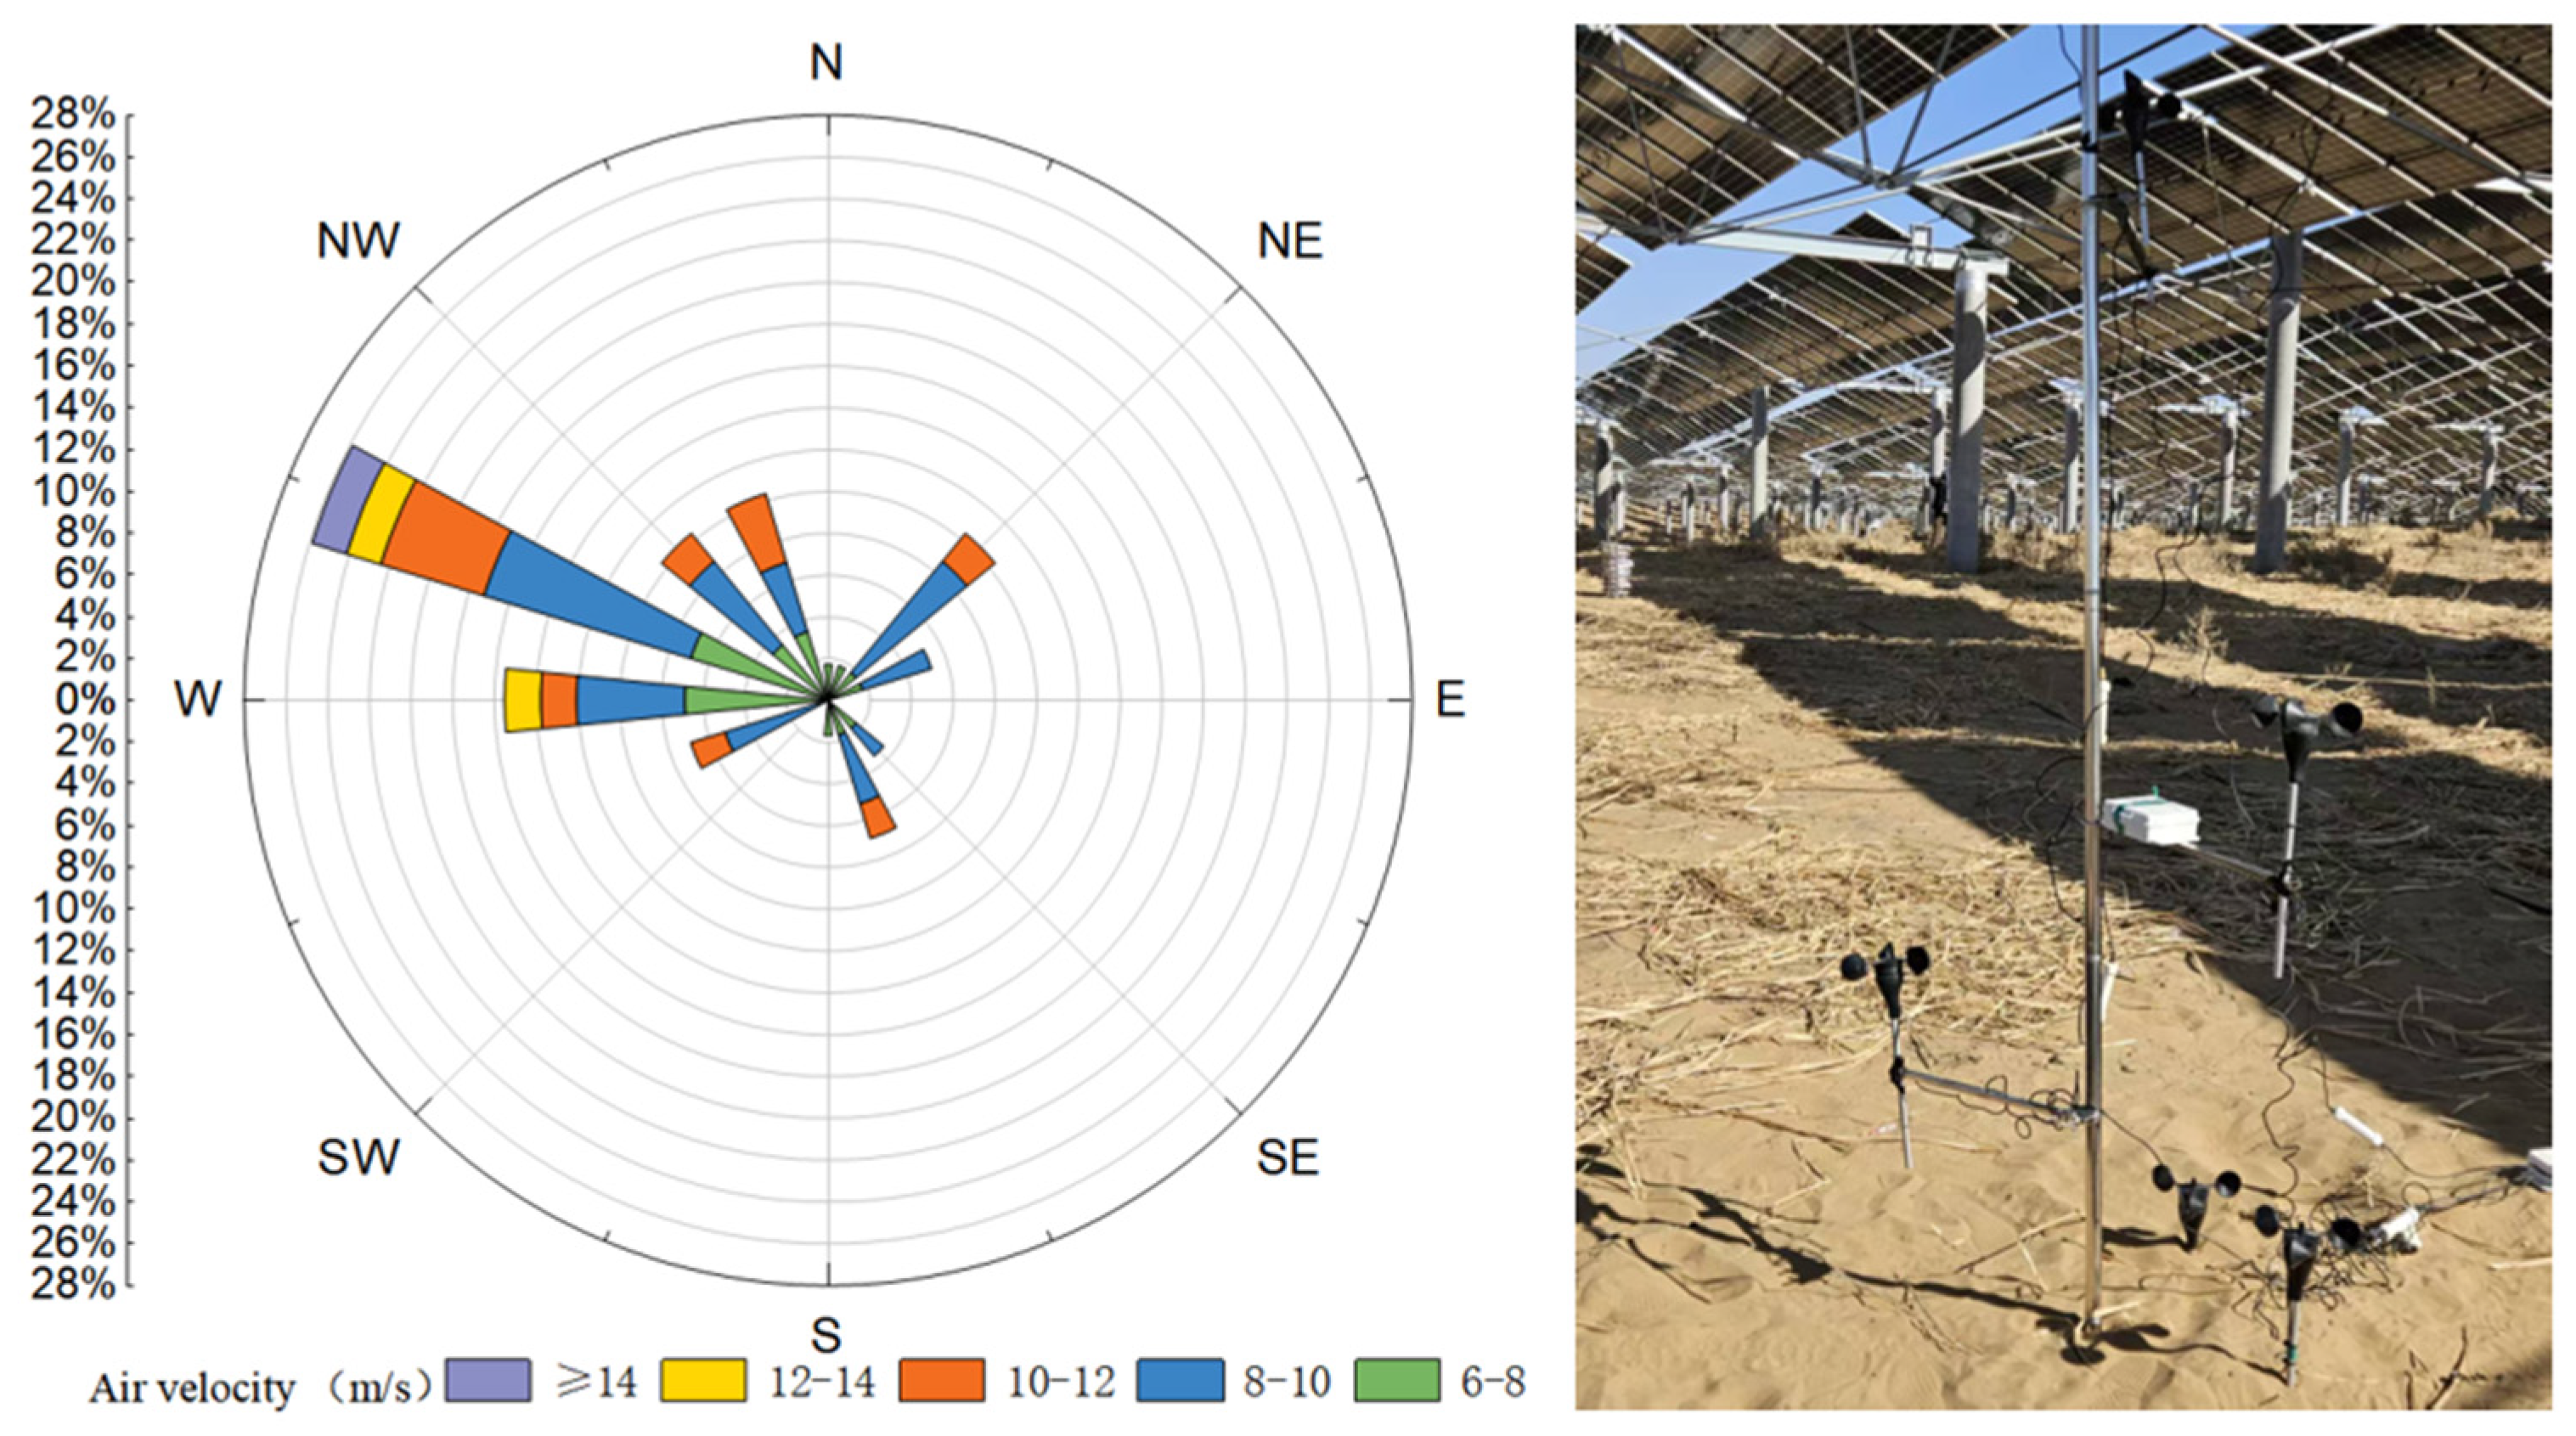
This study was conducted in the area covered by flexible-support photovoltaic systems in the Kubuqi Desert. The photovoltaic power station was completed in April 2023. The photovoltaic panels were mounted on a flexible-support system composed of double-layer cable structures and inter-row supports. All panels were arranged facing south, with an east–west span of 30 m. Each span consisted of 30 photovoltaic panels; the spacing between panels in the north–south direction was 2 m, the front edge of the panels was approximately 4.0 m above the ground, and the rear edge was approximately 5.4 m above the ground. To compare the protective effects of different vegetation restoration measures, three comparative plots were established on the northwestern side of the same flexible-support photovoltaic power station, and restoration measures were implemented in all plots in June 2024. The experimental design and field conditions of the vegetation restoration plots are shown in Figure 2. The prevailing wind conditions and the field setup for wind-speed measurements are shown in Figure 3.

2.3. Research Methods

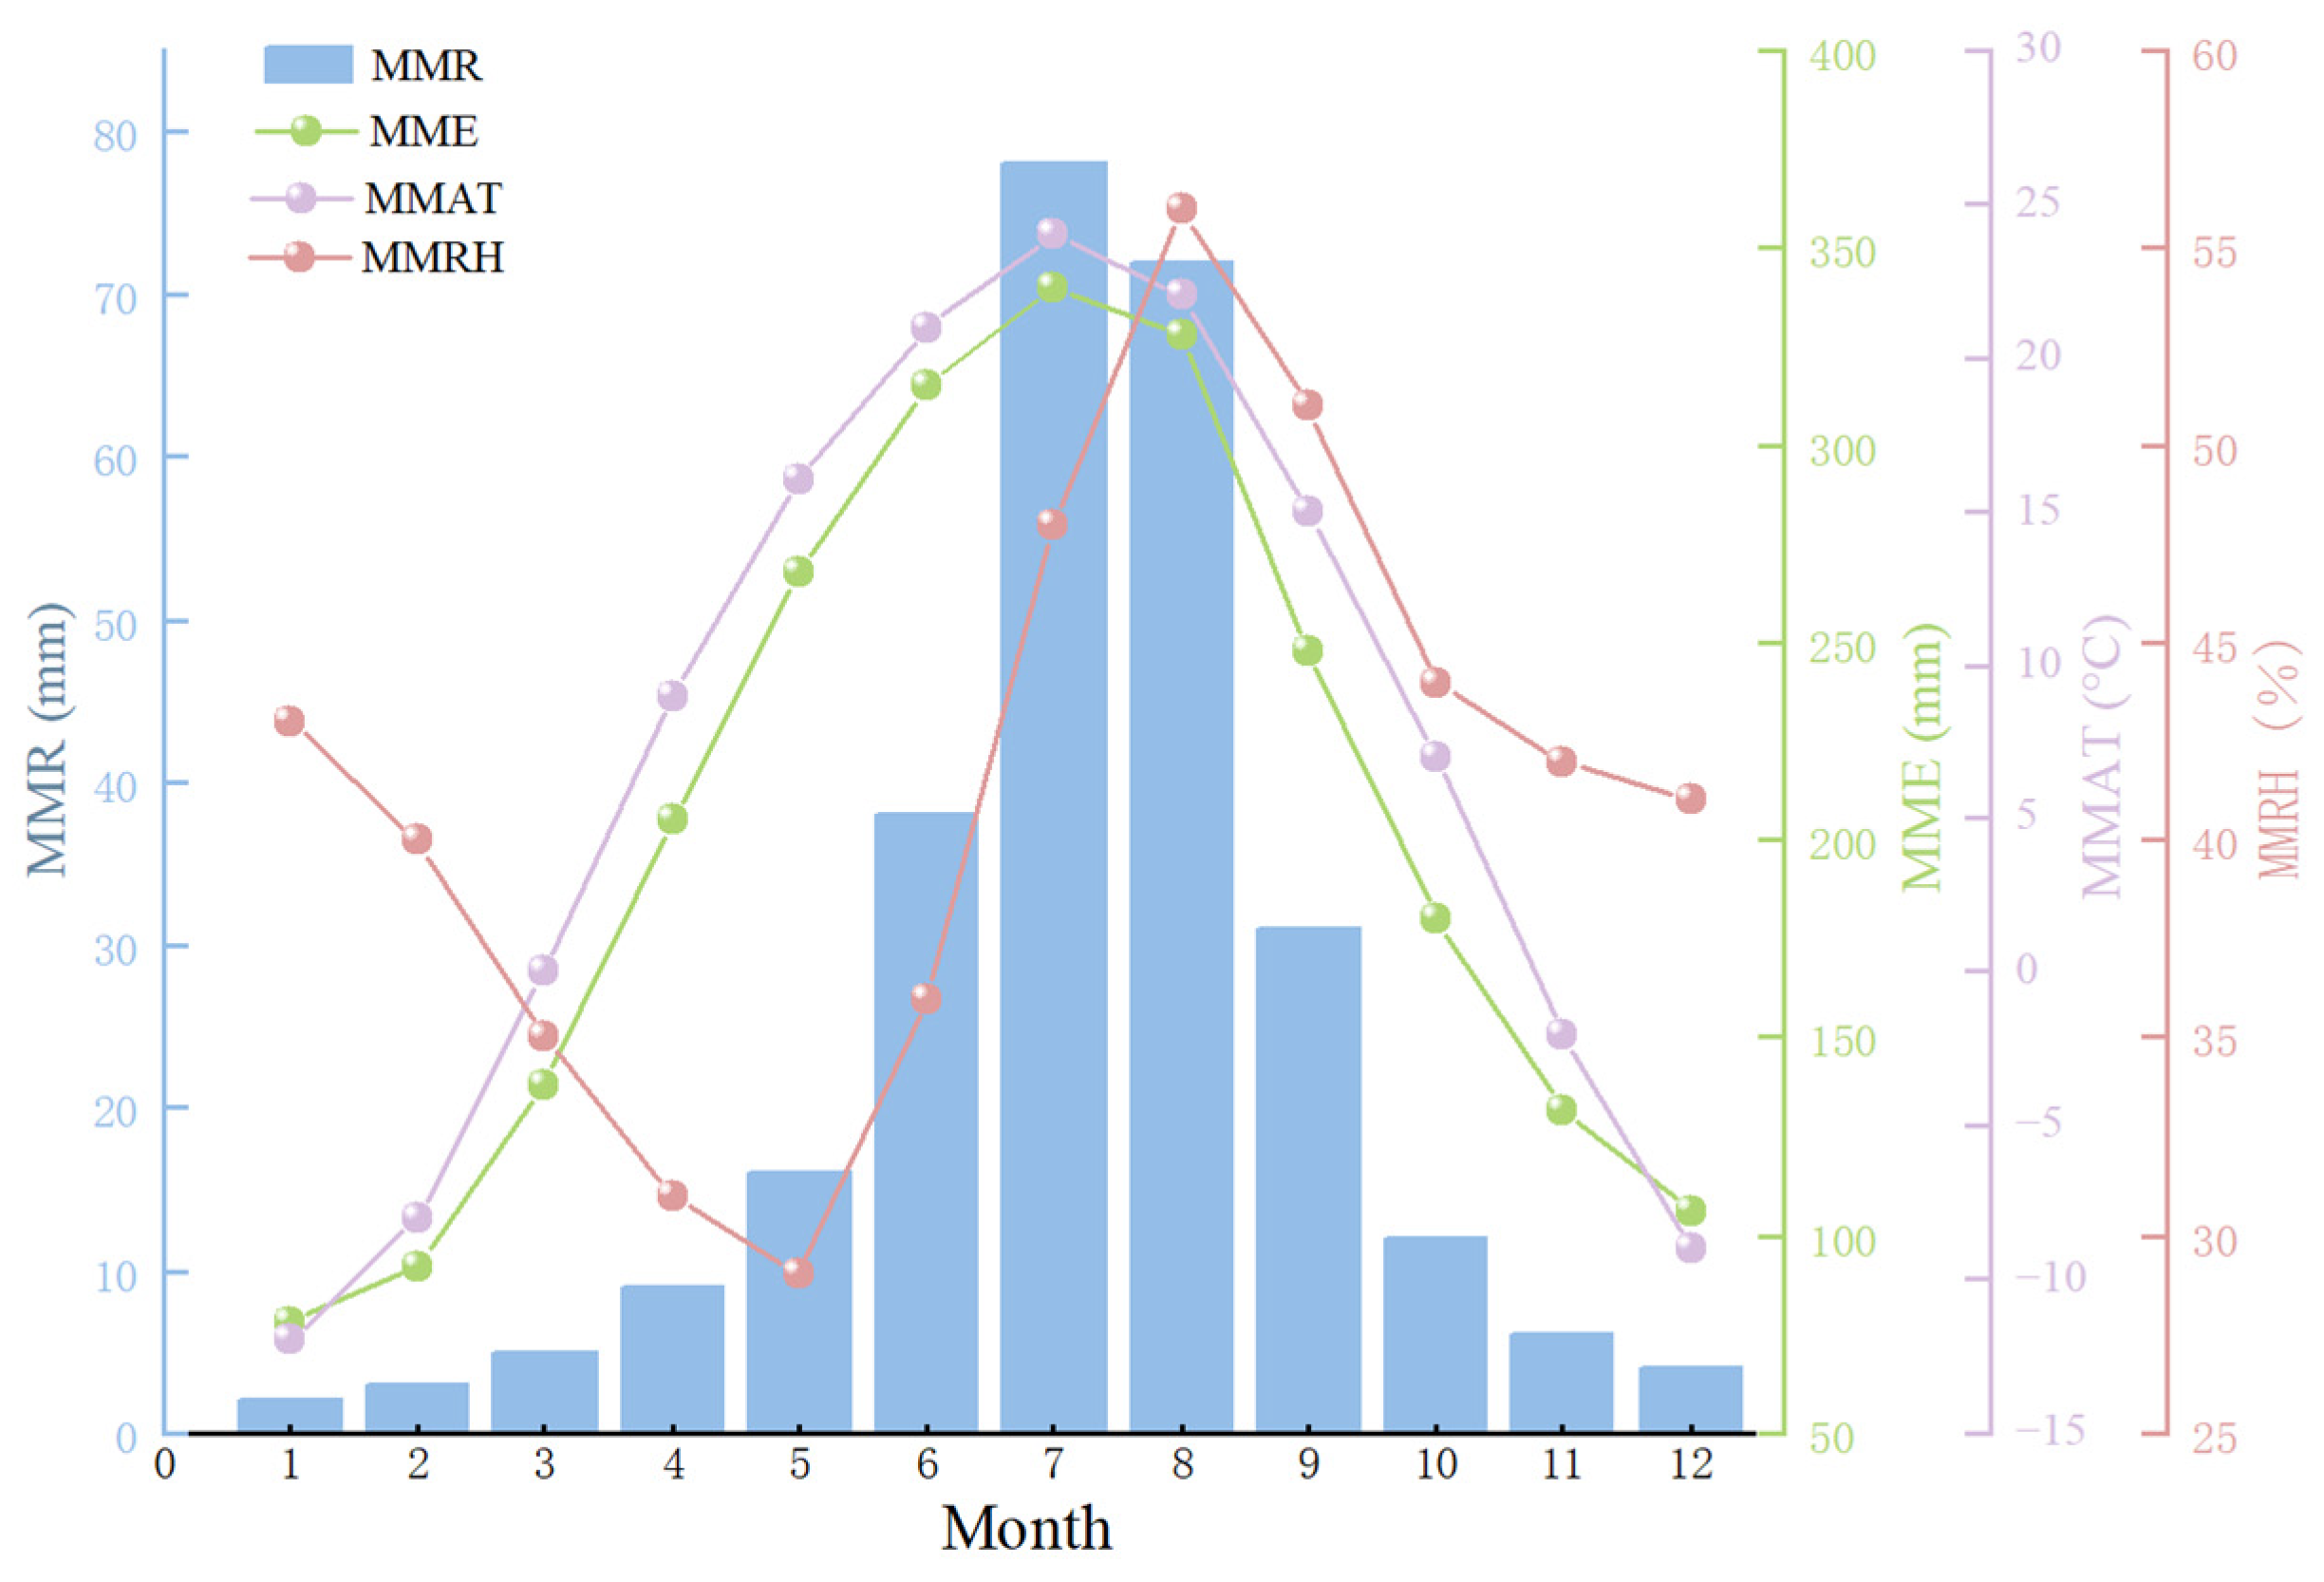
Figure 4 shows the monthly variation in meteorological factors in the study area in 2025. Soil sampling and wind–sand observations were conducted in April and November 2025 in a flexible-support photovoltaic power station in the Kubuqi Desert. The April campaign represented the late stage of the wind–sand active period before the main rainy season, whereas the November campaign represented the post-rainy period and the beginning of the next wind–sand active period. The two campaigns were first checked separately to account for this seasonal contrast. Because this study focused on differences among restoration measures and functional zones rather than on seasonal dynamics, the values from the two campaigns were then averaged for the main analysis. Based on spatial differentiation within the photovoltaic array, three zones were defined under each restoration measure: the panel front-edge zone (QY), the under-panel zone (BX), and the pedestal zone (JZ). QY was located beneath the panel front edge and was strongly affected by runoff concentration, BX was located between two adjacent panel rows, and JZ represented a zone with stronger near-surface wind-field disturbance. Samples in JZ were collected from the east, south, west, and north sides of the pedestal and composited. No restoration measure was applied in CK, where random sampling was used. Soil samples were collected at depths of 0–5, 5–10, 10–20, and 20–30 cm. For each restoration measure, zone, and soil depth, three independent field sampling points were established. At each sampling point, three nearby subsamples from the same depth were mixed to form one composite field sample. Thus, the depth combination contained three independent composite field samples (n = 3). Laboratory analytical replicates were used only to check measurement precision, and the mean analytical value was used as the value of each independent field replicate.
Wind speed was measured simultaneously in each restoration plot and the corresponding CK plot along the prevailing wind direction using a DEM6 portable anemometer (Zhonghuan TIG (Tianjin) Meteorological Instruments Co., Ltd., Tianjin, China) at heights of 10, 20, 50, 70, and 100 cm. Observations were conducted under clear, rain-free conditions with stable wind direction at incoming wind speeds of 4.77, 6.68, and 8.53 m/s. Each measurement lasted 2 min at 10 s intervals, with three replicates for each observation unit. Mean values were used to calculate windbreak efficiency, and wind-speed profiles were fitted to estimate aerodynamic roughness length. Sand accumulation was monitored simultaneously using BSNE sand collectors installed 10 cm above the ground, with three parallel points in each observation unit. Sampling lasted 30 days, with collection every 10 days, and the total mass collected was used as the total sand accumulation. The total sand mass collected during the observation period was used to calculate cumulative sand-fixing efficiency, whereas particle-size composition was used only to describe the relative composition of wind-eroded materials. After air-drying and impurity removal, samples were weighed and used to determine the mechanical composition of wind-eroded materials and to evaluate sand-fixing effect and cumulative sand-fixing efficiency in QY, BX, and JZ. For particle-size analysis, air-dried soil samples were treated with 10% H2O2 and 10% dilute hydrochloric acid to remove organic matter and carbonates, dispersed by ultrasonic vibration, and measured three times with a FRITSCH laser particle-size analyser. Particle-size fractions were classified according to the U.S. system, and particle diameters at cumulative particle-volume percentages of 5%, 10%, 16%, 25%, 50%, 75%, 84%, 90%, and 95% were extracted for subsequent calculations.
The Udden–Wentworth grain-size classification was adopted, and a logarithmic transformation was performed using the Krumbein method. Specifically, the particle diameters corresponding to the previously extracted cumulative volumetric percentages of soil particles were converted into Φ values for subsequent calculations. The conversion formula is as follows:
Φ = log 2 D
where D is the soil particle diameter.
According to the Folk–Ward graphical method, soil grain-size parameters, including mean grain size (Mz), standard deviation (Sd), skewness (SK), and kurtosis (Kg), were calculated. The volumetric contents of different soil particle-size fractions were determined using a laser particle-size analyser, and the fractal dimension was calculated by characterizing the soil fractal model with the particle-size volume distribution. The calculation formula is as follows [29]:
M Z = 1 3 ( Φ 16 + Φ 50 + Φ 84 )
S d = Φ 84 Φ 16 4 + Φ 95 Φ 5 6.6
S K = Φ 16 + Φ 84 2 Φ 50 2 ( Φ 84 Φ 16 ) + Φ 5 + Φ 95 2 Φ 50 2 ( Φ 95 Φ 16 )
Κ g = Φ 95 Φ 5 2.44 ( Φ 75 Φ 25 )
( R i R m a x ) 3 D = V r < R I V T
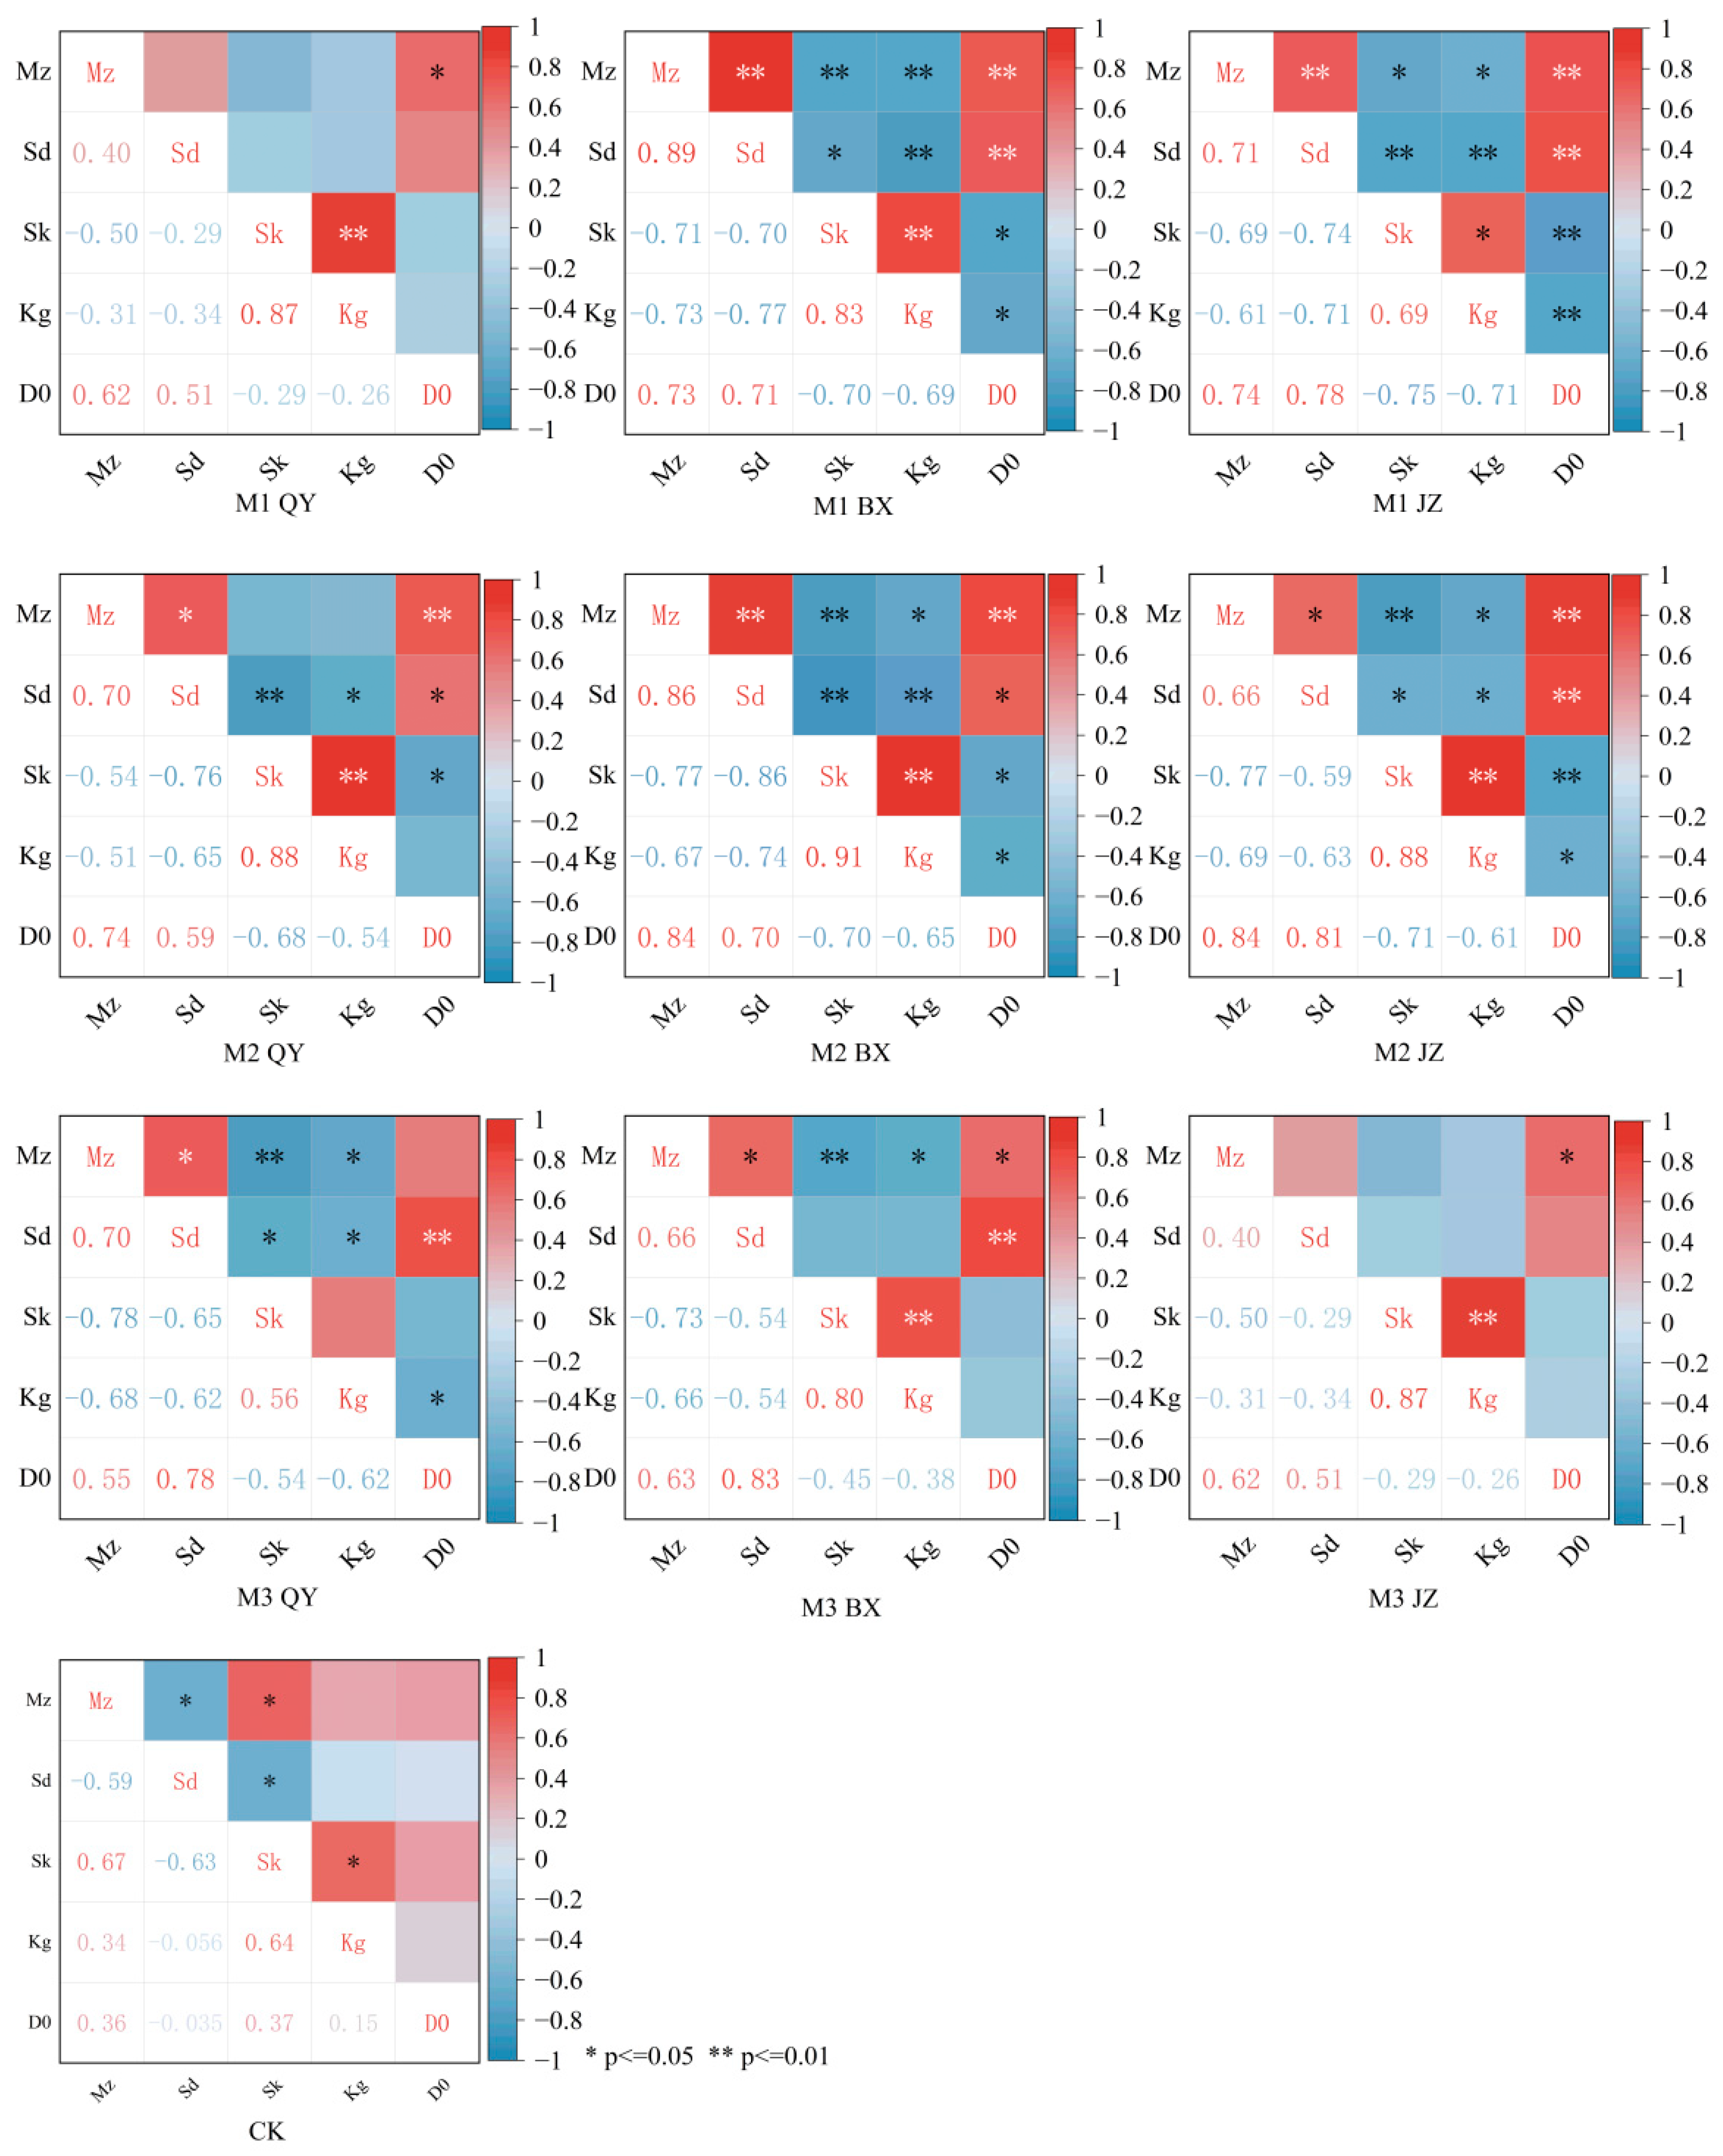
Equations (1)–(6) were used to quantify the grain-size structure of surface sediments. Equation (1) converts particle diameter into the Φ scale, allowing grain-size data to be expressed on a logarithmic scale and compared consistently among samples. Equations (2)–(5) describe different aspects of the grain-size distribution based on the Folk–Ward graphical method. Mz represents the average particle-size level and reflects the overall fineness or coarseness of surface sediments. Sd describes the sorting degree and indicates the uniformity of particle-size distribution. Sk reflects the asymmetry of the distribution and helps identify whether the sample is enriched in finer or coarser fractions. Kg, calculated by Equation (5), describes the peakedness of the grain-size distribution and indicates whether particles are concentrated near the central size class or distributed more widely across several size fractions. Equation (6) was used to calculate the fractal dimension (D0) of the particle-size distribution. D0 integrates the volume distribution of different particle-size fractions and reflects the complexity of sediment structure and the relative contribution of fine particles. A higher D0 generally indicates a higher fine-particle contribution and a more developed particle-size structure, whereas a lower D0 reflects a coarser and simpler sediment structure. These parameters were therefore used together to evaluate how vegetation restoration changed surface sediment sorting, fine-particle retention, and the stability of the underlying surface. Here, D is the fractal dimension, Ri is the measured soil particle diameter, Rmax is the diameter of the largest particle, V(r < Ri) is the volume percentage of soil particles smaller than the measured particle diameter (Ri), and VT is the total volume percentage of all soil particle-size fractions. The equations for calculating surface roughness and friction velocity are as follows:
U Z = U * K ln Z Z 0
where Uz is the mean wind speed at height z (m/s); z is the vertical height of a point on the wind-speed profile above the ground surface (cm); u* is the friction velocity (m/s); z0 is the aerodynamic roughness length (cm); and K is the von Kármán constant, taken as 0.4.
To calculate the aerodynamic roughness length and friction velocity, this study performed least-squares regression of the measured wind-speed data using the logarithmic form of the near-surface wind-speed profile. The equation is as follows:
U Z = b + a ln Z
where a and b are regression coefficients. By setting Uz = 0, the surface roughness length can be obtained as follows:
Z 0 = exp ( b / a )
Equations (7)–(9) were used to describe the near-surface wind-speed profile and to derive aerodynamic roughness length (z0) and friction velocity (u*). These two parameters reflect the aerodynamic resistance of the underlying surface and the intensity of near-ground momentum exchange. Larger z0 and u* values indicate stronger disturbance of airflow by vegetation cover or surface obstacles and greater capacity to weaken near-surface wind erosion.
The equation for calculating windbreak efficiency is as follows:
F = V 0 V s b V 0 × 100 %
Equation (10) was used to calculate windbreak efficiency by comparing wind speed over the restored surface with that over the untreated control at the same height. This index directly quantifies the wind-reduction effect of each vegetation restoration measure. Here, F is the windbreak efficiency relative to the control (%), and V0 and Vsb represent the wind speed over bare sand and the wind speed after blockage by the vegetation measure at the same height, respectively (m/s).
Soil moisture content was determined by the oven-drying method. Samples from each soil layer within the 0–30 cm profile were collected using cutting rings, sealed with tape, and weighed as m1. The samples were then returned to the laboratory and oven-dried to constant weight, the weight being recorded as m2. The calculation formula is as follows:
soil   moisture   content   ( % ) = m 1 m 2 m 2
Equation (11) was used to calculate the gravimetric soil moisture content. This index was used to evaluate how vegetation restoration and photovoltaic-array microenvironments affected soil water retention in different functional zones. Soil organic matter (SOM) was determined by the potassium dichromate oxidation method with external heating [30]. Alkali-hydrolyzable nitrogen (AHN) was determined by the alkali diffusion method [31]. Available phosphorus (AP) was extracted with NaHCO3 and determined using a UV spectrophotometer [32]. Available potassium (AK) was extracted with NH4OAc and determined by flame photometry [28]. Soil pH was measured using a pH meter [33].

2.4. Data Processing and Analysis

Data were organized in Excel 2022. The April and November campaigns were first checked separately, and their averaged values were used in the main analysis to compare restoration measures and functional zones. The three independent composite field samples were used as statistical replicates (n = 3). Laboratory analytical replicates were used only to check measurement precision, and their mean value was used for each field replicate. Means, standard deviations, and one-way ANOVA were calculated in IBM SPSS Statistics 27. Multiple comparisons were performed using the LSD test at p < 0.05. All graphical outputs were prepared using Origin 2025.

3. Results and Analysis

3.1. Effects of Different Vegetation Restoration Measures on Soil Physical Properties

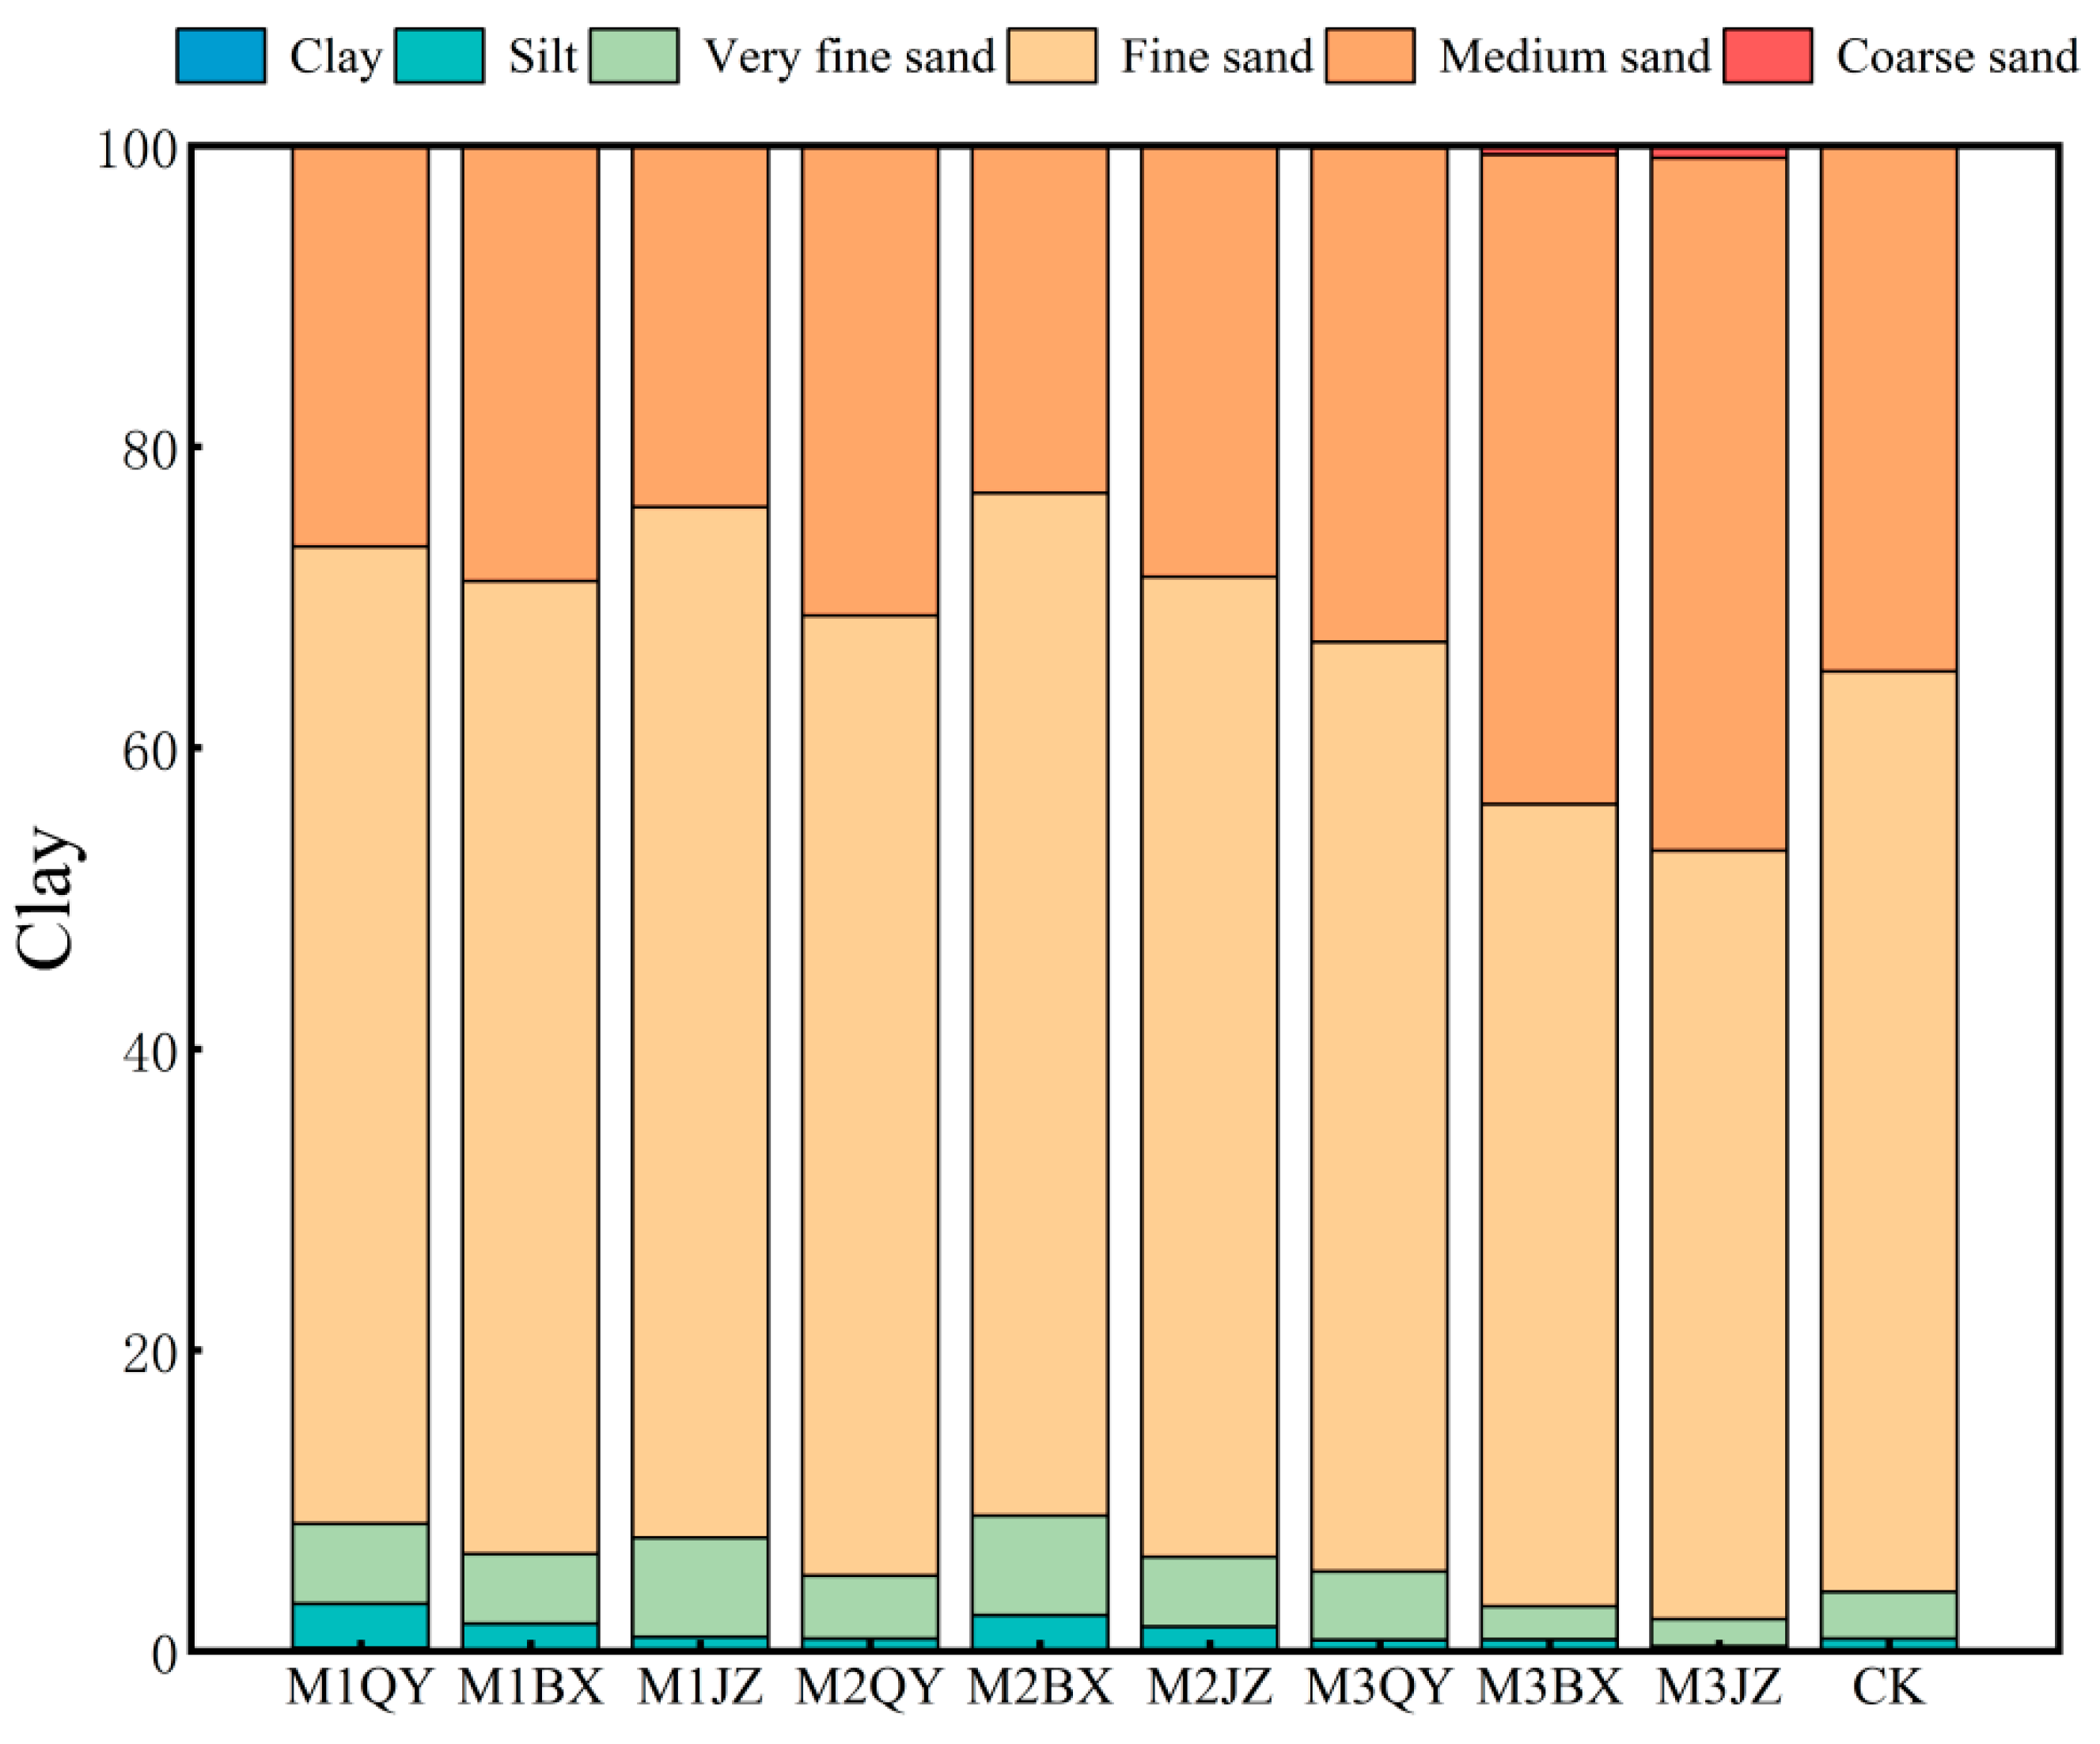
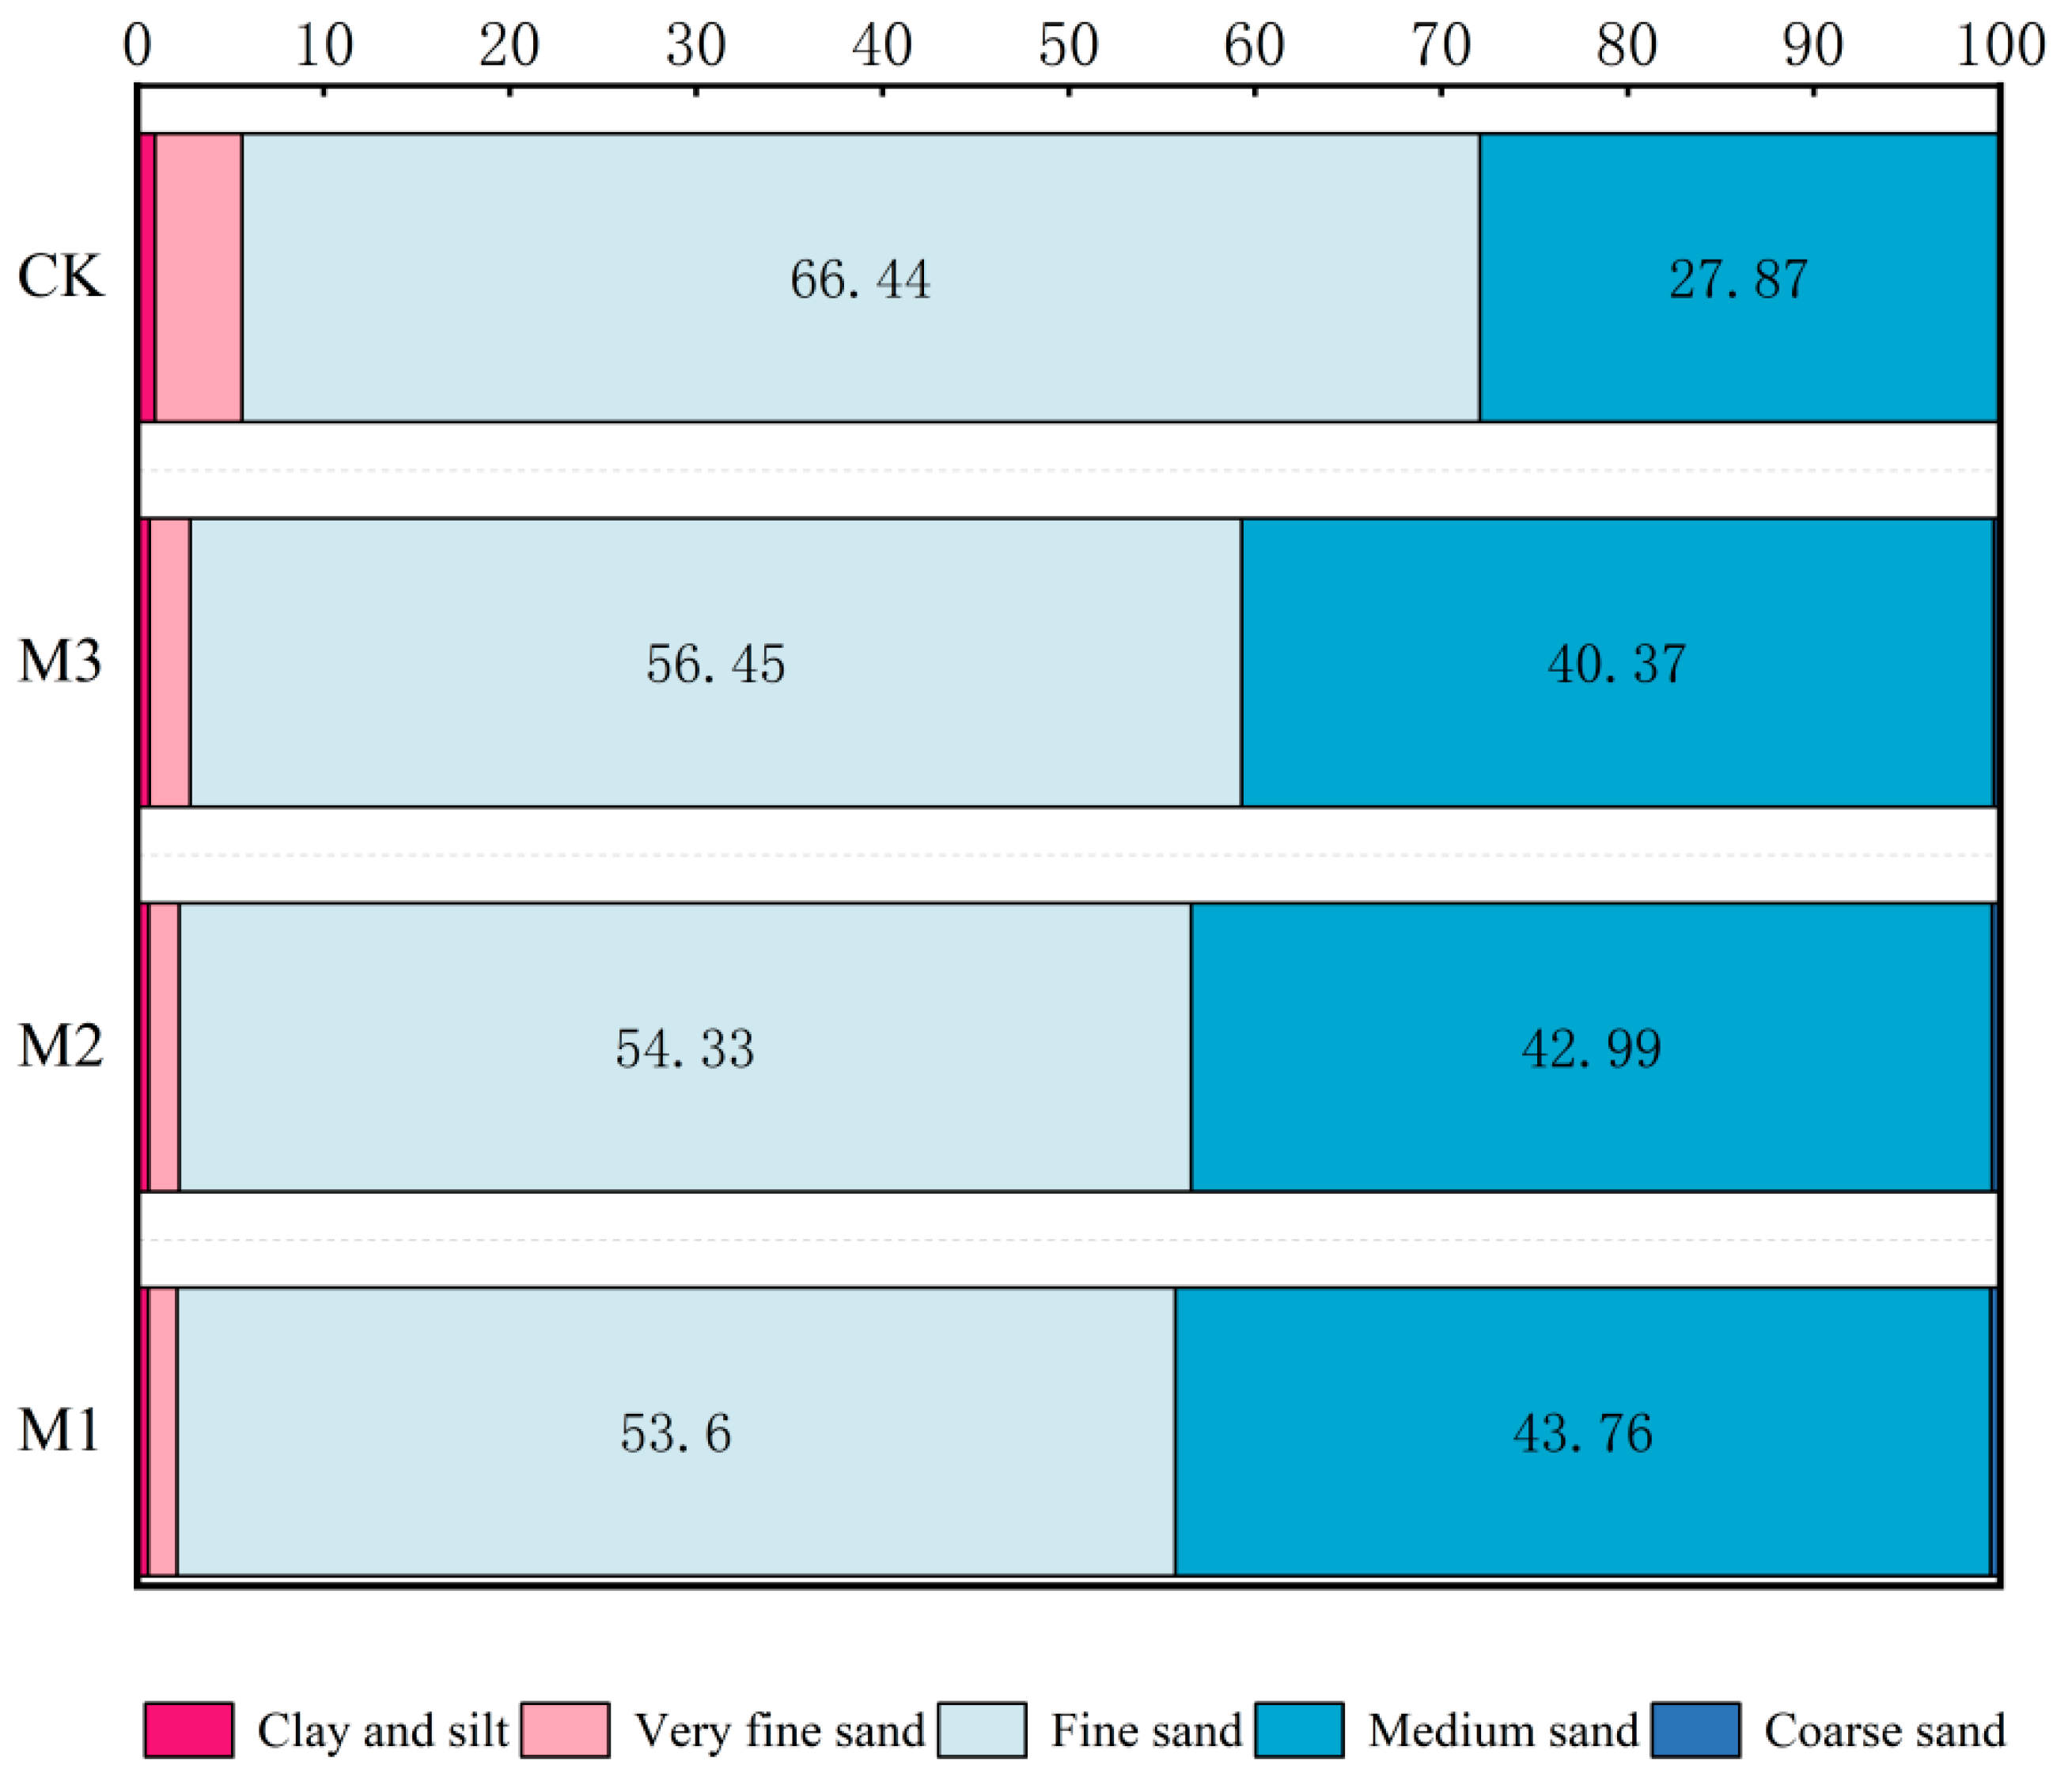
Figure 5 shows that surface sediments were dominated by fine and medium sand, while clay, silt, and coarse sand remained low. After restoration, M1 retained more fine particles in QY and JZ, M2 concentrated finer fractions in BX, and M3 showed higher medium and coarse sand in BX and JZ.
Table 2 and Figure 6 show that Mz and D0 showed more distinct variation among zones than Sd, Sk, and Kg. Mz ranged from 2.005 to 2.364. Under M1, higher Mz values occurred in QY and JZ, whereas under M2, the highest value occurred in BX. Under M3, Mz remained relatively low, especially in BX and JZ. D0 ranged from 1.459 to 1.935 and differed among zones under the three restoration measures. Under M1, D0 decreased significantly from QY to BX and JZ. Under M2, D0 was lower in QY than in BX and JZ, while BX and JZ showed no significant difference. Under M3, D0 was lower in JZ than in QY and BX, while QY and BX showed no significant difference. In comparison, Sd, Sk, and Kg changed within narrow ranges, with values of 0.556–0.593, 0.060–0.113, and 0.974–1.045, respectively.
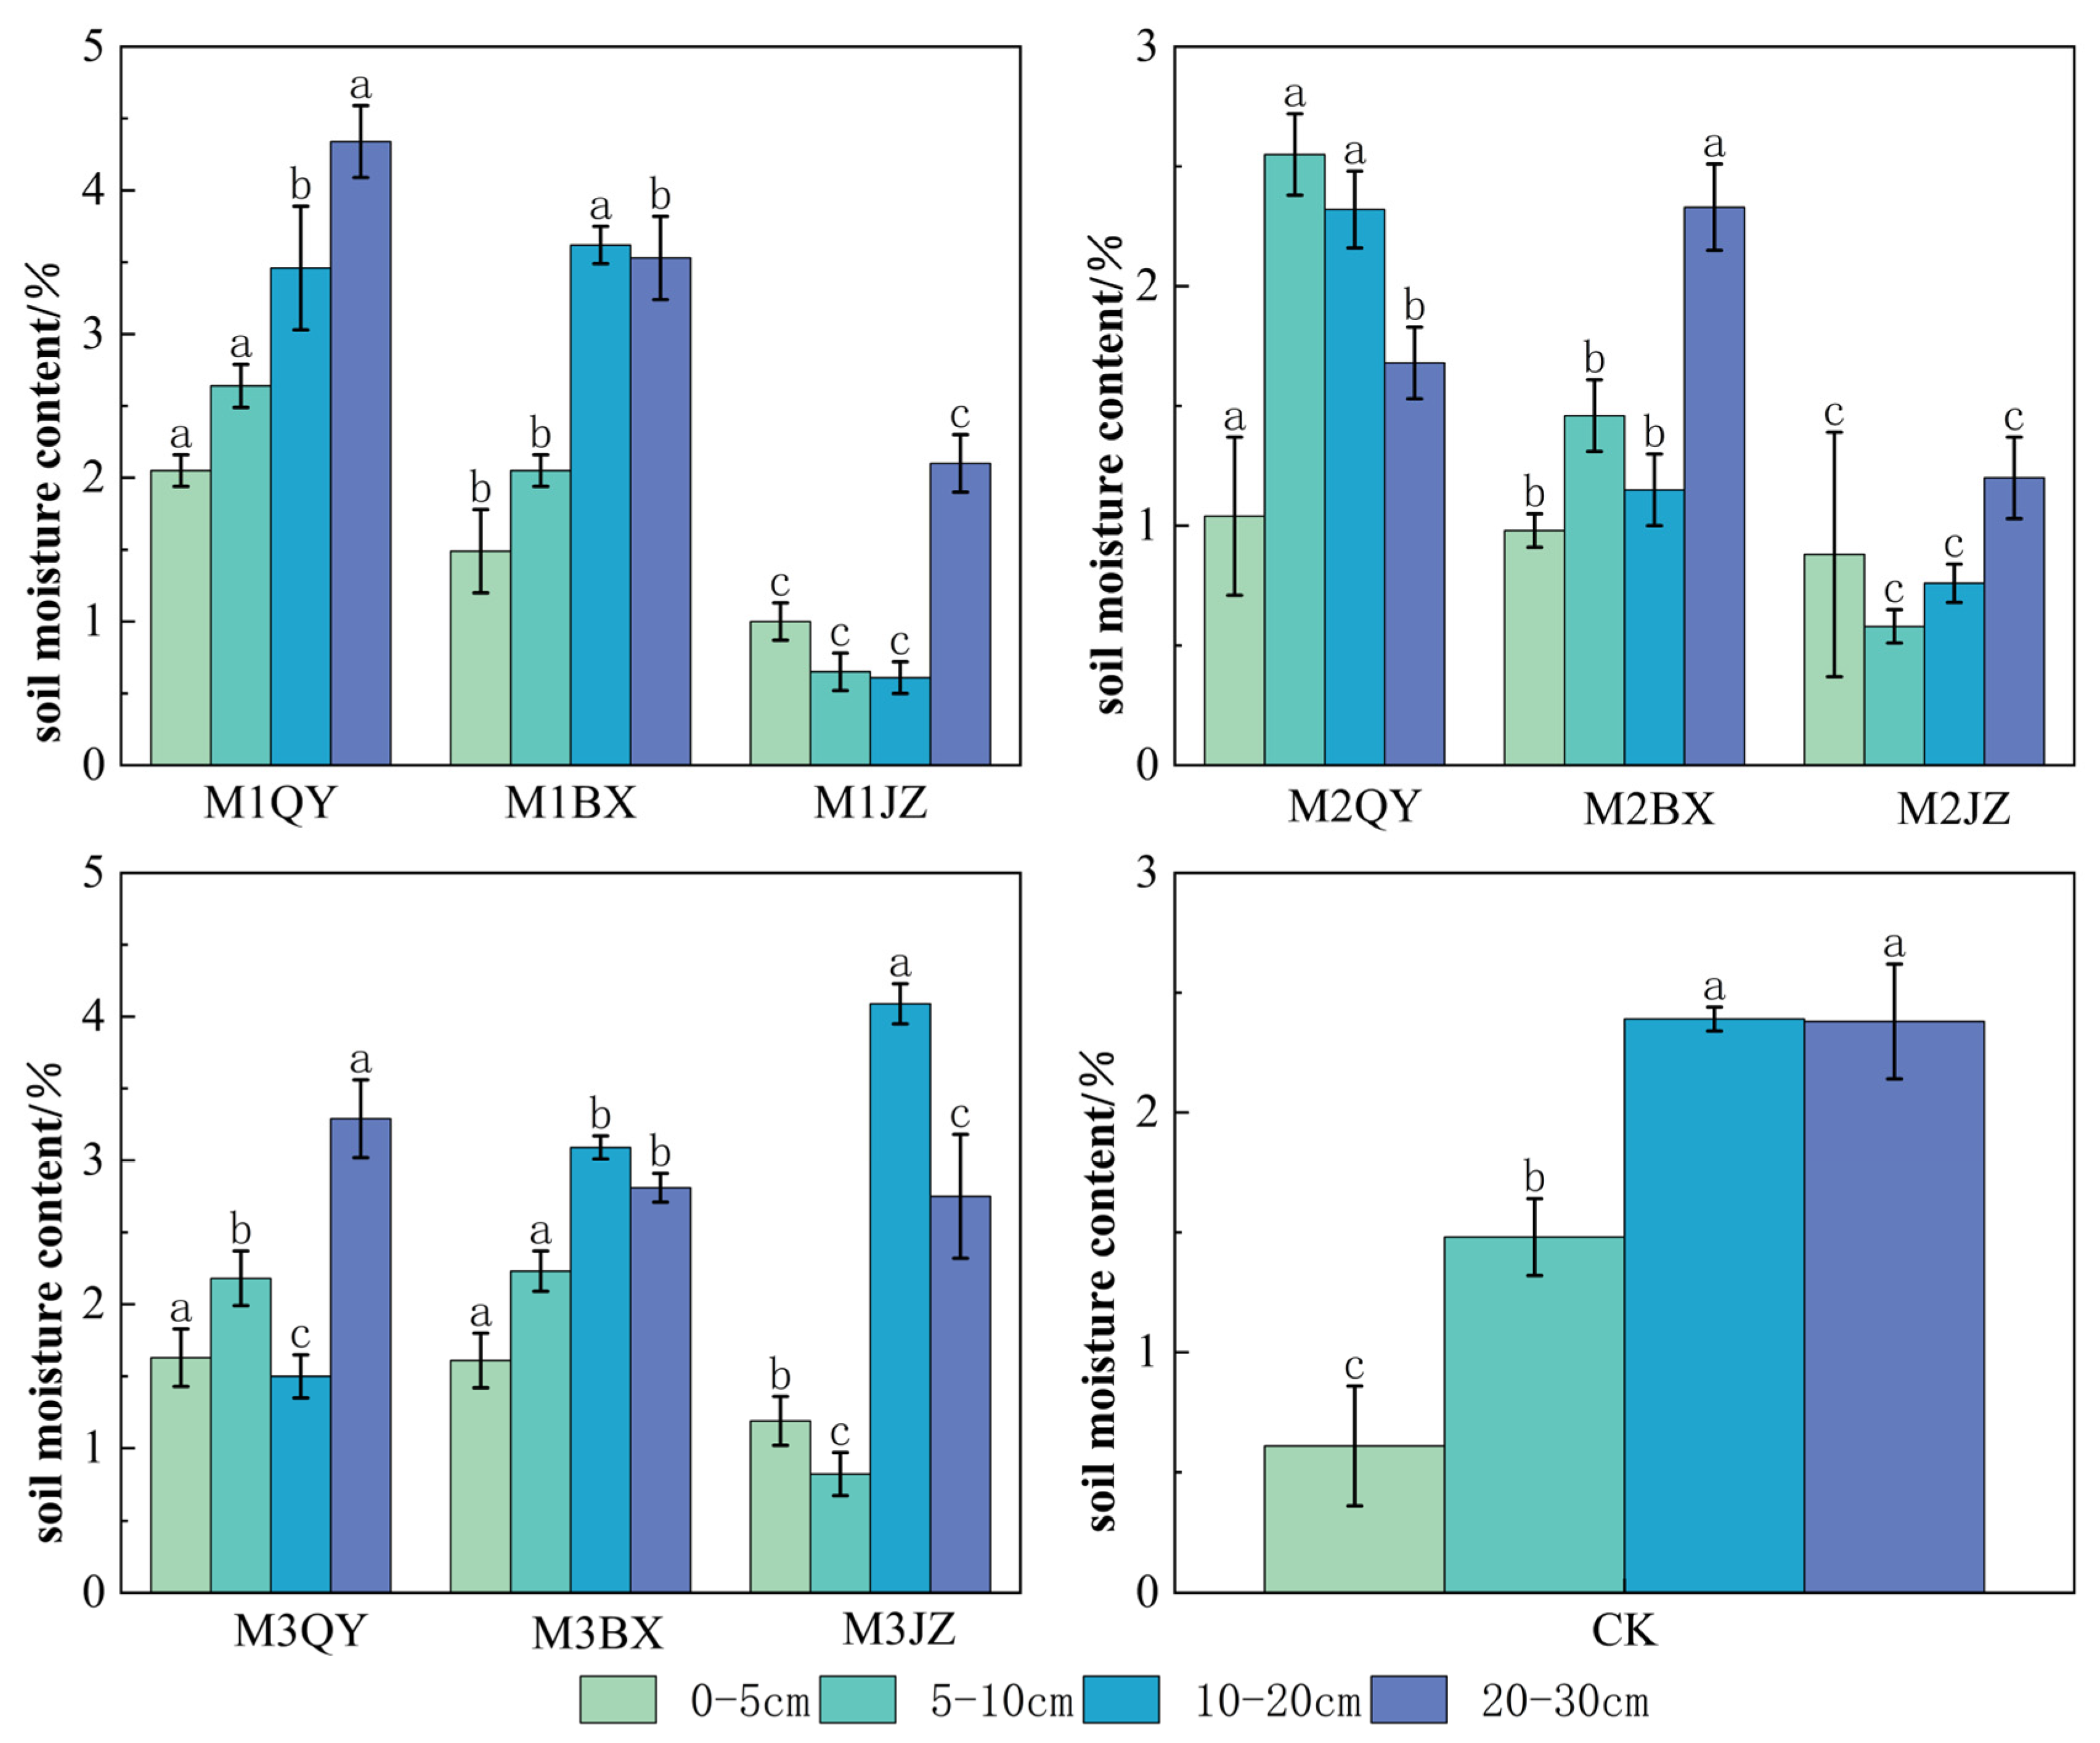
As shown in Figure 7, soil moisture ranged from 0.58% to 4.34% and varied with restoration measure, position, and soil depth. In CK, moisture was low in the surface layer and increased downward. Restoration changed this pattern. In QY, M1 showed the strongest moisture accumulation, increasing from 2.05% to 4.34% and peaking in the 20–30 cm layer. In BX, higher moisture under M1 and M3 was mainly concentrated in the 10–30 cm layers. In JZ, M2 remained low across all layers, whereas M3 reached 4.09% in the 10–20 cm layer. Overall, soil moisture accumulation shifted among QY, BX, and JZ under different restoration measures, with the clearest differences in the deeper layer of QY, the middle and lower layers of BX, and the middle layer of JZ.

3.2. Soil Nutrient Characteristics Under Different Vegetation Restoration Measures

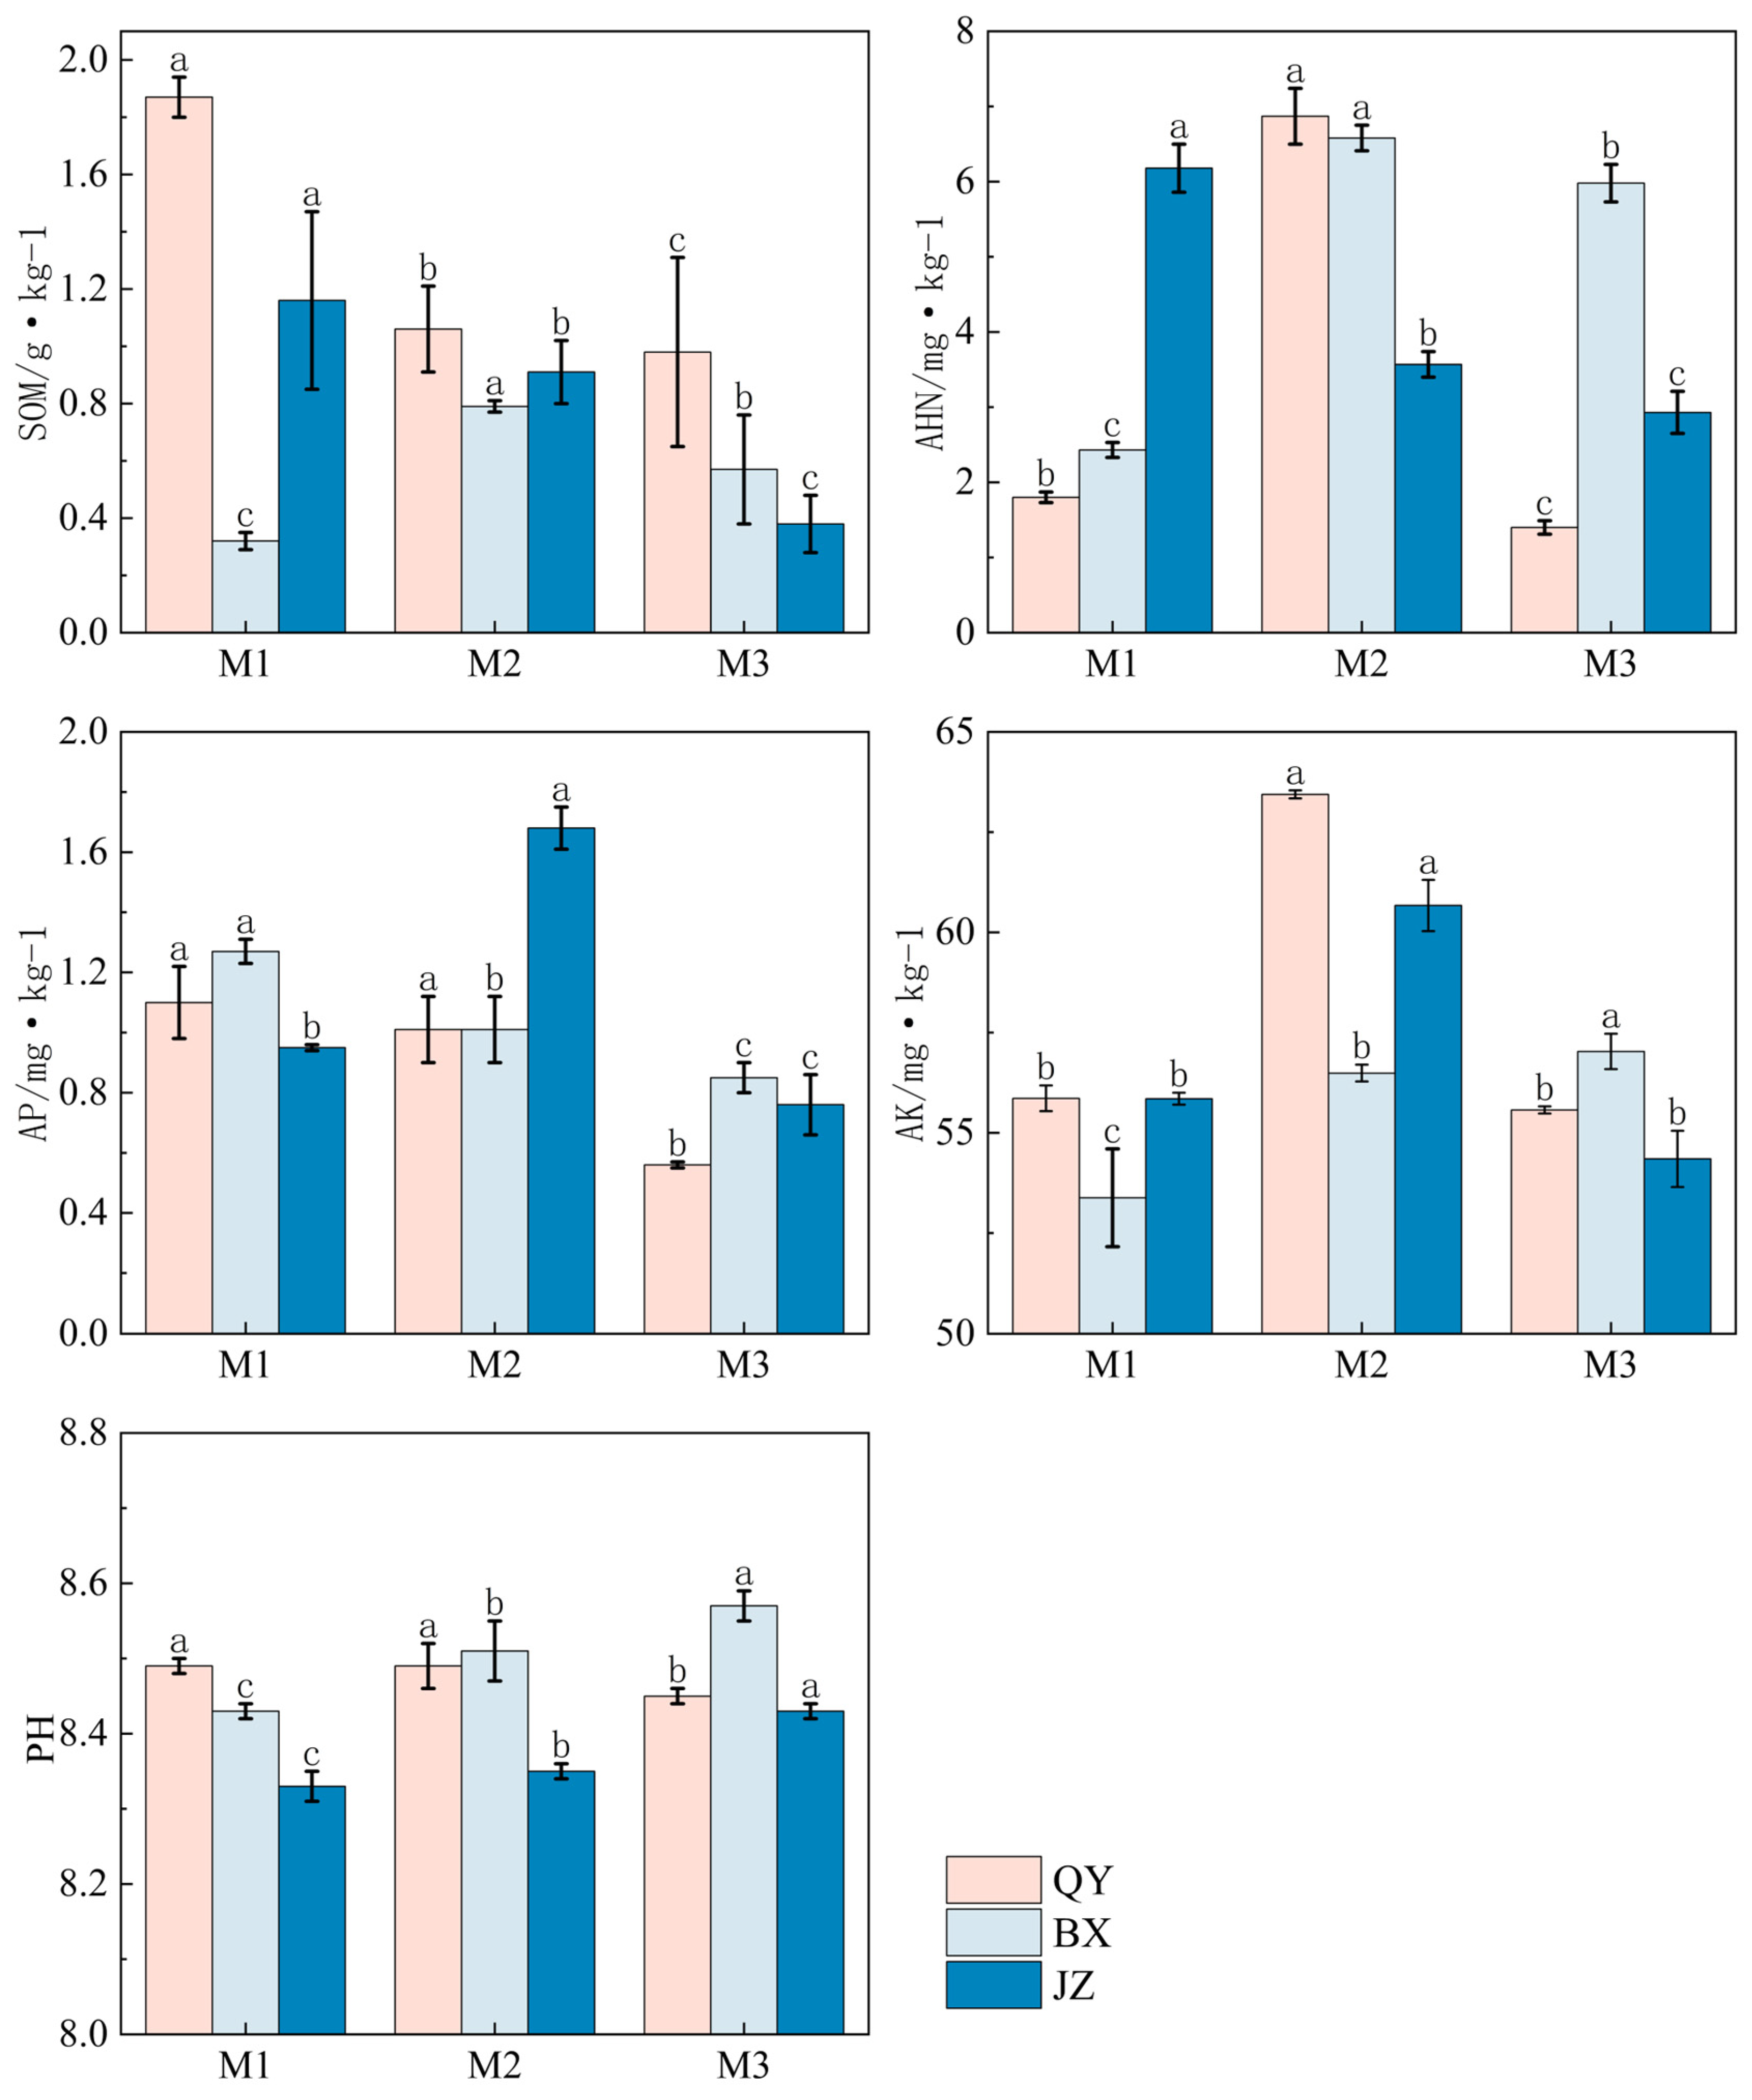
Figure 8 shows that soils under all restoration measures were alkaline, with pH ranging from 8.33 to 8.57 and varying less than nutrient indicators. SOM ranged from 0.32 to 1.87, with higher values under M1 in QY and JZ. AHN was highest under M2 in QY and BX, reaching 6.87 and 6.58, respectively. AK was highest under M2 in QY and JZ, while AP was highest under M1 in QY and BX. Overall, M1 favored SOM and AP accumulation, whereas M2 promoted available nutrient formation.

3.3. Relationships Among Soil Factors

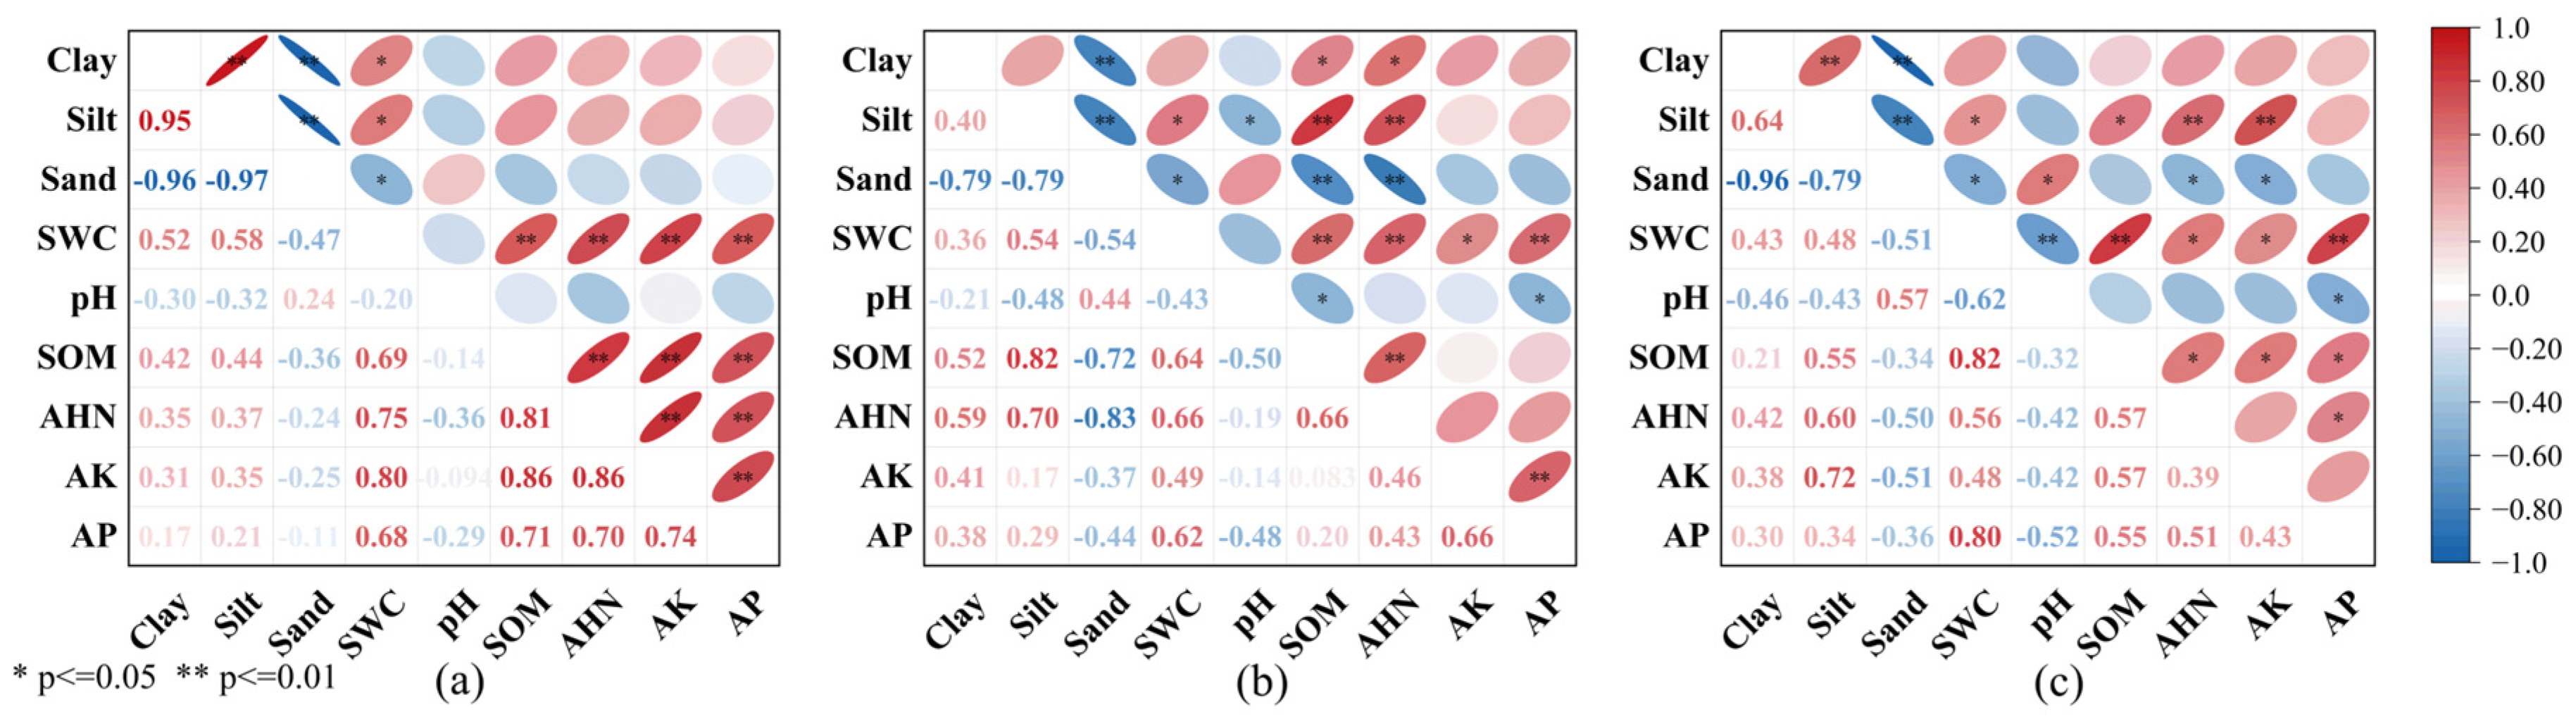
Figure 9 shows clear correlations among soil texture, moisture, and nutrients. Clay was positively correlated with silt, and both were negatively correlated with sand. SWC was generally positively correlated with clay, silt, SOM, AHN, AK, and AP, but negatively correlated with sand. Under M1, correlations among SWC and nutrient indicators were strongest. Under M2, silt was more closely associated with SOM and AHN. Under M3, SWC–SOM and SOM–AP correlations were more evident. Overall, fine-particle enrichment and higher moisture favored nutrient accumulation, whereas higher sand content reflected weaker water and nutrient retention.

3.4. Windbreak and Sand-Fixing Effects Under Different Vegetation Restoration Measures

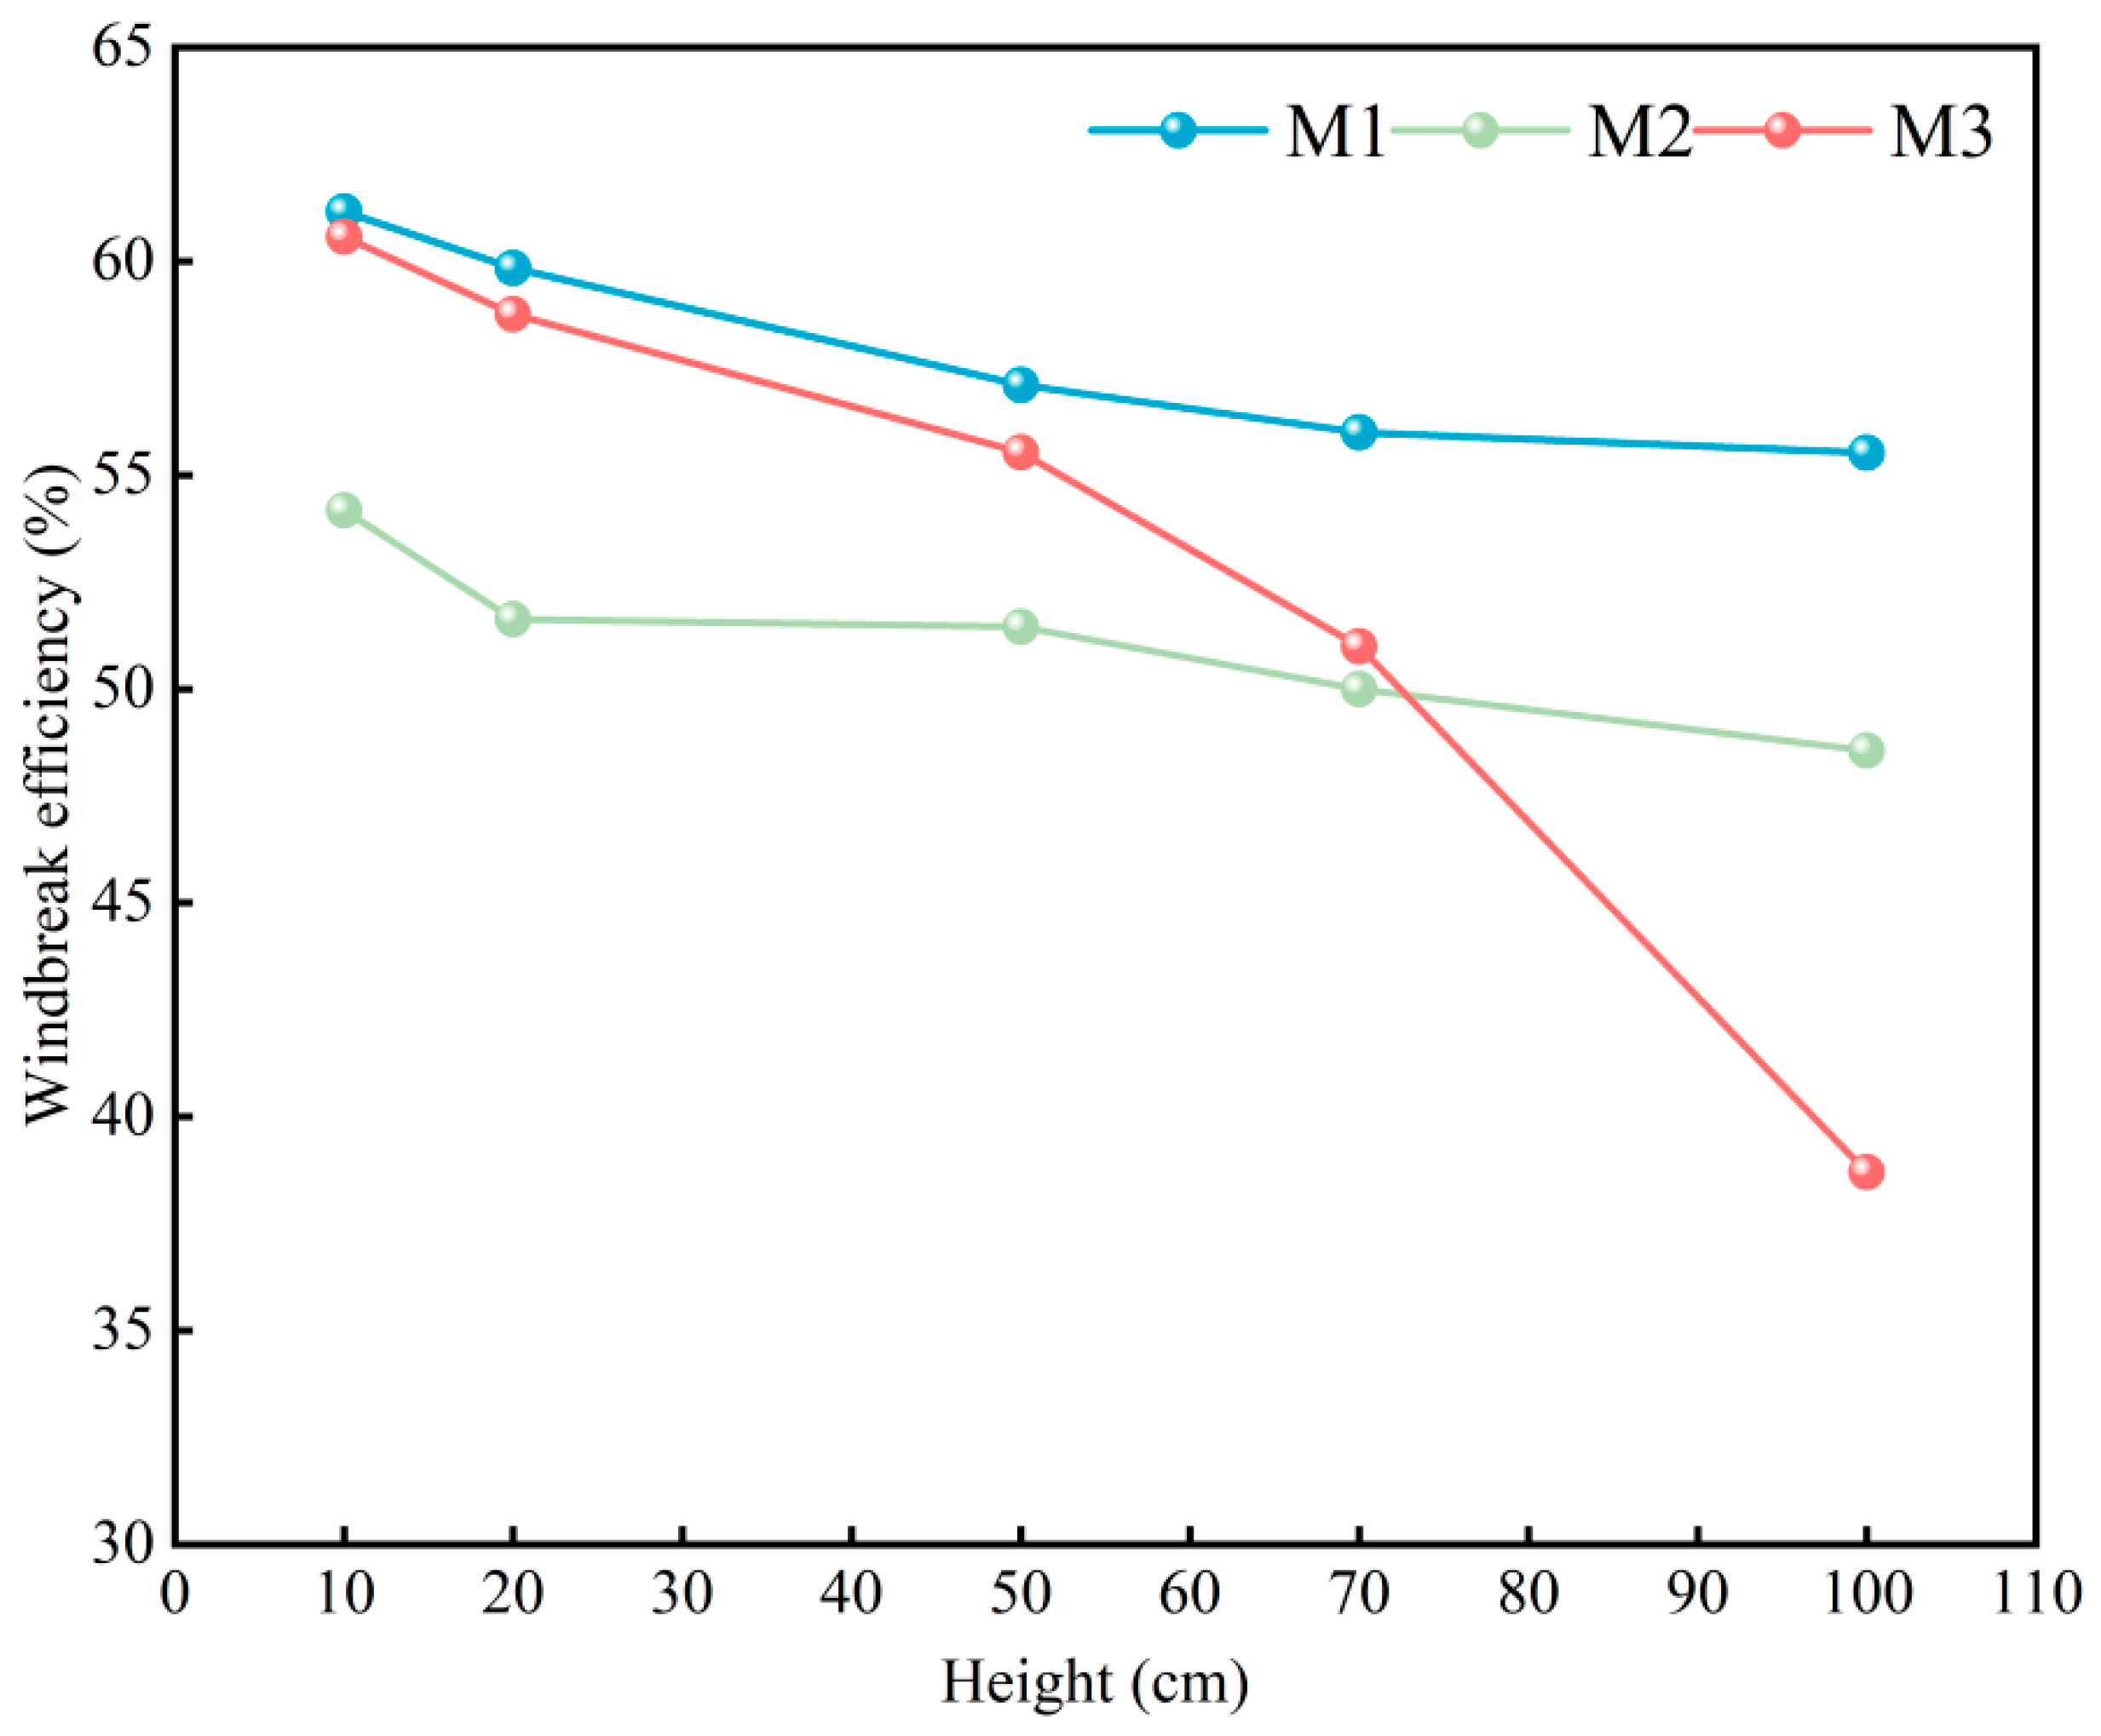
Figure 10 shows that windbreak efficiency under all three restoration measures decreased with height within the 10–100 cm near-surface layer. M1 remained the highest and changed little with height, decreasing from 61.16% at 10 cm to 55.52% at 100 cm. M2 showed a similar vertical decline, from 54.18% to 48.56%. M3 was close to M1 within the 10–50 cm layer, but declined sharply above 70 cm and reached 38.71% at 100 cm. This indicates that M3 had a stronger near-surface wind-reduction response, whereas M2 maintained a more stable effect in the upper part of the measured layer. The difference between M2 and M3 was therefore mainly reflected in vertical distribution rather than overall windbreak ranking.
Table 3 shows that wind-speed profiles under the three restoration measures were well fitted by logarithmic functions under all wind-speed conditions, with R2 values of 0.97–0.99. Aerodynamic roughness length under all restoration measures was higher than that of the corresponding CK. M1 remained highest or near-highest across the three wind-speed conditions, reaching 0.92, 1.14, and 0.90 cm at 4.77, 6.68, and 8.53 m/s, respectively. M2 showed relatively low but consistently higher roughness than CK. M3 was close to M2 at 4.77 m/s, but increased under medium and high wind speeds and approached M1 at 8.53 m/s. These results indicate that M1 produced the most stable increase in aerodynamic roughness length, while the difference between M2 and M3 was mainly reflected in their response to wind-speed conditions.
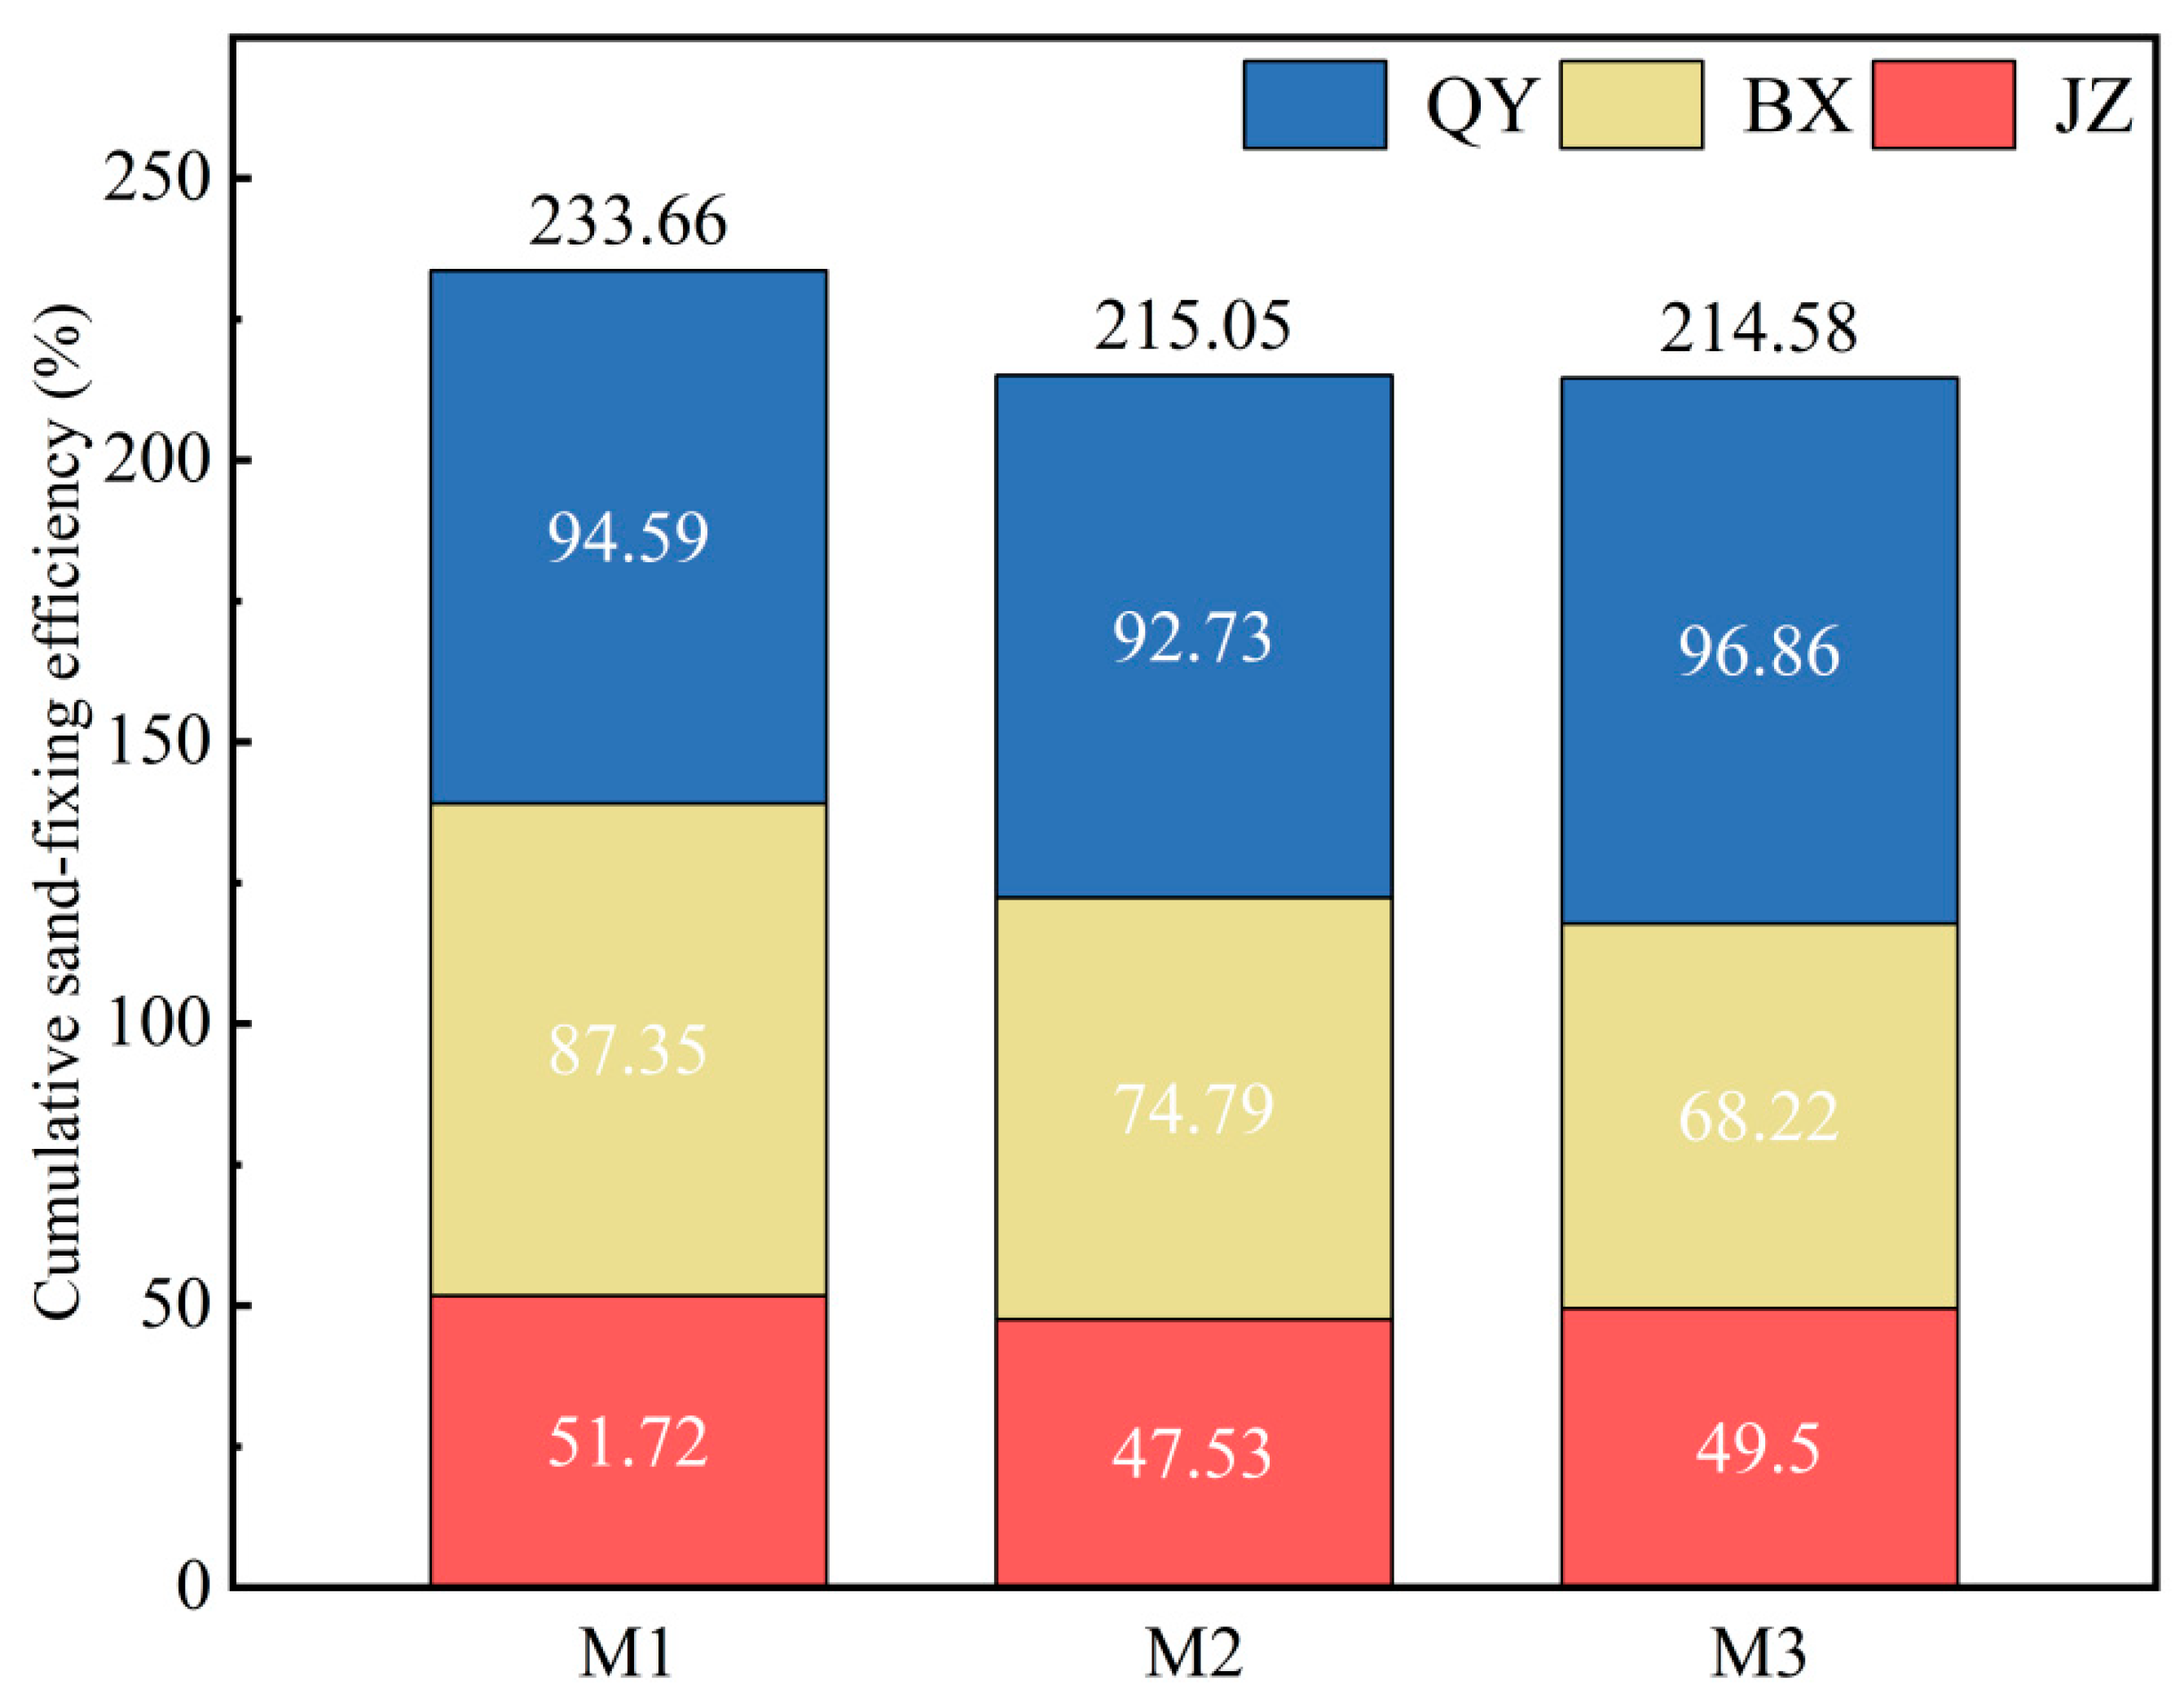
Figure 11 shows that M1 had the highest cumulative sand-fixing efficiency, with a total value of 233.66%, exceeding M2 and M3 by 18.61% and 19.08%, respectively. The total values of M2 and M3 were close, at 215.05% and 214.58%, indicating comparable cumulative effects. Under all three measures, sand-fixing efficiency decreased from QY to BX and JZ, and QY and BX contributed more than 76% of the cumulative effect. M1 remained highest in BX and JZ, showing stronger spatial continuity. M2 and M3 differed mainly in spatial distribution: M3 was slightly higher in QY, whereas M2 retained a higher value in BX; their difference in JZ was small. These results indicate that M1 had the strongest cumulative and spatially continuous sand-fixing effect, while M2 and M3 showed similar total effects but different zonal responses.
As shown in Figure 12, wind-eroded materials under all restoration measures were dominated by fine sand and medium sand. Compared with CK, fine sand decreased from 66.44% to 53.60–56.45%, whereas medium sand increased from 27.87% to 40.37–43.76%. This change should be interpreted as a relative shift in particle-size composition after the reduction in finer transported fractions, rather than as direct evidence of true grain coarsening. M1 and M2 showed more evident changes in particle-size composition, with relatively high medium sand and low very fine sand. M3 retained slightly higher fine sand and very fine sand contents. This difference was related to the role of Atriplex canescens at the panel front edge. Shrub interception altered the incoming sand-transport pathway and promoted particle sorting before sediments entered the array, whereas reed mulch combined with grass seeding mainly acted through near-surface cover and local sand trapping. Thus, the weaker change under M3 reflected its more localized cover-based effect, rather than a lower overall protective value.

4. Discussion

4.1. Effects of Different Vegetation Restoration Measures on Soil Particle Size and Soil Moisture Content

Panel shading, runoff from panel surfaces, and array layout altered near-surface evaporation, water input, and wind–sand movement [34]. As a result, the panel front-edge zone (QY), under-panel zone (BX), and pedestal zone (JZ) formed different microenvironments. Vegetation restoration further changed front-edge interception, surface-cover continuity, and surface sand-fixing capacity [35]. These changes were reflected in sediment sorting, water redistribution, and the spatial variation in soil particle-size composition and soil moisture. In this study, surface-sediment Mz ranged from 2.005 to 2.364, and D0 ranged from 1.459 to 1.935, indicating that restoration measures had altered the structure of surface sediments [13].
Differences in particle-size composition were mainly reflected in the spatial position of fine-particle accumulation. When reed mulch was combined with Atriplex canescens planting along the panel front edge, shrub interception and surface cover jointly reduced near-surface sand-transport [36], allowing fine particles to accumulate in the front-edge zone. When A. canescens was planted only along the panel front edge, local shrub interception changed the sand transport pathway, and fine-particle accumulation was more evident in the under-panel zone. The combination of reed mulch and grass seeding mainly acted through surface cover and near-surface erosion suppression. Under this measure, the response was more concentrated in local surface stabilization, whereas its extension toward the array interior was weaker. Thus, the difference between M2 and M3 was expressed mainly in the spatial position of sediment redistribution, rather than in a simple difference in overall soil physical recovery.
Soil moisture also showed different spatial responses under the three restoration measures. These differences were related to water input, evaporation loss, and the capacity of surface sediments to retain water. Panel shading reduced surface evaporation, while runoff concentration and edge dripping increased local water input [37]. Where front-edge interception, surface cover, and fine-particle accumulation occurred together, soil water retention was stronger. The combination of reed mulch and A. canescens planting showed a more continuous response in QY, while reed mulch combined with grass seeding enhanced local water retention in parts of JZ. Planting A. canescens alone improved local wind–sand conditions, but the lack of continuous surface cover limited its water-retention effect mainly to parts of BX.
The three restoration measures, therefore, represented different pathways of soil physical recovery [32]. The combination of reed mulch and A. canescens planting formed a more continuous process linking wind reduction, erosion suppression, fine-particle deposition, and water retention, and showed the strongest integrated effect. M2 and M3 had comparable overall effects, but their dominant processes differed. M2 was mainly associated with front-edge shrub interception and under-panel sediment redistribution, whereas M3 was mainly associated with surface cover, near-surface erosion suppression, and local water retention. Soil physical recovery in desert photovoltaic power stations, therefore, depends on whether restoration measures can coordinate wind reduction, sand stabilization, and water retention within key functional zones.

4.2. Effects of Different Vegetation Restoration Measures on Soil Nutrients

Vegetation restoration also influences nutrient accumulation through litter input, root turnover, and rhizosphere processes [24]. Changes in soil nutrients, therefore, reflect a further step in soil recovery, from physical improvement to fertility enhancement. In the study area, soil pH ranged from 8.33 to 8.57, with variation much smaller than that of SOM, AHN, AK, and AP. This suggests that different restoration measures did not alter the alkaline nature of aeolian sandy soil, and that treatment differences were mainly reflected in organic matter accumulation and the formation of available nutrients [38]. The positive association among fine particles, soil moisture, and nutrient indicators can be explained by the combined effects of particle retention and vegetation input. Clay and silt fractions have larger specific surface areas than sand particles and can retain more organic matter, ammonium, phosphorus, potassium, and soil water through adsorption and aggregation processes. Fine-particle enrichment, therefore, provides a physical basis for nutrient accumulation in restored sandy soils. In contrast, higher sand content usually indicates larger pores, weaker aggregation, lower water-holding capacity, and a higher risk of nutrient loss through leaching and wind erosion. Under vegetation restoration, reed mulch and plant roots further increased organic inputs and improved near-surface stability, which helped retain fine particles and promoted nutrient accumulation. This explains why SOM, AHN, AK, and AP were generally higher in zones where fine particles and soil moisture increased, while sandy zones showed weaker nutrient accumulation. Among these indicators, the spatial pattern of SOM most clearly reflected differences in plant input. In QY and JZ, SOM reached 1.87 and 1.16 g·kg−1, respectively, both under the treatment combining reed mulch with Atriplex canescens planting along the front edge, whereas in BX, the lowest value was only 0.32 g·kg−1. This pattern suggests that organic matter was more easily retained and accumulated in relatively stable positions when surface cover and shrub input occurred together. Reed mulch reduced surface wind erosion, while Atriplex canescens provided continuous organic input through litter return and root turnover. SOM increased most clearly under the composite restoration measure [39].
Available nutrient patterns also pointed to differences in rhizosphere processes among restoration pathways. AHN reached 6.87 and 6.58 mg·kg−1 in QY and BX, respectively. AK was 63.44 mg·kg−1 in QY and 60.67 mg·kg−1 in JZ, while AP reached 1.68 mg·kg−1 in JZ. These higher values occurred mainly in treatments where shrub effects at the panel front edge were stronger. Atriplex canescens has a well-developed root system and relatively high rhizosphere activity. It more directly promotes nitrogen mineralisation, potassium activation, and local nutrient redistribution. Responses in AHN and AK were therefore more evident. The treatment combining reed mulch and grass seeding mainly improved surface cover and the local moist environment. Except for AK in BX, which reached 57.03 mg·kg−1, the other nutrient indicators remained generally low. At this stage, grass-based restoration had not yet formed a stable vegetation–soil feedback process. The main constraint was not the cover itself, but the slow establishment of the herbaceous community, limited litter return, and weaker rhizosphere effects than under shrub planting.
Nutrient responses under the three restoration measures were not confined to changes in a single indicator. They reflected the combined effects of organic input, fine-particle retention, soil moisture conservation, and rhizosphere transformation. Aeolian sandy soil has low clay and silt contents, weak aggregation, and poor water-holding capacity. Fine particles and nutrients are also easily removed by wind erosion. Under this soil background, a short-term increase in one nutrient does not represent stable fertility recovery. The more critical process is whether vegetation restoration can support a continuous vegetation–soil feedback.
This feedback is formed through linked surface and biological processes. Vegetation cover and reed mulch reduce near-surface wind erosion and help retain clay and silt fractions. These fine particles provide adsorption sites for organic matter and available nutrients. Higher soil moisture supports root activity and microbial transformation, allowing litter return and root turnover to contribute to SOM and available nutrients. Shrub establishment, especially Atriplex canescens planting along the panel front edge, provides relatively stable organic input and rhizosphere activity. When surface protection, water retention, and plant input occur together, soil fertility can shift from short-term fluctuation to gradual accumulation.
The three restoration measures differed in the continuity of this feedback. M1 combined front-edge shrub interception with reed mulch, linking surface stabilization, fine-particle retention, soil water conservation, and organic input. This was consistent with the higher SOM values under M1 in QY and JZ. M2 depended mainly on A. canescens planting, and its nutrient response was more closely related to rhizosphere activation and local redistribution of available nutrients. M3 improved surface cover and local moisture conditions, but the herbaceous community was still at an early establishment stage, with weaker litter return and rhizosphere effects than shrub-based restoration. Thus, vegetation restoration in desert photovoltaic power stations should focus on building a stable pathway connecting surface protection, vegetation growth, fine-particle retention, and nutrient accumulation, rather than on the temporary increase in a single nutrient.

4.3. Windbreak and Sand-Fixing Effects of the Three Vegetation Restoration Measures

Differences in windbreak and sand-fixing effects among the three restoration measures were related to how each measure changed near-surface roughness, airflow structure, and sand transport [17]. After the flexible-support photovoltaic array was established, wind-speed redistribution and sediment accumulation differed among the panel front-edge zone, under-panel zone, and pedestal zone. Wind–sand transport within the array was no longer a continuous process over bare sand, but involved front-edge interception, local deposition, and partial retransport. Atriplex canescens planted along the panel front edge mainly weakened and deflected incoming flow, whereas reed mulch and herbaceous cover mainly increased surface roughness and reduced near-ground shear stress. The effects of the three restoration measures, therefore, depended on the spatial coupling between shrub interception and surface cover.
The combination of reed mulch and A. canescens planting provided both front-edge interception and surface protection. Incoming flow was weakened at the panel front edge, and saltating particles were sorted and deposited as they entered the array. Reed mulch then increased bed-surface roughness and reduced effective shear in the near-surface layer, limiting the recovery of sand transport toward the under-panel and pedestal zones. This explains why M1 maintained higher windbreak efficiency and stronger spatial continuity of sand-fixing effect [40].
Planting A. canescens only along the panel front edge changed the incoming sand-transport pathway and promoted particle deposition near the front-edge interface. Its effect also extended partly toward the under-panel zone, but the lack of continuous surface cover limited its capacity to suppress re-entrainment inside the array. In contrast, reed mulch combined with grass seeding mainly acted through surface cover and near-surface erosion suppression [41]. Its effect was concentrated in the lower layer and the panel front-edge zone, while its extension toward the array interior was weaker. The overall difference between M2 and M3 should therefore be interpreted as a difference in dominant process and spatial expression, rather than as a statistically supported ranking of total protective performance.
Changes in the mechanical composition of wind-eroded materials were consistent with this process. After restoration, fine sand decreased, and medium sand increased, but this pattern should be interpreted as a relative compositional shift after the reduction in finer transported fractions, rather than as direct evidence of true grain coarsening. The cumulative sand-fixing efficiency, calculated from the total collected sand mass, showed that restoration measures reduced the overall wind-eroded material captured by the collectors. Thus, the higher medium sand proportion reflected the lower contribution of finer particles to the collected wind-eroded materials. M1 and M2 showed relatively stronger effects on incoming sediment sorting, while M3 was more closely associated with local near-surface sand trapping. Thus, the three measures corresponded to different combinations of incoming-flow weakening, surface erosion suppression, and internal sand stabilization. Windbreak and sand-fixing performance depended on whether these control links were connected across the functional zones of the photovoltaic array [38].

4.4. Integrated Effects of the Three Vegetation Restoration Measures and Implications for Zonal Configuration

The differences among the three restoration measures were mainly reflected in their functional roles and spatial suitability, rather than in a simple ranking of overall performance. The measure combining reed mulch with Atriplex canescens planting along the panel front edge showed stronger spatial continuity in fine-particle retention, soil water conservation, organic matter accumulation, and sand fixation, and can be used as the core measure for overall protection [42]. M2 and M3 had comparable overall protective effects, but their dominant functions differed. M2 was more closely related to front-edge shrub interception, sand-transport regulation, and the extension of protective effects toward the under-panel zone [43]. M3 was more closely associated with surface cover, near-surface sand trapping, and local water conservation in the panel front-edge zone. This difference has practical value for zonal configuration, but it does not support a simple overall ranking between M2 and M3. Vegetation restoration in desert photovoltaic power stations should therefore be arranged by functional zone according to wind–sand input intensity, sediment redistribution, and restoration objectives [44].
The upwind outer edge and dominant air inlets are strongly affected by wind–sand input and are prone to surface destabilization. In these areas, a composite protective belt combining reed mulch with front-edge planting of A. canescens can strengthen front-edge interception, promote fine-particle deposition, improve water retention in deeper soil layers, and reduce the continued disturbance of incoming wind–sand flow within the array [45]. In the middle of the array, the main task shifts from outer-edge interception to structural maintenance and local regulation [28]. Front-edge planting of A. canescens can serve as the main framework for controlling under-panel redeposition and maintaining available nutrient accumulation [46]. Where sand reactivation is strong or the surface remains exposed, reed mulch can be added locally to improve surface-cover continuity. In downwind and depositional zones, reed mulch combined with grass seeding can be used for local sand trapping, surface cover, and moisture conservation. In pedestal zones and along passage edges, where deposited sand can be reactivated, shrub reinforcement combined with surface cover can further improve local stability [47].
Accordingly, the zonal configuration pattern of “composite interception in the upwind zone, framework maintenance in the middle of the array, and cover-based sand trapping in the downwind zone” better matches the spatial differentiation of wind–sand processes and soil recovery within photovoltaic arrays [48]. This pattern is not a simple combination of the three restoration measures, but a targeted arrangement based on their functional roles. The composite measure undertakes outer-edge protection and overall stabilization, M2 supports middle-zone maintenance and local regulation, and M3 contributes to sediment fixation and local water conservation in front-edge or depositional zones. Compared with the uniform application of a single restoration measure, this zonal configuration can improve the targeting and persistence of protective effects [49].
This study still has limitations. The field observations were conducted in April and November 2025, and the averaged values were used to compare restoration measures and functional zones. This design did not fully resolve seasonal variation in wind–sand activity, soil moisture redistribution, and nutrient accumulation. The study was also conducted at one high-clearance flexible-support photovoltaic power station, so the results need to be tested under different panel layouts, surface conditions, and desert types. In addition, the restoration measures were still at an early stage, and the long-term stability of reed mulch, herbaceous establishment, Atriplex canescens growth, and vegetation–soil feedback requires further monitoring. Future work should extend field observations to multiple years, include more photovoltaic power station types, and combine wind–sand process measurements with vegetation and soil monitoring to verify the persistence of the proposed zonal restoration strategy.

5. Conclusions

This study evaluated three vegetation restoration measures in a high-clearance flexible-support photovoltaic power station at the edge of the Kubuqi Desert, using the panel front-edge zone, under-panel zone, and pedestal zone as functional units. The results show that restoration effects within the photovoltaic array were spatially differentiated, and that the protective effect of a restoration measure depended on the connection among front-edge interception, surface stabilization, soil water retention, nutrient accumulation, and sand fixation.
(1)
All three restoration measures changed the surface sediment structure and soil moisture conditions. Mz ranged from 2.005 to 2.364, and D0 ranged from 1.459 to 1.935. Soil moisture ranged from 0.58% to 4.34%, with the highest value occurring in the 20–30 cm layer of QY under M1. The panel front-edge zone and under-panel zone were the most sensitive positions for sediment redistribution and soil water variation, indicating that restoration effects cannot be evaluated only at the whole-station scale.
(2)
Nutrient responses differed among restoration measures and functional zones. M1 showed higher SOM in QY and JZ, reaching 1.87 and 1.16 g·kg−1, respectively. M2 was more closely related to locally available nutrient activation, while M3 mainly improved surface cover and local moisture conditions. These results indicate that the key to soil improvement is not the short-term increase in a single nutrient, but the formation of a continuous pathway linking fine-particle retention, soil moisture conservation, organic input, and nutrient accumulation.
(3)
All three restoration measures increased surface roughness, weakened near-surface airflow, and improved sand fixation. M1 showed the strongest and most spatially continuous protective effect. Its windbreak efficiency decreased only from 61.16% at 10 cm to 55.52% at 100 cm, and its total cumulative sand-fixing efficiency reached 233.66%. M2 and M3 had comparable total cumulative sand-fixing efficiencies, at 215.05% and 214.58%, respectively, but their zonal responses differed. M2 maintained a stronger extension toward the under-panel zone, whereas M3 showed a more concentrated response in near-surface sand trapping and the panel front-edge zone.
(4)
The main contribution of this study is that it identifies the functional-zone gap in vegetation restoration evaluation for desert photovoltaic power stations. Previous assessments have mainly focused on whole-station responses or single indicators, while this study shows that wind-erodible sediment redistribution, soil moisture, soil nutrients, windbreak efficiency, and cumulative sand-fixing efficiency are linked differently across QY, BX, and JZ. This finding supports a zonal restoration strategy: composite interception in the panel front-edge zone, structural maintenance in the under-panel zone, and cover-based sand trapping in deposition-prone areas.

Author Contributions

Z.M.: Conceptualization, methodology, supervision, Writing—review and editing, funding acquisition. X.L.: Conceptualization, investigation, methodology, data curation, visualization, writing—original draft. H.L.: Investigation, methodology, Writing—review and editing. G.T.: Investigation, methodology, Writing—review and editing. J.Y. (Jixin Yang): Investigation, data curation, validation, resources, Writing—review and editing. J.Y. (Jiye Yang): Investigation, data curation, validation, resources, Writing—review and editing. All authors have read and agreed to the published version of the manuscript.

Funding

This work was supported by the Research Project on Integrated Sand Hazard Control Technologies for Photovoltaic Power Stations in Sandy Areas (2025YFHH0151), the Huaneng Group Science and Technology Project (HNKJ24-H116), the Fundamental Research Funds for Universities Directly under the Inner Mongolia Autonomous Region (BR22-13-03), and the Inner Mongolia Natural Science Foundation (2024MS04019).

Data Availability Statement

The raw data supporting the conclusions of this article will be made available by the authors on request.

Conflicts of Interest

Jixin Yang is employed by Hohhot City Investment and Construction Group Co., Ltd. Jiye Yang is employed by the Bureau of Agriculture, Animal Husbandry and Science and Technology of Zhuozi County. Their employers had no role in the study design; data collection, analysis, or interpretation; preparation of the manuscript; or the decision to publish. The remaining authors declare no conflicts of interest.

Abbreviations

AbbreviationsFull term
PVPhotovoltaic
CKUntreated control
M1Reed mulch + Atriplex canescens planting along the panel front edge
M2Atriplex canescens planting along the panel front edge alone
M3Reed mulch + grass seeding
QYPanel front-edge zone
BXUnder-panel zone
JZPedestal zone
SWCSoil moisture content
SOMSoil organic matter
AHNAlkali-hydrolyzable nitrogen
APAvailable phosphorus
AKAvailable potassium
MzMean grain size
SdStandard deviation of grain size
SkSkewness
KgKurtosis
D0Fractal dimension
ANOVAAnalysis of variance
LSDLeast significant difference
BSNEBig Spring Number Eight sand collector
MMRMonthly mean rainfall
MMEMonthly mean evaporation
MMATMonthly mean air temperature
MMRHMonthly mean relative humidity

References

  1. Kong, D.; Wu, H.; Wang, M.; Simmons, M.; Lü, X.; Yu, Q.; Han, X. Structural and Chemical Differences between Shoot- and Root-Derived Roots of Three Perennial Grasses in a Typical Steppe in Inner Mongolia China. Plant Soil 2010, 336, 209–217. [Google Scholar] [CrossRef] [Scilit]
  2. Yue, S.; Wu, W.; Zhou, X.; Ren, L.; Wang, J. The Influence of Photovoltaic Panels on Soil Temperature in the Gonghe Desert Area. Environ. Eng. Sci. 2021, 38, 911–920. [Google Scholar] [CrossRef] [Scilit]
  3. Ezzaeri, K.; Fatnassi, H.; Bouharroud, R.; Gourdo, L.; Bazgaou, A.; Wifaya, A.; Demrati, H.; Bekkaoui, A.; Aharoune, A.; Poncet, C.; et al. The Effect of Photovoltaic Panels on the Microclimate and on the Tomato Production under Photovoltaic Canarian Greenhouses. Sol. Energy 2018, 173, 1126–1134. [Google Scholar] [CrossRef] [Scilit]
  4. Binz, C.; Tang, T.; Huenteler, J. Spatial Lifecycles of Cleantech Industries—The Global Development History of Solar Photovoltaics. Energy Policy 2017, 101, 386–402. [Google Scholar] [CrossRef] [Scilit]
  5. Gan, F. Soil Quality Assessment of Karst Trough Valley under Different Bedrock Strata Dip and Land-Use Types, Based on a Minimum Data Set. CATENA 2024, 241, 108048. [Google Scholar] [CrossRef] [Scilit]
  6. Wang, X. Spatial and Temporal Variations in Surface Soil Moisture and Vegetation Cover in the Loess Plateau from 2000 to 2015. Ecol. Indic. 2018, 95, 320–330. [Google Scholar] [CrossRef] [Scilit]
  7. Luo, Z.; Luo, J.; Wu, S.; Luo, X.; Sui, X. Soil Bacterial Community in a Photovoltaic System Adopted Different Survival Strategies to Cope with Small-Scale Light Stress under Different Vegetation Restoration Modes. Front. Microbiol. 2024, 15, 1365234. [Google Scholar] [CrossRef] [Scilit] [PubMed]
  8. Shi, J. Recalcitrant Organic Carbon Plays a Key Role in Soil Carbon Sequestration along a Long-Term Vegetation Succession on the Loess Plateau. CATENA 2023, 233, 107528. [Google Scholar] [CrossRef] [Scilit]
  9. Uldrijan, D. Ecological Effects of Preferential Vegetation Composition Developed on Sites with Photovoltaic Power Plants. Ecol. Eng. 2021, 168, 106274. [Google Scholar] [CrossRef] [Scilit]
  10. Orr, F.M. Addressing Climate Change with Clean Energy Technology. ACS Energy Lett. 2016, 1, 113–114. [Google Scholar] [CrossRef] [Scilit]
  11. Huang, B.; Li, Z.; Zhao, Z.; Wu, H.; Zhou, H.; Cong, S. Near-Ground Impurity-Free Wind and Wind-Driven Sand of Photovoltaic Power Stations in a Desert Area. J. Wind Eng. Ind. Aerodyn. 2018, 179, 483–502. [Google Scholar] [CrossRef] [Scilit]
  12. Monnens, D.; Denison, R.F.; Sadok, W. Rising Vapor-pressure Deficit Increases Nitrogen Fixation in a Legume Crop. New Phytol. 2023, 239, 54–65. [Google Scholar] [CrossRef] [Scilit] [PubMed]
  13. Tang, G.; Meng, Z.; Gao, Y.; Dang, X. Impact of Utility-Scale Solar Photovoltaic Array on the Aeolian Sediment Transport in Hobq Desert, China. J. Arid. Land 2021, 13, 274–289. [Google Scholar] [CrossRef] [Scilit]
  14. Javed, W.; Guo, B.; Figgis, B.; Martin Pomares, L.; Aïssa, B. Multi-Year Field Assessment of Seasonal Variability of Photovoltaic Soiling and Environmental Factors in a Desert Environment. Sol. Energy 2020, 211, 1392–1402. [Google Scholar] [CrossRef] [Scilit]
  15. Li, B.; Lei, C.; Zhang, W.; Olawoore, V.S.; Shuai, Y. Numerical Model Study on Influences of Photovoltaic Plants on Local Microclimate. Renew. Energy 2024, 221, 119551. [Google Scholar] [CrossRef] [Scilit]
  16. Zheng, Y.; Wang, H.; Yang, M.; Peng, G.; Dong, T.T.X.; Xu, M.L.; Tsim, K.W.K. Prenylated Flavonoids from Roots of Glycyrrhiza Uralensis Induce Differentiation of B16-F10 Melanoma Cells. Int. J. Mol. Sci. 2018, 19, 2422. [Google Scholar] [CrossRef] [Scilit] [PubMed]
  17. Liu, Y.; Zhang, R.-Q.; Ma, X.-R.; Wu, G.-L. Combined Ecological and Economic Benefits of the Solar Photovoltaic Industry in Arid Sandy Ecosystems. J. Clean. Prod. 2020, 262, 121376. [Google Scholar] [CrossRef] [Scilit]
  18. Paul, G.C.; Saha, S.; Ghosh, K.G. Assessing the Soil Quality of Bansloi River Basin, Eastern India Using Soil-Quality Indices (SQIs) and Random Forest Machine Learning Technique. Ecol. Indic. 2020, 118, 106804. [Google Scholar] [CrossRef] [Scilit]
  19. Knapp, A.K.; Sturchio, M.A. Ecovoltaics in an Increasingly Water-Limited World: An Ecological Perspective. One Earth 2024, 7, 1705–1712. [Google Scholar] [CrossRef] [Scilit]
  20. Raiesi, F. A Minimum Data Set and Soil Quality Index to Quantify the Effect of Land Use Conversion on Soil Quality and Degradation in Native Rangelands of Upland Arid and Semiarid Regions. Ecol. Indic. 2017, 75, 307–320. [Google Scholar] [CrossRef] [Scilit]
  21. Meng, R.; Meng, Z.; Jia, R.; Li, H.; Cai, J.; Gao, Y. Positive Soil Responses to Different Vegetation Restoration Measures in Desert Photovoltaic Power Stations. Front. Plant Sci. 2025, 16, 1607404. [Google Scholar] [CrossRef] [Scilit] [PubMed]
  22. De Araújo Barbosa Borges, L.; Ramos, M.L.G.; Fernandes, P.M.; Carneiro, M.A.C.; Silva, A.M.M. Organic Cultivation of Sugarcane Restores Soil Organic Carbon and Nitrogen. Org. Agric. 2019, 9, 435–444. [Google Scholar] [CrossRef] [Scilit]
  23. Gootman, K.; Kellner, E.; Hubbart, J. A Comparison and Validation of Saturated Hydraulic Conductivity Models. Water 2020, 12, 2040. [Google Scholar] [CrossRef] [Scilit]
  24. Yue, S.; Guo, M.; Zou, P.; Wu, W.; Zhou, X. Effects of Photovoltaic Panels on Soil Temperature and Moisture in Desert Areas. Environ. Sci. Pollut. Res. 2021, 28, 17506–17518. [Google Scholar] [CrossRef] [Scilit] [PubMed]
  25. Shen, M.S.; Zhang, J.J.; Zhang, S.H.; Zhang, H.B.; Sun, R.X.; Zhang, Y.Z. Seasonal Variations in the Influence of Vegetation Cover on Soil Water on the Loess Hillslope. J. Mt. Sci. 2020, 17, 2148–2160. [Google Scholar] [CrossRef] [Scilit]
  26. Chen, X.; Chen, B.; Wang, Y.; Zhou, N.; Zhou, Z. Response of Vegetation and Soil Property Changes by Photovoltaic Established Stations Based on a Comprehensive Meta-Analysis. Land 2024, 13, 478–496. [Google Scholar] [CrossRef] [Scilit]
  27. Raiesi, F.; Pejman, M. Assessment of Post-Wildfire Soil Quality and Its Recovery in Semi-Arid Upland Rangelands in Central Iran through Selecting the Minimum Data Set and Quantitative Soil Quality Index. CATENA 2021, 201, 105202. [Google Scholar] [CrossRef] [Scilit]
  28. Cai, J.; Meng, Z.; Meng, R.; Li, H.; Chen, X.; Ren, X.; Guo, L.; Hao, M. Exploring a Path of Vegetation Restoration Best Suited for a Photovoltaic Plant in the Hobq Desert. Front. Environ. Sci. 2024, 12, 1380421. [Google Scholar] [CrossRef] [Scilit]
  29. Armstrong, A.C. On the Fractal Dimensions of Some Transient Soil Properties. J. Soil Sci. 1986, 37, 641–652. [Google Scholar] [CrossRef] [Scilit]
  30. Nelson, D.W.; Sommers, E. Total Carbon, Organic Carbon, and Organic Matterl. In Methods of Soil Analysis; Chapter 29; John Wiley & Sons: Hoboken, NJ, USA, 1982; pp. 1–41. [Google Scholar]
  31. Chen, B.; Yang, H.; Song, W.; Liu, C.; Xu, J.; Zhao, W.; Zhou, Z. Effect of N Fertilization Rate on Soil Alkali-Hydrolyzable N, Subtending Leaf N Concentration, Fiber Yield, and Quality of Cotton. Crop J. 2016, 4, 323–330. [Google Scholar] [CrossRef] [Scilit]
  32. Munhoz, R.D.O.; Berton, R.S.; Camargo, O.A.D. Phosphorus Sorption and Redistribution on Soil Solid Phase in a Brazilian Haplorthox Amended with Biosolids. Appl. Environ. Soil Sci. 2011, 2011, 283061. [Google Scholar] [CrossRef] [Scilit]
  33. Gao, T.; Gao, M.; Peng, J.; Li, N. Effects of Different Amount of Biochar on Nitrogen, Phosphorus and Potassium Nutrients in Soil. IOP Conf. Ser. Mater. Sci. Eng. 2018, 394, 22043. [Google Scholar] [CrossRef] [Scilit]
  34. Li, P.; Luo, Y.; He, Z.; Zheng, J.; Xia, X.; Liao, Z.; Gao, X. A Comparative Study of the Effects of Photovoltaic Power Plants in Desert and Lake on the Microclimate. Energy Rep. 2023, 10, 2128–2137. [Google Scholar] [CrossRef] [Scilit]
  35. Xiao, B.; Wang, J.-H.; Zhou, C.-Y.; Chen, J.-M.; Zhang, N.; Zhao, N.; Han, X.-Y.; Niu, Y.-X.; Feng, Y.-B.; Du, G.-H. Ethno-Medicinal Study of Artemisia ordosica Krasch. (Traditional Chinese/Mongolian Medicine) Extracts for the Treatment of Allergic Rhinitis and Nasosinusitis. J. Ethnopharmacol. 2020, 248, 112262. [Google Scholar] [CrossRef] [Scilit] [PubMed]
  36. Wu, J.; Wang, H.; Li, G.; Ma, W.; Wu, J.; Gong, Y.; Xu, G. Vegetation Degradation Impacts Soil Nutrients and Enzyme Activities in Wet Meadow on the Qinghai-Tibet Plateau. Sci. Rep. 2020, 10, 21271. [Google Scholar] [CrossRef] [Scilit] [PubMed]
  37. Weltzin, J.F.; Coughenour, M.B. Savanna Tree Influence on Understory Vegetation and Soil Nutrients in Northwestern Kenya. J. Veg. Sci. 1990, 1, 325–334. [Google Scholar] [CrossRef] [Scilit]
  38. Sinke, W.C. Development of Photovoltaic Technologies for Global Impact. Renew. Energy 2019, 138, 911–914. [Google Scholar] [CrossRef] [Scilit]
  39. Kobayashi, T.; Liao, R.-T.; Li, S.-Q. Ecophysiological Behavior of Artemisia ordosica on the Process of Sand Dune Fixation. Ecol. Res. 1995, 10, 339–349. [Google Scholar] [CrossRef] [Scilit]
  40. Chang, Z.; Liu, S.; Fu, J.; Wang, Q.; Wang, F.; Sun, T.; Liu, S.; Wang, F. Effect of Desert Photovoltaic on Sand Prevention and Control—Taking Gansu Gulang Zhenfa Photovoltaic DC Field as an Example. IOP Conf. Ser. Earth Environ. Sci. 2020, 601, 12032. [Google Scholar] [CrossRef] [Scilit]
  41. Randle-Boggis, R.J.; White, P.C.L.; Cruz, J.; Parker, G.; Montag, H.; Scurlock, J.M.O.; Armstrong, A. Realising Co-Benefits for Natural Capital and Ecosystem Services from Solar Parks: A Co-Developed, Evidence-Based Approach. Renew. Sustain. Energy Rev. 2020, 125, 109775. [Google Scholar] [CrossRef] [Scilit]
  42. Sansaniwal, S.K. Energy and Exergy Analyses of Various Typical Solar Energy Applications—A Comprehensive Review. Renew. Sustain. Energy Rev. 2018, 82, 1576–1601. [Google Scholar] [CrossRef] [Scilit]
  43. Tan, Y. Agrivoltaics Development Progresses: From the Perspective of Photovoltaic Impact on Crops, Soil Ecology and Climate. Environ. Res. 2025, 266, 120540. [Google Scholar] [CrossRef] [Scilit] [PubMed]
  44. Vasu, D. Soil Quality Index (SQI) as a Tool to Evaluate Crop Productivity in Semi-Arid Deccan Plateau, India. Geoderma 2016, 282, 70–79. [Google Scholar] [CrossRef] [Scilit]
  45. El Chaar, L.; Lamont, L.A.; El Zein, N. Review of Photovoltaic Technologies. Renew. Sustain. Energy Rev. 2011, 15, 2165–2175. [Google Scholar] [CrossRef] [Scilit]
  46. Kavga, A.; Trypanagnostopoulos, G.; Zervoudakis, G.; Tripanagnostopoulos, Y. Growth and Physiological Characteristics of Lettuce (Lactuca sativa L.) and Rocket (Eruca sativa Mill.) Plants Cultivated under Photovoltaic Panels. Not. Bot. Horti Agrobot. Cluj-Napoca 2018, 46, 206–212. [Google Scholar] [CrossRef] [Scilit]
  47. Choi, C.S.; Cagle, A.E.; Macknick, J.; Bloom, D.E.; Caplan, J.S.; Ravi, S. Effects of Revegetation on Soil Physical and Chemical Properties in Solar Photovoltaic Infrastructure. Front. Environ. Sci. 2020, 8, 141–148. [Google Scholar] [CrossRef] [Scilit]
  48. Pourasl, H.H. Solar Energy Status in the World: A Comprehensive Review. Energy Rep. 2023, 10, 3474–3493. [Google Scholar] [CrossRef] [Scilit]
  49. Meng, R.; Meng, Z.; Ren, X.; Cai, J.; Tong, X. Positive Impacts of Typical Desert Photovoltaic Scenarios in China on the Growth and Physiology of Sand-Adapted Plants. Front. Plant Sci. 2025, 15, 1515896. [Google Scholar] [CrossRef] [Scilit] [PubMed]
Figure 1. Location of the study area.
Processes 14 02332 g001
Figure 2. Experimental design of vegetation restoration plots in the photovoltaic power station.
Processes 14 02332 g002
Figure 3. Wind rose and wind-speed measurement.
Processes 14 02332 g003
Figure 4. Monthly variation characteristics of meteorological factors in the study area in 2025. MMR, MME, MMAT, and MMRH represent monthly mean rainfall, monthly mean evaporation, monthly mean air temperature, and monthly mean relative humidity, respectively.
Processes 14 02332 g004
Figure 5. Grain-size composition of surface sediments under different vegetation restoration measures.
Processes 14 02332 g005
Figure 6. Correlations among grain-size parameters of surface sediments under different vegetation restoration measures.
Processes 14 02332 g006
Figure 7. Soil moisture content under different vegetation restoration measures.
Processes 14 02332 g007
Figure 8. Soil nutrients under different vegetation restoration measures.
Processes 14 02332 g008
Figure 9. Correlations among soil indicators under different vegetation restoration measures. Correlations among soil indicators under different vegetation restoration measures: (a) M1, reed mulch combined with Atriplex canescens planting along the panel front edge; (b) M2, Atriplex canescens planting along the panel front edge alone; (c) M3, reed mulch combined with grass seeding.
Processes 14 02332 g009
Figure 10. Windbreak efficiency under different vegetation restoration measures.
Processes 14 02332 g010
Figure 11. Cumulative sand-fixing efficiency under different vegetation restoration measures.
Processes 14 02332 g011
Figure 12. Mechanical composition of wind-eroded materials under different vegetation restoration measures.
Processes 14 02332 g012
Table 1. Representative studies on photovoltaic–ecosystem interactions in arid and semiarid regions.
StudyMain FocusMain ContributionRemaining Gap Related to This Study
Huang et al. [11]Wind and wind-driven sand around photovoltaic power stationsClarified how photovoltaic facilities influence near-ground wind and sand movement in desert areasDid not evaluate vegetation restoration measures or soil improvement within internal array zones
Yue et al. [24]Soil temperature and moisture under photovoltaic panelsShowed that photovoltaic panels alter soil hydrothermal conditions in desert areasFocused mainly on soil temperature and moisture, with limited linkage to wind–sand protection
Tang et al. [13]Aeolian sediment transport in utility-scale photovoltaic arraysDemonstrated that photovoltaic arrays affect aeolian sediment transport in the Hobq DesertDid not compare different vegetation restoration measures or their zonal effects
Chen et al. [26]Vegetation and soil responses after photovoltaic station constructionSynthesized vegetation and soil property changes after photovoltaic constructionProvided broad-scale evidence, but did not resolve functional-zone differences within arrays
Meng et al. [21]Soil responses to vegetation restoration in desert photovoltaic power stationsReported positive soil responses under different restoration measuresFocused mainly on soil improvement, with less emphasis on coupled wind erosion control and zonal sand-fixing performance
Cai et al. [28]Vegetation restoration pathways in a photovoltaic plant in the Hobbq DesertCompared restoration pathways and soil improvement effectsDid not explicitly link sediment redistribution, windbreak efficiency, and cumulative sand-fixing effects across QY, BX, and JZ
Table 2. Grain-size characteristics of surface sediments under different vegetation restoration measures.
MzSdSkKgD0
M1QY2.311 ± 0.132 a0.593 ± 0.071 a0.113 ± 0.031 a1.045 ± 0.086 a1.935 ± 0.158 a
BX2.264 ± 0.085 b0.565 ± 0.048 b0.083 ± 0.022 b0.993 ± 0.054 b1.793 ± 0.101 b
JZ2.341 ± 0.167 a0.562 ± 0.061 b0.065 ± 0.018 c0.987 ± 0.049 b1.686 ± 0.087 c
M2QY2.222 ± 0.079 b0.556 ± 0.039 a0.061 ± 0.015 b0.976 ± 0.035 b1.598 ± 0.064 b
BX2.364 ± 0.193 a0.580 ± 0.102 a0.099 ± 0.037 a1.011 ± 0.073 a1.823 ± 0.166 a
JZ2.264 ± 0.116 b0.562 ± 0.058 a0.071 ± 0.026 b0.992 ± 0.052 a1.761 ± 0.109 a
M3QY2.214 ± 0.073 a0.574 ± 0.065 a0.060 ± 0.019 a0.975 ± 0.041 a1.549 ± 0.058 a
BX2.047 ± 0.181 b0.564 ± 0.051 a0.067 ± 0.028 a0.974 ± 0.047 a1.562 ± 0.096 a
JZ2.005 ± 0.143 b0.567 ± 0.089 a0.061 ± 0.021 a0.974 ± 0.038 a1.459 ± 0.131 b
CK2.166 ± 0.0970.556 ± 0.0530.062 ± 0.0200.927 ± 0.0611.655 ± 0.084
Note: Values are presented as mean ± SD. Within the same vegetation restoration measure and grain-size parameter, different lowercase letters indicate significant differences among QY, BX, and JZ (p < 0.05), whereas identical letters indicate no significant difference.
Table 3. Aerodynamic roughness length under different vegetation restoration measures at different wind speeds.
Wind Speed (m/s)Restoration MeasureFitted Equation of the Wind-Speed ProfileR2Aerodynamic Roughness Length/cm
4.77M1y = 0.03 + 0.43In(z)0.980.92
M1 CKy = 1.35 + 0.67In(z)0.980.14
M2y = 0.51 + 0.41In(z)0.980.29
M2 CKy = 1.35 + 0.67In(z)0.980.14
M3y = 0.43 + 0.34In(z)0.970.28
M3 CKy = 1.35 + 0.67In(z)0.970.14
6.68M1y = −0.08 + 0.65In(z)0.991.14
M1 CKy = 2.03 + 0.92In(z)0.970.11
M2y = 0.38 + 0.65In(z)0.980.55
M2 CKy = 2.03 + 0.92In(z)0.970.11
M3y = 0.26 + 0.59In(z)0.970.64
M3 CKy = 1.76 + 0.99In(z)0.970.17
8.53M1y = 0.09 + 0.81In(z)0.990.9
M1 CKy = 2.61 + 1.2In(z)0.980.11
M2y = 0.64 + 0.78In(z)0.980.44
M2 CKy = 2.2 + 1.24In(z)0.980.17
M3y = 0.12 + 0.83In(z)0.990.87
M3 CKy = 2.2 + 1.24In(z)0.980.17
Disclaimer/Publisher’s Note: The statements, opinions and data contained in all publications are solely those of the individual author(s) and contributor(s) and not of MDPI and/or the editor(s). MDPI and/or the editor(s) disclaim responsibility for any injury to people or property resulting from any ideas, methods, instructions or products referred to in the content.