Article

Sloshing-Induced Thermo-Hydrodynamic Characteristics of Onboard Liquid Hydrogen Cylinders: Effects of Filling Ratio

1
School of Automobile and Traffic Engineering, Jiangsu University, 301 Xuefu Road, Zhenjiang 212013, China
2
School of Automotive Engineering, Wuhu University, No. 47, Zhongshan North Road, Jiujiang District, Wuhu 241008, China
*
Author to whom correspondence should be addressed.
Processes 2026, 14(12), 2005; https://doi.org/10.3390/pr14122005
Submission received: 27 March 2026 / Revised: 6 May 2026 / Accepted: 13 May 2026 / Published: 20 June 2026
(This article belongs to the Section Chemical Processes and Systems)

Abstract

The safety and stability of onboard Liquid Hydrogen (LH2) storage systems depend strongly on gas–liquid two-phase flow, heat transfer, and phase change under sloshing; however, the coupled influence of filling ratio and sloshing on thermo-hydrodynamic behavior remains underexplored. We develop a Volume of Fluid (VOF)-based two-phase Computational Fluid Dynamics (CFD) model in ANSYS Fluent to quantify interfacial dynamics, pressure response, and temperature-field evolution in LH2 tanks subjected to sinusoidal acceleration for filling ratios from 10% to 90%. Increasing the filling ratio strengthens net condensation in the ullage and thus intensifies depressurization. As the filling ratio increases from 10% to 90%, the pressure reduction over the 2.0 s sloshing process increases from 0.418 kPa to 2.410 kPa, and the corresponding initial depressurization rate rises from 0.209 to 1.205 kPa s−1. Free-surface motion decreases with filling ratio: at 10%, large interface excursions can induce gas-cavity formation and splashing, increasing the risk of intermittent propellant supply, whereas at 90% the interface is constrained and oscillations are suppressed. Higher filling ratios lead to faster ullage cooling and larger temperature oscillations. The liquid warms modestly, and its warming rate decreases nonlinearly with filling ratio, consistent with the larger effective thermal mass at higher fillings. Overall, the obtained mechanistic understanding can support the engineering design of onboard LH2 tanks, including filling-ratio selection and thermal-management optimization under sloshing conditions.

1. Introduction

With ongoing industrial modernization in China, the vehicle fleet has expanded markedly. Although conventional fuel-powered vehicles continue to meet transportation demands, pollutants such as carbon monoxide and nitrogen oxides emitted during fossil-fuel combustion threaten public health and contribute to global warming [1,2]. Under the dual pressures of environmental constraints and energy security, renewable-energy options for transportation have attracted increasing attention. Hydrogen, as an energy carrier with high gravimetric energy density and near-zero tailpipe emissions in fuel-cell applications, has gained particular interest [3]. Compared with high-pressure gaseous and solid-state storage, Liquid Hydrogen (LH2) storage leverages cryogenic liquefaction to achieve higher volumetric density, alleviating pressure-related constraints and volumetric limitations of conventional approaches and thereby enhancing onboard hydrogen capacity and overall system efficiency [4].
In this context, advances in onboard LH2 storage tanks are critical for improving cryogenic storage performance, extending driving range, and reducing reliance on refueling infrastructure. However, owing to its low kinematic viscosity, LH2 is prone to pronounced sloshing under vehicle dynamics and inertial excitation. These coupled fluid–structure interactions can compromise tank integrity and system stability, constituting a key challenge for safe onboard LH2 storage [5]. Computational Fluid Dynamics (CFD) has therefore been widely applied to investigate heat transfer, phase change, self-pressurization, and pressure-control strategies in cryogenic LH2 tanks. Li et al. [6] employed Reynolds-averaged Navier–Stokes (RANS) equations coupled with the Volume of Fluid (VOF) method to quantify how inlet mass flow rate, injection temperature, injector configuration, and pressurant gas type affect pressurization dynamics. Liu et al. [7] used a two-dimensional CFD framework to resolve multiphysics fields in LH2 tanks under varying ullage pressures, with emphasis on thermal stratification. Shuang and Liu [8] analyzed pressure oscillations and thermal-performance degradation during depressurization cycles under microgravity. Zhou et al. [9] modeled self-pressurization driven by heat leakage through insulation and structural supports under 1 g conditions using coupled thermal–fluid simulations. Stewart and Moder [10] clarified how initial pressurization level, surface-tension treatment, and saturation-pressure modeling influence pressurization kinetics under 1 g. Liu et al. [11] examined the thermodynamic effects of interfacial phase change and heat transfer under sinusoidal sloshing excitation using VOF-based simulations. Wu and Ju [12] studied marine Liquefied Natural Gas (LNG) tanks and showed that sloshing enhances interphase mixing and heat transfer, accelerates pressure decay, and alters interfacial morphology and thermodynamic-field distributions. Hou et al. [13] investigated longitudinal sloshing in spacecraft LH2 tanks under microgravity and reported intensified fluid motion, enhanced gas–liquid mixing, and pronounced parameter variations at excitation frequencies above 20 Hz.
In contrast, sloshing in onboard LH2 tanks remains relatively underexplored, with most studies focusing on room-temperature surrogates or LNG systems. The cryogenic sloshing mechanisms and associated dynamic loads under vehicle operating conditions (e.g., road-induced vibration and inertial excitation) have not been systematically characterized. Lacapere [14] identified interfacial heat and mass transfer as the dominant mechanism governing pressure reduction in sealed containers based on sloshing experiments with liquid nitrogen and oxygen. Sherif et al. [15] suggested that sloshing-induced conversion of kinetic to thermal energy in automotive LH2 containers may increase evaporation rates. Chung et al. [16] analyzed LH2 sloshing in marine tanks at three filling levels. Zhu et al. [17] optimized anti-sloshing baffles for heavy-duty LNG tanks using combined numerical and experimental approaches and proposed a computational framework for resolving nonlinear sloshing in automotive storage systems.
Previous CFD studies have provided useful insights into cryogenic tank pressurization, phase change, thermal stratification, and sloshing. However, most of them focused on stationary storage, single or limited filling conditions, non-onboard tank configurations, or non-LH2 surrogate systems. The role of filling ratio in the coupled interface motion, pressure response, and temperature-field evolution of onboard LH2 tanks under sloshing is still not fully quantified. For onboard LH2 storage, filling ratio is an important operating parameter because it determines the liquid inventory, ullage volume, effective thermal mass, gas–liquid contact condition, and condensation potential. These factors directly affect depressurization, interface stability, and thermal redistribution during vehicle-induced sloshing. Therefore, five filling ratios of 10%, 30%, 50%, 70%, and 90% were selected to cover low-, medium-, and high-filling conditions. This range is used as a broad parametric envelope rather than as a single prescribed vehicle operating condition. Accordingly, this study uses a VOF-based multiphase model in ANSYS Fluent 2023 to analyze the filling-ratio-dependent thermo-hydrodynamic response of onboard LH2 tanks under identical excitation and thermal boundary conditions. The results provide guidance for anti-sloshing design and operating-parameter selection in onboard cryogenic hydrogen storage systems.

2. Numerical Calculation Models

2.1. Governing Equations

The governing equations solved in this study are summarized below [18].
Continuity equation:
ρ t + · ( ρ v ) = S m
Momentum equation:
t ( ρ v ) + · ( ρ v v ) = p + · ( μ + μ t ) v + ( v ) T + ρ g
Energy equation:
t ( ρ E ) + · [ v ( ρ E + p ) ] = · ( K T ) + S h
where ρ is the density, v is the velocity vector, S m is the mass source term, p is the pressure, μ is the molecular dynamic viscosity, μ t is the eddy viscosity, g is the gravitational acceleration vector, E is the total energy, K is the thermal conductivity, and S h is the energy source term.

2.2. Turbulence Model

The standard k ε model is adopted, in which the eddy viscosity is evaluated from the turbulent kinetic energy k and its dissipation rate ε , providing a robust closure for engineering turbulence simulations. The transport equations for k and ε are given as follows:
t ( ρ k ) + · ( ρ v k ) = · μ + μ t σ k k + G k + G b ρ ε Y M + S k
t ( ρ ε ) + · ( ρ v ε ) = · μ + μ t σ ε ε + C 1 ε ε k ( G k + C 3 ε G b ) C 2 ε ρ ε 2 k + S ε
where G k , G b and Y M denote production of turbulent kinetic energy by mean velocity gradients, production due to buoyancy, and the contribution of compressibility fluctuations to the dissipation rate, respectively. The turbulent Prandtl numbers are set to σ k = 1.0 and σ ε = 1.3 . Model constants are C 1 ε = 1.44 , C 2 ε = 1.92 , and C 3 ε = 0.2 [18].
The eddy viscosity μ t enters the momentum equation through the effective viscosity ( μ + μ t ) and is computed from k and ε as
μ t = C μ ρ k 2 / ε
where C μ = 0.09 is the standard k ε constant, and k and ε are the turbulent kinetic energy and dissipation rate, respectively.

2.3. Interface Capturing Method

The VOF method is employed to capture the liquid–vapor interface in the two-phase flow. A scalar volume-fraction field α ( 0 α 1 ) is introduced in each control volume to indicate the local phase occupancy. For a two-phase system, the volume fractions satisfy
α l + α v = 1
where α is the volume fraction, and subscripts l and v denote liquid and vapor, respectively. In this study, the nominal free surface is identified by α = 0.5 [19].
Material properties in interfacial cells are evaluated using volume-fraction-weighted mixing rules:
ρ = ρ l α l + ρ v α v k = k l α l + k v α v μ = μ l α l + μ v α v
Thermophysical properties of hydrogen are obtained from NIST REFPROP [20]. The total energy is computed as a mass-weighted mixture quantity:
E = ρ l α l E l + ρ v α v E v ρ l α l + ρ v α v
where the energy term E is treated as mass-averaged variables.

2.4. Phase Change Model

Phase change is driven by the deviation between the local pressure p and the saturation pressure p s a t ( T int ) evaluated at the interfacial temperature T int , leading to evaporation when p < p s a t and condensation when p > p s a t . The saturation pressure is evaluated using an integrated Clausius–Clapeyron relation, expressed as
p s a t = P v · exp 1 / T v 1 / T s a t δ
where ( T v , P v ) is a reference point on the saturation curve, and ( 20.355 K , 101 , 325 Pa ) is adopted in this study. The parameter δ represents the ratio of the ideal-gas constant R to the molar latent heat L of hydrogen in the integrated Clausius–Clapeyron relation. Its unit is K 1 , so that the exponent in Equation (10) is dimensionless. Although δ may vary weakly with temperature, it is treated as a constant over the narrow cryogenic temperature range considered here. To benchmark Equation (10) against the NIST REFPROP saturation curve, saturation pressures over 20– 25 K were extracted from REFPROP and used to fit δ . The fitted value was δ = 7.935 × 10 3 , and the maximum relative deviation between Equation (10) and the REFPROP saturation pressure was 0.74 % . This accuracy is considered sufficient for evaluating the pressure-dependent saturation state in the present sloshing simulations [21].
The mass source term S m in Equation (1) accounts for interfacial mass transfer associated with phase change. The phase-change mass-transfer rate is modeled by
S m = r ( p s a t p ) V c e l l 2 π R v · T int
where R v is the specific gas constant of the vapor, T int is the interfacial temperature, V cell is the cell volume, and r is the tuning coefficient of the phase-change model. The value of r directly affects numerical stability and the predicted interfacial mass-transfer rate. According to reported sensitivity analyses for cryogenic phase-change simulations, r is commonly selected within 0.01 0.1 . A smaller value may lead to slow convergence and underprediction of pressure response, whereas an excessively large value may cause non-physical oscillations near the vapor–liquid interface. Following this selection basis, r = 0.05 was adopted in the present study to obtain stable interfacial mass-transfer behavior. The same r value was used for all filling-ratio cases to ensure consistency in the comparative analysis [21].

2.5. Sloshing Excitation Model

To represent vehicle-induced sloshing, a sinusoidal acceleration is imposed along the longitudinal (X) direction:
α x = α 0 sin ( 2 π f t )
where a 0 is the acceleration amplitude and f is the excitation frequency. In the tank-fixed (non-inertial) reference frame, this excitation is incorporated into the momentum equation as an additional inertial body force. Accordingly, the body-force term in Equation (2) can be written as
ρ g e f f = ρ ( g α x e x )
where e x is the unit vector in the X direction.

3. Tank Structure Modeling

3.1. Two-Dimensional Computational Model

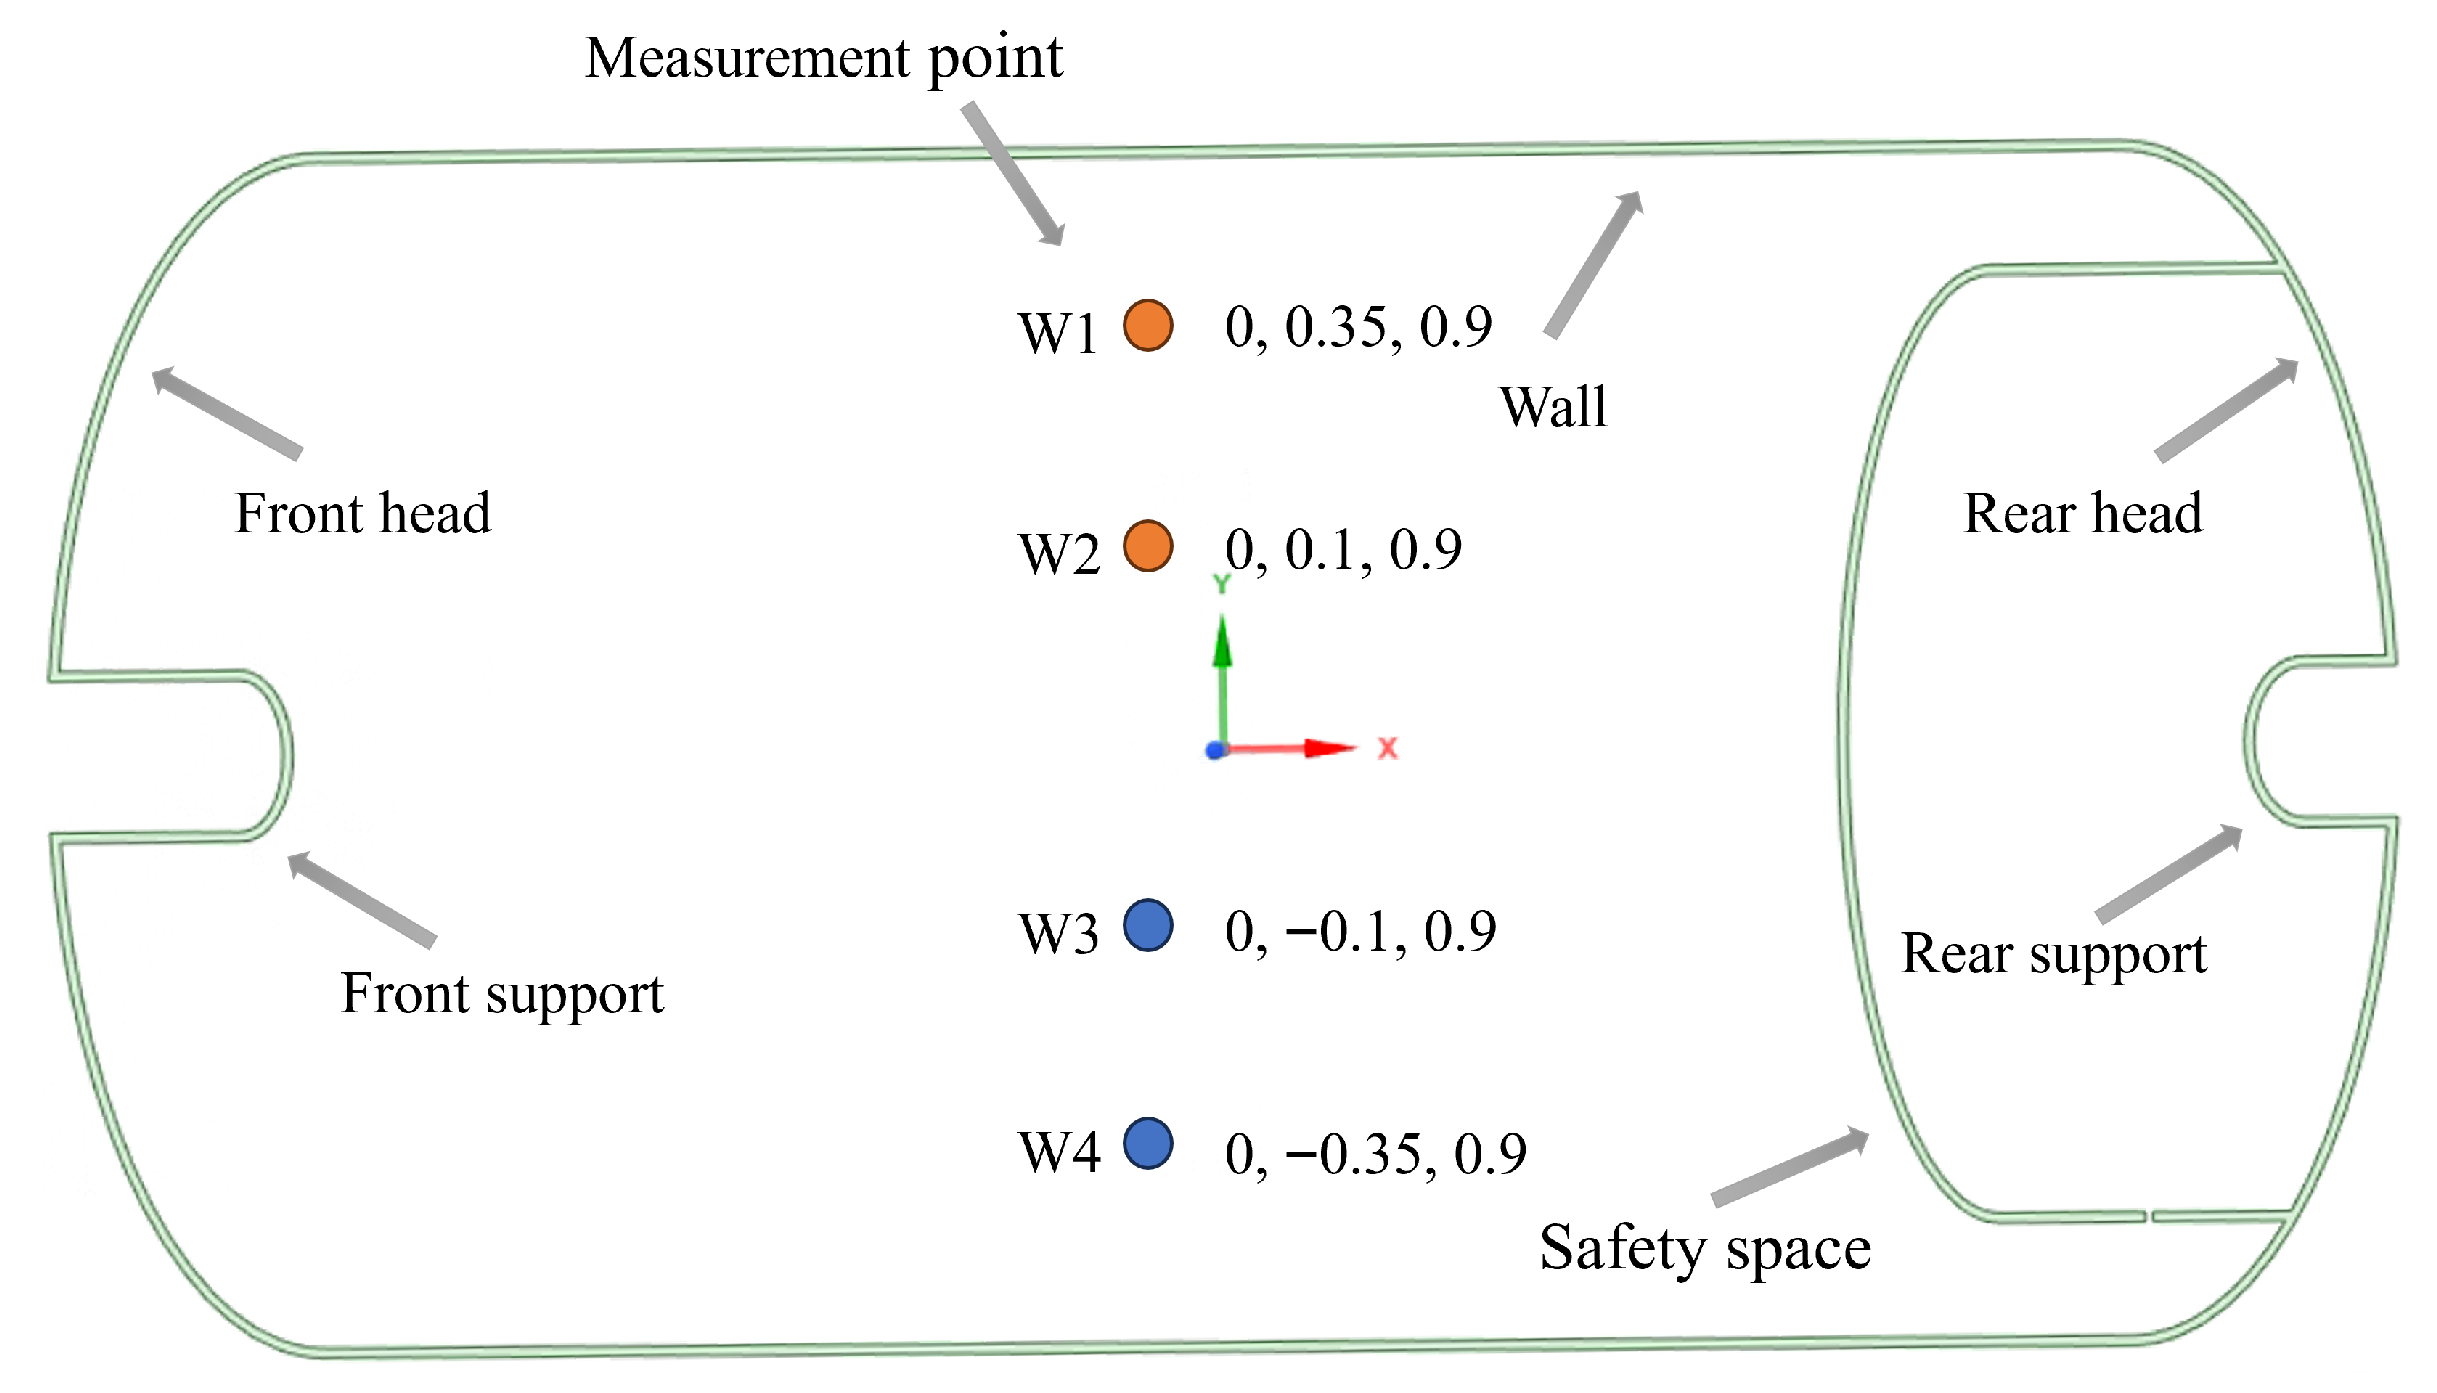
During vehicle acceleration, pronounced LH2 sloshing can occur within the inner vessel of the 1350 L onboard storage tank. To investigate this behavior, a two-dimensional computational fluid dynamics (CFD) model based on the finite volume method (FVM) was developed in ANSYS Fluent 2023 to represent the key structural features of the inner vessel. The investigated tank has a nominal internal volume of 1350 L. The inner vessel has an approximate outer diameter of 960 mm and a total length of 2262 mm, and it consists of a cylindrical section connected to front and rear ellipsoidal heads. The nominal wall thickness is approximately 5 mm, corresponding to design thicknesses of 4.69 mm for the cylindrical section and 4.23 mm for the heads. The model includes the cylindrical sidewall, front and rear ellipsoidal heads, and the front and rear support structures. In this study, the filling ratio is defined as the initial LH2 volume divided by the total internal volume of the inner vessel. Thus, filling ratios of 10%, 30%, 50%, 70%, and 90% correspond to initial ullage volume fractions of 90%, 70%, 50%, 30%, and 10%, respectively. A 6 mm-diameter vent opening was included at the base of the ullage region to better represent thermodynamic behavior. The inner vessel was modeled as 316 L stainless steel with a 5 mm wall thickness to represent the as-designed geometry. To focus on worst-case sloshing dynamics, the sloshing-mitigation effect of the baffle plate was not included in the present model.
A monitoring scheme was implemented to quantify the transient temperature-field evolution during LH2 sloshing. Four fixed monitoring points, W1–W4, were defined inside the inner vessel, and their coordinates are marked in Figure 1. These points were used only for temperature monitoring during the transient simulations. It should be noted that the local phase surrounding a given monitoring point is not absolutely fixed for all cases, because the gas–liquid interface position changes with the filling ratio and the transient sloshing process. Therefore, the monitoring points remain geometrically fixed, whereas their instantaneous phase association may vary under different filling conditions.

3.2. Numerical Setup and Boundary Conditions

The simulations were performed in ANSYS Fluent 2023 using a double-precision, pressure-based transient solver to capture non-isothermal sloshing dynamics. Accordingly, all governing equations were discretized and solved within a finite volume method (FVM) framework. Turbulence was modeled using the standard k ε model with enhanced wall treatment. The standard k ε model was selected primarily on the basis of prior engineering practice and numerical robustness, rather than on a dedicated turbulence-model comparison in the present work. For the present VOF-based cryogenic sloshing simulations, the main objective is to resolve the overall pressure response, interfacial evolution trend, and thermal behavior under different filling ratios, rather than the detailed fine-scale turbulent structures. In this context, the standard k ε model provides a robust and computationally efficient closure and has therefore been adopted in the present study. Although more advanced approaches such as LES may capture local turbulent structures with higher fidelity, their computational cost is not practical for the current parametric study involving multiple filling-ratio cases. Nevertheless, as a RANS-based closure, the standard k ε model cannot explicitly resolve instantaneous vortical structures, local wave breaking, or small-scale turbulence generated near the strongly deforming interface. Therefore, its predictions should be interpreted mainly in terms of global pressure, interface-evolution trends, and thermal response, rather than detailed transient turbulence structures. Second-order upwind schemes were applied to the momentum and energy equations, whereas first-order discretization was used for k and ε to improve numerical stability. The first-order scheme was applied only to the transport equations of k and ε . This treatment may introduce additional numerical diffusion in local turbulence quantities. However, the present study focuses on the global pressure response, interface evolution, and temperature-field variation rather than detailed turbulence statistics. Therefore, this choice is not expected to affect the main conclusions of the filling-ratio comparison. Pressure-velocity coupling was handled using the Pressure Implicit with Splitting of Operators (PISO) algorithm. Residual convergence criteria were set to 1 × 10 3 for continuity and momentum and 1 × 10 6 for energy. For most sloshing cases considered in this study, a fixed time step of 0.0001 s was adopted.Within each time step, the maximum number of iterations was set to 20. Convergence was judged using the residual criteria and the stabilization of the monitored ullage pressure. The Courant number was monitored during the transient calculation and kept below 1 by using a fixed time step of 0.0001 s. This setting helped maintain stable interface advection in the VOF calculation.
The inner-cylinder sidewall is protected by Multi-Layer Insulation (MLI) to reduce heat ingress. Based on measurements from the Zhangjiagang Cryogenic Laboratory, the sidewall boundary condition was prescribed as a constant heat flux of 0.74 W/m2, and the static contact angle was set to 5°. Different heat-flux inputs were applied to the supports: the front support had a higher heat-leakage density (45.49 W/m2) than the Glass-Fiber-Reinforced Polymer (GFRP) rear support (36.69 W/m2), based on standardized thermal characterization tests. All solid–fluid interfaces employed coupled wall heat-transfer treatment consistent with common practice in cryogenic-tank simulations.
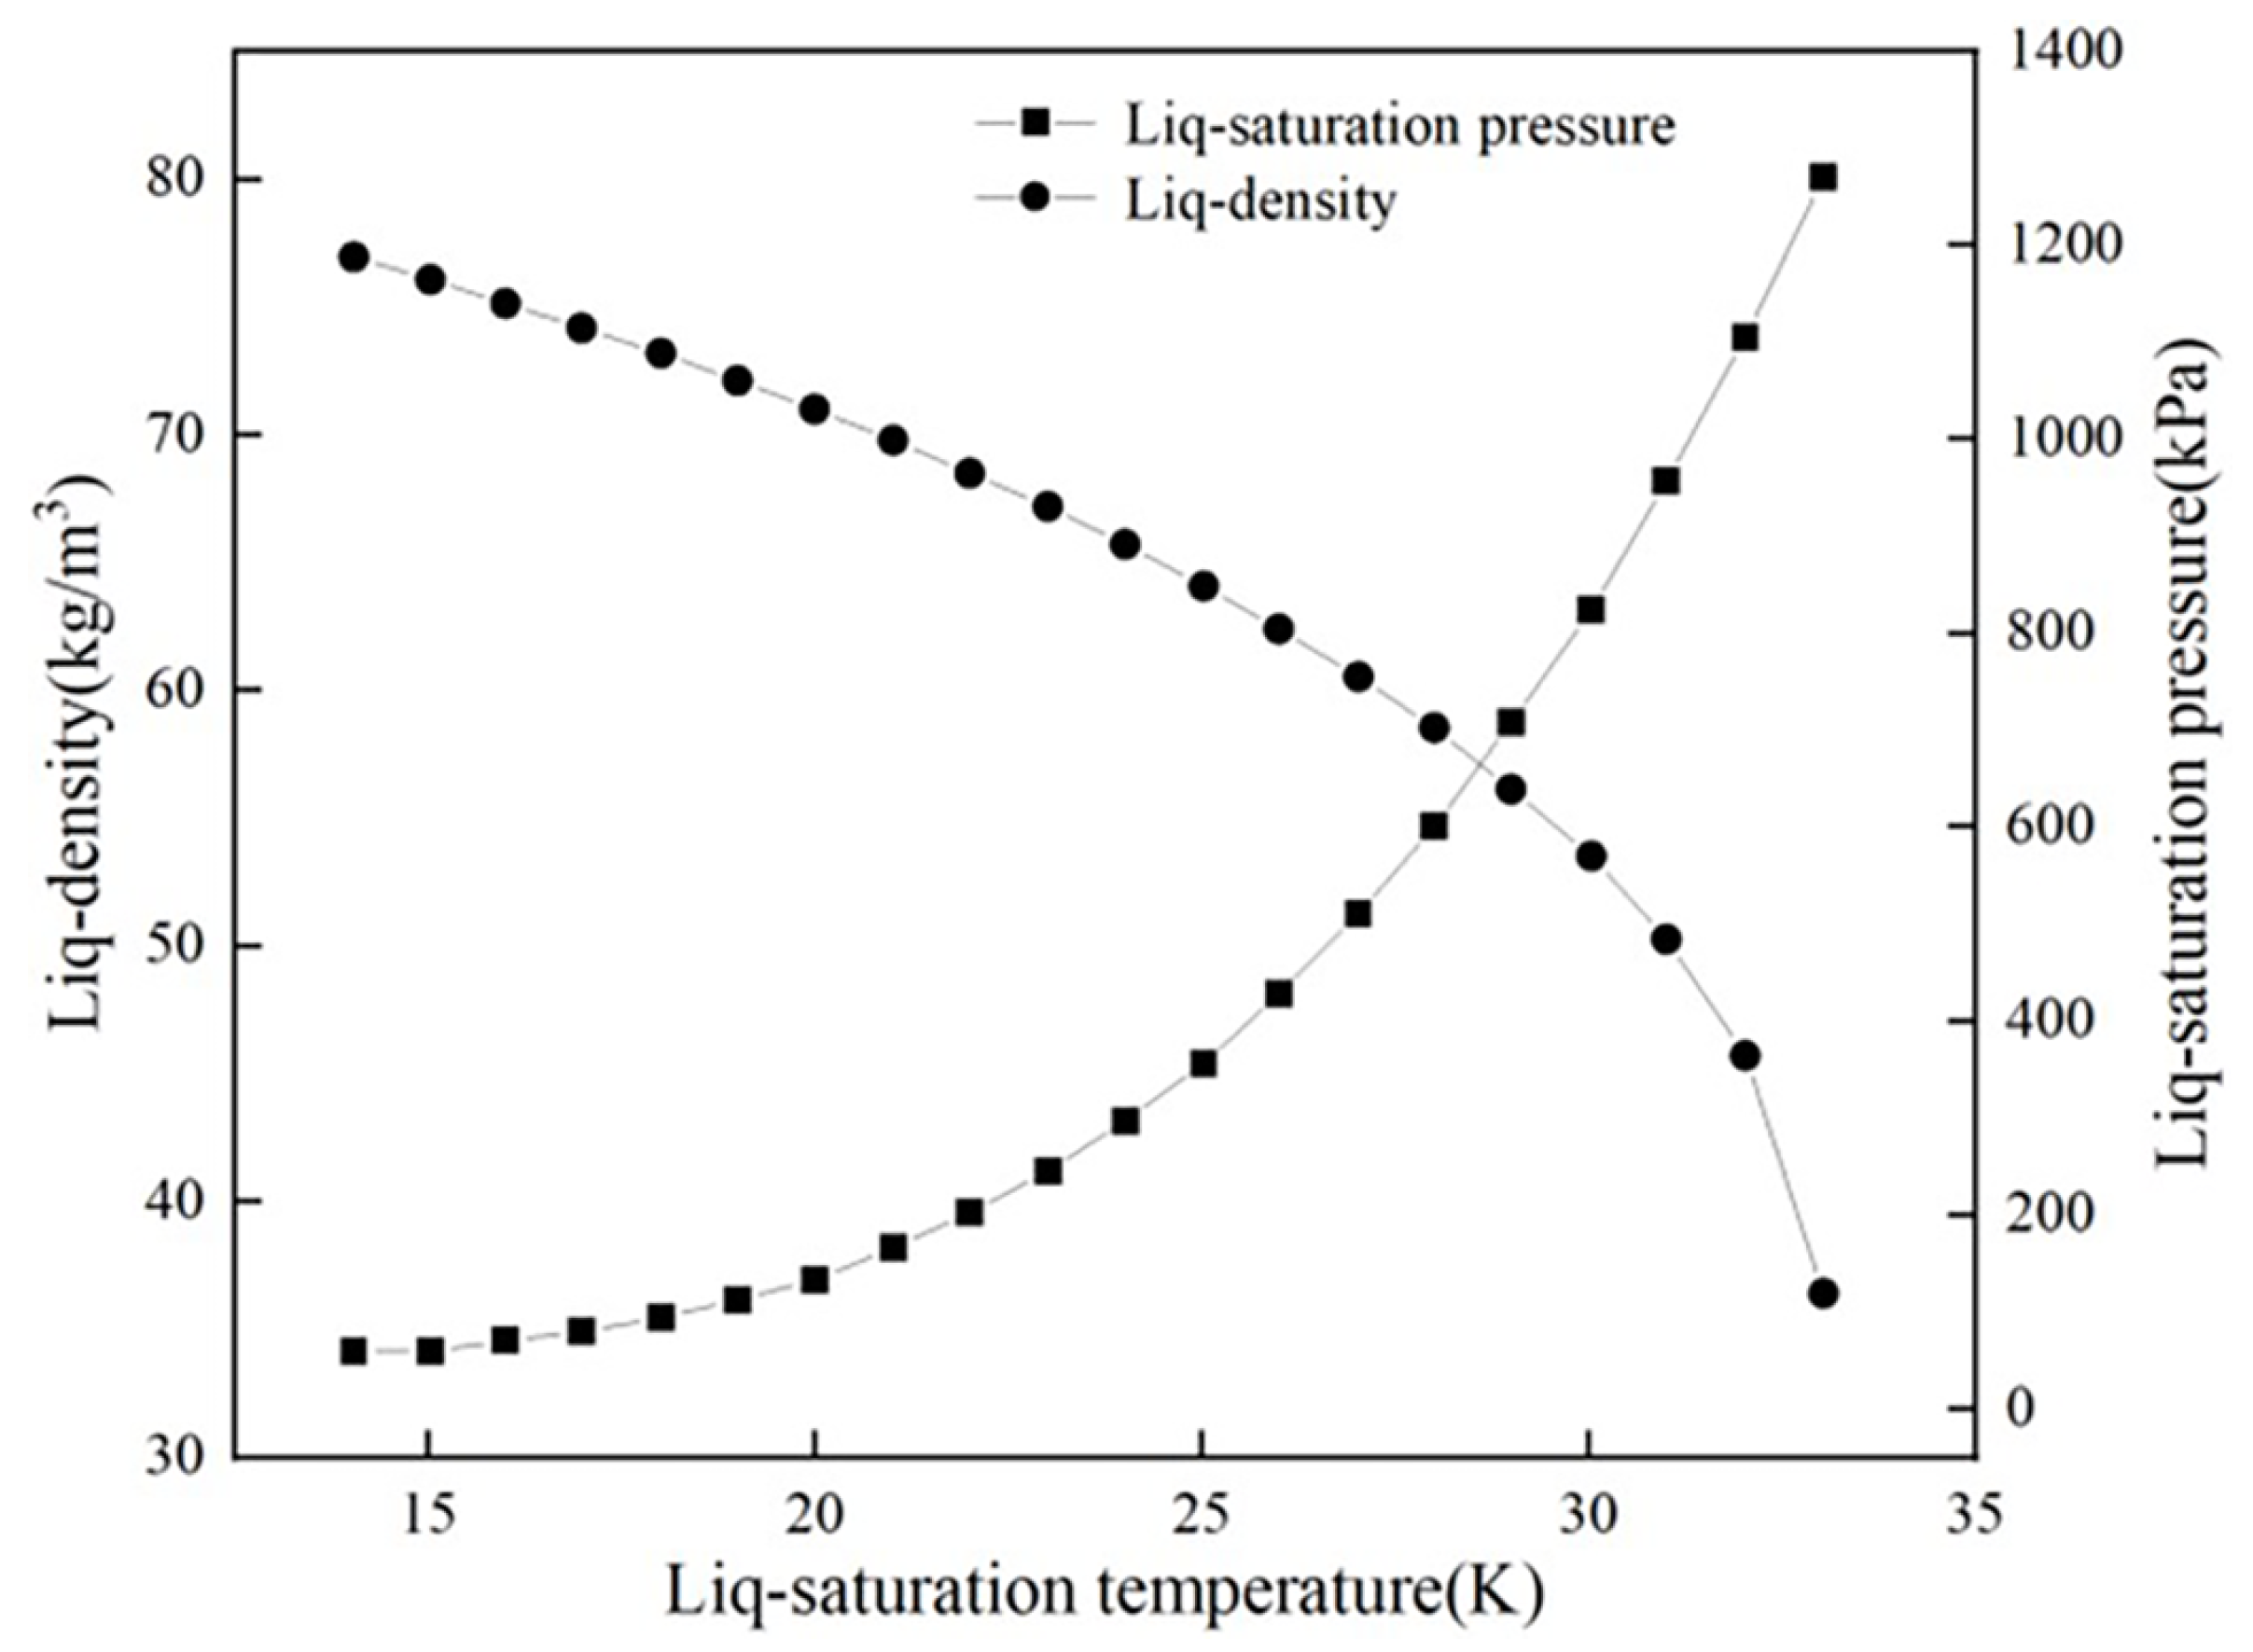
Thermophysical properties were specified to ensure physical consistency of the simulations. Figure 2 shows the temperature-dependent LH2 density and saturation pressure used in the model. The vapor phase was modeled as an ideal gas, whereas the liquid phase used the Boussinesq approximation to account for temperature-dependent density variations, consistent with established cryogenic-fluid modeling practice. Property data were obtained from NIST databases.
To simulate onboard sloshing under dynamic excitation, the flow field was initialized in a quiescent state. At t = 0 s, a sinusoidal acceleration with an amplitude of 2 g was applied along the X-axis for 2.0 s. The selected 2 g amplitude and 2.0 s duration are not taken from a measured vehicle acceleration spectrum. Instead, they are prescribed as an idealized severe transient longitudinal excitation to examine the thermo-hydrodynamic response of the tank under strong inertial disturbance. This controlled excitation allows the effects of filling ratio to be compared under the same tank geometry, thermal boundary conditions, and loading form. More realistic vehicle acceleration spectra will be considered in future work.

3.3. Mesh- and Time-Step-Independence Verification

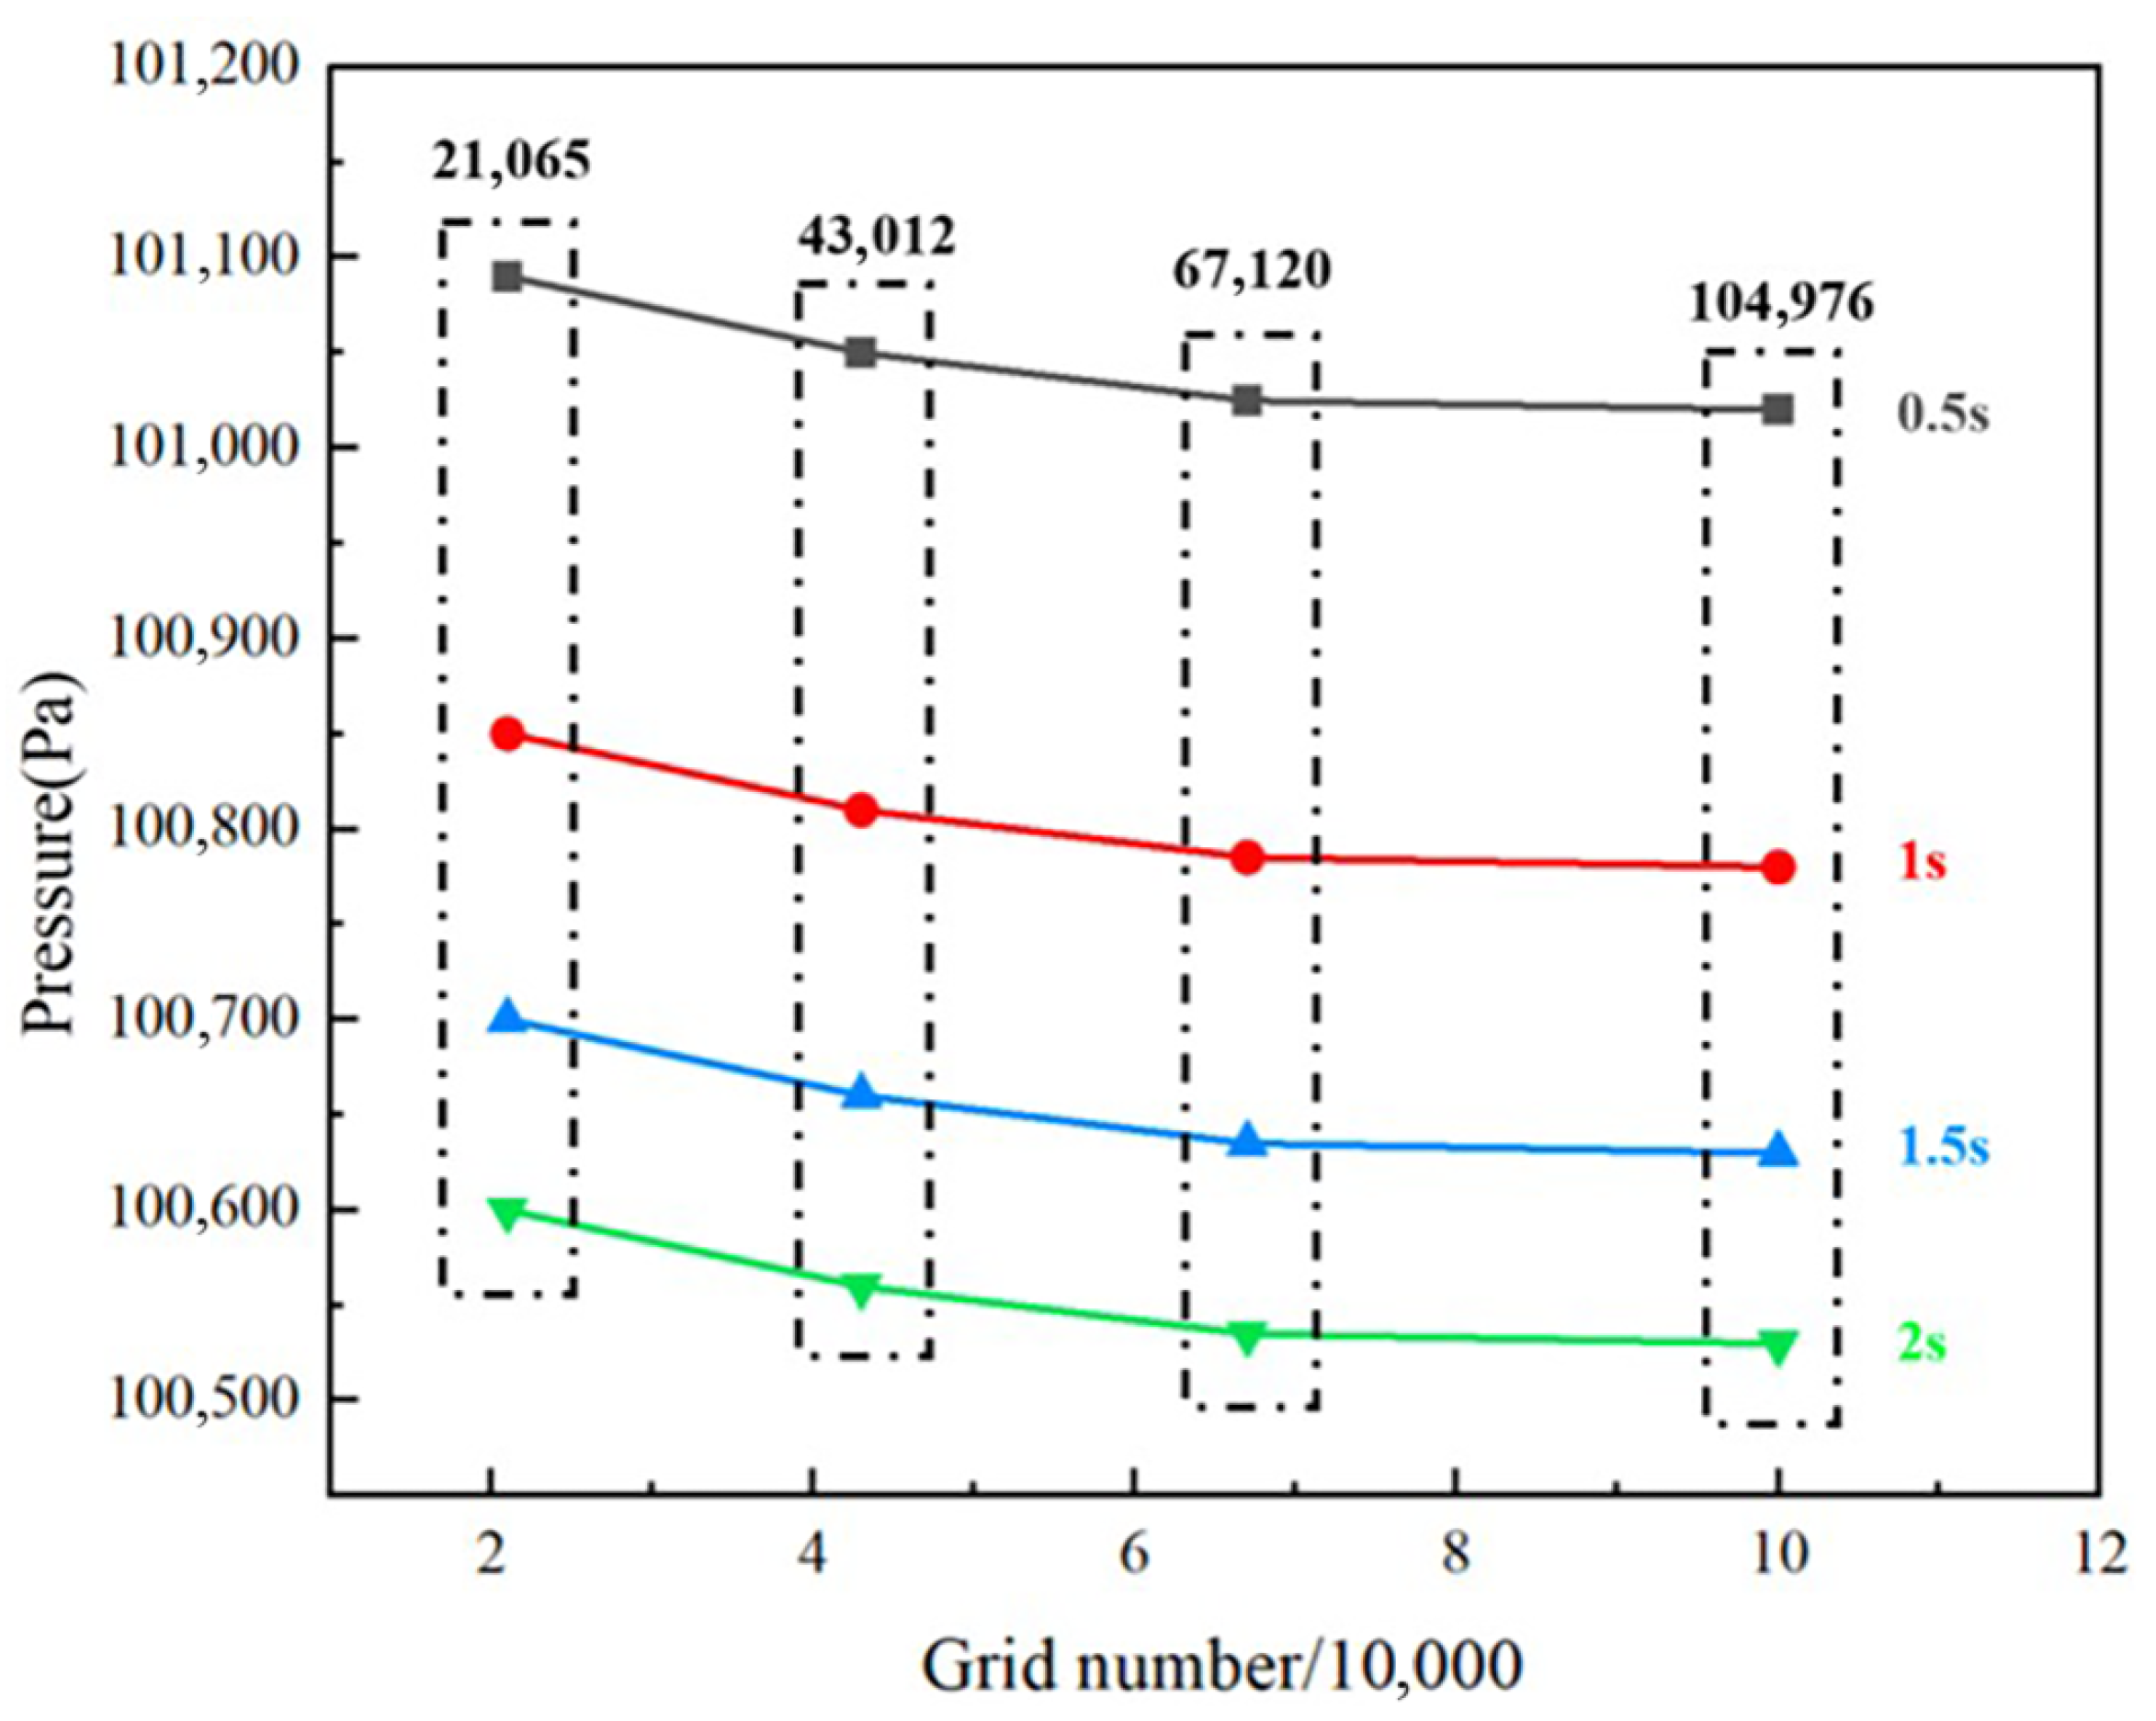
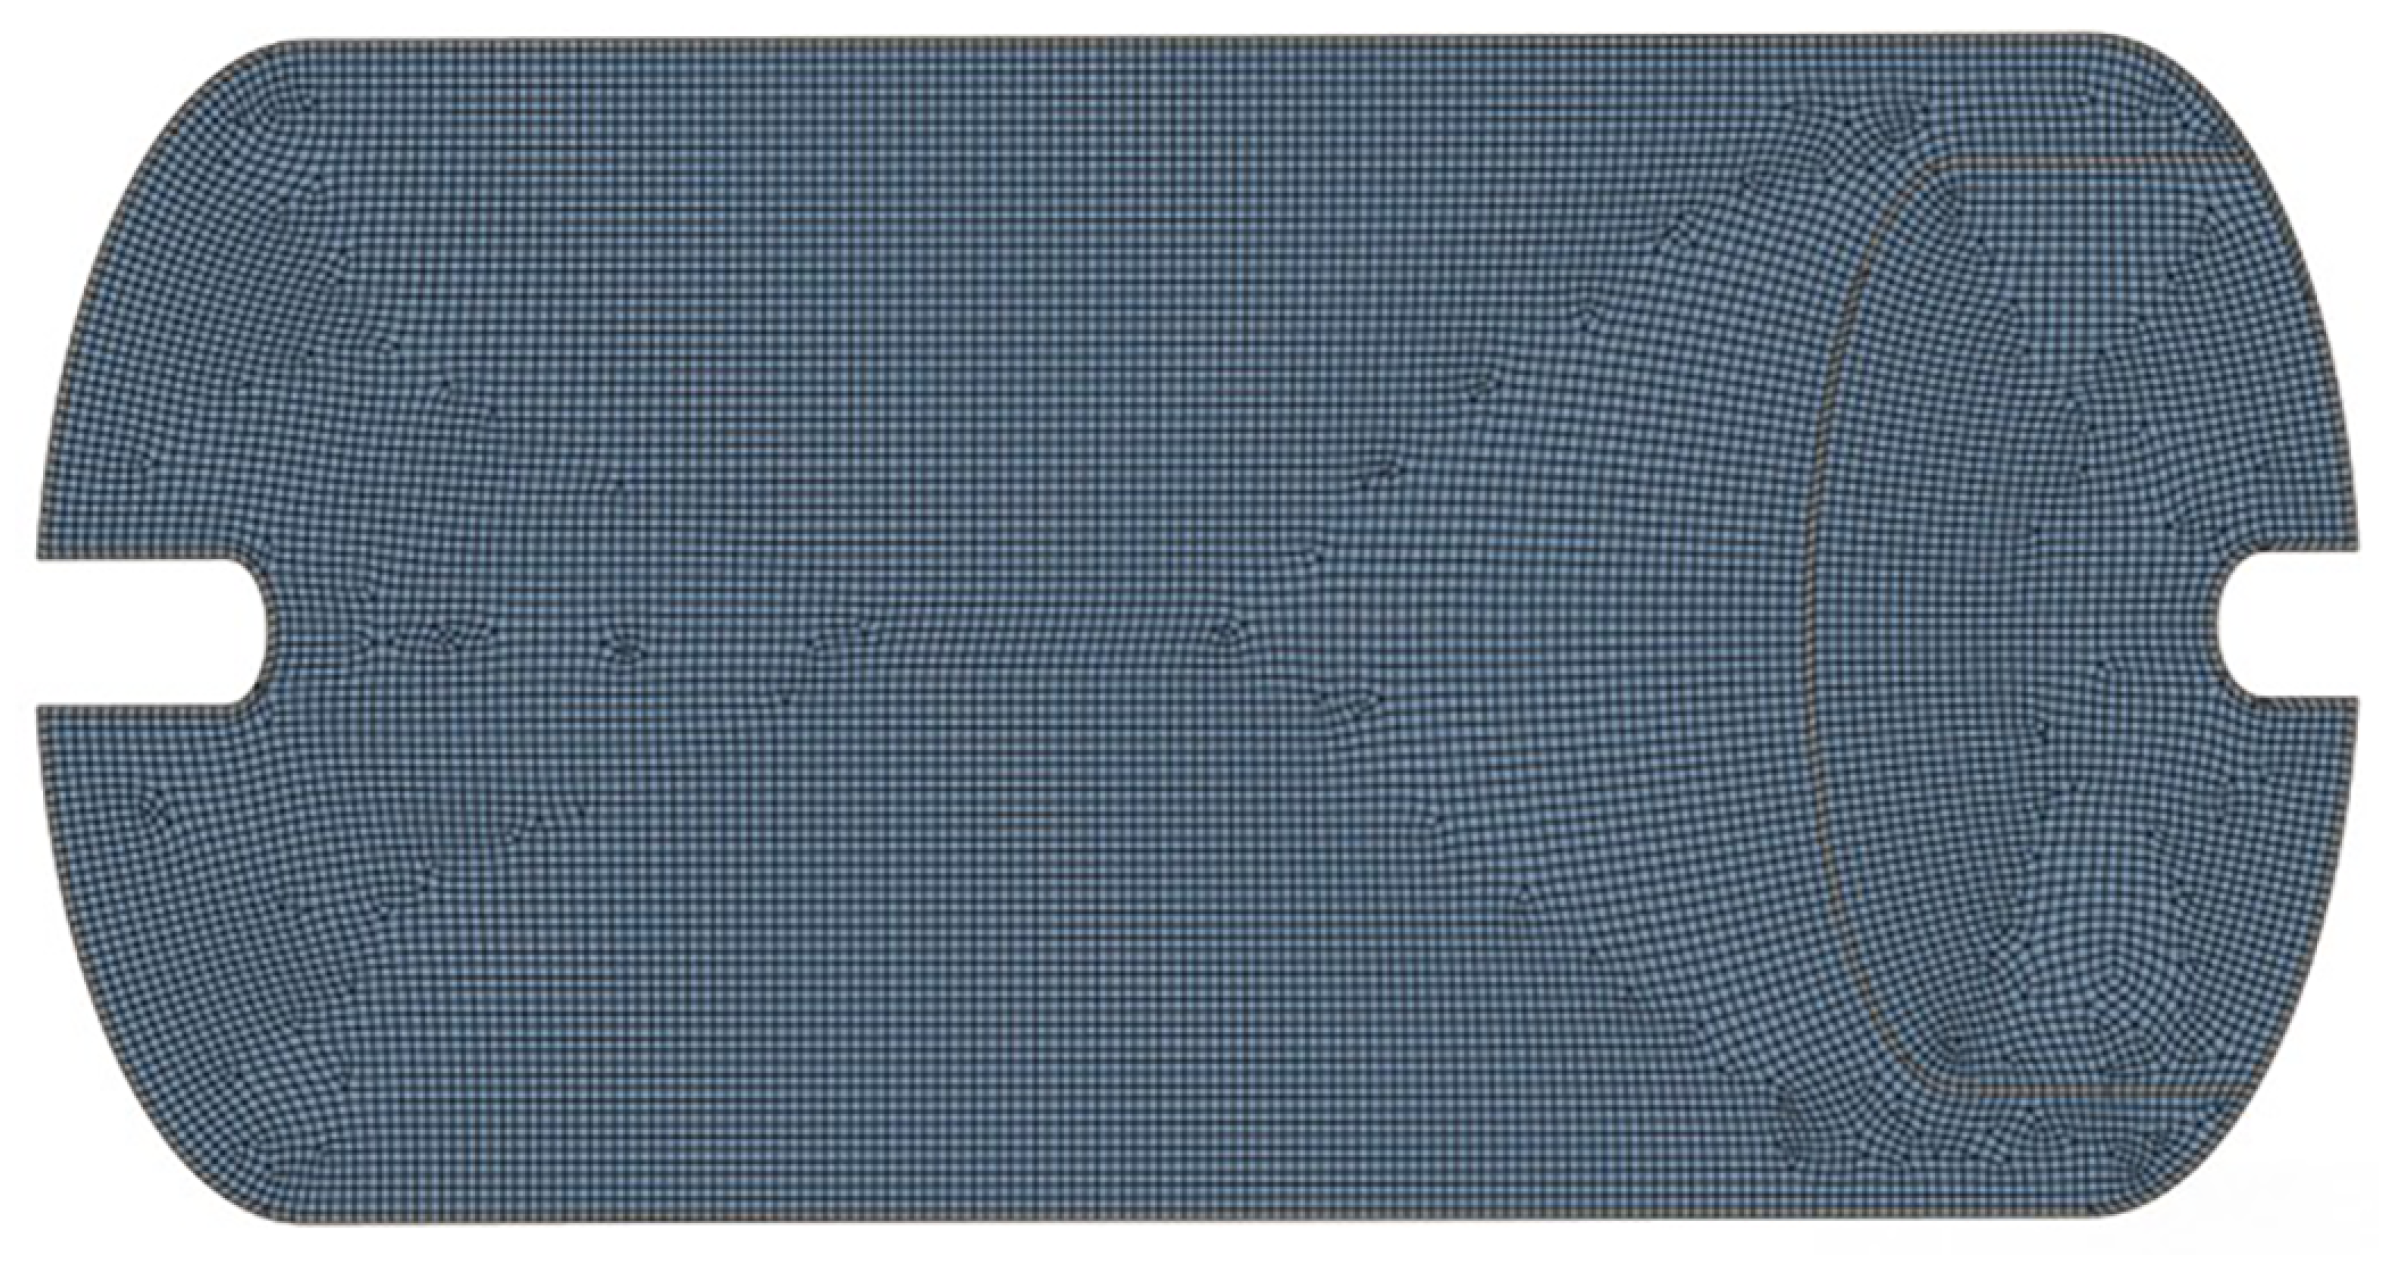
The two-dimensional model was meshed using ANSYS Fluent Meshing with local refinement in key regions. Refinement was applied near the front/rear supports and the ullage region, and a three-layer boundary-layer mesh was used to better resolve near-wall flow. Four meshes with nominal element sizes of 2, 3, 4, and 5 mm were evaluated to balance accuracy and computational cost, resulting in 21,065, 43,012, 67,120, and 104,976 cells, respectively. The pressure evolution during sloshing was computed for each mesh, and the results are compared in Figure 3. The results show that the pressures predicted by the coarser meshes with 21,065 and 43,012 cells still exhibit relatively large deviations. By contrast, when the grid number increased from 67,120 to 104,976, the maximum relative deviation in pressure was only 0.004%, indicating that further refinement produced a negligible influence on the predicted pressure response. Therefore, considering both accuracy and computational cost, the mesh with 67,120 cells was selected for subsequent simulations (Figure 4).
A time-step sensitivity analysis was also performed to ensure numerical accuracy and stability. Three different time steps ( Δ t = 0.0002 s , 0.0001 s , and 0.00005 s ) were tested under identical boundary and mesh conditions for a representative sloshing case. The results indicated that the predicted pressure histories obtained with Δ t = 0.0001 s and Δ t = 0.00005 s were consistent, with only negligible differences observed between the two cases. In contrast, the simulation with Δ t = 0.0002 s experienced numerical instability and did not converge satisfactorily, indicating that this time step was too large to resolve the rapid interfacial evolution and pressure variation during sloshing. Based on these observations, Δ t = 0.0001 s was selected for most subsequent sloshing simulations, as it provides a balance between numerical accuracy, convergence stability, and computational efficiency.

3.4. Model Validation

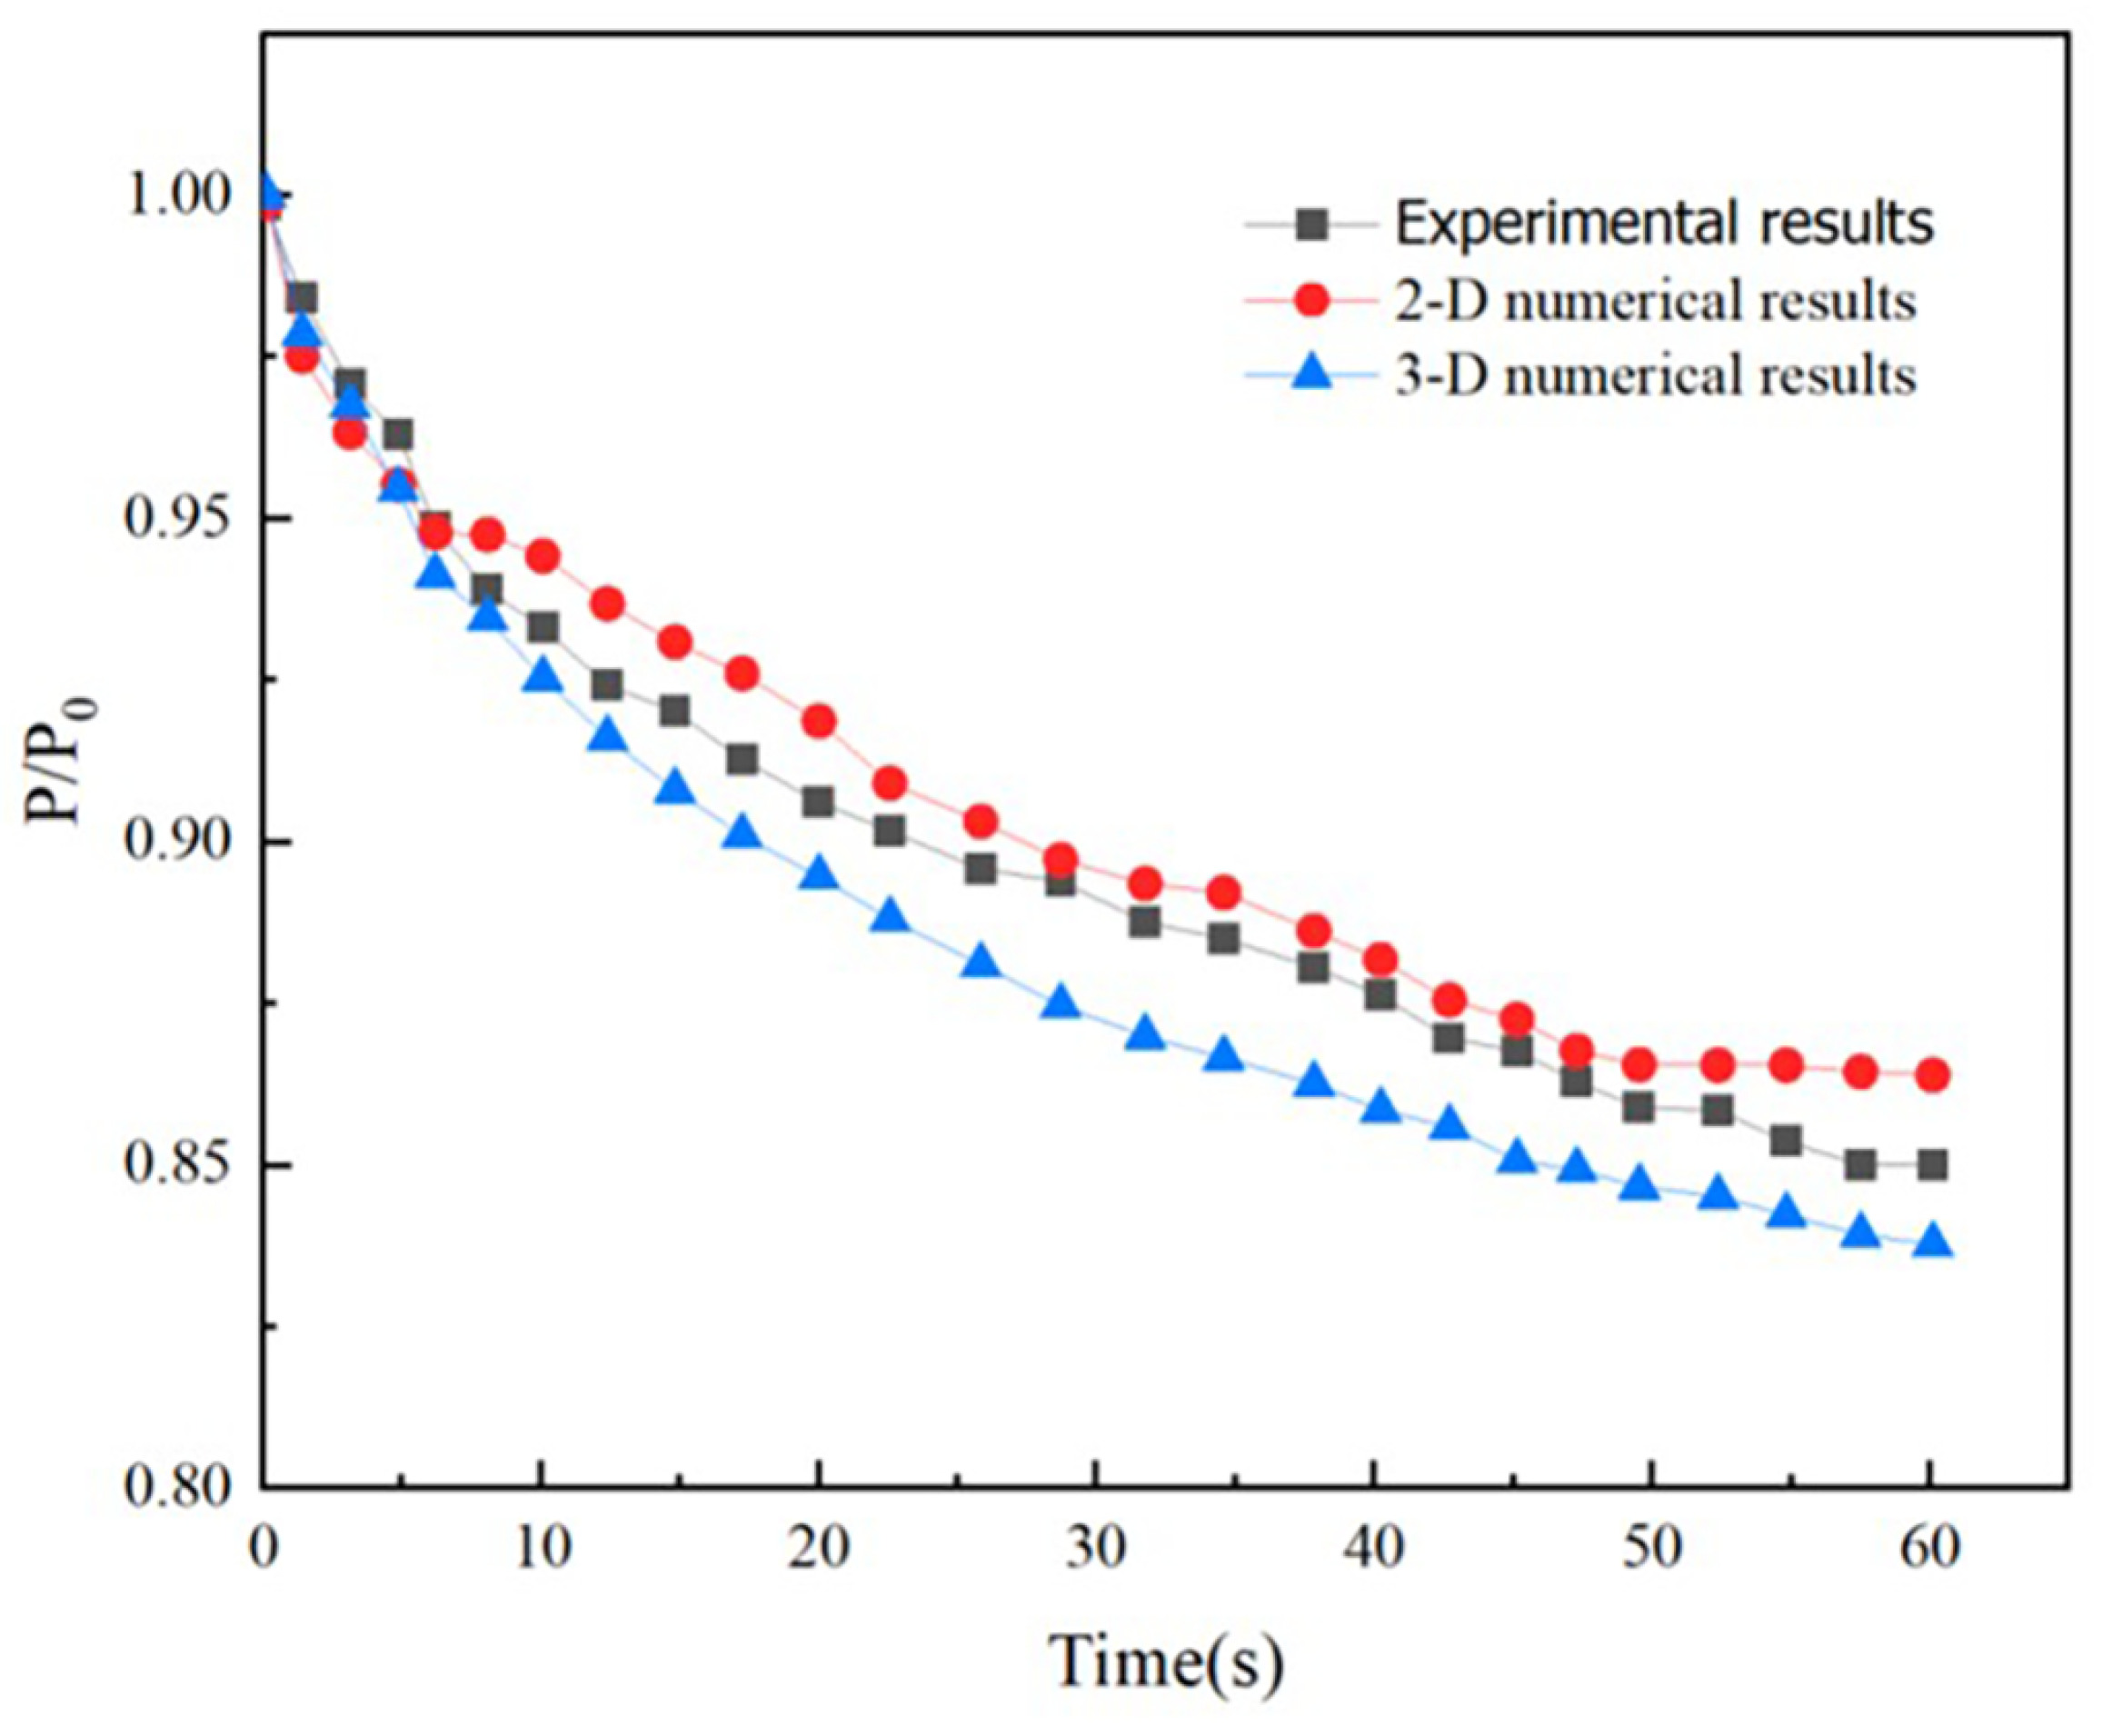
Grotle et al. [22,23] experimentally investigated the thermodynamic response of cryogenic liquid tanks under sloshing conditions. Their setup used a motor-driven crank–rod mechanism to impose periodic oscillations on a transparent cylindrical vessel, and pressure transducers mounted at the tank apex recorded transient pressure fluctuations. The present model was validated by comparing simulated and measured pressure histories under Configuration II (50% fill level, 0.29 Hz, 3° amplitude). Simulation conditions were matched to the experimental specifications to ensure a consistent basis for comparison. Figure 5 compares the measured and simulated pressure profiles. Both the two-dimensional and three-dimensional models reproduce the overall temporal pressure trend, and the two-dimensional model shows a relative error below 5% compared with the experimental data. The two-dimensional model therefore provides a computationally efficient surrogate for parametric investigations while maintaining acceptable accuracy for engineering analysis.
It should be noted that the two-dimensional model mainly resolves the dominant longitudinal sloshing motion and the associated thermo-hydrodynamic response along the central section of the tank. This approximation is appropriate for the present parametric analysis because it reproduces the measured pressure trend and shows reasonable agreement with the corresponding three-dimensional prediction. However, transverse wave motion, azimuthal vortical structures, and other fully three-dimensional interface-breaking phenomena cannot be resolved within the two-dimensional framework and should be addressed in future three-dimensional studies.

4. Results and Discussion

4.1. Analysis of Sloshing Dynamics

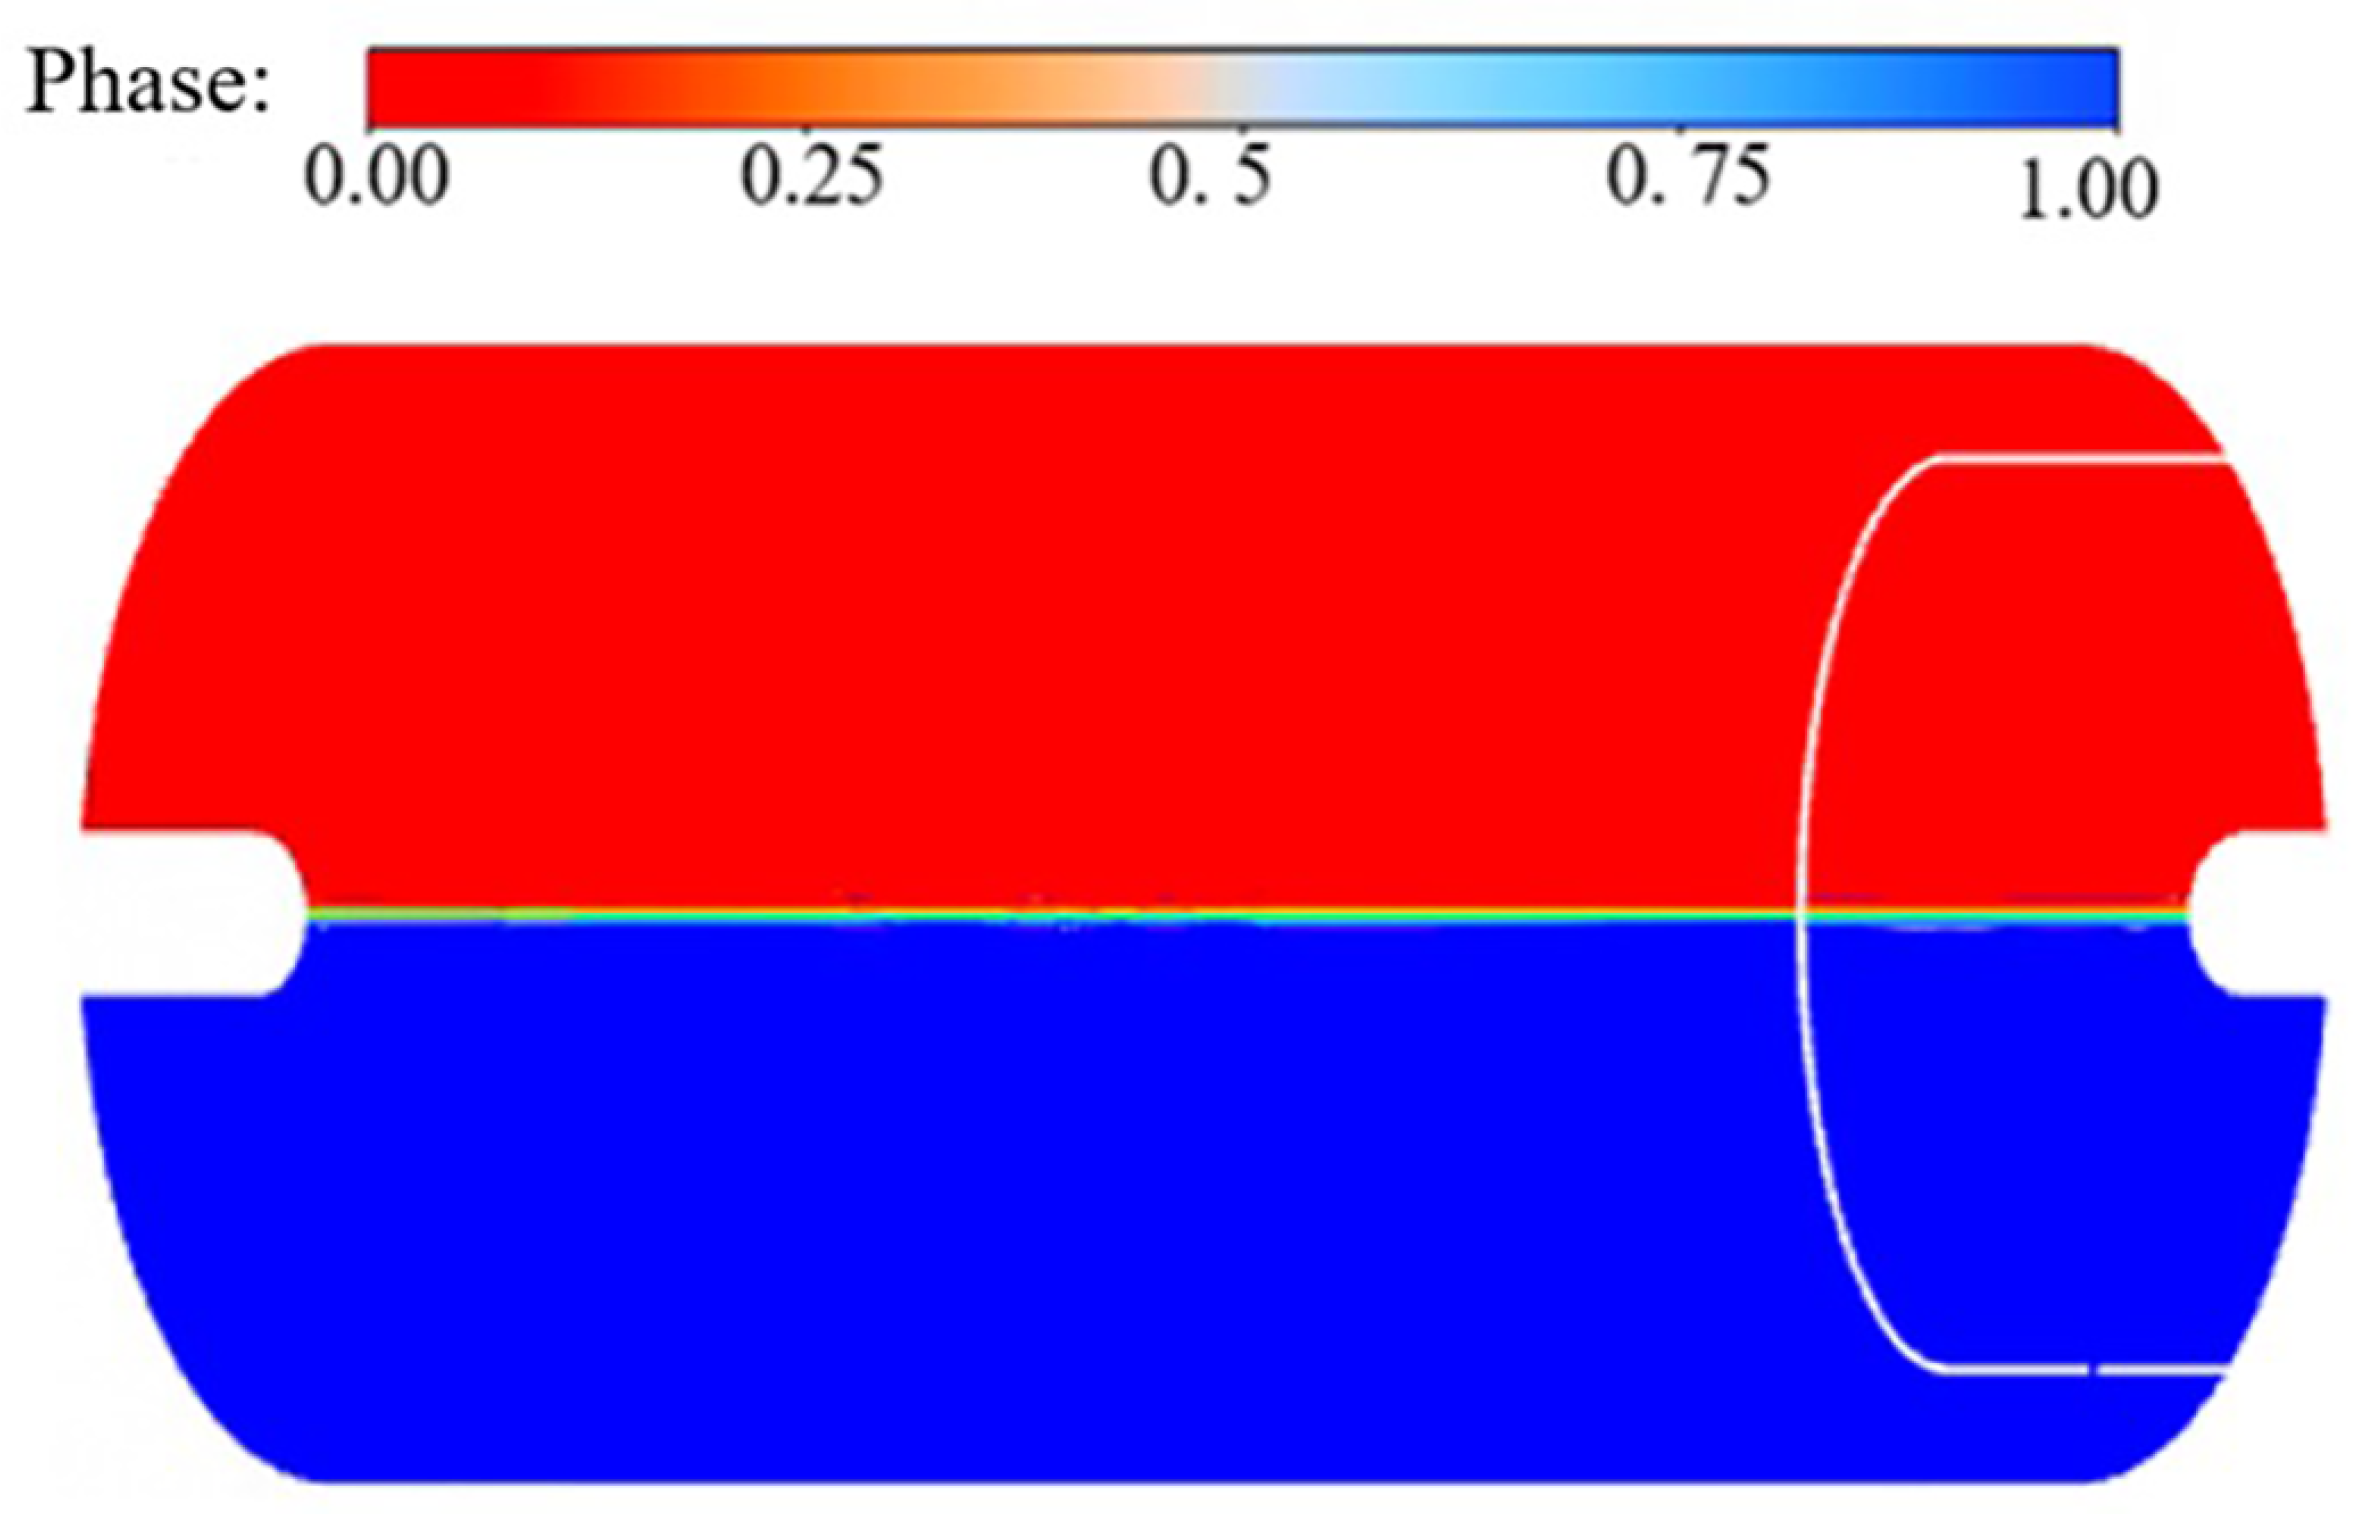
As shown in Figure 6, the 50% filling case initialized at thermodynamic equilibrium exhibits a stable hydrostatic configuration. The ullage pressure becomes nearly uniform and the gas–liquid interface remains continuous and stable prior to excitation. The phase distribution is represented by the VOF volume fraction a ( a = 0 for vapor and a = 1 for liquid), and the nominal interface is identified at a = 0.5 . The initial temperatures are 20.4 K in the ullage and 20.3 K in the liquid, respectively. In the model, the gravitational acceleration was set to 9.81 m · s 2 , and the liquid–vapor surface tension coefficient of hydrogen was set to the default constant value of 0.00193 N · m 1 . The ambient pressure and temperature were set to 101.325 kPa and 300 K , respectively. Sloshing is imposed by a sinusoidal longitudinal acceleration with amplitude 2 g over the 2.0 s interval, and this equilibrium state serves as the baseline for analyzing the transient response.
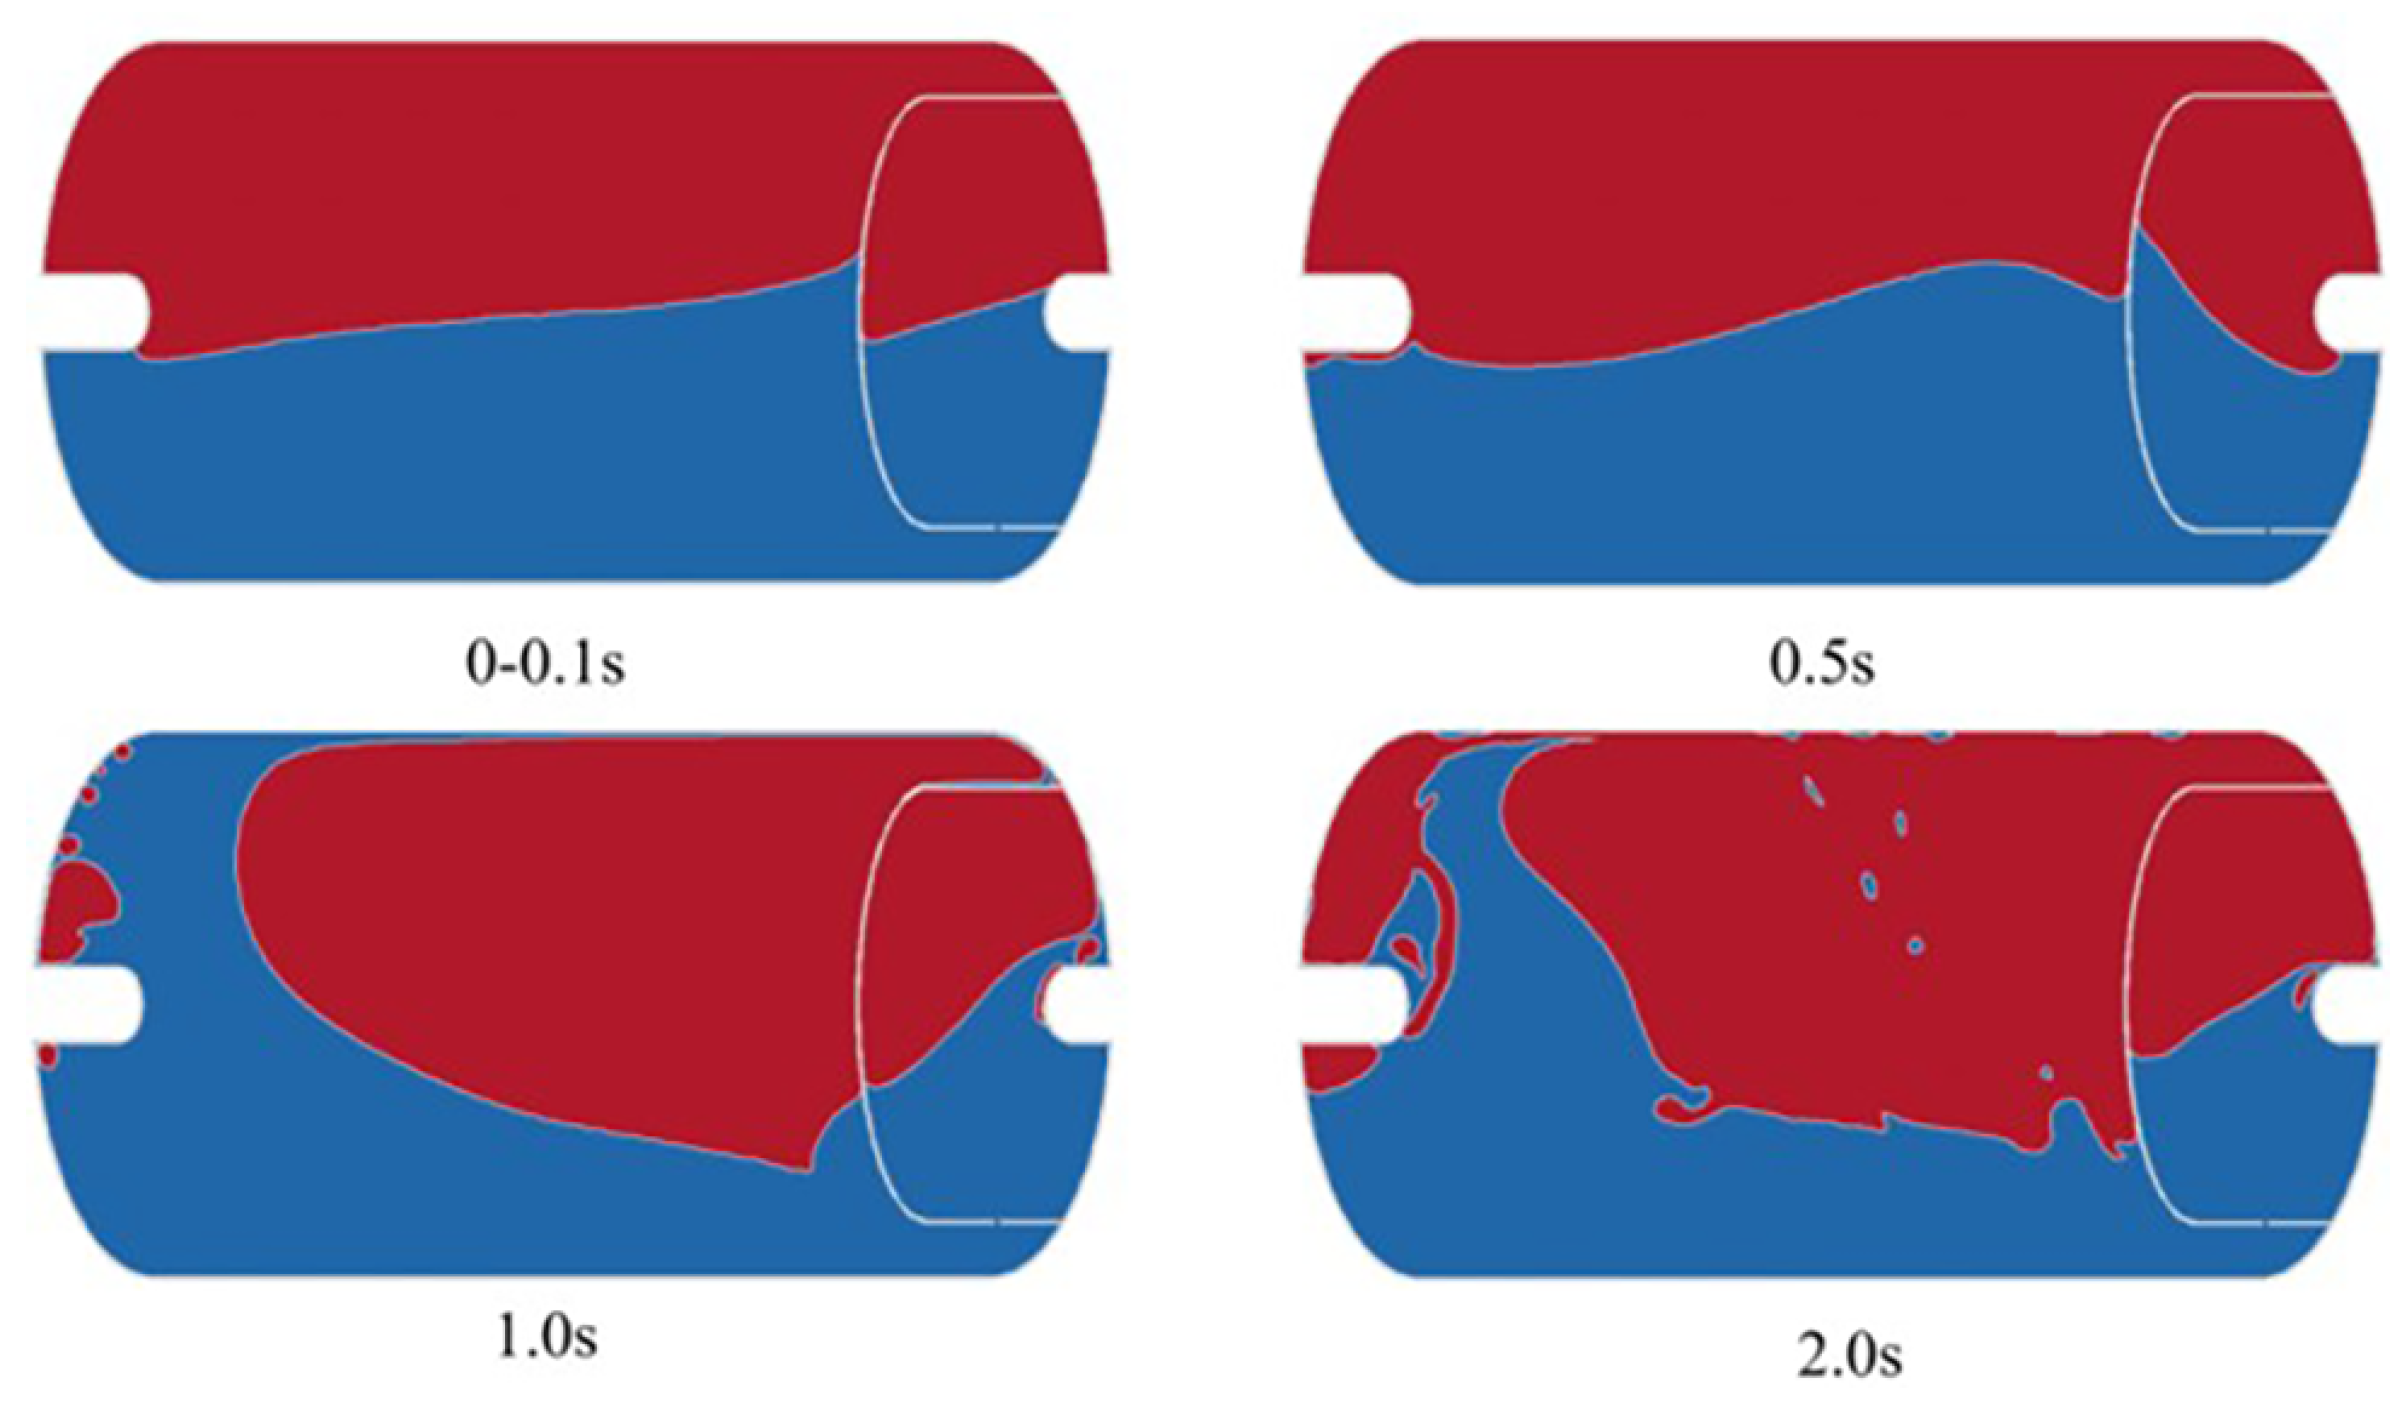
Figure 7 shows the time-resolved free-surface evolution over the 2.0 s sloshing event. During 0–0.5 s, the imposed longitudinal acceleration drives the liquid toward the rear side, followed by a return flow due to wall confinement. Between 0.5 and 1.0 s, strong recirculation develops and the interface becomes highly distorted, with local entrainment and intermittent bubble formation. During 1.0–2.0 s, repeated wall impacts lead to wave breaking and large-amplitude interface oscillations. These features may promote gas entrainment and transient surges, which can disturb propellant management and increase pressure pulsations that are relevant to system integrity. In the present analysis, Figure 7 is used to identify the main interfacial regimes during sloshing, including interface translation, local entrainment, and wave breaking. The subsequent pressure, condensation-rate, mass-transfer, and temperature results provide the quantitative basis for interpreting the thermo-hydrodynamic response.
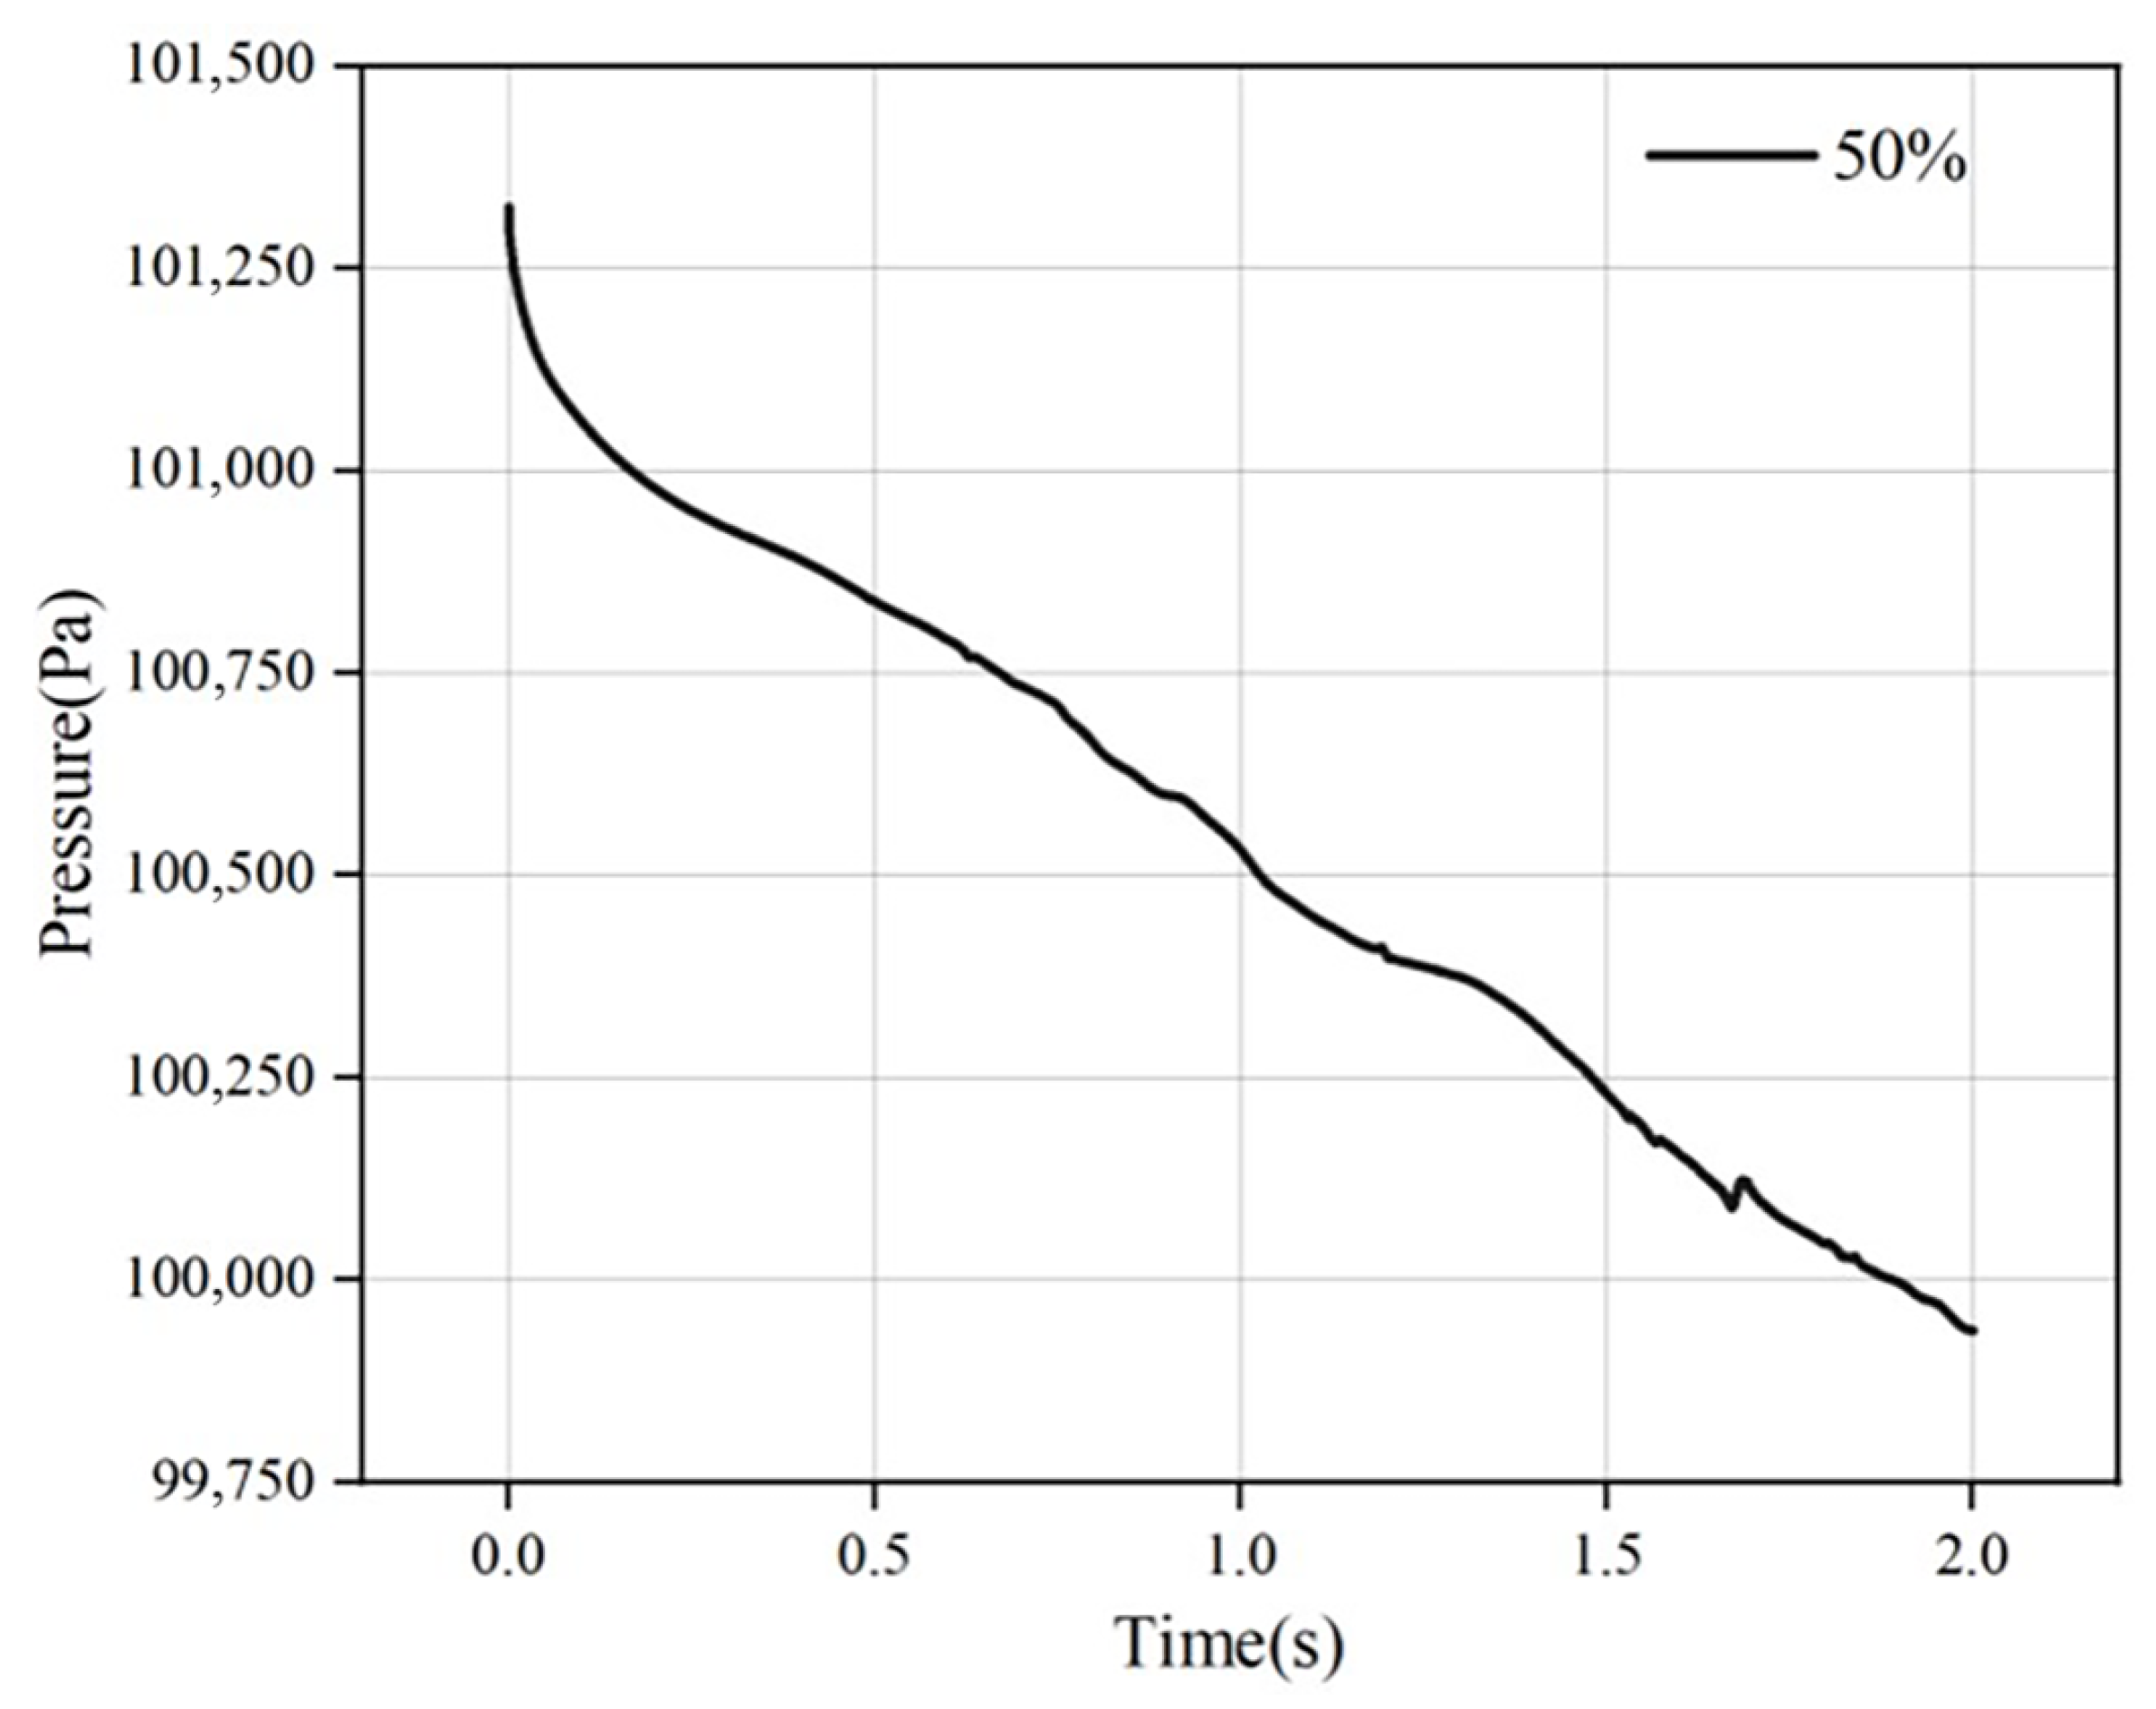
Figure 8 presents the measured ullage pressure at W1 during axial sloshing, showing a nonlinear pressure decay. In the initial 0–0.25 s, the pressure decreases from 101.35 kPa to 101.00 kPa, corresponding to a depressurization rate of 1.4 kPa s−1. From 0.25–2.0 s, the decay rate reduces to 0.6 kPa s−1, consistent with partial compensation by external heat leak, and the pressure remains below 100 kPa. At 101.325 kPa, the saturation temperature is 20.355 K; therefore, the liquid at 20.3 K is slightly subcooled, whereas the ullage gas at 20.4 K is slightly superheated. Sloshing increases the effective interfacial area and enhances heat and mass transfer between subcooled liquid and warmer vapor. The enhanced contact can promote net condensation in the ullage, which removes vapor mass and contributes to the observed pressure reduction. The two-stage decay suggests that condensation dominates the early rapid depressurization, whereas the later stage reflects a balance between heat leak and ongoing phase change.
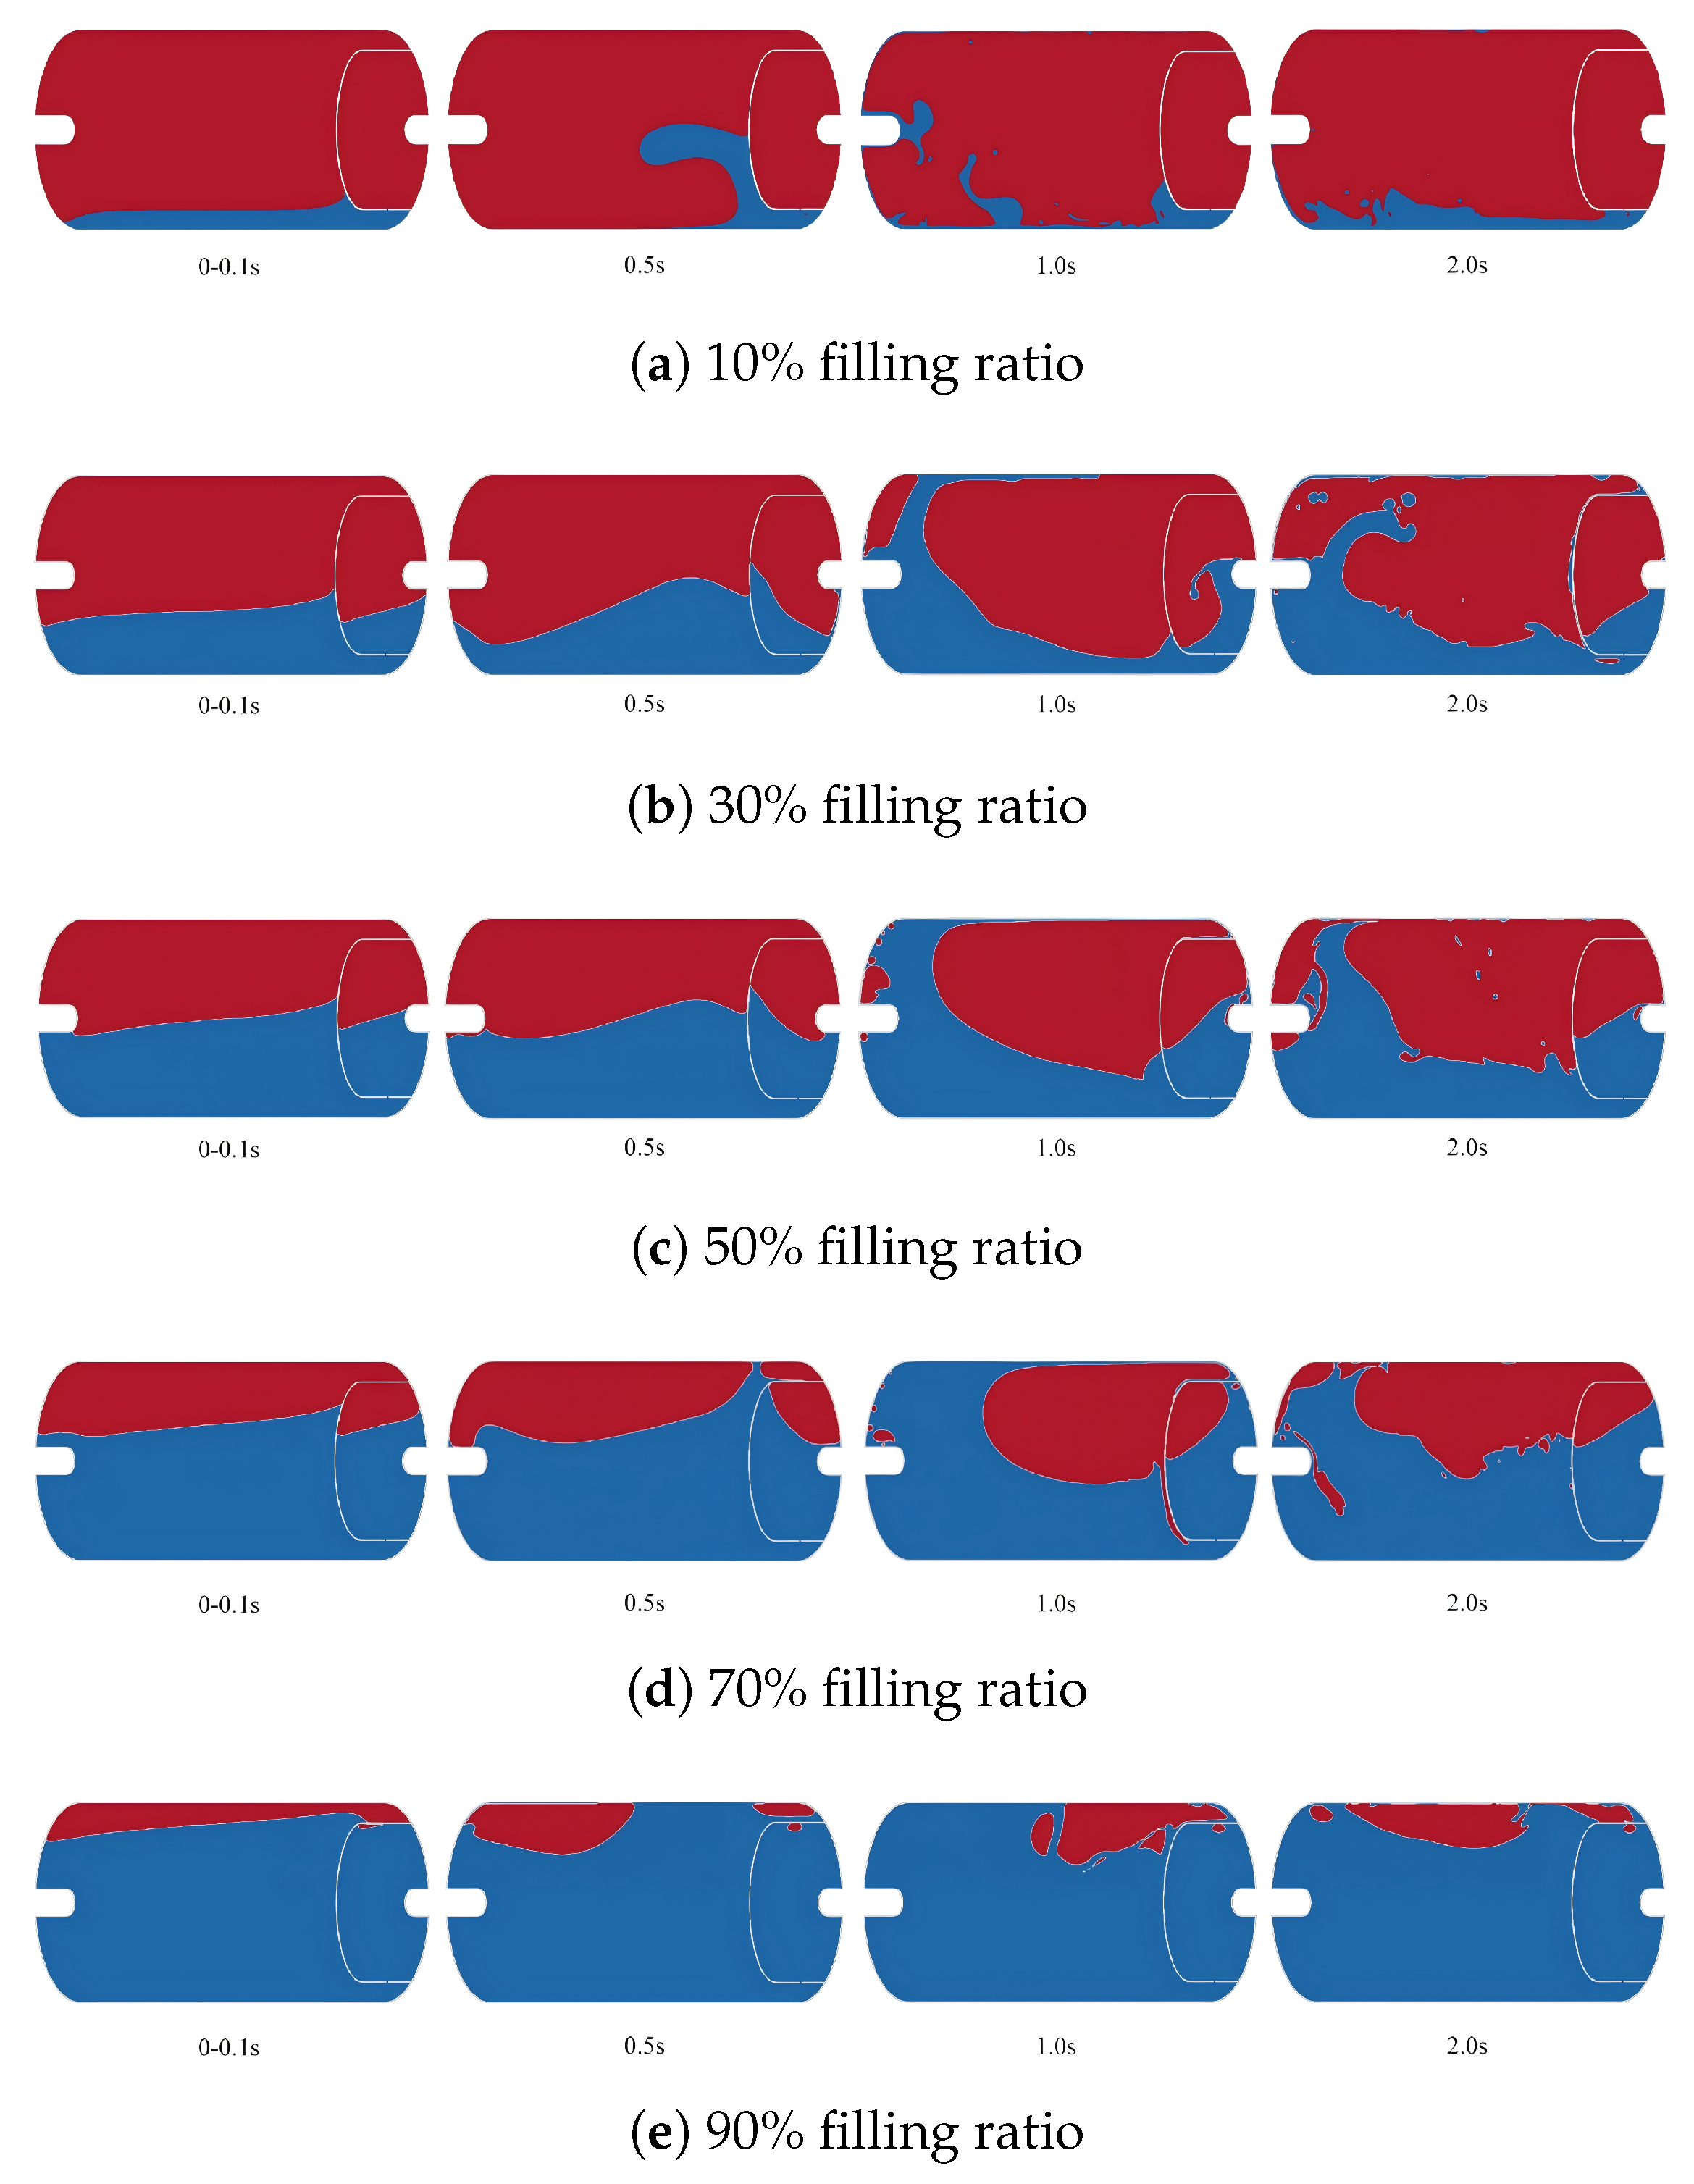
To isolate filling effects, simulations are performed at 10%, 30%, 50%, 70%, and 90% filling ratios under otherwise identical conditions. The results indicate that the liquid–vapor inventory strongly affects both interface motion and pressure response during sloshing. As shown in Figure 9, the interface evolution is qualitatively similar across filling ratios, but the oscillation amplitude differs markedly. During the early stage, the free surface shifts in the direction of acceleration and subsequently reverses as the forcing changes sign and the flow adjusts to confinement. At later times, overturning and wave breaking occur, which can entrain vapor into the liquid.
The free-surface displacement decreases as the filling ratio increases. At 10% filling, the large ullage volume allows the largest interface excursions, and a temporary vapor cavity may form near the front region around t = 0.5 s. Subsequent impacts can induce splashing and local depletion near the pickup region, potentially increasing the risk of intermittent supply. At 30% filling, cavity formation is less pronounced, although wave breaking remains evident at later times. At 90% filling, the interface motion is constrained, while the available contact area per unit ullage volume can remain high, favoring stronger pressure response. Overall, increasing the filling ratio suppresses interface fluctuations, which is relevant for improving storage stability.
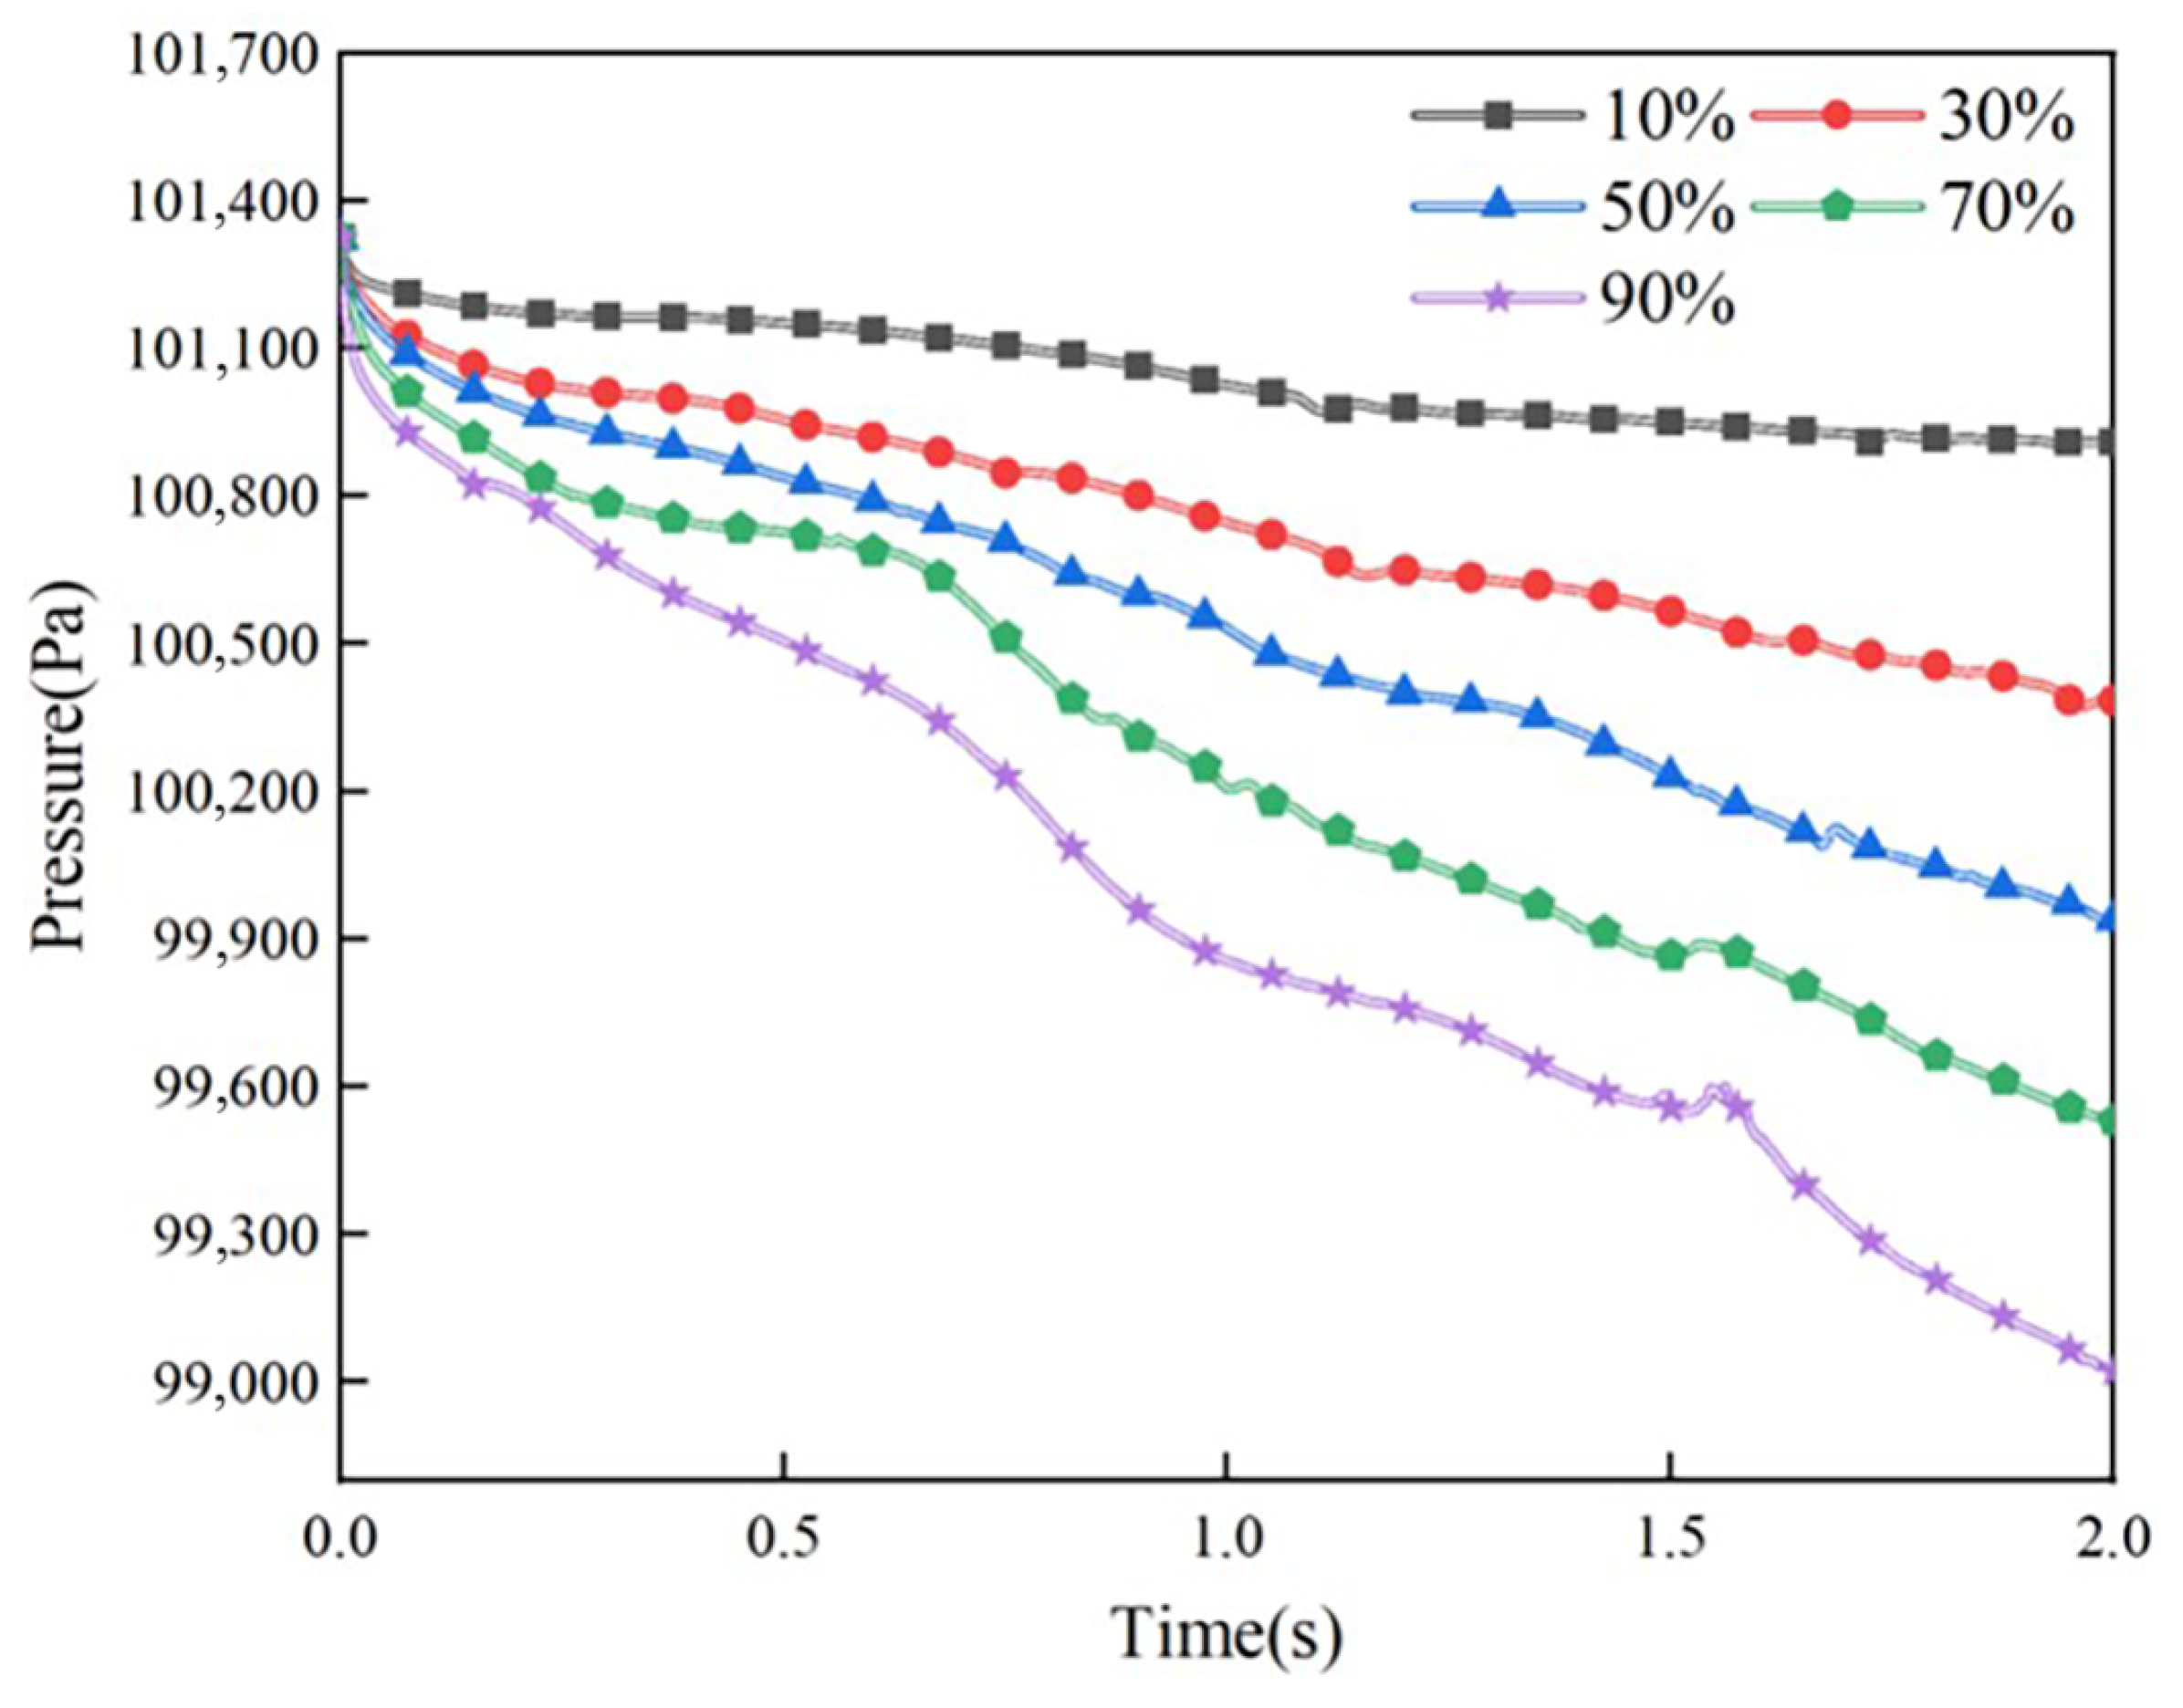
For pressure comparison, the same monitoring location (W1) is used for all filling ratios, and the remaining conditions match the 50% baseline. Figure 10 shows that the pressure response depends strongly on the filling ratio. Higher filling ratios produce larger pressure drops, especially during the initial 0–0.25 s interval. As the filling ratio increases from 10% to 90%, the pressure at W1 decreases from 101.325 kPa to 100.907, 100.382, 99.937, 99.482, and 98.915 kPa, corresponding to depressurization rates of 0.209, 0.471, 0.694, 0.921, and 1.205 kPa s−1, respectively. This trend reflects coupled interfacial heat/mass transfer between the liquid and ullage. At low filling (10%), large interface motion does not necessarily yield strong depressurization because the effective interfacial area and liquid inventory can limit net condensation. At high filling (90%), interface motion is smaller, but the reduced ullage volume and increased contact can enhance condensation-driven pressure decay. Overall, the pressure-decay kinetics are controlled primarily by interfacial transfer capacity (area and thermal state) rather than by interface displacement amplitude alone. To facilitate comparison among different filling ratios, the normalized pressure drop was further calculated as Δ P / P 0 = ( P 0 P t ) / P 0 × 100 % , where P 0 is the initial ullage pressure and P t is the pressure at t = 2.0 s . The normalized pressure drops for the 10%, 30%, 50%, 70%, and 90% filling ratios are approximately 0.41%, 0.93%, 1.37%, 1.82%, and 2.38%, respectively. This result confirms that the relative depressurization intensity increases with filling ratio under the same excitation condition.
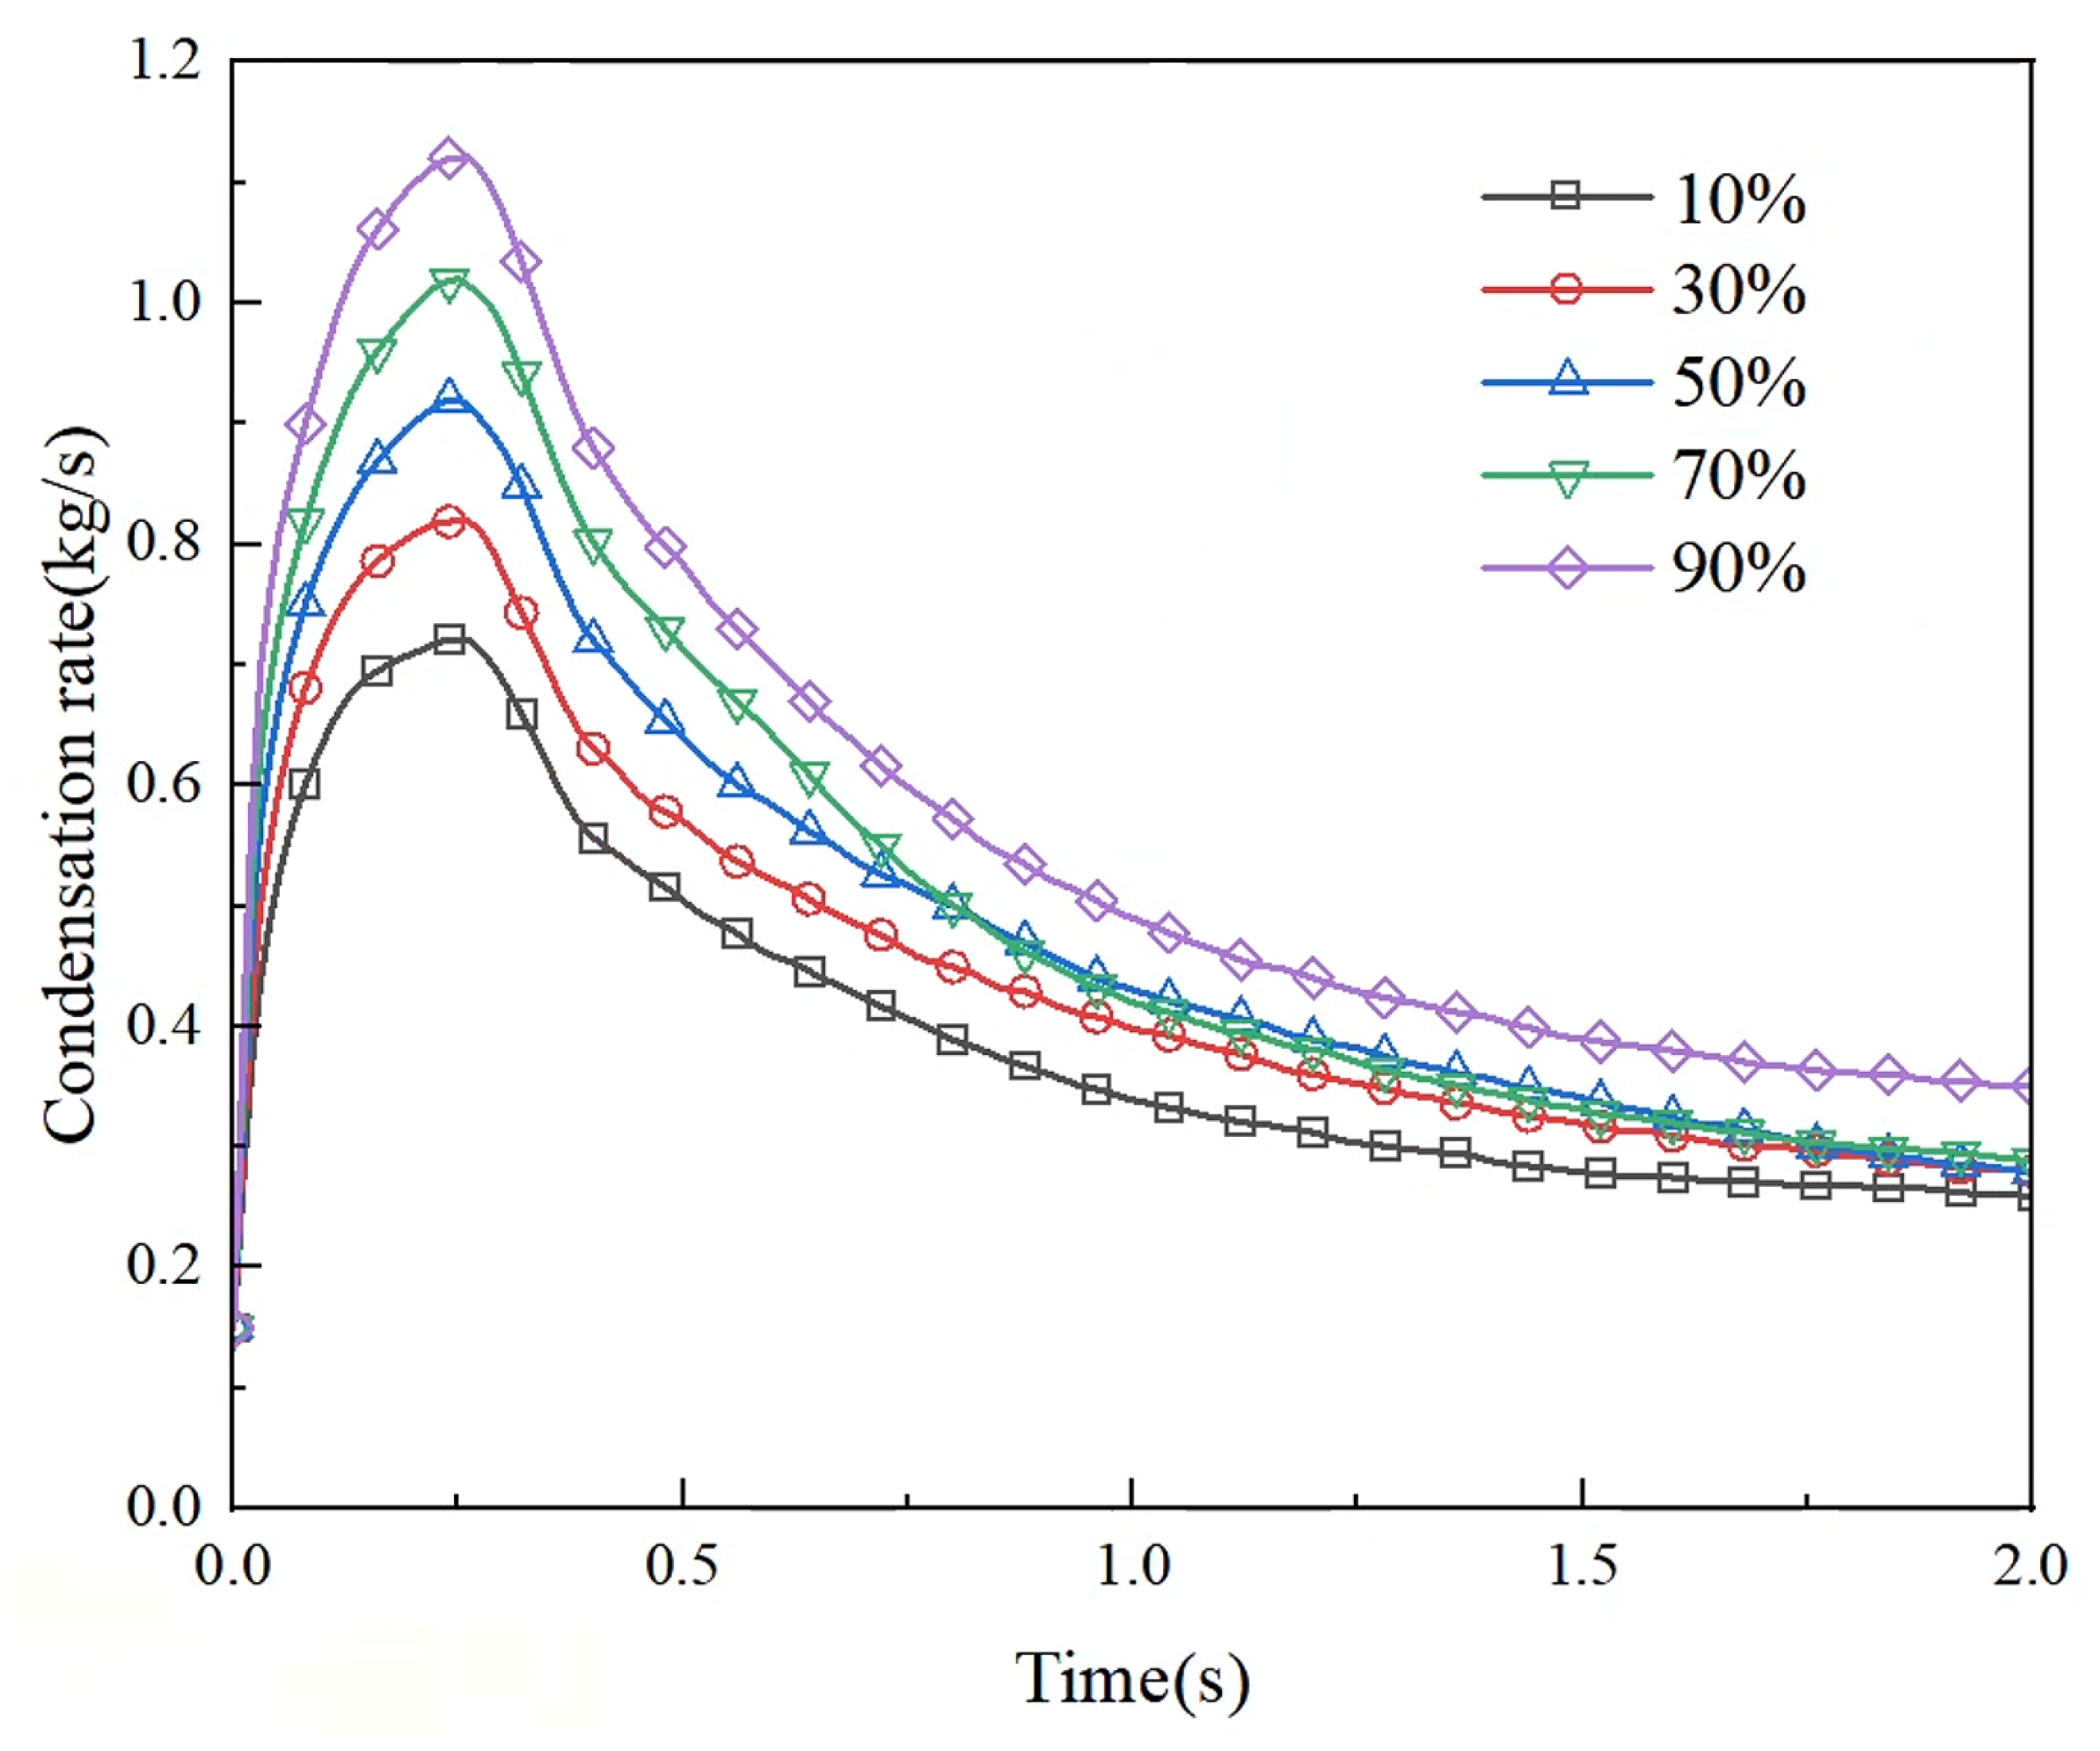
To further quantify the phase-change contribution to pressure decay, the condensation rate was extracted for different filling ratios, as shown in Figure 11. At a filling ratio of 10%, the peak condensation rate is relatively low, approximately 0.88, followed by rapid attenuation. As the filling ratio increases, the peak condensation rate increases markedly and reaches approximately 1.12 at 90% filling. Combined with the pressure histories in Figure 10, this result indicates that higher filling ratios produce stronger condensation, faster pressure decay, and larger pressure-reduction amplitudes. In contrast, lower filling ratios show weaker condensation and more gradual depressurization. Therefore, the condensation rate is positively correlated with the pressure-drop rate, confirming that enhanced interfacial condensation is a dominant mechanism responsible for the accelerated pressure decay during sloshing.

4.2. Analysis of Sloshing Thermodynamic Performance

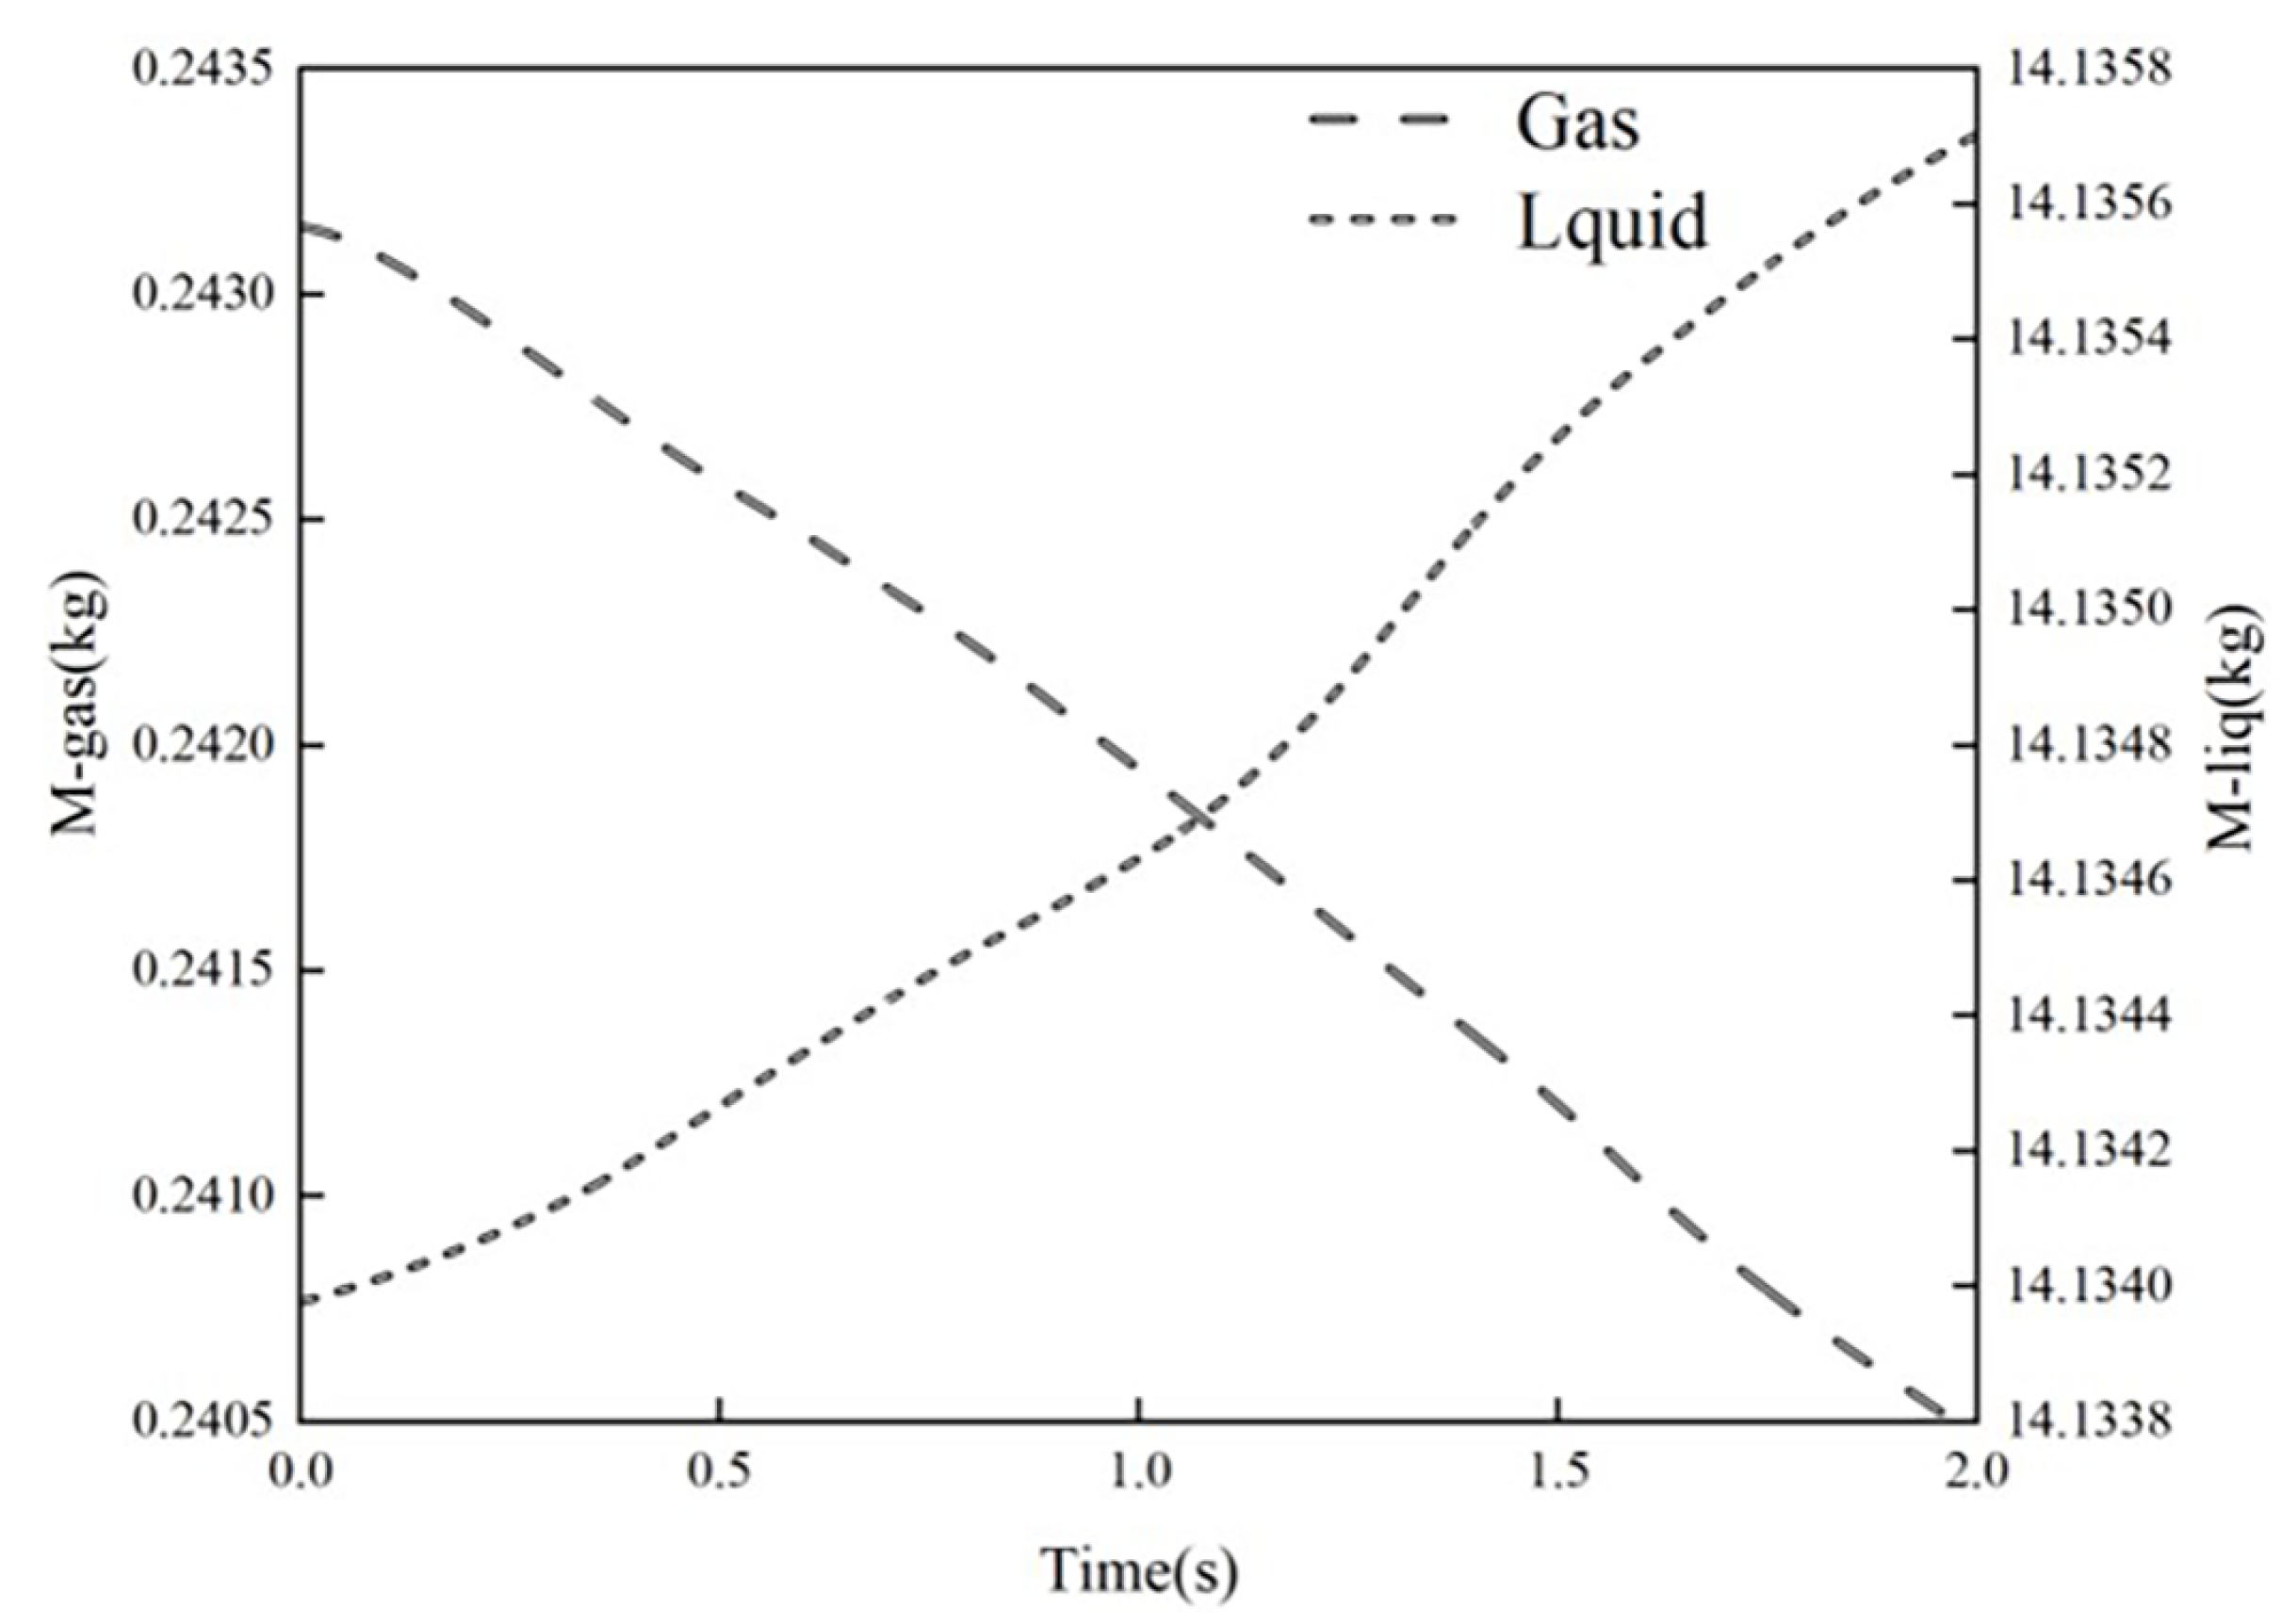
Figure 12 shows the time-resolved interphase mass transfer in an onboard LH2 tank at a 50% filling ratio. Over the 2.0 s sloshing cycle, the vapor mass decreases from 0.2432 to 0.2405 kg ( 1.1 % ), whereas the liquid mass increases from 14.1340 to 14.1357 kg ( + 0.012 % ). These changes arise from the initial thermodynamic nonequilibrium state, in which the liquid is subcooled and the ullage vapor is slightly superheated. Sloshing-induced free-surface motion renews and enlarges the effective gas–liquid interface, thereby intensifying interphase heat transfer. The subcooled liquid promotes net condensation in the ullage, reducing vapor mass and increasing liquid mass. This trend is consistent with the Lee phase-change model, supporting the chosen interphase mass-transfer parameterization in the simulations.
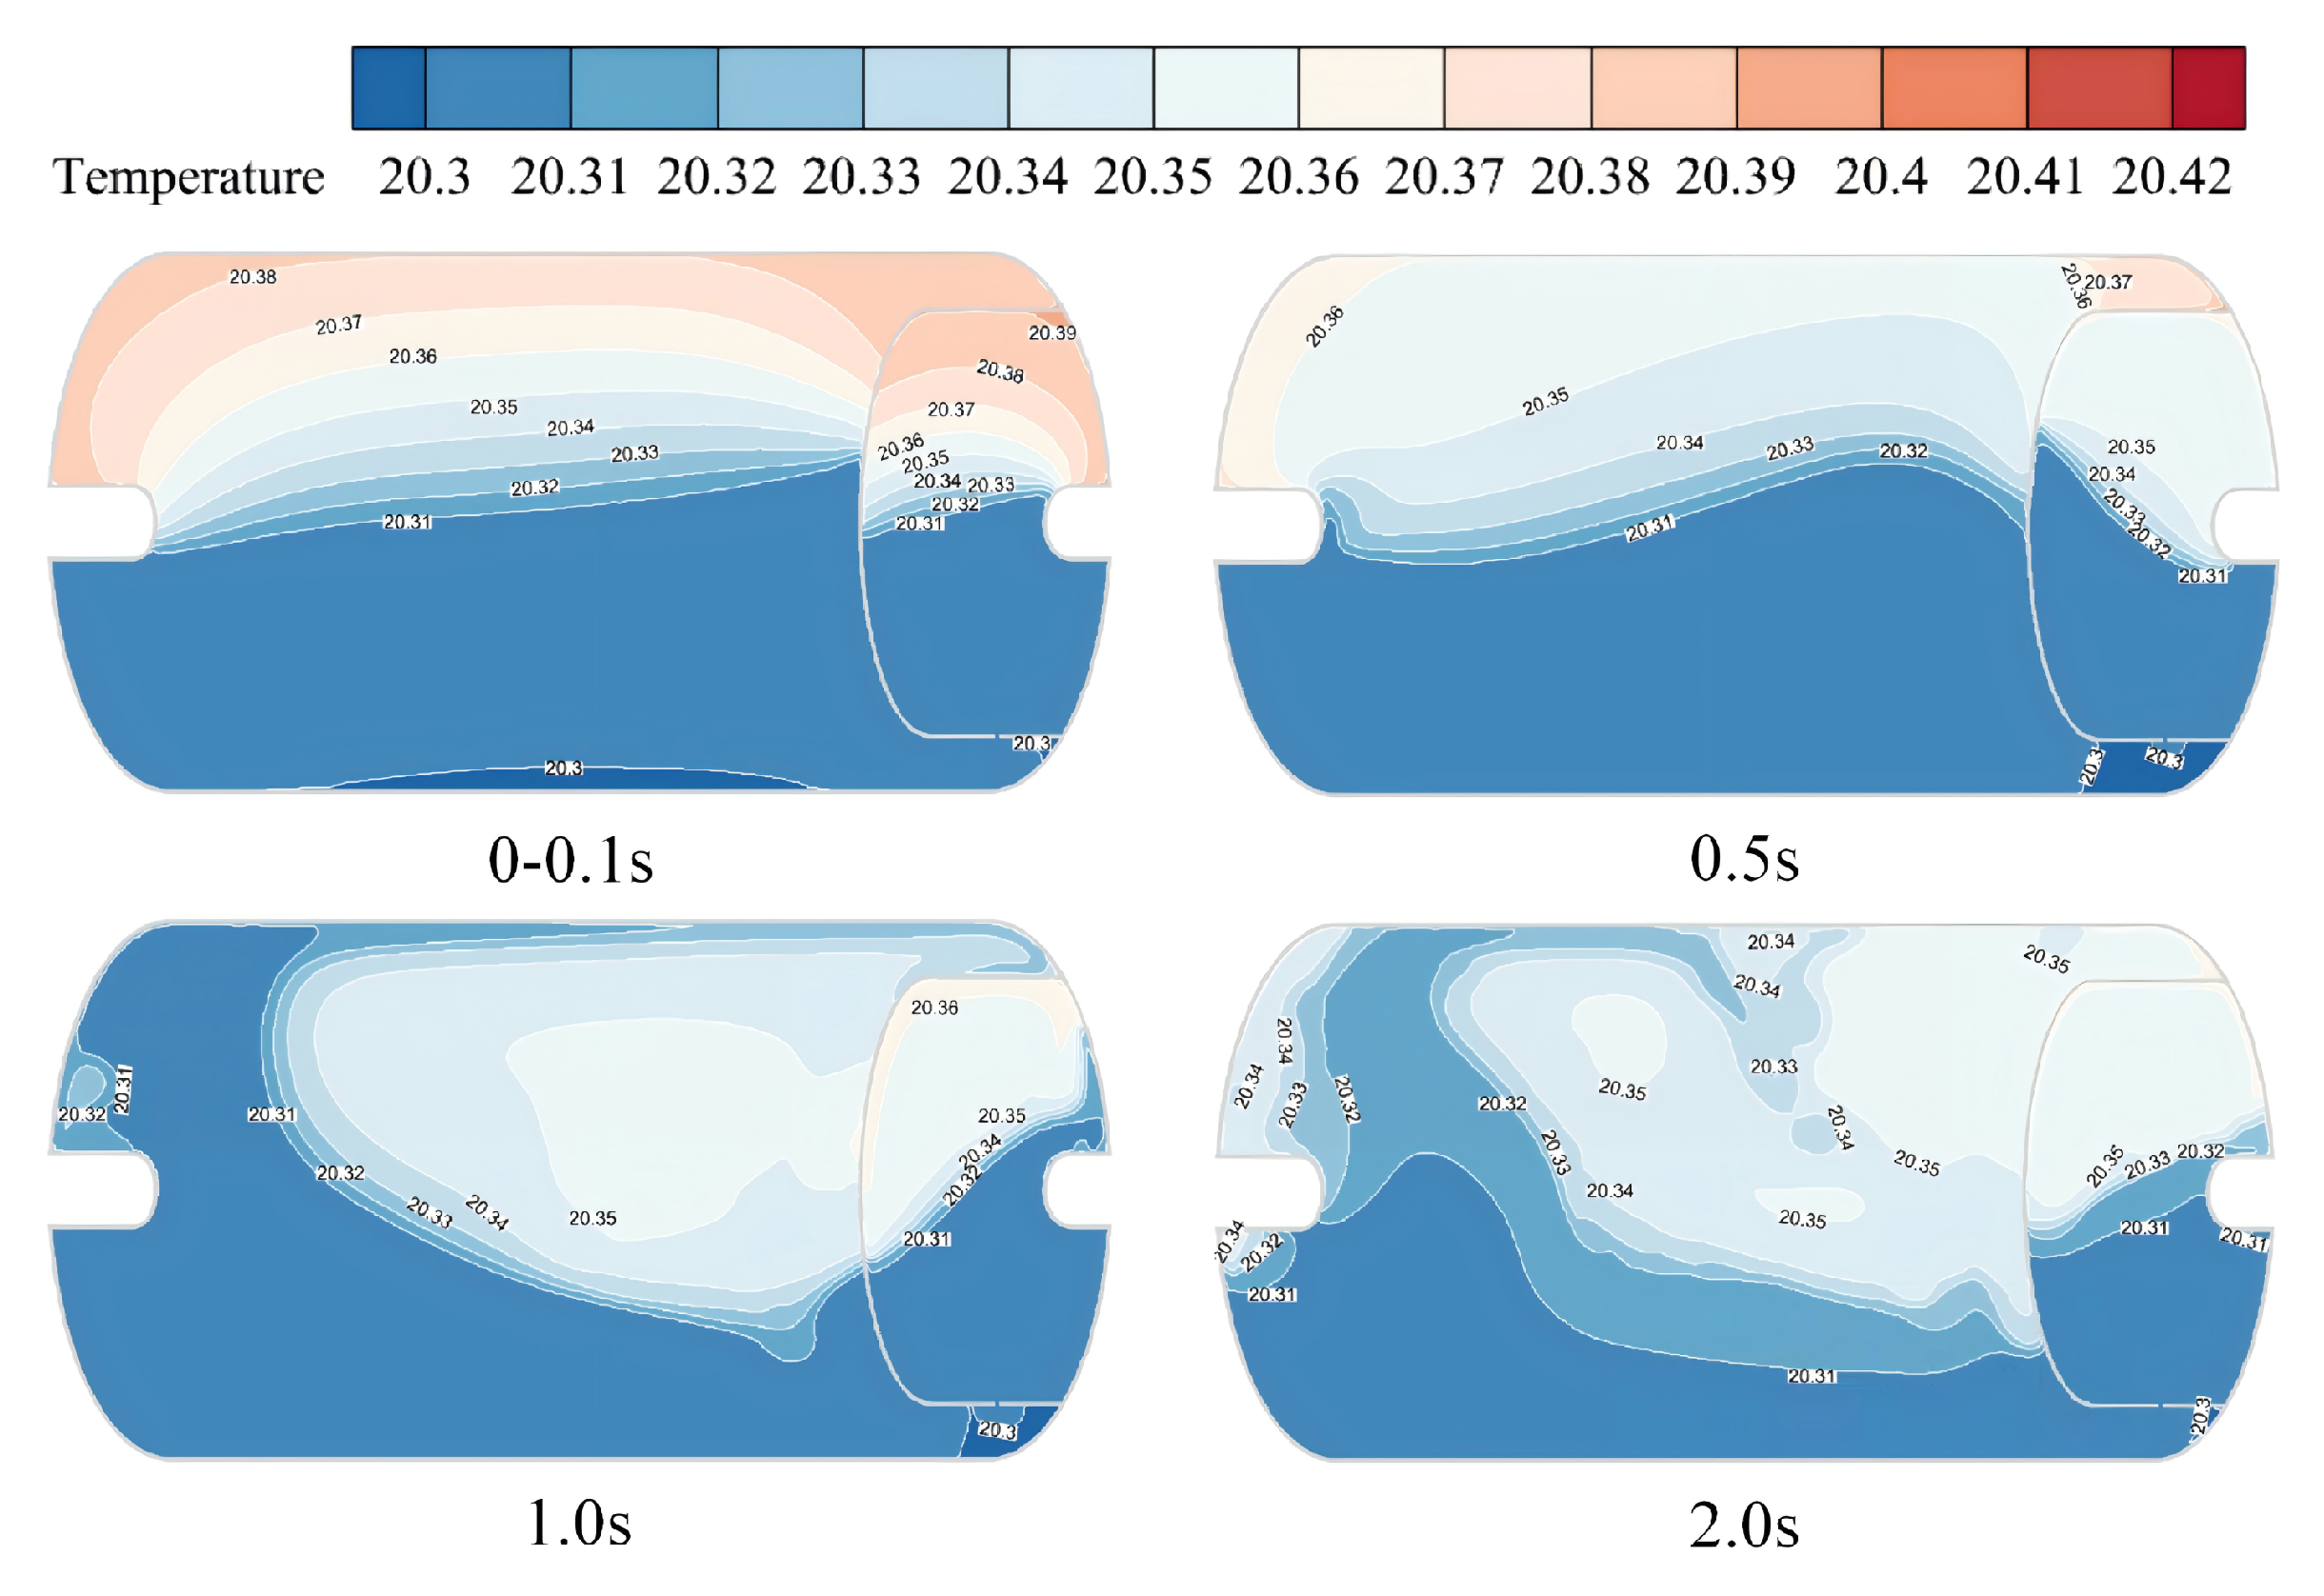
Figure 13 summarizes the transient temperature-field response in the inner vessel during 0.1–2.0 s of sloshing, reflecting coupled conduction and convection. At t = 0.1 s, the temperature field is strongly non-uniform: a steep gradient develops near the ullage wall due to conductive heat ingress, while buoyancy-driven natural convection concentrates warmer gas near the top. Meanwhile, heat ingress through the rear head and upper wall produces the highest temperatures near the ullage apex. At this stage, the response is governed primarily by wall conduction and local natural convection. By t = 1.0 s, sloshing-induced interfacial disturbances enhance interfacial renewal and forced convection, accelerating cooling in the ullage. By t = 2.0 s, the temperature field becomes more uniform and the initial stratification near the ullage apex is largely suppressed, indicating effective sloshing-induced mixing. Notably, the rollover observed near t = 1.0 s strongly modulates ullage temperature: intensified interfacial turbulence intermittently enhances heat transfer, producing a sharp temperature drop and highlighting the strong coupling between liquid-phase hydrodynamics and ullage thermal states.
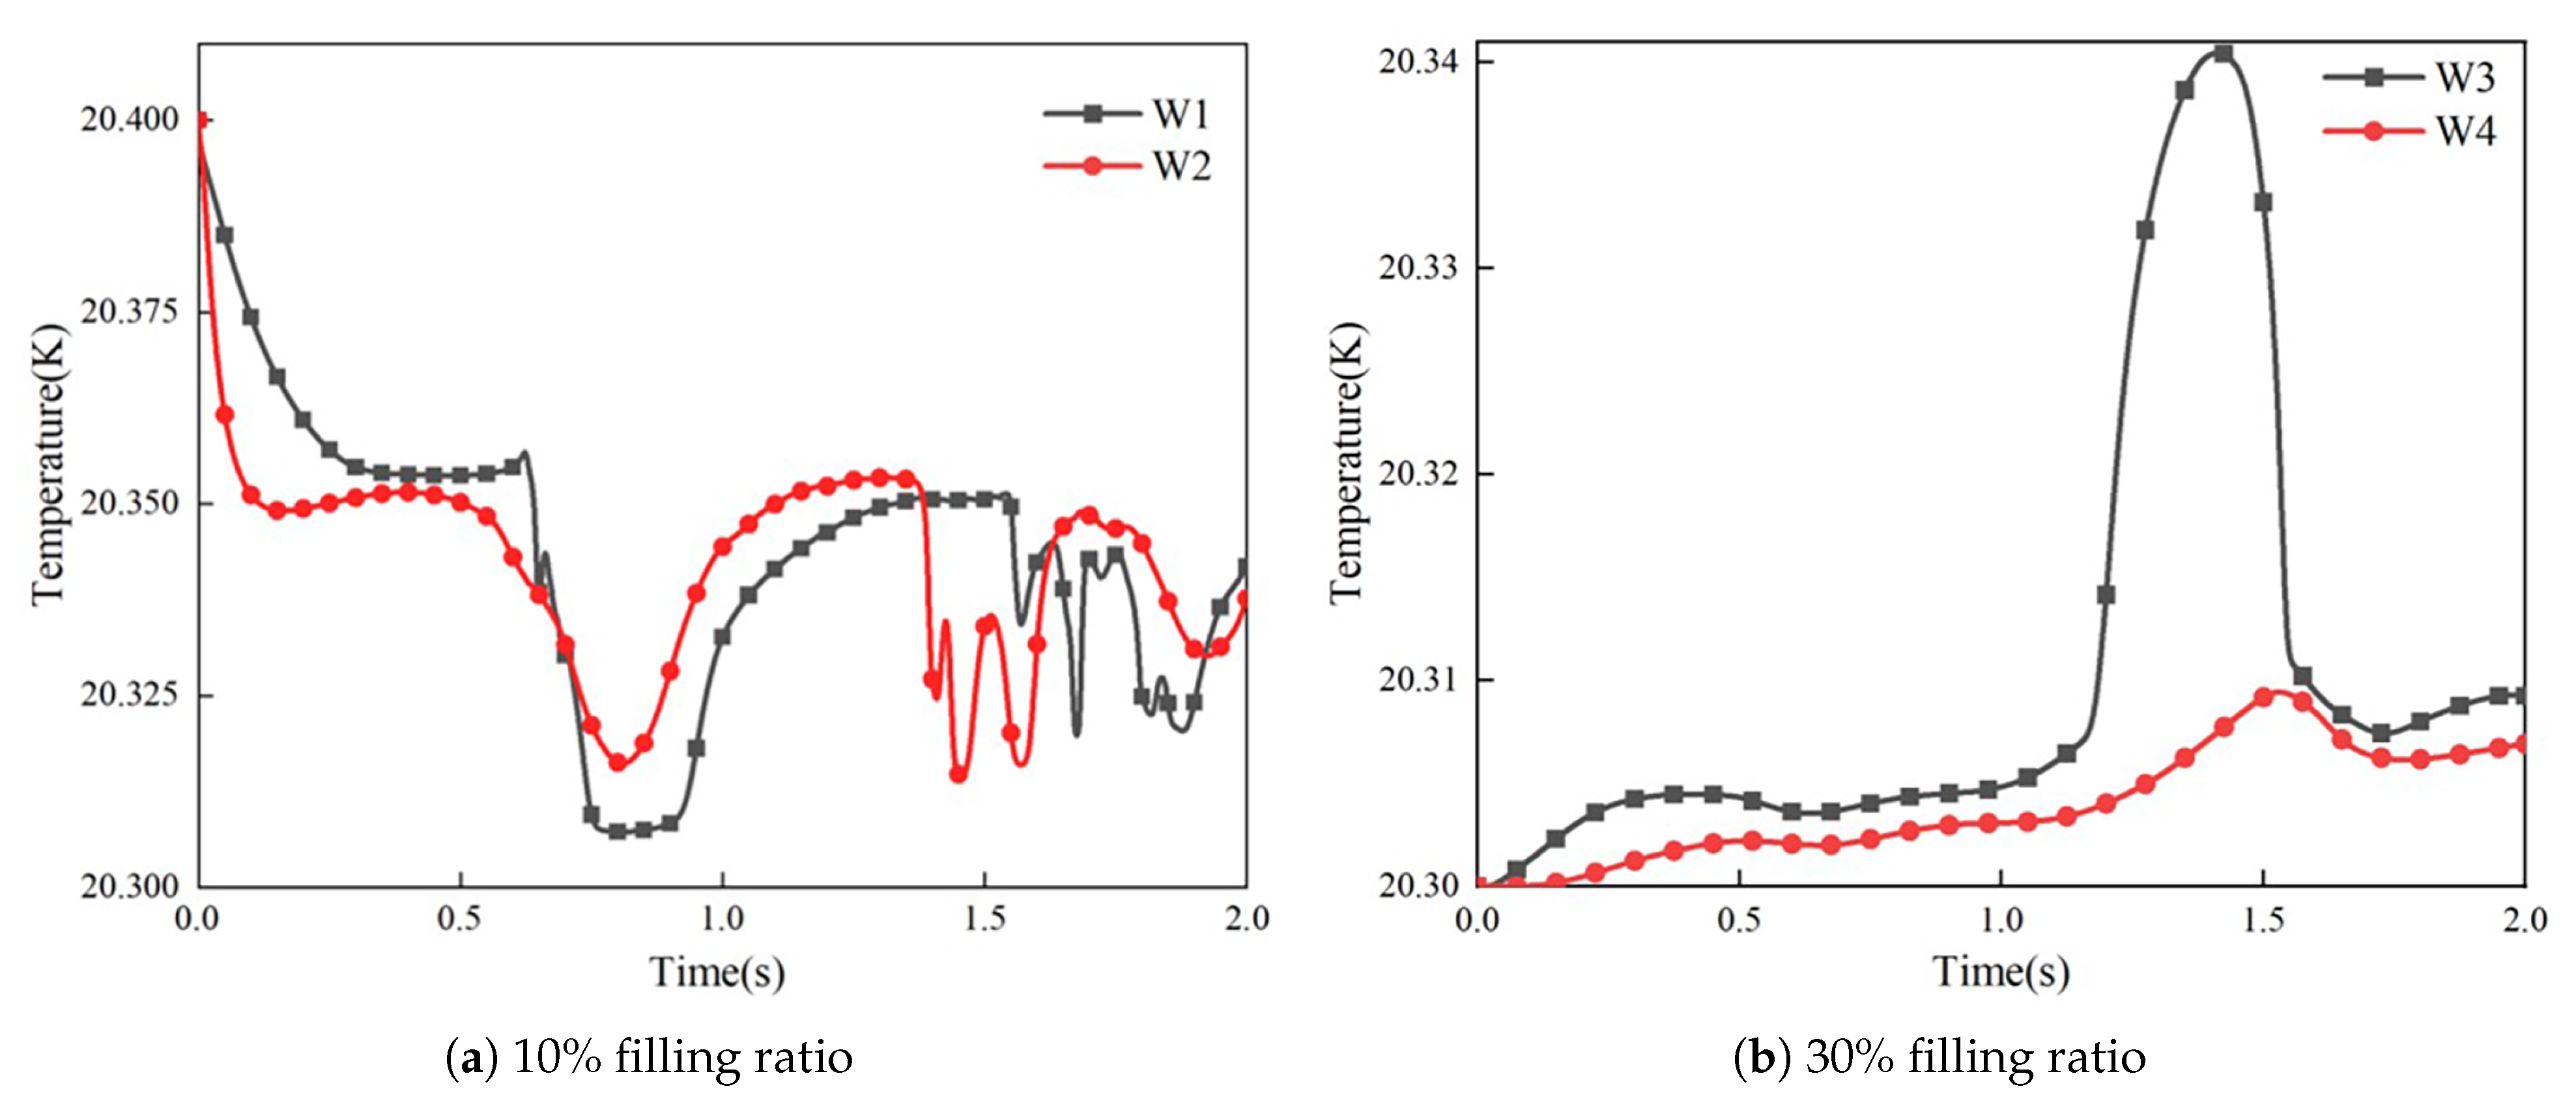
Figure 14a shows the temperature response at ullage monitoring points W1 and W2 during the first 2.0 s of sloshing. Both points start at 20.4 K and cool during 0–0.25 s. At t = 0.25 s, temperatures decrease to 20.36 K (W1) and 20.35 K (W2), corresponding to cooling rates of 0.16 and 0.20   K s −1, respectively. The slower cooling at W1 is attributed to its greater separation from the liquid surface, which weakens liquid-driven convection, consistent with the observed ullage depressurization trend. During 0.25–0.5 s, both points show a slight rebound due to parasitic heat leak through the wall, with W1 exhibiting a more damped response than W2, reflecting thermal relaxation under continued external heat ingress. During 0.5–1.0 s, sustained excitation promotes local wave breaking near W1/W2, leading to abrupt temperature drops followed by rapid recovery. This behavior indicates intermittent enhancement of convective heat transfer caused by wave-induced turbulence, underscoring the role of free-surface disturbances in ullage thermal dynamics. From 1.0–2.0 s, both points continue oscillatory cooling and approach 20.34 K (W1) and 20.33 K (W2) by 2.0 s, indicating reduced stratification and a more uniform ullage temperature distribution.
Figure 14b shows the temperature response at liquid-phase monitoring points W3 and W4. Both start at 20.3 K and warm gradually due to enhanced heat exchange with the ullage through the interface. At t = 1.5 s, transient gas-cavity formation near W3 raises its temperature toward ullage values and induces a smaller increase at W4. By 2.0 s, temperatures reach 20.309 K (W3) and 20.306 K (W4); W3 remains warmer because it lies closer to the interface/ullage, increasing heat uptake from the warmer vapor. This asymmetry underscores the coupling between interfacial dynamics and local temperature gradients, indicating that interface motion strongly influences cryogenic thermal fields.
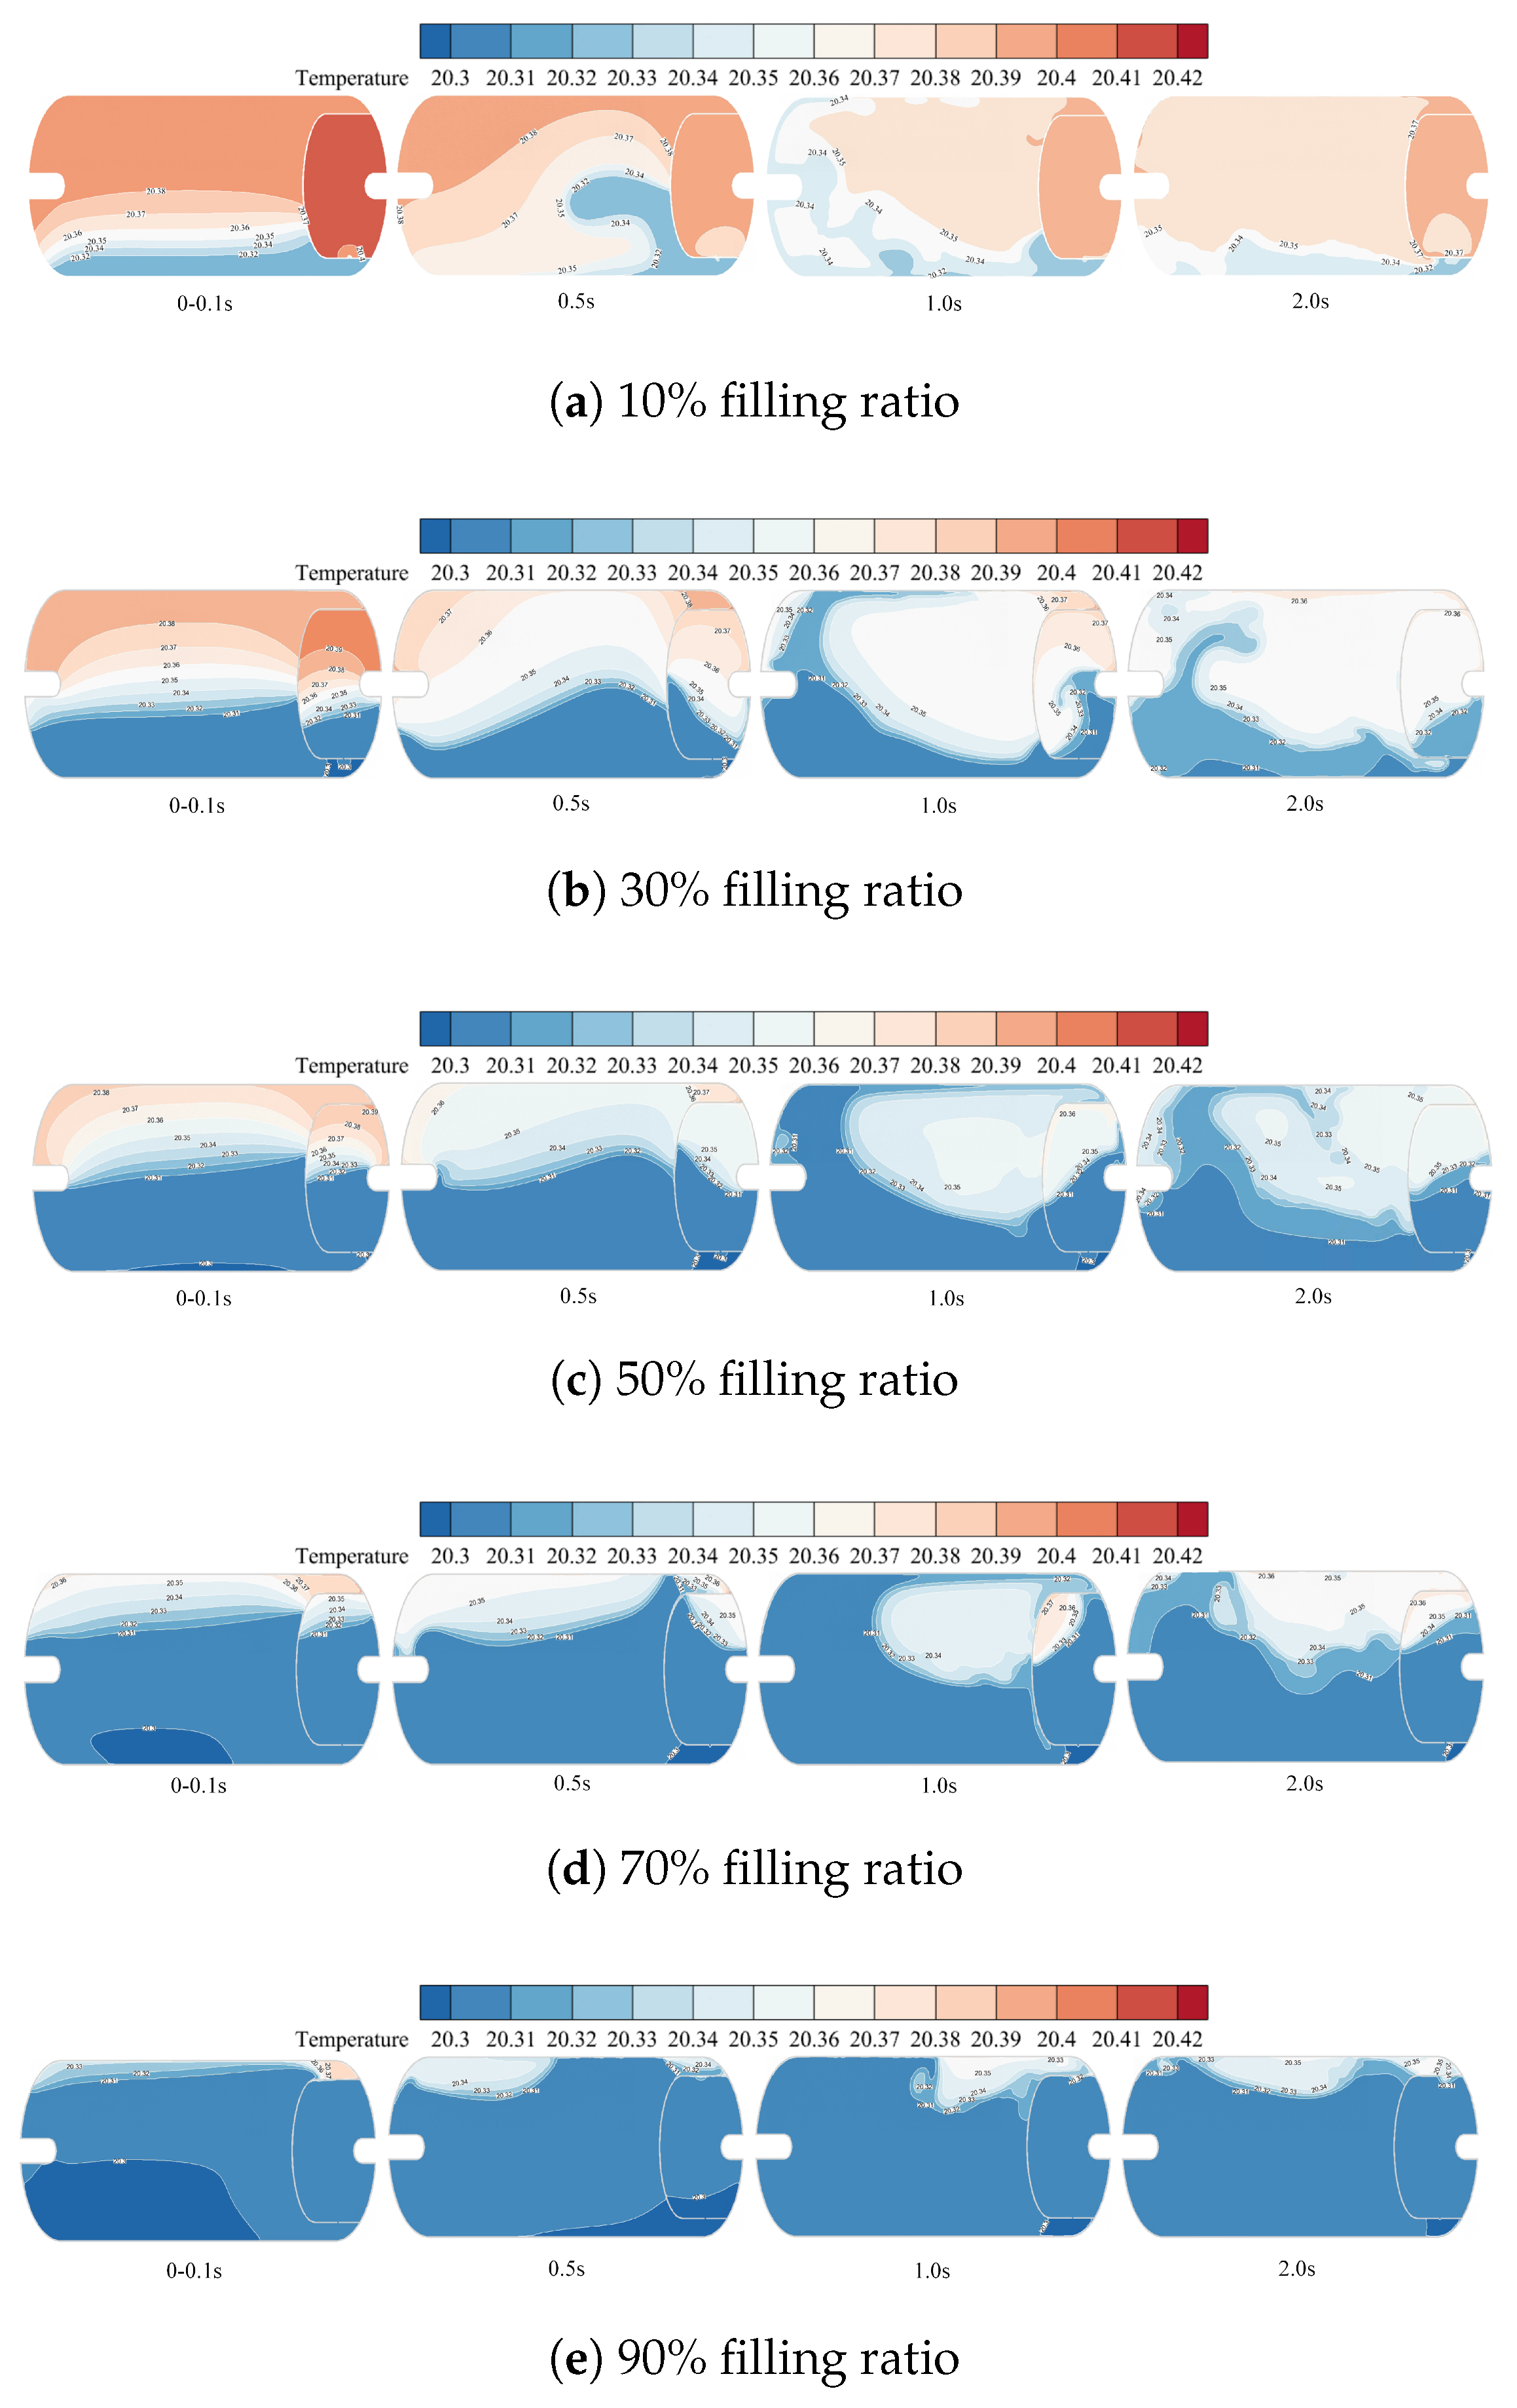
Figure 15 compares temperature-field responses under external excitation for different filling ratios. Initially, a high-temperature region forms near the ullage apex. As sloshing develops, interfacial heat and mass transfer between subcooled liquid and warmer vapor promotes ullage cooling and liquid warming, reducing temperature gradients. For low filling ratios (≤30%), the limited liquid inventory reduces the ability of subcooled LH2 to precool the ullage, so heat transfer remains concentrated near the interface. At 10% filling, the liquid occupies only the bottom portion of the vessel, limiting effective interfacial exchange and slowing thermal equilibration; consequently, elevated temperatures persist near the ullage apex despite gradual cooling. For filling ratios ≥ 30%, a higher liquid level reduces ullage volume and shortens the characteristic heat-transfer path between phases, promoting faster cooling of the warmer vapor near the apex during the early transient. Enhanced heat transfer further arises from dynamic interfacial perturbations that renew the interface and strengthen convective transport. Consequently, ullage cooling becomes stronger with increasing filling ratio, indicating a positive correlation between liquid occupancy and thermal equilibration efficiency in the present configuration.
Although the temperature differences shown in Figure 12 and Figure 14 are relatively small, typically on the order of 0.1 K , they remain physically meaningful for LH2 near saturation. Under cryogenic conditions, the vapor and liquid phases are close to phase equilibrium, and even a small temperature variation can modify the local saturation-pressure difference and affect interfacial condensation. At higher filling ratios, the ullage volume is smaller and the disturbed liquid–vapor interface occupies a larger relative proportion of the vapor space. This enhances heat transfer from the warmer vapor to the colder liquid and promotes stronger ullage cooling. Therefore, the observed temperature variation should be interpreted together with the pressure decay and phase-change behavior, rather than as an isolated thermal difference.
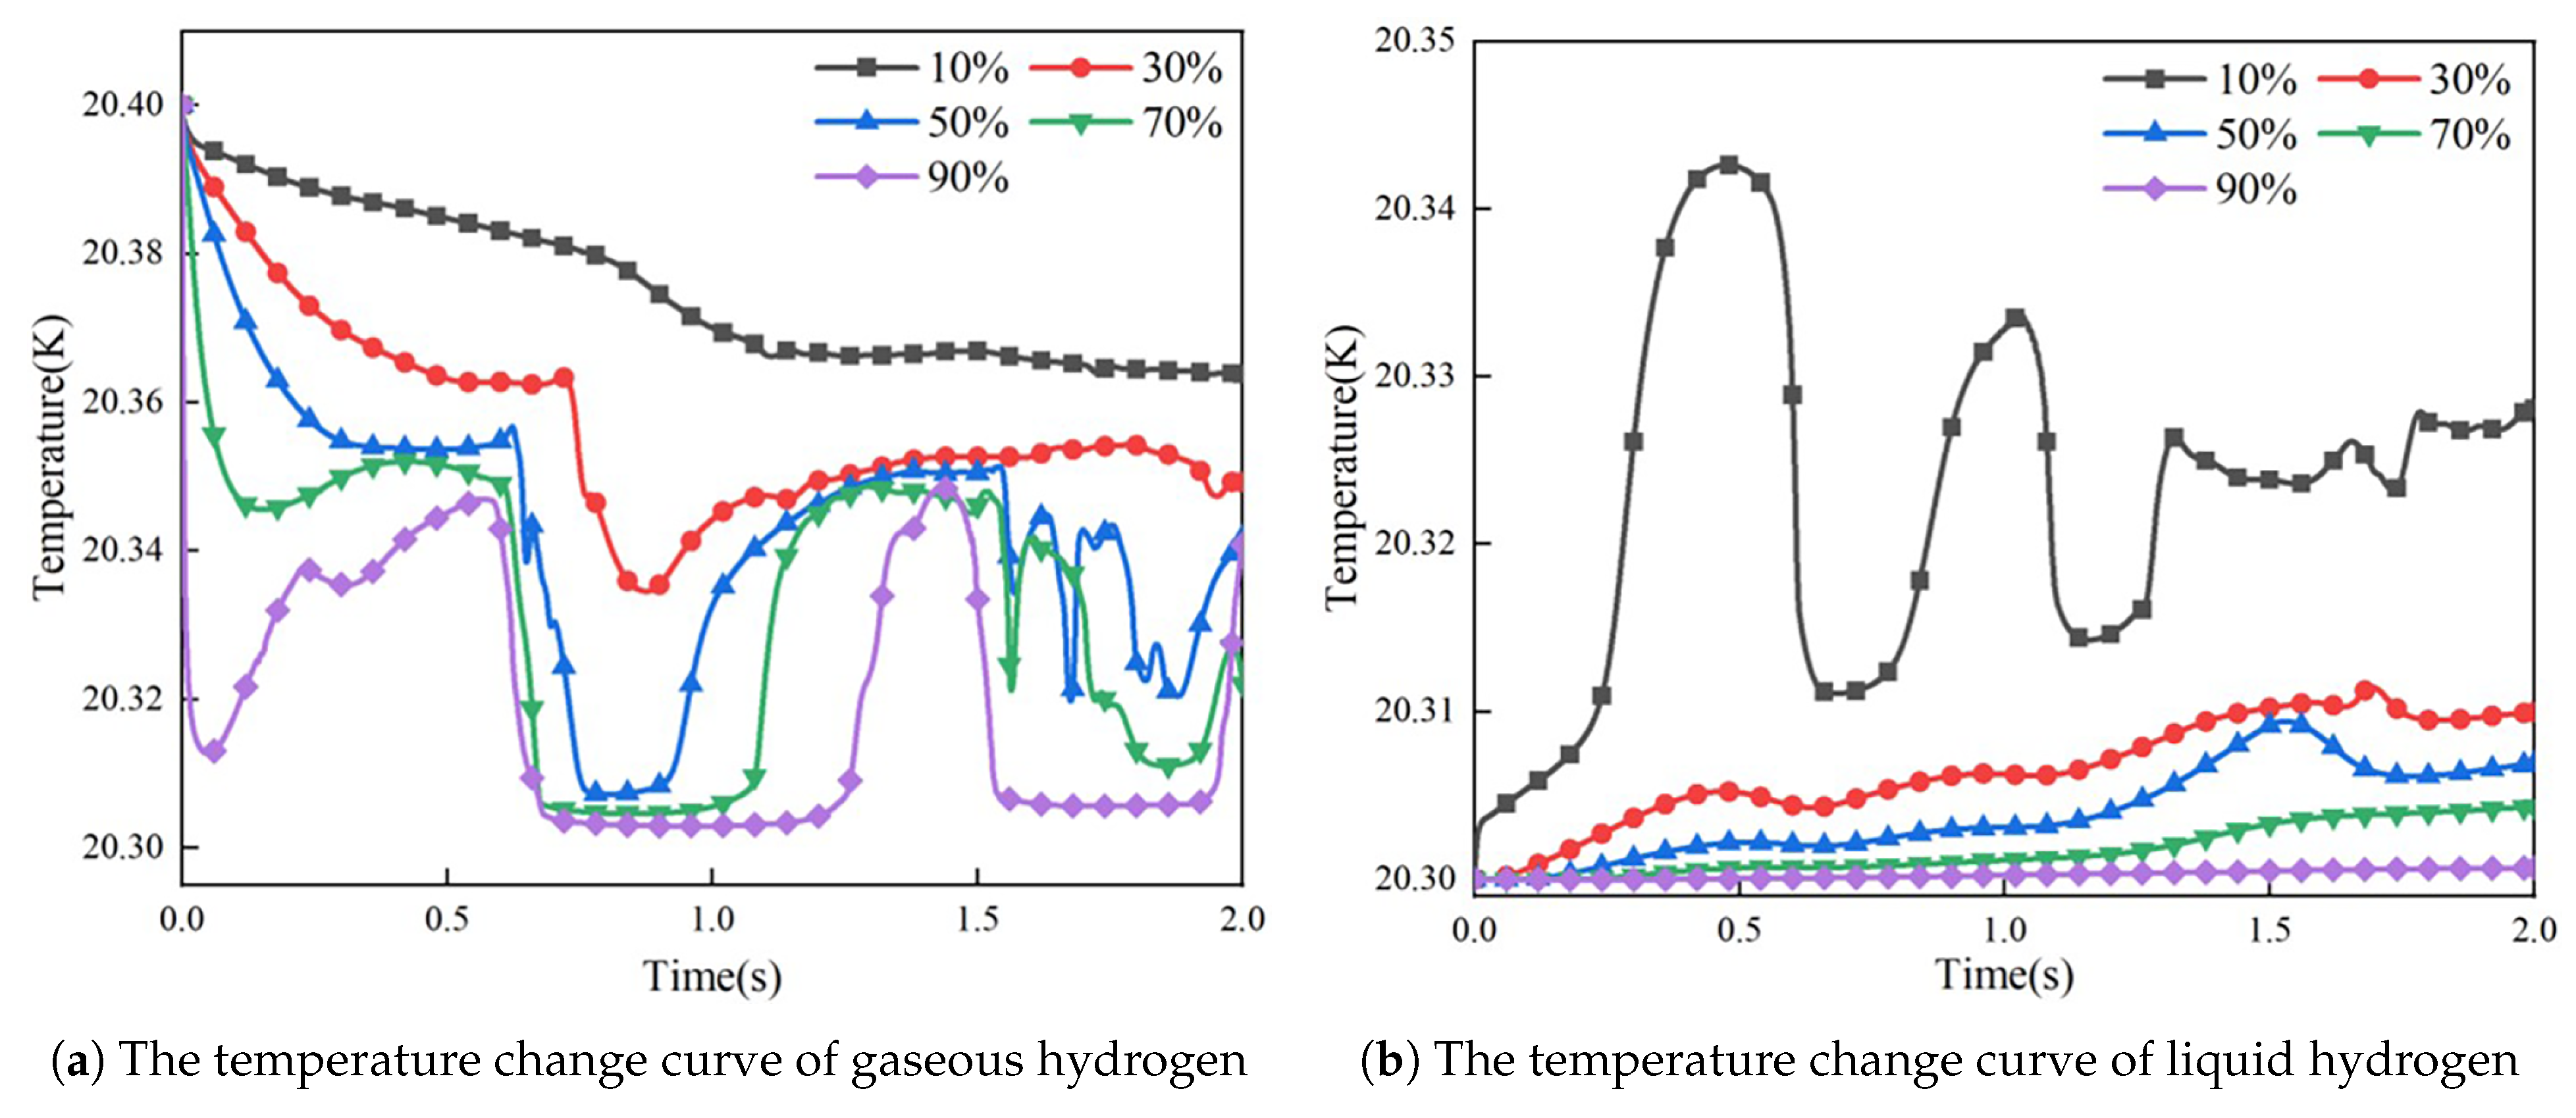
Figure 16a shows the temperature history at W1 for different filling ratios. All cases start at 20.40 K and cool under acceleration-induced sloshing. The response depends strongly on filling ratio: during the first 0.25 s, higher filling ratios cool faster, consistent with a shift from conduction-dominated exchange at low filling to turbulence-enhanced convection and condensation at high filling. At 2.0 s, W1 reaches 20.37 K (10%), 20.35 K (30%), and ∼20.34 K (50–90%), with larger oscillations at higher filling ratios. These oscillations likely result from wave breaking and intermittent turbulence near the monitoring point, which transiently enhances heat transfer. Overall, the filling ratio modulates ullage thermal efficiency and stability by altering flow regimes and the intensity of interfacial disturbances.
Figure 16b shows the temperature response at W3 across filling ratios. Starting from 20.3 K, W3 warms in all cases as the liquid equilibrates thermally with the warmer ullage through interfacial exchange. By 2.0 s, W3 reaches 20.33 K (10%), 20.31 K (30%), 20.307 K (50%), 20.304 K (70%), and 20.30 K (90%), indicating that the warming rate decreases nonlinearly as filling ratio increases. Higher filling ratios increase the effective thermal mass of the liquid, yielding a more inert (slower) temperature response under similar heat inputs. Notably, the 10% case shows stronger temperature fluctuations, whereas 30–90% cases warm more smoothly. This difference arises because, at low filling, W3 lies closer to the interface, so interfacial disturbances can intermittently alter local heat transfer and phase-change intensity; at higher filling ratios, W3 is deeper in the liquid bulk, which buffers interfacial disturbances. Overall, the filling ratio modifies the sloshing response through two coupled effects: it suppresses large free-surface excursions while increasing the relative importance of interfacial condensation because of the reduced ullage volume. This explains why high filling ratios show weaker interface oscillations but stronger condensation-driven pressure decay and ullage cooling under the present excitation condition.

5. Conclusions

This study investigated the thermo-hydrodynamic response of the investigated 1350 L onboard LH2 tank under a specified initial pressure, fixed sinusoidal longitudinal excitation, and filling ratios of 10%, 30%, 50%, 70%, and 90% using a VOF-based two-phase CFD model. The conclusions are limited to the tank geometry, pressure condition, excitation setting, and filling-ratio range considered in this work. The main findings are summarized as follows.
(1)
Higher filling ratios lead to stronger depressurization under the investigated excitation condition. As the filling ratio increases from 10% to 90%, the pressure reduction over the 2.0 s sloshing process increases from 0.418 kPa to 2.410 kPa. The corresponding initial depressurization rate rises from 0.209 to 1.205 kPa s−1, and the normalized pressure drop increases from 0.41% to 2.38%. This trend is mainly attributed to the reduced ullage volume and enhanced interfacial heat and mass transfer at higher filling ratios.
(2)
Increasing the filling ratio suppresses large free-surface motion but strengthens the relative influence of interfacial exchange on ullage pressure. At 10% filling, the large ullage volume allows stronger interface excursions, gas-cavity formation, and splashing. At 90% filling, interface motion is more constrained, but the smaller ullage volume makes the vapor pressure more sensitive to interfacial condensation.
(3)
Higher filling ratios also produce stronger ullage cooling and slower liquid temperature response. The liquid temperature at 2.0 s decreases from 20.33 K to 20.30 K as the filling ratio increases from 10% to 90%, reflecting the larger effective thermal mass of the liquid. Although the temperature differences are small, they are relevant for LH2 near saturation because they can affect local saturation-pressure differences and interfacial phase change.
The present study has several limitations. First, the two-dimensional model mainly captures the dominant longitudinal sloshing response and cannot fully resolve transverse wave motion, azimuthal vortices, or three-dimensional interface breaking. Second, the excitation condition was simplified as a fixed sinusoidal acceleration, whereas real vehicle operation may involve more complex acceleration spectra. Third, the baseline model did not include baffles or other anti-sloshing devices. Therefore, the present conclusions should be interpreted within the investigated tank size, initial pressure, filling-ratio range, and excitation condition, and should not be directly generalized to all vehicle-mounted LH2 tanks without further validation. Future work will focus on three-dimensional simulations, measured vehicle-acceleration inputs, and the integration of anti-sloshing structures to improve the engineering applicability of the model.

Author Contributions

Conceptualization, C.X.; methodology, C.X.; software, C.X.; validation, C.X. and H.W.; formal analysis, C.X.; investigation, C.X.; resources, C.X.; data curation, C.X. and H.D.; writing—original draft, C.X., H.D. and H.W.; writing—review and editing, H.W.; visualization, H.D.; supervision, H.D. and H.W.; project administration, H.D. and H.W. All authors have read and agreed to the published version of the manuscript.

Funding

This research received no external funding.

Data Availability Statement

The original contributions presented in this study are included in the article. Further inquiries can be directed to the corresponding author.

Conflicts of Interest

The authors declared no potential conflicts of interest concerning the research, authorship, and/or publication of this article.

References

  1. Han, S.H.; Kim, S.; Chang, H.; Li, G.; Son, Y. Increased soil temperature stimulates changes in carbon, nitrogen, and mass loss in the fine roots of Pinus koraiensis under experimental warming and drought. Turk. J. Agric. For. 2019, 43, 80–87. [Google Scholar] [CrossRef] [Scilit]
  2. Ren, G.; Cui, M.; Yu, H.; Fan, X.; Zhu, Z.; Zhang, H.; Dai, Z.; Sun, J.; Yang, B.; Du, D. Global environmental change shifts ecological stoichiometry coupling between plant and soil in early-stage invasions. J. Soil Sci. Plant Nutr. 2024, 24, 2402–2412. [Google Scholar] [CrossRef] [Scilit]
  3. Durbin, D.J.; Malardier-Jugroot, C. Review of hydrogen storage techniques for on board vehicle applications. Int. J. Hydrogen Energy 2013, 38, 14595–14617. [Google Scholar] [CrossRef] [Scilit]
  4. Galassi, M.C.; Acosta-Iborra, B.; Baraldi, D.; Bonato, C.; Harskamp, F.; Frischauf, N.; Moretto, P. Onboard compressed hydrogen storage: Fast filling experiments and simulations. Energy Procedia 2012, 29, 192–200. [Google Scholar] [CrossRef] [Scilit]
  5. Hwang, H.T.; Varma, A. Hydrogen storage for fuel cell vehicles. Curr. Opin. Chem. Eng. 2014, 5, 42–48. [Google Scholar] [CrossRef] [Scilit]
  6. Jiachao, L.; Liang, G. Simulation of mass and heat transfer in liquid hydrogen tanks during pressurizing. Chin. J. Aeronaut. 2019, 32, 2068–2084. [Google Scholar] [CrossRef] [Scilit]
  7. Liu, Z.; Li, Y.; Zhou, G. Study on thermal stratification in liquid hydrogen tank under different gravity levels. Int. J. Hydrogen Energy 2018, 43, 9369–9378. [Google Scholar] [CrossRef] [Scilit]
  8. Shuang, J.; Liu, Y. Efficiency analysis of depressurization process and pressure control strategies for liquid hydrogen storage system in microgravity. Int. J. Hydrogen Energy 2019, 44, 15949–15961. [Google Scholar] [CrossRef] [Scilit]
  9. Zhou, R.; Zhu, W.; Hu, Z.; Wang, S.; Xie, H.; Zhang, X. Simulations on effects of rated ullage pressure on the evaporation rate of liquid hydrogen tank. Int. J. Heat Mass Transf. 2019, 134, 842–851. [Google Scholar] [CrossRef] [Scilit]
  10. Stewart, M.; Moder, J.P. Self-pressurization of a flightweight, liquid hydrogen tank: Simulation and comparison with experiments. In Proceedings of the 52nd AIAA/SAE/ASEE Joint Propulsion Conference; American Institute of Aeronautics and Astronautics: Reston, VA, USA, 2016; p. 4674. [Google Scholar]
  11. Liu, Z.; Feng, Y.; Yan, J.; Li, Y.; Chen, L. Dynamic variation of interface shape in a liquid oxygen tank under a sinusoidal sloshing excitation. Ocean Eng. 2020, 213, 107637. [Google Scholar] [CrossRef] [Scilit]
  12. Wu, S.; Ju, Y. Numerical study on pressure drops and thermal response of cryogenic fuel storage tanks under sinusoidal sloshing excitation. Int. J. Hydrogen Energy 2023, 48, 36523–36540. [Google Scholar] [CrossRef] [Scilit]
  13. Hou, C.; Yu, Y.; Liu, X.; Ding, J.; Cui, Z. Effects of longitudinal excitation on liquid hydrogen sloshing in spacecraft storage tanks under microgravity conditions. Int. J. Hydrogen Energy 2024, 51, 765–780. [Google Scholar] [CrossRef] [Scilit]
  14. Lacapere, J.; Vieille, B.; Legrand, B. Experimental and numerical results of sloshing with cryogenic fluids. Prog. Propuls. Phys. 2009, 1, 267–278. [Google Scholar] [CrossRef] [Scilit]
  15. Sherif, S.; Zeytinoglu, N.; Veziroǧlu, T. Liquid hydrogen: Potential, problems, and a proposed research program. Int. J. Hydrogen Energy 1997, 22, 683–688. [Google Scholar] [CrossRef] [Scilit]
  16. Chung, S.M.; Jeon, G.M.; Park, J.C. Numerical approach to analyze fluid flow in a type C tank for liquefied hydrogen carrier (part 1: Sloshing flow). Int. J. Hydrogen Energy 2022, 47, 5609–5626. [Google Scholar] [CrossRef] [Scilit]
  17. Zhu, Y.; Bu, Y.; Gao, W.; Xie, F.; Guo, W.; Li, Y. Numerical study on thermodynamic coupling characteristics of fluid sloshing in a liquid hydrogen tank for heavy-duty trucks. Energies 2023, 16, 1851. [Google Scholar] [CrossRef] [Scilit]
  18. Li, S.; Yan, Y.; Wei, W.; Wang, Z.; Ni, Z. Numerical simulation on the thermal dynamic behavior of liquid hydrogen in a storage tank for trailers. Case Stud. Therm. Eng. 2022, 40, 102520. [Google Scholar] [CrossRef] [Scilit]
  19. Roenby, J.; Bredmose, H.; Jasak, H. A computational method for sharp interface advection. R. Soc. Open Sci. 2016, 3, 160405. [Google Scholar] [CrossRef] [Scilit] [PubMed]
  20. Lemmon, E.W.; Bell, I.H.; Huber, M.L.; McLinden, M.O. REFPROP Documentation; Release 10.0; National Institute of Standards and Technology: Boulder, CO, USA, 2018; 135p. [Google Scholar]
  21. Barsi, S.; Kassemi, M. Numerical and experimental comparisons of the self-pressurization behavior of an LH2 tank in normal gravity. Cryogenics 2008, 48, 122–129. [Google Scholar] [CrossRef] [Scilit]
  22. Grotle, E.L.; Bihs, H.; Æsøy, V. Experimental and numerical investigation of sloshing under roll excitation at shallow liquid depths. Ocean Eng. 2017, 138, 73–85. [Google Scholar] [CrossRef] [Scilit]
  23. Grotle, E.L.; Æsøy, V. Dynamic modelling of the thermal response enhanced by sloshing in marine LNG fuel tanks. Appl. Therm. Eng. 2018, 135, 512–520. [Google Scholar] [CrossRef] [Scilit]
Figure 1. Two-dimensional computational model of the inner vessel.
Processes 14 02005 g001
Figure 2. Temperature dependence of LH2 density and saturation pressure.
Processes 14 02005 g002
Figure 3. Predicted pressure at selected times (0.5–2.0 s) for different grid resolutions.
Processes 14 02005 g003
Figure 4. Computational mesh of the two-dimensional domain.
Processes 14 02005 g004
Figure 5. Comparison diagram of experimental and simulated pressures.
Processes 14 02005 g005
Figure 6. Volume-fraction field of LH2 in the onboard cylinder at a 50% filling ratio (initial equilibrium state).
Processes 14 02005 g006
Figure 7. Snapshots of the gas-liquid interface evolution during a 2.0 s sloshing event (50% filling ratio).
Processes 14 02005 g007
Figure 8. Ullage pressure history at monitoring point W1 during sloshing (50% filling ratio).
Processes 14 02005 g008
Figure 9. Snapshots of the gas–liquid interface evolution under different filling ratios.
Processes 14 02005 g009
Figure 10. Ullage pressure histories at W1 under different filling ratios.
Processes 14 02005 g010
Figure 11. Time histories of condensation rate under different filling ratios.
Processes 14 02005 g011
Figure 12. Time histories of gas-phase and liquid-phase mass during sloshing (50% filling ratio).
Processes 14 02005 g012
Figure 13. Temperature contours during a 2.0 s sloshing event (50% filling ratio).
Processes 14 02005 g013
Figure 14. Temperature histories at monitoring points under the reference filling ratio (50%).
Processes 14 02005 g014
Figure 15. Temperature contours under different filling ratios.
Processes 14 02005 g015
Figure 16. Time histories of gaseous hydrogen temperature and liquid hydrogen temperature under different filling ratios.
Processes 14 02005 g016
Disclaimer/Publisher’s Note: The statements, opinions and data contained in all publications are solely those of the individual author(s) and contributor(s) and not of MDPI and/or the editor(s). MDPI and/or the editor(s) disclaim responsibility for any injury to people or property resulting from any ideas, methods, instructions or products referred to in the content.