1. Introduction
During the exploitation of tight shale gas resources characterized by ultra-low permeability, multi-stage hydraulic fracturing in horizontal wells is a critical technology for production enhancement. Ensuring effective isolation between fracturing stages and preventing inter-stage fluid channeling is a necessary prerequisite for the successful implementation of fracturing designs [
1,
2,
3,
4,
5]. However, during perforation operations, the cement sheath and casing can be damaged, and weak planes are generated at the wellbore bonding interfaces. Under the Influence of subsequent fracturing operations, high-pressure fluid within the wellbore is prone to channeling along the cement sheath–formation interface. This type of channeling not only directly compromises the sealing integrity of the wellbore but may also cause unintended communication between different fracturing stages, ultimately weakening the overall reservoir stimulation effectiveness [
6,
7,
8,
9,
10]. Such interface channeling has become a critical engineering hazard threatening wellbore integrity and production safety [
11,
12]. Taking the Lu-203 well block as an example, of 21 production wells, 16 experienced reduced fracturing effectiveness due to cement sheath sealing failure at perforation clusters, leading to stage communication. Consequently, the regional daily gas production plummeted from 9.88 × 10
5 m
3/d to 1.25 × 10
5 m
3/d, a decrease of 87.3%. This stage of communication also caused an average decrease of 17.9% in the estimated ultimate recovery (EUR) for typical pad wells. Furthermore, engineering practice and data statistics indicate that inter-stage channeling also occurs in other shale gas fields such as Weiyuan and Changning, leading to sharp production declines and reduced reservoir recovery. This issue has attracted significant industry attention and has become a key focus for optimizing current fracturing design and operational practices [
13,
14]. Therefore, to effectively predict and mitigate inter-stage channeling during fracturing and to enhance reservoir stimulation performance, it is essential to systematically investigate the dynamic process of bonding interface damage—induced by perforation operations—under the action of fracturing fluid. This study comprehensively accounts for the geological and engineering conditions of the target well. Moreover, it considers the mechanical behavior of the tripartite wellbore system. It focuses on clarifying the dynamic evolution mechanism of high-pressure fluid migration along weak interfaces within the wellbore. Furthermore, the study seeks to quantify the Influence of various key parameters on fluid channelling behaviour, consequently establishing a solid theoretical basis and guiding the decision-making process for field fracturing operations and wellbore integrity management.
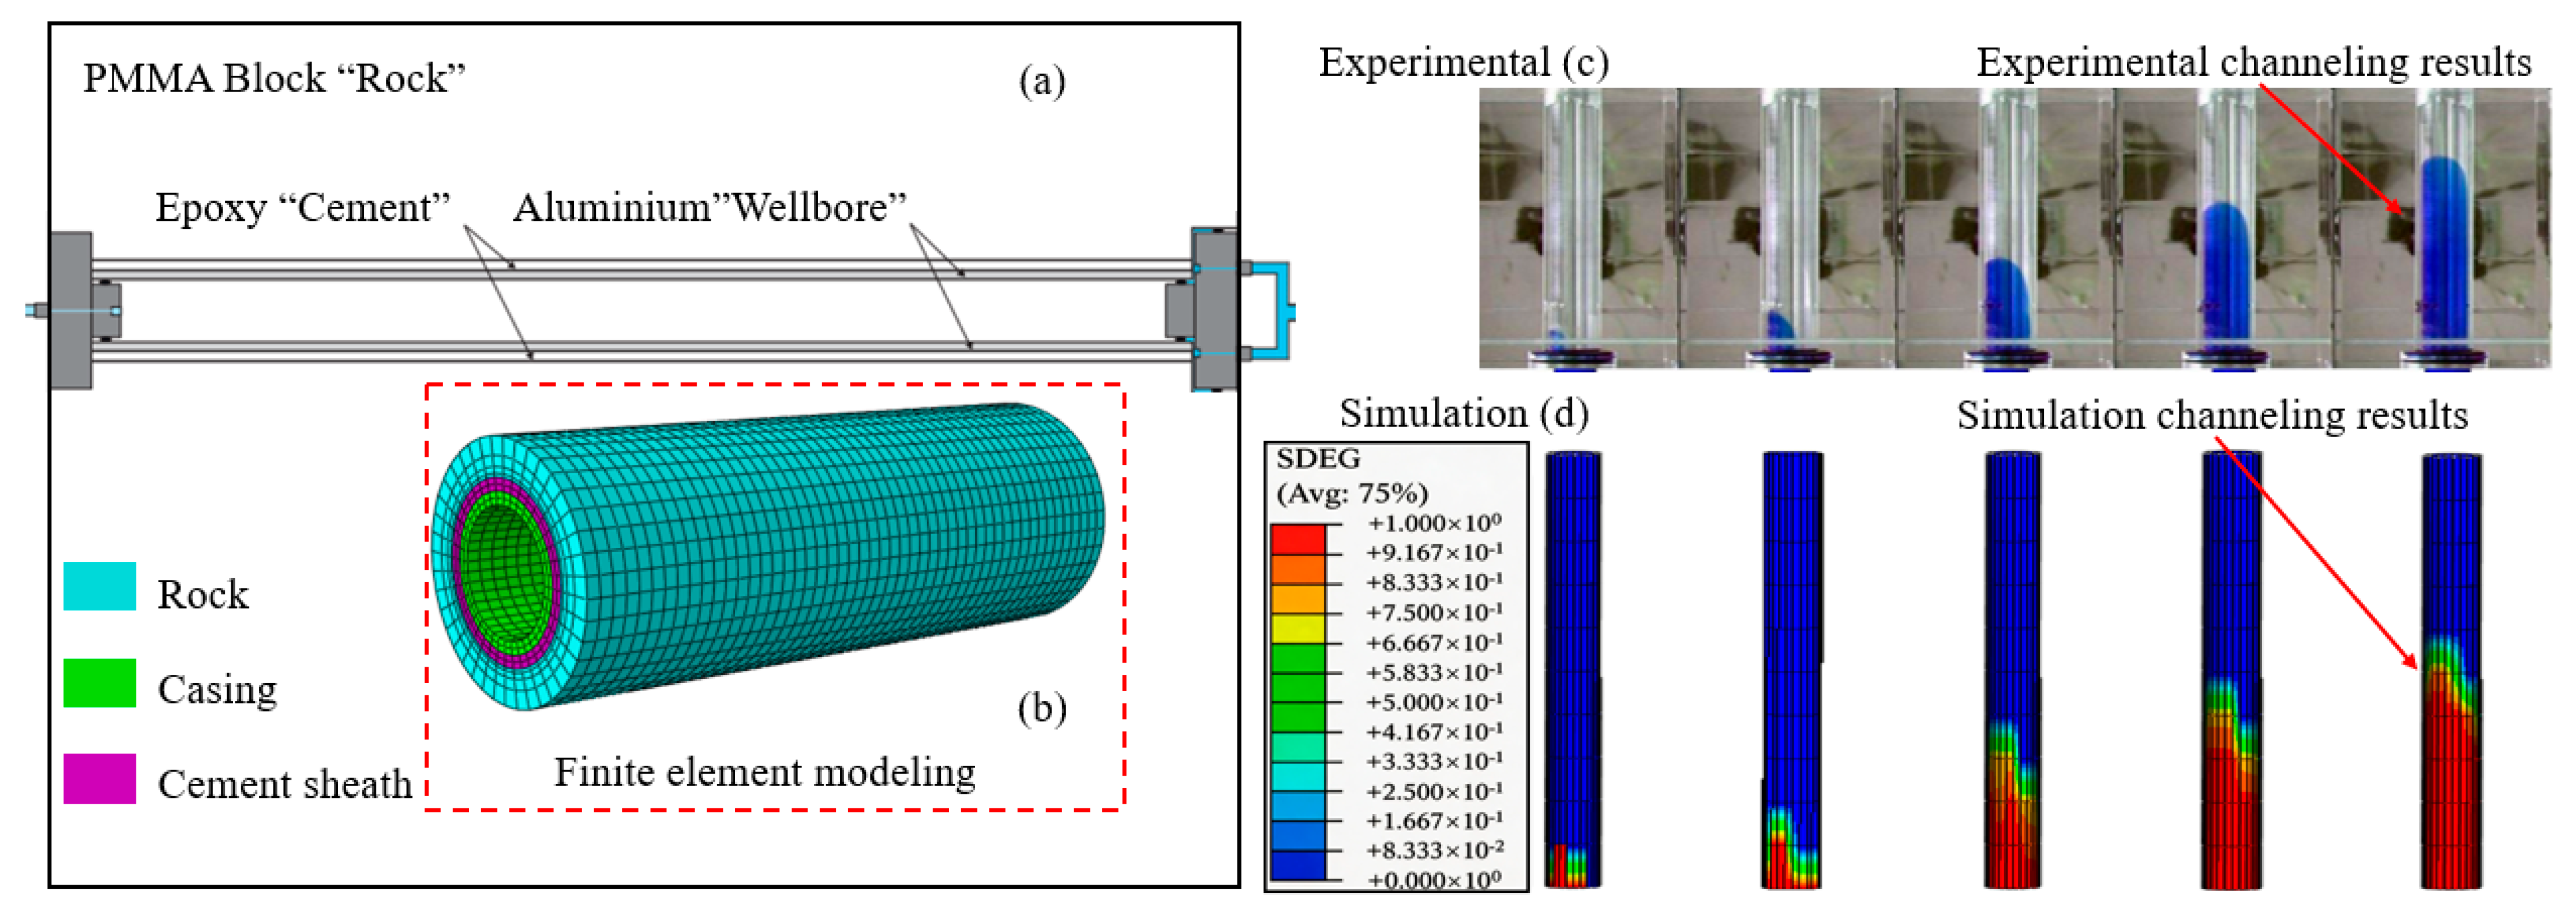
Regarding inter-stage channeling during fracturing operations, previous studies have extensively explored the risk of initial channeling and the dynamic evolution patterns of channeling development through methods such as laboratory experiments, theoretical calculations, and numerical simulations. In terms of laboratory experimental studies, Lecampion conducted experiments using aluminum tubes to simulate casing, epoxy resin to simulate cement, and PMMA blocks to simulate the formation. With preset initial defects and controlled wellbore pressure and fluid viscosity, the circumferential coverage of the debonding fracture was observed to stabilize between 1/2 and 3/4 of the wellbore circumference. However, the calculation results for the axial propagation height along the wellbore were not explicitly provided, thus failing to offer a complete reference for the full spatial evolution of interface debonding [
15]. Sun constructed experimental assemblies with different cement sheath conditions at the primary and secondary interfaces to simulate downhole environments. Utilizing acoustic logging devices, they analyzed the impact of various micro-annuli on interfacial sealing capacity. The study concluded that the size of the interfacial micro-annulus directly determines the effectiveness of cementing isolation [
16]. In terms of theoretical calculations, prior work by Lecampion and Su formed complementary conclusions on the issue of interface debonding. Specifically, the former identified the circumferential coverage range of the fracture, estimating it to be 1/2 to 3/4 of the wellbore circumference [
8,
15]. Meanwhile, the latter systematically analyzed the impact of the annular cement’s mechanical properties on the channeling height. This work preliminarily established a quantitative evaluation method for the occurrence of channeling at the wellbore bonding surface. Regarding numerical modeling, Taleghani developed a 3D framework using the extended finite element method to simulate the bonding interface of the wellbore assembly during fracturing operations. They investigated the effects of different parameter settings on fracture propagation after interfacial debonding. The study indicated that the stiffness of the set cement is a critical factor determining interface fracture propagation [
17]. Feng developed a 3D computational framework addressing fluid-driven interfacial debonding in vertical injection wells, utilizing the Cohesive Zone Method (CZM) integrated with pore pressure. Their study investigated the impact of lateral stress fields, pre-existing interface imperfections, and the mechanical attributes of the cement bond on the pressure required for fracture extension (FPP) and the geometry of the debonded area. The study concluded that the minimum horizontal in situ stress serves as the dominant factor controlling fracture propagation. Initial defects significantly lower the pressure required to initiate fractures, and the development of debonding is considerably influenced by cement stiffness [
18]. Based on the CZM model, Li developed separate fracture propagation models for the primary and secondary interfaces of the cement sheath under constant injection pressure. By employing a secondary stress criterion to describe interfacial damage evolution, they systematically analyzed the influence patterns of cement sheath parameters, formation properties, and operational pressure on the vertical extension and morphology of the fracture at the cementing interfaces. The study concluded that enhancing the bonding strength at the secondary interface can simultaneously suppress fracture propagation at both interfaces [
19]. Based on the research above, it can be concluded that studies have been conducted focusing on the fracture propagation mechanism at cementing interfaces during fracturing operations and the influencing parameters (such as cement stiffness, formation stress, and bond integrity). These studies have elucidated the impact of these variables on the pressure required for fracture extension and the resulting geometric morphology. However, no systematic research has investigated the propagation patterns of fractures along cementing interfaces axially and circumferentially within the wellbore. Therefore, relevant optimization measures still lack sufficient quantitative analysis for cement sheath interface debonding.
In practical cementing operations, casing eccentricity is a common engineering phenomenon influenced by factors such as well trajectory control accuracy and casing running practices. The eccentric structure not only results in uneven circumferential distribution of cement sheath thickness, leading to interfacial stress concentration and weakened sealing performance, but also significantly affects mud displacement efficiency. This increases the probability of drilling fluid retention in the narrow side of the eccentric annulus, thereby forming mud channels and bonding defects, which weaken the initial bonding strength at the interfaces. Consequently, wellbore fluids are more likely to channel along the bonding interfaces following perforation operations [
20,
21,
22,
23,
24]. To define the displacement front boundary of drilling fluids in horizontal wells with casing eccentricity, a calculation model was established by Fu [
25]. The research findings indicated that a non-uniform cement sheath around the casing is primarily caused by eccentricity. Furthermore, it was concluded that an eccentricity level of 0.5 is sufficient to create continuous channels along the wellbore. This research confirmed that the non-uniform annulus distribution caused by eccentricity not only directly results in cementing bonding defects but also provides preferential pathways for interfacial channeling during subsequent fracturing operations. Zhang employed elasticity theory and finite element methods to establish a strain-based finite element mechanical model for the casing–cement sheath–formation system, considering the contact characteristics of the bonding interfaces. An investigation was conducted into the Influence of casing eccentricity on the stress distribution in the cement sheath. It was concluded that the variation in contact pressure at the bonding interfaces, induced by eccentricity, is significantly governed by the in situ stress regime. The study demonstrated that casing eccentricity compromises cement sheath integrity, thereby affecting inter-zonal isolation. Suppose eccentricity is not controlled during cementing, the sealing performance of the cement sheath declines, potentially inducing inter-zonal channeling [
26]. A model describing cohesive behavior at cement sheath interfaces was developed by Arjomand via three-dimensional finite-element analysis. The internal stress profile of the cement sheath was analyzed in relation to casing eccentricity. Furthermore, the Influence of this eccentricity on the structural integrity of the cement sheath was assessed. It was observed that the narrow side of the cement sheath is rendered more vulnerable to both compressive and tensile failures, a phenomenon attributed to stress concentration [
27]. As eccentricity increases, the damaged zone expands, and the interface sealing capacity further decreases, thereby significantly raising the risk of channeling. A two-dimensional plane-strain finite-element model of the casing–cement sheath–formation system was established by Zheng, and the mechanical response associated with casing eccentricity was investigated. It was revealed that stress concentration is induced on the narrow side of the annulus, rendering the eccentric cement sheath more susceptible to integrity failure under equivalent strength conditions [
28]. Furthermore, greater eccentricity leads to higher stress on the narrow side and a lower critical failure pressure, making it easier for interface channeling pathways to form. The aforementioned research results indicate that, although numerous studies have focused on the impact of casing eccentricity on cement sheath integrity, studies specifically addressing interfacial channeling under casing eccentricity remain notably insufficient. At the level of the interaction mechanism between casing eccentricity and interfacial channeling, no research has yet systematically elucidated the laws governing the initiation and propagation of channeling pathways in relation to the degree of eccentricity.
Synthesizing the aforementioned studies, it is apparent that a series of studies have been conducted, through means such as establishing numerical simulation models, carrying out laboratory experiments, and performing theoretical calculations, to address the issue of channeling along bonding interfaces by high-pressure wellbore fluid in the presence of initial weak planes after perforating operations. While substantial advancements have been made in understanding the mechanisms of wellbore interface channeling, limitations persist regarding the treatment of complex wellbore geometries and their three-dimensional (3D) evolution characteristics. The objective of this study is not to formulate an entirely new theoretical framework; instead, a substantive incremental extension is provided based on the established 3D fluid-driven interface debonding model (CZM–pore pressure coupling), specifically tailored for the realistic condition of casing eccentricity. Within the existing CZM pore pressure coupling framework, a non-uniform cement sheath geometry induced by casing eccentricity is incorporated into a 3D wellbore assembly model to simulate a more authentic horizontal wellbore environment. Furthermore, the axial extension and circumferential expansion of the cement–formation interface debonding are quantified simultaneously, thereby revealing the 3D dynamic evolution laws under complex geometric boundaries and surmounting the constraints of prior research that predominantly focused on a single axial dimension. Finally, the differential impacts of eccentricity on interface initiation pressure and debonding length are compared under thin-side and thick-side injection conditions, providing a more robust quantitative foundation for wellbore integrity evaluation under eccentric configurations.
In response, a 3D finite-element model of the wellbore assembly incorporating an eccentric casing was established. This model is based on rock mechanics and fluid–solid coupling theory. It was solved using a stress-seepage coupling method. This research seeks to reveal the onset and propagation laws of fractures at the cement–formation interface under the coupled action of stress and seepage. It seeks to reveal the mechanisms by which casing eccentricity and the mechanical properties of the annular cement influence the failure process. These findings provide theoretical support for related engineering quality control.
2. Fracturing Fluid Wellbore Channeling Model
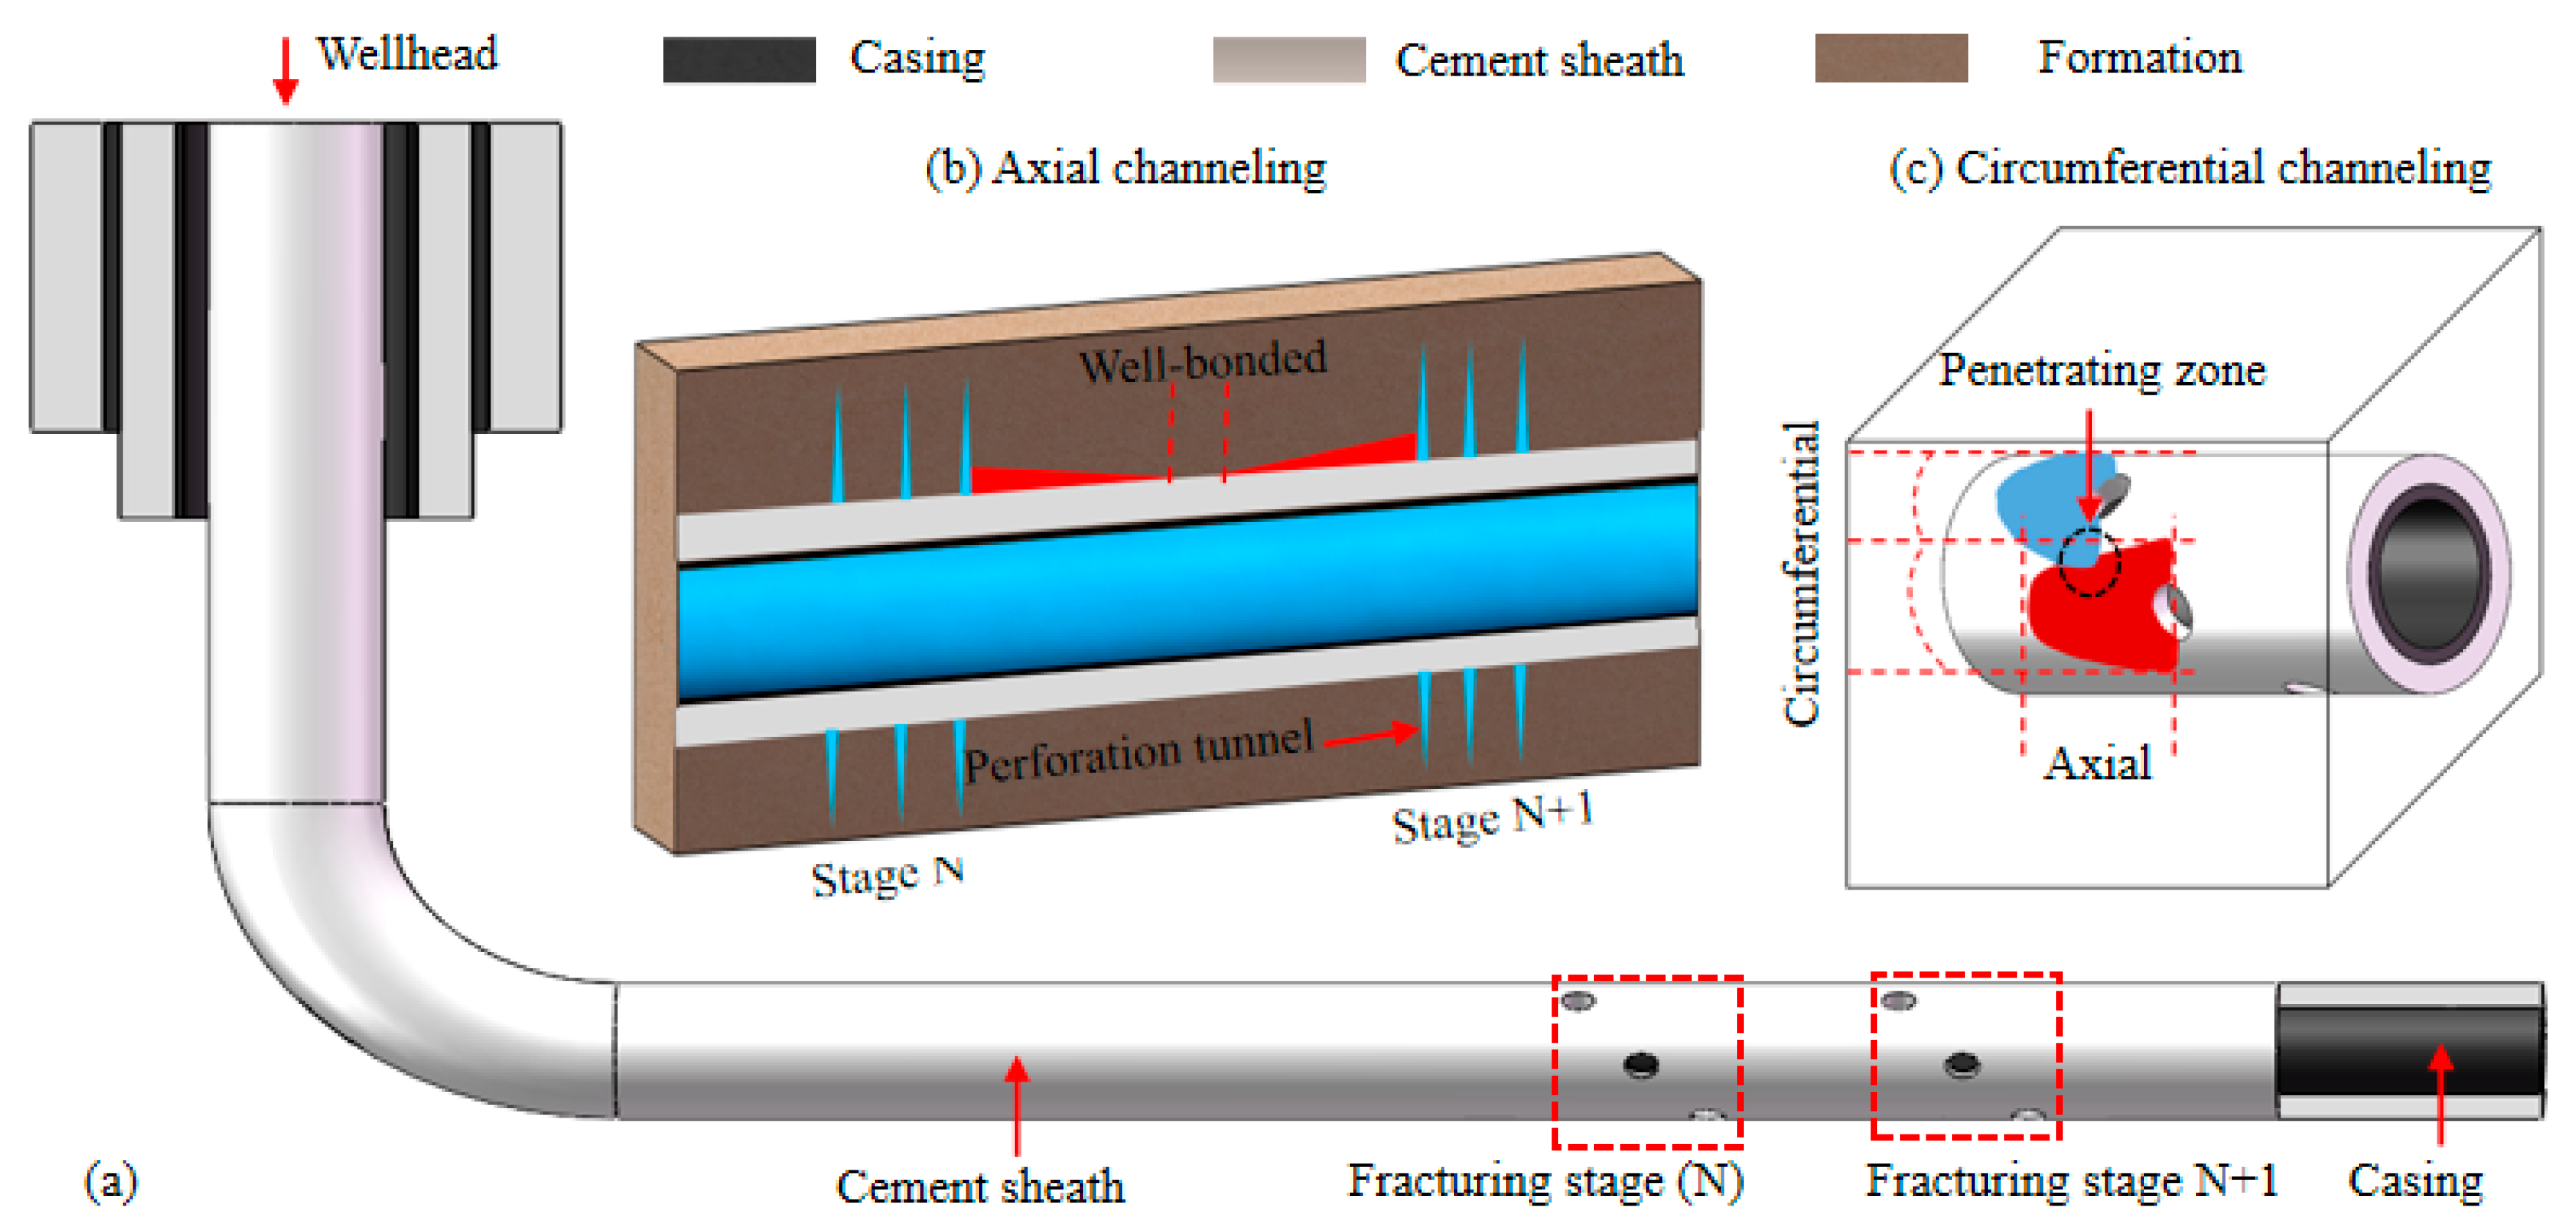
In the process of hydraulic fracturing, the typical wellbore structure of multi-stage fracturing in horizontal wells is shown in
Figure 1a, which is mainly composed of the wellhead, casing, cement sheath, and formation. The horizontal section is divided into multiple independent fracturing stages (Stage N, Stage N+1) along the wellbore axis. Perforation operations penetrate the composite wellbore structure formed by the casing, cement sheath, and formation (as illustrated in
Figure 1). This results in the formation of an initial damage zone at the casing-cement sheath-formation bonding interfaces, thereby creating structural weak planes where the bond strength at the casing-cement sheath and cement sheath-formation interfaces is significantly reduced. Previous research indicates that with continued injection of fracturing fluid, once the fluid pressure exceeds the interfacial bond strength, the fluid intrudes along these weakened interfaces and leads to debonding. The debonded zones propagate and interconnect under fluid drive, ultimately forming a continuous flow channel (micro-annulus) within the annular space [
29]. As shown in
Figure 1b, inter-stage flow along the wellbore axis may occur initially. Furthermore, under the action of fracturing fluid, the flow can also extend circumferentially along the cement–formation interface investigated in this study, as illustrated in
Figure 1c, resulting in more complex flow pathways. The combined effect of axial and circumferential flows eventually leads to the establishment of a continuous annular flow channel, which can cause connectivity between different fracturing stages and ineffective loss of fracturing fluid.
2.1. Geometric Model and Mesh Generation
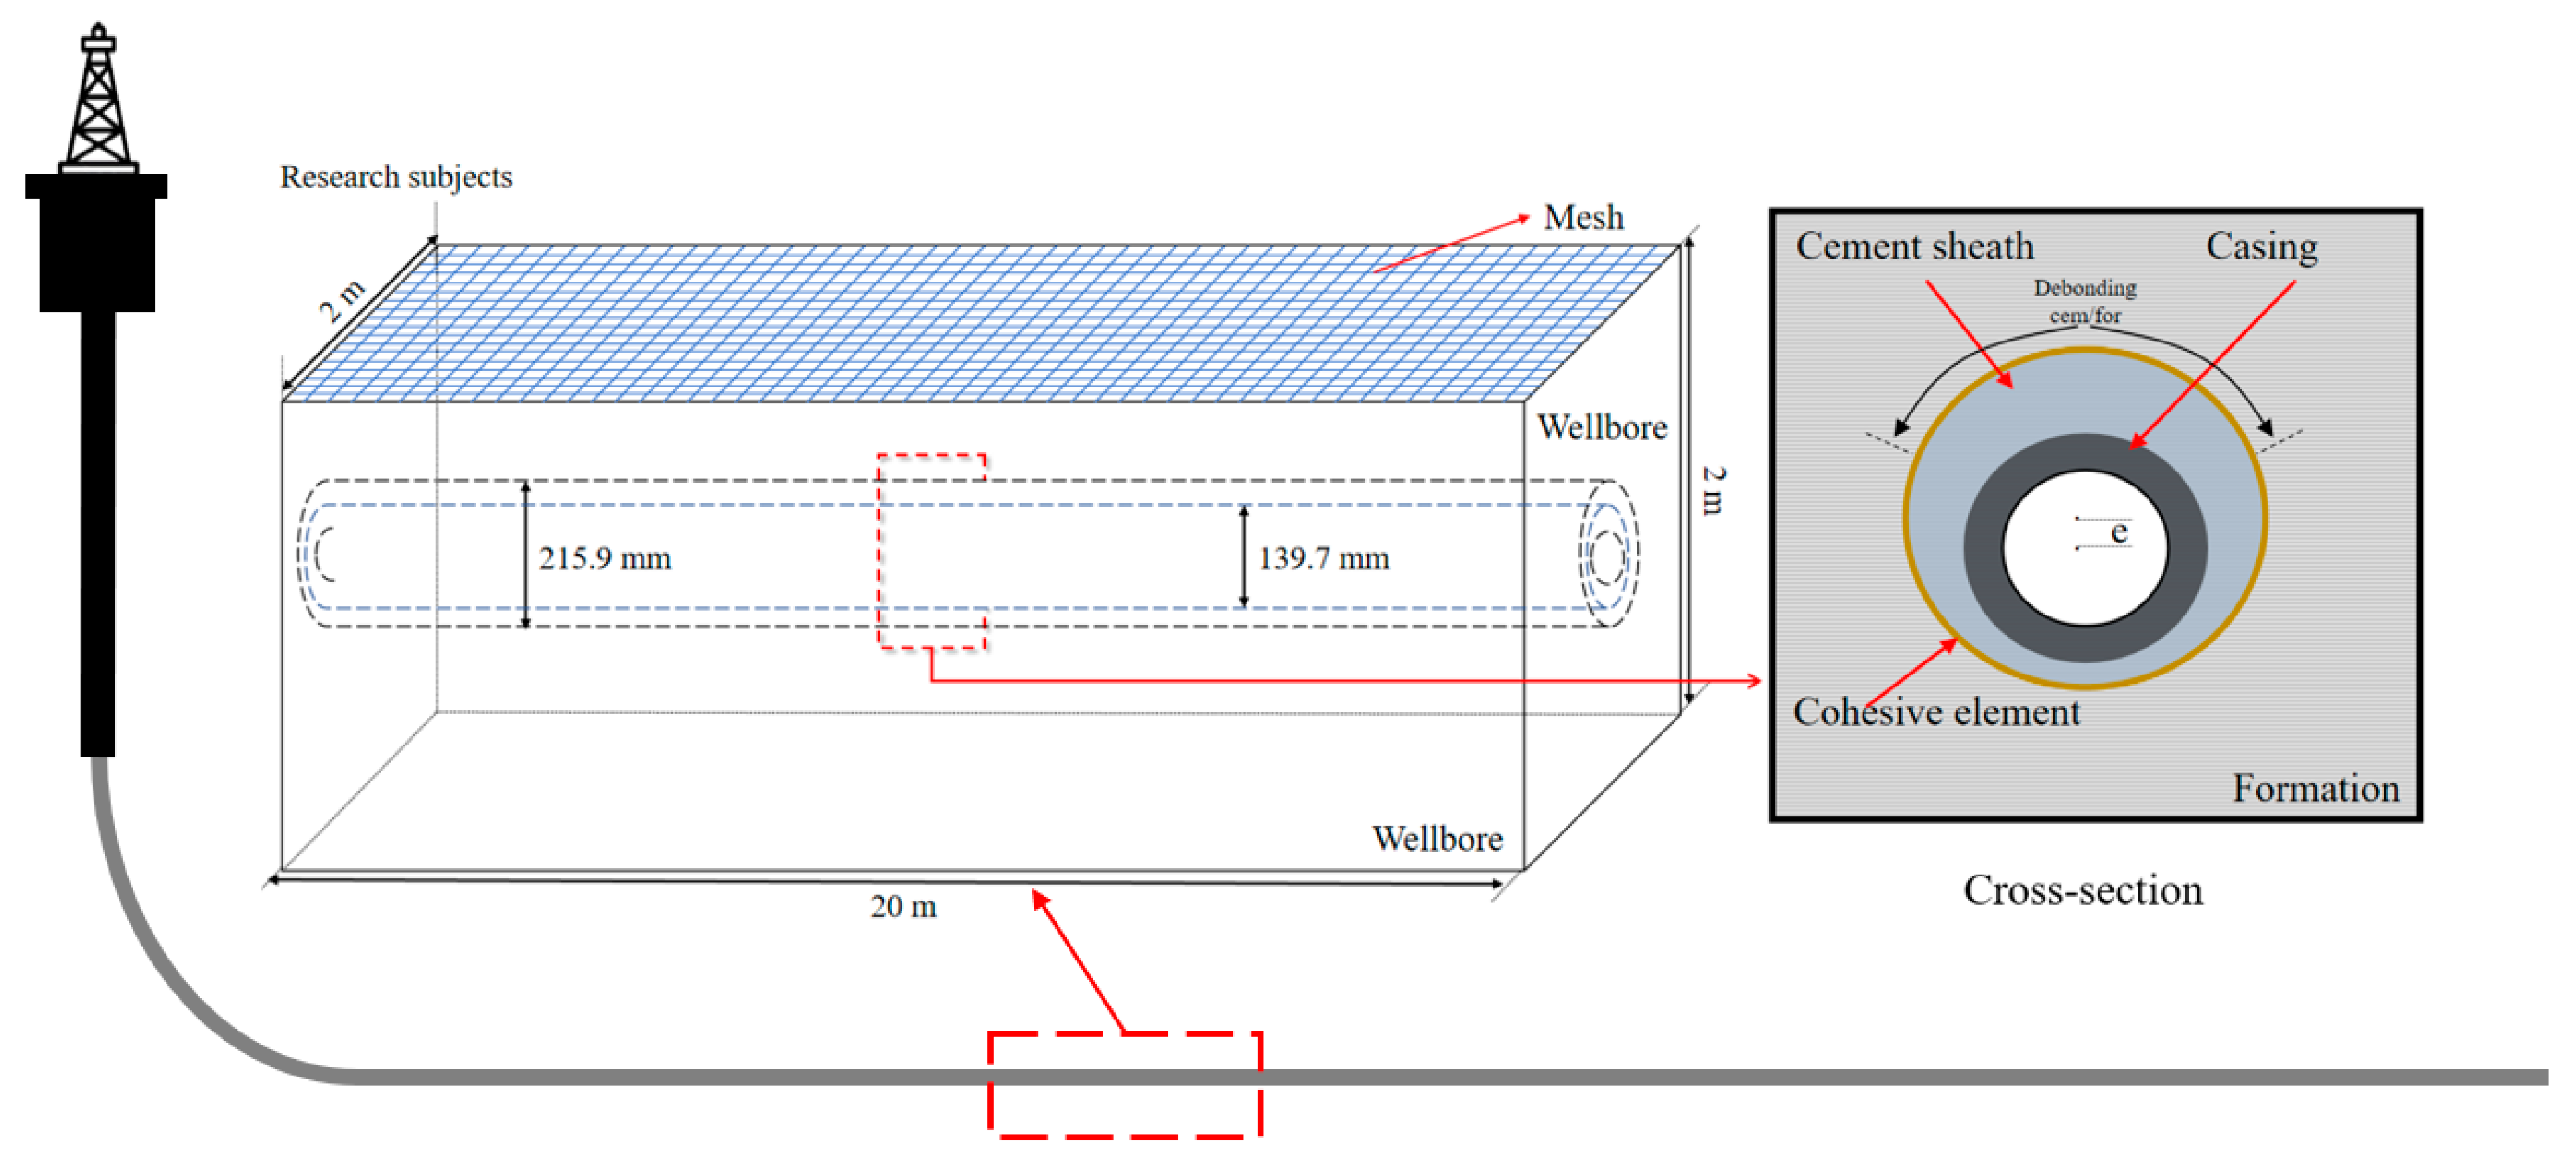
Based on an actual well from a specific block of the Daqing Oilfield, the model was constructed. The well is characterized by a measured depth of 4770 m and an actual vertical depth of 2554.24 m. The length of the horizontal section was 2545 m. The studied wellbore assembly was located at a position 1500 m into the horizontal section. During the modeling process, the actual conditions of long horizontal sections and the presence of casing eccentricity in contemporary multi-stage fracturing wells were considered. To address this, a mechanical model of the wellbore-formation assembly was formulated, with the specific geometry of casing eccentricity being incorporated into the casing, cement, and rock components. The geometry and dimensions of the model (with the formation block measuring 2 m × 2 m × 20 m) are illustrated in
Figure 2. The inner diameter of the borehole was specified as 215.90 mm. The cement sheath thickness was set to 38.10 mm, while an outer diameter of 139.70 mm and a wall thickness of 9.17 mm were specified for the casing. To verify the rationality of the selected model size, a sensitivity analysis of the lateral formation dimension was further conducted in this study. Taking the interfacial breakdown pressure and the final debonding length as evaluation indicators, the model responses were comparatively analyzed for lateral formation dimensions of 0.5 m, 1.0 m, 1.5 m, and 2.0 m. The results show that when the lateral half-width of the formation reaches 1.0 m, the calculation deviations of the key evaluation indicators stabilize within 5%. When the lateral dimension is further increased to 2.0 m, no significant fluctuation is observed in the simulation results. Therefore, a formation block size of 2 m × 2 m × 20 m was adopted in this study, which can ensure the accuracy of the numerical solution and effectively reduce boundary effects [
19,
24], while also controlling the computational scale and balancing simulation accuracy with computational efficiency.
To comparatively analyze the Influence of casing eccentricity on channeling at the wellbore bonding interface, different degrees of casing eccentricity were established in the model. During the setup, eccentricity was implemented by offsetting the casing center a predefined distance (
ε) relative to the center of the cement sheath outer wall. The eccentricity was quantified as the ratio of the offset distance
ε to the maximum radial clearance of the annular space (
R −
r), with the calculation formula shown in (1). This configuration resulted in the formation of a non-uniform cement sheath structure, characterized by a thin side and a thick side.
where
R is the outer radius of the cement sheath, in mm;
r is the outer radius of the casing, in mm; and
ε is the casing eccentricity offset, in mm.
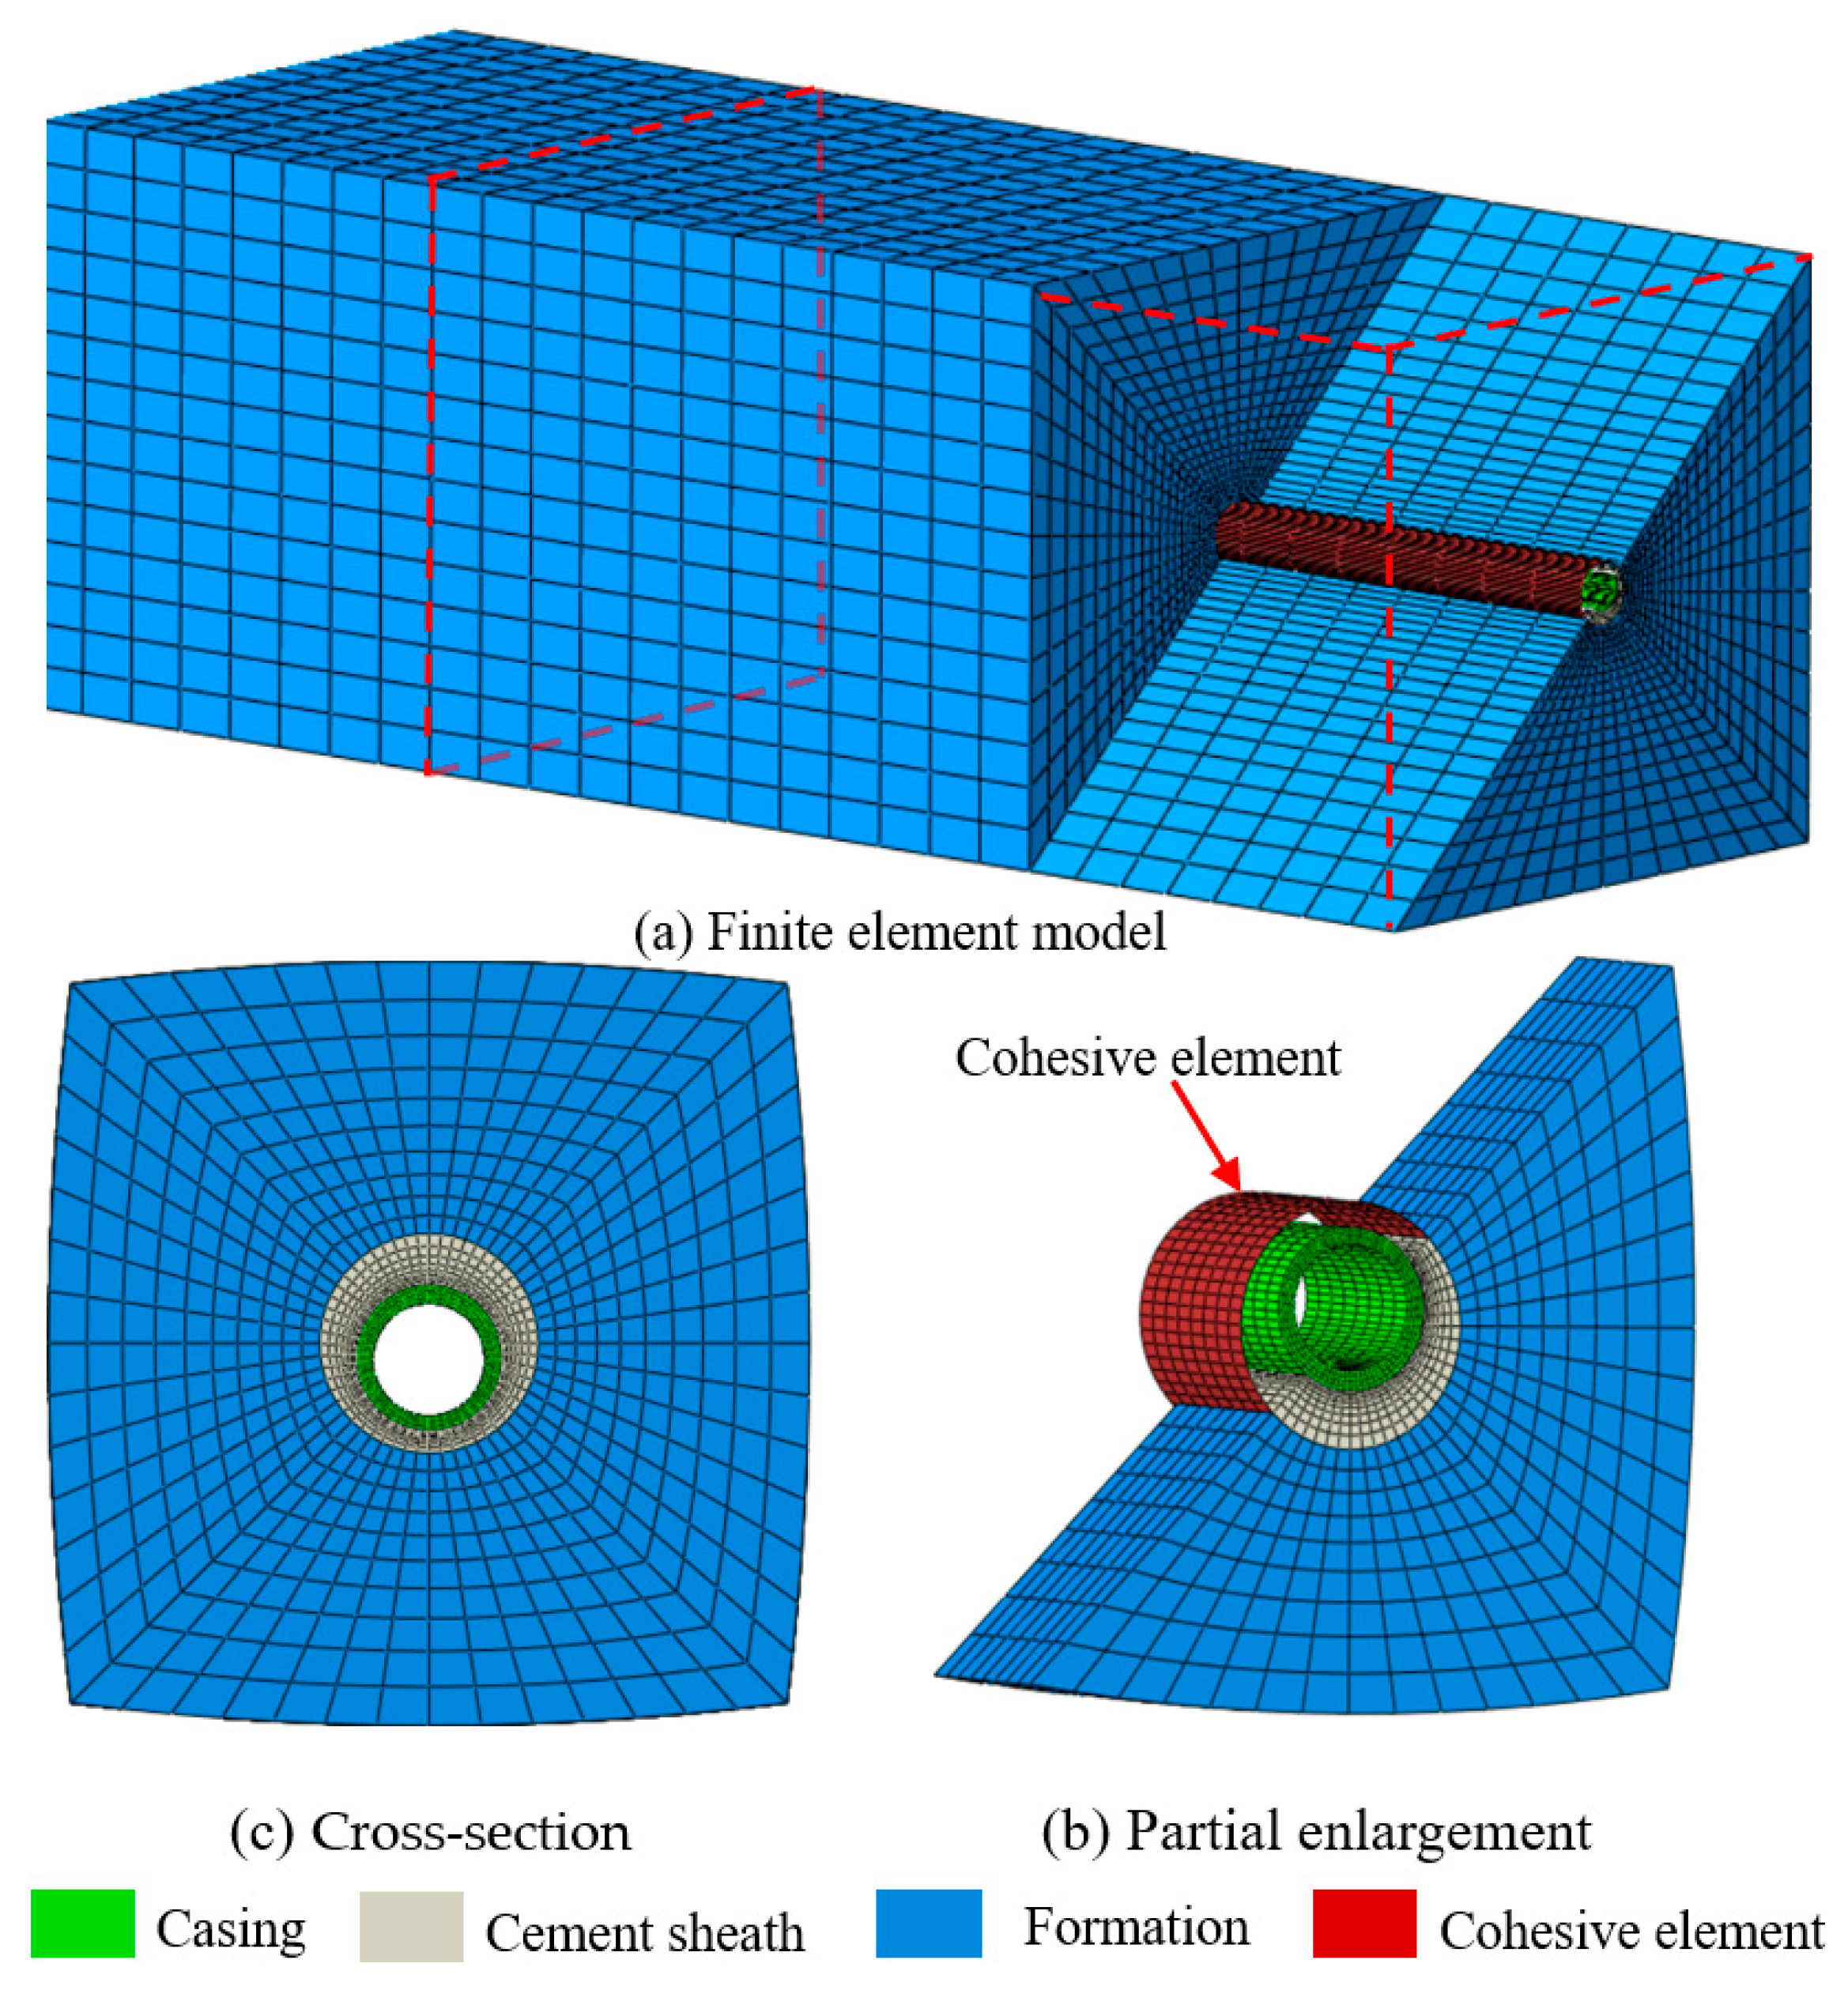
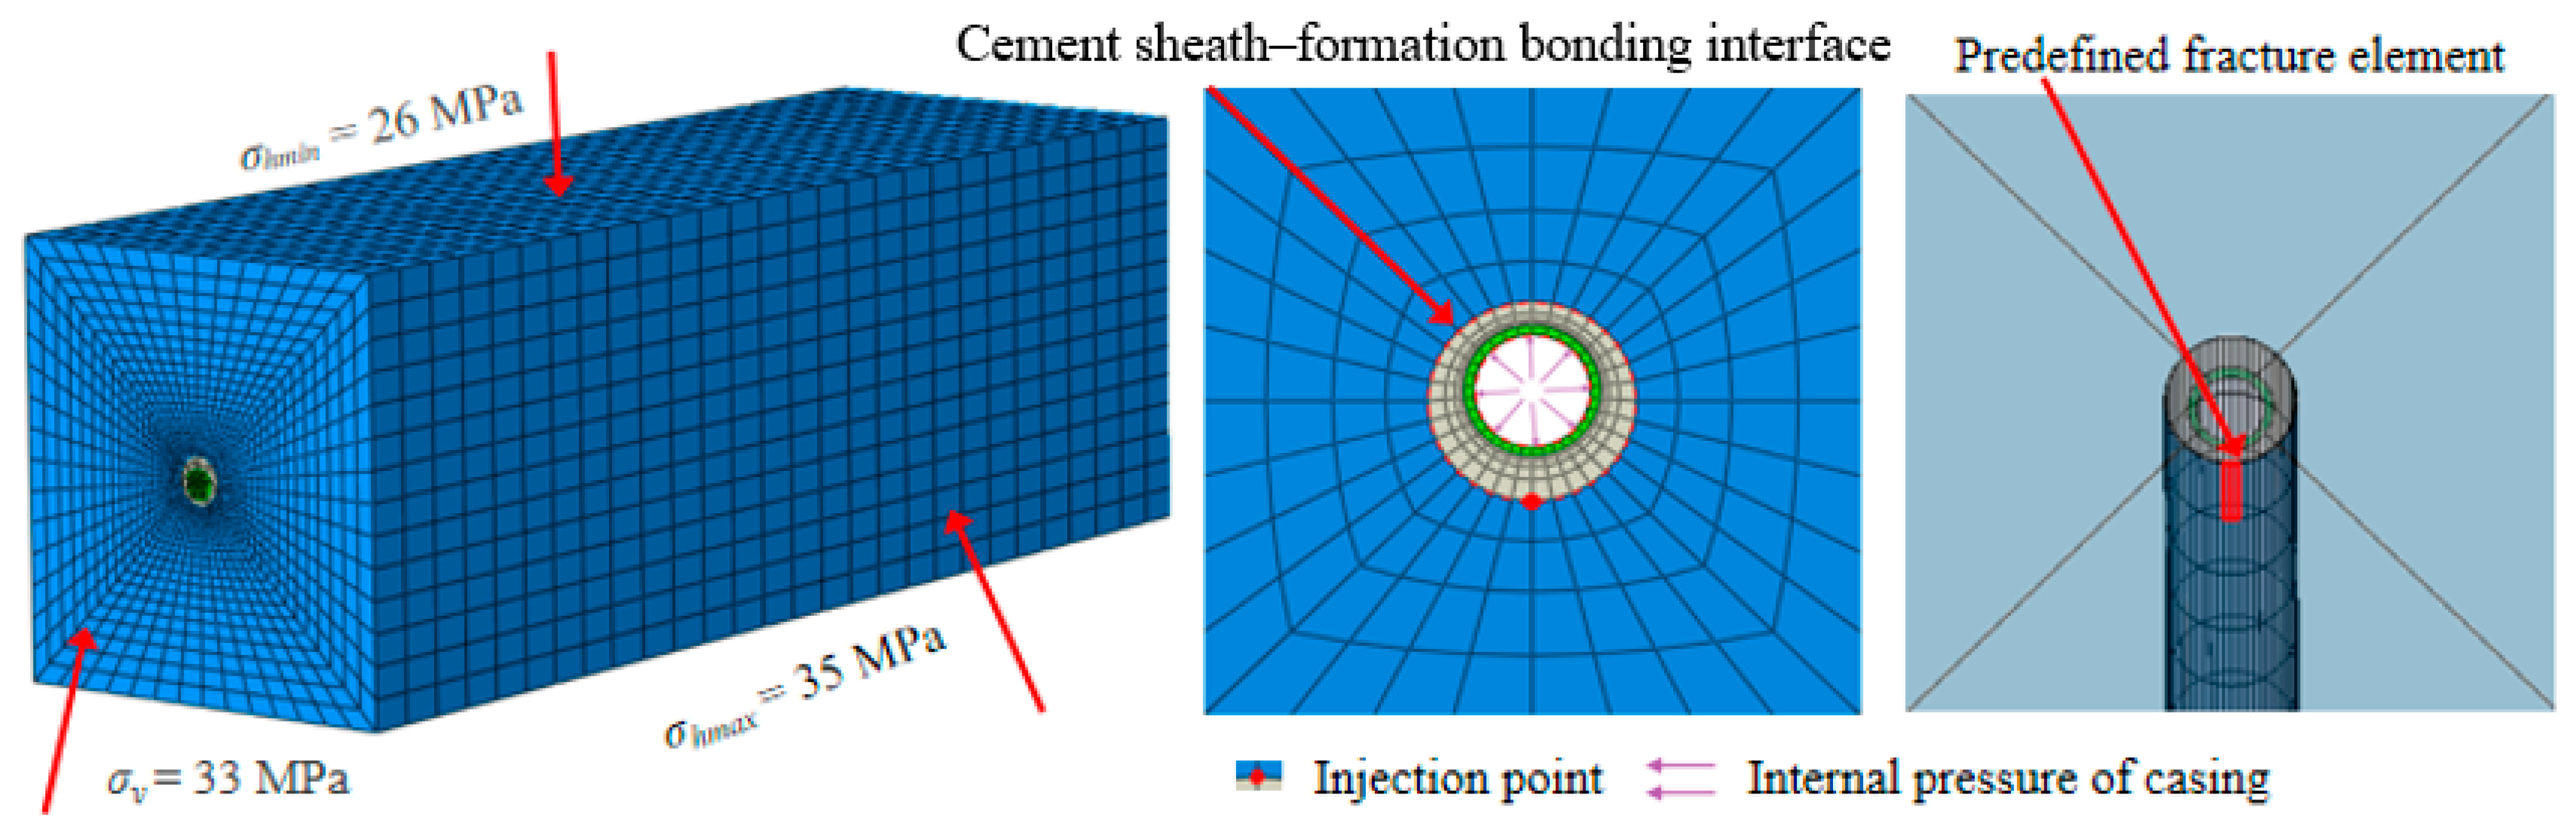
During the numerical modeling process, the casing and cement sheath were discretized using a uniform hexahedral structured mesh, while a similar mesh type with variable density was applied to the formation. As shown in
Figure 3a, a targeted meshing scheme was adopted to balance computational accuracy and efficiency. In the cement sheath–formation interface region, where significant stress gradients exist, local mesh refinement was implemented to ensure computational accuracy. Concurrently, by establishing a reasonable mesh transition gradient in the peripheral areas, a graded mesh condition from fine to coarse was created. This approach controlled the total number of computational elements and conserved computational resources. Furthermore, to accurately characterize the mechanical behavior of interface debonding caused by fluid channeling along the wellbore bonding interface, null-thickness cohesive elements were embedded throughout the entire cement sheath–formation contact domain (
Figure 3b). In this three-dimensional model, the casing was configured with an eccentric placement to simulate actual downhole conditions. The resulting cross-sectional view of the eccentric configuration is presented in
Figure 3c.
In terms of parameter configuration, the material parameters for the wellbore assembly were obtained from an actual well. The casing was simulated with a linear elastic constitutive model, employing C3D8R elements. Both the cement sheath and the formation were modeled using the Mohr–Coulomb plasticity model, with the element type designated as C3D8P. The specific material constants utilized in the model are tabulated in
Table 1 [
24], whereas the parameters defining the cement sheath–formation interface behavior are summarized in
Table 2.
2.2. Coupled Pore Pressure CZM
Based on the preceding analysis, after weak planes are generated at the bonding interface of the wellbore assembly following perforation operations, fracturing fluid is driven along these planes into the interface. During the fluid channeling process, the stress and strain at the crack-tip region of the bonding interface may exceed its bond strength, allowing the channeling to propagate continuously [
30]. To simulate this process, based on the mechanisms of material stiffness degradation and damage evolution, zero-thickness cohesive elements were implemented at the cement sheath–formation bonding interface using the cohesive zone model (CZM). These elements are used to characterize the fracture mechanics behavior of the interface, from intact state to complete failure, during fluid channeling.
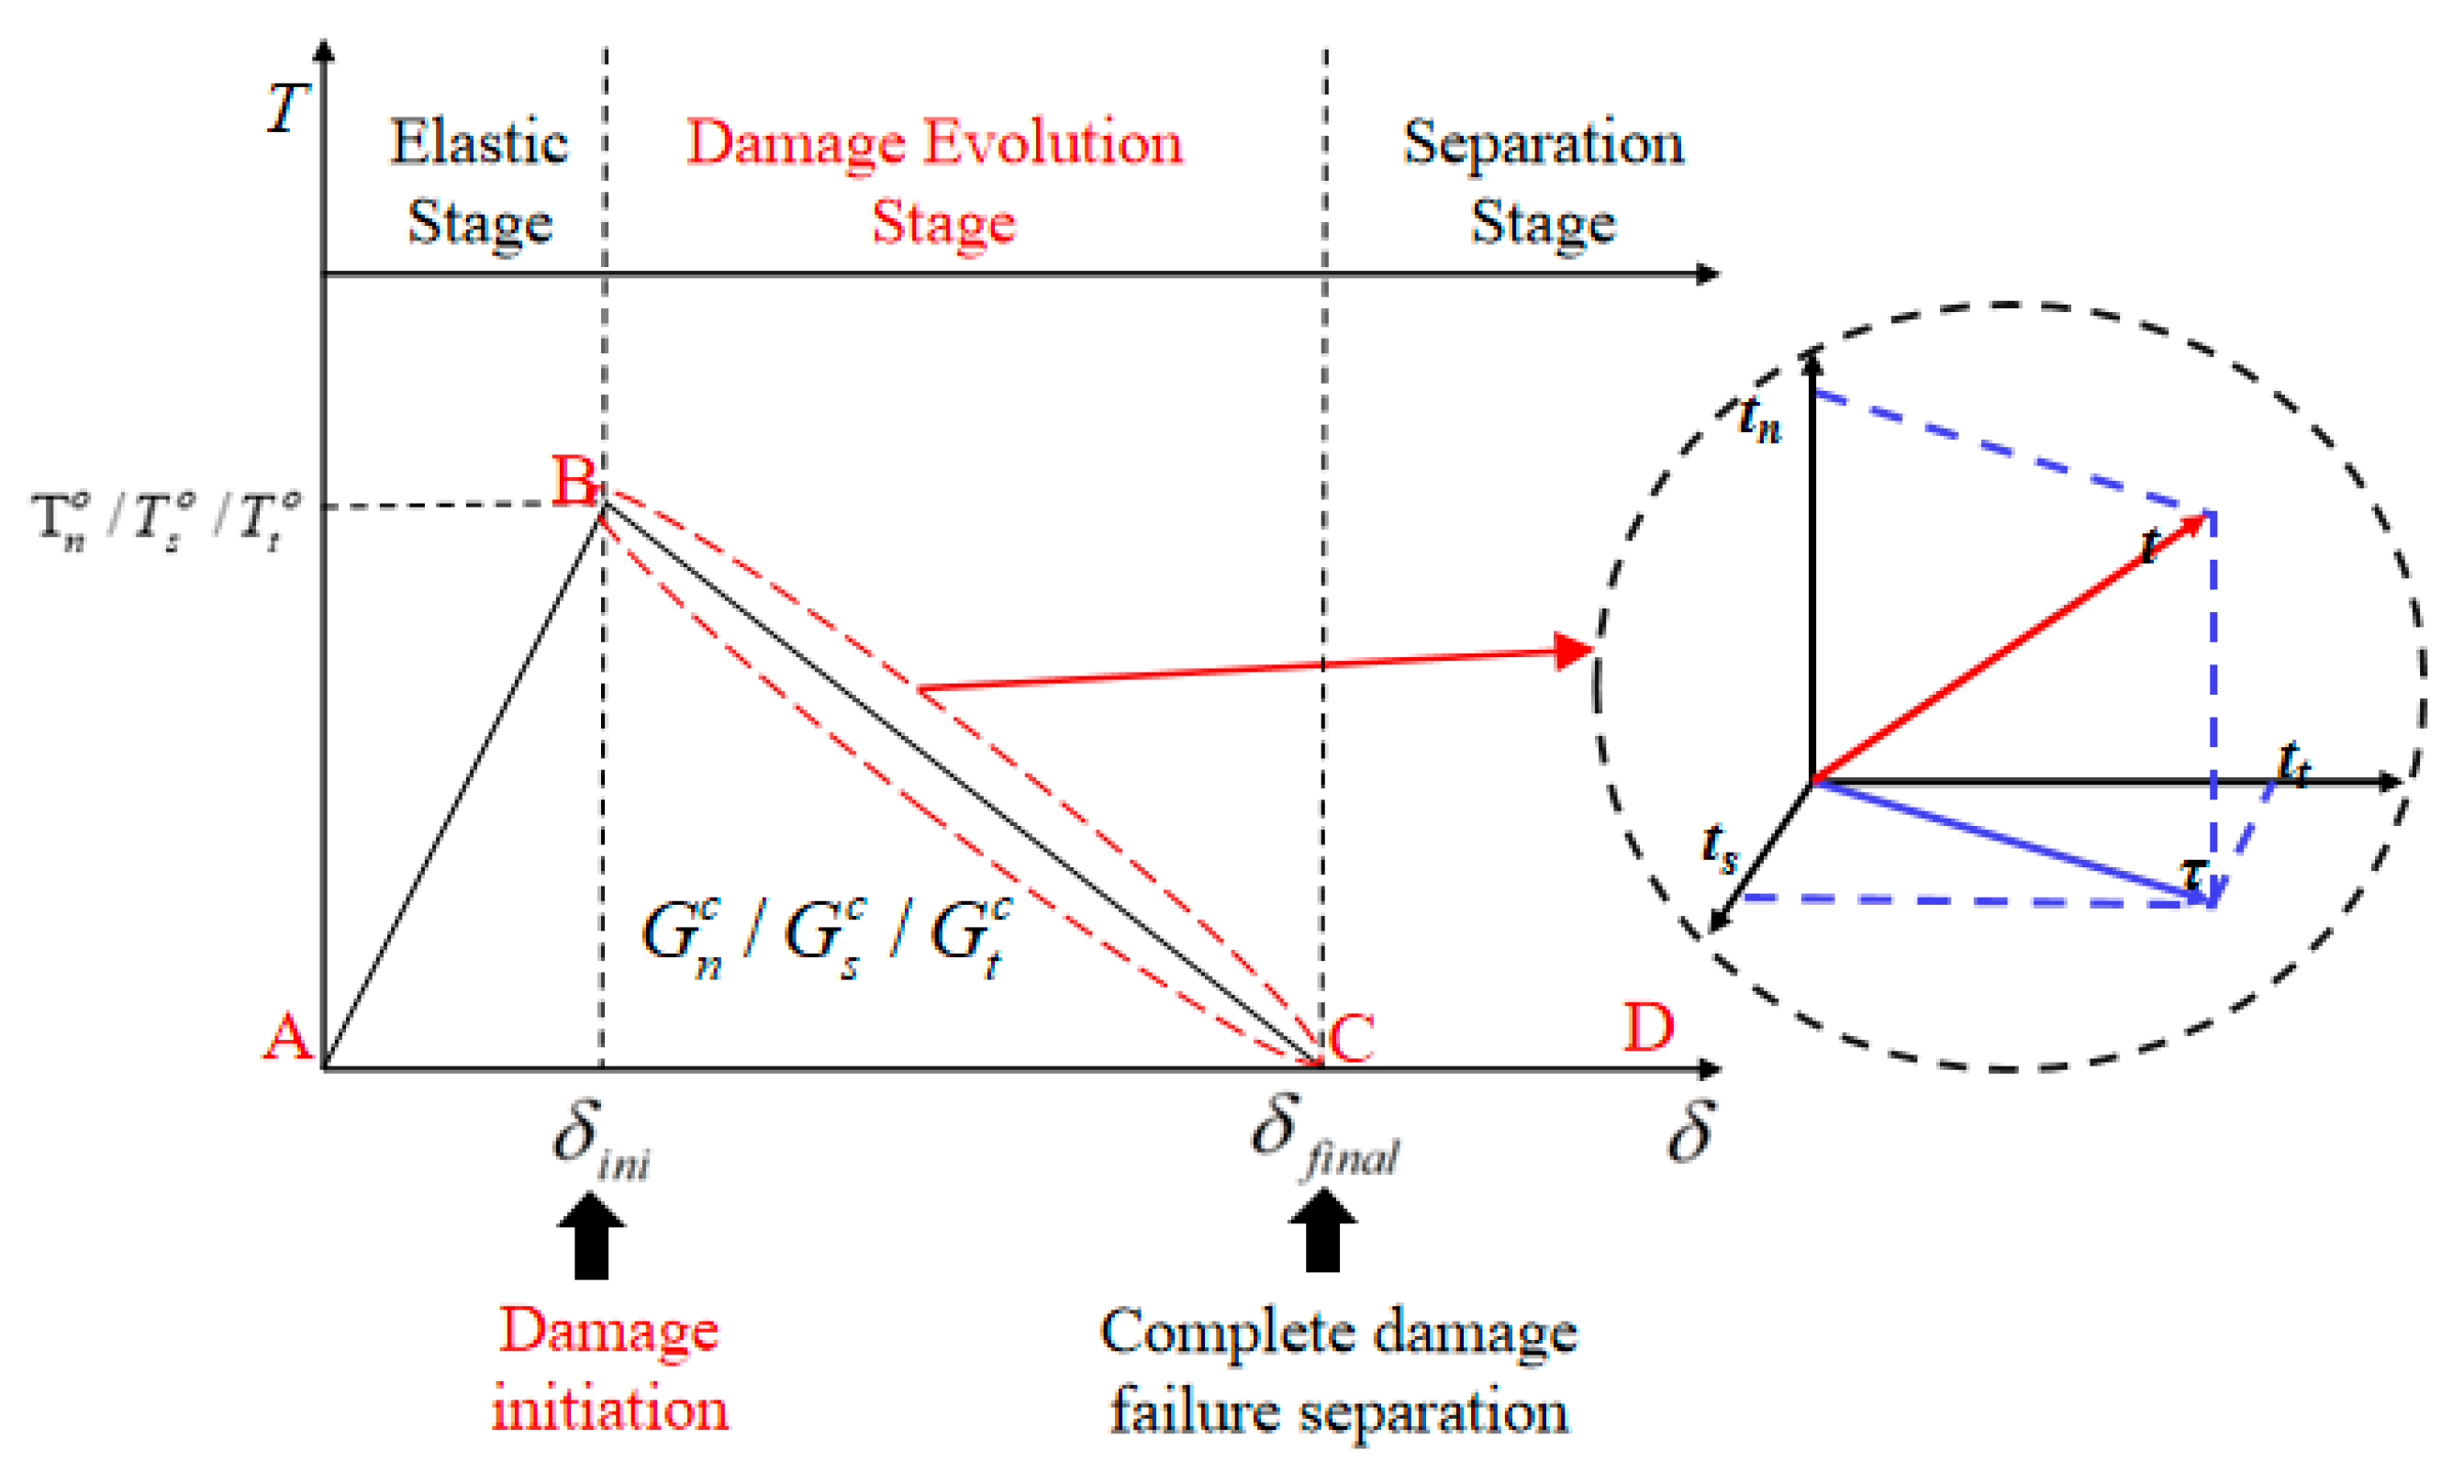
Within the framework of the traction-separation law, the cohesive zone model describes fracture initiation and propagation at the bonded interface as a process of damage evolution, beginning from a state of initial integrity. This constitutive law comprises three distinct stages: the initial loading stage (AB), the damage evolution stage (BC), and the interface separation stage (CD), as shown in
Figure 4. Here, the coordinates are defined as displacement (
δ, horizontal) and traction (
T, vertical). The damage dissipation energy is geometrically equal to the area bounded by the curve and the δ-axis. The figure illustrates the bonding interface cracking process and its corresponding damage evolution mechanism. Point B is the critical point for damage initiation, after which the fracture enters the damage evolution stage. Point C is another critical point marking complete separation, signifying entry into the separation stage.
For the failure criterion of the bonding interface, according to the study by Feng, the maximum nominal stress criterion exhibits less conservatism in predicting fracture initiation and better aligns with the actual failure conditions of the bonding interface [
18]. Therefore, the maximum nominal stress criterion is adopted to determine bonding interface failure. When the tensile stress in any direction within a cohesive element reaches its tensile strength threshold, initial damage is considered to have occurred in the material, and the cohesive element begins the failure process. Damage initiation is defined by Equation (2) as the point where the maximum nominal stress ratio attains a value of unity.
In the equation, the critical strengths of the interface in the normal and two shear directions are denoted as Tno, Tso, and Tt0 (Pa), respectively. Correspondingly, the stresses in these directions are represented by Tn, Ts, and Tt (Pa). The Macaulay bracket < > is used to signify that interface damage is not induced under pure compression.
Wang demonstrated that the Benzeggagh–Kenane (BK) fracture criterion is particularly suitable for interface damage involving the first and second shear directions [
31]. This energy-based criterion posits that fracture propagation occurs when the ratio of shear-to-total energy dissipation reaches the interface’s critical fracture energy. Consequently, the BK criterion, expressed in Equation (3), is adopted in this study to govern damage evolution.
The model employs the following energy-based parameters (units: J/m2): Gn, Gs, and Gt are the deformation dissipation energies for the normal and two shear directions, with Gnc, Gsc, and Gtc being their respective critical values for failure initiation. The total energies are defined as GM = Gs + Gt (shear), GT = Gn + Gs + Gt (all modes), and Gc. The criterion exponent is denoted by β.
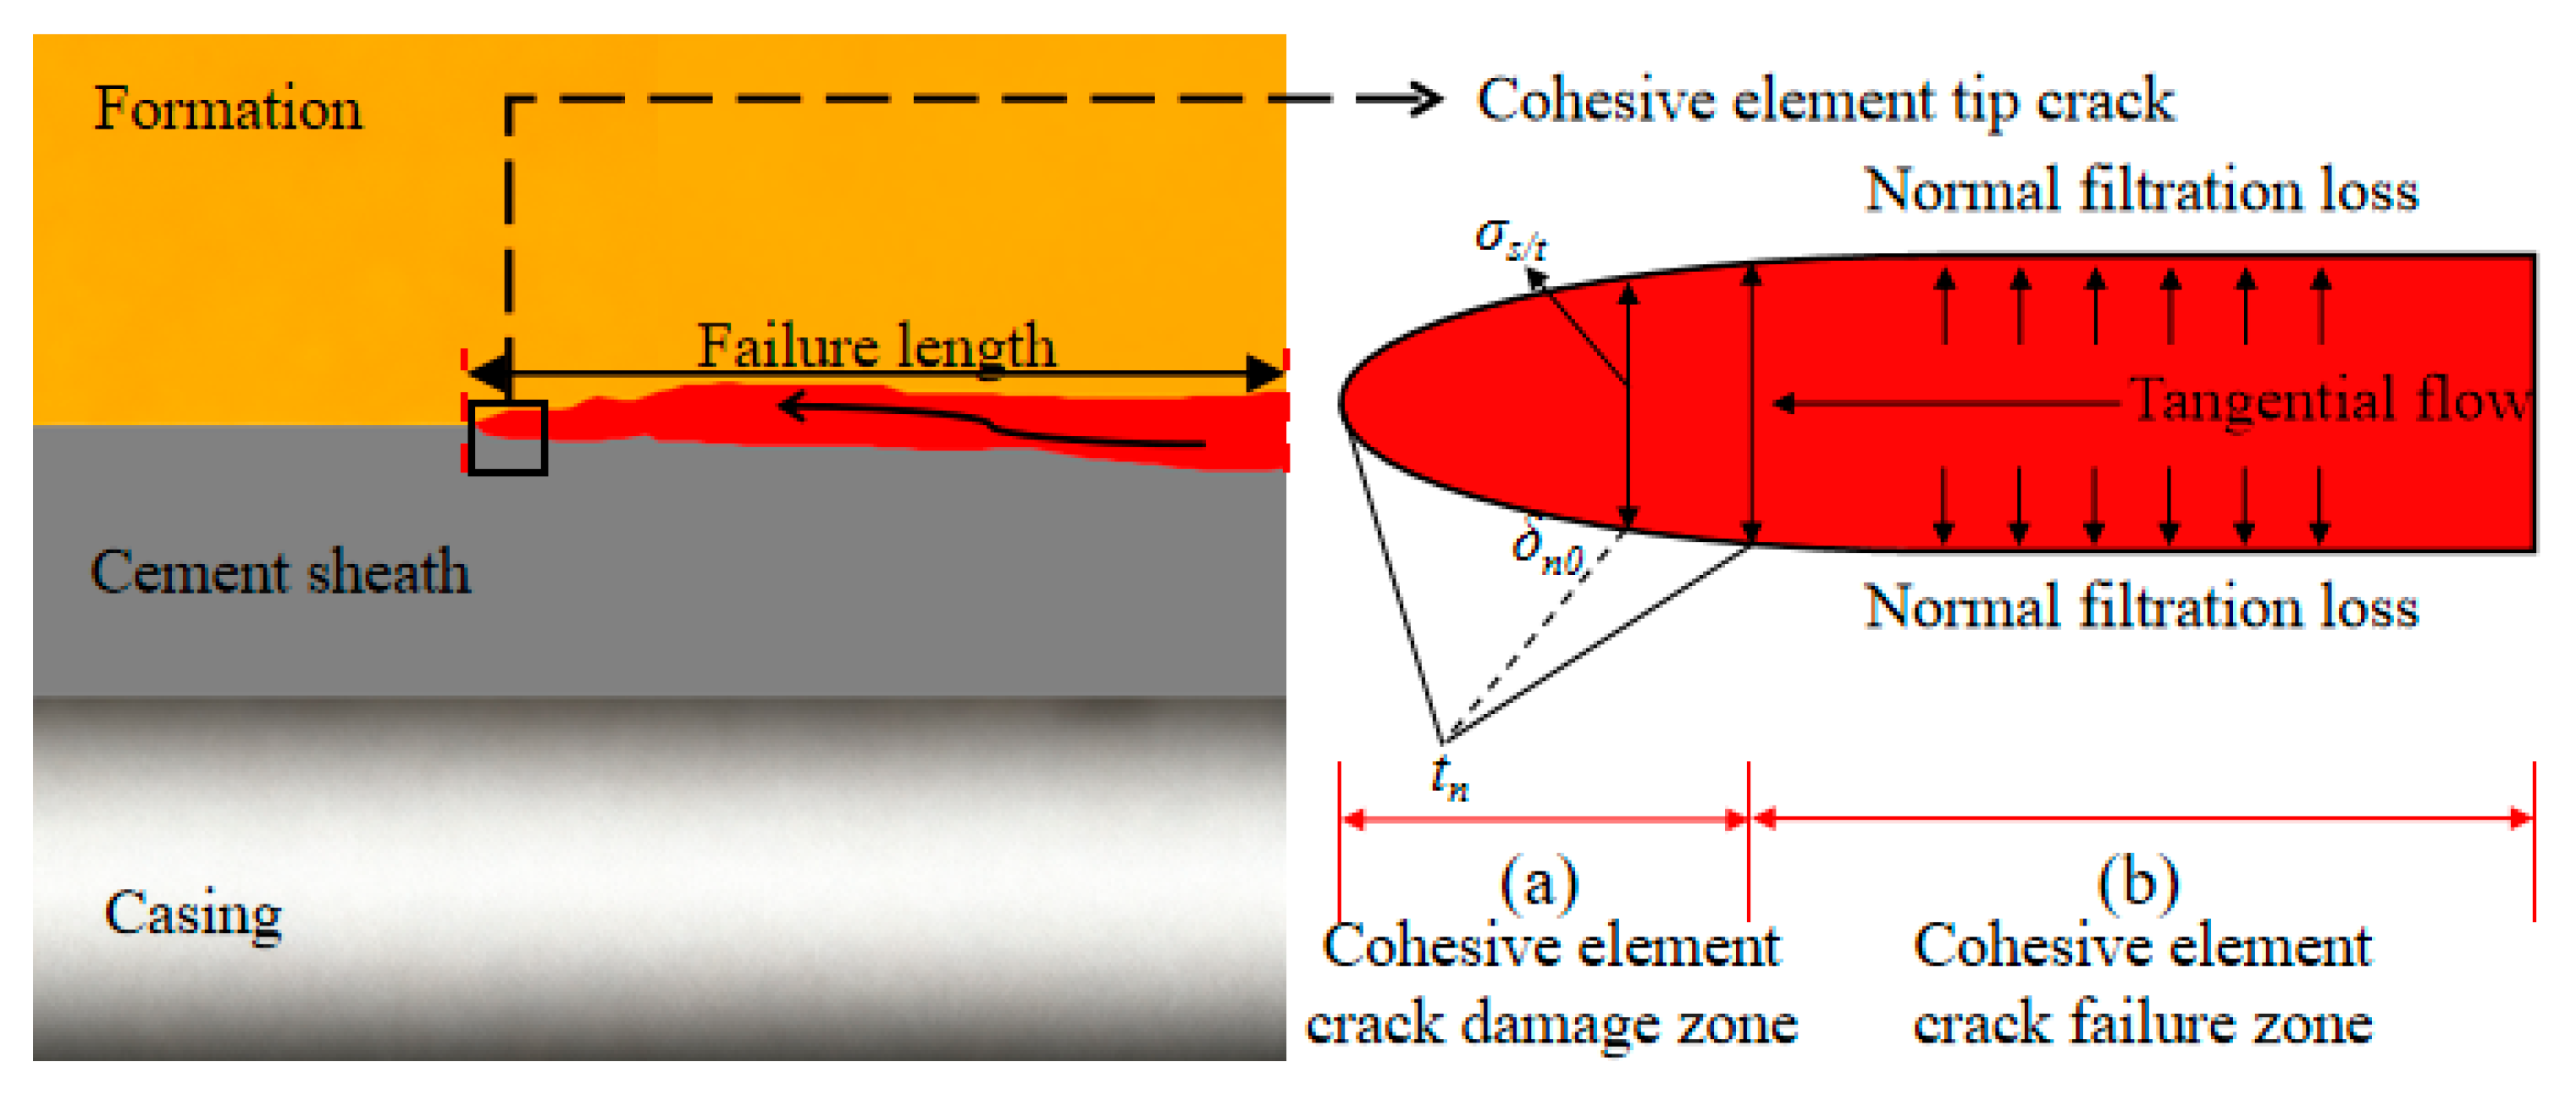
The hydrodynamic behavior of the fracturing fluid inside the interface crack and its driving effect on fracture evolution are illustrated in
Figure 5, where the fracture is distinctly divided into two characteristic zones. The first is the fracture failure zone (a), where the tangential flow of fracturing fluid, parallel to the contact surface, is dominant. The second is the fracture damage zone (b), where fracturing fluid leaks off into the surrounding medium through normal filtration perpendicular to the contact surface. This bonding interface cracking mechanism can be summarized as follows: the tangential flow of fracturing fluid transmits fluid pressure to the fracture tip, continuously increasing the pressure there. Once the tip pressure surpasses the strength limit of the interfacial material, the cohesive elements at the tip initiate damage first, gradually forming a failure zone, and ultimately enabling sustained fracture propagation.
The mass conservation of fluid within the fracture is expressed by the continuity equation as:
where
vt and
vb are the normal flow velocities across the top and bottom surfaces of the fracture (m/s), representing the fluid leak-off rates from the fracture into the surrounding porous media;
w is the fracture width (m); and
q is the volumetric flow rate per unit length in the tangential direction of the fracture (m
2/s).
Incompressible and Newtonian fracturing fluid is assumed in this study. The momentum equation of the tangential flow in the fracture can be expressed as that of a Newtonian fluid flow between narrow parallel plates:
where
μ is the fluid viscosity within the fracture (Pa·s), and
p represents the fluid pressure gradient within the fracture (Pa/m).
The pore fluid flow behavior in the porous media is assumed to be governed by Darcy’s law. It can be described as:
In this formulation, vfp is the average velocity of the pore fluid relative to the solid phase, φ is the porosity of the medium, g and g represent the gravitational acceleration vector and its magnitude, respectively; k denotes the hydraulic conductivity of the porous medium, pf is the density of the pore fluid, pp is the pore pressure, and X signifies the spatial coordinate vector.
2.3. Boundary Conditions and Loading Configurations
Regarding the load configuration, two primary aspects were considered: (a) Mechanical loads: In situ stresses of 35 MPa, 26 MPa, and 33 MPa were applied to the formation, which correspond to the maximum horizontal stress, the minimum horizontal stress, and the vertical stress, in that order. An initial pore pressure of 20 MPa was established for the model. Furthermore, the casing internal pressure during fracturing, primarily composed of wellhead pressure, static fluid column pressure, and fluid friction, was considered. During stimulation operations, key parameters included a wellhead pressure of 58 MPa, a fracturing fluid density of 1000 kg/m
3, and a friction coefficient of 0.002486 MPa/m. (b) Fluid loads: Taking into account the relationship between fracturing displacement rate, wellbore dimensions, and the injection point size, and referencing the configuration used in previous analyses of similar problems, the average width of the debonded cement sheath–formation interface was defined as h. Based on Equation (7), the fluid flow rate entering the bonding interface during channeling was calculated and subsequently injected at a rate of 1 × 10
−5 m
3/s.
where
Qh is the fracturing fluid flow rate within the wellbore cross-section (m
3/min);
l is the micro-fracture length (mm);
h is the average micro-fracture width (mm);
w is the perforation diameter (mm); and
L is the cement sheath thickness (mm).
In terms of boundary condition configuration, two primary aspects were addressed: (a) For the solid mechanics boundary conditions, displacement and rotational constraints in the X, Y, and Z directions were applied to the surfaces of the formation model to effectively suppress rigid-body displacement and physical deformation of the model, thereby representing the actual condition of the studied object being constrained by the rock mass deep underground. (b) For the simulation of fluid migration along the wellbore bonding interface, a concentrated pore flow was applied between two preselected cohesive elements to represent the dynamic fracture propagation mechanism triggered by fracturing fluid injection and the subsequent formation of a channeling pathway, under the condition of existing initial interfacial defects. The specific parameters are listed in
Table 3, and the overall boundary and loading conditions are presented in
Figure 6.
2.4. Simulation Steps
During the execution of the numerical simulation study, the following primary steps were analyzed:
- (1)
Step I: An initial in situ stress field replicating downhole conditions was established through the application of four key pressures to the model: far-field stresses, overburden pressure, casing internal pressure, and initial pore pressure. Equilibrium is achieved through calculation under these loading conditions. During this equilibrium phase, apart from a predefined initial micro-annulus at the casing/cement sheath interface on the model bottom, no material damage or interface failure occurs in any other region of the model.
- (2)
Step II: The process of bottomhole pressure buildup induced by fracturing fluid injection and the subsequent interface debonding driven by this pressure was simulated. A boundary condition characterized by low-velocity fluid inflow was applied to the interface to replicate the bottomhole pressure buildup. Consequently, the extension dynamics of the interfacial separation induced by hydraulic forces were examined.
- (3)
Step III: The Influence of geomechanical and engineering parameters on interface channeling behavior was studied, revealing significant differences in interface debonding patterns between centered and eccentric casing configurations.
4. Results and Discussion
4.1. Dynamic Evolution of Axial Channeling
In the context of fracture-induced channeling, both the decohesion behavior at the second interface (cement/formation) and the hydrodynamic characteristics of fluid migration along the separation zone were analyzed. During the analysis, the casing was configured in a centered position. The scalar stiffness degradation factor (SDEG) was adopted to characterize the degree of interface debonding. The severity of the separation process is directly reflected by the value of the SDEG parameter, where a minimum value of 0 signifies that the region is not yet fully debonded, and a maximum value of 1 indicates complete debonding (damage) of the region. Subsequently, the extent of the continuous damage zone satisfying the threshold condition is statistically analyzed along the axial direction of the wellbore, and its maximum axial projection length is taken as the interface debonding length/height at that moment. For the circumferential propagation range, the azimuthal coverage of the elements meeting the threshold condition in the circumferential direction is counted.
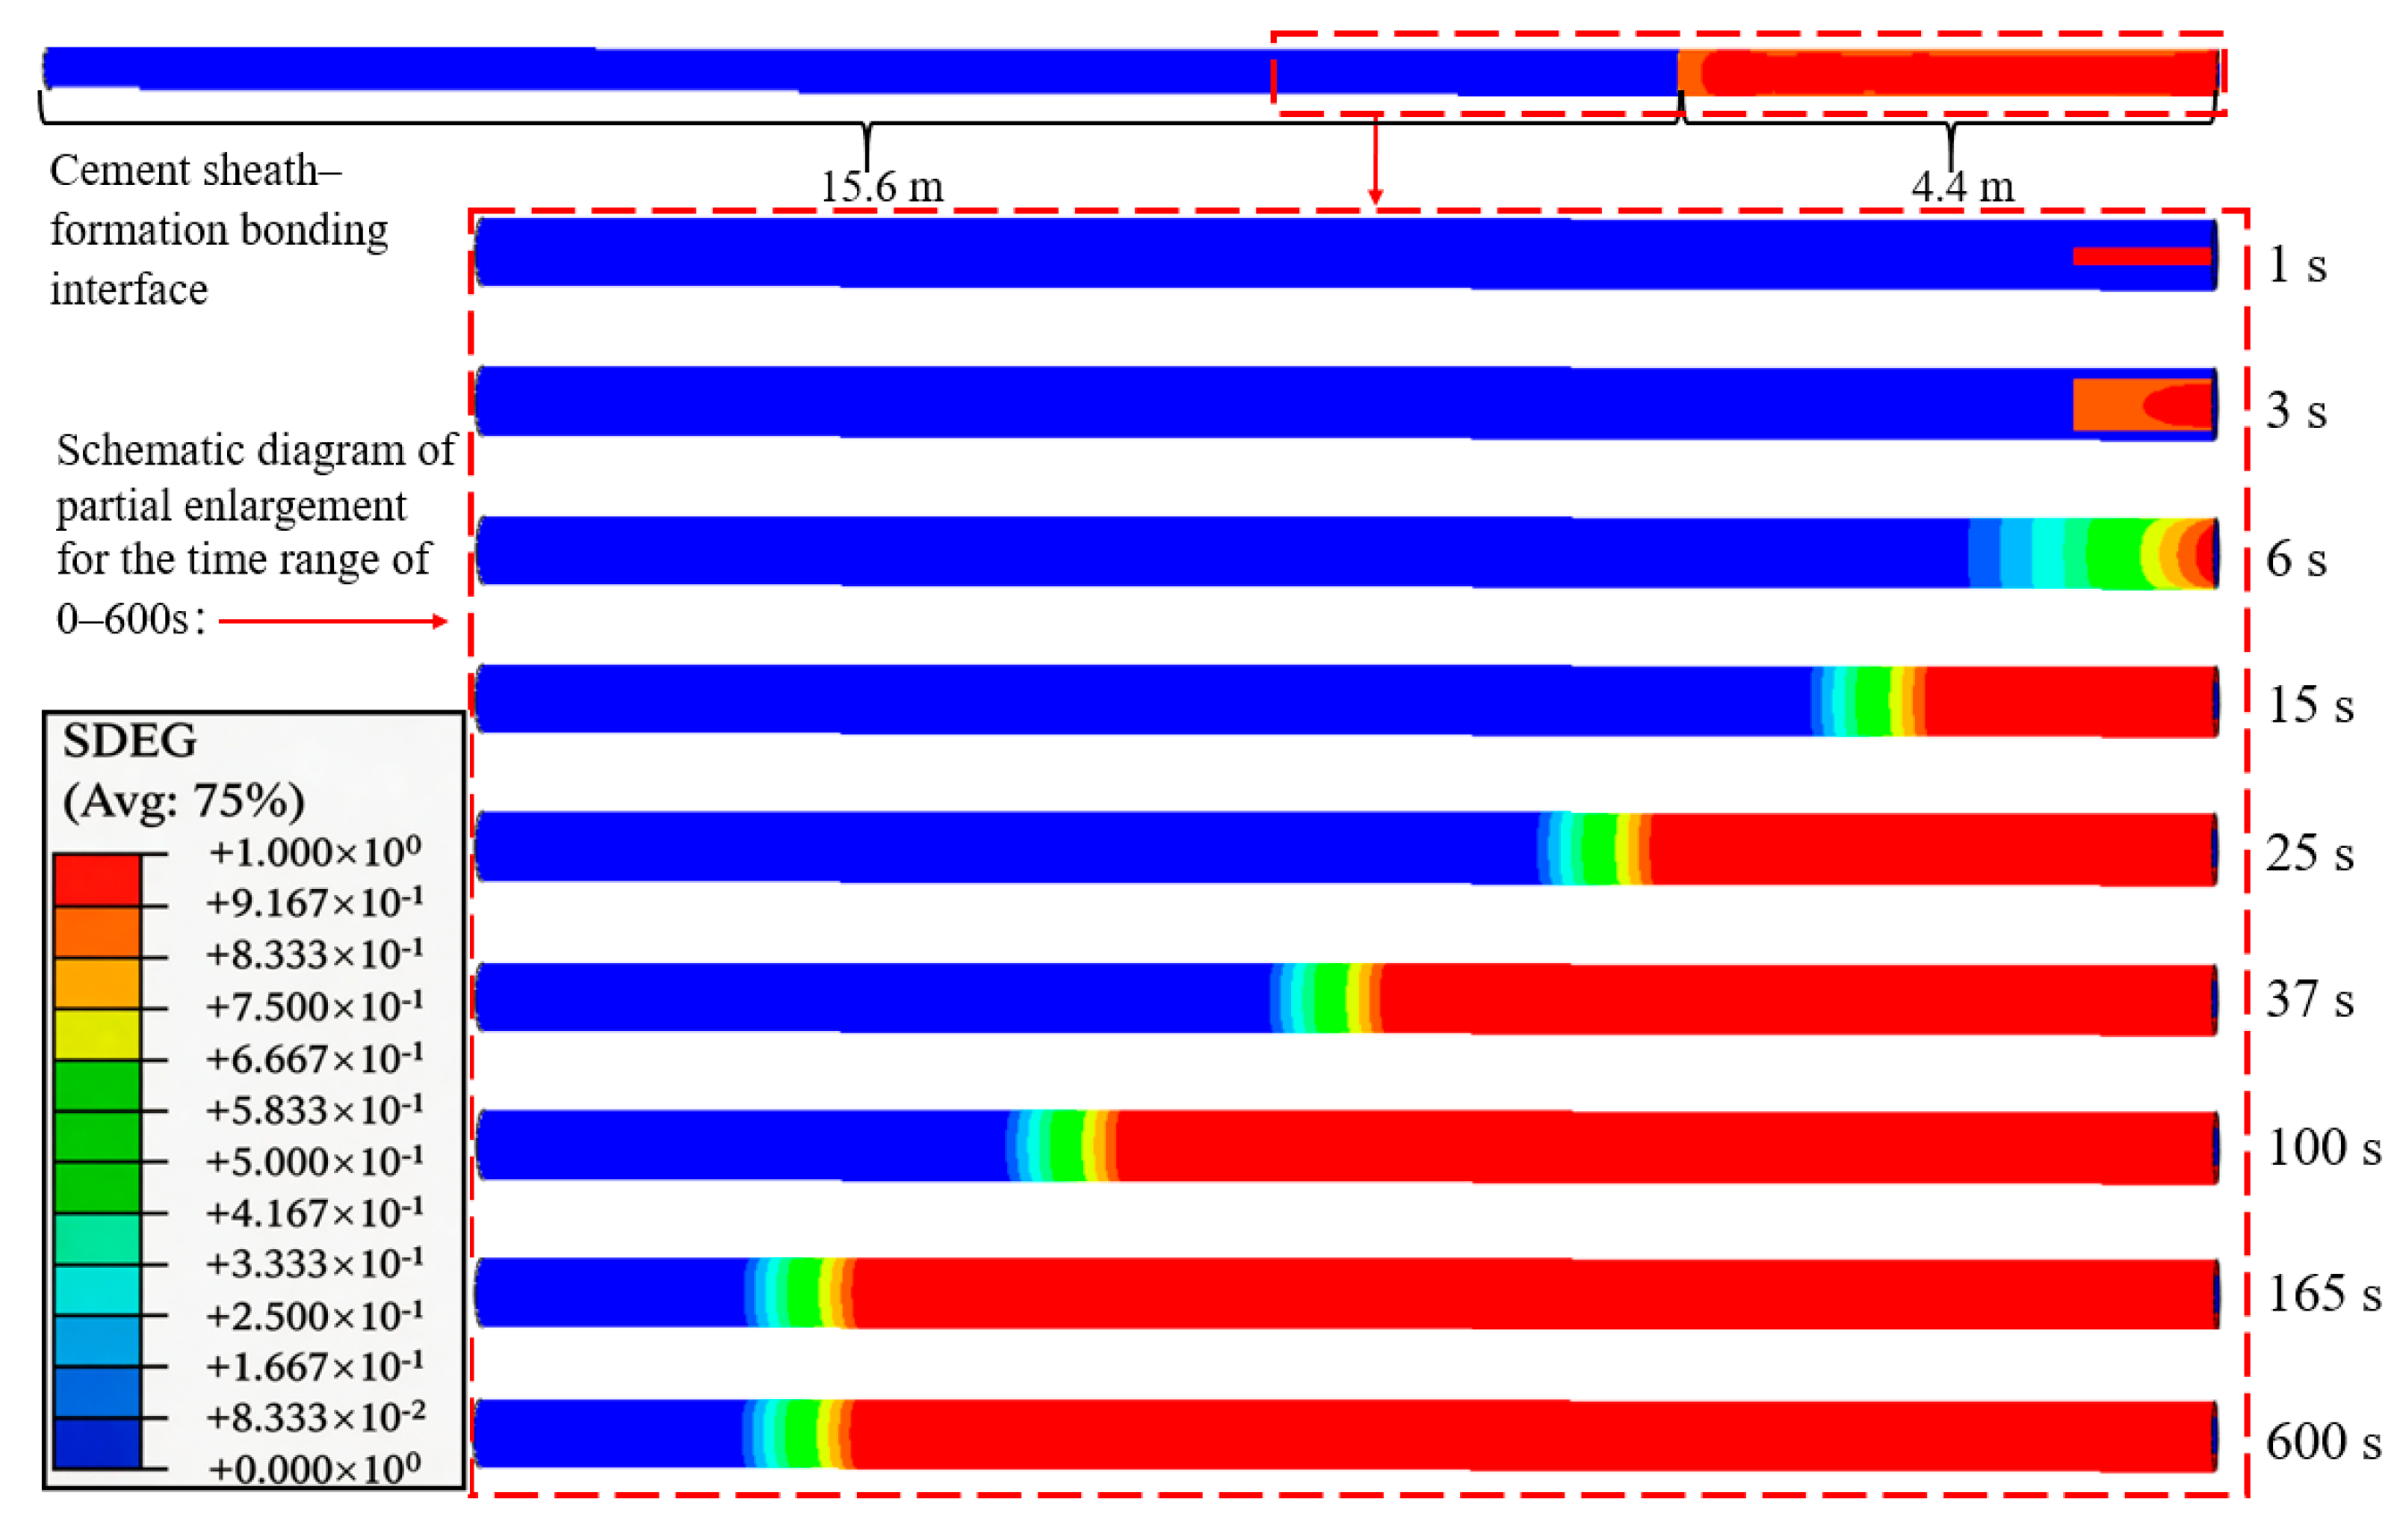
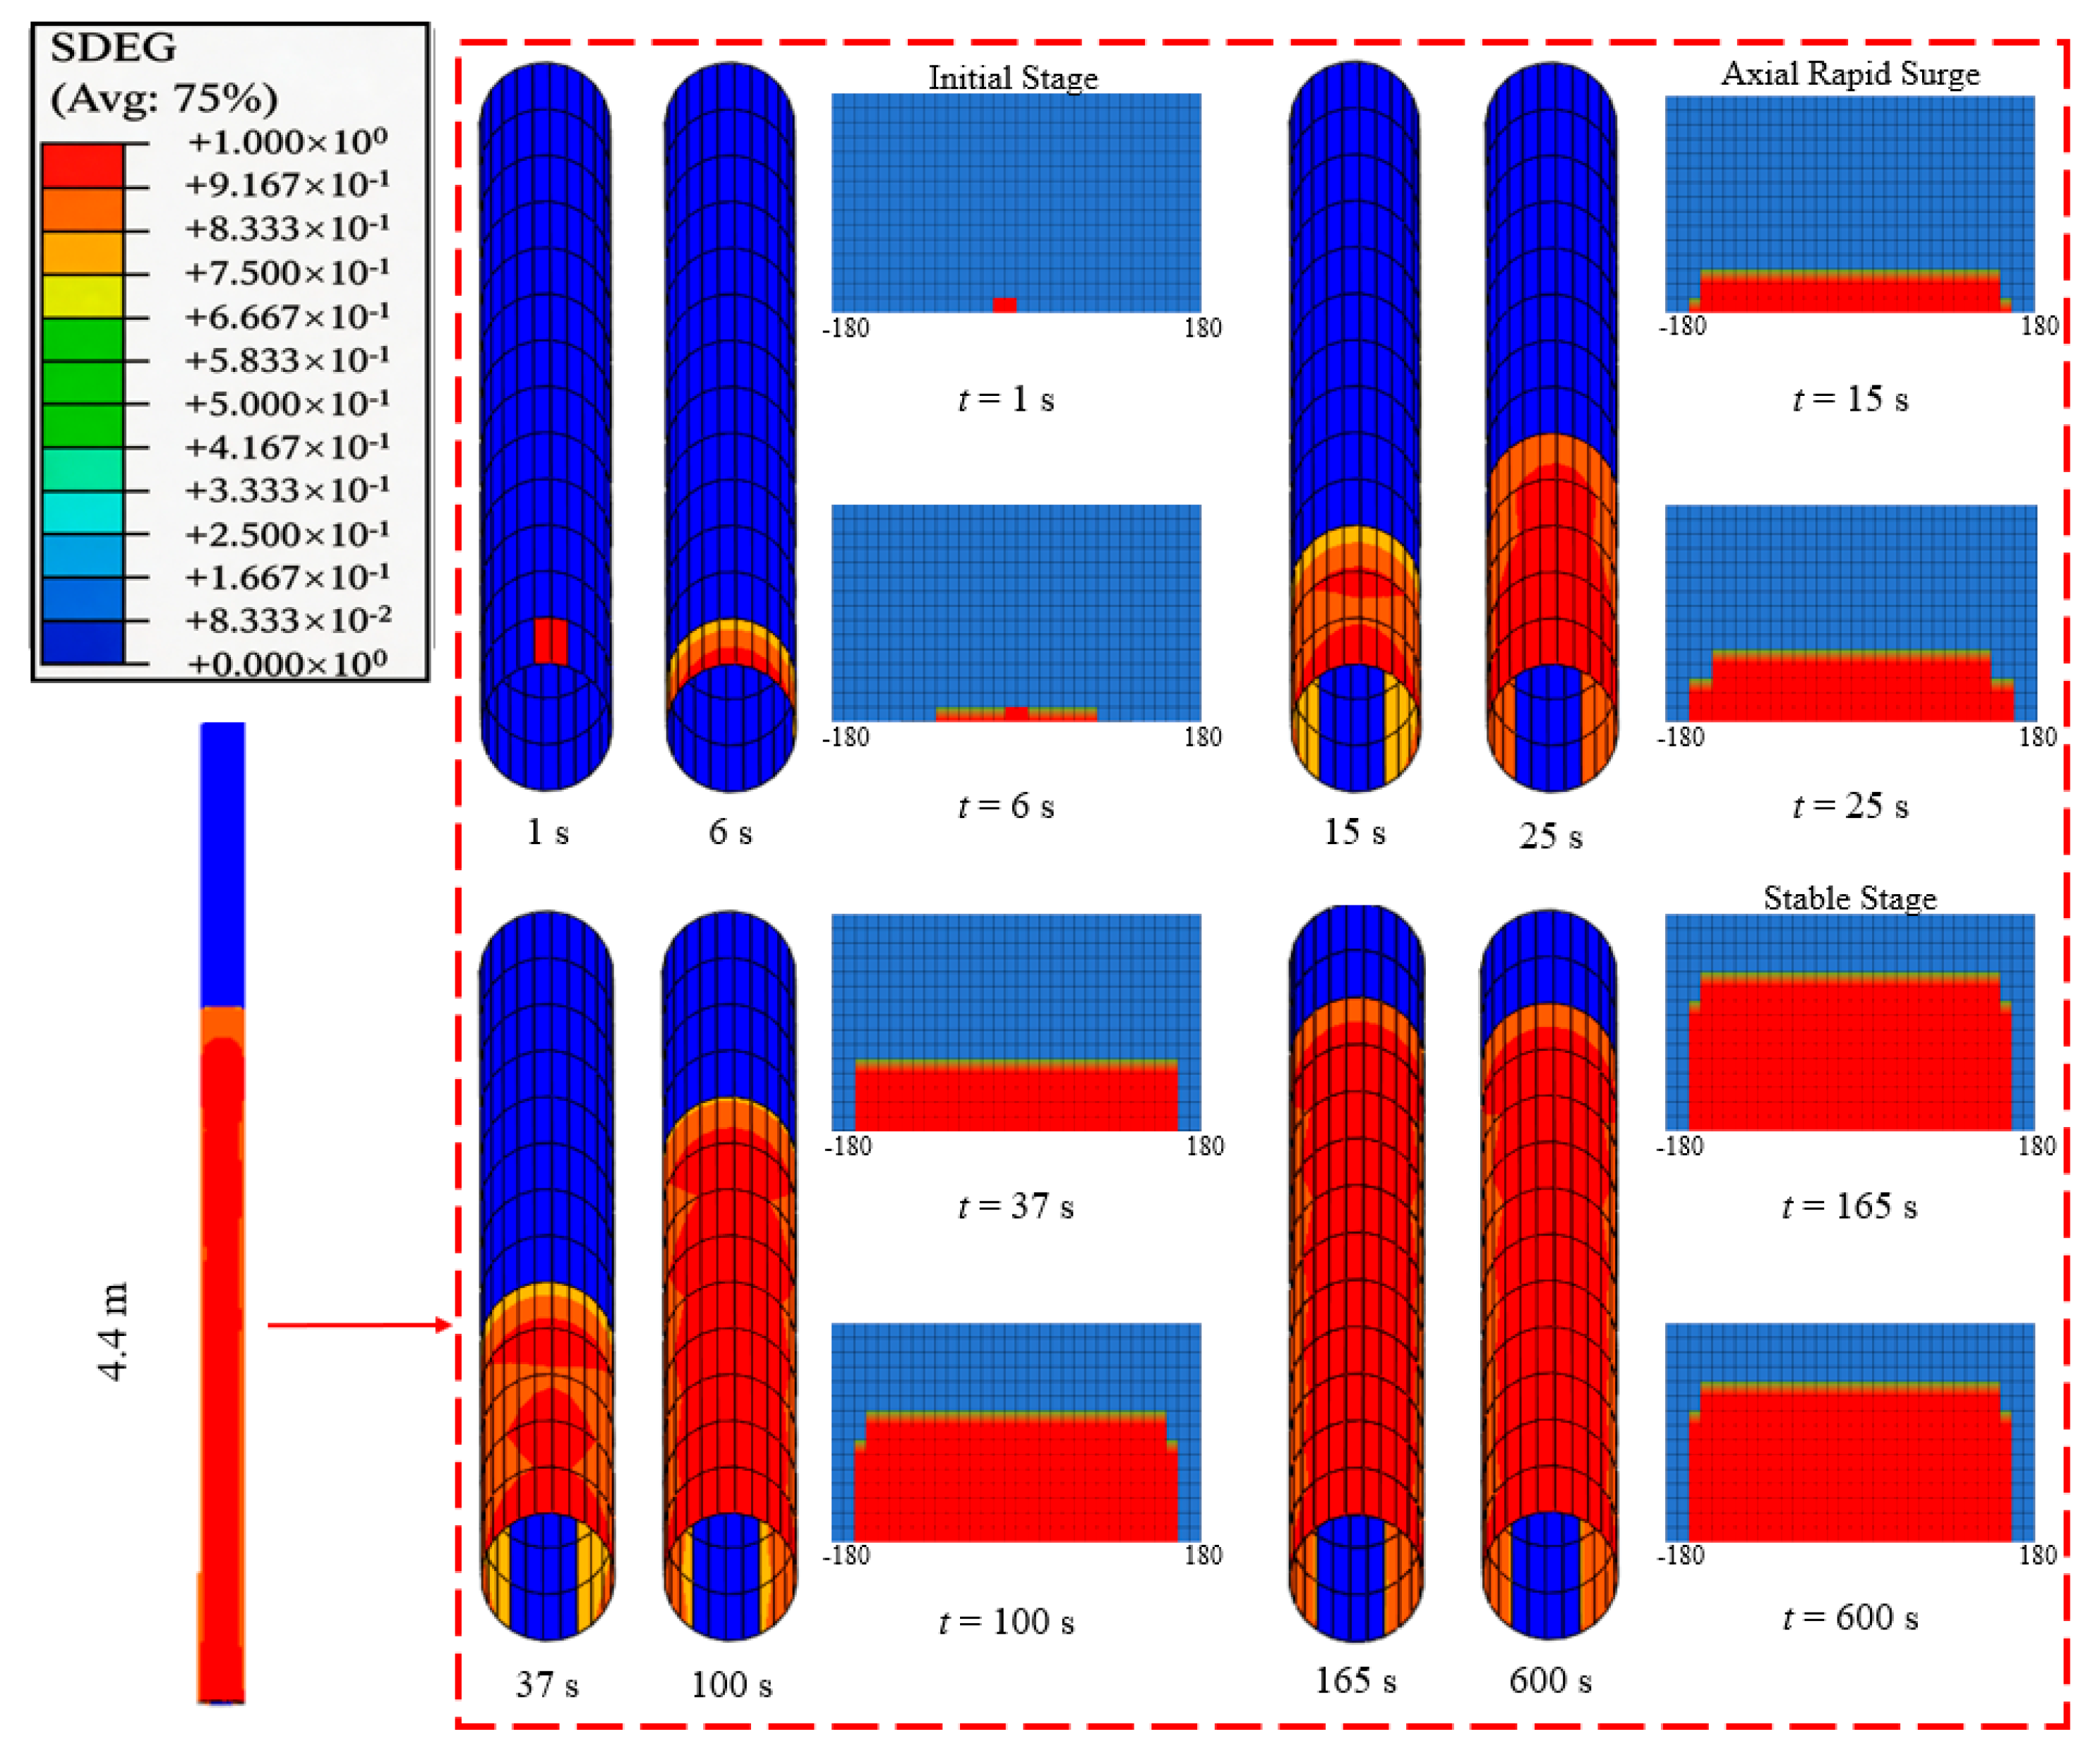
The detachment process at the second interface (cement/formation), together with the temporal evolution of fluid flow paths, is illustrated in
Figure 9. The trend in the figure suggests that the dynamic process of wellbore fluid intruding into and migrating along the weak plane of the bonding interface can be divided into the following four stages:
Stage I: Intact bonding interface (t = 0 s). The structural integrity of the second interface is maintained subsequent to the execution of cementing and perforation procedures. Although weak planes induced by perforation exist, the pressure of the fluid within the wellbore is insufficient to drive intrusion along these planes.
Stage II: Initial debonding at the weak plane (t = 1–6 s). As the fracturing operation commences, a high fluid pressure is maintained within the perforations. Driven by this pressure, fluid begins to intrude into the bonding interface of the cement sheath–formation assembly along the pre-existing weak planes. Localized damage starts to appear at the interface, and the scalar stiffness degradation factor (SDEG) gradually increases. Furthermore, the figure indicates that during the initial intrusion, the fluid first propagates a certain distance axially before beginning to extend circumferentially.
Stage III: Propagation of the debonded interface (t = 7–165 s). With the continuous intrusion of fluid, interface debonding progresses. The fluid migrates forward along the fractured bonding interface, while the area characterized by the scalar stiffness degradation factor (SDEG) rapidly expands. Ultimately, a dominant channeling pathway penetrating the interface is formed, marking the entry into an accelerated damage evolution phase.
Stage IV: Stable phase of the debonded interface (t = 166–600 s). The simulation results show that interface debonding enters a stable phase. The extent of the damaged zone remains constant, and the contour morphology of the scalar stiffness degradation factor (SDEG) stabilizes. As seen in the figure, a final bonded-interface failure zone with a length of approximately 4.40 m is established.
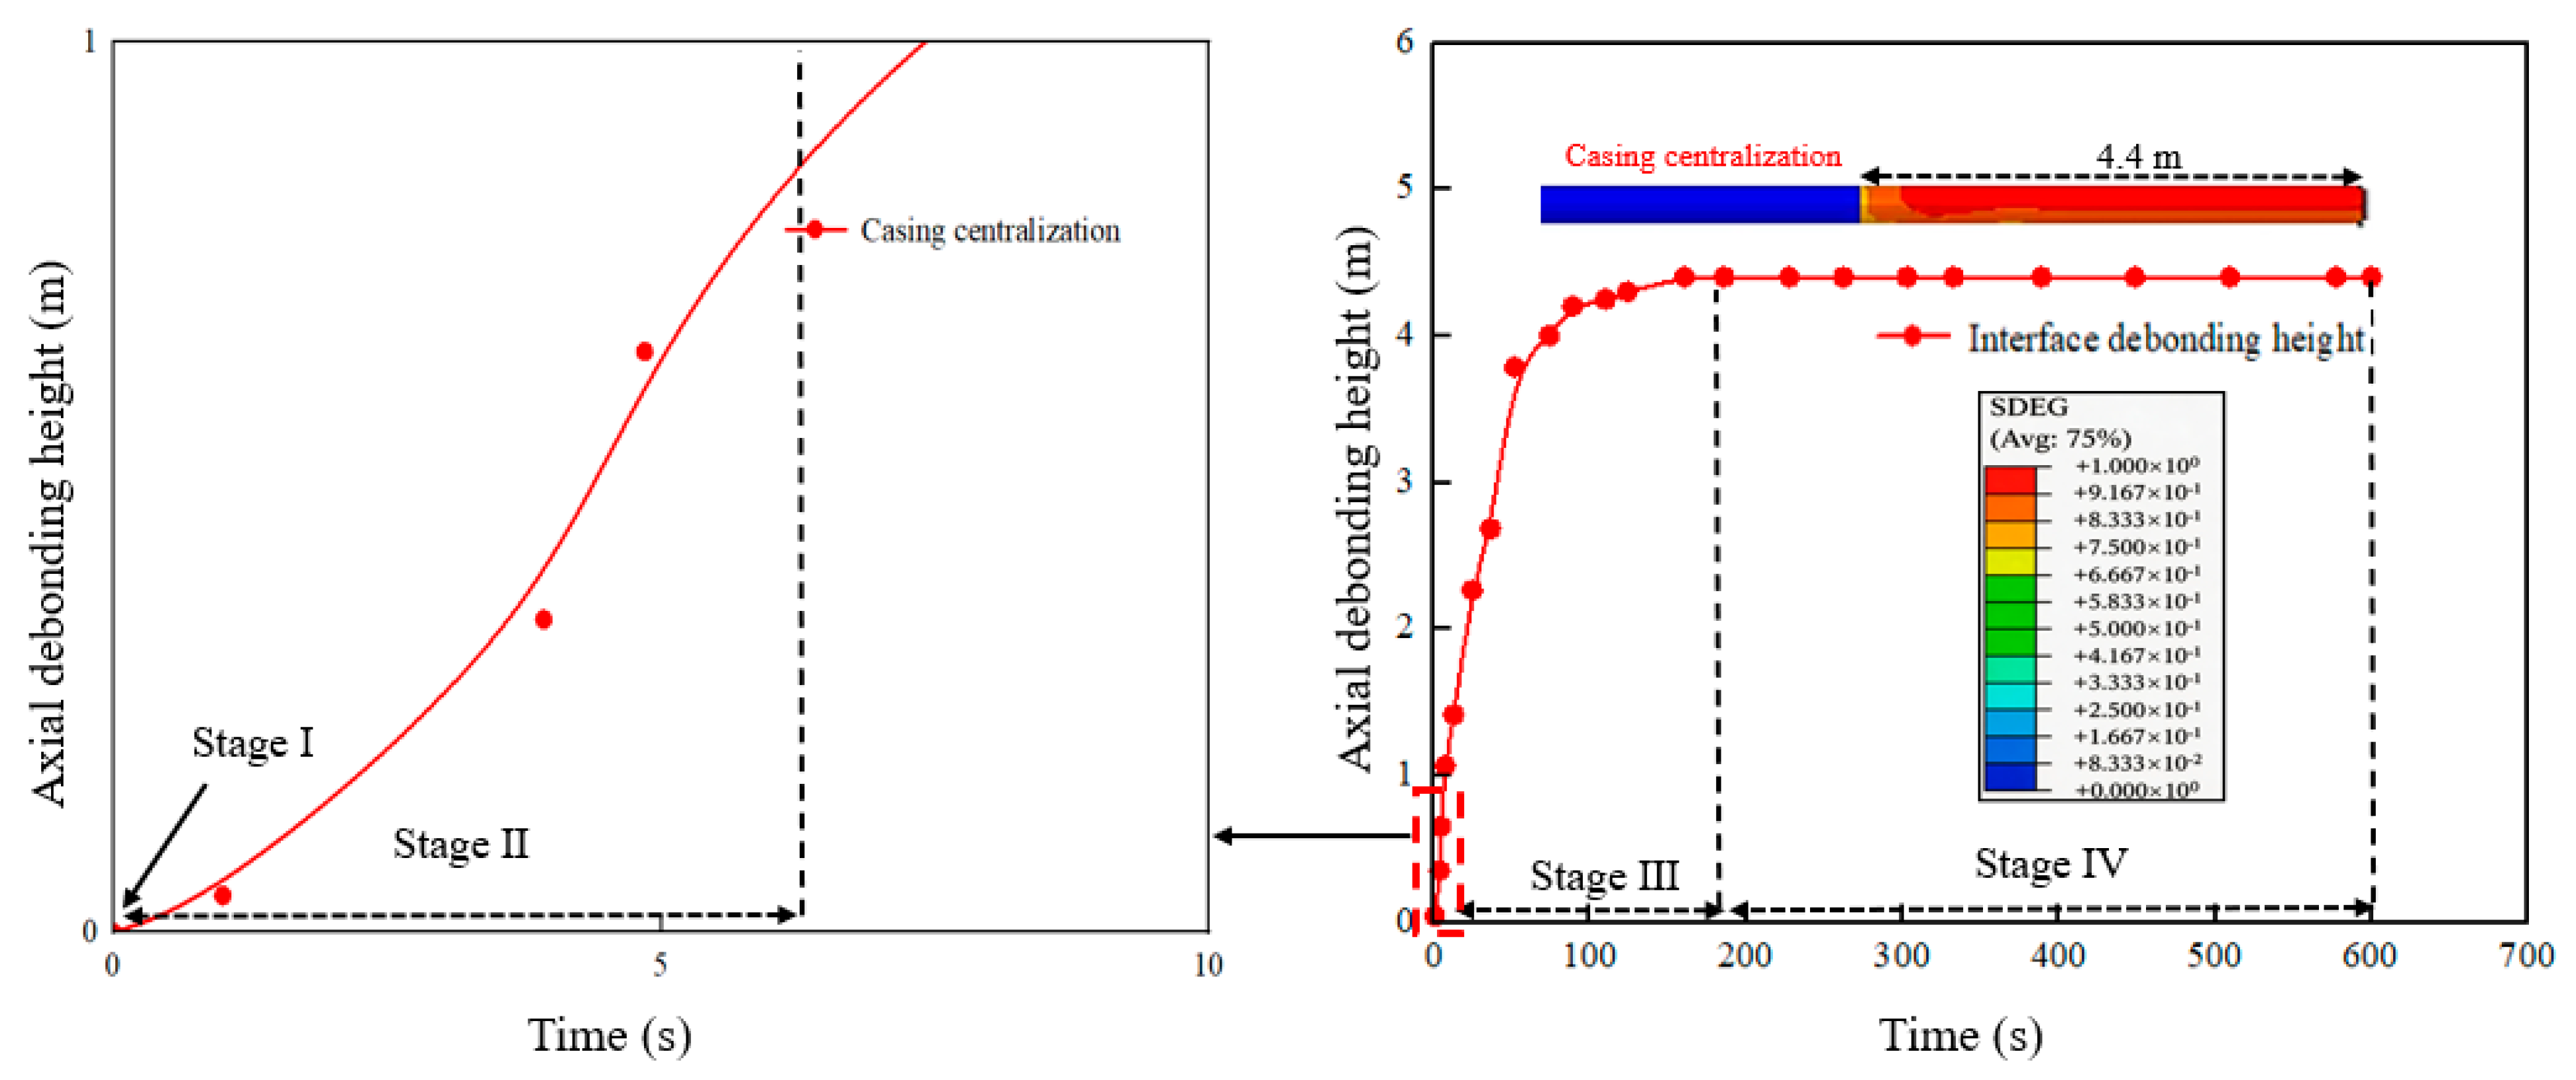
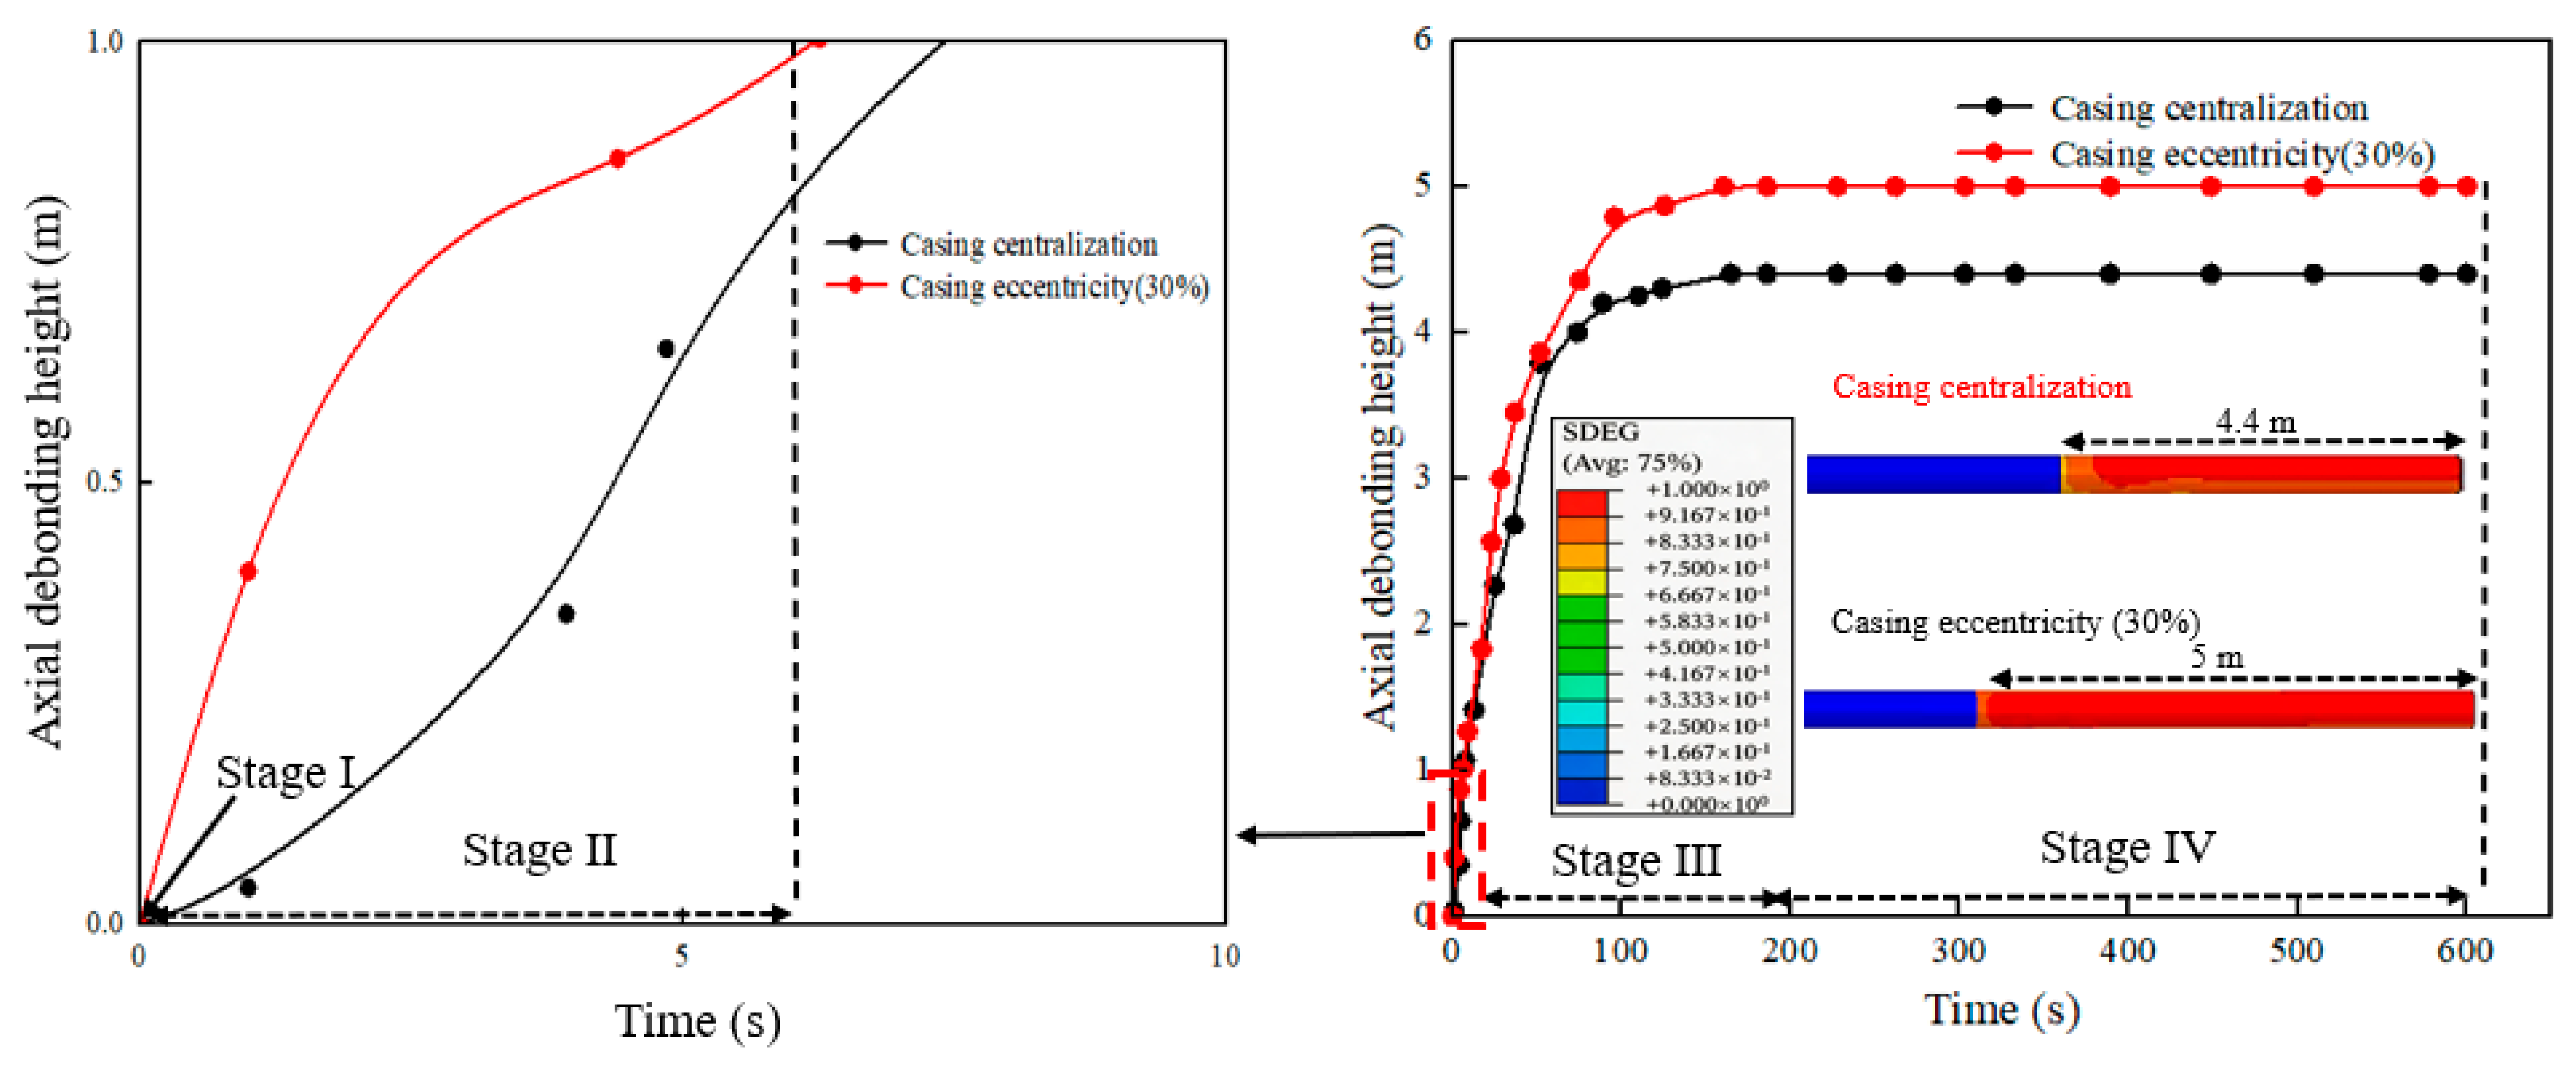
To further quantitatively analyze the dynamic evolution process of the debonded bonding interface in the axial direction, the variation in the axial length of interface debonding over different time periods was analyzed, as shown in
Figure 10. Based on the figure, it can be observed that with the continuous injection of fluid, the axial debonding length first increases rapidly, then grows more slowly, and eventually stabilizes. Specifically, it can be summarized as four distinct stages:
Stage I: The interface was in its initial intact state (t = 0 s). The bonding remained intact with no damage incurred, and the axial debonding length was zero.
Stage II: Initial debonding at the weak plane (t = 1–6 s). After the initiation of the fracturing operation, a localized high-pressure zone was formed within the perforations, driving the fracturing fluid to intrude into the second interface (cement/formation). Under this fluid pressure, the debonding length increased gradually, and localized damage was initiated at the interface.
Stage III: Propagation of the debonded interface (t = 7–165 s). Interface debonding subsequently entered a phase dominated by axial propagation. This stage was characterized by the rapid axial extension of the damaged zone. The fracturing fluid, within the established channel, drove the continuous forward propagation of the debonded interface. During this stage, the debonding length initially exhibited a rapid increase, followed by a slower rate of growth.
Stage IV: Stable phase of interface debonding (t = 166–600 s). In this final stage, a new mechanical equilibrium was reached within the system. The propagation of the damaged zone ceased. Over time, the interface failure length gradually increased until it stabilized upon reaching approximately 4.40 m.
4.2. Dynamic Propagation of Circumferential Channeling
Based on previous analyses, it is known that current research has primarily been focused on the axial propagation of fluid along the second interface (cement/formation), which serves as the basis for optimizing fracturing stage spacing [
17,
18]. However, in actual engineering practice, while fluid continuously migrates axially, causing debonding, it also propagates circumferentially along the cement sheath–formation interface. In response to this, a specific analysis was conducted on the process of fluid migration in the circumferential direction and the resulting propagation of the bonding interface.
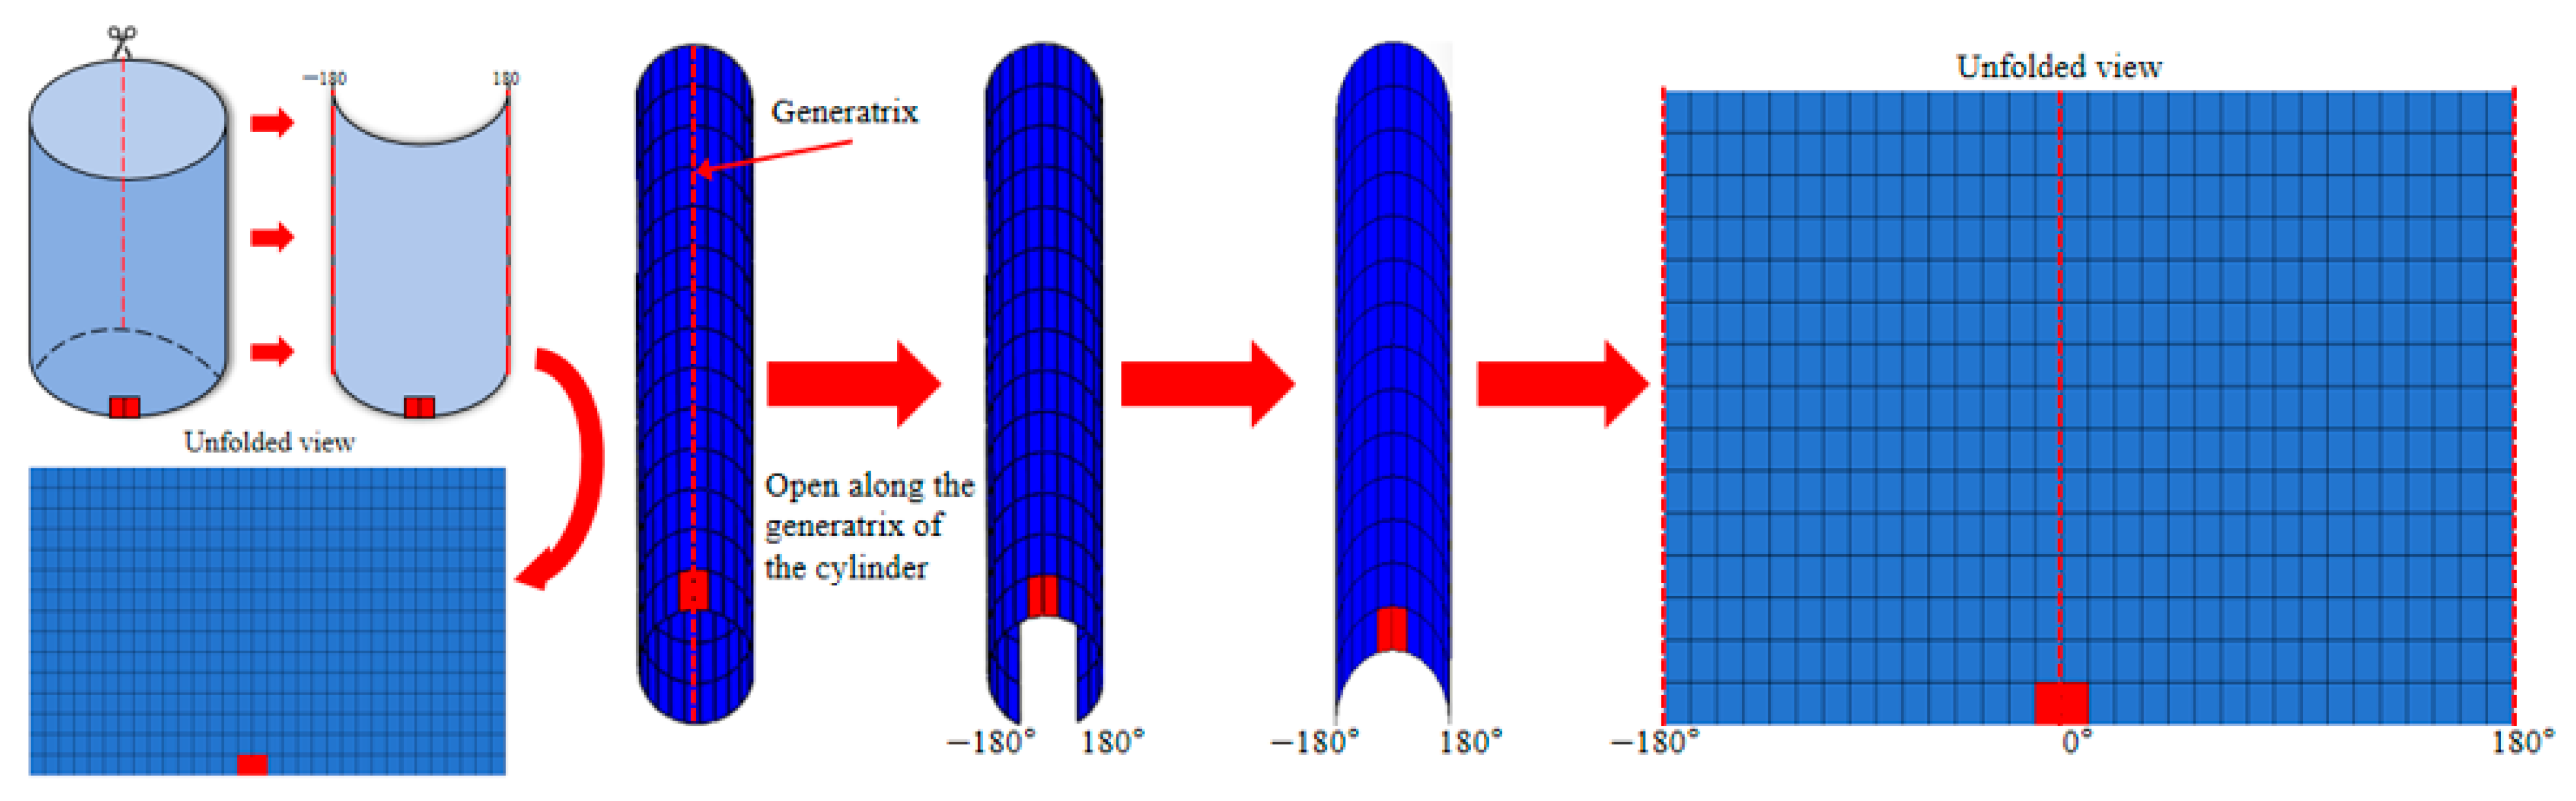
To more intuitively characterize the debonding evolution at the cement–formation interface (the second interface), the 3D cylindrical interface, modeled using zero-thickness cohesive elements, is unrolled into a planar view for visualization, as illustrated in
Figure 11. The specific processing workflow is as follows: first, the opposing faces of two preset fracture elements on the 3D cylindrical interface are selected as the cutting baseline; subsequently, the cylinder is cut along this reference plane and flattened into a 2D rectangular plane; finally, the damage data from the interface elements are mapped onto this 2D plane to generate the corresponding contour plots. This unrolled view enables a clear and systematic presentation of the dynamic evolution characteristics of fluid migrating simultaneously in both axial and circumferential directions.
The dynamic pattern of co-occurring axial and circumferential fluid migration across various times is illustrated in
Figure 12, leading to its division into four distinct phases.
Stage I: Intact bonding interface (t = 0 s). This stage represents the initial state of the entire evolution process. After cementing and perforation, the bonding interface remains intact without any visible damage, providing a baseline for subsequent debonding evolution.
Stage II: Initial debonding at the weak plane (t = 1–6 s). This stage characterizes the initiation and initial propagation of interface damage. The numerical simulation results indicate that the damaged zone first initiates and propagates axially, followed by a tendency for circumferential propagation, revealing the initial mode of interface failure.
Stage III: Propagation of the debonded interface (t = 7–165 s). This stage is characterized primarily by the rapid axial extension of the damaged zone. The simulation results fully illustrate the evolution of the channeling pathway from a local defect into a continuous, interconnected region, during which the sealing integrity of the interface is compromised.
Stage IV: Stable phase of the debonded interface (t = 166–600 s). The simulation results show that a final equilibrium is reached during this stage. Neither the extent of the damaged zone nor the morphology characterized by the scalar stiffness degradation factor (SDEG) changes further. Ultimately, a stable, 4.40 m-long damaged zone is formed.
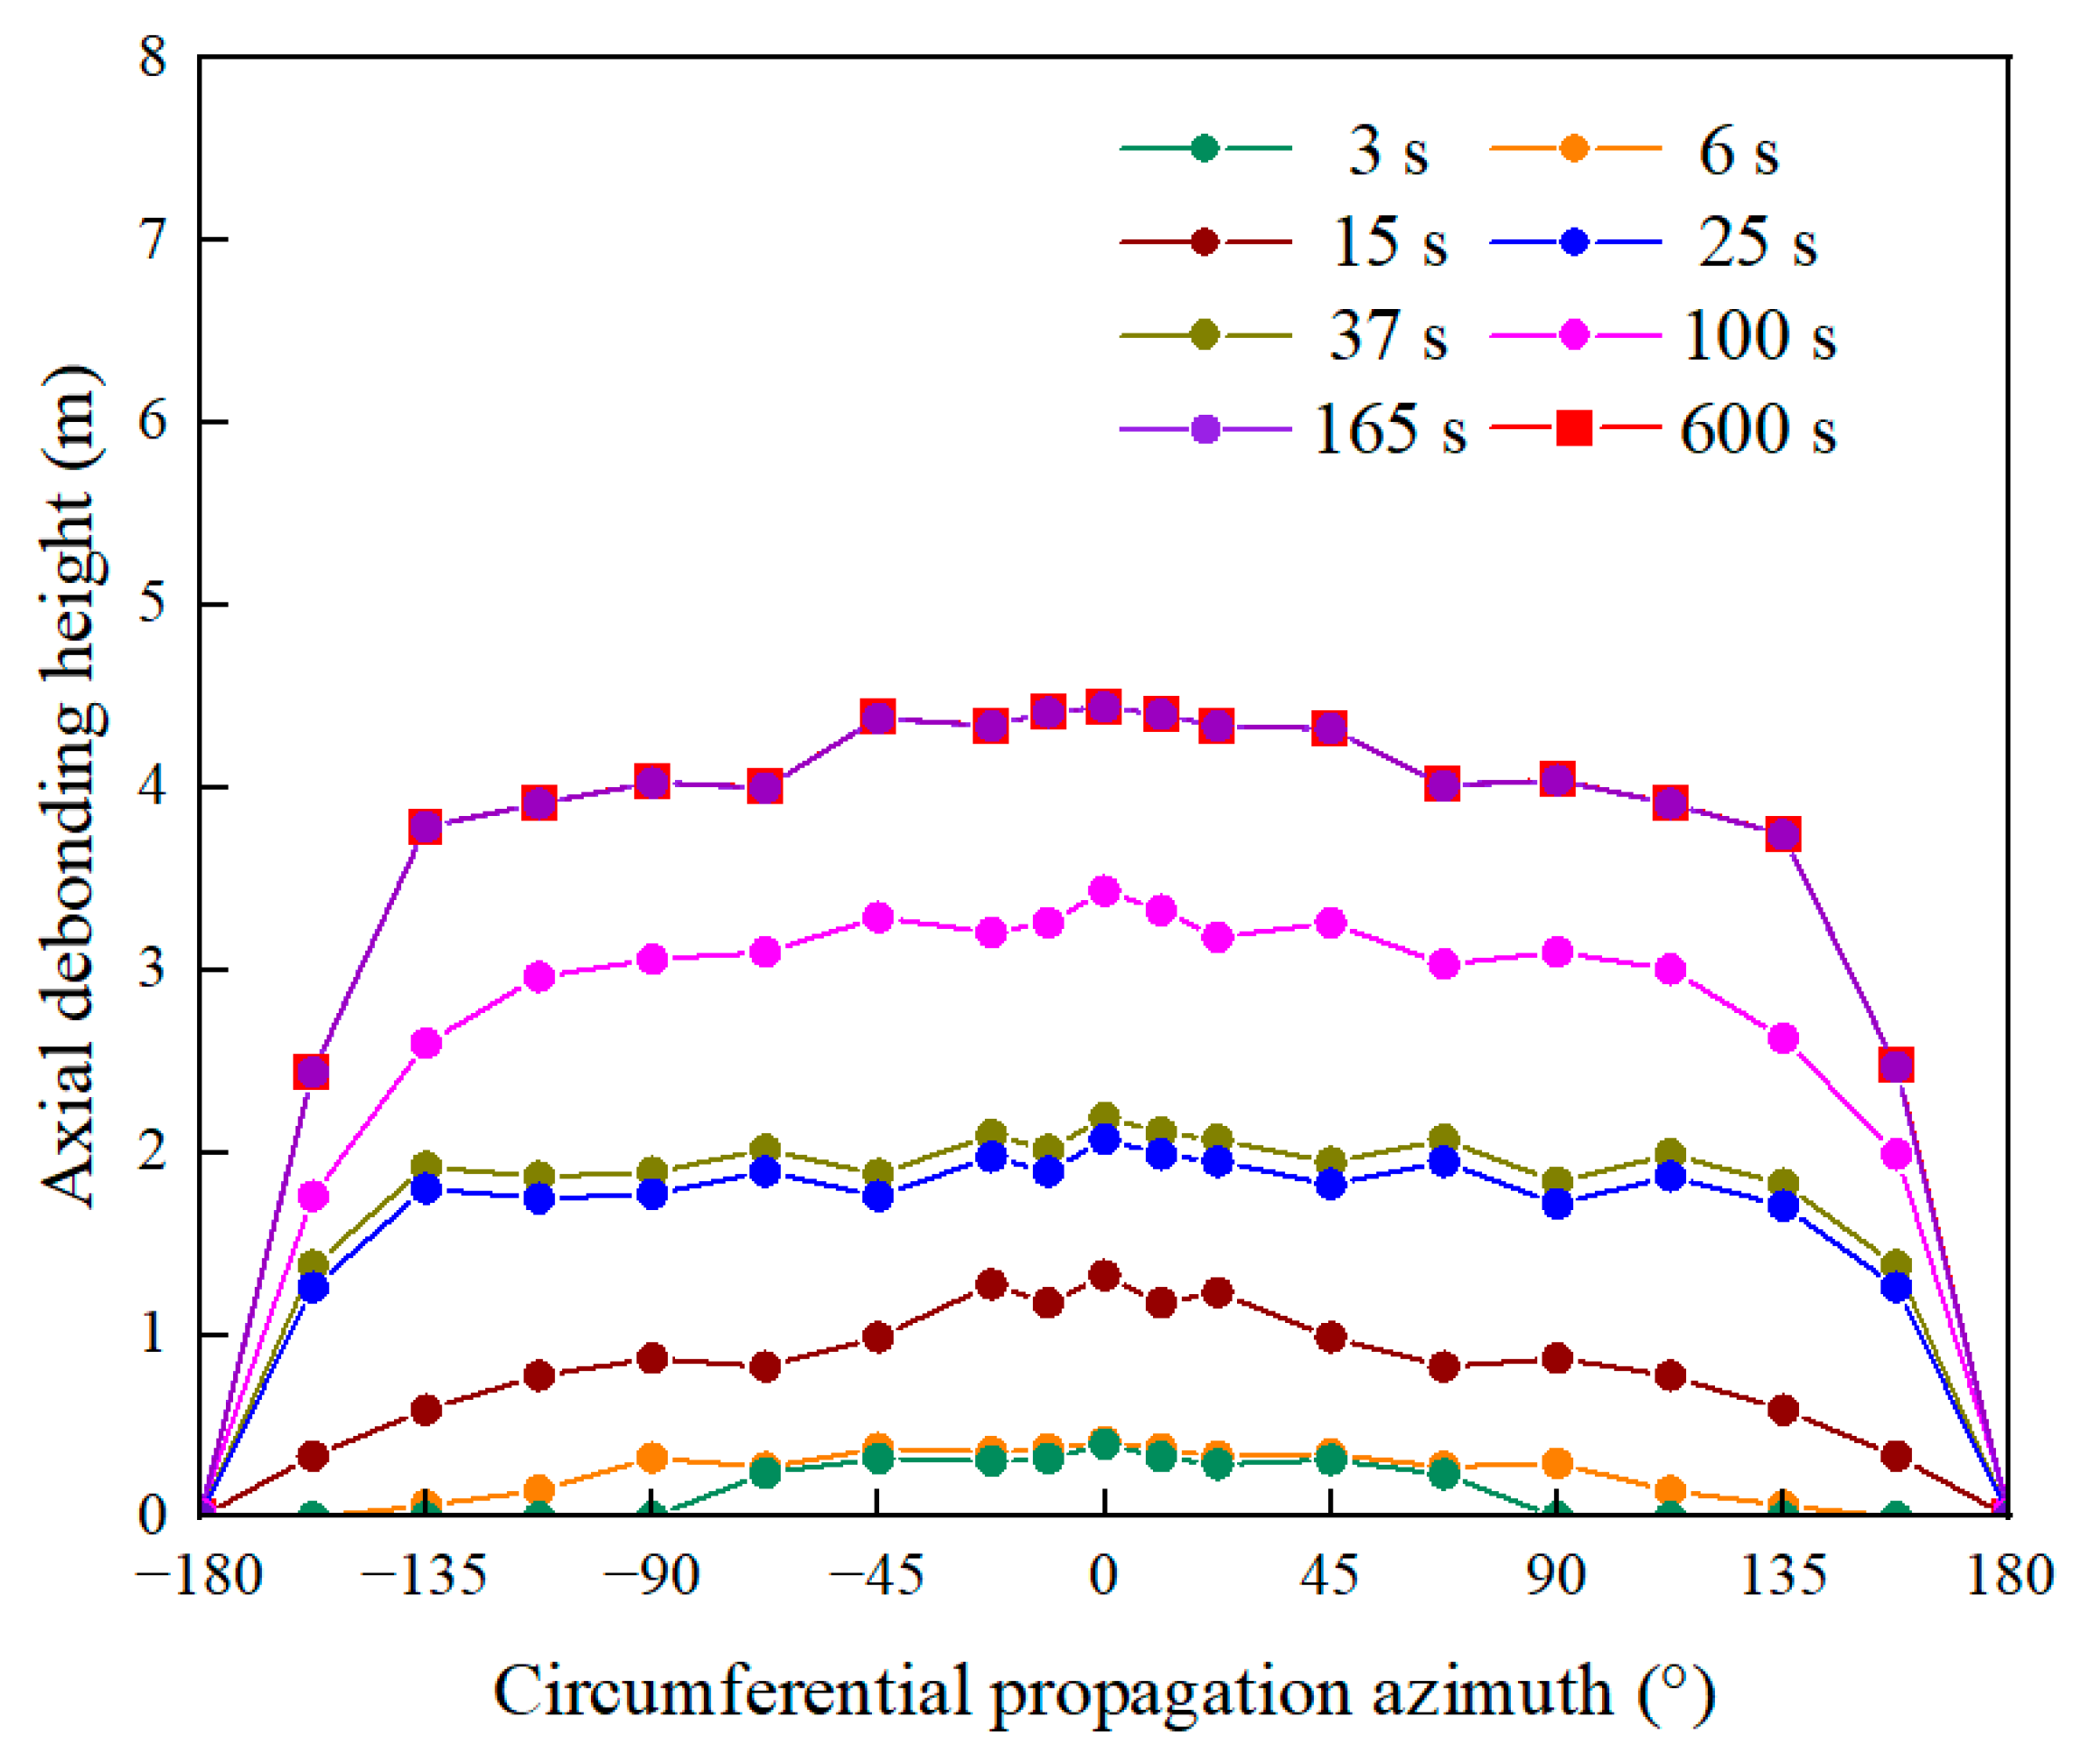
The dynamic evolution of axial debonding length and circumferential propagation azimuth for the cemented interface is illustrated in
Figure 13 across a range of time conditions. The following observations are made based on the figure:
Stage I: Intact bonding interface (t = 0 s). This stage is defined as the initial state prior to fracturing fluid injection. At this point, the cement sheath–formation interface system remains macroscopically intact, with its sealing effectiveness maintained by the wellbore pressure conditions. Although perforation operations may create potential local flow paths, interface failure has not yet been triggered.
Stage II: Initial debonding at the weak plane (t = 1–6 s). During this stage, interface debonding begins to initiate. As seen in the figure, the overall development of the axial debonding height is limited, and the damaged zone is confined to a finite range of circumferential azimuth angles. This indicates that the interface damage is in its initial phase, with limited spatial extent.
Stage III: Propagation of the debonded interface (t = 7–165 s). A significant transition in interface debonding behavior occurs in this stage, where the dominant mode shifts from circumferential propagation to rapid axial extension. A marked increase in the axial debonding length is observed, while the range of circumferential azimuth angles covered by the damage also expands simultaneously. This evolution indicates that interface debonding has progressed from localized initiation to large-scale axial interconnection.
Stage IV: Stable phase of the debonded interface (t = 166–600 s). The system reaches its final equilibrium state during this stage. The interface debonding process completely ceases, which is macroscopically characterized by a constant axial debonding length after t = 166 s, with no further propagation observed until the end of the simulation (t = 600 s).
4.3. Comparison of Concentric and Eccentric Casing
Based on prior analyses, it is recognized that existing numerical simulations have generally been configured with the casing in a centered position. This setup does not reflect the practical engineering conditions of long horizontal sections, where casing sagging and resulting eccentricity are common [
21]. To address this, the eccentricity of the casing was set to 30% for the present study. The thinner region of the cement sheath resulting from this eccentricity was designated as the initial weak plane for fluid channeling initiation. Subsequently, a comparison was conducted to analyze the differences in fluid migration patterns along the second interface (cement/formation) between the centered casing condition and the eccentric casing condition.
The fluid migration patterns along the second interface under both centered and eccentric casing conditions are illustrated in
Figure 14. Based on this figure, the following observations can be made: during all stages of time development, a more pronounced growth of the axial debonding length is observed under the 30% casing eccentricity condition. Specifically, a faster initial growth rate of the debonding length is exhibited under the eccentric condition compared to the centered condition. Furthermore, a steeper slope for the debonding length curve is observed in the eccentric case, indicating a significantly higher propagation rate. In the final stable stage, the debonding length under the 30% eccentric condition is also found to be markedly greater than that under the centered casing condition.
4.4. Sensitivity Analysis
4.4.1. Influence of Casing Eccentricity
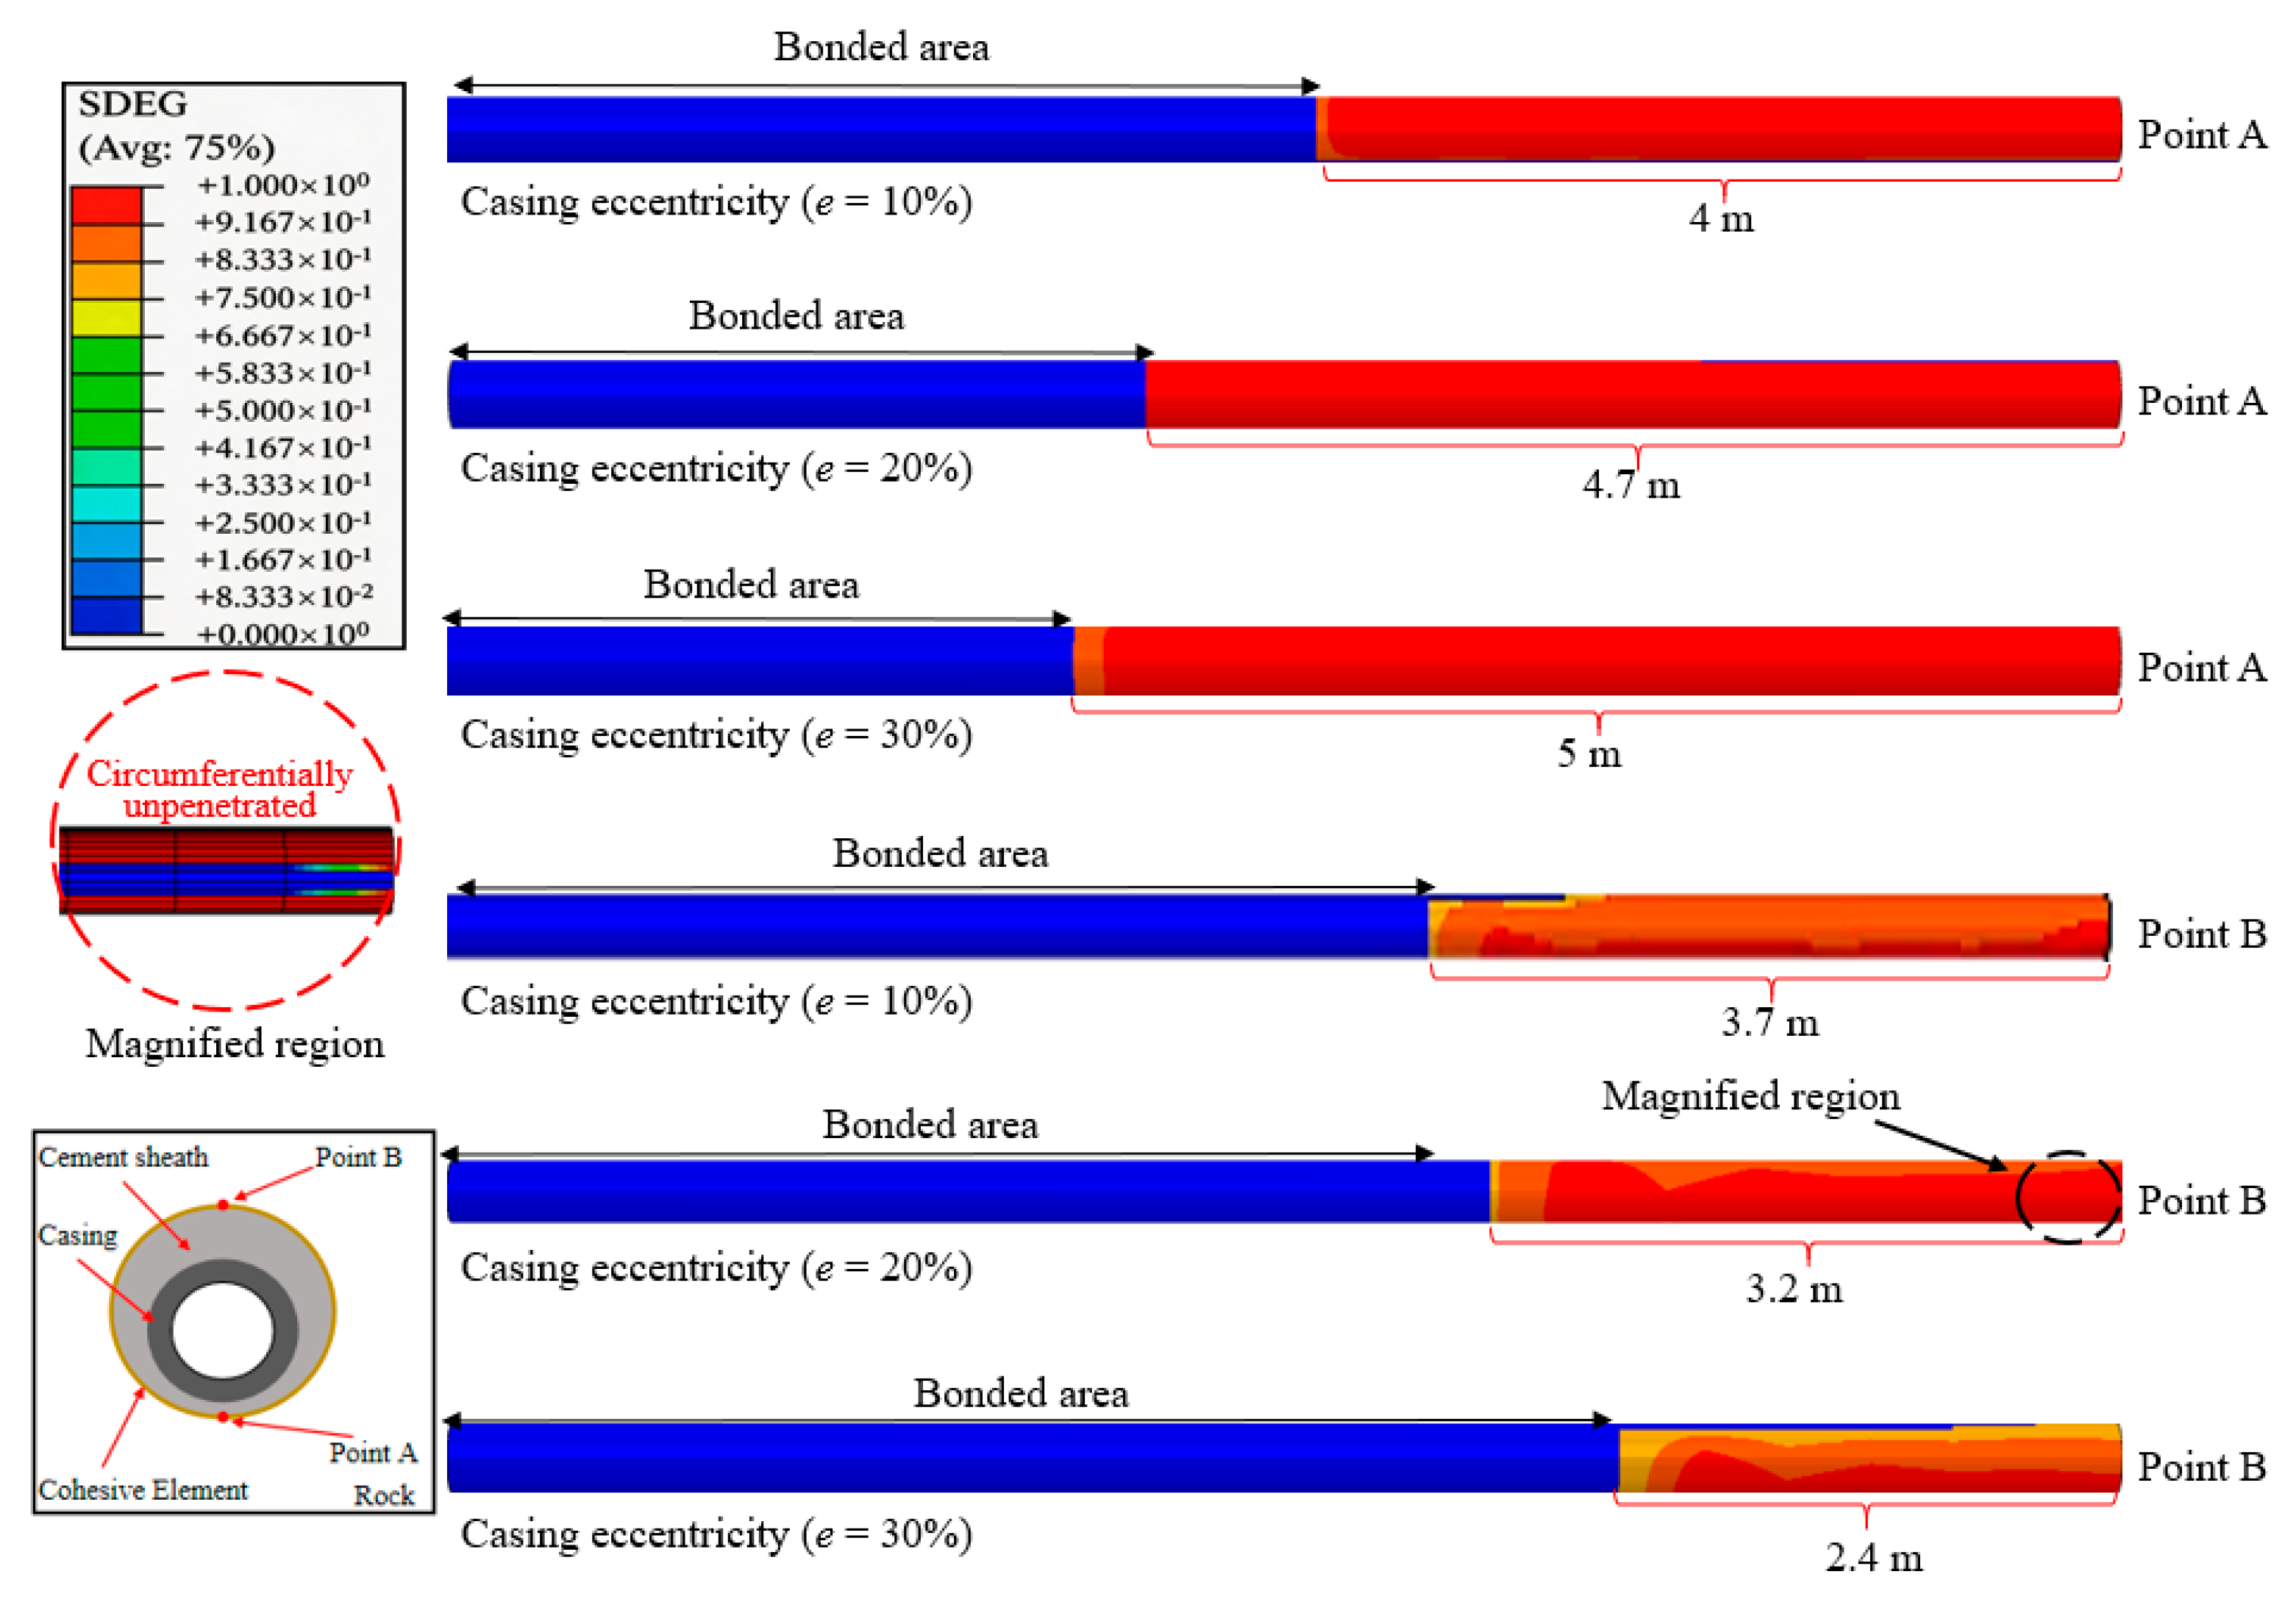
With the aim of analyzing the role of casing eccentricity in the detachment characteristics of the second interface, corresponding numerical models were established for three working conditions with eccentricity (e) values of 10%, 20%, and 30%, respectively. In the models, two sets of fracturing fluid injection schemes were configured. In the first set, the injection point was located at the thin side of the cement sheath (labeled as Point A); in the second set, the injection point was located at the thick side of the cement sheath (labeled as Point B). All other parameters were kept consistent to enable a comparative analysis of the effects of different injection locations on interface debonding behavior.
To analyze the impact of casing eccentricity, the interface debonding length was adopted as the key evaluation metric. The results are presented in
Figure 15. Several deductions are made from the illustrated results: As the eccentricity increases, the interface debonding length under the thin-side injection (Point A) condition shows a continuous increase, whereas it demonstrates a gradual decrease under the thick-side injection (Point B) condition. This confirms that casing eccentricity promotes debonding at the thin side of the bonding interface, while exhibiting an inhibitory effect at the thick side. Furthermore, this trend becomes more pronounced with increasing eccentricity.
Regarding specific data, when the casing eccentricity (e) is 10%, the interface debonding length is 4.00 m for the thin side and 3.70 m for the thick side (Point B). As the eccentricity increases to 20%, the propagation length on the thin side increases to 4.70 m, while on the thick side it decreases to 3.20 m. When the eccentricity is further increased to 30%, the propagation length on the thin side reaches 5.00 m, whereas on the thick side it is reduced to 2.40 m.
Further analysis reveals that casing eccentricity results in an uneven distribution of cement sheath thickness. In the thin-side region, the degree of stress concentration is intensified with increasing eccentricity, thereby promoting interface debonding. Conversely, on the thick side, the greater thickness of the cement sheath causes the detrimental effects associated with stress concentration to become increasingly prominent as eccentricity rises. This imposes stronger constraints on interface debonding, ultimately leading to a significant reduction in the debonding length at the thick side of the interface.
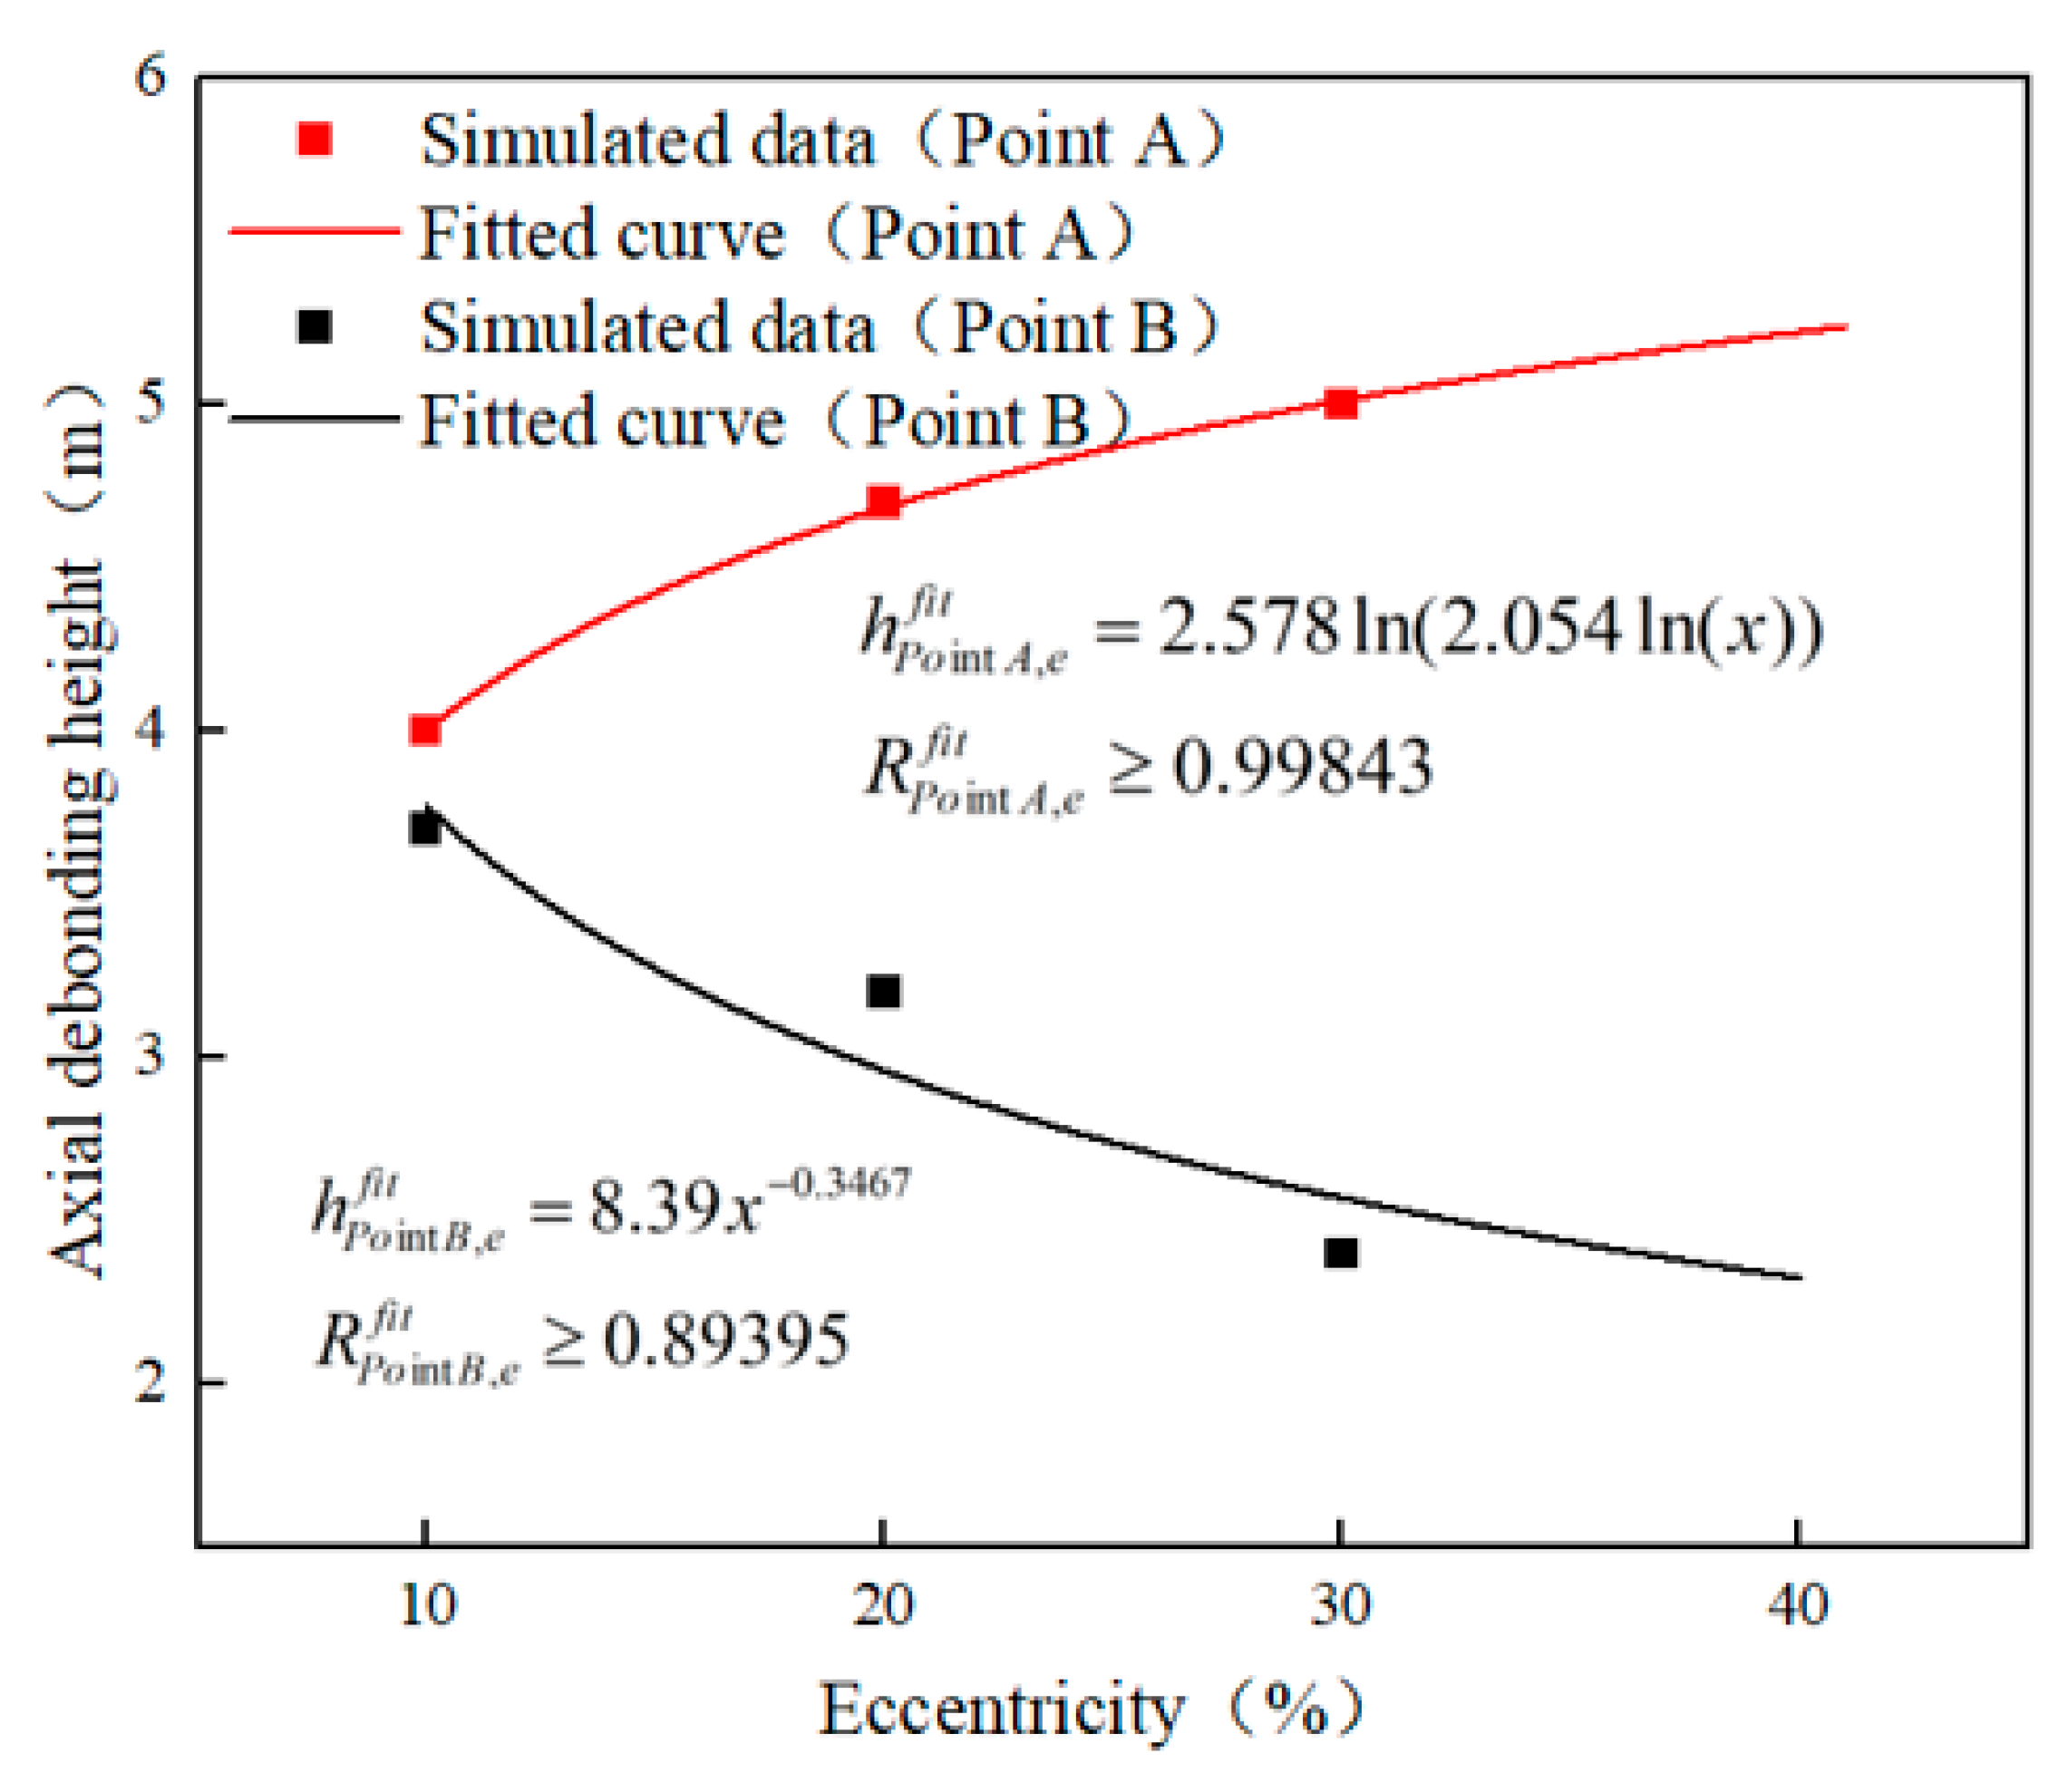
The evolution of the axial separation length at the interface was analyzed under varying casing eccentricity scenarios. The specific results corresponding to the narrow side (Point A) and the wide side (Point B) of the cement sheath are plotted in
Figure 16. Overall, when fracturing fluid is injected from the thin side (Point A), a logarithmic growth trend with increasing eccentricity is exhibited by the debonding length, with the fitting relationship given by Equation (8). In contrast, when injection occurs from the thick side (Point B), a power-law decrease with increasing eccentricity is shown by the debonding length, as fitted by Equation (9). It should be noted that these fitting equations are empirical descriptions of the numerical results within the investigated parameter range, rather than universal predictive formulas.
Examining the specific numerical values: as eccentricity increases from 10% to 30%, the debonding height at Point A increases from 4.00 m to 5.00 m, representing an increase of 25%. In contrast, Point B exhibits a decrease from 3.70 m to 2.40 m, corresponding to a 35.10% drop. This disparity is primarily attributed to the circumferential non-uniform distribution of cement sheath thickness. Under thin-side injection conditions, eccentricity exacerbates the stress concentration effect in this region, thereby promoting interface debonding. For thick-side injection, the thicker cement sheath imposes stronger constraints on the vertical propagation of fractures, resulting in a significant decrease in debonding length as eccentricity increases.
where
h represents the axial debonding height, in meters; “
fit” denotes the fitted function;
e is the independent variable representing eccentricity; and
Point A and
Point B represent the injection points set at the thin side and thick side of the cement sheath, respectively.
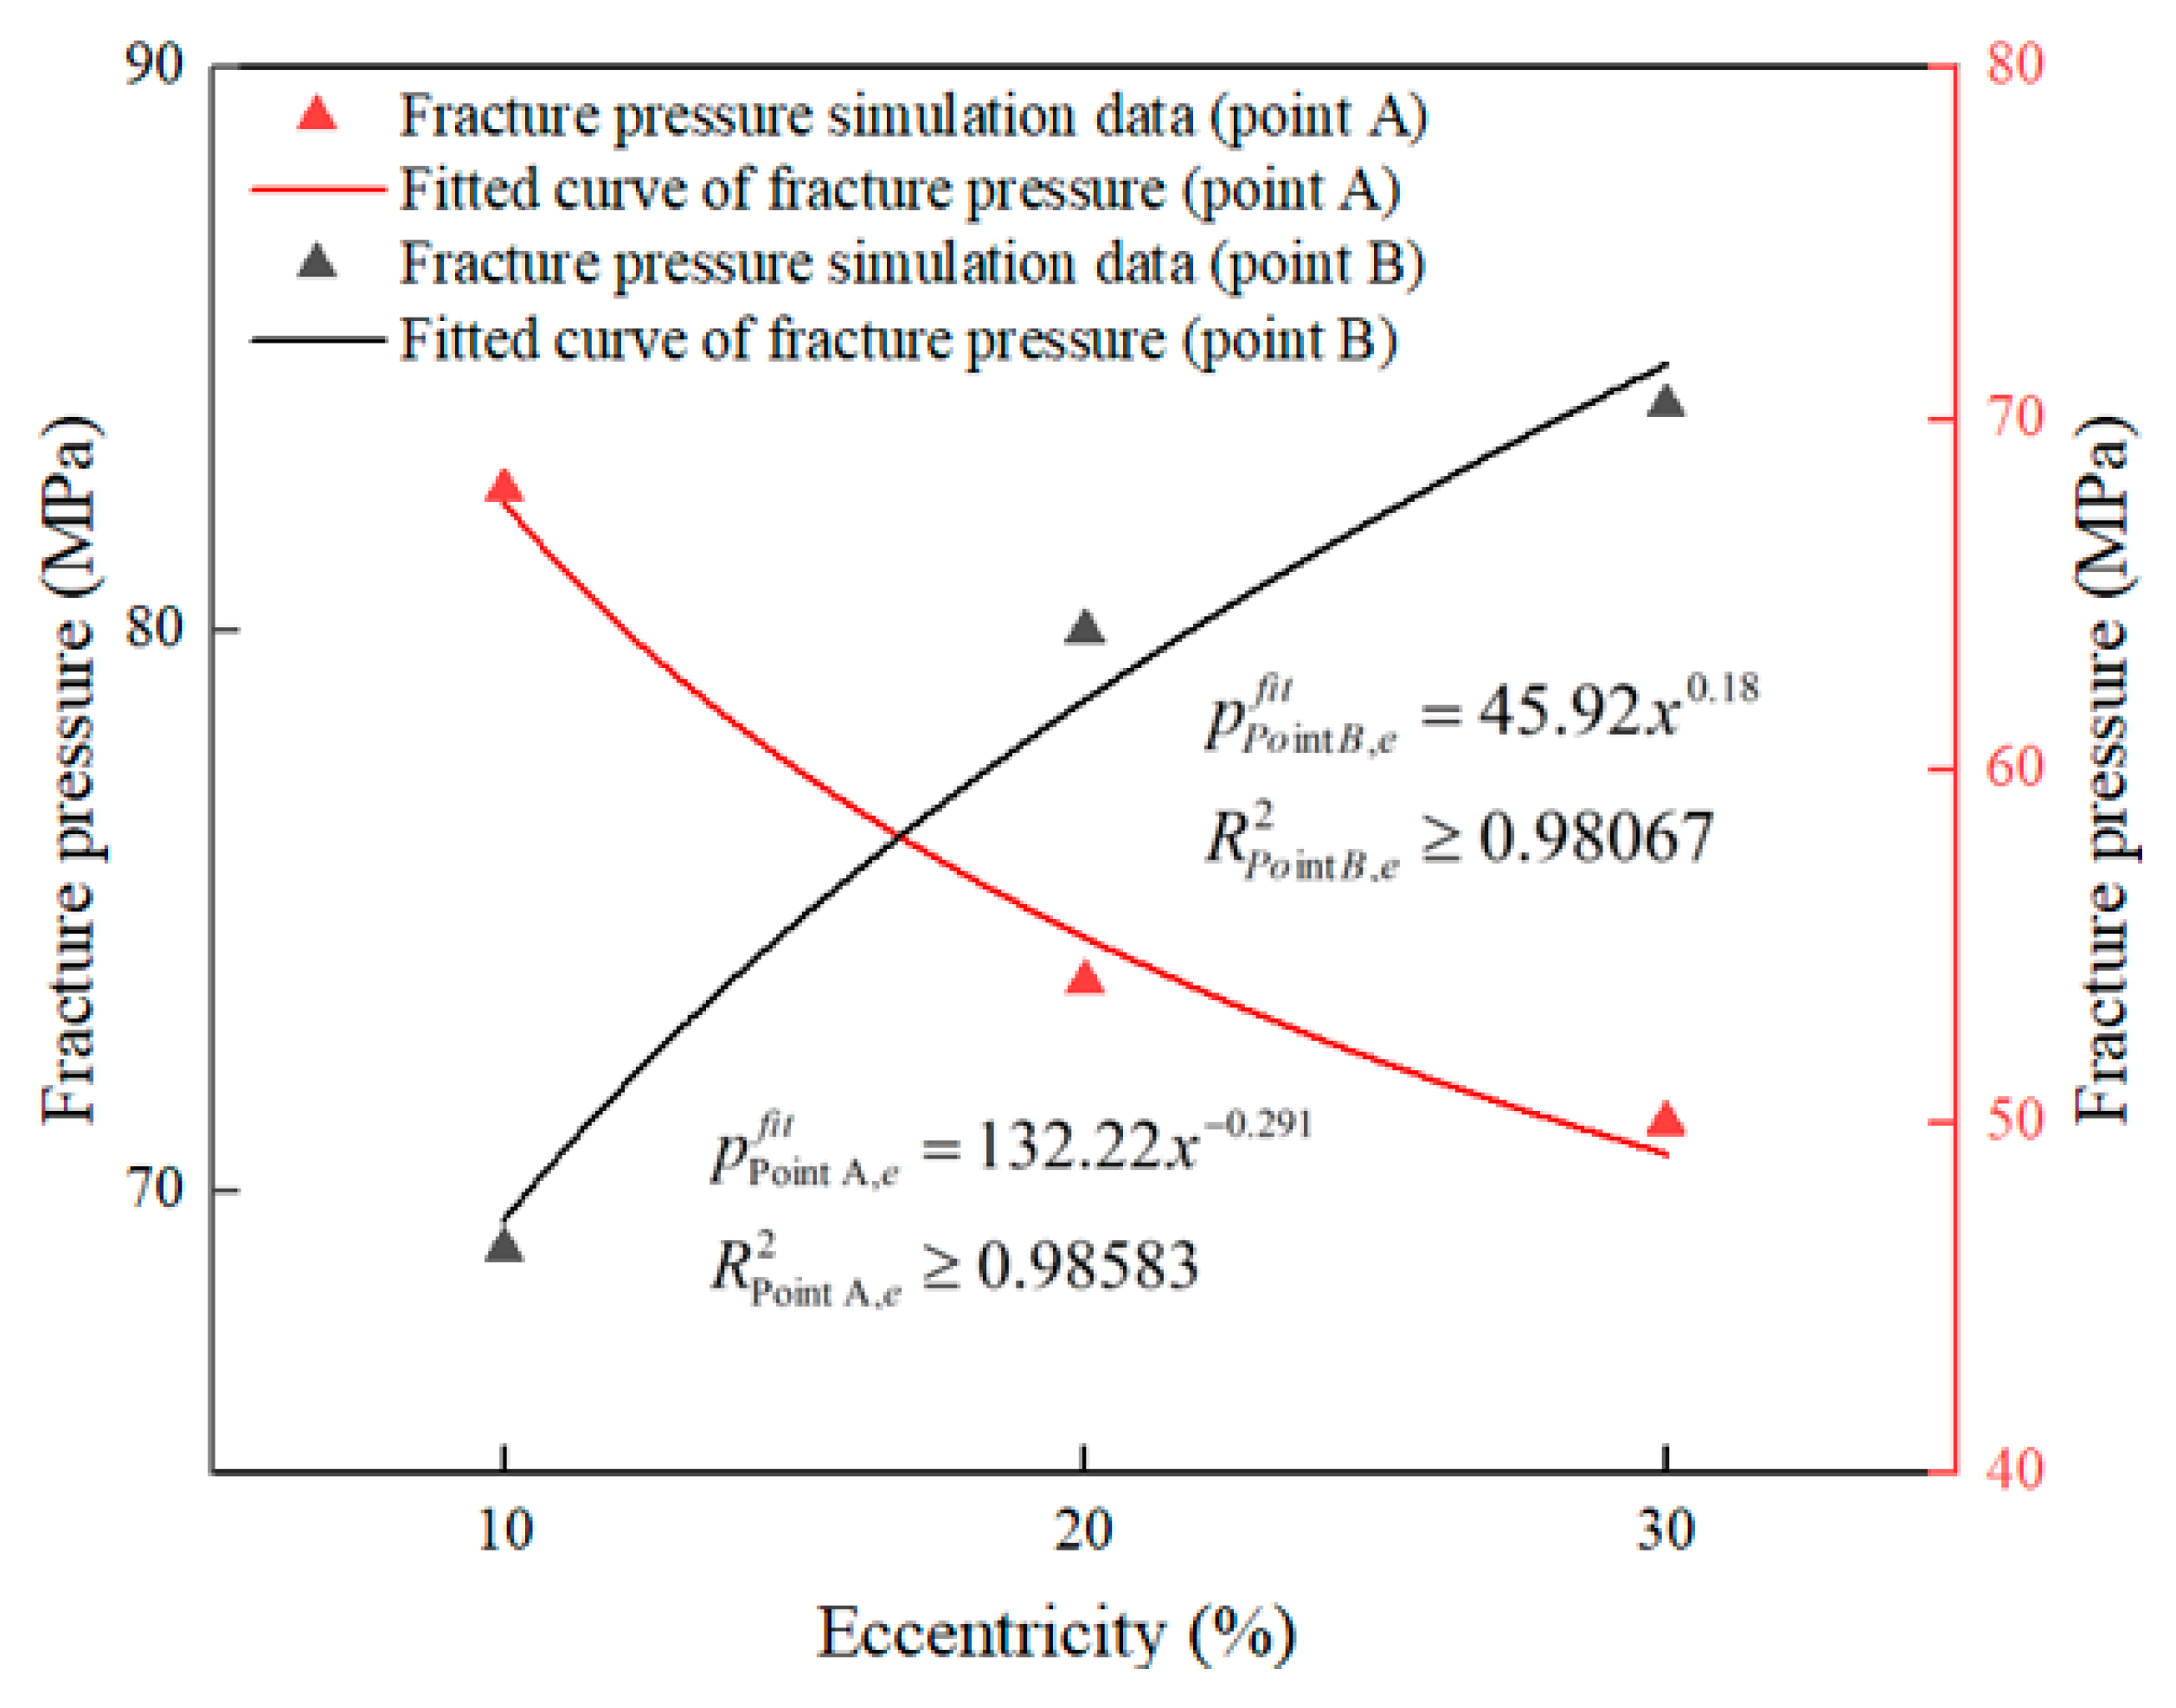
The variation in fracture initiation pressure at the interface when fracturing fluid is injected from the thin side (Point A), and the thick side (Point B) of the cement sheath under different casing eccentricities is further illustrated in
Figure 17. As shown, distinctly opposite trends are exhibited by the two fitted curves, represented by Equations (10) and (11). For injection at the thin side (Point A), a decrease in fracture initiation pressure with increasing eccentricity is observed, indicating that the fluid pressure required to induce fracture initiation in this region is progressively reduced. Conversely, for injection at the thick side (Point B), an increasing trend in the initiation pressure with rising eccentricity is shown, meaning that fracture initiation at this location becomes progressively more difficult. When the eccentricity is increased from 10% to 30%, a decrease in the breakdown pressure at Point A from approximately 68 MPa to about 50 MPa is observed, while an increase in the breakdown pressure at Point B from about 69 MPa to around 85 MPa is noted. The pattern of decreasing breakdown pressure at the thin side and increasing breakdown pressure at the thick side is thereby confirmed. These results indicate that interface debonding is more likely to occur under casing eccentricity conditions.
where
P represents the fracture breakdown pressure, in MPa; “
fit” denotes the fitted function;
e is the independent variable representing eccentricity; and
Point A and
Point B represent the injection points set at the thin side and thick side of the cement sheath, respectively.
4.4.2. Influence of Elastic Modulus of Cement Sheath
To systematically investigate the role and mechanism of the elastic modulus of the cement sheath in interfacial debonding, a parametric analysis was conducted by varying the cement elastic modulus while keeping other model parameters constant. Four elastic modulus values (5, 10, 15, and 20 GPa) were selected to analyze the debonding behavior at the second interface (cement/formation) under casing eccentricity conditions.
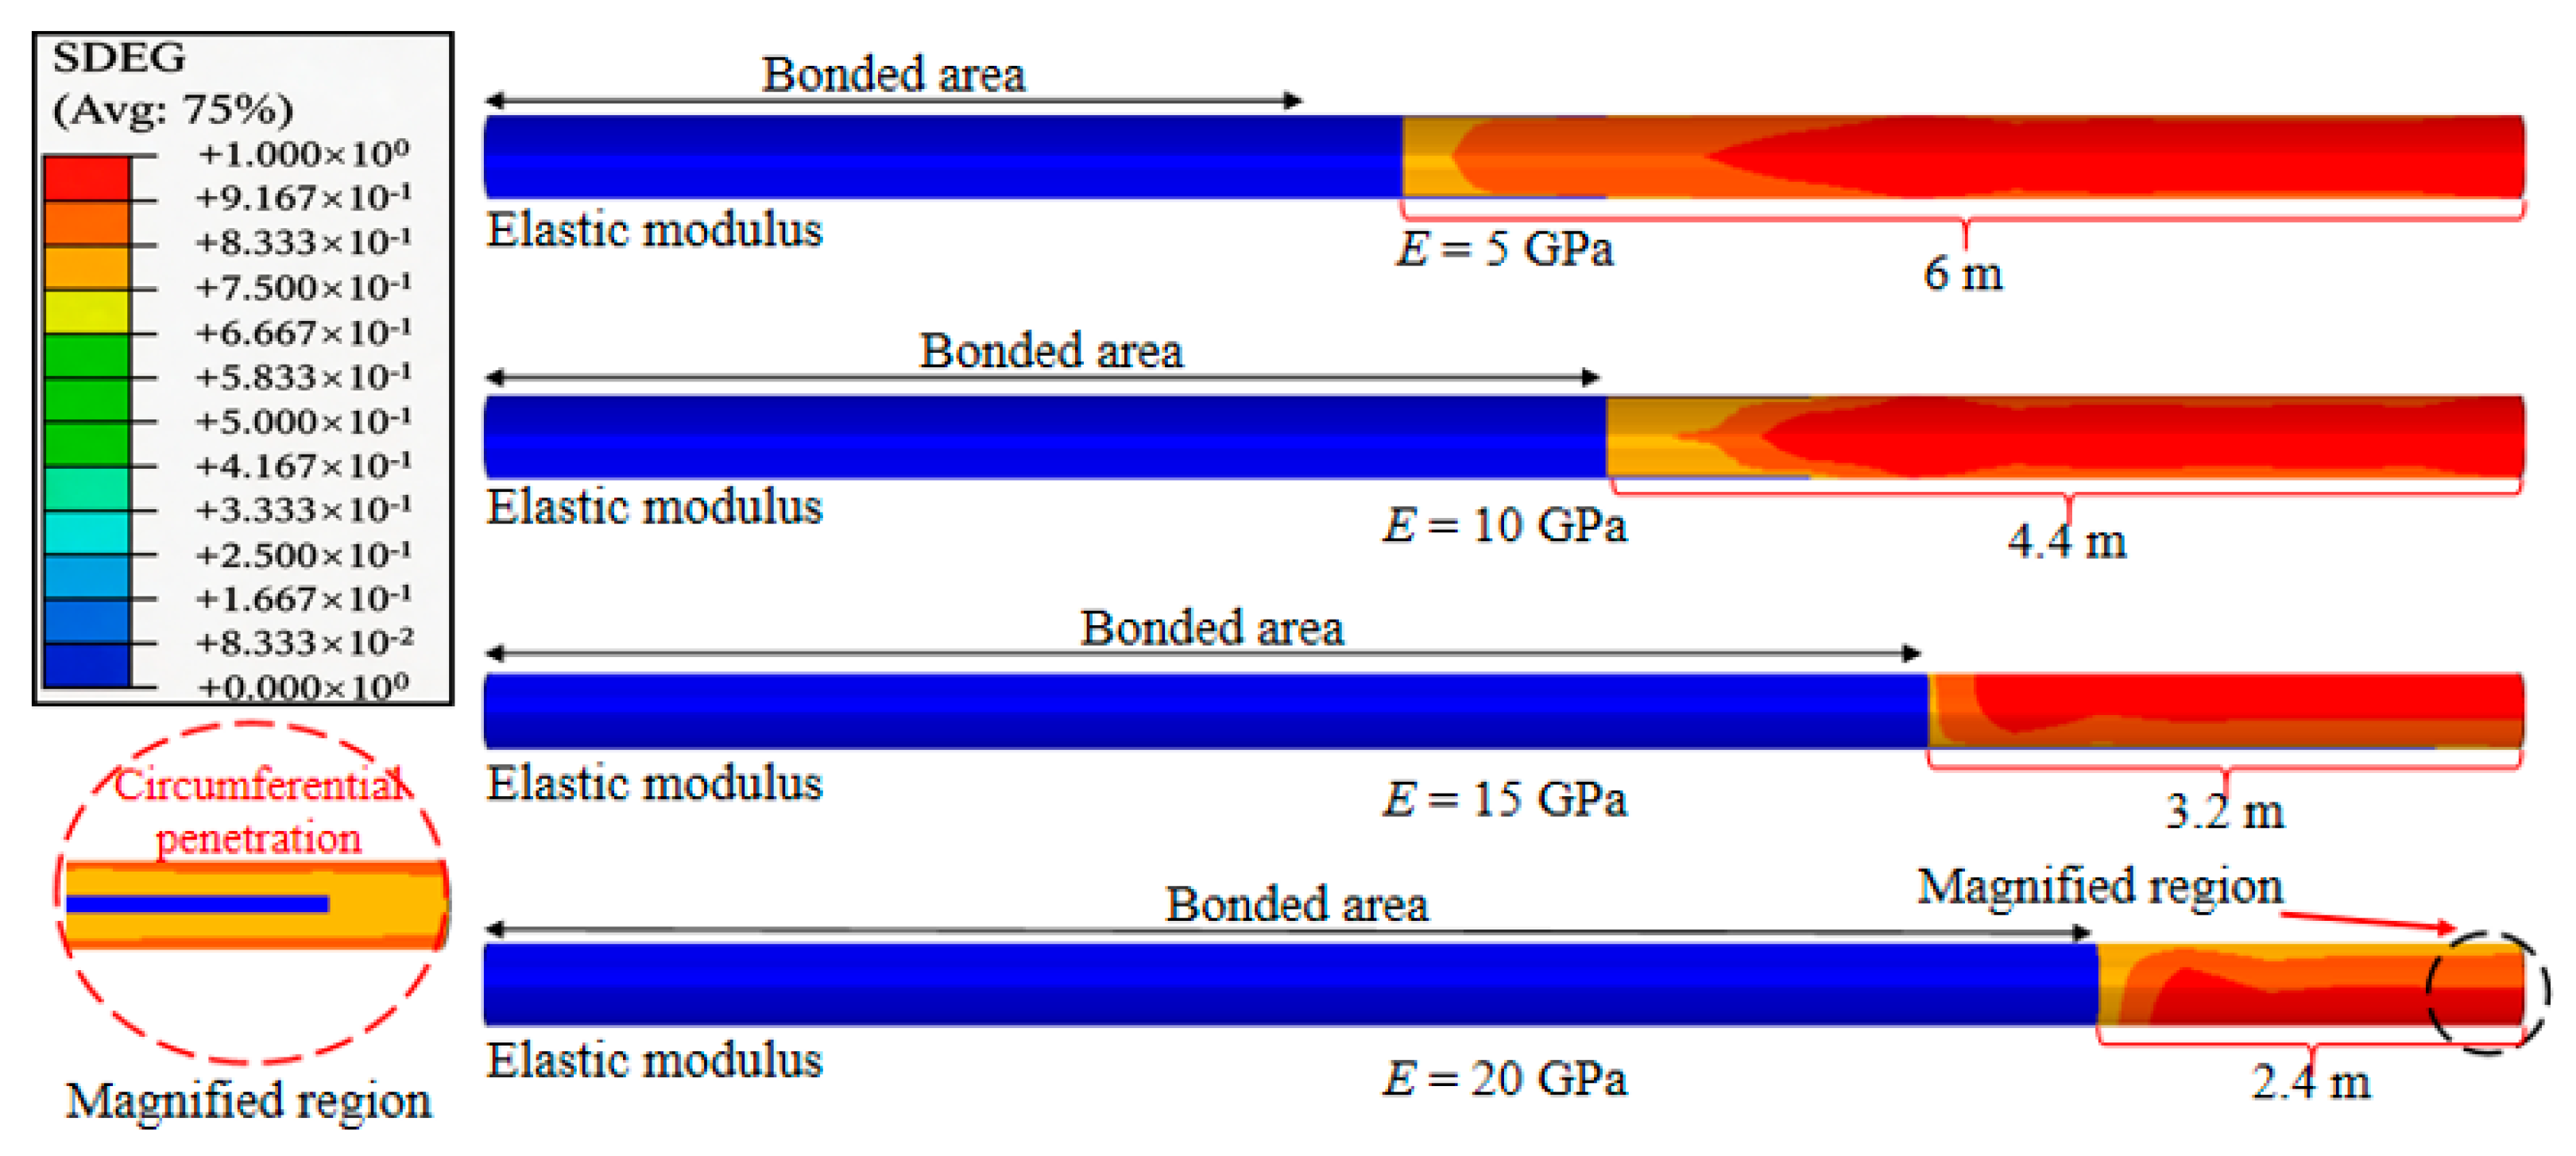
A significant influence of the cement elastic modulus on the damage propagation behavior at the second interface (cement/formation) under casing eccentricity conditions is shown in
Figure 18. In terms of the overall trend, a distinct inverse correlation between the Young’s modulus of the cement and the axial extent of the interfacial failure zone is demonstrated. Specifically, when the elastic modulus is 5 GPa, a damage zone length of 6.00 m is recorded. This damage length is decreased to 4.40 m when the modulus is increased to 10 GPa. With further increases to 15 GPa and 20 GPa, the damage length is further reduced to 3.20 m and 2.40 m, respectively. The analysis reveals that increasing the cement’s elastic modulus constitutes an effective means of suppressing interfacial debonding.
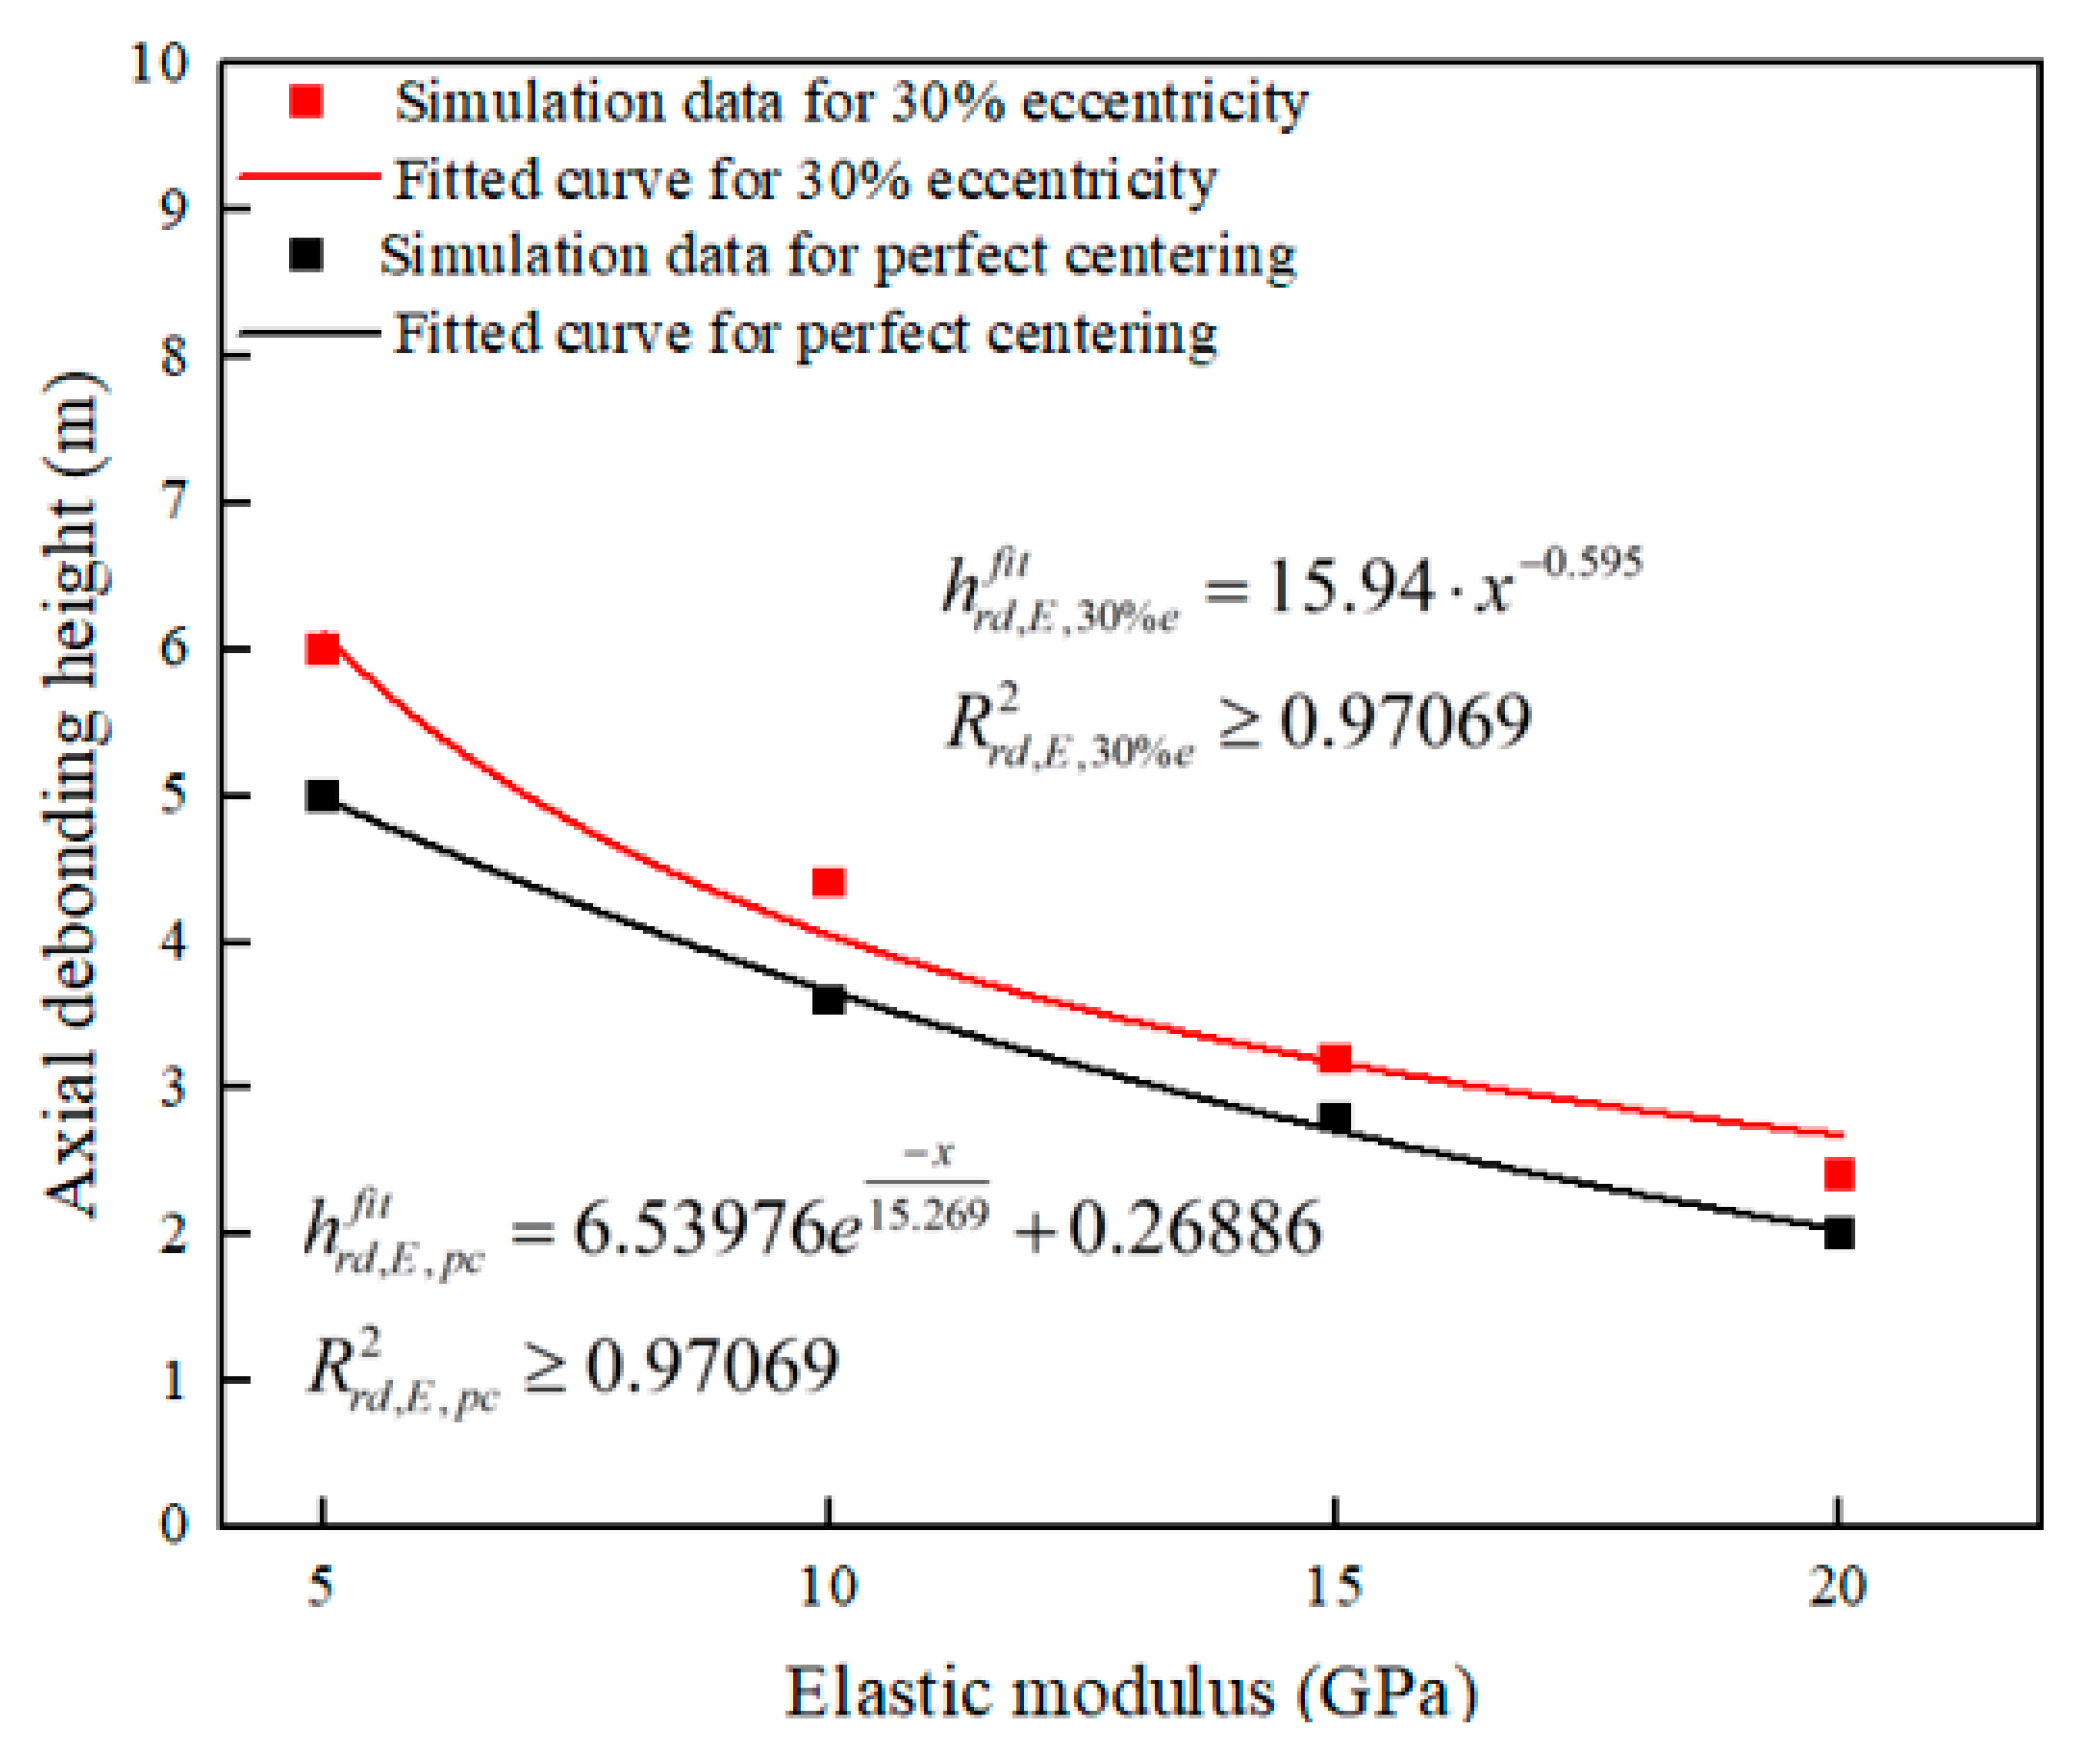
The impact of cement stiffness (Young’s modulus) on the extent of axial decohesion was investigated for both concentric and eccentric wellbore geometries, as plotted in
Figure 19. Based on the fitted curves (12) and (13), a negative correlation is observed between the material stiffness and the longitudinal failure extent in both scenarios, suggesting that a higher elastic modulus tends to suppress interfacial separation within the investigated parameter range. Specifically, regarding the concentric configuration, a reduction in the detachment length from 5.00 m down to 2.00 m is recorded as the Young’s modulus is elevated from 5 GPa to 20 GPa. Conversely, within an identical range of material properties, a more extensive separation length is identified under the eccentric casing scenario. This disparity validates that the severity of failure at the cement–rock boundary is intensified by casing eccentricity, thereby rendering the interface more vulnerable to damage extension. When juxtaposed with the concentric case, the interfacial decohesion behavior is determined to be significantly more severe under eccentric conditions.
where
hrd represents the axial debonding height, in meters; “
fit” denotes the fitted function; 30%
e represents the casing eccentricity;
pc represents the centralized casing condition; and
E represents the elastic modulus of the cement sheath, in GPa.
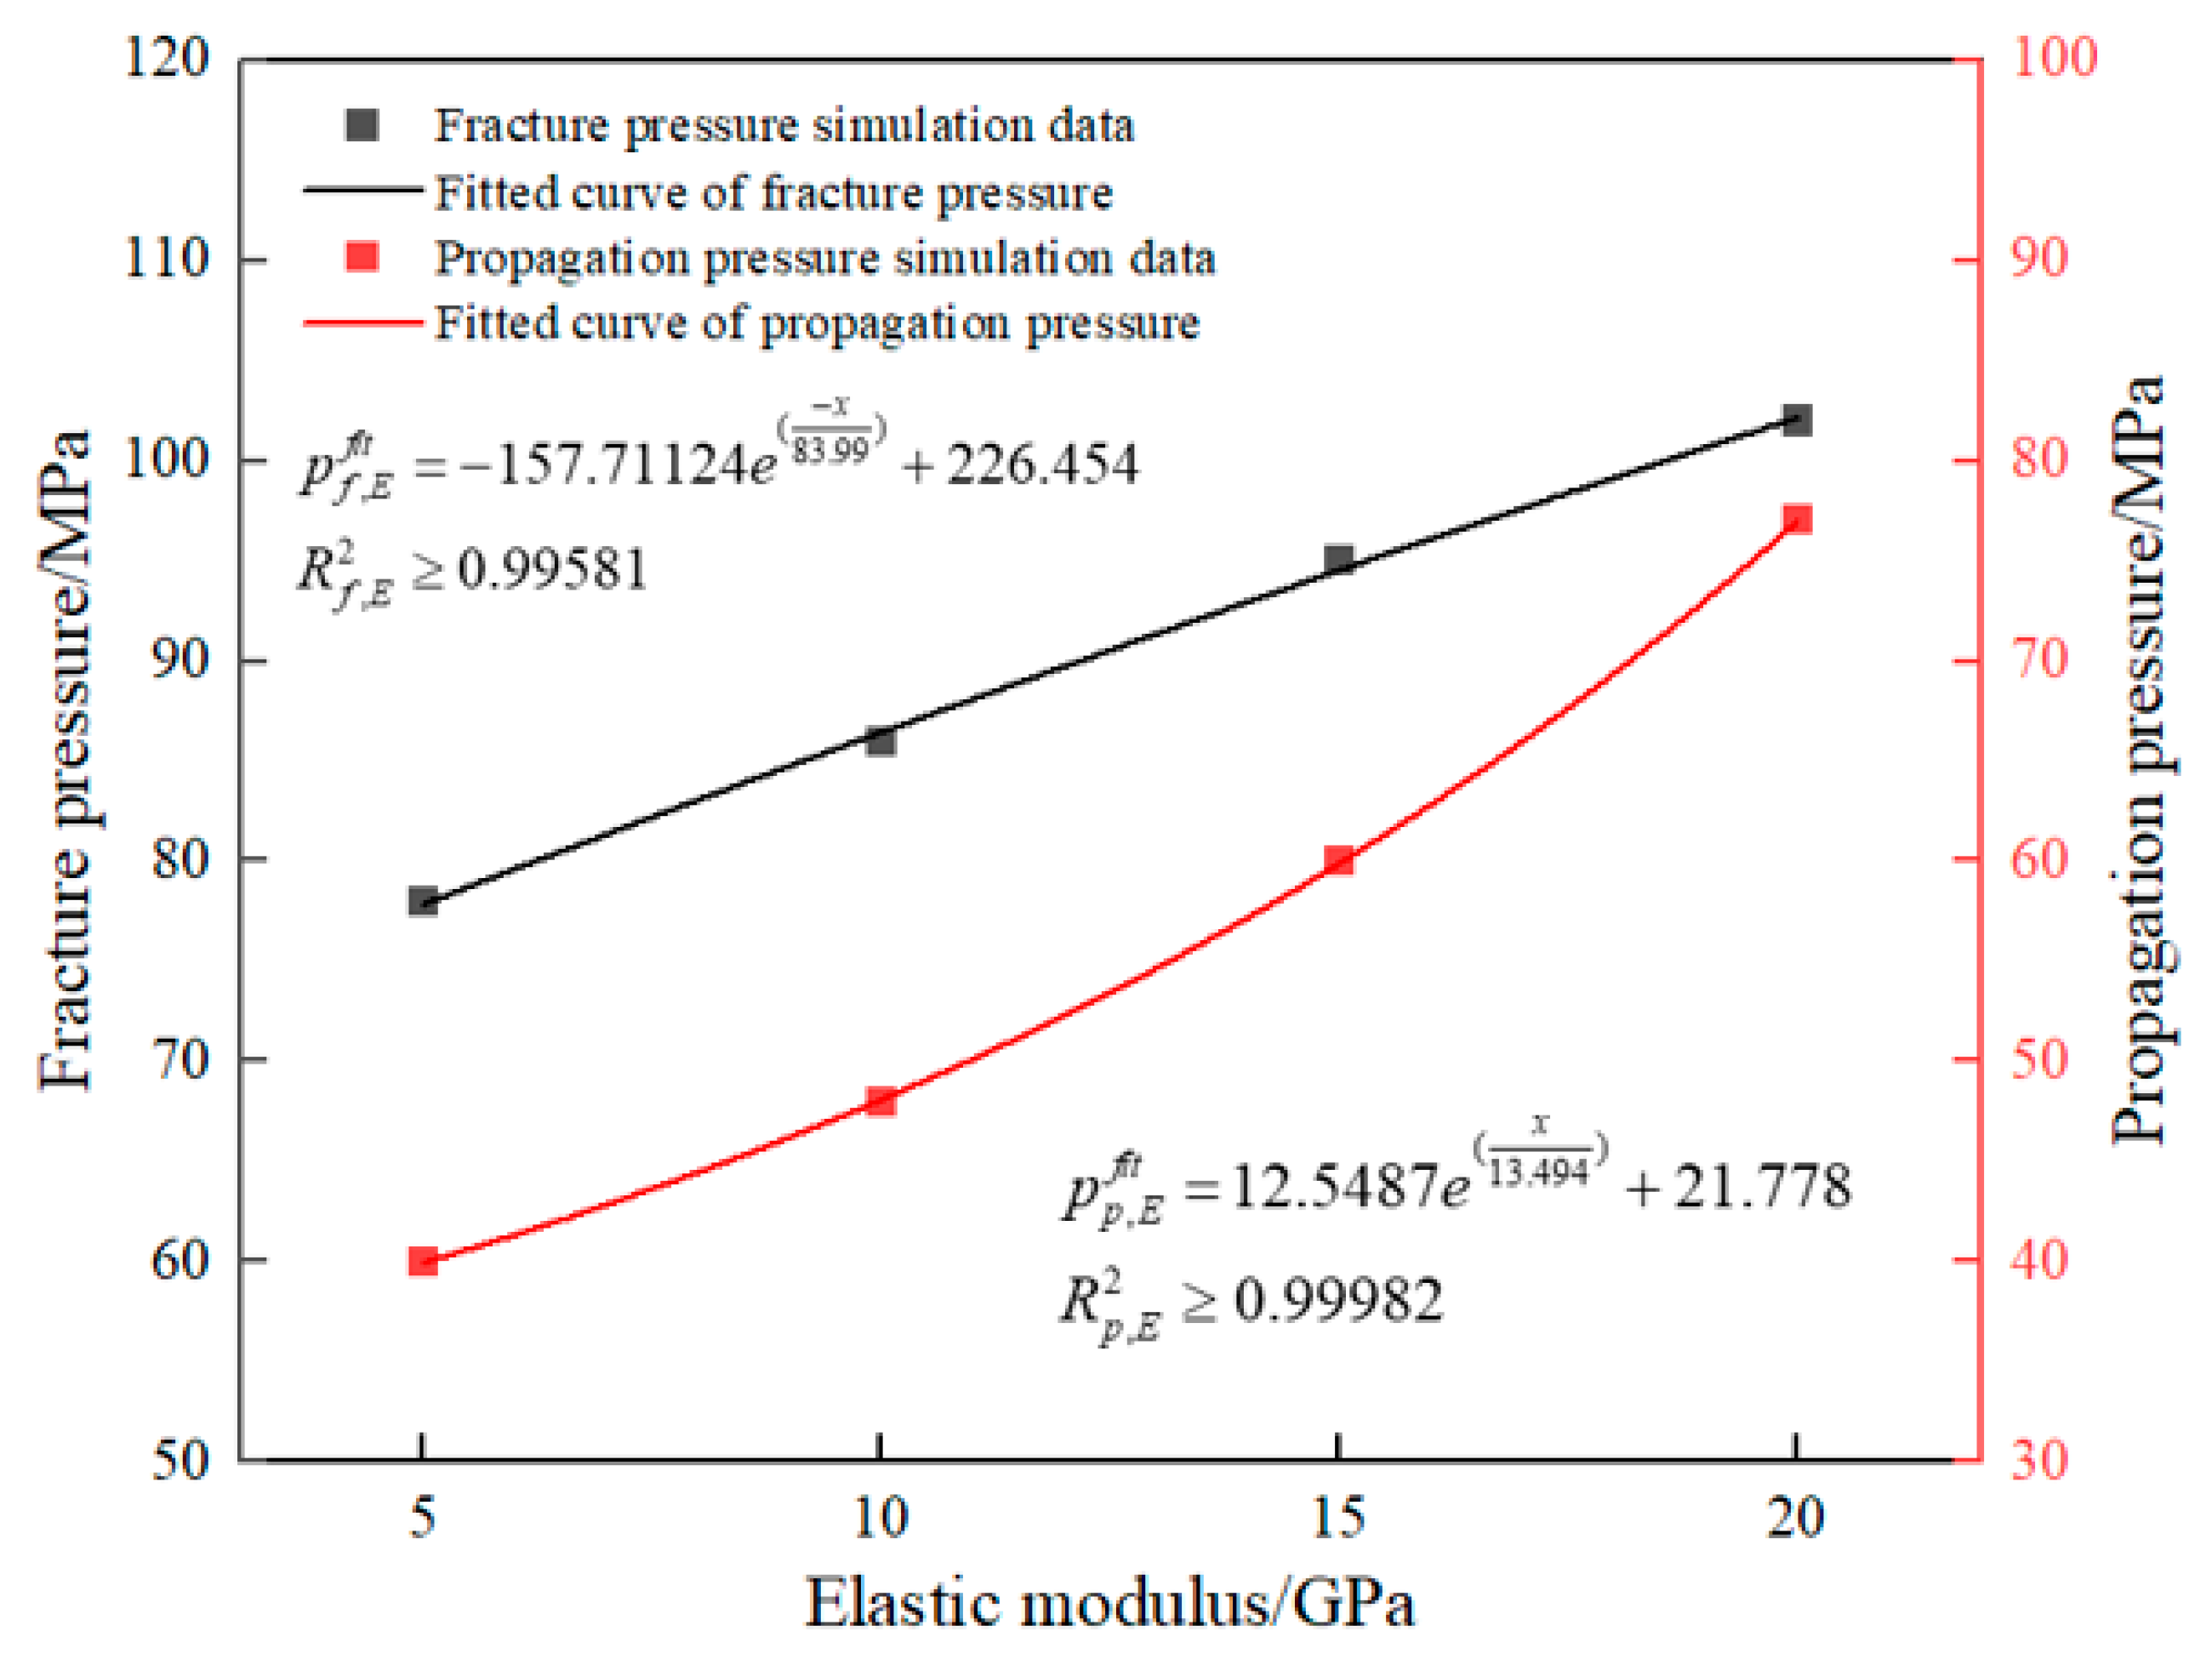
For the scenario of casing eccentricity, the critical pressures required for interfacial fracture initiation and propagation are plotted in
Figure 20 as a function of the cement Young’s modulus. From the fitted curves (14) and (15), both pressures are observed to increase significantly with the increase in elastic modulus within the investigated parameter range. Specifically, an exponential growth trend is followed by the breakdown pressure as the elastic modulus rises, having increased from approximately 78 MPa to about 102 MPa when the modulus is raised from 5 GPa to 20 GPa. Similarly, an approximately exponential increasing trend is also exhibited by the propagation pressure, rising from about 40 MPa to around 77 MPa over the same range of elastic modulus variation, with a more pronounced rate of increase being observed in the higher modulus range. It is indicated that the difficulty of both fracture initiation and propagation is raised by an increase in the cement elastic modulus: the interfacial stress distribution is altered by a cement sheath with a higher elastic modulus, thereby increasing the breakdown pressure required for fracture initiation as well as the propagation pressure during subsequent fracture extension, which makes the processes of fracture initiation and propagation more difficult to occur.
where
Pf represents the fracture breakdown pressure, in MPa;
Pp represents the fracture propagation pressure, in MPa; “
fit” denotes the fitted function; and
E represents the elastic modulus of the cement sheath, in GPa.
4.4.3. Influence of In Situ Stress
It is recognized that the mechanical integrity of the second interface (cement/formation) is dictated not only by the constituent materials but also significantly by the far-field stress environment. Consequently, simulations were performed on a model featuring 30% casing eccentricity to capture the fracture evolution subjected to diverse stress scenarios. The primary objective was to determine how the minimum horizontal stress impacts the detachment process. Four discrete stress levels—15, 25, 35, and 45 MPa—were examined while maintaining all other input parameters unchanged.
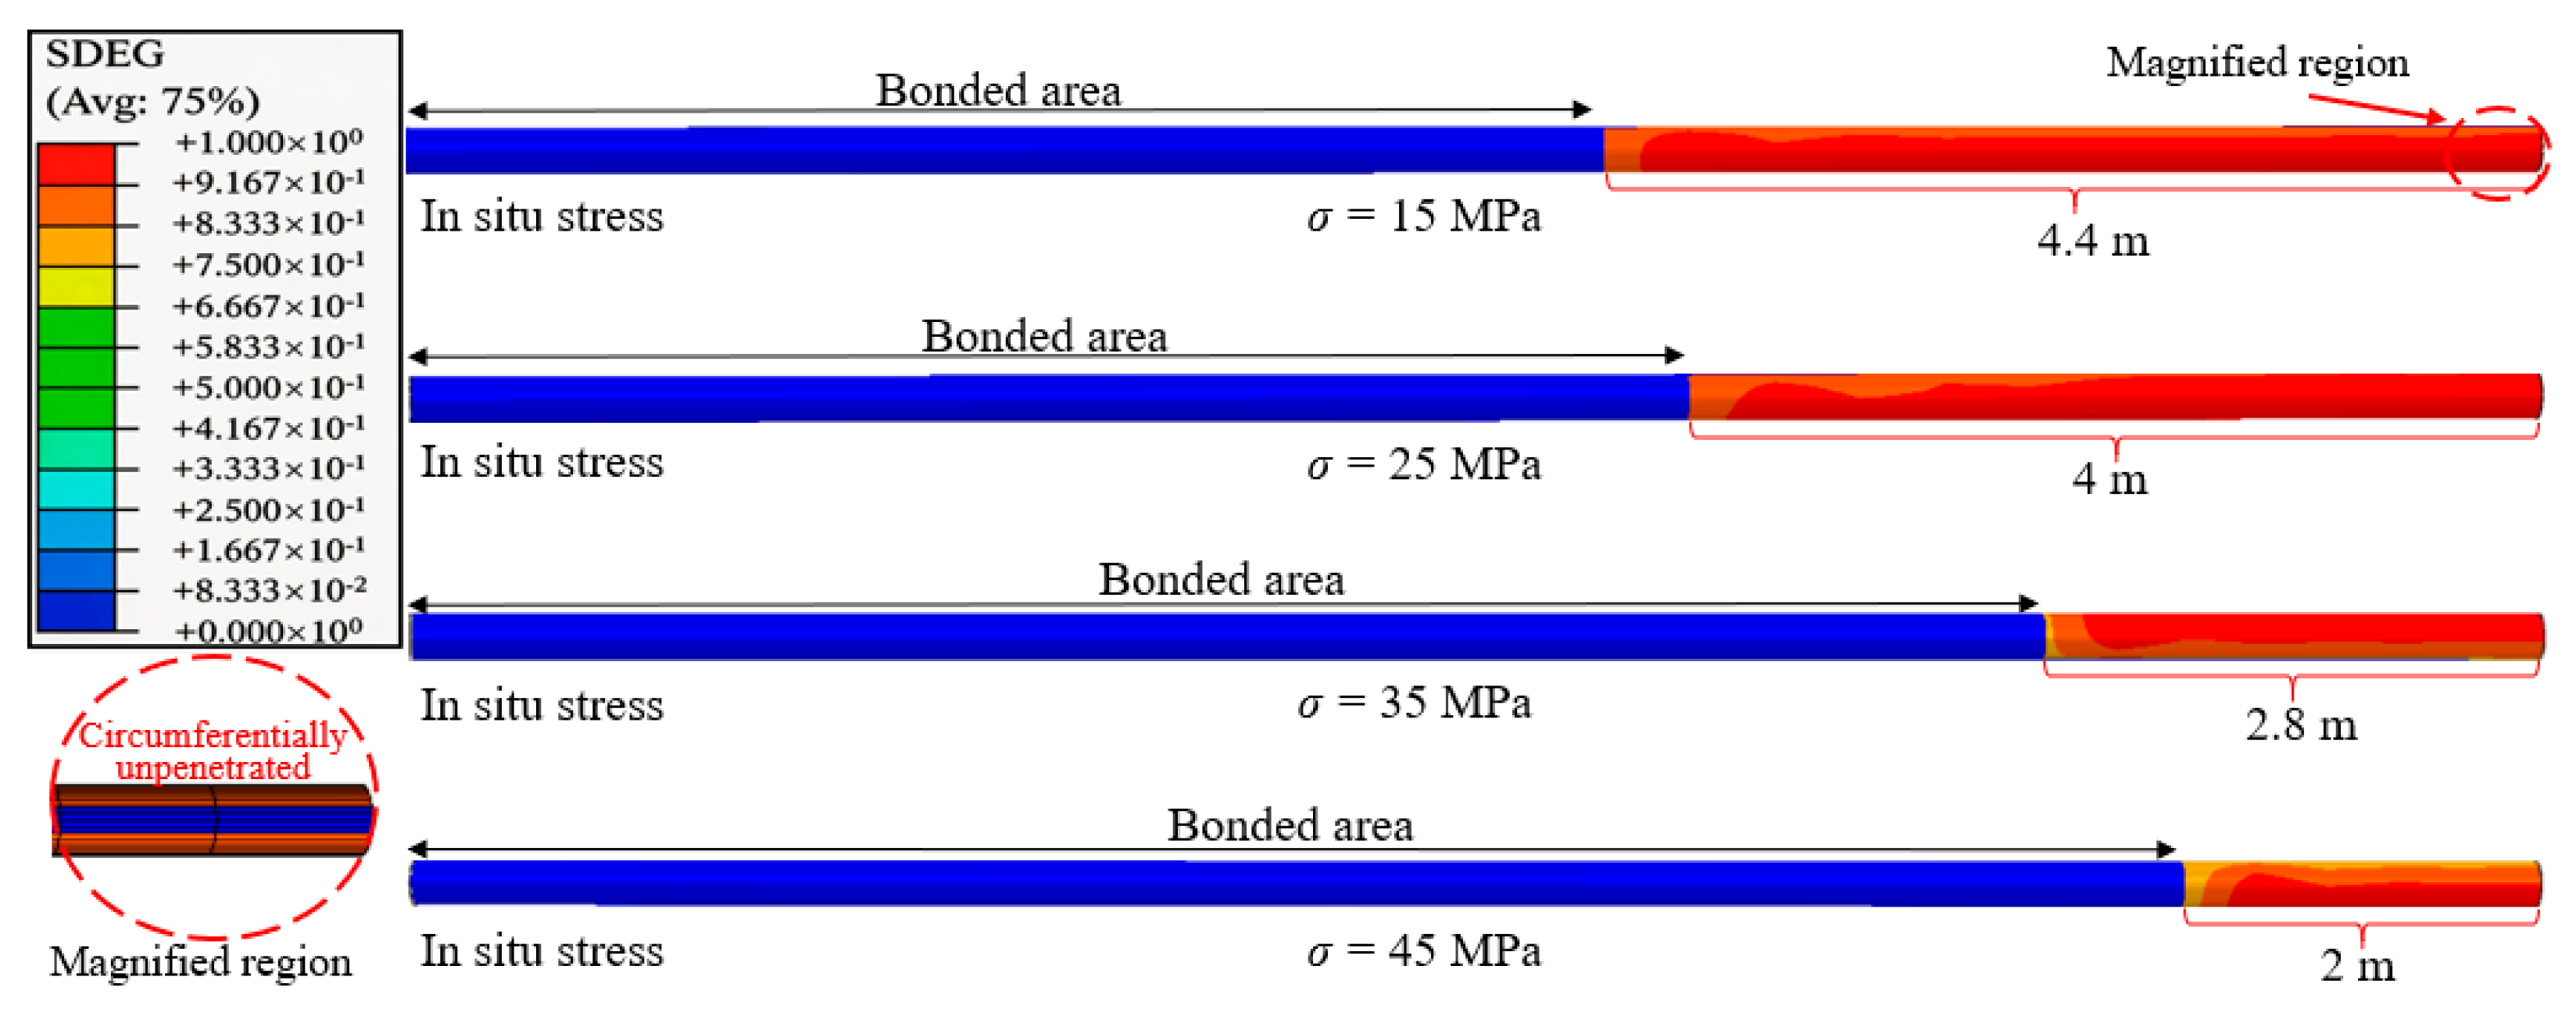
The propagation behavior of fractures at the second interface (cement/formation) under different in situ stress conditions is illustrated in
Figure 21. In terms of the overall variation trend, a significant decrease in the axial propagation length of the interface damage zone is observed as the in situ stress increases. When the in situ stress was 15 MPa, an interface debonding length of 4.40 m was measured. As the in situ stress was increased to 45 MPa, the propagation length was reduced to 2.00 m, representing a decrease of approximately 54.50%. This result demonstrates that an increase in the minimum in situ horizontal stress inhibits debonding at the bonding interface, and the degree of inhibition increases with increasing stress. Further analysis reveals that an increase in the minimum in situ horizontal stress increases the resistance to interface debonding, leading to a deceleration in the debonding rate and a restriction on its propagation extent, thereby significantly reducing the final propagation height.
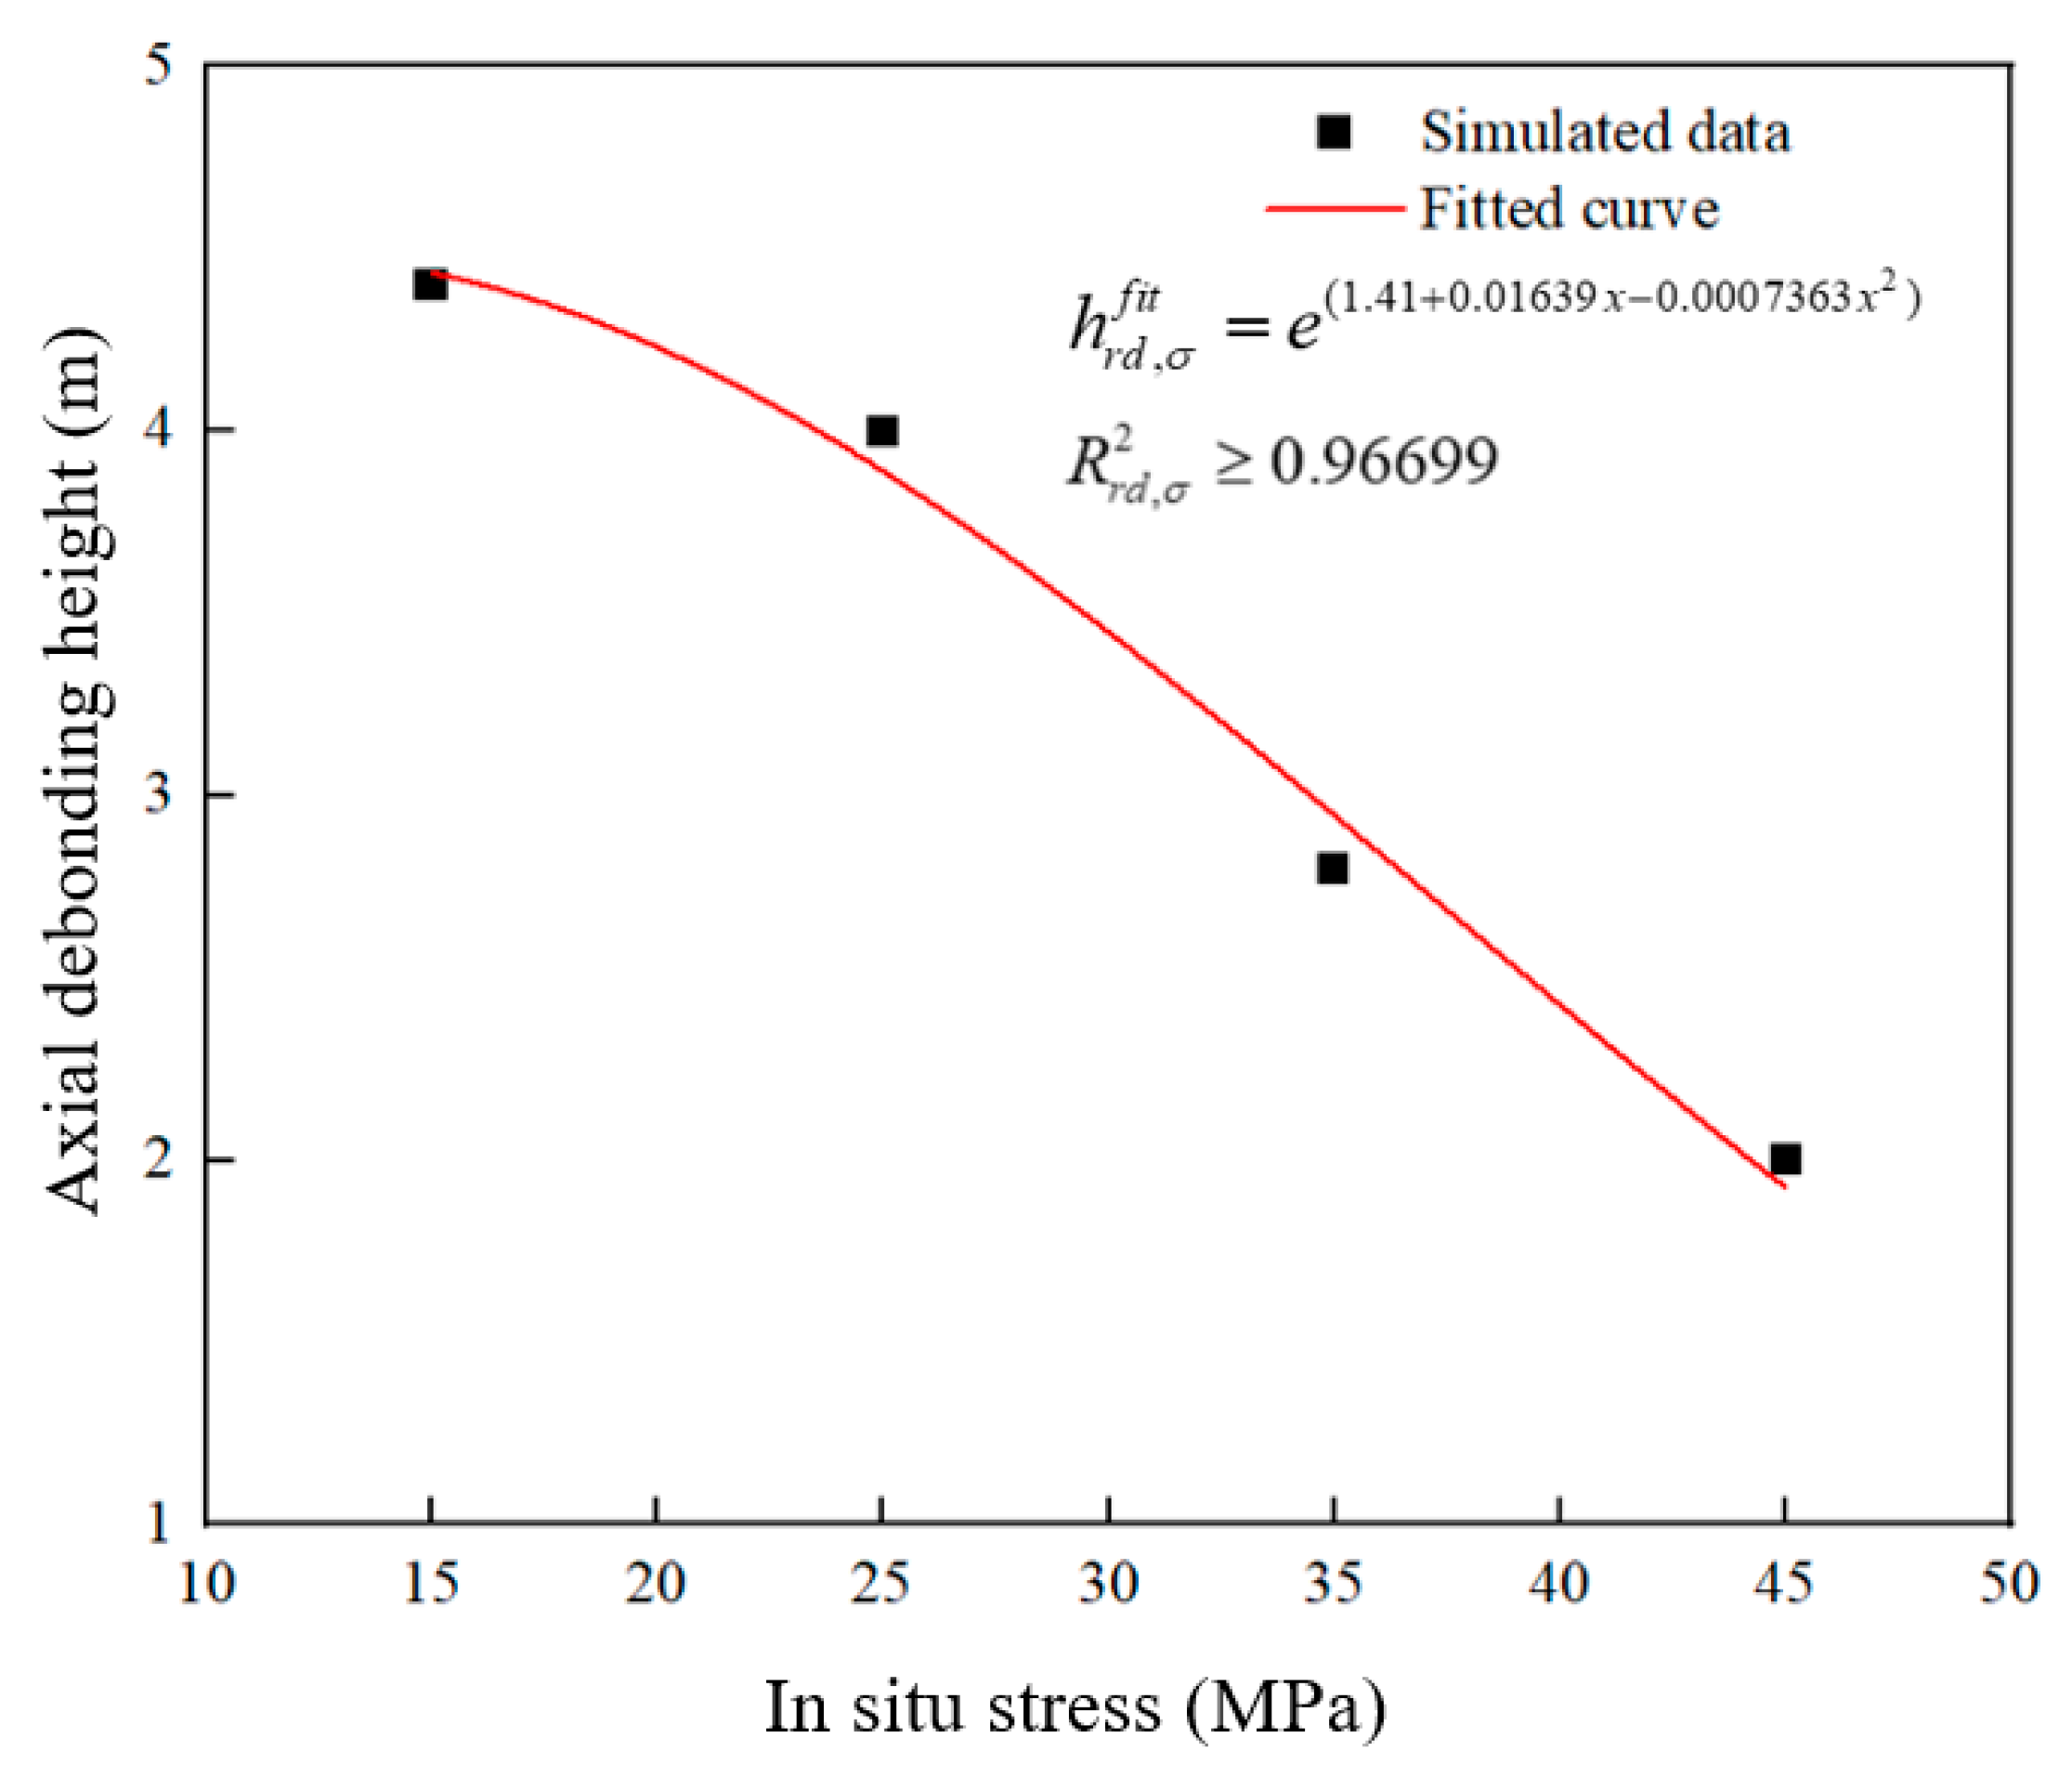
The dependency of the axial decohesion extent on the in situ stress regime is plotted in
Figure 22. As indicated by the fitted curve (16), an inverse correlation is observed between the minimum horizontal stress and the length of the interfacial separation within the investigated stress range. Upon scrutinizing specific stress intervals, a moderate decline in the damaged length is noted between 15 MPa and 25 MPa. However, in the range of 25–45 MPa, the data follows a near-linear trajectory, where a sharp increase in the reduction rate of the decohesion length is recorded. These findings suggest that the propagation of fractures at the second interface tends to be hindered by the minimum horizontal stress under the present model conditions. Additionally, this suppressive Influence appears to become more pronounced with the elevation of the in situ stress magnitude.
where
hrd represents the axial debonding height, in meters; “
fit” denotes the fitted function; and
σ represents the minimum horizontal in situ stress.
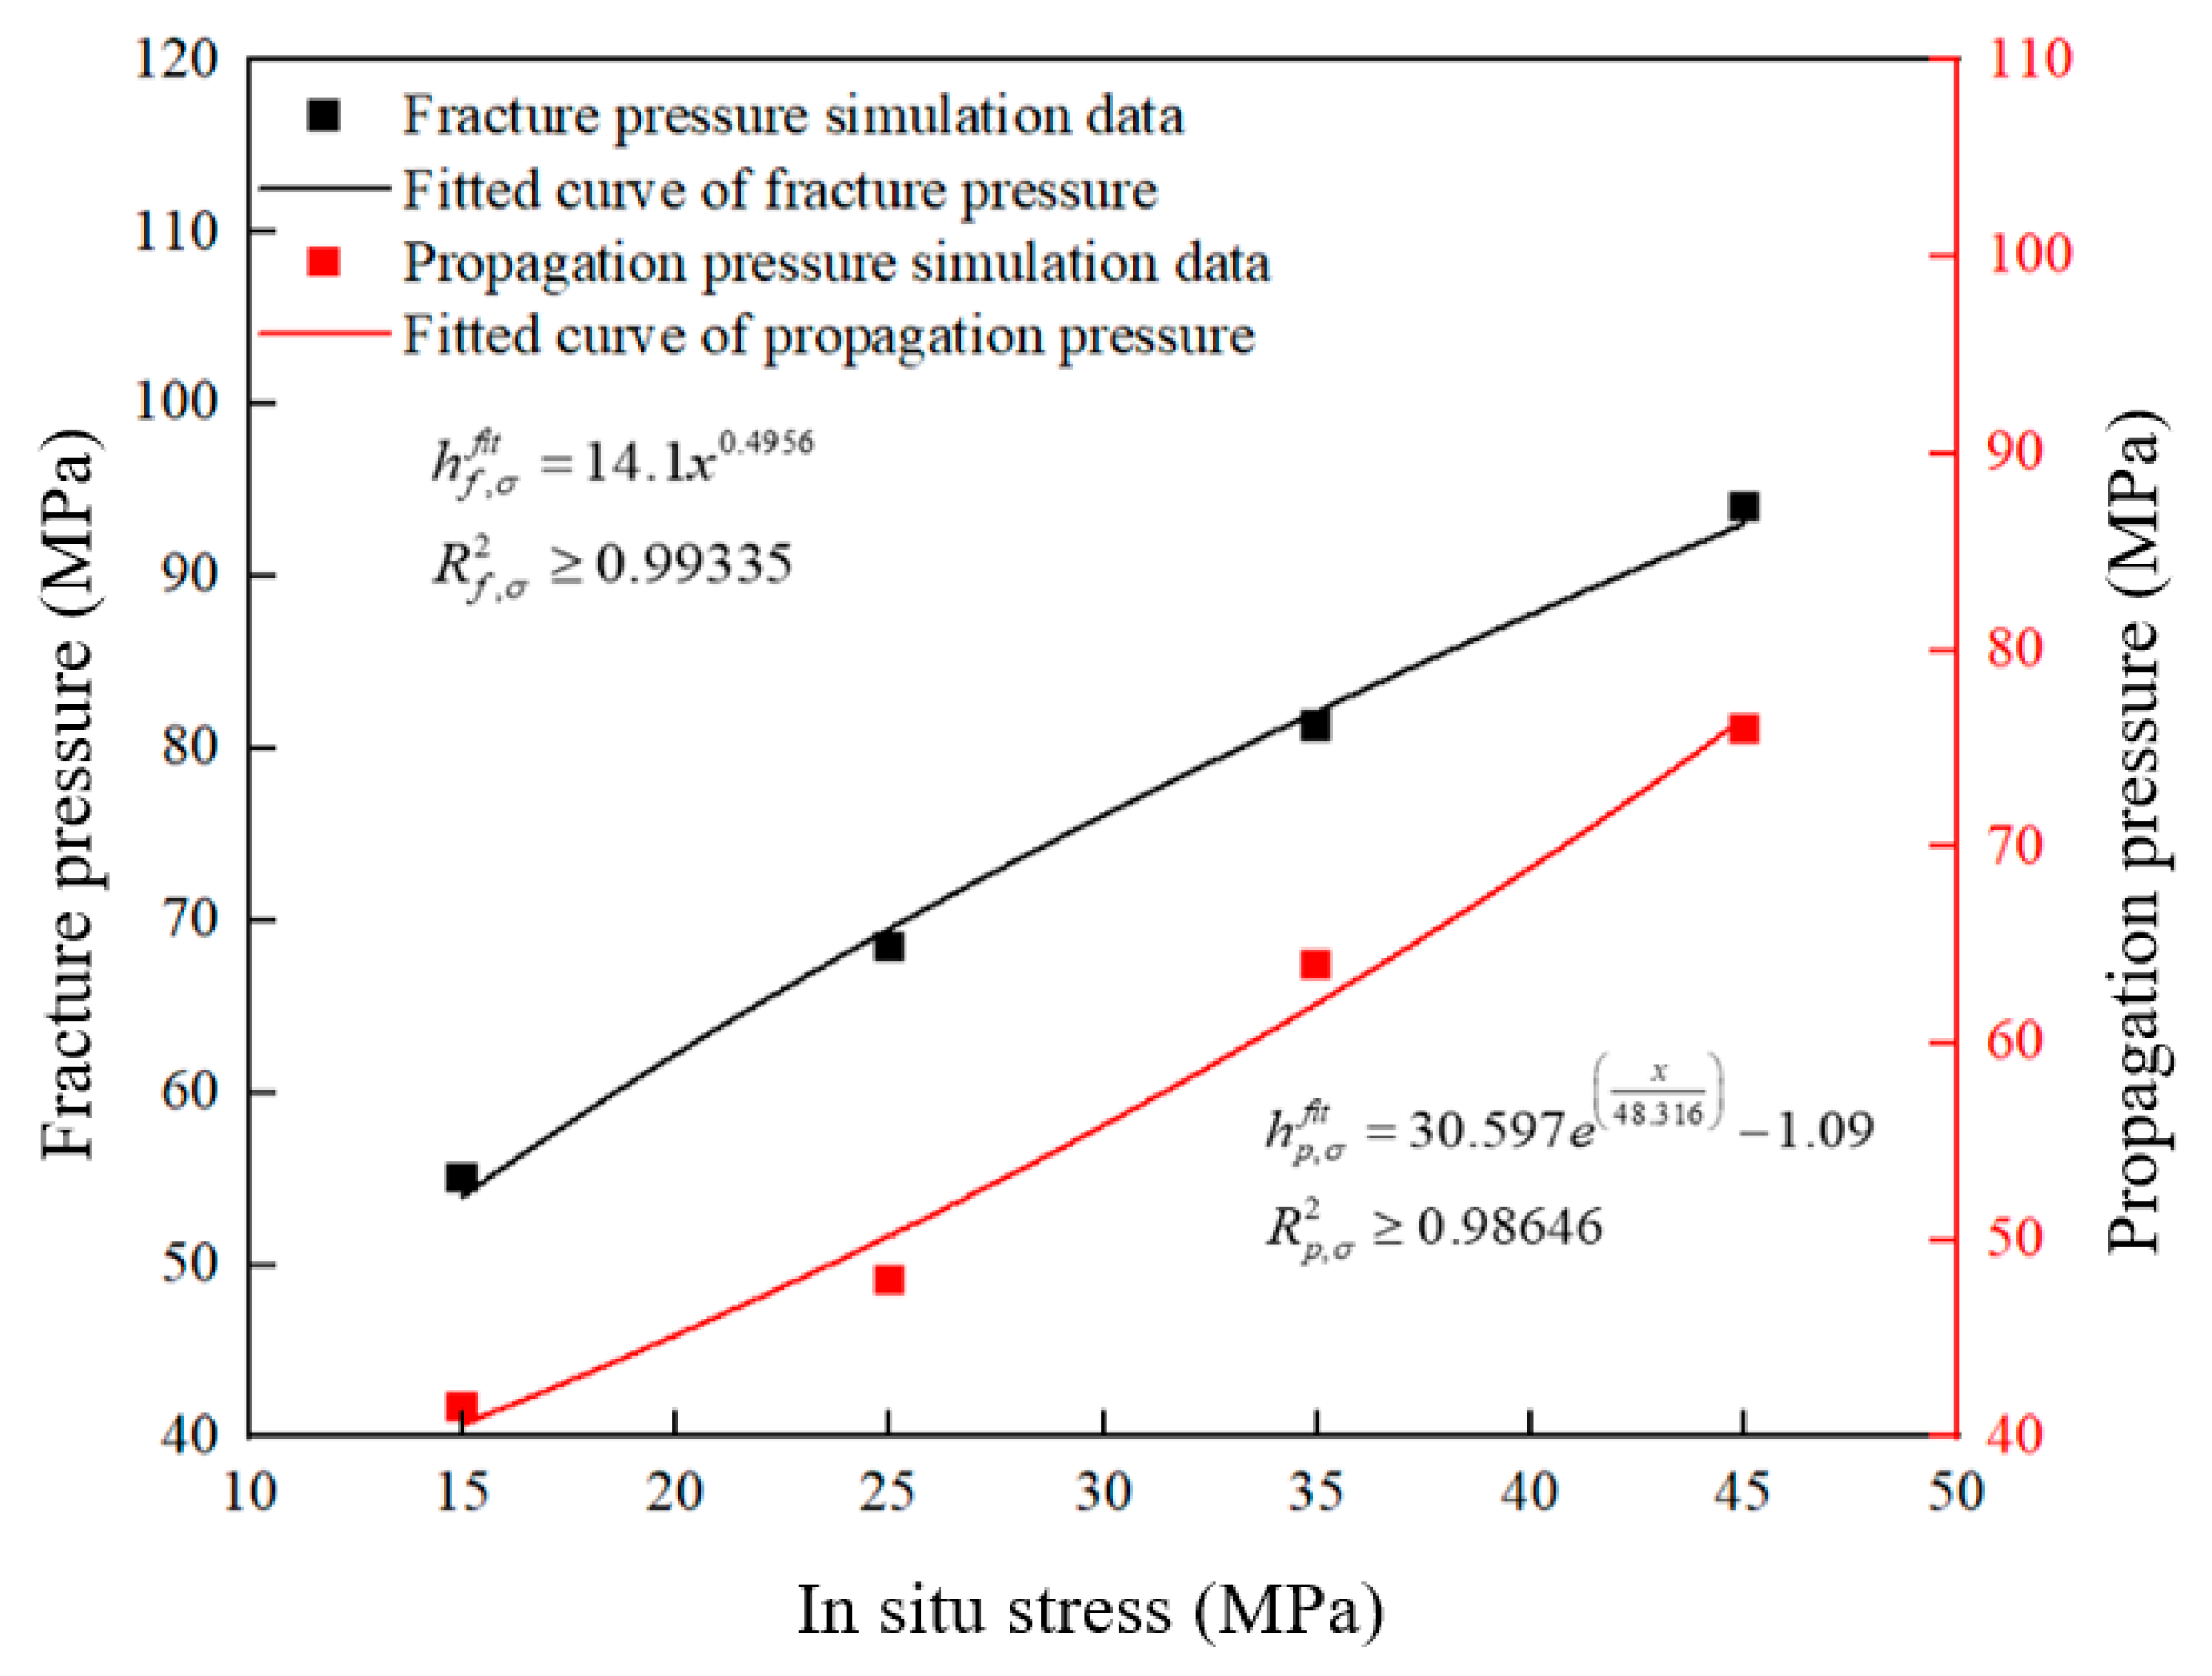
The evolution of the breakdown pressure and propagation pressure of fractures at the second interface under different in situ stress conditions is further revealed in
Figure 23. From the results of the fitting analysis, the breakdown pressure is observed to follow an approximate power-law increasing trend within the investigated stress range, while the propagation pressure shows an approximately exponential increasing trend. It should be noted that Equations (17) and (18) are empirical fitting relationships derived from the present numerical results, rather than universal predictive formulas. As demonstrated by the data in the figure, when the in situ stress is increased from 15 MPa to 45 MPa, the propagation pressure is raised from an initial value of 42 MPa to 76 MPa, representing an increase of 81%; concurrently, the breakdown pressure is elevated from 55 MPa to 93 MPa, corresponding to a 69% rise. A continuous upward trend with increasing in situ stress is exhibited by both the breakdown pressure and the propagation pressure, suggesting that the mechanical constraints imposed on the interface debonding process are progressively strengthened. The difficulty of debonding at the bonding interface is closely related to the magnitude of the minimum horizontal in situ stress. Under high-stress environments, both the initiation and propagation of fractures tend to be more strongly constrained, making interfacial debonding less likely to occur within the simulated conditions.
where
Pf represents the fracture breakdown pressure, in MPa;
Pp represents the fracture propagation pressure, in MPa; “
fit” denotes the fitted function; and
σ represents the minimum horizontal in situ stress.
4.4.4. Influence of Fracturing Fluid Injection Rate
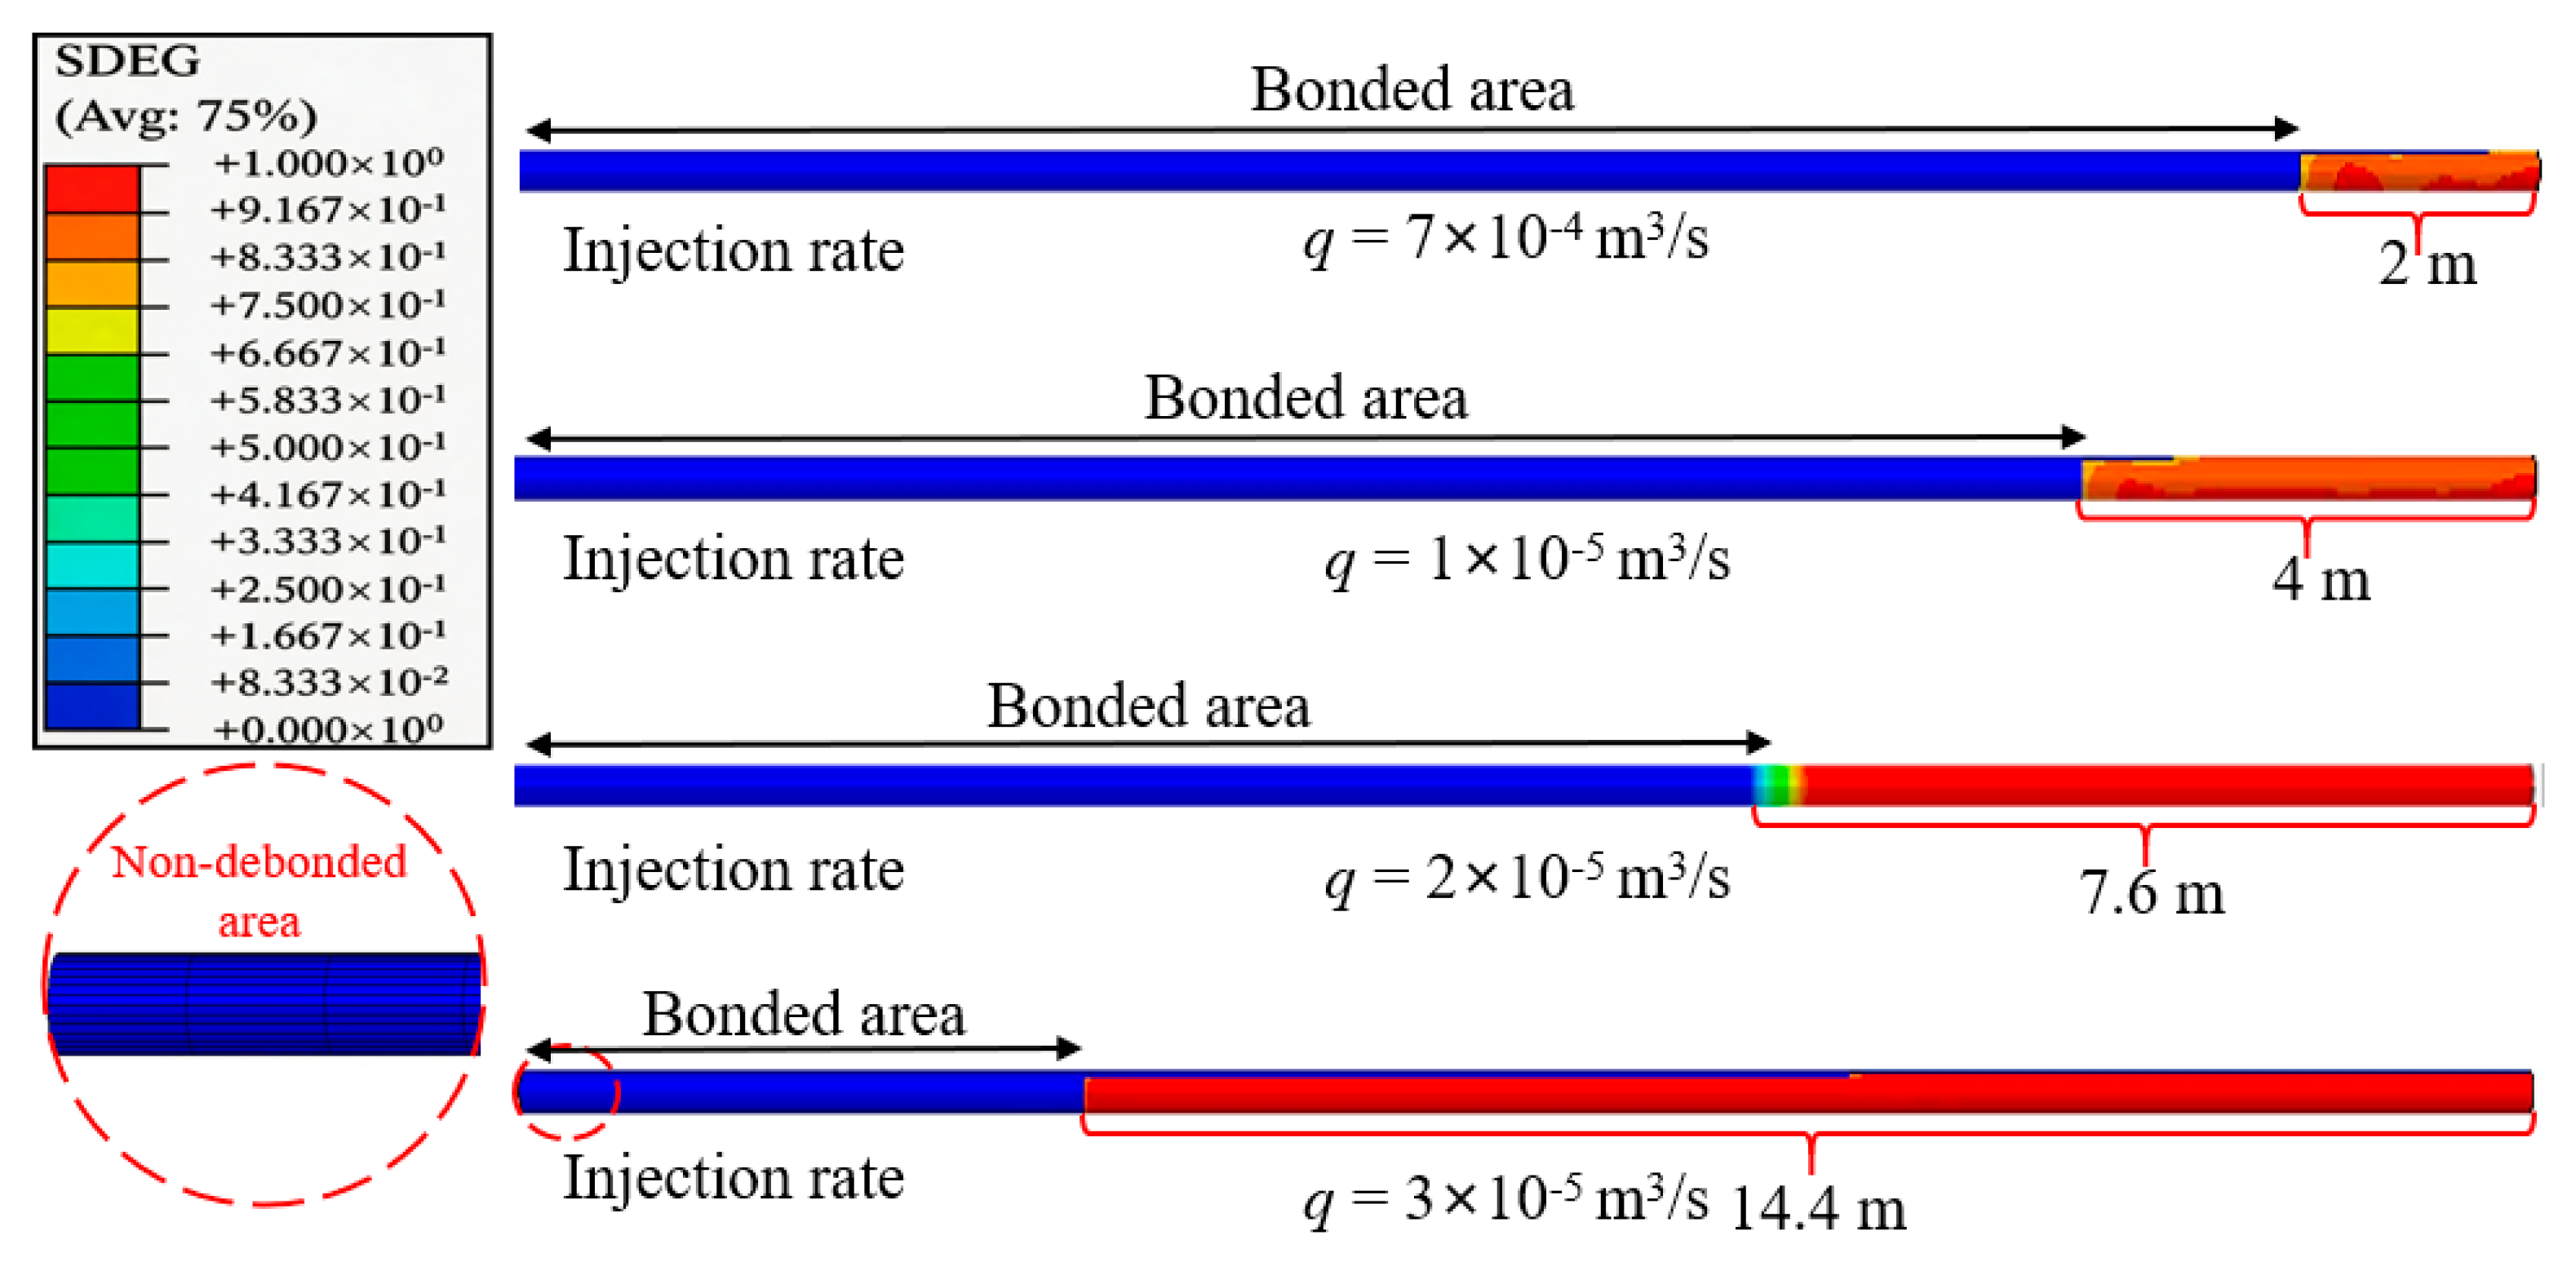
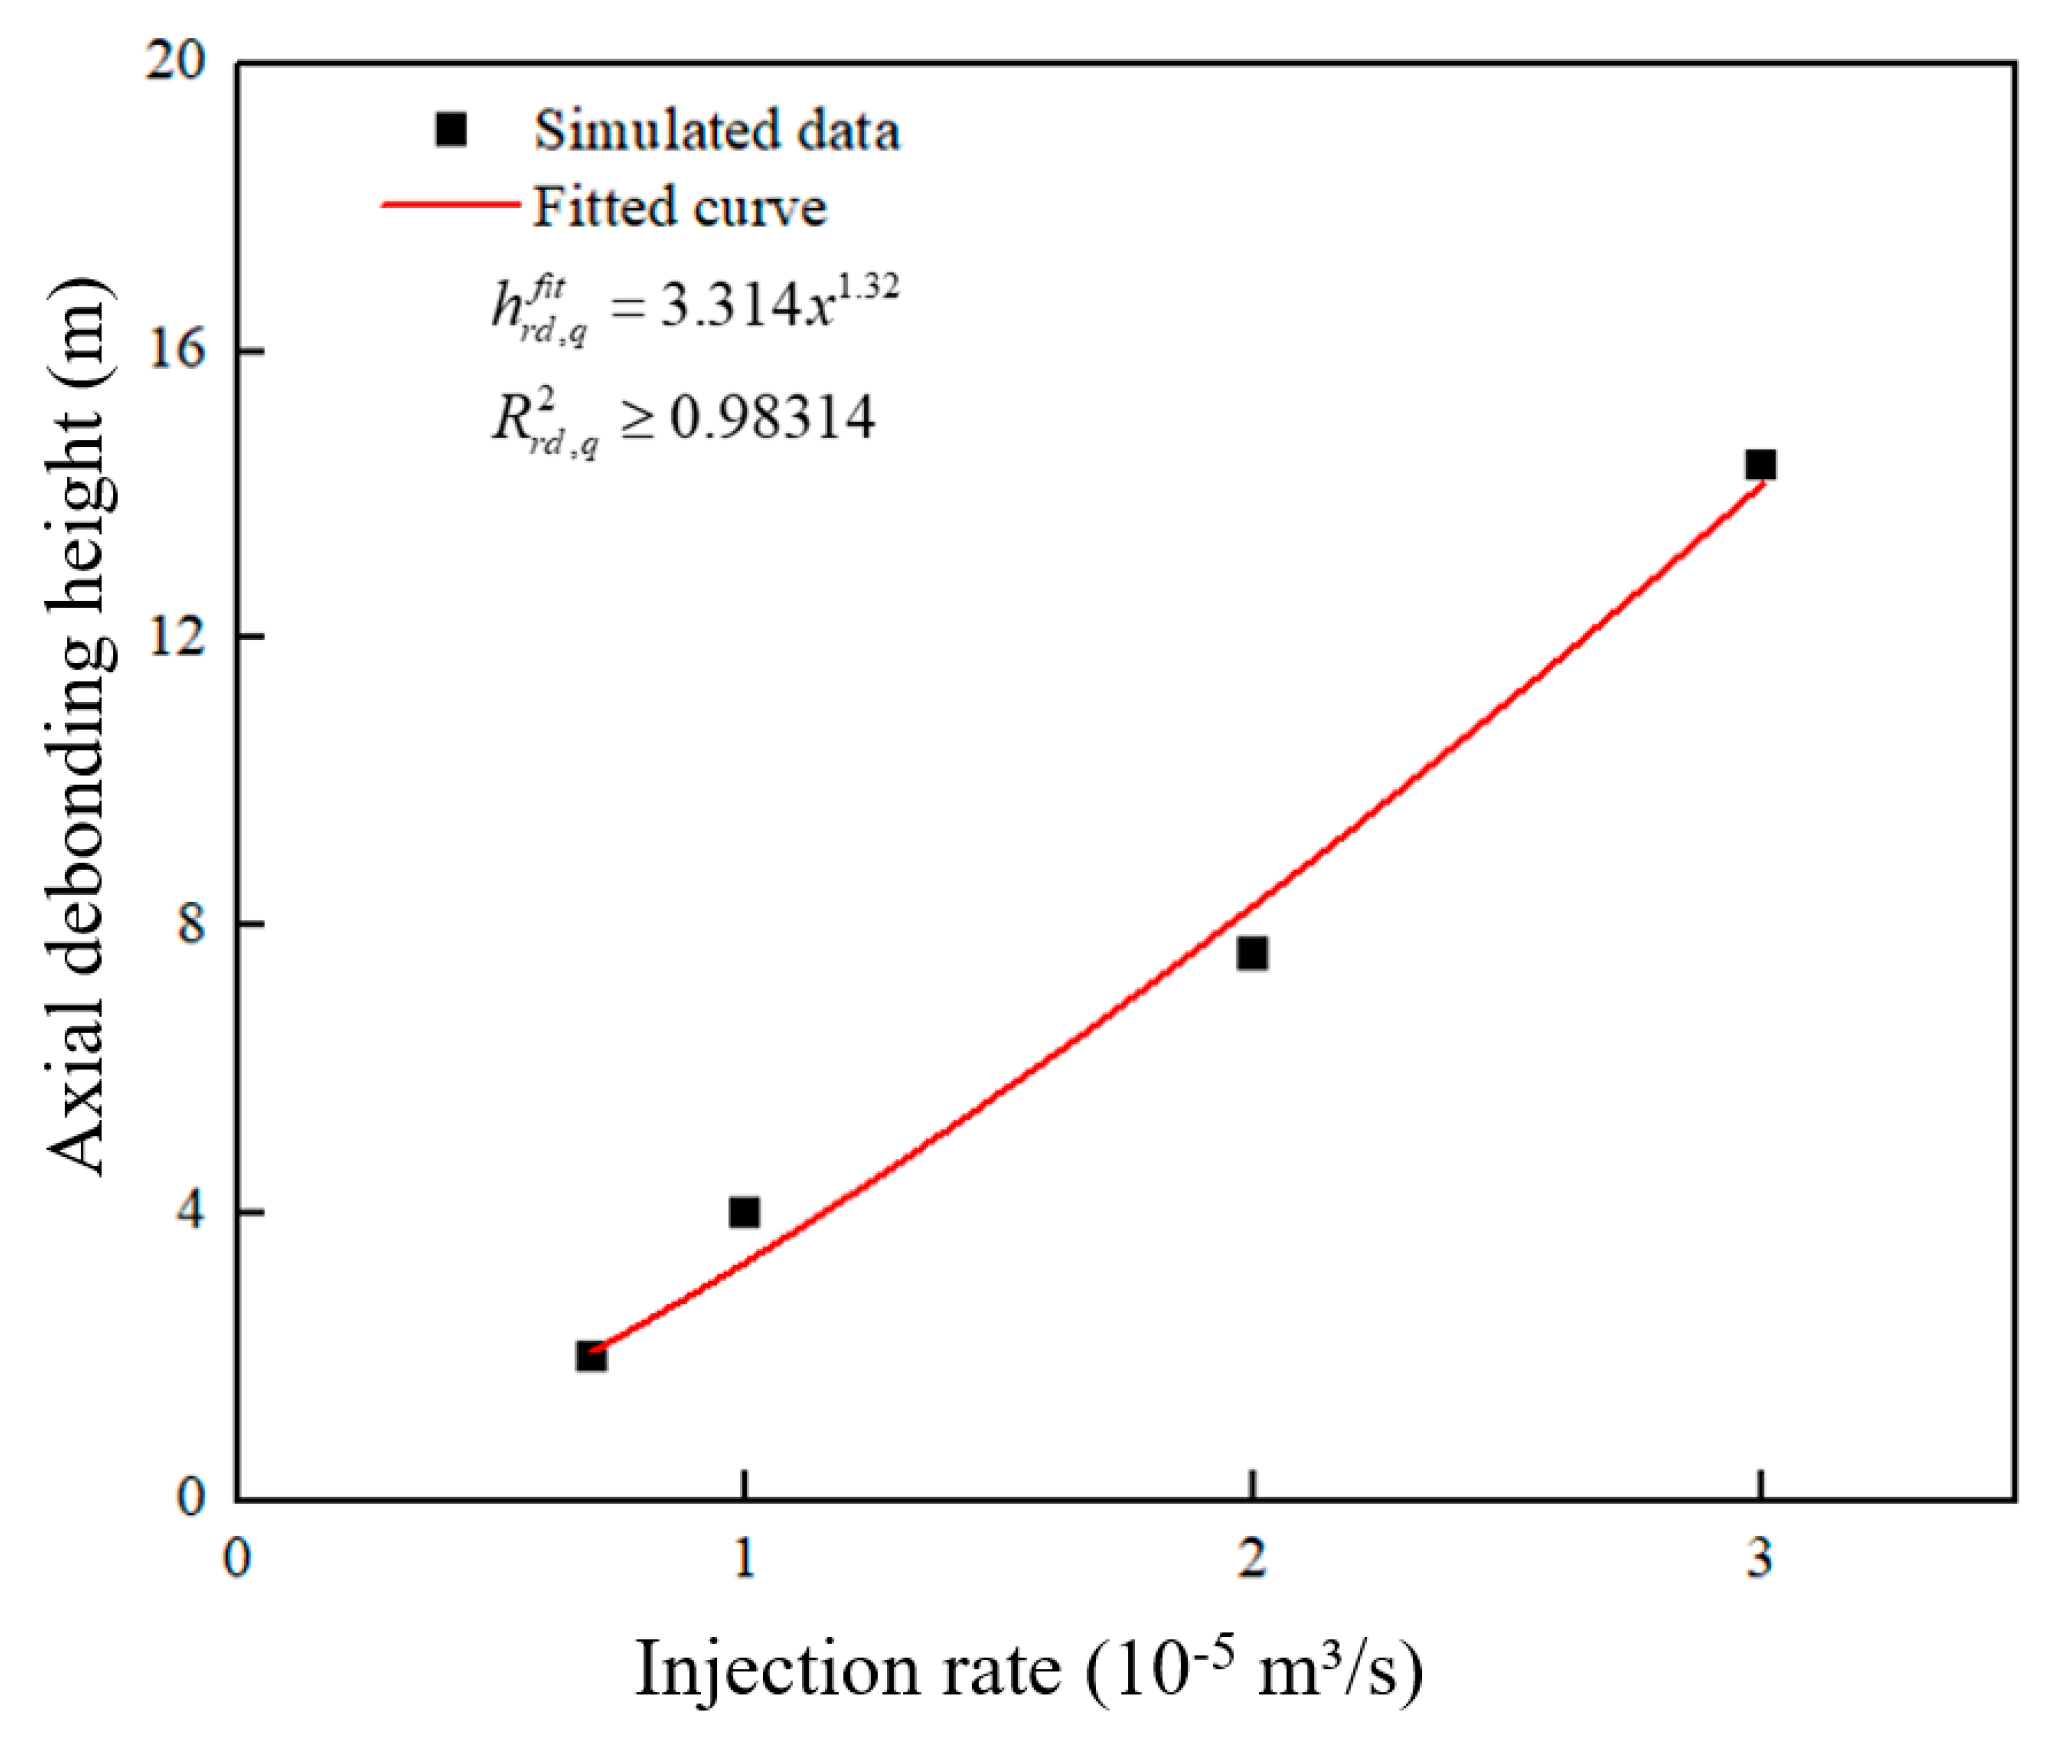
The debonding behavior of the cement sheath–formation bonding interface is not only influenced by material properties and in situ stress but also closely related to the fracturing fluid injection rate. To investigate the effect of this factor, simulations were conducted under casing eccentricity, with all other parameters held constant, examining damage propagation at the interface for four injection rates (7 × 10⁻⁶ m3/s, 1 × 10⁻⁵ m3/s, 2 × 10⁻⁵ m3/s, 3 × 10⁻⁵ m3/s).
The propagation morphology of damage at the second interface under different injection rate conditions is illustrated in
Figure 24, where the red areas represent the fully debonded zones. As the overall trend indicates, the axial propagation height of the interfacial damaged zone increases significantly with higher injection rates. When the injection rate is 7 × 10
−6 m
3/s, the damaged zone height is 2.00 m. A damage height of 14.40 m is attained at an injection rate of 3 × 10
−5 m
3/s, reflecting a significant rise. This result demonstrates that a higher injection rate significantly promotes the debonding behavior at the bonding interface. Further analysis reveals that the driving effect of the fracturing fluid at the interface is enhanced by an increased injection rate, which intensifies the initiation and propagation of interface damage, consequently leading to a significant increase in the debonding length of the bonding interface.
The axial decohesion length along the cement–rock boundary is plotted as a function of the fracturing fluid pumping rate in
Figure 25. A power-law-like increasing trend within the investigated pumping-rate range is indicated by the fitting results. With an increase in the injection rate, a significant rise in the debonding height is observed, suggesting that debonding at the bonding interface tends to be promoted by a high injection rate under the present model conditions. This effect is likely associated with the enhanced hydraulic driving force of the fracturing fluid at high injection rates, which may facilitate interfacial damage development and fracture propagation.
where
hrd represents the axial debonding height, in meters; “
fit” denotes the fitted function; and
q represents the injection rate, in m
3/s.
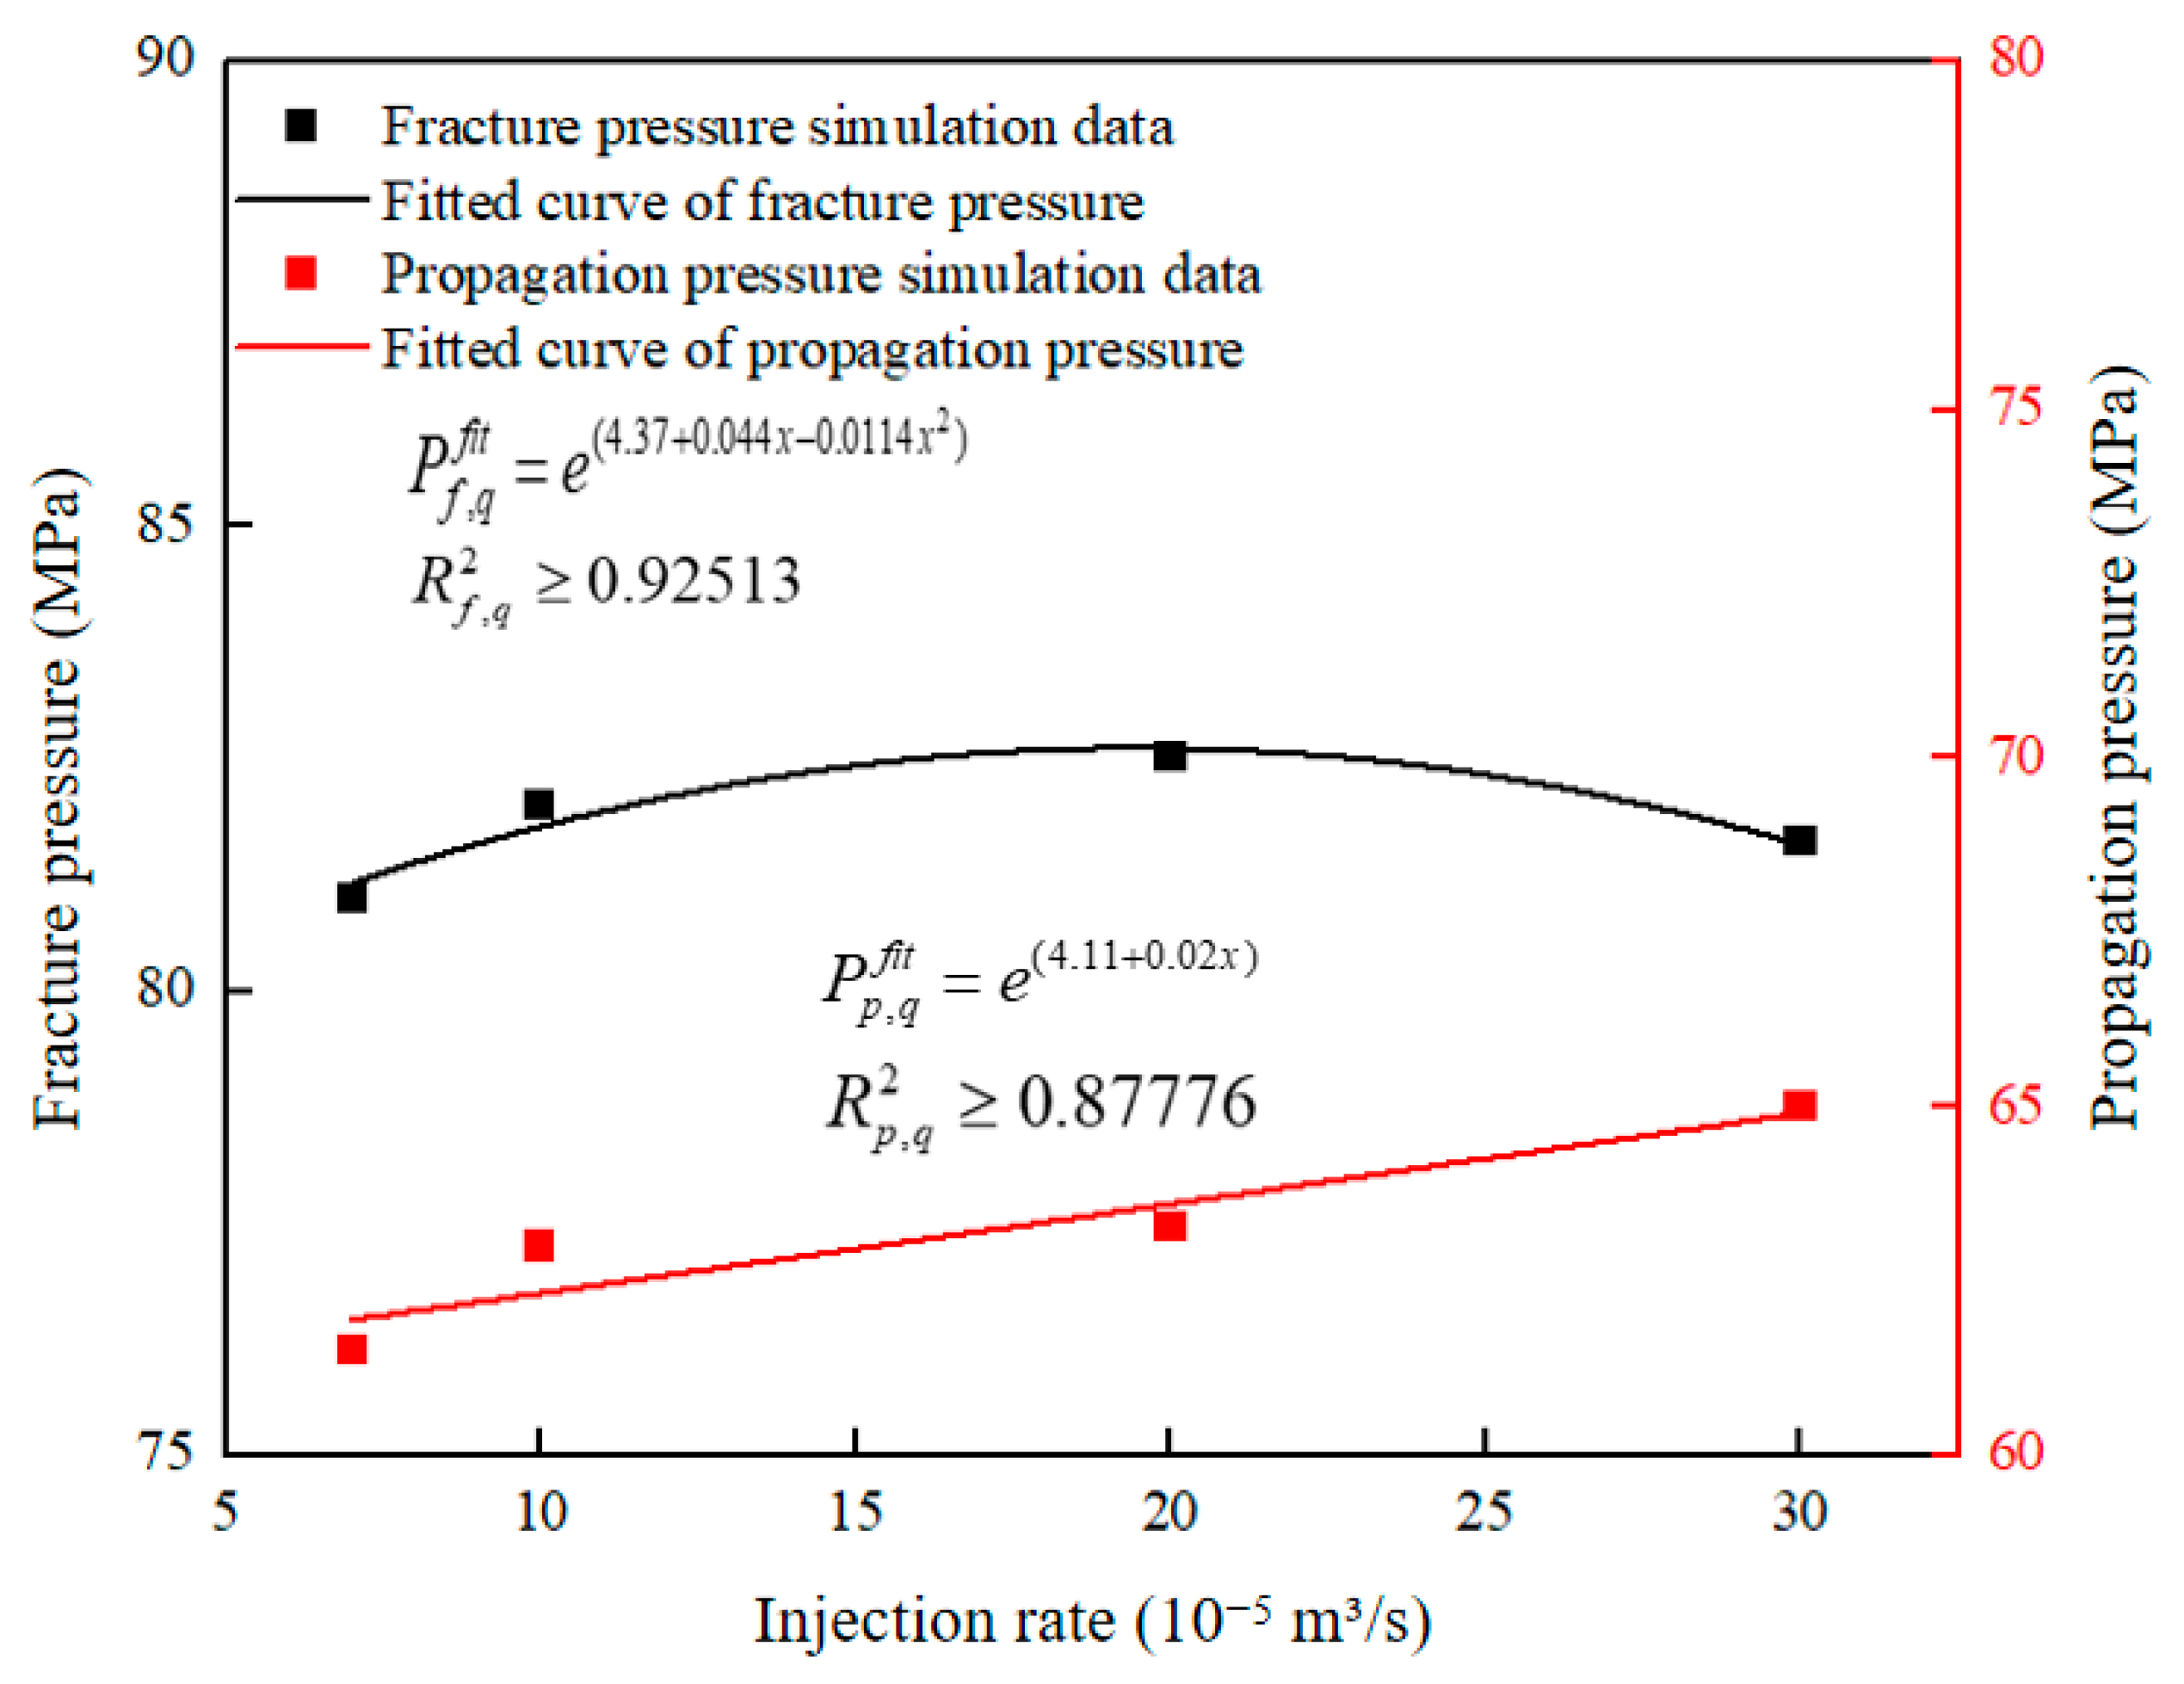
The variation in fracture initiation pressure and propagation pressure with different injection rates is illustrated in
Figure 26. From the fitted curves (20) and (21), it is indicated that the impact of an increasing injection rate on both the breakdown pressure and the propagation pressure is relatively limited within the investigated injection-rate range. Specifically, the breakdown pressure is not observed to change significantly with an increasing injection rate and exhibits a slight decrease at higher rates. In contrast, the propagation pressure is shown to increase linearly with the injection rate, although the magnitude of this increase remains modest. These results suggest that the injection rate may not be the dominant factor controlling fracture pressure under the present model conditions. During fracturing operations, if channeling is detected, reducing the injection rate may help alleviate the channeling tendency, but its effectiveness should be further evaluated in combination with wellbore integrity, in situ stress, cement properties, and field monitoring data.
where
Pf represents the fracture breakdown pressure, in MPa;
Pp represents the fracture propagation pressure, in MPa; “
fit” denotes the fitted function; and
q represents the injection rate, in m
3/s.
4.5. Limitations and Future Research Directions
It should be acknowledged that the present study is conducted under an isothermal assumption, which neglects the potential thermal effects arising from the significant temperature discrepancy between the injected fracturing fluid and the surrounding reservoir formation. In real engineering scenarios, the cooling effect of the fluid can induce thermal contraction of the cement sheath, which may further exacerbate interface debonding or lead to the formation of micro-annuli. Consequently, incorporating these thermal impacts by developing a fully coupled thermo-hydro-mechanical (THM) model represents a critical direction for our future research to provide a more comprehensive assessment of wellbore integrity under complex environmental conditions.