Article

Modeling and Box–Behnken Design Optimization for the Efficient Removal of Ibuprofen via Heterogeneous Fenton-like Reactions Using a Fe3O4/HNTs as a Catalyst


by
Erick A. García-García
1,
Adolfo E. Obaya-Valdivia
1,
Jaime Jiménez-Becerril
2,
Julio C. Morales-Mejía
3,
José A. Chávez-Carvayar
4 and
Yolanda M. Vargas-Rodríguez
1,*
1
Laboratorio de Nanomateriales y Catálisis, FES Cuautitlán, Universidad Nacional Autónoma de México, Avenida 1° de mayo S/N, Sta Maria Guadalupe las Torres, Cuautitlán Izcalli 54740, Estado de México, Mexico
2
Departamento de Química, Instituto Nacional de Investigaciones Nucleares, Carretera México-Toluca S/N, La Marquesa, Ocoyoacac 52750, Estado de México, Mexico
3
Departamento de Ingeniería y Tecnología, FES Cuautitlán, Universidad Nacional Autónoma de México, Avenida 1° de mayo S/N, Sta Maria Guadalupe las Torres, Cuautitlán Izcalli 54740, Estado de México, Mexico
4
Instituto de Investigaciones en Materiales, Universidad Nacional Autónoma de México, Circuito Exterior, Investigación Científica S/N, Ciudad Universitaria, Ciudad de México 04510, Mexico
*
Author to whom correspondence should be addressed.
Processes 2026, 14(10), 1609; https://doi.org/10.3390/pr14101609
Submission received: 5 April 2026 / Revised: 5 May 2026 / Accepted: 8 May 2026 / Published: 15 May 2026

Abstract

A Fe3O4/HNTs composite was synthesized, characterized by SEM, TEM, XPS, adsorption–desorption N2, XRD, FTIR, VSM and Zeta potential, and was used for an ibuprofen adsorption and Fenton oxidation study. The response surface methodology (RSM) and Box–Behnken experimental designs were employed. The effects of pH, contact time, ibuprofen concentration, and Fe3O4/HNTs dosage on ibuprofen adsorption were evaluated. Additionally, adsorption isotherms and a kinetic study were performed. The effects of pH, H2O2 concentration, and Fe3O4/HNTs dosage for IBU removal were also studied. The results of ibuprofen adsorption on Fe3O4/HNTs indicate that adsorption was favored at acidic pH. The adsorption followed pseudo-second-order kinetics and a Freundlich isotherm. Under mild conditions (pH 7, 298.15 K) with a Fe3O4/HNTs dosage of 1.5 g L−1 and 0.5 M H2O2, the heterogeneous Fenton-like reaction achieved 99% ibuprofen removal and 60% mineralization. The Fe3O4/HNTs catalyst demonstrated high efficiency for aqueous ibuprofen removal under environmentally mild pH and temperature conditions, and it was easily recoverable and reusable.

1. Introduction

Chemicals of Emerging Concern (CECs) are chemicals recently identified as threats to the environment and human health that require extensive regulation or monitoring [1]. These compounds include pharmaceuticals, industrial chemicals, personal care products, and others that can harm both aquatic and terrestrial ecosystems as well as human health [2]. CECs are often released into the environment through human activities, such as pharmaceutical use, industrial production, and consumer products [3]. Unlike conventional pollutants, which have been studied and regulated for decades, CECs pose additional challenges due to their dynamic nature and the lack of comprehensive data on their long-term effects [4]. For instance, ibuprofen (IBU) is a widely used nonsteroidal anti-inflammatory drug (NSAID) known for its analgesic and antipyretic properties. It is commonly prescribed to relieve fever, pain, rheumatoid arthritis, and osteoarthritis [5]. IBU is consumed extensively in both human and veterinary medicine [6], and it is the third most widely employed drug in the world, with an annual consumption of nearly 200 tons [7]. IBU has been found in water treatment plants in Australia, Canada, Chile, China, Finland, Ghana, Greece, India, Japan, Korea, Mexico, New Zealand, Palestine, Poland, Portugal, South Africa, Singapore, Spain, Switzerland, Thailand, Turkey, United Arab Emirates, United Kingdom, United States, and Vietnam [8,9]. It has also been detected in domestic wastewater in Spain, Denmark, Singapore, the Czech Republic, Germany, the United Kingdom, Sweden, and Mexico [10,11,12,13,14,15,16,17,18,19], and in surface water bodies such as the Madín Dam in Mexico [20,21]. Its presence is primarily due to human and animal excretion and its introduction through wastewater treatment systems. Its removal in wastewater treatment plants (WWTPs) is limited, which favors its release into the environment [7]. This situation is further exacerbated by animal excretion, the disposal of expired medications, and the discharge of untreated water.
IBU has been reported to have several adverse effects on organisms, including cellular and genetic damage to the freshwater bivalve Dreissena polymorpha, delayed hatching of eggs in the freshwater fish Oryzias latipes and freshwater cladocerans such as Daphnia magna and Moina macrocopa, inhibition of photosynthesis in the freshwater diatom Navicula sp., damage to the hemocytes of Ruditapes philippinarum, and an impact on the growth of the freshwater microalga Scenedesmus rubescens [22,23,24,25,26].
IBU has been removed by methods such as adsorption with different materials, including biochar [6], carbon nanotube-based materials [27], nanoparticles with polyamidoamine [28], and magnetic nanoparticles such as Fe3O4@hydroxyapatite [29]; biological methods [30,31]; and advanced oxidation processes (AOPs). AOPs refer to a group of chemical treatment processes designed to remove organic and inorganic contaminants from water and wastewater. These processes are typically based on the generation of highly reactive hydroxyl radicals (•OH), which can break down a wide range of pollutants [32].
One of the most well-known AOPs is the Fenton process, which is based on the generation of hydroxyl radicals from the decomposition of hydrogen peroxide (H2O2) in the presence of materials containing Fe (II) ions under acidic conditions. This reaction yields hydroxyl radicals (•OH) and Fe (III). Additionally, these ferric ions react with hydrogen peroxide, producing hydroperoxyl radicals (•OOH) and regenerating the catalyst (ferrous ions). If the reaction is initiated by Fe (III) ions, the process is commonly referred to as “Fenton-like.” However, there is a redox cycle that creates a series of redox reactions, causing both species to be present simultaneously, regardless of the starting ion [32,33,34].
IBU has been oxidized through the Fenton process and its various combinations with different sources of iron and other materials, such as sonolysis and sono-Fenton systems with Fe(II) ions, homogeneous modified Fenton-like oxidation with an FeIII-gallic acid complex, heterogeneous Fenton with Fe-zeolite catalysts, plasma-supported Fenton (with Fe-based ordered mesoporous carbon; 88.3% efficiency), electro-Fenton systems, Fenton-like with zero-valent ions, and electro-Fenton with zero-valent ions [35,36,37,38,39,40].
Among ion-based materials, Fe3O4 is one of the most reported iron(III) compounds for Fenton-like oxidation studies of IBU [41,42]. Heterogeneous photo-Fenton processes include carbon dots/Fe3O4@carbon sphere pomegranate-like composites activated by a persulfate system, heterogeneous photo-Fenton with humic acid-coated Fe3O4, sono-electrolytic Fenton, Fe3O4 supported on multi-walled carbon nanotubes (MWCNTs), and the Fenton-like graphene oxide-based electro-Fenton process [41,42,43,44,45,46].
Halloysite nanotubes (HNTs) are an economically viable material that can be employed without further purification. HNTs are clay minerals from the kaolin group, typically composed of two layers rolled into a tubular morphology. The outer layer is composed of silicates (tetrahedral crystals), whereas the inner layer of the nanotube consists of alumina (Al2O3) octahedra. Due to their large surface area, HNTs are known to be good adsorbents and catalyst supports [47,48,49,50].
This study aims to develop and optimize Fe3O4/HNTs composite for the efficient removal of ibuprofen from aqueous systems using a heterogeneous Fenton-type process. It is proposed that integrating magnetite nanoparticles into halloysite nanotubes enhances catalytic performance by optimizing dispersion, increasing the accessibility of active sites, and facilitating electron transfer during H2O2 activation, leading to high removal efficiency and medium mineralization under mild conditions. Furthermore, response surface methodology (RSM) is employed to systematically evaluate and optimize the key operating parameters governing the adsorption and oxidation processes.

2. Materials and Methods

2.1. Preparation of Fe3O4/HNTs Composite

Halloysite nanotubes Al2Si2O5(OH)4·2H2O (HNTs), iron(III) chloride hexahydrate (FeCl3 6H2O) and iron sulfate heptahydrate (FeSO4·7H2O) and ammonium hydroxide solution (NH4OH, 28–30%), hydrogen peroxide solution (H2O2, 30% w/w), solutions of hydrochloric acid (HCl, 0.1 M) and sodium hydroxide (NaOH, 0.1 M) were purchased from Merck/Sigma-Aldrich, St. Louis, MO, USA. The catalyst (Fe3O4/HNTs) was synthesized using a coprecipitation method using Fe(ll) and Fe(lll) salts in a basic medium in the presence of HNTs as described by Maleki and Sadati [51]. The HNTs and distilled water were added to the 3-neck flask and kept under constant stirring at 60 °C. Then, FeSO4·7H2O and FeCl3·6H2O were solubilized in distilled water and added to the 3-neck flask. The solution was kept under constant stirring at 60 °C for 1 h. Afterward, NH4OH was slowly added until the pH reached 11, maintaining stirring, at 70 °C for 2 h. The resulting solution was stored at room temperature for 24 h, forming solid deposition. Neodymium magnets were used to hold solids along with the supernatant liquid. Solids were washed several times with distilled water until the wash water had pH 7. The solid was dried at 70 °C for two days and crushed with a mortar until a fine powder was obtained.

2.2. Characterization of the Catalyst

The HNTs, magnetite, and solid catalyst were characterized using various techniques. The morphology and particle size were determined by scanning electron microscopy (JEOL-6460LV at 20 kV; JEOL, Inc., Peabody, MA, USA) and energy dispersive X-ray spectroscopy (EDX). The high-resolution scanning electron microscopy (HRSEM) technique was used with a JEOL JSM-7600F field emission scanning electron microscope (FESEM) (JEOL, Inc., Peabody, MA, USA). X-ray photoelectron spectroscopy (XPS) spectra were obtained using the VERSAPROBE II (Instrument from Physical Electronics, Chanhassen, MN, USA).
The specific surface area of the samples was determined using the Brunauer–Emmett–Teller (BET) method. The Barrett-Joyner-Halenda (BJH) method at 77 K (Autosorb 1 MP, Quantachrome Instruments; Boynton Beach, FL, USA) was employed to estimate pore volume and pore size distribution. Before measurements, the samples were degassed under vacuum at 573 K for 10 h. The crystalline phases were identified by X-ray diffraction (XRD) using a Bruker AXS X-ray diffractometer (D8 Advanced Plus; Bruker AXS, Madison, WI, USA), with CuKa1 monochromatic radiation, λ = 1.54056 Å). Data collection was performed in the 2θ range from 2° to 70°, with a step width of 0.02° and a count time per step of 1.8 s. Normal operating conditions were 35 kV and 30 mA. Infrared spectra were obtained using a Fourier-transform infrared (FT-IR) spectrometer (Nicolet 6700 with Ge-on KBr beamsplitter, Thermo Scientific, Waltham, MA, USA), and the amount of IBU adsorbed onto the catalyst particles was determined using a Perkin Elmer 283 spectrometer (KBr tablets) (PerkinElmer, Waltham, MA, USA) in the wavenumber range from 400 to 4000 cm−1. Vibrating sample magnetometer (VSM) measurements were obtained using a SQUID magnetometer. Zeta potential was determined using a Zetasizer Nano ZS90 device (Malvern Panalytical, Malvern, UK/US office: Westborough, MA, USA) at pH 7 and 25 °C, with the particles suspended in distilled water.

2.3. Adsorption

Ibuprofen solutions were prepared in deionized water, with concentrations ranging from 1.5 to 15 mg L−1, and the pH was adjusted with 0.1 M HCl or 0.1 M NaOH. Calibration curves for ibuprofen in aqueous solution were established. Measurements were performed at pH values of 2, 7, and 12. Absorbance spectra as a function of wavelength in the 200–300 nm range were recorded for ibuprofen concentrations from 1.5 to 15 mg L−1 using a UV-Vis spectrophotometer (Perkin Elmer Model Lambda 25; PerkinElmer, Waltham, MA, USA). The results showed that the wavelength of maximum absorption for solutions at pH 2 was 222 nm, while for solutions at pH 7 and 12, maximum absorption occurred at 224 nm.
In 10 mL of IBU solutions with concentrations of 9–15 mg L−1 and pH values of 2, 7, and 12, respectively, 0.5–1.5 g L−1 of the Fe3O4/HNTs adsorbent was added. The mixtures were continuously stirred at 200 rpm and 293.15 K. At each time interval (1–14 days), the Fe3O4/HNTs was removed using an external magnet. The remaining IBU in the solution, or the amount not adsorbed, was determined by UV-Vis spectrophotometry. Each experiment was performed in triplicate. Obtaining a standard deviation of 0.045.
The amount of IBU adsorbed by the adsorbent at any time, q t (mg g−1), and at equilibrium, q e (mg g−1), respectively, was calculated based on the concentration in the solution before and after adsorption, according to Equations (1) and (2). The amount of IBU adsorbed by Fe3O4/HNTs at any time, q t (mg g−1), and at equilibrium, q e (mg g−1), was calculated based on the concentration in the solution before and after adsorption, using Equations (1) and (2).
q t = ( C o C t ) V W
q e = ( C o C e ) V W
where C 0 (mg L−1) is the initial IBU concentration, C t (mg L−1) is the concentration after a contact time t , C e (mg L−1) is the remaining concentration at equilibrium, V (L) is the sample volume, and W (mg) is the mass of Fe3O4/HNTs used in each test.
The percentage of IBU adsorption onto Fe3O4/HNTs was calculated using Equation (3).
I B U   a d s o r b e d   ( % ) = C o C f C o C o 100 %  
where Co is the initial concentration of IBU (15 mg L−1) and Cf is the final concentration of IBU after adsorption.
The adsorption results were fitted with pseudo-first order (PFO) kinetic, pseudo-second order (PSO) kinetic, and intra-particle diffusion to determine the adsorption mechanisms.
This PFO kinetic model (Equation (4)) was analyzed because it typically applies to physisorption processes and describes physical interactions between the adsorbate and the adsorbent, such as Van der Waals or dipole–dipole forces. In this model, qt and qe (mg g−1) represent the amounts of IBU adsorbed at time t and at equilibrium, respectively; t (min) is the adsorption time, and k1 (min−1) is the Lagergren pseudo-first-order rate constant [52].
L n   ( q e q t ) = q e k 1 t
The pseudo-second order (PSO) kinetic model, Equation (5). This model implies that the adsorbent surface exhibits a specific affinity for the adsorbate, and that the active sites progressively become saturated over time, which gradually reduces the adsorption rate until equilibrium is reached. Where, qt and qe (mg g−1) represent the amounts of IBU adsorbed at time t and at equilibrium, respectively; t (min) is the adsorption time, and k2 (mg g−1 min−1) is the pseudo-second-order rate constant [53].
t q t = 1 k 2 q e 2 + 1 q e t
The intraparticle diffusion model (Equation (6)) posits that the adsorption rate is, at least in part, governed by the transport of the adsorbate from the bulk solution into the internal pores of the adsorbent. This internal diffusion takes place through the porous structure of the solid and may become the rate-limiting step when active sites are not readily accessible from the external surface, due to the adsorbent’s pore characteristics. In this model, qt is the amount of IBU adsorbed at time t (min), ki is the intraparticle diffusion rate constant (mg g−1 min1/2), and C is a constant (mg g−1) associated with the boundary layer thickness [54].
q t = k i t 1 / 2 + C
The adsorption isotherm data were obtained at 298.15 K. The concentration range is 5–15 mg L−1. Adsorption equilibrium data were analyzed using the Henry, Freundlich and Langmuir isotherms models.
Henry’s isotherm, Equation (7), assumes ideal behavior, where adsorption occurs in a monolayer without interactions between adsorbed molecules and no saturation of adsorption sites. Although simple, the Henry isotherm is fundamental for understanding adsorption at low coverage and is often employed to define the initial slope of more complex isotherms, such as Freundlich or Langmuir [55].
q e = K H C e
The Freundlich isotherm shown in Equation (8), is an empirical model that can be applied to multilayer adsorption, with a non-uniform distribution of the heat of adsorption and affinities on the heterogeneous surface, is an empirical model that can be applied to multilayer adsorption, with a non-uniform distribution of the heat of adsorption and affinities on the heterogeneous surface [56]. Where qe (mg⋅g−1) is the equilibrium amount of adsorbed IBU, Ce (mg⋅L−1) is the equilibrium concentration of IBU, and KF (mg⋅g−1) and n are constants for a given adsorbate and adsorbent, per mass unit of adsorbent, at equilibrium.
log q e = log K F + ( 1 n ) log C e
The Langmuir isotherm, as expressed in Equation (9), assumes that adsorption occurs as a monolayer on a homogeneous surface. In this context, Ce (mg·L−1) represents the equilibrium concentration of the adsorbate in the solution phase, while qe (mg·g−1) denotes the amount of adsorbate retained per unit mass of adsorbent when equilibrium is reached. The parameters q0 and KL are the Langmuir constants, which describe the maximum adsorption capacity and the affinity of the binding sites, respectively [57].
C e q e = ( 1 q m a x K L ) + ( 1 q o ) C e

2.4. Ibuprofen Removal by Heterogeneous Fenton Reaction

IBU removal was carried out in propylene centrifuge tubes. Solutions of 15 mg L−1 were prepared in deionized water, and the pH was adjusted using either HCl (0.1 M) or NaOH (0.1 M). After pH adjustment, the corresponding dose of Fe3O4/HNTs was mixed with 10 mL of IBU solution. The addition of hydrogen peroxide initiated the heterogeneous Fenton-type reaction. After 24 h of reaction, the catalyst was separated from the reaction samples with a magnet. A sample of the supernatant liquid was immediately collected, and the chemical oxygen demand (COD) was determined. Digester equipment for COD vials HI 83980 Hanna was used for the COD. A UV–visible spectrophotometer (UV-Vis Perkin Elmer Model Lambda 25) was employed to determine the Cr3+ and Cr6+ (as dichromate) absorbance in digested samples to match them against the corresponding COD calibration plot.
The total organic carbon (TOC) of the oxidation samples was recorded using a Sievers 900 analyzer (GE Analytical Instruments (Sievers), Boulder, CO, USA) with ultrapure water. This experiment was performed in triplicate. The mineralization percentage was determined using Equation (10). Where initial TOC and final TOC are the TOC values at the start and end of the oxidation reaction, respectively
M i n e r a l i z a t i o n   ( % ) = T O C i n i t i a l T O C f i n a l T O C i n i t i a l × 100
The reusability of the catalysts was evaluated through five cycles of the Fenton reaction. After each cycle, the catalysts were recovered using a magnet, exhaustively washed, dried, and then reused under the same experimental conditions.

2.5. Response Surface Methodology and Experimental Design

For the adsorption and Fenton oxidation studies, Box–Behnken experimental designs were employed. pH, dosage (adsorbent/catalyst), and H2O2 concentration were selected as independent variables. These factors were evaluated at two levels and a center point (−1, 0, and +1).
A second-order (quadratic) model was obtained to analyze the interactions between variables (Equation (11)). An analysis of variance (ANOVA) was applied to verify the statistical significance of the model terms.
Y = β o + β 1 X 1 + β 2 X 2 + β 12 X 1 X 2 + β 11 X 1 2 + β 22 X 2 2
where Xi, Xi2, and XiXj represent the linear, quadratic, and interaction terms, respectively. β0, βii, and βij are the coefficients of the linear model terms, the quadratic model terms, and the interaction terms, respectively, and Y represents the response, which is the percentage of adsorption and removal for Fenton oxidation, respectively. Design Expert software version 11 (Stat-Ease, Inc. Minneapolis, MN, USA) was the software used. Response surface methodology (RSM) was employed as a statistical and mathematical approach to model and analyze adsorption and oxidation processes where multiple variables influence the desired outcome, to optimize the response [58].

3. Results

3.1. Catalyst Analysis

3.1.1. STEM and SEM

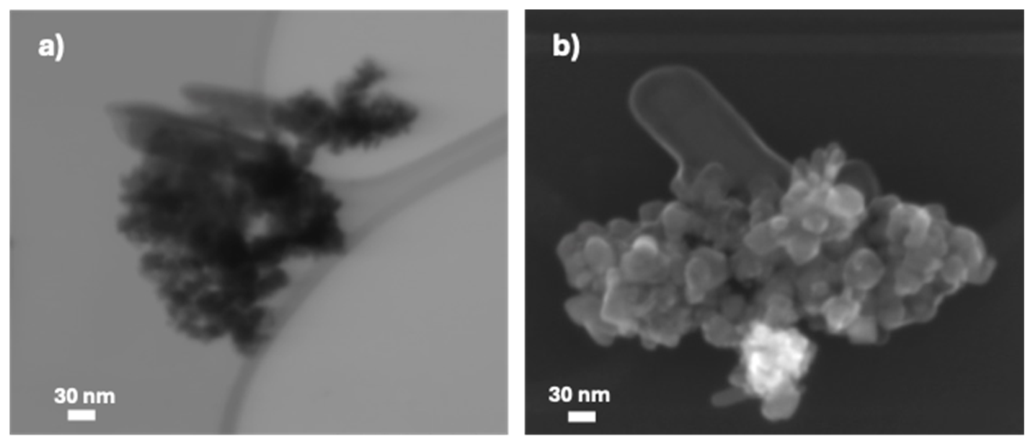
Figure 1 shows the STEM and SEM images obtained in the nanometer range. These images reveal clusters of spherical nanoparticles, identified as Fe3O4, surrounding the NTHs. The SEM image suggests that these are not crystallites, but rather clusters with an average size of 265 nm. However, the surface spherical particles have an average diameter of 25 to 40 nm.
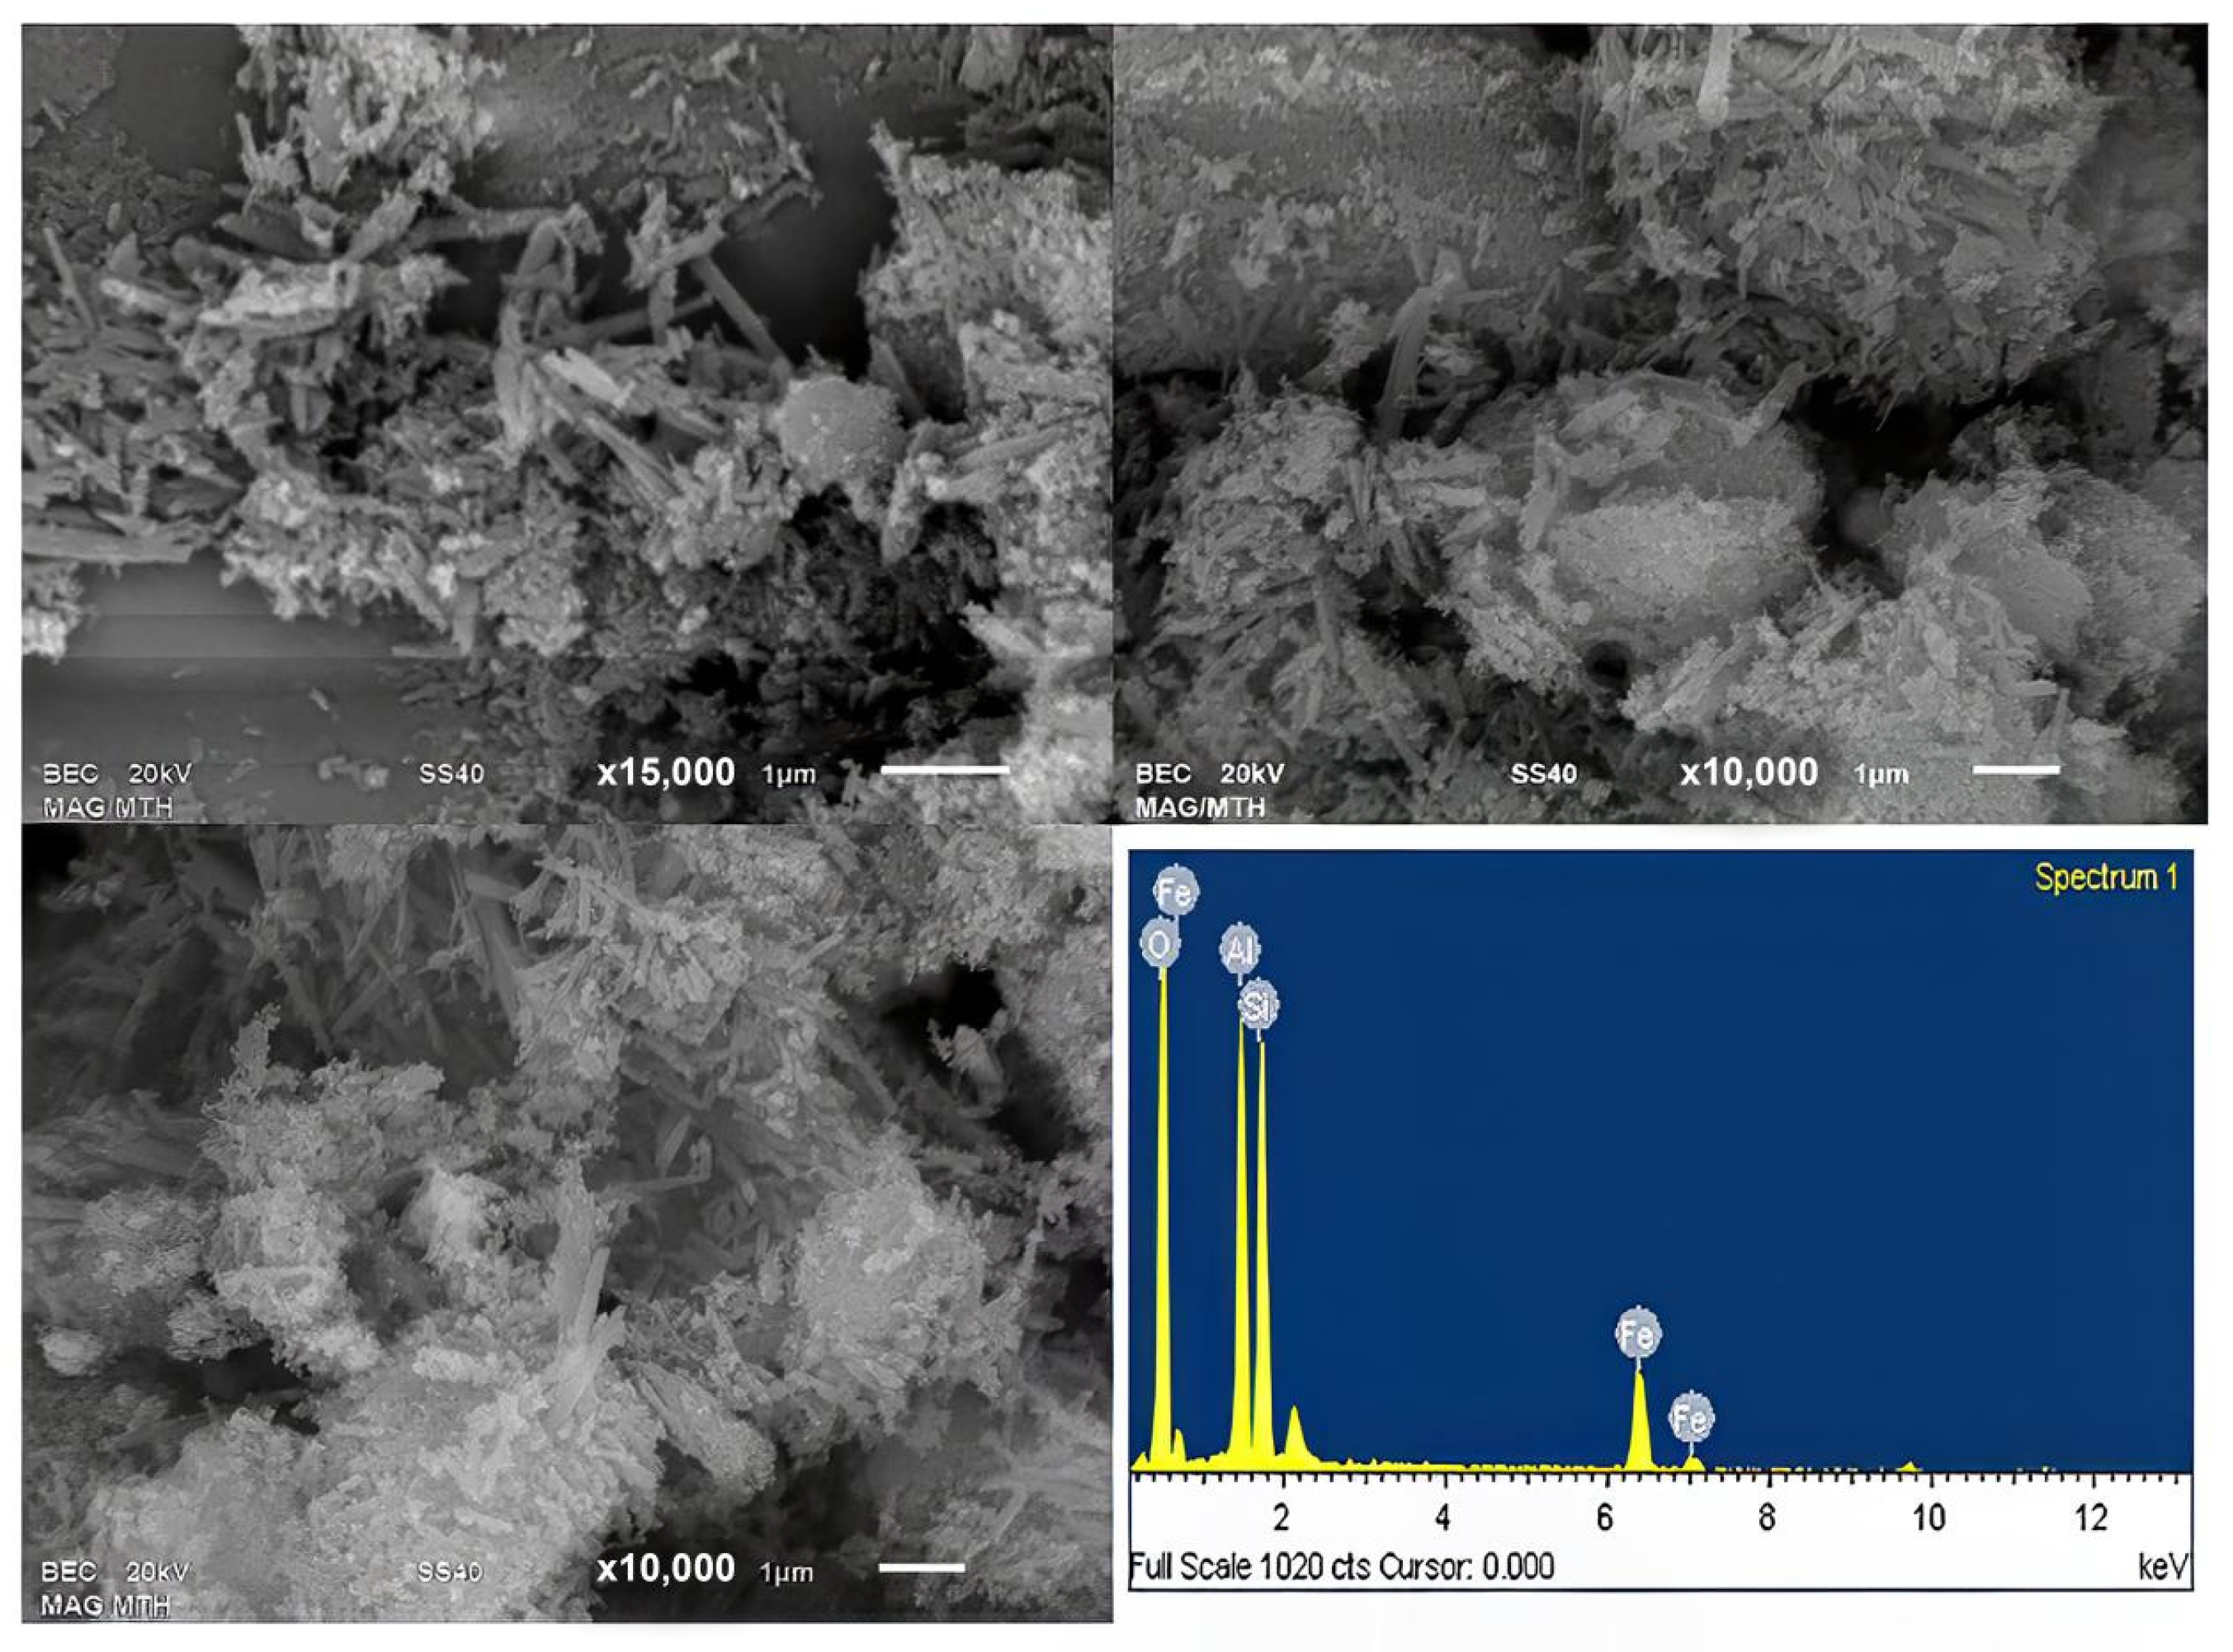
The morphology and size details of the Fe3O4/HNTs catalyst were determined by SEM. Figure 2 indicates that the catalyst particles were nearly spherical and of uniform size; in addition, halloysite nanotubes exhibited irregular needle shape and irregular agglomerations on and around catalyst particles. It might be due to strong inter-particle Van der Waals forces or due to magnetic attraction among the Fe3O4 nanoparticles. Also, SEM images confirm the catalyst’s sized structure and morphology. Chemical composition of the catalyst, determined by EDX, confirms the presence of iron, oxygen, silicon and aluminum.

3.1.2. XPS

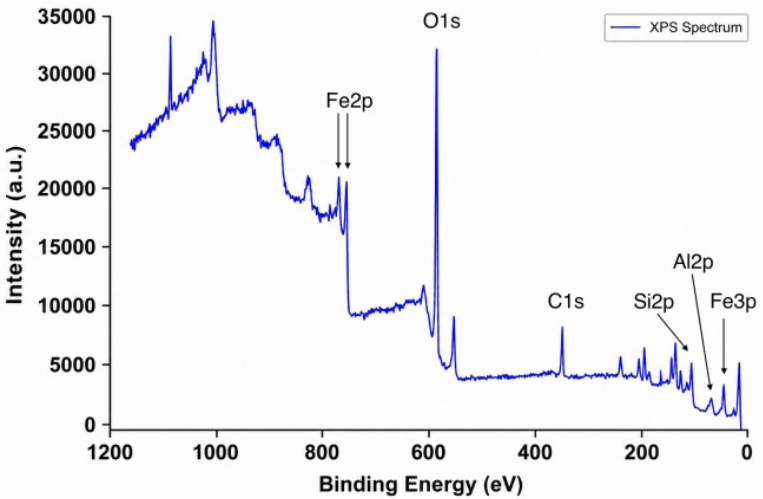
The XPS spectrum of the Fe3O4/NHTs sample is shown in Figure 3. Peaks for iron, oxygen, aluminum, silicon, and carbon were observed. The iron signals (Fe 2p, BE 710.1 eV and BE 711.3 eV) are assigned to octahedral Fe(II) and Fe(III), respectively, which correspond to Fe3O4 [59]. The oxygen signal (O 1s, BE 530 eV) is assigned to iron oxides. Peaks for aluminum (Al 2p, BE 74 eV) and silicon (Si 2p, BE 99 eV) were also observed. After integrating and normalizing the spectral areas, the composition of the sample was found to be Fe (51.33%), O (28.13%), Al (7.38%), Si (10.17%) and C (2.99%), respectively, with a Fe3O4/HNTs ratio of 60/40. Si/Al ratio of 1.37, like that reported in other works [60].

3.1.3. Adsorption–Desorption N2

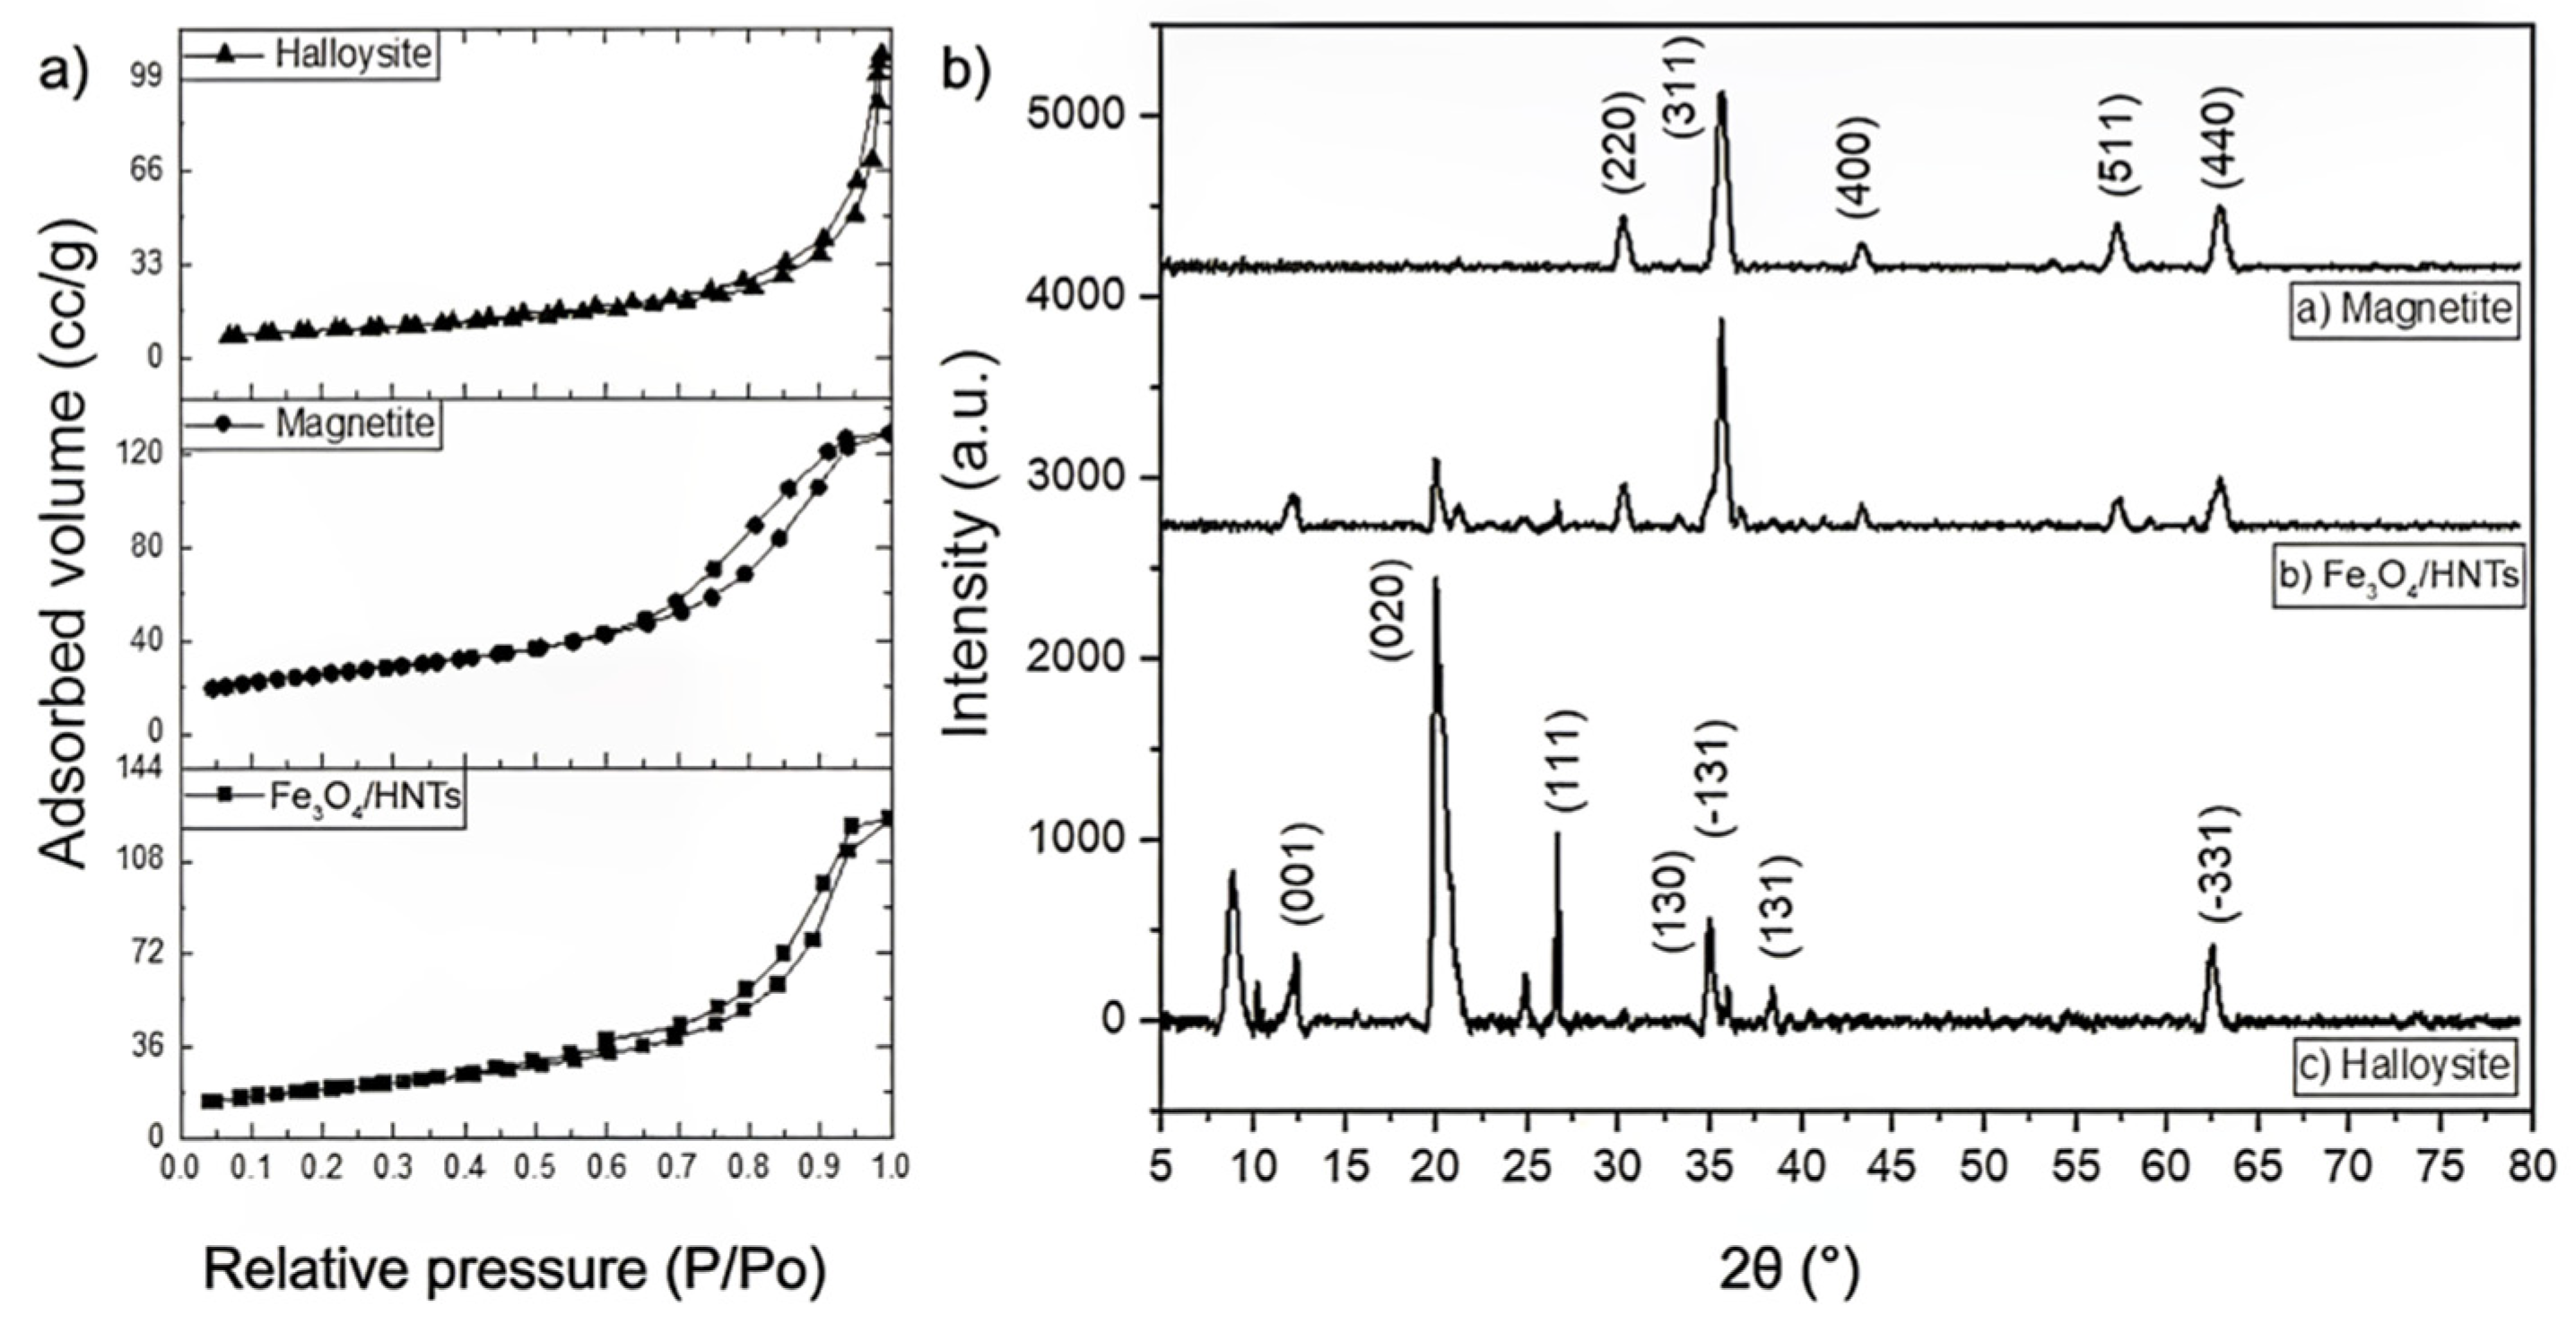
The pore size distribution of the Fe3O4, HNTs, and Fe3O4/HNTs samples was obtained using the Barret–Joyner–Hallenda (BJH) method [61]. In all cases, mesoporous particles (2–50 nm) and macroporous particles with a pore diameter greater than 50 nm [62]. The pore size distribution for halloysite is trimodal, with maxima at 3.3, 11, and 75 nm, respectively. The pore size distribution for magnetite is monomodal, with a maximum of 7.7 nm. The Fe3O4/HNTs catalyst presents a bimodal pore size distribution with maxima at 3.3 and 18 nm. From the nitrogen adsorption–desorption study for halloysite, magnetite, and magnetite/halloysite samples (Figure 4a), it is observed that the three samples presented hysteresis cycles, indicating the presence of mesoporous material. For HNTs, a minimal hysteresis cycle of type H3 is observed, characteristic of mesoporous materials that form agglomerates of particles with pores or a slit-lamellar shape with non-uniform size, characteristic of mesoporous materials that form agglomerates of particles with pores or a slit-lamellar shape with non-uniform size [62], and that has been observed in different HNT samples [63]. Fe3O4 and Fe3O4/HNTs samples show H1-type hysteresis cycles, which are characteristic of solids consisting of particles crossed by almost cylindrical channels or formed by aggregates (consolidated) or agglomerates (unconsolidated) of spheroidal particles with pores of size and uniform shape [62]. The similarity of the types of hysteresis between Fe3O4 and Fe3O4/HNTs indicates a higher magnetite content in the catalyst than halloysite. The specific surface area of Fe3O4, HNTs, and Fe3O4/HNTs was determined using the BET equation, using the results of N2 adsorption on the surfaces, obtaining values of 90 67.7 m2 g−1, 34.4 m2 g−1 and 67.7 m2 g−1, respectively. The BET area for Fe3O4/HNTs was higher than the area of the HNTs because the magnetite is heterogeneously supported on the halloysite and is clustered together.

3.1.4. X-Ray Diffraction

The X-ray diffraction pattern of the Fe3O4/HNTs sample is shown in Figure 4b). The crystalline phases identified are magnetite and HNTs according to the Power Diffraction Pattern sheets (PDF) 01-076-0958 and 00-009-0451, respectively. The HNTs were identified with the reflections near at 2θ (11.87°, 20.1°, 24.5°, 35.1°, 38.1°, 54.6° and 62.6°). The most important result marks this identification for d001, corresponding to the reflection at 11.87°, which was observed in the pattern. This reflection corresponds to a d space around 7.77 Å, a characteristic result for dehydrated HNTs (7 Å) [64,65]. The magnetite phase was identified with the reflections at 2θ (30.11°, 35.46°, 43.1°, 57.0°, and 62.59°). The most important result marks this identification for d220, corresponding to the reflection at 30.11° observed in the pattern. The crystalline domain size (D) was determined using the Scherrer equation. The highest intensity reflections for HNTs and Fe3O4 were selected in the X-ray diffraction pattern of the Fe3O4/HNTs sample. The crystalline domain size (D) was determined using the Scherrer equation. The highest intensity reflections for HNTs and Fe3O4 were selected in the X-ray diffraction pattern of the Fe3O4/HNTs sample. The crystallite sizes of the natural HNTs and the magnetite synthesized by the coprecipitation method were 13 and 12 nm, respectively. However, when the synthesis of Fe3O4 was carried out in the presence of HNTs, the crystallite size of both HNTs and Fe3O4 increased to 25 nm and 40 nm, respectively.

3.1.5. Vibrating Sample Magnetometer

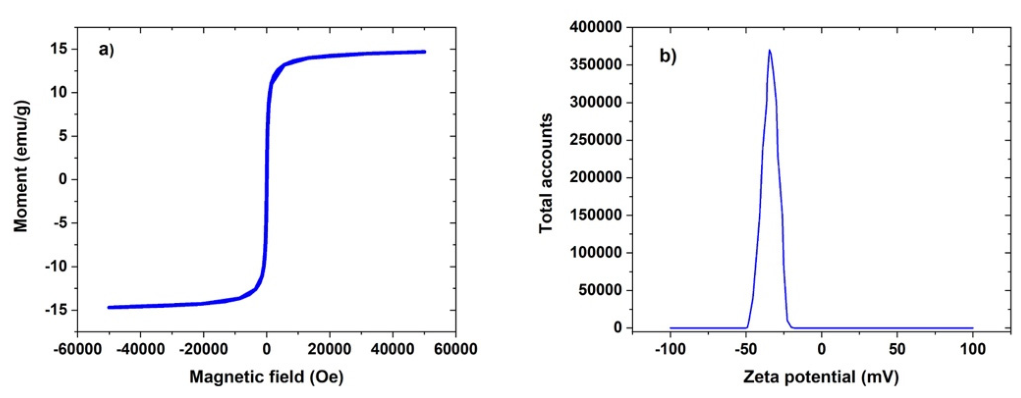
Figure 5a shows the magnetization-magnetic field (M-H) curve of Fe3O4 nanoparticles supported on NTH. The sigmoidal shape of the M-H curve indicates the absence of hysteresis. This type of curve is characteristic of small nanoparticles, where coercivity and remanence are practically zero, which is typical of superparamagnetic materials [66]. The magnetization reaches a saturation value (Ms) of around 13 emu/g, suggesting that the magnetite particles are magnetized to their maximum capacity under the applied field. Although the Fe3O4 particles exhibit agglomerations with an average size of ~236 nm in SEM/TEM, a nanoparticle array with sufficiently weak interparticle magnetic interactions exhibits superparamagnetic behavior [67].

3.1.6. Zeta Potential

Figure 5a shows a zeta potential distribution plot, where the x-axis represents the zeta potential (mV) in the range of −200 mV to 200 mV, and the y-axis shows the total number of counts. The plot exhibits a narrow Gaussian curve, centered at −34.6 mV. This result indicates moderate electrostatic stability [68].

3.2. Box–Behnken Design for the Adsorption of Ibuprofen on Fe3O4/HNTs

A design Box–Behnken was implemented to evaluate the factors used (A: pH, and B: Fe3O4/HNTs) and determine their effect on the adsorption of IBU onto Fe3O4/HNTs. Three levels were evaluated for each factor (−1, +1, and 0) (Table 1). In addition to three center points, a total of 12 experiments were conducted, where the percentage of adsorption was measured in each one (Table 2). Obtaining a standard deviation of 0.4.
The statistical models, shown in Table 3, were obtained using the Design Expert 11 software. The quadratic model best fits the adsorption results, considering different pH values and doses of the adsorbent. p-values less than 0.0500 indicate model terms are significant. In this case, A, A2, and B2 are significant model terms. Values greater than 0.1000 indicate the model terms are not significant.
The ANOVA results are shown in Table 4. The model F-value of 77.53 implies the model is significant. There is only a 0.01% chance that an F-value this large could occur due to noise. The lack-of-fit F-value of 25.71 implies the lack-of-fit is significant. There is only a 1.22% chance that a lack-of-fit f-value this large could occur due to noise.
The quadratic model equation that quantitatively describes the response’s relationship with the factors was obtained. It can be employed to determine the optimal experimental conditions for the absorption of IBU on Fe3O4/HNTs (Equation (12)).
I B U   a d s o r b e d   ( % ) = 3.47 3.33 A + 0.1867 B 0.12 A B + 2.5 A 2 0.7338 B 2
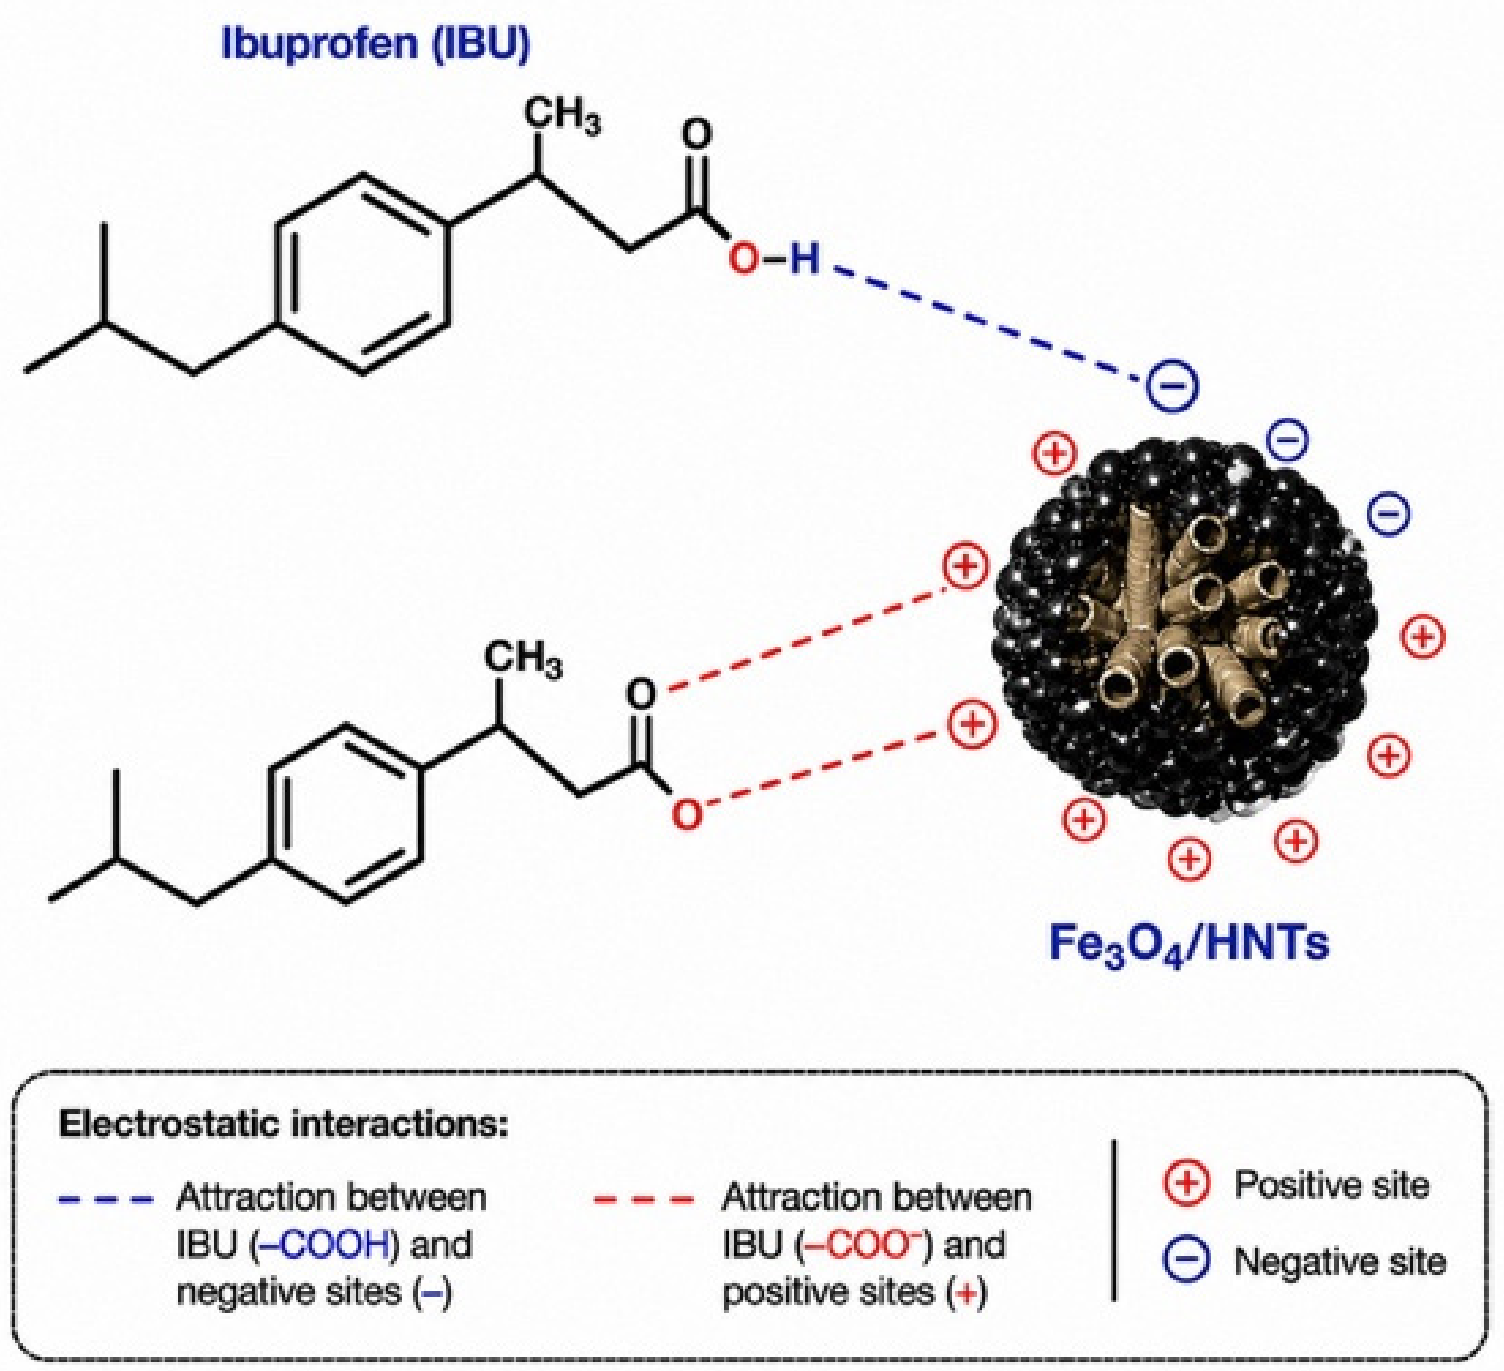
According to Equation (12), the main factor in the absorption of IBU on Fe3O4/HNTs is A (pH). At more acidic pH values, greater adsorption is obtained: at pH 2, approximately 8%; at neutral pH, around 3%; and at pH 12, it decreases between 2 and 2.5%. Also, a slight increase in adsorption is observed when the amount of Fe3O4/HNTs reaches a maximum. These results indicate that at acidic pH, the adsorption of IBU on Fe3O4/HNTs is favored because the protons of the carboxylic acid of the IBU form hydrogen bonds with the surface of the magnetite [69]. On the other hand, at basic pH, ibuprofen is in its anionic form due to the deprotonation of its carboxylic group, which presents a negative charge like the surface of Fe3O4/HNTs, repelling each other and disfavoring adsorption (Figure 6).
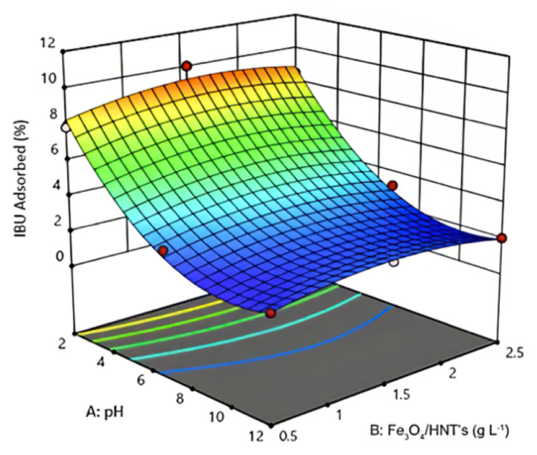
Another significant value was B: Fe3O4/HNTs. The increase in adsorption with the rise in the amount of Fe3O4/HNTs is due to the increase in the number of active sites for the adsorption of the IBU. Figure 7 shows the response surface graph of IBU adsorption as a function of pH and the adsorbent dose. Where higher adsorption is observed at acidic pH 2.
Finally, the optimal experimental conditions for the absorption of IBU were obtained at a concentration of 15 mg L−1, a temperature of 298.15 K, a pH of 2, and a dose of Fe3O4/HNTs of 1.5 g L−1, adsorbing an amount of 1.1 mg g−1 of adsorbent.

3.3. Adsorption Kinetics

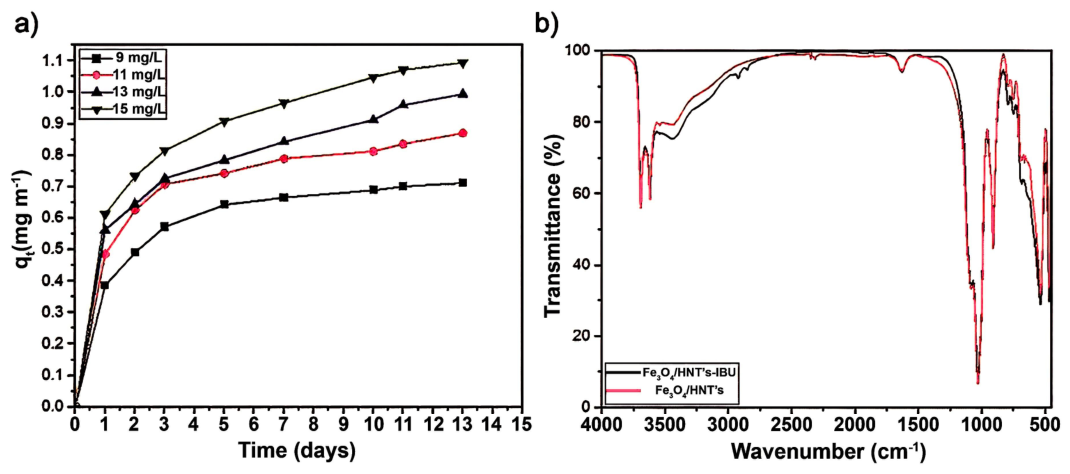
Figure 8a shows that the adsorbed amount of IBU on Fe3O4/HNTs increased depending on the concentration. This increase, at higher concentrations of IBU, could be due to the shift in the adsorption–desorption equilibrium towards the adsorption process until the highest concentration was reached, which shows a saturation of the active sites of the adsorbent. To know the adsorption rate of IBU on the Fe3O4/HNTs adsorbate, adsorption kinetics, and equilibrium adsorption experiments were carried out, where data were obtained on the adsorbed amount of IBU per gram of adsorbent at 297.15 K as a function of time (pH 2 and dose of the adsorbent of 1.5 mg g−1). The kinetic curves show adsorption behavior, where drug adsorption is slow in the initial days of contact with the adsorbent, followed by a low, gradual removal before reaching equilibrium. As can be seen in Figure 8a, approximately 10% of the IBU was absorbed within the first five days, showing slow kinetics. In the following period, adsorption continues at lower rates, reaching equilibrium after 14 days. The adsorption kinetics profile is characteristic of drug adsorption in solution onto different adsorbents [70,71], as well as gases on CuCl/boehmite surfaces [72].
FTIR spectra of the Fe3O4/HNTs and adsorbed Fe3O4/HNTs-IBU samples are presented in Figure 8b. FTIR spectra show the vibrations for HNTs in the range of 4000–400 cm−1. The bands at 3695 and 3622 cm−1 correspond to the elongation of the HNTs structural O–H groups. The bands 3527, 3456, and 1650 cm−1 are due to the stretching and bending of the water molecules. The absorption bands found at 1091 cm−1 and 1032 cm−1 are due to the presence of Si–O–Si, and the band at 910 cm−1 corresponds to the bending of Al–O–OH, respectively, for HNTs [73]. Also, a vibration is observed at 553 cm−1 that corresponds to magnetite. It is essential to mention that magnetite presents this characteristic vibration in the infrared spectrum in the range of 540 to 570 cm−1 (Fe–O). The absence of the IBU signal in the spectrum Fe3O4/HNTs-IBU indicates minimal IBU adsorption on the Fe3O4/HNTs surface.
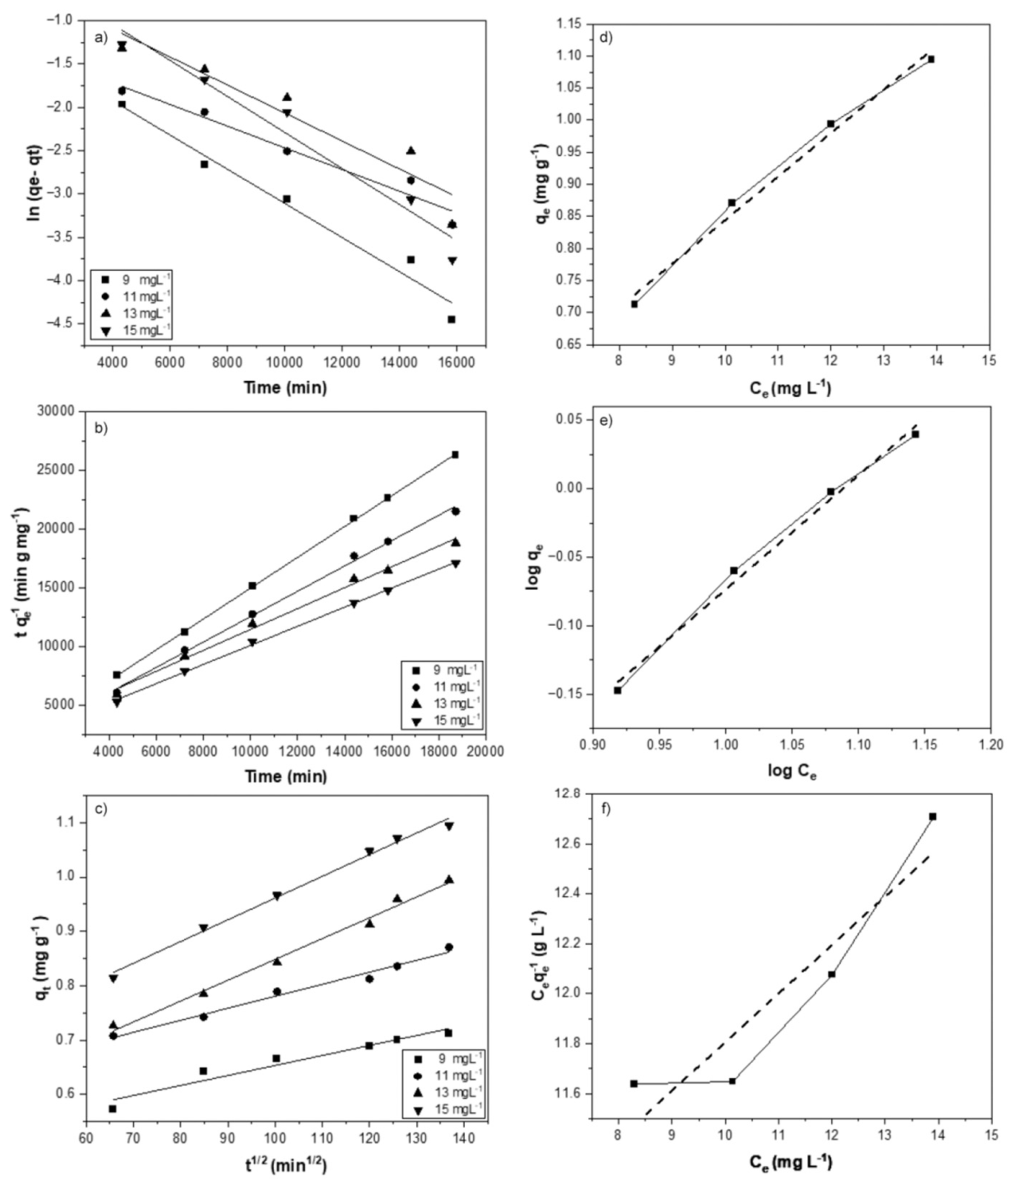
Adsorption experiments were used to investigate the effect of contact time on IBU adsorption. To explain the adsorption of IBU on Fe3O4/HNTs, the PFO, PSO, and intraparticle diffusion equation models were employed. The results were fitted to the equations of the PFO, PSO, and intraparticle diffusion kinetic models. Table 5 presents the fitting parameters of these kinetic models. In the PFO model, the R2 value was 0.973. For the PSO and intraparticle diffusion models, the R2 values were 0.998 and 0.992, respectively. The coefficient of determination R2 closest to unity corresponds to the PSO model, which is the one that best fits the adsorption of IBU onto Fe3O4/HNTs. For the sample of 15 mg L−1, k2 is 3.27 E−4 (g⋅mg−1⋅min−1). The value of k2, on the order of thousandths, implies that the adsorption rate of IBU onto Fe3O4/HNTs is slow. This model suggests that the adsorbent surface exhibits a specific affinity for the adsorbate, and that progressively becomes saturated over time, which gradually reduces the adsorption rate until equilibrium is reached [53]. PSO models have been regularly obtained for the adsorption of IBU with other adsorbents such as graphene oxide nanoplatelets, doped copper, superparamagnetic silica nanocomposites, magnetic multi-walled carbon, and Fe3O4/Rice husk [31,69,71,74,75,76,77,78,79,80,81,82,83,84,85,86,87,88,89,90].
In Table 6, it can be seen that practically all the IBU adsorption studies on different surfaces fit the PSO model, regardless of the initial IBU concentration or whether the adsorption is carried out at acidic, neutral, or basic pH.

3.4. Adsorption Isotherm

The results obtained for the amount of IBU adsorbed per gram of Fe3O4/HNTs, qe (mg g−1), and the IBU concentration in the adsorption system at equilibrium, Ce (mg L−1), were measured in adsorption experiments conducted at pH 7. These data were fitted to the Henry isotherm (qe vs. Ce), the Freundlich isotherm (log qe vs. log Ce), and the Langmuir isotherm (Ce/qe vs. Ce), as shown in Figure 9d–f. Linear regression was performed for each isotherm (dashed lines), and it was observed that the data fit best to the Henry and Freundlich isotherms, but not to Langmuir.
The parameters obtained for each isotherm are shown in Table 6. The Langmuir model (R2 = 0.87356) indicates that the adsorption results do not fit the Langmuir isotherm, while the data fit very closely to the Henry (R2 = 0.988) and Freundlich (R2 = 0.99126) isotherms.
The Freundlich equation had the best correlation, with a maximum adsorption capacity of 5.1 mg g−1. It assumes heterogeneous adsorption energies on the surface of the adsorbent. The parameter 1/n in the Freundlich equation reflects the degree of surface heterogeneity of the adsorbent. Lower values of 1/n (approaching zero) suggest greater surface heterogeneity, whereas values approaching one indicate a more homogeneous surface. It maintains low heterogeneity since the value of 1/n is close to 1, in accordance with the Freundlich adsorption. It is important to note that with TEM and SEM images, the surface of the Fe3O4/HNTs nanocomposite was observed to be heterogeneous, which confirms that IBU adsorption fits the Freundlich isotherm. This is due to the heterogeneous surfaces formed during the synthesis of nanocomposites, as seen in the case of magnetic nanoparticles coated with zeolite [86] and rape straw biomass fiber/β-Cyclodextrin/Fe3O4 [89] (Table 7).
The adsorption capacity of IBU on Fe3O4/HNTs is shown to be 5.1 mg L−1 (Table 6), a very low value attributed to the weak hydrogen bonding interaction between IBU and the magnetite surface [69]. This result indicates that significant adsorption of IBU onto the HNTs does not occur. The minimal adsorption of IBU on Fe3O4/HNTs ensures that it remains available in the solution phase, thereby allowing the heterogeneous Fenton reaction to take place on the catalyst surface.

3.5. Ibuprofen Removed by Heterogeneous Fenton-Type Reaction (Monitoring)

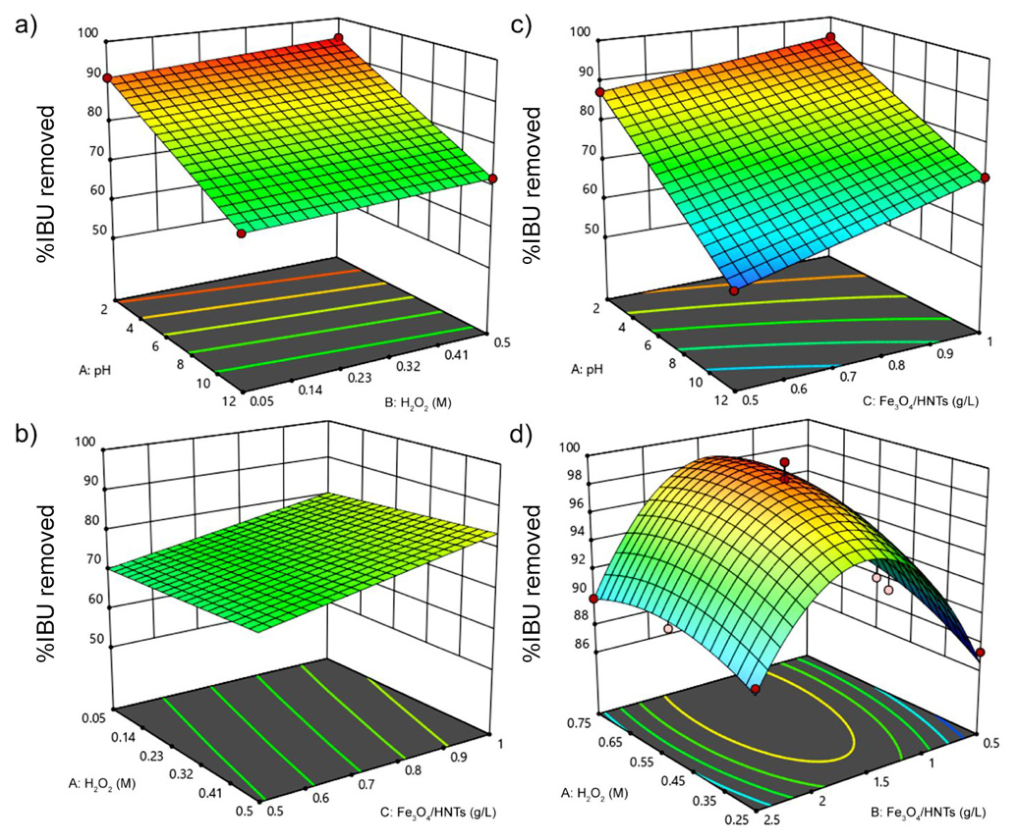
A monitoring design was implemented to evaluate the factors used (A: pH, B: H2O2, and C: Fe3O4/HNTs) and determine their effect on IBU degradation. Two levels were evaluated for each factor (−1 and +1) (Table 8). In addition to three center points, resulting in a total of 11 experiments where the percentage of removal of IBU was measured at each one. The results of TOC removal efficiency for Fenton are presented in Table 9.
The data of Fenton were fitted to a quadratic model, the significance and adequacy of which were tested by ANOVA (Table 10). The F-test of the regression models produced very low p-values (<0.0001), indicating that the model was of high significance. The determination coefficients (R2) of the model indicated that 94.51% of the total variability could be explained by the model for the Fenton. The value of the adjusted determination coefficient (adjusted R2 = 0.8204) also proved the high significance of the model.
The values of all regression coefficients with the significance levels are given in Table 11. The model F-value of 1177.02 implies the model is significant. There is only a 0.08% chance that an F-value this large could occur due to noise. p-values less than 0.0500 indicate model terms are significant. It could be seen that, for the Fenton reaction, the linear coefficients of reaction pH (β2) and the concentration of Fe3O4/HNTs (β3), as well as the interaction coefficient of initial pH with concentration of Fe3O4/HNTs (β23) are significant factors at a level less than 5% by independent variables in terms of coded factors are show in Equation (13).
I B U   o x i d a t i o n ( % ) = 76.38 13.31 A + 1.21 B + 5.45 C + 2.24 A C + 0.2775 B C 0.2550 A B C
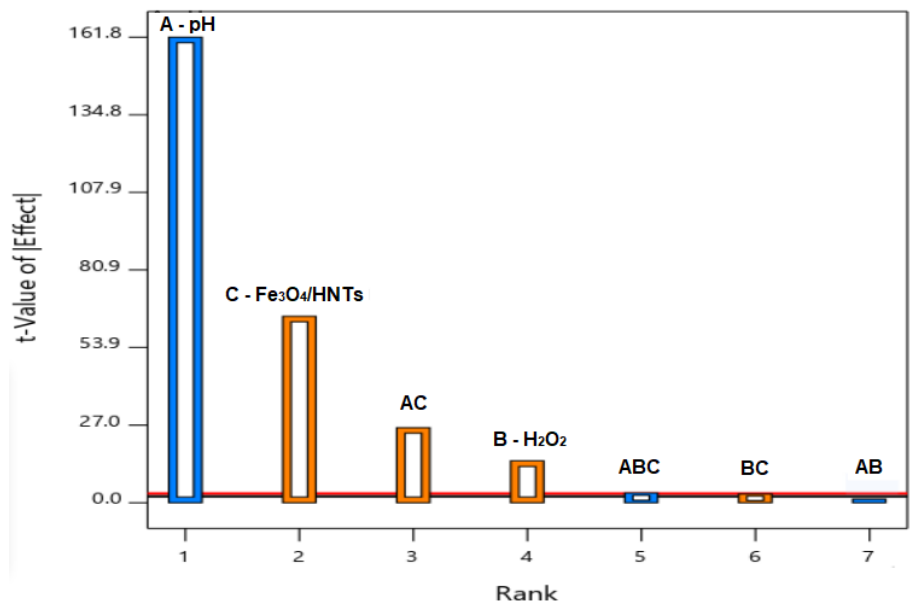
According to Equation (12) and the Pareto chart (Figure 10), the variable with the main effect on removal is A: pH. With a t-value of 161.8. It has been reported that, at acidic pH and in the presence of H2O2, the iron from magnetite dissolves, and that a higher concentration of iron in the solution contributes to the effective production of hydroxyl radicals, increasing the degradation [91].
After pH, the variable with the greatest effect on IBU removed is C, the concentration of Fe3O4/HNTs. Hydroxyl radicals are formed on the surface of Fe3O4/HNTs when Fe reacts with hydrogen peroxide, thus forming hydroxyl radicals. Therefore, increasing the catalyst concentration increases the surface for hydroxyl radical formation.
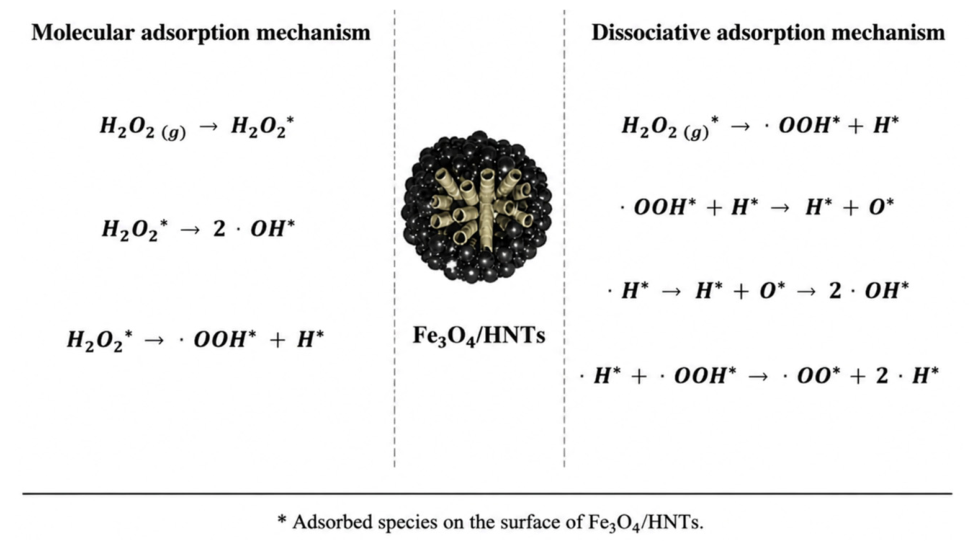
It is worth mentioning that the Fe3O4 surface exhibits a mixed valence state (Fe2+/Fe3+), which leads to two possible adsorption sites for H2O2. The two modes of H2O2 adsorption are shown in Figure 11. The first is molecular adsorption on Fe2+/Fe3+ sites (tetrahedral/octahedral): The adsorption structure is molecular, and dissociation can occur through the breaking of the O–H or O–O bonds, generating OH or OOH radicals on the Fe3O4 surface. This dissociation is controlled both by kinetics (O–H bond cleavage) and thermodynamics (O–O bond cleavage) [92].
The second mechanism of hydroxyl radical formation is dissociative adsorption on Fe3+/Fe3+ sites (octahedral/octahedral): This adsorption mode favors the breaking of the O–O bond, generating two OH radicals on the Fe3O4 surface with a small energy barrier of 0.24 eV. It has also been observed that in these mechanisms, Fe2+ is oxidized to Fe3+, while the Fe3+ site remains in its original oxidation state, forming a mixture of OH anion and OH radical. In contrast, the dissociative adsorption of H2O2 on Fe3+/Fe3+ sites exclusively produces two OH radicals, as no change is observed in the oxidation states of the iron sites [92].
The next significant value was the AC (pH with Fe3O4/HNTs) interaction because pH affects the magnetite contained in the catalyst. The point zero charge (PZC) of magnetite is 6.5, so at acidic pH values, the catalyst surface becomes protonated [93,94], favoring the adsorption of IBU onto Fe3O4/HNTs and thus degradation, since hydroxyl radicals are formed on the catalyst surface [93].
Finally, the variable with the smallest, but still significant, effect on IBU removal was the H2O2 concentration, since the hydroxyl radicals originate from hydrogen peroxide, so increasing the concentration favors degradation. The response surface plots obtained are shown in Figure 12a–c. The highest amount of IBU removal was 94.74% at pH 2, 0.5 M of H2O2, and 1 g L−1 of Fe3O4/HNTs.

3.6. Ibuprofen Removed by Heterogeneous Fenton-Type Reaction (Optimization)

Once the effects of pH, Fe3O4/HNTs dosage, and H2O2 concentration on IBU degradation were determined, a Box–Behnken experimental design was implemented to find the optimal experimental conditions for IBU removal through a Fenton-type heterogeneous reaction, maintaining a constant pH 7 and temperature of 298 K. The amounts of Fe3O4/HNTs and H2O2 were increased because, according to the monitoring design, a higher amount of Fe3O4/HNTs and H2O2 (Figure 12b) favors IBU removal (Table 12). The results of the removal of IBU are shown in Table 13.
The removal design results were fitted to the Linear, 2FI, Quadratic, and Cubic equations (Table 14). The data were best described by the quadratic model, with a standard deviation of 1.29 and adjusted and predicted R2 values of 0.9251 and 0.8204, respectively. These results indicate reasonable agreement, suggesting a good predictive capability of the model, with a model determination coefficient (R2) of 0.9848. Additionally, the model showed a non-significant lack of fit (p-value = 0.5212), indicating no statistical evidence that the model is poorly fitted; therefore, it is appropriate and reliable.
The Model F-value of 28.16 implies the model is significant. (Table 15). There is only a 0.04% chance that an F-value this large could occur due to noise. p-values less than 0.0500 indicate model terms are significant. In this case, A and B2 are significant model terms. Values greater than 0.1000 indicate the model terms are not significant. If there are many insignificant model terms (not counting those required to support hierarchy), model reduction may improve your model. The Lack of Fit F-value of 0.94 implies the Lack of Fit is not significant relative to the pure error. There is a 52.12% chance that a Lack of Fit F-value this large could occur due to noise. Non-significant lack of fit is good—we want the model to fit. The variables in terms of coded factors are shown in Equation (14).
I B U r e m o v e d ( % ) = 98.60 + 1.39 A + 0.2817 B 0.9275 A B 1.51 A 2 7.93 B 2
At pH 7, both the H2O2 concentration and the squared dose of the Fe3O4/HNTs catalyst were the most influential factors for IBU removal. Hydroxyl radicals are generated from hydrogen peroxide, so increasing its concentration enhances the removal efficiency. Equation (14) accurately describes the system within the concentration range shown in the response surface (Figure 12d), where 99% degradation is achieved at 1.5 g L−1 of Fe3O4/HNTs and 0.5 M H2O2.

3.7. Mineralization of IBU

Based on the initial and final TOC values of 4.05 ppm and 1.61 ppm, respectively, the percentage of mineralization was determined using Equation (10), resulting in 60% mineralization when the sample achieved 99% IBU removal.

3.8. Catalyst Reuse

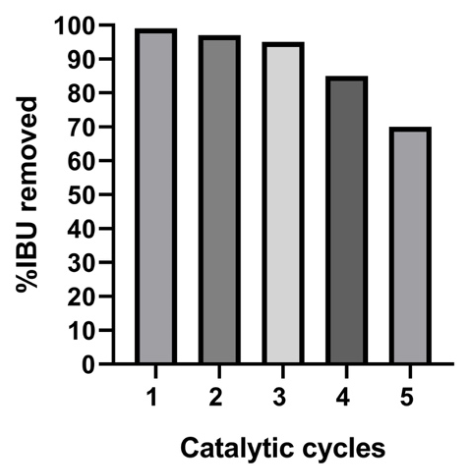
The catalyst was reused for five cycles (Figure 13), with the amount of IBU removed decreasing from the second cycle onward. The removal efficiency dropped to 70% in the fifth cycle. It is noteworthy that the efficiency remained nearly constant during the first three cycles, which can be attributed to the mild conditions of the Fenton reaction under optimal parameters, maintaining the catalyst’s stability [94,95].
Table 16 presents advanced processes for the removal and/or mineralization of ibuprofen (IBU). Reported IBU removal efficiencies range from 60% to 98%, with mineralization up to 40%, whereas in our study, a 99% removal and 60% mineralization were achieved. However, some of the reported processes are carried out under extreme pH conditions or require high energy input.
The optimal IBU removal conditions obtained in this study using Fe3O4/HNTs were at mild conditions: pH 7, compared to reported processes at pH 3 and 5 [44,45,46,96,97]; temperature of 293.15 K, versus 323.15 K and 343.15 K reported in previous studies [43,97]; lower H2O2 concentration (0.5 M) compared to 0.6–0.8 M [96,98]; shorter reaction time (20 h) compared to 50 h for unsupported Fe3O4 [41]; and a smaller catalyst dosage (1.5 g L−1 of Fe3O4/HNTs) compared to 6 g L−1 of Fe3O4/Clay slurry [42].
Furthermore, the combined use of response surface methodology (RSM) and the Box–Behnken design to independently and systematically optimize the adsorption and oxidation stages provides a more comprehensive understanding of the process. Importantly, the system achieves near-complete degradation and partial mineralization under close-to-neutral pH conditions, representing a significant practical advantage over conventional Fenton-based methods, which typically require strongly acidic environments.
Unlike many reported systems (Table 16), where adsorption plays a dominant role, the present material exhibits a relatively low adsorption capacity, which is advantageous for keeping the contaminant in solution and, therefore, available for oxidative degradation. This characteristic allows for more efficient use of the catalytic surface for the generation of hydroxyl radicals.
While the results demonstrate high efficiency in ibuprofen removal, the adsorption process was relatively slow, requiring prolonged contact times to reach equilibrium. Furthermore, although the catalyst showed promising performance, its long-term stability and iron leaching potential were not systematically evaluated in this work. Another aspect that deserves attention is the relatively high concentration of H2O2 required to achieve optimal performance, which could have implications for large-scale applications.
Therefore, future research will focus on improving the stability and reusability of the catalyst, evaluating metal leaching under different operating conditions, and optimizing oxidant consumption. As well as identifying the by-products and evaluating their toxicity. Furthermore, it will be crucial to evaluate this system in real wastewater matrices and apply it to other emerging contaminant classes to further validate its practical applicability.

4. Conclusions

In this study, a Fe3O4/HNTs composite was synthesized as an alternative adsorbent for the removal of ibuprofen, an emerging environmental contaminant. Elemental analysis using EDS and XPS confirmed the presence of iron, oxygen, silicon, and aluminum in the catalyst, while XRD characterization verified the formation of crystalline Fe3O4. The composite exhibited Fe3O4 agglomerates supported on the HNTs and demonstrated superparamagnetic behavior. Additionally, the material displayed a meso- to macroporous structure and a negative zeta potential at pH 7, indicating surface stability under neutral conditions.
Adsorption experiments of ibuprofen on Fe3O4/HNTs were fitted using a pseudo-second-order kinetic model and a Freundlich adsorption isotherm. These results suggest that the composite possesses a highly active surface with heterogeneous adsorption energies, supporting its effectiveness for pharmaceutical removal in aqueous media.
Additionally, using response surface methodology with a Box–Behnken experimental design and ANOVA statistical analysis, it was found that the adsorption of IBU onto the Fe3O4/HNTs adsorbent-catalyst at 298.15 K and an initial IBU concentration of 15 mg L−1 is pH-dependent, being favored under acidic conditions. Optimal adsorption was achieved at pH 2 with a Fe3O4/HNTs dosage of 1.5 g L−1, resulting in a maximum adsorption capacity of 1.1 mg g−1.
For IBU removal via the Fenton-type reaction, it was observed that at neutral pH (7) and room temperature (298.15 K), with an initial IBU concentration of 15 mg L−1 and H2O2 concentrations ranging from 0.25 to 0.75 M, both the H2O2 concentration and the catalyst dosage were important factors. A maximum IBU removal of 99% was achieved under environmentally friendly pH and temperature conditions when the catalyst dosage was 1.5 g L−1 of Fe3O4/HNTs, and the H2O2 concentration was 0.5 M.
Finally, TOC analysis indicated that the maximum mineralization reached 60%.
Adsorption studies showed partial efficiency, while heterogeneous Fenton-type reactions achieved complete contaminant removal. This methodology offers the advantage of recovering the adsorbent/catalyst through a magnetic field. These results confirm the material’s potential as an efficient alternative for treating water contaminated with IBU, helping to mitigate its environmental impact and health risks.
This study contributes to the development of Fe3O4/HNTs composites, which can function as efficient, magnetically recoverable catalysts for the removal of pharmaceutical contaminants such as ibuprofen. The magnetic recoverability of the catalyst, along with the use of low-cost halloysite nanotubes, enhances the potential scalability of the process. Furthermore, the catalytic mechanism, based on the generation of hydroxyl radicals, suggests that this approach could be applied to a broader range of organic contaminants with similar structural characteristics.

Author Contributions

Conceptualization, Y.M.V.-R.; Methodology, E.A.G.-G. and Y.M.V.-R.; Software, A.E.O.-V.; Validation, J.C.M.-M.; Formal analysis, J.J.-B. and J.A.C.-C.; Investigation, E.A.G.-G.; Writing—original draft, E.A.G.-G.; Writing—review and editing, J.C.M.-M.; Project administration, A.E.O.-V.; Funding acquisition, Y.M.V.-R. All authors have read and agreed to the published version of the manuscript.

Funding

This work was supported by Dirección General de Asuntos del Personal Académico DGAPA-PAPIIT (grant IN113722) and by Programa Interno de Cátedras de Investigación 2024, FES Cuautitlán-UNAM (grant CI2462). Awarded scholarship SECIHTI 1225471.

Data Availability Statement

The original contributions presented in this study are included in the article. Further inquiries can be directed to the corresponding author.

Acknowledgments

The authors thank the Departamento de Forense Nuclear y Química Analítica, ININ, for providing the facilities for the Total Organic Carbon (TOC) analyses and Manuel Aguilar Franco, Técnico académico of CFATA-UNAM, for the microscopy.

Conflicts of Interest

The authors declared no potential conflicts of interest with respect to the research, authorship, and/or publication of this article.

References

  1. Rout, P.R.; Zhang, T.C.; Bhunia, P.; Surampalli, R.Y. Treatment technologies for emerging contaminants in wastewater treatment plants: A review. Sci. Total Environ. 2021, 753, 141990. [Google Scholar] [CrossRef] [PubMed]
  2. Rathi, B.S.; Kumar, P.S.; Show, P.L. A review on effective removal of emerging contaminants from aquatic systems: Current trends and scope for further research. J. Hazard. Mater. 2021, 409, 124413. [Google Scholar] [CrossRef]
  3. Morin-Crini, N.; Lichtfouse, E.; Liu, G.; Balaram, V.; Lado Ribeiro, A.R.; Lu, Z.; Stock, F.; Carmona, E.; Teixeira, M.R.; Picos-Corrales, L.A.; et al. Worldwide cases of water pollution by emerging contaminants: A review. Environ. Chem. Lett. 2022, 20, 2311–2338. [Google Scholar] [CrossRef]
  4. Jiang, Y.; Ran, J.; Mao, K.; Yang, X.; Zhong, L.; Yang, C.; Feng, X.; Zhang, H. Recent progress in Fenton/Fenton-like reactions for the removal of antibiotics in aqueous environments. Ecotoxicol. Environ. Saf. 2022, 236, 113464. [Google Scholar] [CrossRef]
  5. Kean, W.F.; Rainsford, K.D.; Buchanan, W.W. Chapter 6: Therapeutics of ibuprofen in rheumatic and other chronic and painful diseases. In Ibuprofen: Pharmacology, Therapeutic Uses and Risks; Rainsford, K.D., Ed.; Wiley: Hoboken, NJ, USA, 2015; pp. 237–312. [Google Scholar] [CrossRef]
  6. Ahmed, H.R.; Kayani, K.F.; Ealias, A.M.; George, G. Biochar as an eco-friendly adsorbent for ibuprofen removal via adsorption: A review. Inorg. Chem. Commun. 2024, 170, 113397. [Google Scholar] [CrossRef]
  7. Chopra, S.; Kumar, D. Ibuprofen as an emerging organic contaminant in environment, distribution and remediation. Heliyon 2020, 6, e04087. [Google Scholar] [CrossRef]
  8. He, R.; Wu, X.; Mu, H.; Chen, L.; Hu, H.; Wang, J.; Ren, H.; Wu, B. Priority control sequence of 34 typical pollutants in effluents of Chinese wastewater treatment plants. Water Res. 2023, 243, 120338. [Google Scholar] [CrossRef]
  9. Březinova, T.D.; Vymazal, J.; Koželuh, M.; Kule, L. Occurrence and removal of ibuprofen and its metabolites in full-scale constructed wetlands treating municipal wastewater. Ecol. Eng. 2018, 120, 1–5. [Google Scholar] [CrossRef]
  10. Matamoros, V.; Bayona, J.M. Elimination of pharmaceuticals and personal care products in subsurface flow constructed wetlands. Environ. Sci. Technol. 2006, 41, 8171–8177. [Google Scholar] [CrossRef]
  11. Matamoros, V.; Garcia, J.; Bayona, J.M. Organic micropollutant removal in a full scale surface flow constructed wetland fed with secondary effluent. Water Res. 2008, 42, 653–660. [Google Scholar] [CrossRef]
  12. Liu, Z.H.; Ma, Q.G.; Dai, L.; Dang, Z. Occurrence, removal and risk evaluation of ibuprofen and acetaminophen in municipal wastewater treatment plants: A critical review. Sci. Total Environ. 2023, 891, 164600. [Google Scholar] [CrossRef]
  13. Khasawneh, O.F.S.; Palaniandy, P. Occurrence and removal of pharmaceuticals in wastewater treatment plants. Process Saf. Environ. Prot. 2021, 150, 532–556. [Google Scholar] [CrossRef]
  14. Matamoros, V.; Hijosa, M.; Bayona, J.M. Assessment of the pharmaceutical active compounds removal in wastewater treatment systems at enantiomeric level. Ibuprofen and naproxen. Chemosphere 2009, 75, 200–205. [Google Scholar] [CrossRef]
  15. Zhang, Y.; Lv, T.; Carvalho, P.N.; Arias, C.A.; Chen, Z.; Brix, H. Removal of the pharmaceuticals ibuprofen and iohexol by four wetland plant species in hydroponic culture: Plant uptake and microbial degradation. Environ. Sci. Pollut. Res. 2016, 23, 2890–2898. [Google Scholar] [CrossRef]
  16. Kahl, S.; Kleinsteuber, S.; Nivala, J.; van Afferden, M.; Reemtsma, T. Emerging biodegradation of the previously persistent artificial sweetener acesulfame in biological wastewater treatment. Environ. Sci. Technol. 2018, 52, 2717–2725. [Google Scholar] [CrossRef]
  17. Gardner, M.; Jones, V.; Comber, S.; Scrimshaw, M.D.; Coello-Garcia, T.; Cartmell, E.; Ellor, B. Performance of UK wastewater treatment works with respect to trace contaminants. Sci. Total Environ. 2013, 456, 359–369. [Google Scholar] [CrossRef] [PubMed]
  18. Breitholtz, M.; Näslund, M.; Stråe, D.; Borg, H.; Grabic, R.; Fick, J. An evaluation of free water surface wetlands as tertiary sewage water treatment of micro-pollutants. Ecotoxicol. Environ. Saf. 2012, 78, 63–71. [Google Scholar] [CrossRef] [PubMed]
  19. Moeder, M.; Carranza-Diaz, O.; López-Angulo, G.; Vega-Aviña, R.; Chávez-Durán, F.A.; Jomaa, S.; Delgado-Vargas, F. Potential of vegetated ditches to manage organic pollutants derived from agricultural runoff and domestic sewage: A case study in Sinaloa (Mexico). Sci. Total Environ. 2017, 598, 1106–1115. [Google Scholar] [CrossRef] [PubMed]
  20. Morachis-Valdez, G.; Dublán-García, O.; López-Martínez, L.X.; Galar-Martínez, M.; Saucedo-Vence, K.; Gómez-Oliván, L.M. Chronic exposure to pollutants in Madín Reservoir (Mexico) alters oxidative stress status and flesh quality in the common carp Cyprinus carpio. Environ. Sci. Pollut. Res. 2015, 22, 9159–9172. [Google Scholar] [CrossRef]
  21. Amado-Piña, D.; Romero, R.; Salazar Carmona, E.; Ramírez-Serrano, A.; Gómez-Oliván, L.M.; Elizalde-Velázquez, G.; Natividad, R. Photo-Fenton treatment under UV and Vis light reduces pollution and toxicity in water from Madín Dam, Mexico. Catalysts 2024, 14, 620. [Google Scholar] [CrossRef]
  22. Parolini, M.; Binelli, A.; Provini, A. Chronic effects induced by ibuprofen on the freshwater bivalve Dreissena polymorpha. Ecotoxicol. Environ. Saf. 2011, 74, 1586–1594. [Google Scholar] [CrossRef]
  23. Han, S.; Choi, K.; Kim, J.; Ji, K.; Kim, S.; Ahn, B.; Giesy, J.P. Endocrine disruption and consequences of chronic exposure to ibuprofen in Japanese medaka (Oryzias latipes) and freshwater cladocerans Daphnia magna and Moina macrocopa. Aquat. Toxicol. 2010, 98, 256–264. [Google Scholar] [CrossRef]
  24. Ding, T.; Yang, M.; Zhang, J.; Yang, B.; Lin, K.; Li, J.; Gan, J. Toxicity, degradation and metabolic fate of ibuprofen on freshwater diatom Navicula sp. J. Hazard. Mater. 2017, 330, 127–134. [Google Scholar] [CrossRef] [PubMed]
  25. Kim, S.H.; Nam, K.W.; Allam, B.; Choi, K.S.; Park, K.H.; Park, K.I. Quantification of the inflammatory responses to pro- and anti-inflammatory agents in Manila clam, Ruditapes philippinarum. Fish Shellfish Immunol. 2021, 115, 22–26. [Google Scholar] [CrossRef]
  26. Moro, I.; Matozzo, V.; Moschin, E.; Trentin, R.; Dalla Vecchia, F. Morpho-physiological responses by Chlamydomonas reinhardtii to different concentrations of ibuprofen. Chem. Ecol. 2021, 37, 352–368. [Google Scholar] [CrossRef]
  27. El-Sheikh, A.H.; Qawariq, R.F.; Abdelghani, J.I. Adsorption and magnetic solid-phase extraction of NSAIDs from pharmaceutical wastewater using magnetic carbon nanotubes: Effect of sorbent dimensions, magnetite loading and competitive adsorption study. Environ. Technol. Innov. 2019, 16, 100496. [Google Scholar] [CrossRef]
  28. Kurczewska, J.; Cegłowski, M.; Schroeder, G. PAMAM-halloysite Dunino hybrid as an effective adsorbent of ibuprofen and naproxen from aqueous solutions. Appl. Clay Sci. 2020, 190, 105603. [Google Scholar] [CrossRef]
  29. Mohammadi-Aghdam, S.; Valinezhad-Saghezi, B.; Mortazavi, Y.; Qhoreishi, S. Modified Fe3O4/HAp magnetically nanoparticles as the carrier for ibuprofen: Adsorption and release study. Drug Res. 2018, 69, 93–99. [Google Scholar] [CrossRef]
  30. Feng, Y.; Long, Y.; Wang, Z.; Wang, X.; Shi, N.; Suo, N.; Shi, Y.; Yu, Y. Performance and microbial community of an electric biological integration reactor (EBIR) for treatment of wastewater containing ibuprofen. Bioresour. Technol. 2019, 274, 447–458. [Google Scholar] [CrossRef]
  31. Khadir, A.; Motamedi, M.; Negarestani, M.; Sillanpää, M.; Sasani, M. Preparation of a nano bio-composite based on cellulosic biomass and conducting polymeric nanoparticles for ibuprofen removal: Kinetics, isotherms, and energy site distribution. Int. J. Biol. Macromol. 2020, 162, 663–677. [Google Scholar] [CrossRef]
  32. Munoz, M.; de Pedro, Z.M.; Casas, J.A.; Rodriguez, J.J. Preparation of magnetite-based catalysts and their application in heterogeneous Fenton oxidation–a review. Appl. Catal. B Environ. 2015, 176, 249–265. [Google Scholar] [CrossRef]
  33. Usman, M.; Chaudhary, A.; Hanna, K. Efficient PFAS removal from contaminated soils through combined washing and adsorption in soil effluents. J. Hazard. Mater. 2024, 476, 135118. [Google Scholar] [CrossRef]
  34. Gopinath, A.; Pisharody, L.; Popat, A.; Nidheesh, P.V. Supported catalysts for heterogeneous electro-Fenton processes: Recent trends and future directions. Curr. Opin. Solid State Mater. Sci. 2022, 26, 100981. [Google Scholar] [CrossRef]
  35. Adityosulindro, S.; Barthe, L.; González-Labrada, K.; Jáuregui Haza, U.J.; Delmas, H.; Julcour, C. Sonolysis and sono-Fenton oxidation for removal of ibuprofen in (waste)water. Ultrason. Sonochem. 2017, 39, 889–896. [Google Scholar] [CrossRef]
  36. Lekikot, B.; Mammeri, L.; Talbi, K.; Benssassi, M.E.; Abdessemed, A.; Sehili, T. Homogeneous modified Fenton-like oxidation using FeIII-gallic acid complex for ibuprofen degradation at neutral pH. Desalin. Water Treat. 2021, 234, 147–157. [Google Scholar] [CrossRef]
  37. Adityosulindro, S.; Julcour, C.; Barthe, L. Heterogeneous Fenton oxidation using Fe-ZSM5 catalyst for removal of ibuprofen in wastewater. J. Environ. Chem. Eng. 2018, 6, 5920–5928. [Google Scholar] [CrossRef]
  38. Hirami, Y.; Hunge, Y.M.; Suzuki, N.; Rodríguez-González, V.; Kondo, T.; Yuasa, M.; Terashima, C. Enhanced degradation of ibuprofen using a combined treatment of plasma and Fenton reactions. J. Colloid Interface Sci. 2023, 642, 829–836. [Google Scholar] [CrossRef] [PubMed]
  39. Minella, M.; Bertinetti, S.; Hanna, K.; Minero, C.; Vione, D. Degradation of ibuprofen and phenol with a Fenton-like process triggered by zero-valent iron (ZVI-Fenton). Environ. Res. 2019, 108750, 108750. [Google Scholar] [CrossRef] [PubMed]
  40. Martone, L.; Minella, M.; Minero, C.; Sordello, F.; Vione, D. Effective degradation of ibuprofen through an electro-Fenton process, in the presence of zero-valent iron (ZVI-EF). J. Clean. Prod. 2022, 367, 132894. [Google Scholar] [CrossRef]
  41. Sabri, N.; Hanna, K.; Yargeau, V. Chemical oxidation of ibuprofen in the presence of iron species at near neutral pH. Sci. Total Environ. 2012, 427, 382–389. [Google Scholar] [CrossRef]
  42. Sun, S.P.; Zeng, X.; Lemley, A.T. Nano-magnetite catalyzed heterogeneous Fenton-like degradation of emerging contaminants carbamazepine and ibuprofen in aqueous suspensions and montmorillonite clay slurries at neutral pH. J. Mol. Catal. A Chem. 2013, 371, 94–103. [Google Scholar] [CrossRef]
  43. Zhang, B.T.; Wang, Q.; Zhang, Y.; Teng, Y.; Fan, M. Degradation of ibuprofen in the carbon dots/Fe3O4@carbon sphere pomegranate-like composites activated persulfate system. Sep. Purif. Technol. 2020, 242, 116820. [Google Scholar] [CrossRef]
  44. Gonçalves, N.P.; Minella, M.; Fabbri, D.; Calza, P.; Malitesta, C.; Mazzotta, E.; Prevot, A.B. Humic acid coated magnetic particles as highly efficient heterogeneous photo-Fenton materials for wastewater treatments. Chem. Eng. J. 2020, 390, 124619. [Google Scholar] [CrossRef]
  45. Thokchom, B.; Qiu, P.; Cui, M.; Park, B.; Pandit, A.B.; Khim, J. Magnetic Pd@Fe3O4 composite nanostructure as recoverable catalyst for sonoelectrohybrid degradation of ibuprofen. Ultrason. Sonochem. 2017, 34, 262–272. [Google Scholar] [CrossRef]
  46. Huaccallo-Aguilar, Y.; Diaz de Tuesta, J.L.; Álvarez-Torrellas, S.; Gomes, H.T.; Larriba, M.; Ovejero, G.; García, J. New insights on the removal of diclofenac and ibuprofen by CWPO using a magnetite-based catalyst in an up-flow fixed-bed reactor. J. Environ. Manag. 2021, 281, 111913. [Google Scholar] [CrossRef]
  47. Joussein, E.; Petit, S.; Churchman, J.; Theng, B.; Righi, D.; Delvaux, B. Halloysite clay minerals—A review. Clay Miner. 2005, 40, 383–426. [Google Scholar] [CrossRef]
  48. Vargas-Rodríguez, Y.M.; Obaya, A.; García-Petronilo, J.E.; Vargas-Rodríguez, G.I.; Gómez-Cortés, A.; Tavizón, G.; Chávez-Carvayar, J.A. Adsorption studies of aqueous solutions of methyl green for halloysite nanotubes: Kinetics, isotherms, and thermodynamic parameters. Am. J. Nanomater. 2021, 9, 1–11. [Google Scholar] [CrossRef]
  49. Massaro, M.; Noto, R.; Riela, S. Past, present and future perspectives on halloysite clay mineral and catalyst supportals. Molecules 2020, 25, 4863. [Google Scholar] [CrossRef] [PubMed]
  50. Massaro, M.; Noto, R.; Riela, S. Halloysite nanotubes: Smart nanomaterials in catalysis. Catalysts 2022, 12, 149. [Google Scholar] [CrossRef]
  51. Maleki, T.S.; Sadati, S.J. Synthesis and investigation of hyperthermia properties of Fe3O4/NTHs magnetic nanocomposite. Inorg. Chem. Commun. 2022, 145, 110000. [Google Scholar] [CrossRef]
  52. Revellame, E.D.; Fortela, D.L.; Hernandez, R.; Zappi, M.E.; Gang, D.D. A Critical Review on Kinetic Models and Isotherms for Adsorption-Based Water Treatment. Clean. Eng. Technol. 2020, 1, 100032. [Google Scholar] [CrossRef]
  53. Ho, Y.S.; McKay, G. Pseudo-second order model for sorption processes. Process Biochem. 1999, 34, 451–465. [Google Scholar] [CrossRef]
  54. Weber, W.J.; Morris, J.C. Intraparticle diffusion during the sorption of surfactants onto activated carbon. J. Sanit. Eng. Div. Am. Soc. Civ. Eng. 1963, 89, 53–61. [Google Scholar] [CrossRef]
  55. Foo, K.Y.; Hameed, B.H. Insights into the modeling of adsorption isotherm systems. Chem. Eng. J. 2010, 156, 2–10. [Google Scholar] [CrossRef]
  56. Freundlich, H. Über die Adsorption in Lösungen. Z. Phys. Chem. 1906, 57, 385–470. [Google Scholar] [CrossRef]
  57. Langmuir, I. The adsorption of gases on plane surfaces of glass, mica and platinum. J. Am. Chem. Soc. 1918, 40, 1361–1403. [Google Scholar] [CrossRef]
  58. Myers, R.H.; Montgomery, D.C.; Anderson-Cook, C.M. Response Surface Methodology: Process and Product Optimization Using Designed Experiments; John Wiley & Sons: Hoboken, NJ, USA, 2016. [Google Scholar]
  59. Atrei, A.; Lesiak-Orlowska, B.; Tóth, J. Magnetite nanoparticles functionalized with citrate: A surface science study by XPS and ToF-SIMS. Appl. Surf. Sci. 2022, 602, 154366. [Google Scholar] [CrossRef]
  60. Ng, K.M.; Lau, Y.T.R.; Chan, C.M.; Weng, L.T.; Wu, J. Surface studies of halloysite nanotubes by XPS and ToF-SIMS. Surf. Interface Anal. 2011, 43, 795–802. [Google Scholar] [CrossRef]
  61. Pierotti, R.A.; Rouquerol, J. Reporting physisorption data for gas/solid systems with special reference to the determination of surface area and porosity. Pure Appl. Chem. 1985, 57, 603–619. [Google Scholar] [CrossRef]
  62. Leofanti, G.; Padovan, M.; Tozzola, G.; Venturelli, B. Surface area and pore texture of catalysts. Catal. Today 1998, 41, 207–219. [Google Scholar] [CrossRef]
  63. Churchman, G.J.; Davy, T.J.; Aylmore, L.A.; Gilkes, R.J.; Self, P.G. Characteristics of fine pores in some halloysites. Clay Miner. 1995, 30, 89–98. [Google Scholar] [CrossRef]
  64. Brindley, G.W. Order-Disorder in the Clay Mineral Structures. In Crystal Structures of Clay Minerals and Their X-Ray Identification; Brindley, G.W., Brown, G., Eds.; Mineralogical Society: London, UK, 1980; pp. 125–196. [Google Scholar] [CrossRef]
  65. Clark, C.; Downs, R. Using the American Mineralogist Crystal Structure Database in the Classroom. J. Geosci. Educ. 2004, 52, 76–80. [Google Scholar] [CrossRef]
  66. Gogoi, B.; Das, U. Magnetization dynamics of iron oxide superparamagnetic nanoparticles above blocking temperature. Mater. Today Proc. 2022, 65, 2636–2644. [Google Scholar] [CrossRef]
  67. Bedanta, S.; Kleemann, W. Supermagnetism. J. Phys. D Appl. Phys. 2009, 42, 013001. [Google Scholar] [CrossRef]
  68. Pochapski, D.J.; Carvalho dos Santos, C.; Leite, G.W.; Pulcinelli, S.H.; Santilli, C.V. Zeta potential and colloidal stability predictions for inorganic nanoparticle dispersions: Effects of experimental conditions and electrokinetic models on the interpretation of results. Langmuir 2021, 37, 13379–13389. [Google Scholar] [CrossRef]
  69. Liyanage, A.S.; Canaday, S.; Pittman, C.U.; Mlsna, T. Rapid Remediation of Pharmaceuticals from Wastewater Using Magnetic Fe3O4/Douglas Fir Biochar Adsorbents. Chemosphere 2020, 258, 127336. [Google Scholar] [CrossRef]
  70. Natarajan, R.; Saikia, K.; Ponnusamy, S.K.; Rathankumar, A.K.; Rajendran, D.S.; Venkataraman, S.; Vaidyanathan, V.K. Understanding the factors affecting adsorption of pharmaceuticals on different adsorbents—A critical literature update. Chemosphere 2022, 287, 131958. [Google Scholar] [CrossRef]
  71. Banerjee, P.; Das, P.; Zaman, A.; Das, P. Application of graphene oxide nanoplatelets for adsorption of ibuprofen from aqueous solutions: Evaluation of process kinetics and thermodynamics. Process Saf. Environ. Prot. 2016, 101, 45–53. [Google Scholar] [CrossRef]
  72. Oh, H.; Beum, H.T.; Yoon, Y.S.; Kim, J.; Han, Y.; Kim, J.; Han, S.S. Experiment and modeling of adsorption of CO from blast furnace gas onto CuCl/boehmite. Ind. Eng. Chem. Res. 2020, 59, 12176–12185. [Google Scholar] [CrossRef]
  73. Yuan, P.; Southon, P.D.; Liu, Z.; Kepert, C.J. Organosilane functionalization of halloysite nanotubes for enhanced loading and controlled release. Nanotechnology 2012, 23, 375705. [Google Scholar] [CrossRef] [PubMed]
  74. Xiong, P.; Zhang, H.; Li, G.; Liao, C.; Jiang, G. Adsorption removal of ibuprofen and naproxen from aqueous solution with Cu-doped MIL-101(Fe). Sci. Total Environ. 2021, 797, 149179. [Google Scholar] [CrossRef]
  75. Kollarahithlu, S.C.; Balakrishnan, R.M. Adsorption of pharmaceuticals pollutants, ibuprofen, acetaminophen, and streptomycin from the aqueous phase using amine functionalized superparamagnetic silica nanocomposite. J. Clean. Prod. 2021, 294, 126155. [Google Scholar] [CrossRef]
  76. Hanbali, G.; Jodeh, S.; Hamed, O.; Bol, R.; Khalaf, B.; Qdemat, A.; Samhan, S. Enhanced Ibuprofen Adsorption and Desorption on Synthesized Functionalized Magnetic Multiwall Carbon Nanotubes from Aqueous Solution. Materials 2020, 13, 3329. [Google Scholar] [CrossRef]
  77. Adamu, H.I.; Faruruwa, M.D.; Adeyemi, M.M.; Tomori, W.B. Green Synthesized Iron Oxide Nanoparticles from Rice Husk for Ciprofloxacin and Ibuprofen Adsorption. Afr. J. Adv. Sci. Technol. Res. 2025, 18, 24–53. [Google Scholar] [CrossRef]
  78. Kamarudin, N.H.N.; Jalil, A.A.; Triwahyono, S.; Sazegar, M.R.; Hamdan, S.; Baba, S.; Ahmad, A. Elucidation of acid strength effect on ibuprofen adsorption and release by aluminated mesoporous silica nanoparticles. RSC Adv. 2015, 5, 30023–30031. [Google Scholar] [CrossRef]
  79. Lotfi, R.; Hayati, B.; Rahimi, S.; Shekarchi, A.A.; Mahmoodi, N.M.; Bagheri, A. Synthesis and characterization of PAMAM/SiO2 nanohybrid as a new promising adsorbent for pharmaceuticals. Microchem. J. 2019, 146, 1150–1159. [Google Scholar] [CrossRef]
  80. Cho, H.H.; Huang, H.; Schwab, K. Effects of solution chemistry on the adsorption of ibuprofen and triclosan onto carbon nanotubes. Langmuir 2011, 27, 12960–12967. [Google Scholar] [CrossRef]
  81. Jedynak, K.; Szczepanik, B.; Rędzia, N.; Słomkiewicz, P.; Kolbus, A.; Rogala, P. Ordered mesoporous carbons for adsorption of paracetamol and non-steroidal anti-inflammatory drugs: Ibuprofen and naproxen from aqueous solutions. Water 2019, 11, 1099. [Google Scholar] [CrossRef]
  82. Umenweke, G.; Ogunniyi, S.; Adeyanju, C.A.; Igwegbe, C.A.; Adeniyi, A.G. Mitigation of clofibric acid pollution by adsorption: A review of recent developments. J. Environ. Chem. Eng. 2020, 8, 104264. [Google Scholar] [CrossRef]
  83. Ulfa, M.; Nisa, D.; Muhammad, F.P.; Prasetyoko, D. Investigating the hydrophilicity of zinc oxide nanoparticles using xylene and water for ibuprofen adsorption. J. Chem. Technol. Metall. 2021, 56, 761–768. [Google Scholar]
  84. Rafati, L.; Ehrampoush, M.H.; Rafati, A.A.; Mokhtari, M.; Mahvi, A.H. Removal of ibuprofen from aqueous solution by functionalized strong nano-clay composite adsorbent: Kinetic and equilibrium isotherm studies. Int. J. Environ. Sci. Technol. 2018, 15, 513–524. [Google Scholar] [CrossRef]
  85. Liu, Y.; Liu, R.; Li, M.; Yu, F.; He, C. Removal of pharmaceuticals by novel magnetic genipin-crosslinked chitosan/graphene oxide-SO3H composite. Carbohydr. Polym. 2019, 220, 141–148. [Google Scholar] [CrossRef] [PubMed]
  86. Attia, T.M.S.; Hu, X.L. Synthesized magnetic nanoparticles coated zeolite for the adsorption of pharmaceutical compounds from aqueous solution using batch and column studies. Chemosphere 2013, 93, 2076–2085. [Google Scholar] [CrossRef]
  87. Al-Khateeb, L.A.; Hakami, W.; Abdel Salam, M.; Sanari, J.A.; El-Shaheny, R.; ElMaghrabey, M. Solid phase-fabrication of magnetically separable Fe3O4@graphene nanoplatelets nanocomposite for efficient removal of NSAIDs from wastewater. Anal. Chim. Acta 2022, 1223, 340158. [Google Scholar] [CrossRef]
  88. Frohlich, A.C.; Foletto, E.L.; Dotto, G.L. Preparation and characterization of NiFe2O4/activated carbon composite as potential magnetic adsorbent for removal of ibuprofen and ketoprofen pharmaceuticals from aqueous solutions. J. Clean. Prod. 2019, 229, 828–837. [Google Scholar] [CrossRef]
  89. Wu, G.; Liu, Q.; Wang, J.; Xia, S.; Wu, H.; Zong, J.; Han, J.; Xing, W. Facile fabrication of rape straw biomass fiber/β-CD/Fe3O4 as adsorbent for effective removal of ibuprofen. Ind. Crops Prod. 2021, 173, 114150. [Google Scholar] [CrossRef]
  90. Behera, S.K.; Oh, S.Y.; Park, H.S. Sorptive removal of ibuprofen from water using selected soil minerals and activated carbon. Int. J. Environ. Sci. Technol. 2012, 9, 85–94. [Google Scholar] [CrossRef]
  91. Jung, Y.S.; Lim, W.T.; Park, J.Y.; Kim, Y.H. Effect of pH on Fenton and Fenton-like oxidation. Environ. Technol. 2009, 30, 183–190. [Google Scholar] [CrossRef]
  92. Lin, P.J.; Yeh, C.H.; Jiang, J.C. Theoretical insight into hydroxyl production via H2O2 decomposition over the Fe3O4 (311) surface. RSC Adv. 2021, 11, 36257–36264. [Google Scholar] [CrossRef] [PubMed]
  93. Laurent, S.; Forge, D.; Port, M.; Roch, A.; Robic, C.; Vander Elst, L.; Muller, R.N. Magnetic iron oxide nanoparticles: Synthesis, stabilization, vectorization, physicochemical characterizations, and biological applications. Chem. Rev. 2008, 108, 2064–2110. [Google Scholar] [CrossRef] [PubMed]
  94. Gamba, O.A.; Badawi, M.; Barres, O.; Lainé, J.; Mesquita, J.; Foucaud, Y. Influence of pH on the surface properties of magnetite and hematite: A comprehensive spectroscopic and potentiometric study. Colloids Surf. A Physicochem. Eng. Asp. 2026, 737, 139573. [Google Scholar] [CrossRef]
  95. Liu, D.; Zhang, H.; Wei, Y.; Liu, B.; Lin, Y.; Li, G.; Zhang, F. Enhanced degradation of ibuprofen by heterogeneous electro-Fenton at circumneutral pH. Chemosphere 2018, 209, 998–1006. [Google Scholar] [CrossRef] [PubMed]
  96. Hussain, S.; Aneggi, E.; Briguglio, S.; Mattiussi, M.; Gelao, V.; Cabras, I.; Zorzenon, L.; Trovarelli, A.; Goi, D. Enhanced ibuprofen removal by heterogeneous-Fenton process over Cu/ZrO2 and Fe/ZrO2 catalysts. J. Environ. Chem. Eng. 2020, 8, 103586. [Google Scholar] [CrossRef]
  97. Hussain, S.; Aneggi, E.; Trovarelli, A.; Goi, D. Heterogeneous Fenton-like oxidation of ibuprofen over zirconia-supported iron and copper catalysts: Effect of process variables. J. Water Process Eng. 2021, 44, 102343. [Google Scholar] [CrossRef]
  98. Sun, S.; Hu, Y.; Xu, M.; Cheng, F.; Zhang, H.; Li, Z. Photo-Fenton degradation of carbamazepine and ibuprofen by iron-based metal-organic framework under alkaline condition. J. Hazard. Mater. 2022, 424, 127698. [Google Scholar] [CrossRef] [PubMed]
Figure 1. (a) STEM and (b) SEM micrographs of Fe3O4/HNTs, showing the aggregation of Fe3O4 particles on the nanotubes.
Processes 14 01609 g001
Figure 2. SEM micrographs and EDX image of Fe3O4/HNTs.
Processes 14 01609 g002
Figure 3. XPS spectrum of Fe3O4/HNTs.
Processes 14 01609 g003
Figure 4. (a) Hysteresis loops: H3-type for HNTs, H1-type for Fe3O4 and Fe3O4/HNTs; (b) X-ray diffraction pattern of magnetite, Fe3O4/HNTs, and HNTs.
Processes 14 01609 g004
Figure 5. For Fe3O4/HNTs: (a) Magnetic hysteresis cycle; (b) Zeta-potential.
Processes 14 01609 g005
Figure 6. Representative interactions of ibuprofen and with Fe3O4/HNTs surfaces.
Processes 14 01609 g006
Figure 7. Response surface for IBU adsorption on Fe3O4/HNTs.
Processes 14 01609 g007
Figure 8. (a) Amount of IBU adsorbed on Fe3O4/HNTs as a function of time, and (b) IR for Fe3O4/HNTs and with IBU adsorption on Fe3O4/HNTs.
Processes 14 01609 g008
Figure 9. Kinetic model of: (a) pseudo-first order, (b) pseudo-second order, and (c) intraparticle diffusion; Isotherm of: (d) Henry, (e) Freundlich, and (f) Langmuir for the adsorption of IBU on Fe3O4/HNTs.
Processes 14 01609 g009
Figure 10. Pareto chart, which indicates the main effect on IBU removal where A: pH, B: H2O2, and C: Fe3O3/HNTs.
Processes 14 01609 g010
Figure 11. Mechanisms of hydroxyl radical formation on Fe3O4 surfaces. Adapted from [92].
Processes 14 01609 g011
Figure 12. 3D Response surface plots of % IBU removed in aqueous suspensions, with [IBU]0 = 15 mg L−1, temperature = 25 ± 1 °C, kept constant in all cases: (a) [Fe3O4/HNTs] dose = 1 g L−1; (b) pH 7 and (c) [H2O2]0 = 500 mM; (d) Optimization of IBU removed at pH 7.
Processes 14 01609 g012
Figure 13. Cycle Catalyst reuse cycles.
Processes 14 01609 g013
Table 1. Code and levels of Box–Behnken design for the adsorption of IBU on Fe3O4/HNTs.
FactorCodeLow Level (−1)Central PointHigh Level (+1)
pHX1 = A2712
Adsorbent dose (g L−1)X2 = B0.51.52.5
Table 2. Amount of IBU adsorbed on Fe3O4/HNTs.
RunFe3O4/HNTs
(g L−1)
pHAdsorbed IBU
(%)
10.527.9
20.572.9
30.5121.9
41.5210.1
51.573.1
61.5122.6
72.528.5
82.573.2
92.5122.0
101.573.3
111.573.4
121.573.4
Table 3. Lack-of-fit test of the optimization models for the adsorption of IBU onto Fe3O4/HNTs.
SourceSequential p-ValueLack of Fit p-ValueAdjusted R2Predicted R2
Linear0.00090.00060.74010.6220
2FI0.87660.00050.70850.4662
Quadratic0.00040.01220.97210.8767
Cubic0.33410.00710.97580.0083
Table 4. Analyses of variance (ANOVA) for the quadratic model describing IBU adsorption onto Fe3O4/HNTs.
SourceSum of SquaresDfMean SquareF-Valuep-Value
Model83.31516.6677.53<0.0001
A-pH66.40166.40308.97<0.0001
B-Fe3O4/HNTs0.209110.20910.97280.3621
AB0.057610.05760.26800.6232
A216.62116.6277.320.0001
B21.4411.446.680.0415
Residual1.2960.2149----
Lack of fit1.2430.413725.710.0122
Error0.048330.0161----
Corr total84.6011------
Table 5. Kinetic parameters values for the adsorption of IBU onto Fe3O4/HNTs.
Kinetic ModelR2Associated Constants
PFO0.973k1 = 1.9711 × 10⁻⁴ min−1
PSO0.998k2 = 3.276 × 10⁻⁴ g⋅mg−1⋅min−1
Intraparticle diffusion0.993ki = 0.00400 min2 y C = 0.56147 mg g−1
Table 6. Isotherm parameters for adsorption of IBU on Fe3O4/HNTs.
IsothermR2Associated Constants
Henry0.988KH (mg L⋅mg−1⋅g−1)0.068
Freundlich0.991KF (mg g−1)
(1/n)
0.124
0.837
Langmuir0.873KL (L mg−1)
qmax (mg g−1)
0.012
5.144
Table 7. Comparison of IBU adsorption in other clays and iron oxides.
AdsorbentExperimental ConditionModel KineticAdsorption IsothermMaximum Adsorption
Capacity
(mg g−1)
Reference
Cellulosic Sisal nanoparticlespH 5, [IBU]o = 30 mg L−1, 313 K, PSO-19.45[31]
Fe3O4/Douglas fir biochar5 min, pH 8, [IBU]o = 100 mg L−1, 308 K-Langmuir40[69]
GO nanoplatelets60 min, pH 2–10, [IBU]o = 100 mg L−1PSOLangmuir2.4–3.7[71]
Cu-doped MIL-101Fe360 min, 298 K, pH 2–11, [IBU] = 1–60 mg L−1PSOLangmuir497[75]
Magnetic multi-walled carbon nanotube298 K, pH 4, [IBU] = 20 mg L−1PSOLangmuir1.6–11.8[76]
Fe3O4/Rice husk60 min, pH 7, [IBU]o = 8 mg L−1PSOLangmuir-[77]
Mesoporous silicapH 7, [IBU]o = 4 mg L−1, 298 KPSO--[78]
PAMAM SiO2pH 9, [IBU]o = 1 mg L−1, 298 KPSO-124[79]
Carbon nanotubespH 7, [IBU]o = 42mg L−1, 298 KPSO-231.5
81.6
19.4
[80]
Ordered mesoporous carbonspH 6, [IBU]o = 100 mg L−1, 298 KPSO-120[81]
Polyamidoamine SiO2pH 9, 303 KPSO-9.7[82]
Zinc oxide nanoparticlespH 7, [IBU]o = 100 mg L−1, 298 KPSO-1.1[83]
Nanoclay compositepH 6, [IBU]o = 10 mg L−1, 298 KPSO-9.7[84]
Magnetic genipin-crosslinked chitosan/graphene oxide-SO3H compositepH 6, 120 min, [IBU]o = 10 mg L−1, 308 KPSOLangmuir138[85]
Magnetic nanoparticles coated with zeolitepH 8, 20 min, [IBU]o = 20 mg L−1, 303 KPSOFreundlich-[86]
Fe3O4@graphene nanoplatelets
nanocomposite
pH 2, 200 min, [IBU]o = 0.1 mg L−1, 303 KPSO-9.2[87]
NiFe2O4/activated carbonpH 2, 240 min, [IBU]o = 100 mg L−1, 328 KPSOSips261[88]
Amine-coated magnetic nanocomposite NiFe2O4@SiO2pH 7, 15 min, [IBU]o = 12 mg L−1, 298 KPSOLangmuir59[89]
Rape straw biomass fiber/β-Cyclodextrin/Fe3O4pH 6, 20 min, [IBU]o = 100 mg L−1, 308 KPSOFreundlich48[89]
Kaolinite298 K, pH 3, [IBU]o = 60 mg L−1--3.1[90]
Goethite298 K, pH 3, [IBU]o = 60 mg L−1--6.1[90]
Fe3O4/HNTs1440 min, pH 2, [IBU]o = 15 mg L−1PSOFreundlich5.144This work
Table 8. Code and levels for monitoring the design of the removal of IBU on the Fe3O4/HNTs.
RunCodeLow Level (−1)Central PointHigh Level (+1)
pHX1 = A2.07.012
H2O2 (M)X2 = B0.050.2750.5
Fe3O4/HNTs (g L−1)X3 = C0.50.751.0
Table 9. Results obtained from the IBU removal monitoring design.
RunH2O2
(M)
Fe3O4/HNTs
(g L−1)
pHRemoved IBU
(%)
10.0500.5285
20.0500.51254
30.0501.0291
40.0501.01269
50.5000.5287
60.5000.51256
70.5001.0294
80.5001.01272
90.2750.75789
100.2750.75788
110.2750.75788
Table 10. Lack-of-fit test of the monitoring models for the removal of IBU onto Fe3O4/HNTs.
SourceSequential p-ValueLack of Fit p-ValueAdjusted R2Predicted R2
Linear0.79700.0141−0.1621−0.7955
2FI0.73790.0113−0.2881−2.6005
Quadratic<0.00010.52120.92510.8204
Cubic0.84150.22460.8969−1.0033
Table 11. Analyses of variance (ANOVA) for the quadratic model describing IBU removal.
SourceSum of SquaresDfMean SquareF-Valuep-Value
Model1707.437243.921177.020.0008
A-pH1416.1811416.186833.770.0001
B-H2O212.40112.4059.840.0163
C-Fe3O4/HNTs237.621237.621146.630.0009
AB0.036510.03650.17590.7157
AC40.05140.05193.270.0051
BC0.616110.61612.970.2268
ABC0.520210.52022.510.2540
Curvature354.521354.521565.960.0006
Pure Error0.414520.2072----
Cor Total2032.3610------
Table 12. Code and levels of Box–Behnken design for degradation of IBU.
FactorCodeLow Level (−1)Central PointHigh Level (+1)
H2O2X1 = A0.250.50.75
Fe3O4/HNTs
(g L−1)
X2 = B0.51.52.5
Table 13. Degradation efficiency of IBU on Fe3O4/HNTs.
RunH2O2
(M)
Fe3O4/HNTs
(g L−1)
Removed IBU
(%)
10.250.587
20.251.594
30.252.589
40.500.589
50.501.599
60.501.599
70.501.597
80.501.598
90.502.590
100.750.591
110.751.598
120.752.589
Table 14. Lack-of-fit test of the optimization models for the removal of IBU onto Fe3O4/HNTs.
SourceSequential p-ValueLack of Fit p-ValueAdjusted R2Predicted R2
Linear0.79700.0141−0.1621−0.7955
2FI0.73790.0113−0.2881−2.6005
Quadratic<0.00010.52120.92510.8204
Cubic0.84150.22460.8969−1.0033
Table 15. Analysis of variance (ANOVA) for the Box–Behnken experimental design for the IBU removal with Fe3O4/HNTs.
SourceSum of SquaresDfMean SquareF-Valuep-Value
Model234.83546.9728.160.0004
A-H2O211.56111.566.930.0389
B-Fe3O4/HNTs0.476010.47600.28540.6124
AB3.4413.442.060.2009
A26.0716.073.640.1050
B2167.641167.64100.51<0.0001
Residual10.0161.67----
Lack of fit4.8431.610.93560.5212
Pure Error5.1731.72----
Corr total244.8411------
Table 16. Performance comparison and reaction conditions of Fe3O4/HNTs and other Fe-based catalysts.
CatalystProcessIBU RemovedExperimental ConditionReference
Fe (ll)Sonolysis and sono-Fenton50%pH (2.6–8.0), [Fe2+] = 10 mg L−1, 3 h[35]
Fe(III)-gallic acid complexHomogeneous modified Fenton-like oxidation90.9%pH 7, Room temperature, [IBU]o = 0.05 M, [FeIII-GA complex] = 0.1 mM[36]
Activated carbon fibers (ACFs) supported ferric citrate (Cit-Fe/ACFs)Electro-Fenton97%120 min, current density of 7 mA cm−2[95]
Zero-valent ironElectro-Fenton92%pH 6, current density: 0.5 mA cm−2, time 1 h, [H2O2] in excess[40]
Zero-valent iron
(metallic Fe)
Electro-Fenton80%pH 6, [H2O2] = 50 μM, dosage ZVI 0.01 g L−1[40]
Fe-ordered mesoporous carbon (OMC) Plasma-supported Fenton reactions83%[IBU]o = 50 mg/L, [H2O2]o = 43.3 mg L−1, 2 h, [H2O2] = 21.9 mg L−1[38]
Fe-zeolitePlasma-supported Fenton 88%Fe-zeolite = 1–5 g L−1, “natural” pH[35]
Fe/ZrO2Heterogeneous-Fentondegradation (98%), mineralization (40%)H 5, 343.15 K, [H2O2] (3%) 25 mL L−1, (0.0880 mol L−1), [IBU]o = 10 mg L−1, 2 h[96]
Fe/ZrO2Fenton-like process80%pH 3, 343.15 K, [H2O2] = (3%) 30 mL L−1, [IBU]o = 10 mg L−1, 2 h, Fe/ZrO2 = 400 mg L−1[97]
Iron-based MOF Photo-Fenton80%pH 7.0, 296.15 ± 2 K [IBU]o = 15 mg L−1; [Fe3O4] = 1.84 g L−1; [H2O2]o = 600 mM; [98]
Fe3O4Heterogeneouso
Fenton-like oxidation
60%pH 7.0, 293.15 K, [H2O2]o = 10 mM, Fe3O4 = 1 g L−1, 50 h, [41]
Fe3O4/clay slurryheterogeneous
Fenton-like oxidation
90%pH 7.0, 296.15 ± 2 K, [IBU]o = 15 mg L−1, Fe3O4 = 2.0 g L−1, [H2O2]o = 600 mM; clay = 4.0 g L−1;[42]
Carbon dots/Fe3O4@CSHeterogeneous
Fenton-like oxidation
90%323.15 K, Persulfate = 5 mmol L−1, [IBU]o = 50 μmol, Fe3O4@CS = 0.3 g L−1, 2 h[43]
Humic acid-coated magnetic particlesHeterogeneous photo-Fenton80% pH 3, [H2O2] = 1.0 mmol L−1, [Fe3O4/0.5HA] = 100 mg L−1, [IBU]o = 0.2 mmolL−1[44]
Pd@Fe3O4Sono-electrolytical Fenton3–100%pH 3, 5.2 y 11, 298.15 K, [H2O2] = 3 mg L−1:
Pd@Fe3O4 = 0.1 g L−1; [IBU]o = 0.2 mg L−1, 1 h,
[45]
Fe3O4/MWCNTsHeterogeneous
Fenton-like oxidation
88.7%pH 3; 20 h[46]
Fe3O4/HNTsHeterogeneous
Fenton-like
99%
Mineralization (60%)
pH 7.0, 293.15 K, [IBU]o = 15 mg L−1, [H2O2] = 0.5 mol L−1, Fe3O4/HNTs = 1.5 g L−1, 24 hThis work
Disclaimer/Publisher’s Note: The statements, opinions and data contained in all publications are solely those of the individual author(s) and contributor(s) and not of MDPI and/or the editor(s). MDPI and/or the editor(s) disclaim responsibility for any injury to people or property resulting from any ideas, methods, instructions or products referred to in the content.