Article

Corrosion Evolution and Mechanisms of N80 Steel in H2S/CO2 Coexisting Systems Under Simulated CCUS-EGR Dynamic Environments
1
Chongqing Gas District, PetroChina Southwest Oil & Gas Field Company, Chongqing 401120, China
2
College of Petroleum Engineering, Chongqing University of Science and Technology, Chongqing 401331, China
3
Chongqing Shale Gas Exploration and Development Co., Ltd., Chongqing 401121, China
4
College of Safety Science and Engineering, Chongqing University of Science and Technology, Chongqing 401331, China
*
Author to whom correspondence should be addressed.
Processes 2026, 14(10), 1552; https://doi.org/10.3390/pr14101552
Submission received: 1 April 2026 / Revised: 2 May 2026 / Accepted: 9 May 2026 / Published: 11 May 2026
(This article belongs to the Section Materials Processes)

Abstract

This study evaluates the corrosion evolution of N80 steel in H2S/CO2 environments simulating Carbon Capture, Utilization, and Storage-Enhanced Gas Recovery (CCUS-EGR) processes. High-pressure autoclave experiments were conducted to analyze the impacts of CO2/H2S partial pressure ratios (2.9–67.4), temperature (40–80 °C), and flow rate. Grey relational analysis indicates that the CO2/H2S partial pressure ratio dominates uniform corrosion (γ = 0.880), while flow rate and temperature primarily govern pitting behavior (γ > 0.85). Increasing the ratio from 2.9 (H2S-dominated) to 67.4 (CO2-dominated) doubled the uniform corrosion rate to 1.042 mm/y but reduced pitting by 46%. Mechanistically, the semiconductor conductivity of FeS (∼10−1 S/cm) drives deep pitting via “large cathode–small anode” galvanic effects. Additionally, fluid shear stress selectively erodes porous FeCO3, enriching surface FeS and creating differential corrosion patterns. A comprehensive evolution model describing the transition from a H2S-dominated regime to mixed control and finally to a CO2-dominated regime is established, providing a theoretical foundation for wellbore integrity management throughout the CCUS-EGR lifecycle.

1. Introduction

With the acceleration of global industrialization, atmospheric CO2 concentration has surged from pre-industrial levels of 280 ppm to over 420 ppm, resulting in a global average temperature increase exceeding 1.1 °C. To address this challenge, the Paris Agreement explicitly proposed the goal of limiting global temperature rise to within 2 °C, driving the implementation of “carbon peak” and “carbon neutrality” strategies worldwide. According to the International Energy Agency (IEA)’s Net Zero by 2050 Roadmap, Carbon Capture, Utilization and Storage (CCUS) technology could account for 15% of global emission reductions, emphasizing its indispensable role in achieving climate goals [1,2,3]. As one of the key technological pathways for achieving deep decarbonization, Carbon Capture, Utilization and Storage (CCUS) has garnered widespread attention due to its dual benefits of emission reduction and economic feasibility [4,5].
CCUS technology encompasses diverse application scenarios. Injecting captured CO2 into depleted or low-pressure gas reservoirs can achieve geological storage while enhancing natural gas recovery through gas displacement, a process known as Enhanced Gas Recovery (EGR). This approach is considered one of the most commercially viable directions [6,7,8,9]. Oldenburg [6] first proposed the CO2-EGR concept, suggesting that CO2 used as a cushion gas could enhance natural gas storage capacity. Pilot tests at the Pembina gas field in Alberta, Canada, and the K12-B gas field in the Netherlands confirmed that CO2-EGR can increase reservoir recovery by 5–15% while achieving long-term CO2 geological storage [8,9].
China’s Sichuan–Chongqing region possesses abundant depleted gas field resources and mature natural gas extraction infrastructure, providing unique advantages for large-scale CCUS-EGR applications. PetroChina Southwest Oil & Gas Field Company recently launched several CCUS-EGR pilot projects in the Wolonghe field [10]. However, during CCUS-EGR implementation, as supercritical CO2 is continuously injected into reservoirs, the composition of produced gas undergoes significant dynamic evolution: initially, produced gas primarily consists of original natural gas containing trace to moderate concentrations of H2S (typically 0.5–5%). As injected CO2 breaks through, the CO2 content in produced gas progressively increases from an initial 2–5% to 30–60% or even higher. Previous studies showed that this process is accompanied by a significant decrease in formation water pH and the dissolution of reservoir minerals, which is the fundamental cause of the dramatic change in produced gas composition and the associated subsequent corrosion risks [11,12]. The evolving H2S/CO2 partial pressure ratios in gas composition expose wellbore casing to long-term complex corrosion, challenging wellbore integrity.
In oil and gas production, both H2S and CO2 are typical acidic corrosive gases, and their corrosion mechanisms have been extensively studied. Regarding single H2S corrosion, Smith and Joosten [13] systematically reviewed the corrosion behavior of carbon steel by H2S in CO2-containing oilfield environments, finding that H2S can rapidly react with steel substrates to form iron sulfide (FeS) protective films. Shoesmith et al. [14] revealed the film formation kinetics of FeS and its influence on corrosion rates through electrochemical studies. Ma et al. [15] found that the protectiveness of FeS films depends on temperature and pH, with mackinawite-type FeS films formed under alkaline and neutral conditions exhibiting compact structures. However, Zheng et al. [16] pointed out that FeS films readily dissolve under acidic conditions, and their semiconductor properties may trigger localized galvanic corrosion.
Regarding single CO2 corrosion, Dugstad [17] thoroughly investigated FeCO3 protective film formation conditions, indicating that FeCO3 films are protective when temperature exceeds 60 °C and pH is greater than 5.5. Sun and Nešić [18,19] revealed the multi-step mechanisms of FeCO3 nucleation and growth through kinetic studies, emphasizing the control of supersaturation on film formation rates. Hua et al. [20] found that flow velocity significantly affects FeCO3 film stability, with loose FeCO3 being easily eroded at high velocities.
However, when H2S and CO2 coexist, their competitive adsorption on metal surfaces, interactions between corrosion product films, and alterations in solution chemistry render corrosion behavior extremely complex and difficult to predict [21,22,23]. H2S/CO2 coexisting corrosion has become a research hotspot in recent years. Through electrochemical studies, Choi et al. [24] discovered that trace H2S addition significantly alters the cathodic reaction mechanism of CO2 corrosion. Sun et al. [25] investigated the deposition kinetics of mixed FeS/FeCO3 films, noting that the relative proportions of the two phases depend on the concentration ratio of S2− to CO32− in solution. Ning et al. [26] found that in H2S/CO2 coexisting systems, preferential FeS deposition inhibits FeCO3 formation; however, incomplete FeS films lead to severe localized corrosion.
Numerous studies have been conducted under different H2S/CO2 partial pressure ratio (PCO2/PH2S) conditions. Based on field data, Pots [27] proposed that the system is H2S-dominated when PCO2/PH2S ≤ 20, mixed corrosion-controlled when 20 < PCO2/PH2S ≤ 500, and CO2-dominated when PCO2/PH2S > 500. However, Sun et al. [28] observed that this classification oversimplifies actual corrosion behavior, which is synergistically influenced by temperature, pressure, and flow velocity. In China, Qiu et al. [29] investigated the dominant wellbore corrosion factors in CO2-H2S environments on the Tazhong I gas field and proposed targeted anti-corrosion strategies. Zhu et al. [30] investigated the corrosion behavior of P110 steel in CO2/H2S environments through dynamic corrosion experiments, finding that flow velocity significantly affects corrosion morphology.
In high-concentration H2S/CO2 coexisting systems, Liu et al. [31] compared the corrosion mechanisms of N80, P110, 3Cr steels. Lai and Miao [32] identified the partial pressure ratio as the dominant factor affecting corrosion rate under 4% H2S + 5% CO2. On temperature effects, Gao et al. [33] found that for S135 and G105 steels, corrosion rate at 180 °C was approximately 60% lower than at 100 °C due to compact FeS film formation. Song [34] compared corrosion behavior of 80S and N80 steels, while Song et al. [35] revealed the corrosion mechanism of 20 steel.
Localized corrosion mechanism research in H2S/CO2 coexisting systems is relatively scarce. Kakooei et al. [36] found that heterogeneous product films are the main cause of pitting initiation. Parakala [37] studied film formation behavior through electrochemical impedance spectroscopy (EIS), finding that FeS semiconductor properties may trigger galvanic corrosion. Sherar et al. [38] confirmed significant potential differences between FeS and substrate iron using scanning Kelvin probe microscopy, providing the driving force for galvanic corrosion. However, systematical experimental verification and quantitative analysis of the “large cathode–small anode” effect induced by FeS conductivity and its promotion mechanism for deep pitting remain lacking.
Regarding flow velocity effects, Hodgkiess and Neville [39] found that damage to product film integrity by fluid shear forces is the main cause of accelerated corrosion. Barker et al. [40] investigated the effects of flow velocity on FeCO3 film stability in CO2 corrosion, finding a critical velocity of approximately 3 m/s. Pessu et al. [41] revealed through computational fluid dynamics (CFD) simulations that local high-velocity zones at pipe elbows are prone to severe corrosion. However, research on selective erosion effects of flow velocity on FeS/FeCO3 biphasic films in H2S/CO2 coexisting systems—and the resulting corrosion mode transitions—remains scarce, limiting the fundamental understanding of localized corrosion mechanisms under dynamic flow conditions.
Although previous studies have advanced the understanding of H2S/CO2 corrosion [12,13,14,15,16,17,18,19,20,21,22,23,24,25,26,27,28,29,30,31,32,33,34,35], critical gaps remain: (1) Most experiments employ fixed H2S/CO2 ratios, failing to capture the dynamic CO2 evolution throughout the CCUS-EGR lifecycle, and corrosion mode transition patterns under varying partial pressure ratios remain unclear. (2) The synergistic influence patterns of temperature and flow rate across different partial pressure ratio stages have not been quantitatively characterized. (3) Localized pitting mechanisms in H2S/CO2 coexisting systems remain underexplored. Although FeS-induced galvanic effects have been observed [36,37], systematic analysis of the “large cathode–small anode” effect and its role in deep pitting remains lacking. (4) Research on high-velocity, high-production gas wells (>100,000 m3/d) remains scarce, leaving the differential impact of fluid erosion on uniform corrosion versus pitting poorly understood. These knowledge gaps constrain both the accurate assessment of corrosion risks and the scientific formulation of protection strategies for CCUS-EGR gas production wells.
To address the above research gaps, this study uses CCUS-EGR pilot wells in the Wolonghe Gas Field of Chongqing Gas Mine, PetroChina Southwest Oil & Gasfield Company, as the engineering background. N80 steel, widely used in wellbore casing materials, was selected as the research subject. High-temperature high-pressure dynamic corrosion simulation experiments were conducted to systematically investigate the effects of CO2/H2S partial pressure ratio (ranging from 2.9 to 67.4, covering H2S-dominated, mixed-controlled, and CO2-dominated regimes), temperature (40–80 °C, spanning wellhead to bottomhole conditions), and gas flow rate (50,000–110,000 m3/d, representing low to high production rates) on uniform corrosion and localized pitting behavior. Multi-scale characterization (weight loss method, scanning electron microscopy (SEM), energy dispersive spectroscopy (EDS), X-ray diffraction (XRD), and confocal laser scanning microscopy (CLSM)) and grey relational analysis were employed to elucidate corrosion product film evolution and quantify environmental factor contributions.
The main innovations are threefold: (1) simulating dynamic CO2 content increases (2.56%, 30%, 60%) throughout the CCUS-EGR lifecycle to establish corrosion mode transition patterns; (2) revealing the FeS-induced “large cathode–small anode” galvanic pitting mechanism with quantitative S-content/pitting-depth correlation; and (3) clarifying selective erosion of FeS/FeCO3 biphasic films under fluid scouring, governed by “FeCO3 erosion–FeS regeneration” dynamic equilibrium. These findings provide theoretical and data support for material selection, corrosion monitoring and protection strategy optimization in CCUS-EGR gas production wells, contributing to the safe and efficient implementation of this technology in China.

2. Experimental Section

2.1. Experimental Conditions

Experimental conditions are based on a field CCUS-EGR pilot project (Wolonghe Gas Field, Chongqing Gas District, PetroChina Southwest Oil & Gasfield Company). Field data include: CO2: 2.56%, H2S: 0.89% (PCO2/PH2S = 2.9); wellbore temperature: 21–80 °C; produced water: low-salinity, pH = 6. The key factors considered in the experimental setup include temperature and the two dynamic operating parameters—PCO2/PH2S ratio and gas flow rate—after CO2 breakthrough, wherein the gas flow rate ranged from 50,000 to 80,000 to 110,000 m3/d, and CO2 content ranged from 2.56% to 30% to 60%. H2S content and other factors were held constant.

2.2. Materials and Solutions

This study employed N80 carbon steel, a material extensively used for casing and tubing in oil and gas wellbores. Its chemical composition is presented in Table 1. For the immersion tests, the steel was machined into rectangular coupons of 30 mm × 10 mm × 2 mm. Prior to the corrosion experiments, the working surfaces of the specimens were sequentially ground with silicon carbide abrasive papers up to 800 grit to ensure surface uniformity and reproducibility. After mechanical polishing, the coupons were ultrasonically cleaned in acetone and then absolute ethanol to remove organic contaminants and grease, dried with cold compressed air, and stored in a desiccator to prevent atmospheric oxidation before weighing.
The corrosive medium was simulated formation water prepared according to the ionic composition of the produced water from the Wolonghe Gas Field, analytical grade reagents and deionized water (composition listed in Table 2). To simulate the anaerobic wellbore environment and eliminate dissolved oxygen interference, the test solution was purged with high-purity N2 for at least 2 h prior to transfer into the autoclave system.

2.3. High-Temperature High-Pressure (HTHP) Immersion Tests

The corrosion simulation experiments were conducted in a Hastelloy-lined autoclave equipped with a magnetically driven interactive rotation system. This apparatus allows for precise regulation of temperature (±1 °C) and pressure (±0.1 MPa) while simulating the hydrodynamic shear stress of wellbore fluids via specimen rotation.
Prior to testing, the initial weight of each coupon was recorded using an electronic balance with a precision of 0.1 mg. Four replicate coupons were mounted on a polytetrafluoroethylene (PTFE) holder attached to the rotating shaft, ensuring electrical isolation between the coupon and the autoclave body. After sealing, the system was deaerated by purging with high-purity N2 for two hours to remove dissolved oxygen.
The experimental conditions were designed to replicate the dynamic evolution of the downhole environment during the CCUS-EGR process. The total system pressure was maintained at 8 MPa, with temperatures set to 40, 60, and 80 °C, respectively. According to Dalton’s law of partial pressures, a predetermined PCO2/PH2S ratio was obtained by adjusting the composition of the injected gas mixture. Three distinct scenarios were simulated:
H2S-dominated stage (initial production): 2.56% CO2 and 0.89% H2S, corresponding to PCO2/PH2S = 2.9;
Transition stage (CO2 breakthrough): CO2 content increased to 30% with constant H2S, yielding a partial pressure ratio of 33.7;
CO2-dominated stage (late EGR phase): CO2 content reached 60%, resulting in a partial pressure ratio of 67.4.
Additionally, the rotational speed of the shaft was adjusted to simulate flow conditions equivalent to daily natural gas production rates of 50,000, 80,000, and 110,000 m3/d, respectively.
The duration of each immersion test was 72 h. Although this immersion period yields corrosion rates higher than those found in field conditions, it is sufficient to establish stable corrosion product films and to reveal the relative trends and mechanistic transitions investigated in this study. After completion, the coupons were retrieved, and the corrosion scales were removed using an inhibited hydrochloric acid solution, strictly following ASTM G1-03. The cleaned coupons were rinsed with deionized water, dehydrated with ethanol, dried, and re-weighed. The average corrosion rate ( C R   i n   m m / y ) was calculated using the weight loss method according to Equation (1):
C R = 8.76 × Δ W ρ × A × t
where Δ W is the weight loss (g), ρ is the density of N80 steel (7.86 g/cm3), A is the total surface area (cm2), and t is the immersion time (h).

2.4. Surface Characterization Techniques

To elucidate the corrosion mechanisms of N80 steel in the H2S and CO2 coexisting system, a comprehensive suite of analytical techniques was employed to characterize both the corrosion scales and the underlying substrate morphology.
The surface micromorphology of the coupons was examined using a field emission scanning electron microscope (FE-SEM, JSM-7610FPlus, JEOL Ltd., Akishima, Tokyo, Japan) operating in secondary electron mode before and after the removal of corrosion products. Coupled with SEM, EDS was utilized to determine the elemental composition and distribution within the corrosion scales. An accelerating voltage of 15 kV was selected to optimize the spatial resolution and signal intensity for elemental mapping.
To identify the crystalline phases and chemical compounds present in the corrosion scales, XRD analysis was conducted using aBruker D8 diffractometer (Bruker Corporation, Billerica, MA, USA; manufactured in Karlsruhe, Germany) with Cu-Kα radiation λ = 1.5406   Å . The diffractometer operated at 40 kV and 40 mA, scanning a 2θ range from 10° to 90° with a step size of 0.02°. This configuration ensured high sensitivity for detecting major corrosion products such as iron sulfides (FeS) and iron carbonate (FeCO3).
To quantitatively assess the severity of localized corrosion, the three-dimensional (3D) topography of the cleaned surfaces was reconstructed using CLSM (Zeiss LSM 880, Carl Zeiss AG, Oberkochen, Baden-Württemberg, Germany). This non-contact technique facilitated high-precision measurement of pitting geometry, specifically the maximum pit depth. These data were subsequently employed to calculate the localized pitting rate, thereby enabling a rigorous comparison with the uniform corrosion rate derived from weight loss measurements.

2.5. Grey Relational Analysis (GRA)

The corrosion of N80 steel in a multiphase flow environment constitutes a complex, nonlinear dynamic system governed by multiple coupled factors. Given the limited sample size of the experimental matrix, this system conforms to the characteristics of a “grey system” with partially known information. Accordingly, grey relational analysis (GRA) was employed to quantitatively evaluate the sensitivity of corrosion behavior to various environmental parameters and to identify the dominant controlling factors [42].
In this analysis, the uniform corrosion rate and pitting corrosion rate were designated as the reference sequences ( x 0 ), while temperature, PCO2/PH2S ratio, and gas flow rate served as the comparative sequences ( x i ). To eliminate discrepancies arising from different physical units and orders of magnitude, the raw experimental data were first normalized (dimensionless processing) using Equation (2) [43]:
x i k = x i ( k ) m i n x i m a x x i m i n x i
where x i ( k ) represents the normalized value. Subsequently, the grey relational coefficient, ξ i ( k ) , which correlates the reference sequence with the comparative sequences, was calculated using Equation (3):
ξ i k = Δ m i n + ρ Δ m a x Δ 0 i k + ρ Δ m a x
where Δ 0 i ( k ) is the absolute difference between the two sequences; Δ m i n and Δ m a x are the minimum and maximum differences, respectively; and ρ is the resolution coefficient, which was set to the standard value of 0.5 in this study.
Finally, the grey relational grade (GRG), γ i , was derived by averaging the relational coefficients, as shown in Equation (4):
γ i = 1 n k = 1 n ξ i k
A higher value of γ i (closer to 1.0) indicates a stronger correlation, suggesting that the corresponding environmental factor exerts a more significant influence on the corrosion rate trend.

3. Results

3.1. Corrosion Kinetics

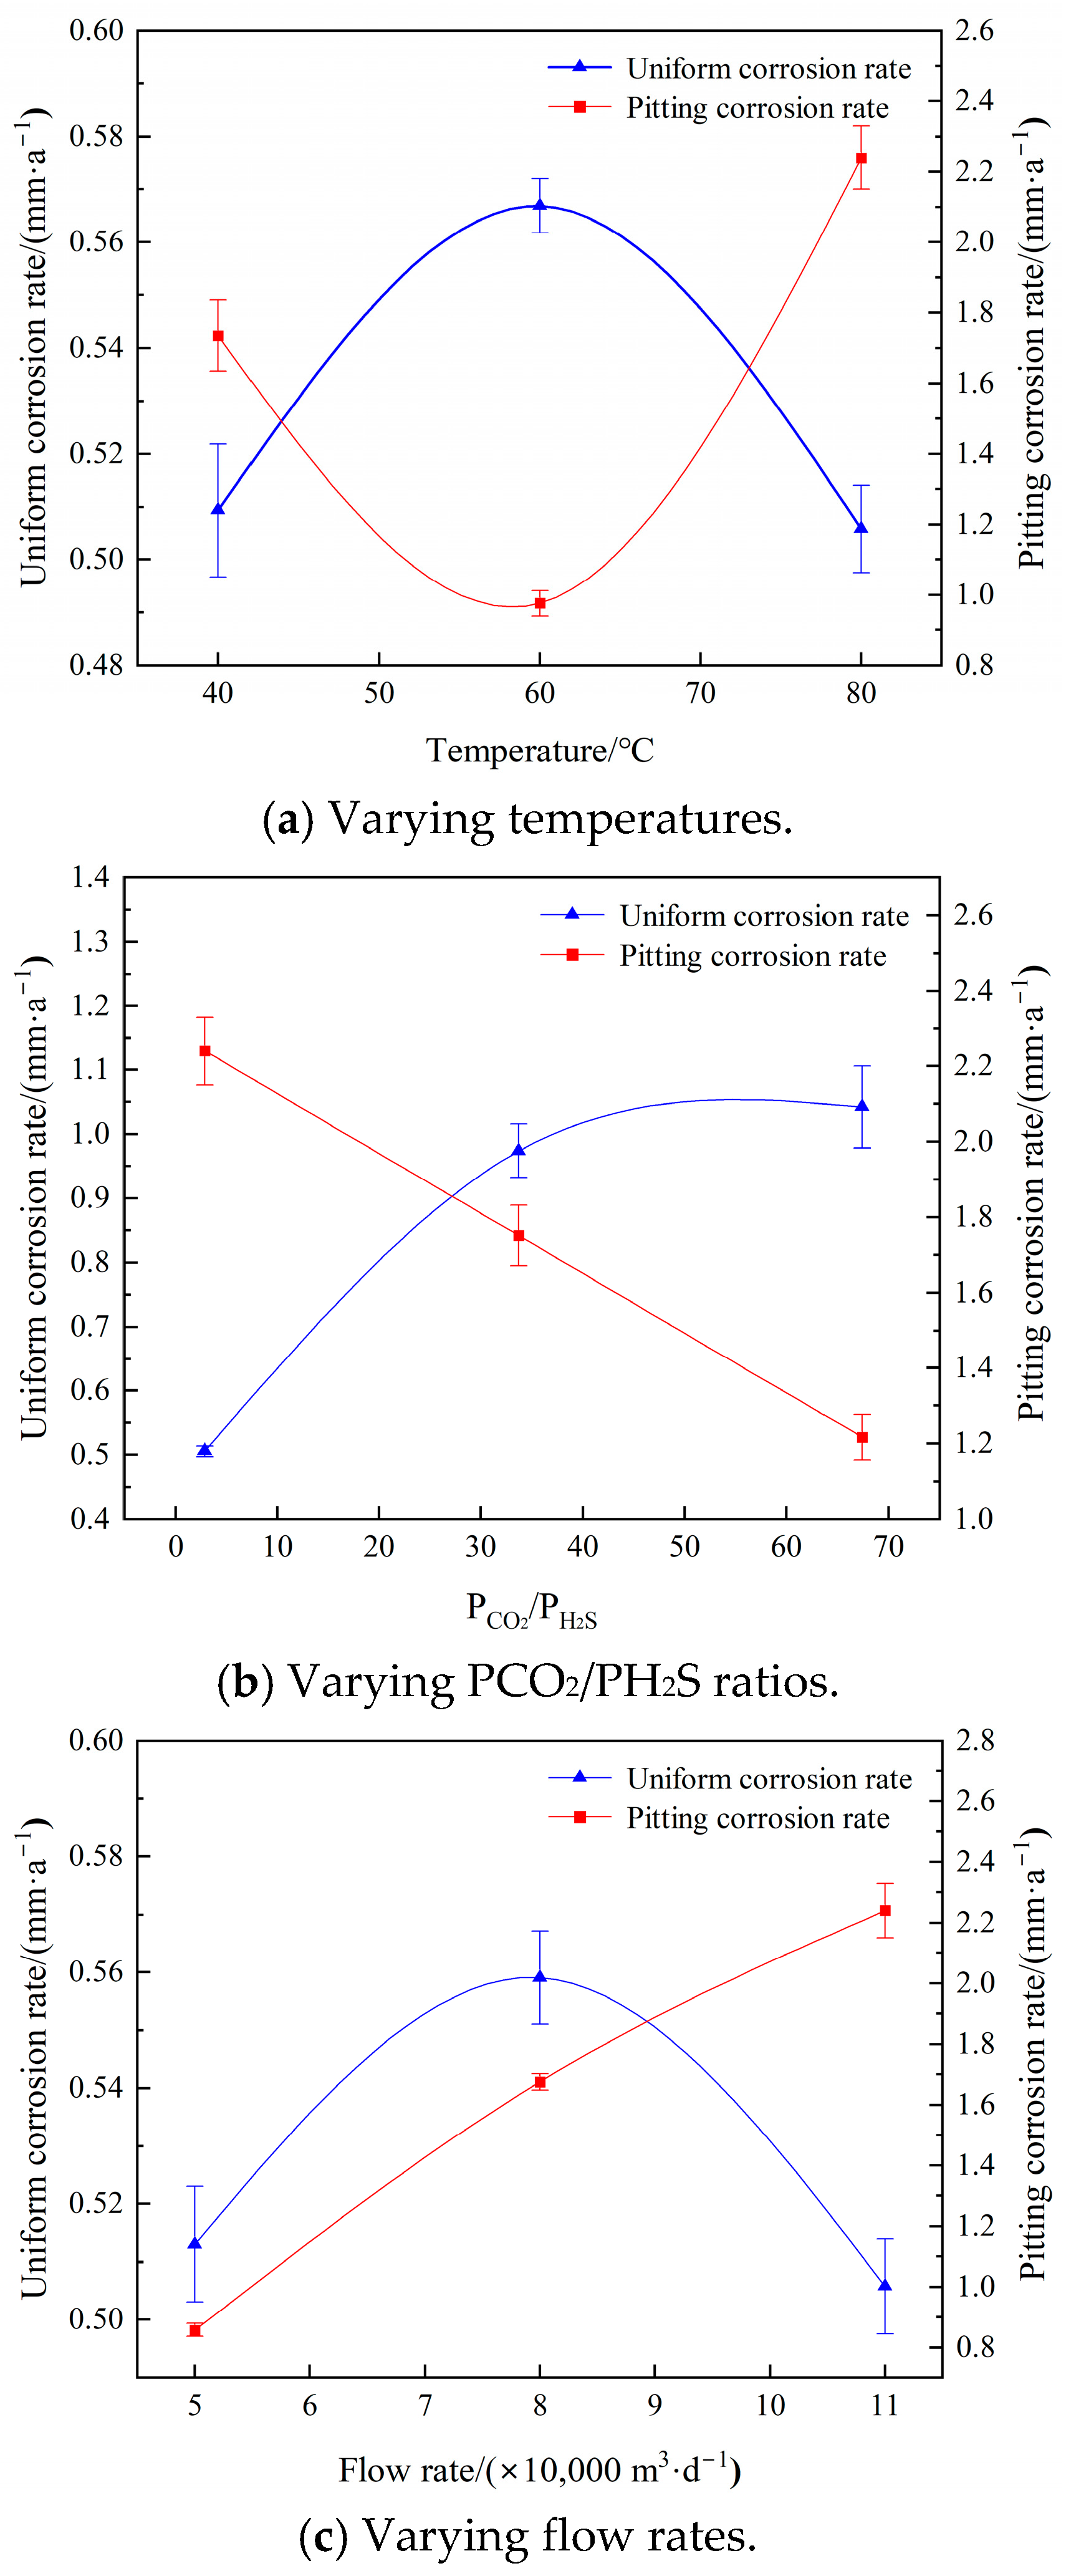
Figure 1 presents the uniform corrosion rate and pitting corrosion rate of N80 steel under seven experimental conditions. By systematically varying temperature, CO2/H2S partial pressure ratio, and flow rate, the two corrosion modes exhibited distinct and contrasting responses to environmental parameters.

3.1.1. Effect of Temperature

Under a PCO2/PH2S ratio of 2.9 and a high flow rate of 110,000 m3/d, the effect of temperature on corrosion behavior is illustrated in Figure 1a. The results reveal that the uniform corrosion rate varied non-monotonically with increasing temperature. Specifically, when the temperature rose from 40 °C to 60 °C, the uniform corrosion rate increased from 0.509 mm/y to a maximum of 0.567 mm/y. However, upon further heating to 80 °C, the corrosion rate decreased to 0.506 mm/y, nearly returning to the level observed at 40 °C.
In stark contrast, the pitting corrosion rate exhibited an opposite trend. At 40 °C, the maximum pitting rate was recorded as 1.735 mm/y. This value decreased significantly to a minimum of 0.976 mm/y at 60 °C (a reduction of approximately 44%). Remarkably, at 80 °C, the pitting rate surged dramatically to 2.240 mm/y, representing the peak value in this test series and marking an increase of approximately 130% compared to that at 60 °C.

3.1.2. Effect of PCO2/PH2S Ratio

Figure 1b depicts the effect of varying PCO2/PH2S ratios on corrosion rates under constant temperature (80 °C) and flow rate (110,000 m3/d). As the PCO2/PH2S ratio increased from 2.9 to 67.4 (corresponding to a CO2 increase from 2.56% to 60%), the uniform corrosion rate exhibited a monotonic increase, progressing from 0.506 mm/y to 0.974 mm/y and ultimately to 1.042 mm/y. At a PCO2/PH2S ratio of 67.4, the uniform corrosion rate was approximately 106% higher than that under a PCO2/PH2S ratio of 2.9, demonstrating that an elevated CO2 concentration substantially accelerates substrate dissolution.
Conversely, the pitting corrosion rate declined progressively with an increasing PCO2/PH2S ratio, decreasing from 2.240 mm/y (PCO2/PH2S ratio of 2.9) to 1.751 mm/y (PCO2/PH2S ratio of 33.7) and further to 1.217 mm/y (PCO2/PH2S ratio of 67.4), representing a reduction of 46%. This divergence between uniform and localized corrosion rates suggests a fundamental shift in corrosion mechanisms as CO2 concentration increases.

3.1.3. Effect of Flow Rate

Under constant temperature (80 °C) and a partial pressure ratio (PCO2/PH2S = 2.9), Figure 1c illustrates the effect of the fluid flow rate on corrosion kinetics. As the flow rate increased from 50,000 m3/d to 80,000 m3/d, the uniform corrosion rate rose modestly from 0.513 mm/y to 0.559 mm/y (an increase of approximately 9%). However, when the flow rate was further increased to 110,000 m3/d, the uniform corrosion rate decreased to 0.506 mm/y, exhibiting a characteristic “bell-shaped” curve with an initial rise followed by a decline.
In contrast, the pitting corrosion rate demonstrated an approximately linear positive correlation with flow rate. The pitting rate was only 0.858 mm/y under the low-flow condition of 50,000 m3/d, but it surged dramatically to 2.240 mm/y when the flow rate increased to 110,000 m3/d, showing a rise of 161%. This indicates that hydrodynamic shear forces exert a far more pronounced accelerating effect on localized corrosion than on uniform corrosion.

3.2. Results of Grey Relational Analysis

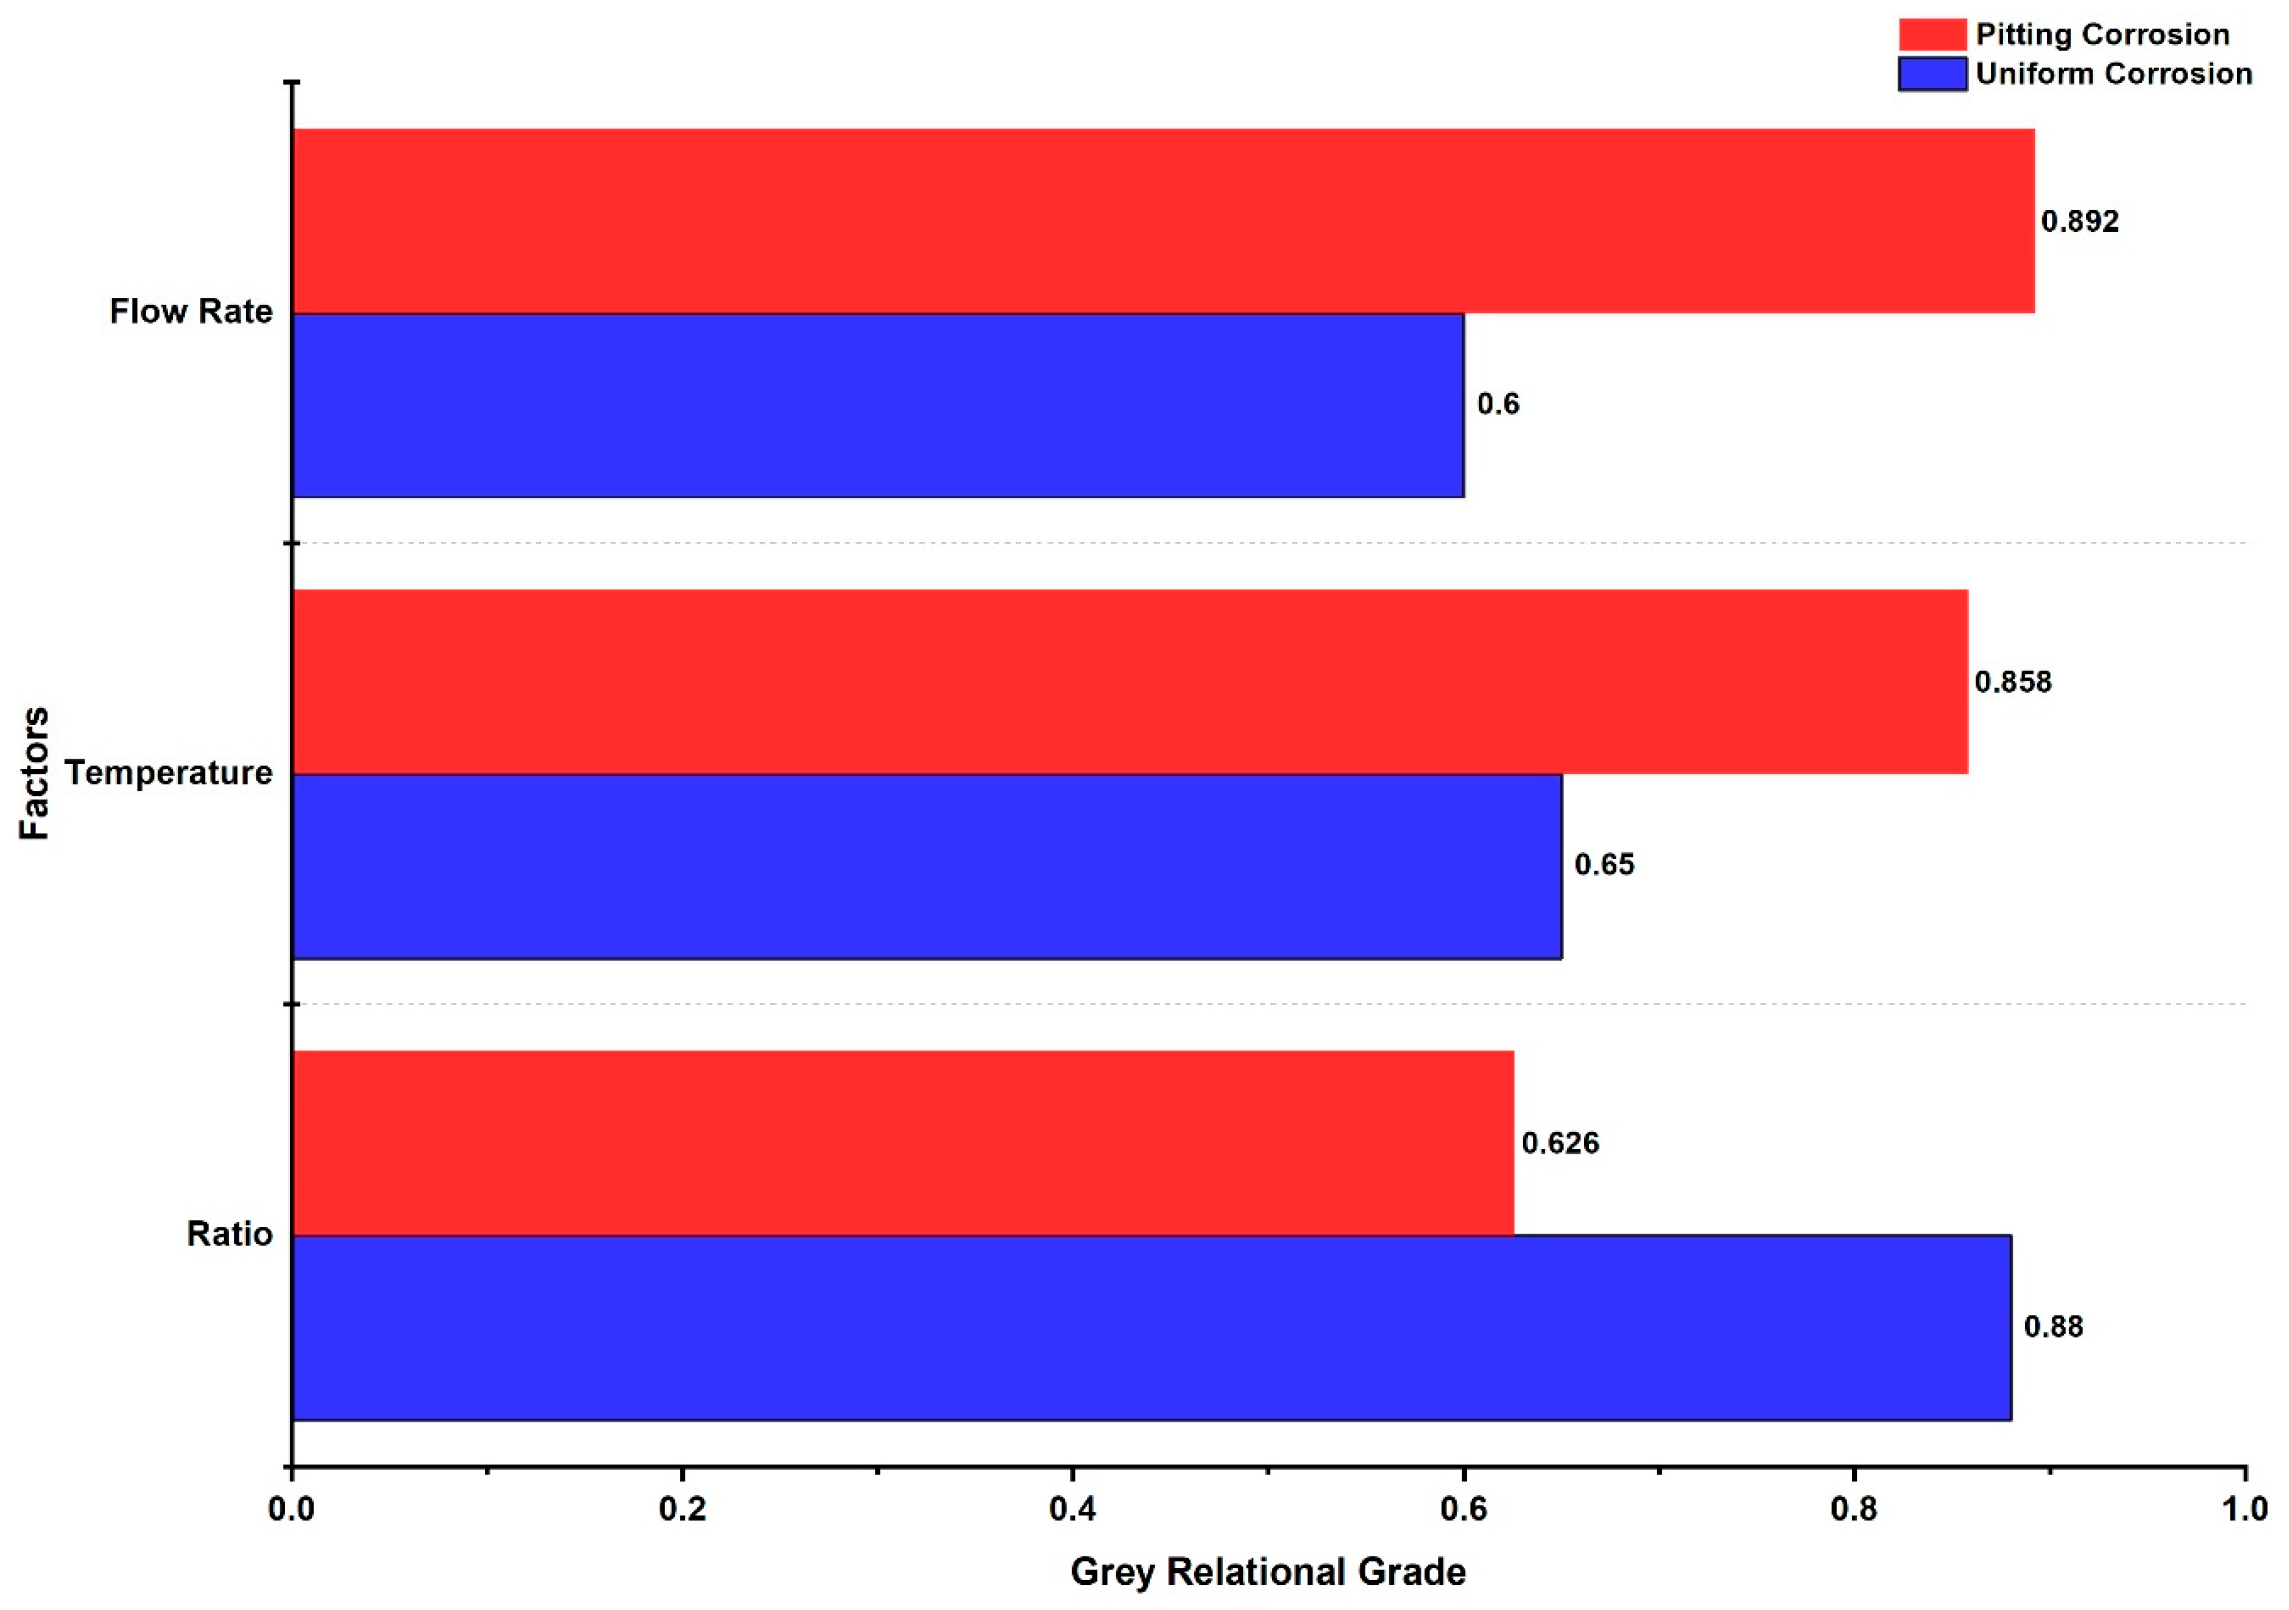
To quantitatively evaluate the relative importance of temperature, PCO2/PH2S ratio, and flow rate on the corrosion behavior of N80 steel, grey relational analysis (GRA) was performed on the experimental dataset. Using the seven experimental conditions (Table 3), the grey relational grades (denoted by γ) between each environmental factor and the corrosion rates were calculated; the results are summarized in Table 4 and illustrated in Figure 2.
The analysis reveals that the PCO2/PH2S ratio exhibited the highest grey relational grade (γ = 0.880), significantly surpassing the influence of temperature (γ = 0.650) and flow rate (γ = 0.600) for uniform corrosion. This quantitatively confirms that the PCO2/PH2S ratio serves as the decisive factor governing the overall dissolution rate of the steel substrate.
In contrast, the ranking of environmental factors for pitting corrosion followed a completely reversed pattern. Flow rate exhibited the highest relational grade (γ = 0.892), followed by temperature (γ = 0.858), whereas the partial pressure ratio showed the lowest value (γ = 0.626). This indicates that hydrodynamic conditions (i.e., shear stress) dominate localized corrosion, outweighing the effect of gas composition.
Temperature exhibited relatively high relational grades for both uniform and pitting corrosion (both ≥0.650), indicating that it influences the formation and evolution of corrosion product scales by governing both thermodynamic equilibrium and reaction kinetics. In contrast, the partial pressure ratio and flow rate displayed a pronounced weight inversion phenomenon between the two corrosion modes. Specifically, the partial pressure ratio showed high sensitivity to uniform corrosion (γ = 0.880) but low sensitivity to pitting (γ = 0.626), whereas flow rate was highly sensitive to pitting (γ = 0.892) but had limited influence on uniform corrosion (γ = 0.600). These findings provide a quantitative basis for corrosion risk stratification and the development of targeted corrosion mitigation strategies in CCUS-EGR gas production wells.

3.3. Surface Morphology and Elemental Composition

To evaluate the protectiveness of corrosion scale microstructures formed under varying operational conditions, we characterized their microstructure and elemental composition. This involved examining the coupon surfaces before and after scale removal using SEM and subsequently performing quantitative elemental analysis with EDS.

3.3.1. Effect of Temperature on Surface Morphology

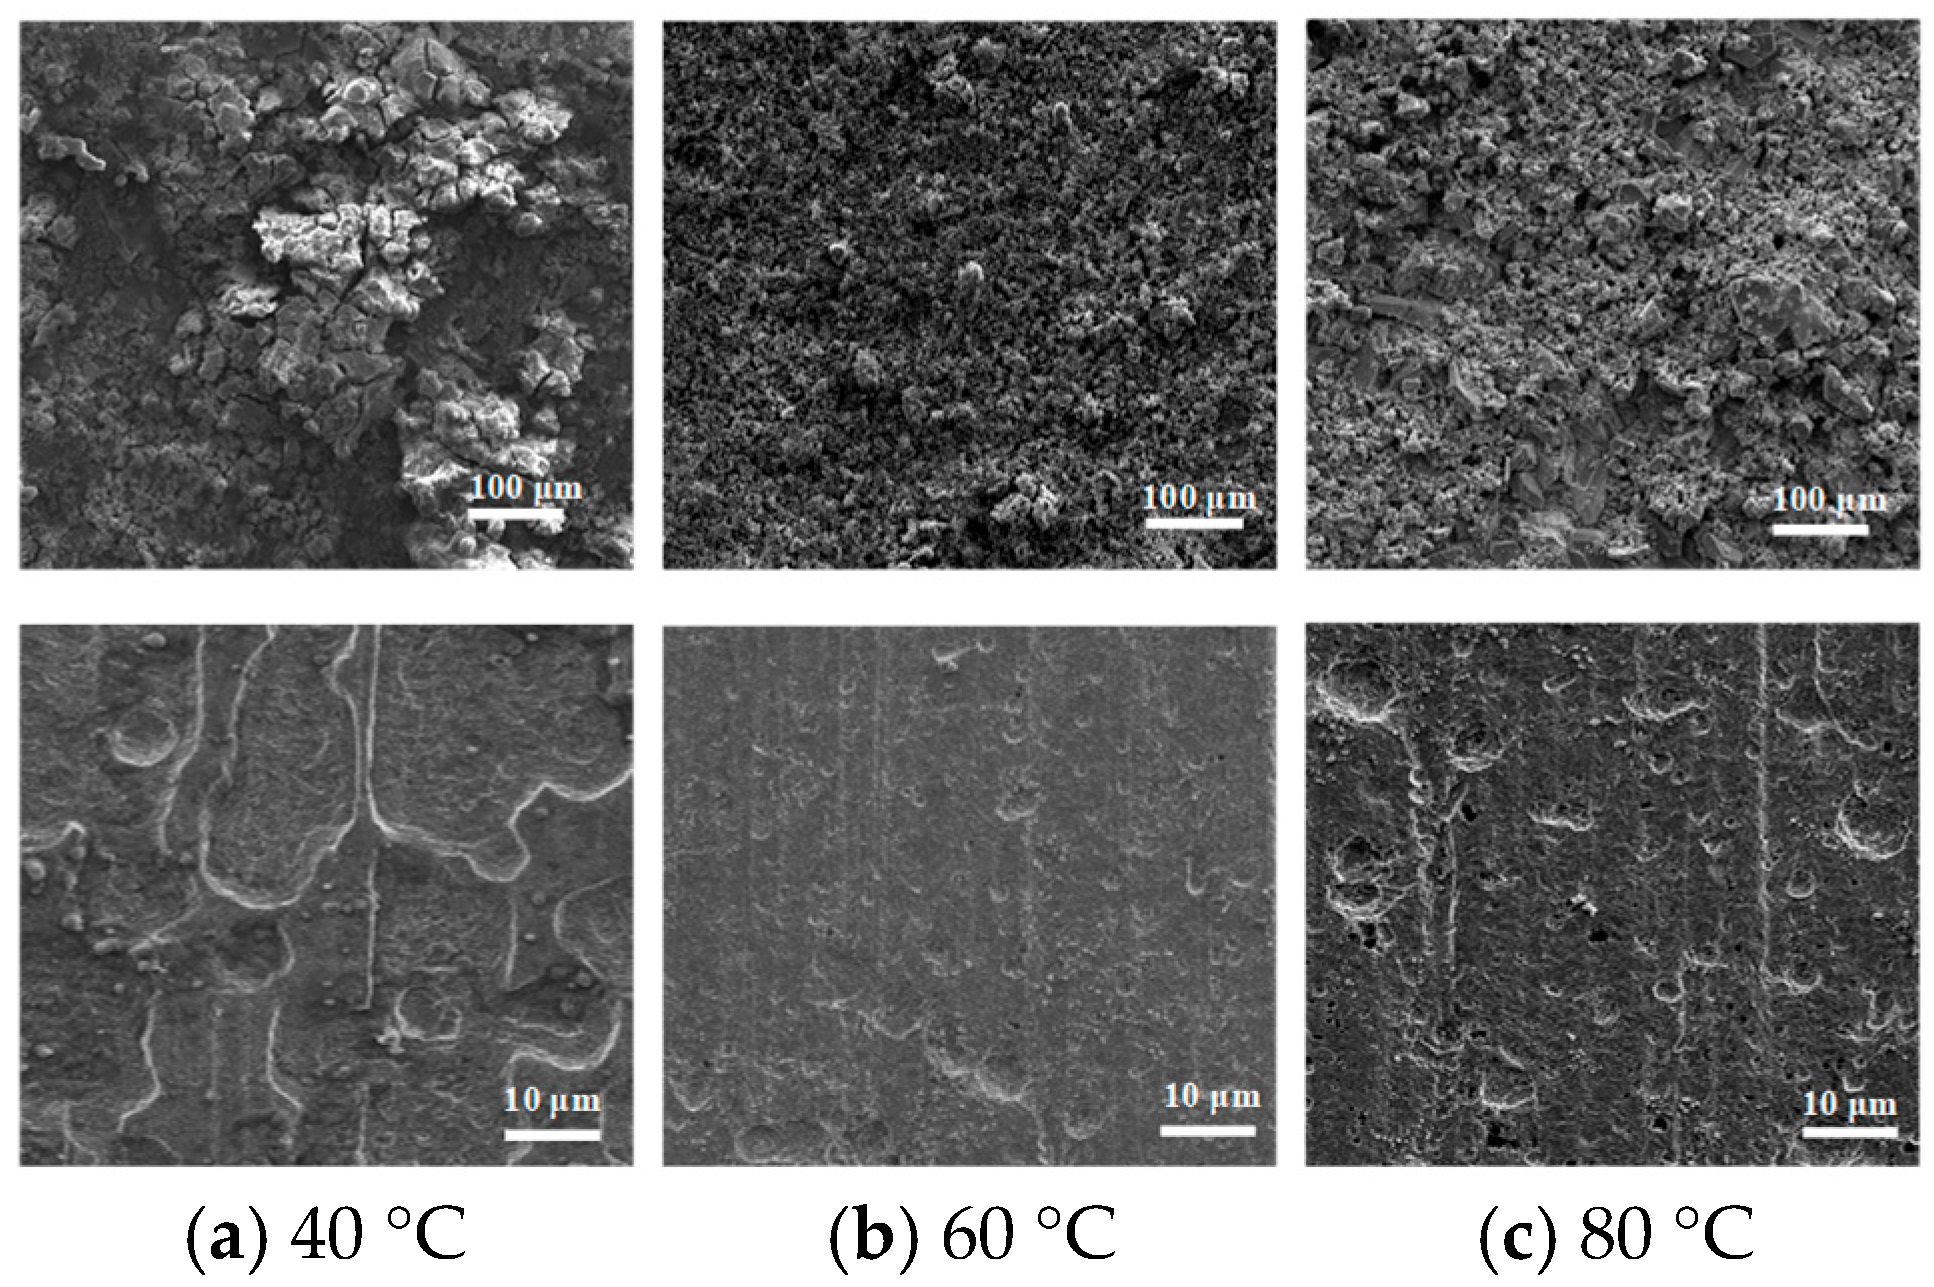
Figure 3 illustrates the effect of temperature (40, 60, and 80 °C) on the corrosion morphology of N80 steel under a constant PCO2/PH2S ratio of 2.9 and a flow rate of 110,000 m3/d.
At 40 °C (Figure 3a), the corrosion scale displayed marked thickness heterogeneity. Thin-layer regions exhibited a compact structure with a well-ordered grain, whereas thick-layer regions showed pronounced cracking, indicating high residual stress within the scale. After scale removal, the substrate revealed unevenly distributed corrosion pits with depths ranging from several to over ten micrometers. EDS analysis (Table 5) showed that the scale contained 14.19 at.% sulfur and 15.08 at.% carbon.
At 60 °C (Figure 3b), the corrosion scale exhibited larger grain sizes and a more porous and loose structure, with notably reduced intergranular packing density. The descaled substrate was relatively smooth, retaining original machining marks and only sparse shallow pits. Compared to 40 °C, the sulfur content at 60 °C decreased to 12.27%, indicating suppressed sulfide formation.
At 80 °C (Figure 3c), the corrosion scale displayed distinct dual-phase structural characteristics: some regions exhibited compact and thick scales with smooth surfaces, whereas localized areas exhibited loose, flocculent structures with evident porosity and gaps. After scale removal, portions of the substrate retained machining textures, but large and deep isolated pits were observed, with pit mouth diameters reaching tens of micrometers. EDS analysis showed a dramatic increase in sulfur content to 29.66%—2.4 times that at 60 °C—while the oxygen content decreased from 30.58% to 20.41%, confirming that elevated temperature promoted preferential sulfide deposition.

3.3.2. Effect of CO2/H2S Partial Pressure Ratio on Surface Morphology

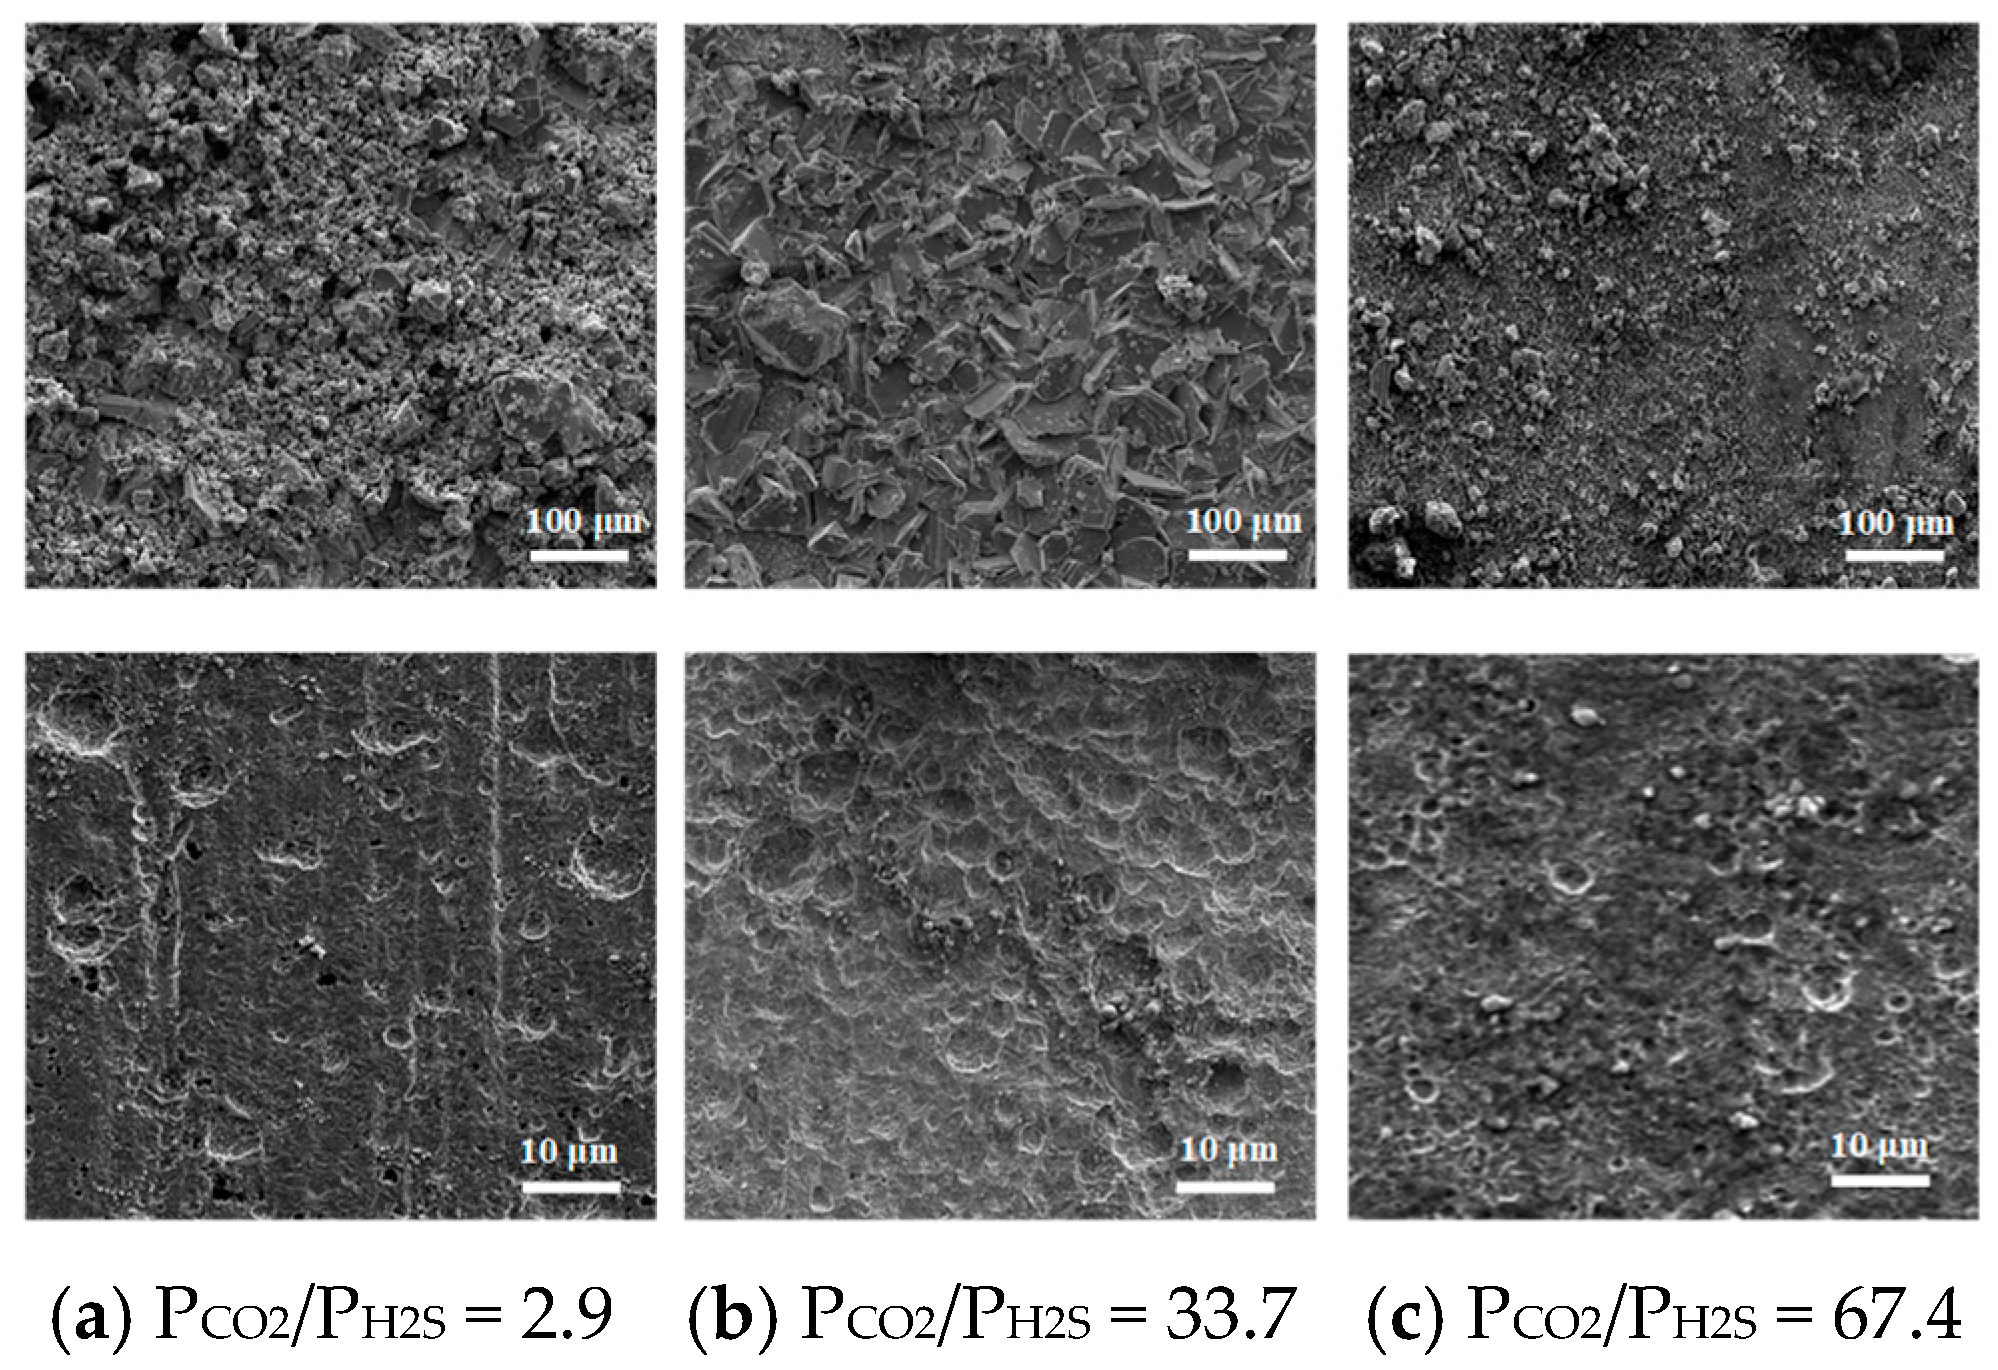
Figure 4 illustrates the effect of varying CO2/H2S partial pressure ratios on surface morphology under constant temperature (80 °C) and flow rate (110,000 m3/d).
At a low PCO2/PH2S ratio (2.9) (Figure 4a), the characteristics of the corrosion scale and substrate after descaling were the same as those previously described at 80 °C (Figure 3c).
At PCO2/PH2S = 33.7 (Figure 4b), the corrosion products exhibited clearly distinguishable crystal grains with a typical polyhedral crystal aggregate morphology and relatively uniform grain stacking. After scale removal, the substrate surface showed a higher density of shallow pits with reduced depths. EDS analysis (Table 6) revealed a decrease in sulfur content to 26.91% and an increase in oxygen content to 22.10%, indicating a higher proportion of carbonate-type products.
At PCO2/PH2S = 67.4 (Figure 4c), the corrosion scale presented a distinctly loose, agglomerated structure with significantly increased surface roughness and abundant micropores and crevices. After scale removal, the substrate surface exhibited characteristics of uniform general dissolution, characterized by a roughened appearance but notably reduced pit depths. EDS data showed a dramatic decrease in sulfur content to only 7.24% (a reduction of 75.6% relative to PCO2/PH2S = 2.9), while oxygen content surged to 48.07% and carbon content remained at 12.39%. This confirms a phase transition from sulfide-dominated to oxide/carbonate-dominated scales.

3.3.3. Effect of Flow Rate on Surface Morphology

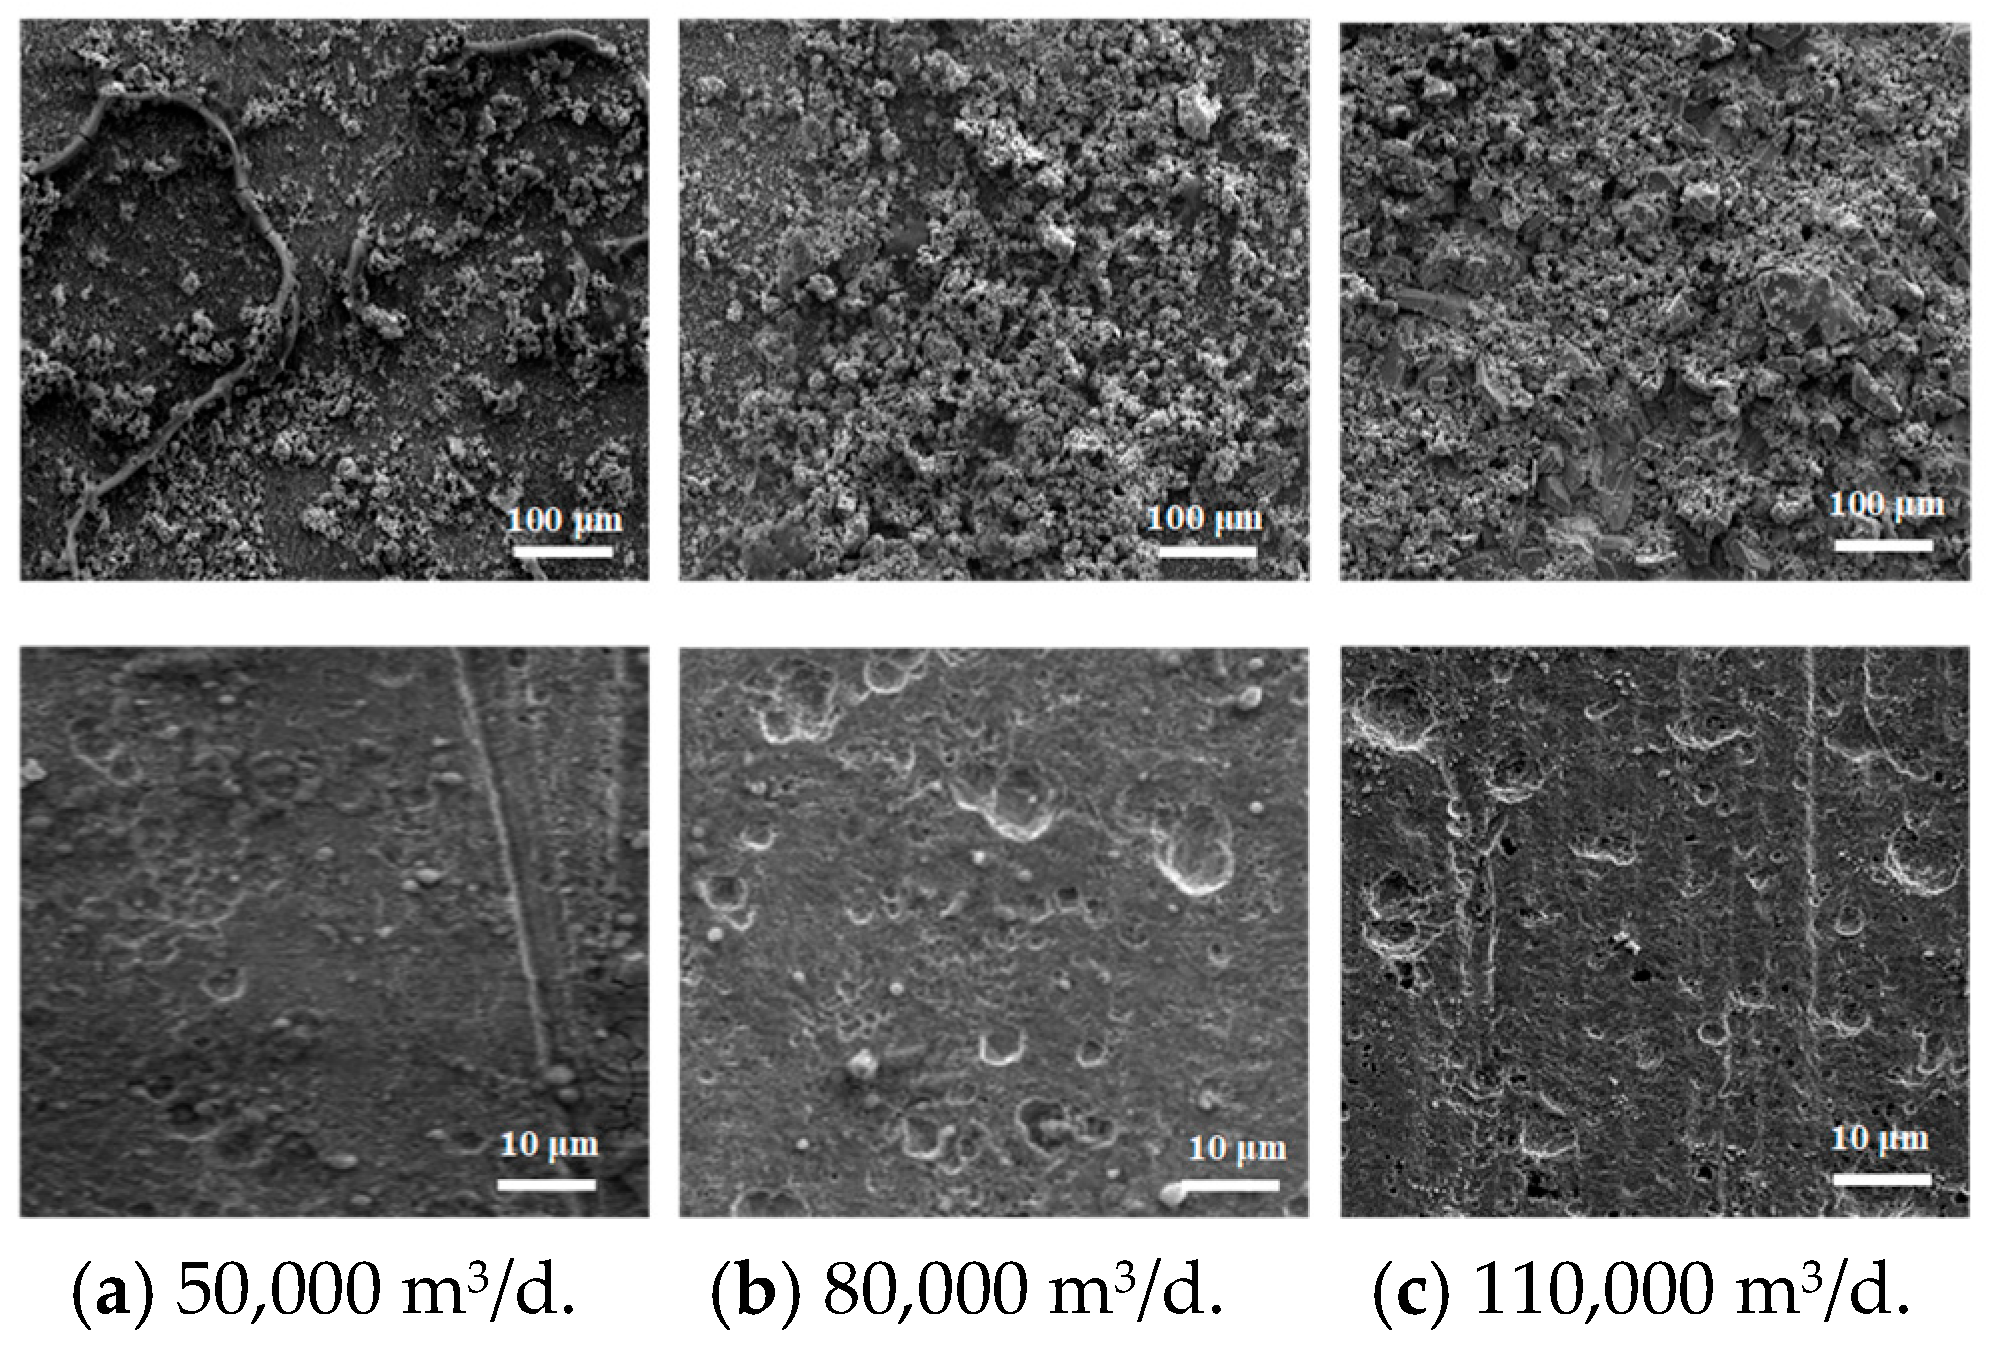
Figure 5 shows the influence of different flow rates on corrosion morphology at constant temperature (80 °C) and partial pressure ratio (PCO2/PH2S = 2.9).
Under low-flow conditions (50,000 m3/d) (Figure 5a), the corrosion scale appeared relatively compact with uniform coverage, albeit with localized regions exhibiting signs of delamination. After removal of the corrosion scale, the underlying substrate surface was comparatively smooth, displaying predominantly uniform corrosion with only a few shallow pits.
When the flow rate was increased to 80,000 m3/d (Figure 5b), the corrosion scale developed pronounced loose and porous characteristics in localized areas, accompanied by reduced mechanical strength and diminished adhesion to the substrate. Following scale removal, the substrate surface revealed numerous large-diameter pitting sites, with pit edges showing distinct traces of fluid erosion.
Under high-flow conditions (110,000 m3/d) (Figure 5c), the corrosion scale was generally compact, though loose and porous regions persisted locally. The cleaned surface exhibited both retained machining textures (indicating protection in certain areas) and pits with significant depth. Notably, under high-flow conditions, the pits displayed a preferential distribution along the fluid flow direction.
EDS analysis (Table 7) revealed that as the flow rate increased from 50,000 to 110,000 m3/d, the sulfur content in the scale increased substantially from 16.61% to 32.67% (an increase of approximately 97%), whereas the oxygen content decreased from 41.54% to 16.33%. These changes indicate that high flow velocity promoted mechanical removal of loose carbonate products, leading to a relative enrichment of more compact sulfide phases in the remaining scale.
Combining SEM morphology observation with EDS elemental analysis revealed that the microstructure and chemical composition of the corrosion scales exhibited high sensitivity to key operational parameters—namely, temperature, partial pressure ratio, and flow rate. Variations in sulfur content directly influenced scale compactness, which in turn dictated the substrate corrosion mode (uniform vs. localized pitting).

3.4. Phase Composition of Corrosion Scales

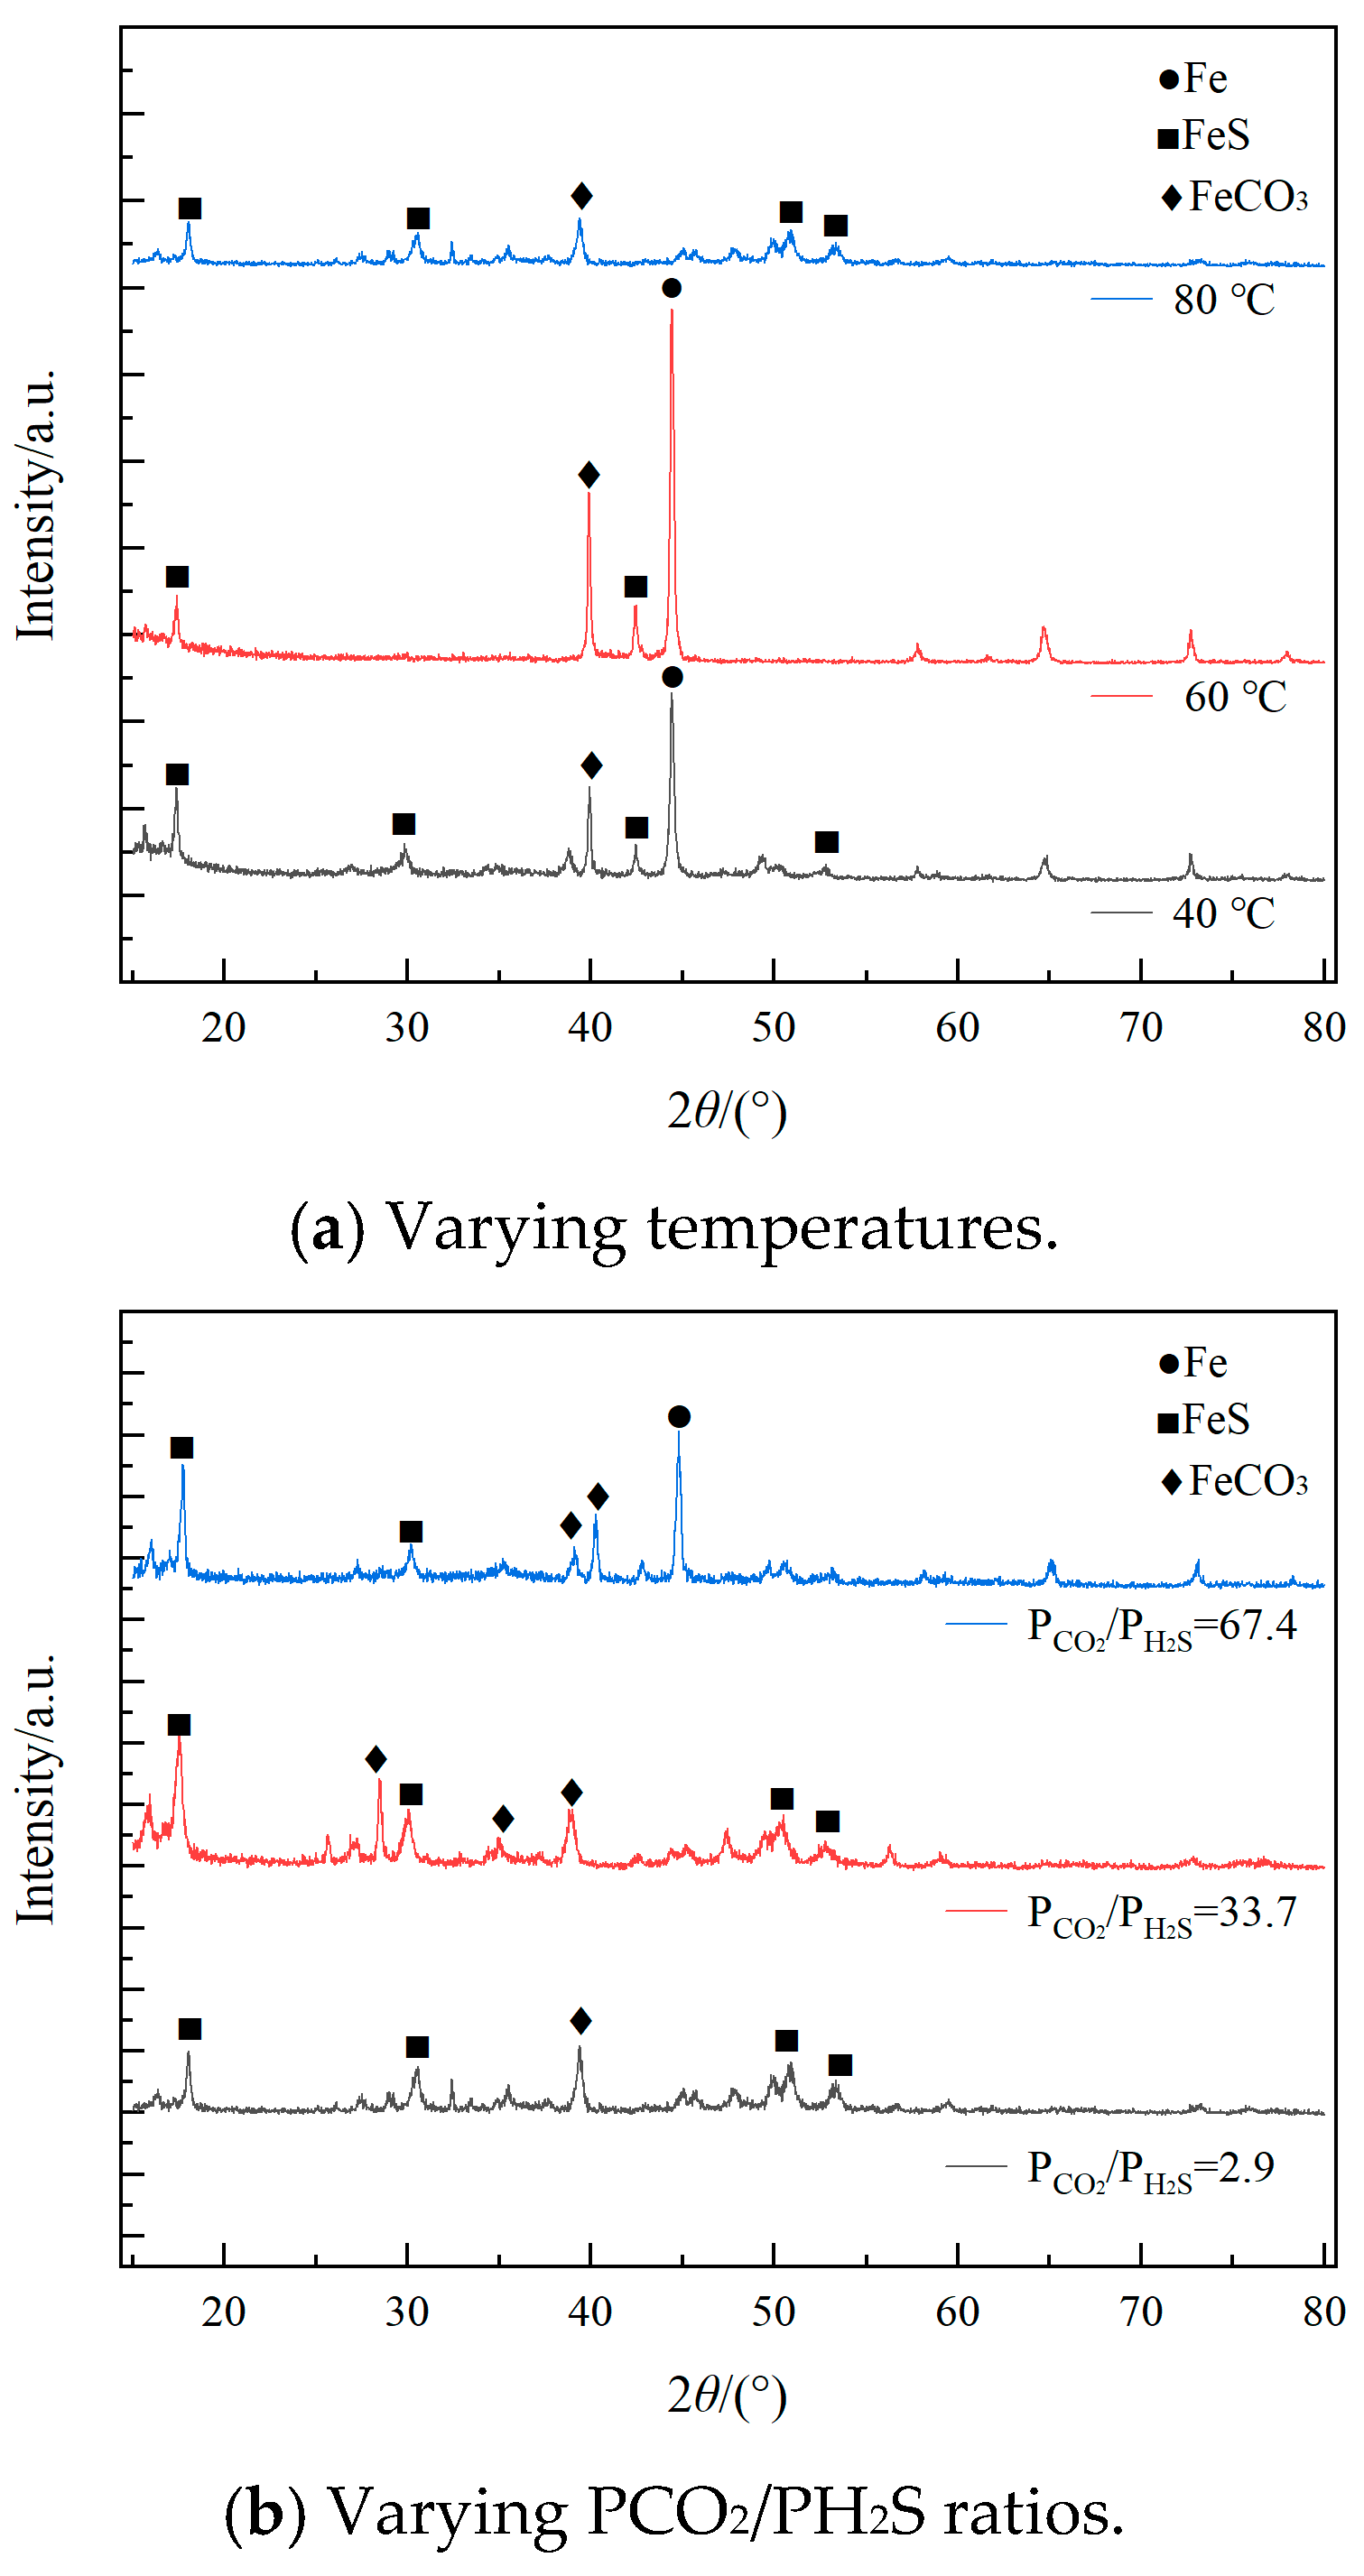
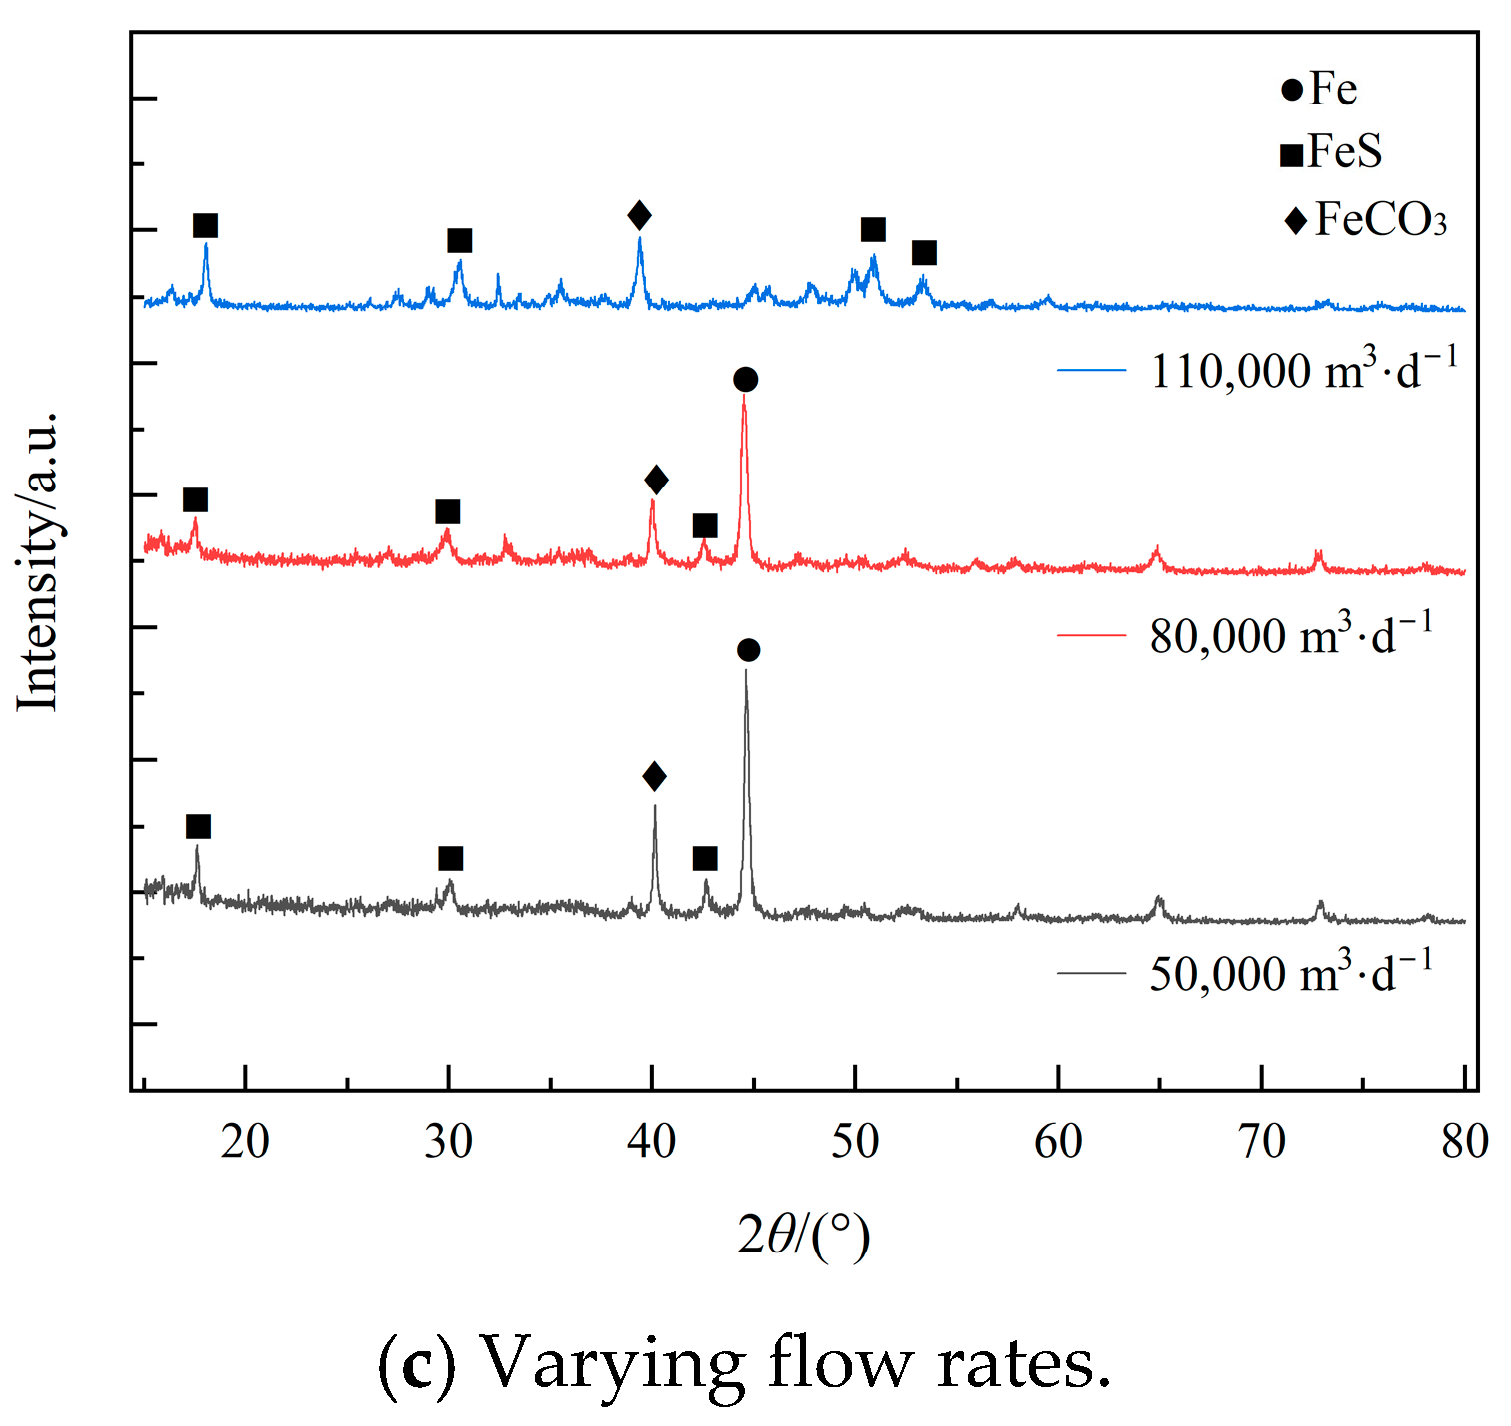
To further confirm the crystalline structure and phase composition of the corrosion products, XRD analysis was performed to characterize the scales formed under varying operational conditions. Figure 6 shows the effects of temperature, PCO2/PH2S ratio, and flow rate on the phase composition of the corrosion scales.

3.4.1. Effect of Temperature on Phase Composition

Figure 6a presents the XRD patterns of corrosion products formed at different temperatures under a constant partial pressure ratio (PCO2/PH2S = 2.9) and flow rate (110,000 m3/d). Under all three temperature conditions, characteristic diffraction peaks corresponding to both iron sulfide (FeS) and iron carbonate (FeCO3) were detected.
The primary diffraction peaks of FeS appeared at 2θ = 30.1°, 33.9°, 43.6°, and 53.2°, corresponding to the (101), (102), (103), and (110) crystallographic planes of tetragonal mackinawite, respectively (JCPDS No. 75-0605). The typical diffraction peaks of FeCO3 were located at 2θ = 24.3°, 32.1°, 38.2°, and 51.8°, corresponding to the (012), (104), (113), and (116) planes of siderite, respectively (JCPDS No. 83-1764).
At 40 °C, the characteristic peaks of FeS exhibited moderate intensity, whereas those of FeCO3 were relatively weak yet clearly distinguishable, indicating a two-phase mixture in the corrosion scale. When the temperature was raised to 60 °C, the intensity of the main FeS peak (2θ = 30.1°) decreased noticeably, while the (104) peak intensity of FeCO3 showed a relative increase, suggesting more active formation of the carbonate phase at this temperature. Under high-temperature conditions (80 °C), all characteristic peaks of FeS intensified significantly, with the (101) and (102) main peaks reaching their maximum heights across the entire experimental series; in contrast, the diffraction peak of FeCO3 became relatively weakened. This result is highly consistent with the EDS analysis, which revealed the highest S content (29.66%) at 80 °C, confirming the preferential deposition of sulfide phases under elevated temperature conditions.

3.4.2. Effect of Partial Pressure Ratio on Phase Composition

Figure 6b shows the effect of varying PCO2/PH2S ratios on the phase composition of the corrosion scales under constant temperature (80 °C) and flow rate (110,000 m3/d). This result clearly reveals the phase evolution with changing conditions.
Under a low partial pressure ratio, the XRD pattern was dominated by sharp and intense characteristic peaks of FeS, indicating the formation of well-crystallized sulfide phases. Although FeCO3 diffraction peaks were also present, their relatively weak intensity suggests that the carbonate phase constituted only a minor component.
When the PCO2/PH2S ratio increased to 33.7, the main peaks’ intensity of FeS began to decline, with peak heights approximately 70% of those at a PCO2/PH2S ratio of 2.9. Concurrently, the characteristic peak intensity of FeCO3 increased markedly. Notably, the intensity of the (104) main peak at 2θ = 32.1° approached that of the FeS (101) peak, implying that the proportions of the two phases within the corrosion scale were approaching equilibrium.
Under a high PCO2/PH2S ratio of 67.4, the phase composition underwent a fundamental transformation. The diffraction peak of FeS substantially attenuated, with only weak residual peak features remaining observable, whereas all characteristic peaks of FeCO3 intensified significantly and became the dominant phase in the pattern. Additionally, a weak diffraction peak corresponding to hematite (Fe2O3) was detected at 2θ ≈ 35.6° (JCPDS No. 33-0664), indicating that the formation of minor amounts of higher-valent iron oxides under the high CO2 concentration and relatively oxidizing environment. This phase evolution trend was in complete agreement with the EDS data, which shows a dramatic decrease in sulfur content from 29.66% to 7.24% and an increase in oxygen content to 48.07%, crystallographically confirming the transition from H2S-dominated to CO2-dominated corrosion mechanisms.

3.4.3. Effect of Flow Rate on Phase Composition

Figure 6c presents the influence of different flow rates on the phase composition of the scales at a constant temperature (80 °C) and partial pressure ratio (PCO2/PH2S = 2.9).
Under low-flow-rate conditions (50,000 m3/d), the XRD pattern revealed the coexistence of FeS and FeCO3 diffraction peaks, with a predominant intensity for FeCO3. This observation indicates that the carbonate phase experienced more sufficient time for deposition and film formation.
When the flow rate was increased to 80,000 m3/d, the characteristic peak intensity of FeS was moderately enhanced, whereas the peak intensity of FeCO3 began to decline, suggesting that fluid erosion began to affect the scale composition.
Under high-flow conditions (110,000 m3/d), the FeS diffraction peaks reached their maximum intensity with sharp peak profiles, whereas the FeCO3 peaks weakened significantly. This observation indicates that under high-flow-velocity conditions, the loosely adherent FeCO3 crystals, which possess poor mechanical adhesion, are more readily removed by fluid erosion, whereas the compact FeS phase, which exhibits strong bonding to the substrate, was selectively retained. This result is fully consistent with the EDS data, which show an increasing sulfur content with flow rate (from 16.61% to 32.67%), confirming a hydrodynamic selective removal effect.
Integrating the XRD phase analysis results reveals that the phase composition of the corrosion scales was significantly regulated by environmental parameters. Specifically, temperature primarily affects the crystallinity and deposition kinetics of FeS; the PCO2/PH2S ratio determines the relative abundance of FeS and FeCO3, serving as the key factor controlling phase succession; and the flow rate modifies the final composition through mechanical removal. These phase variations are directly correlated with the protective performance of the scales, thereby dictating the corrosion behavior of the substrate.

3.5. Three-Dimensional Morphological Characteristics of Localized Corrosion

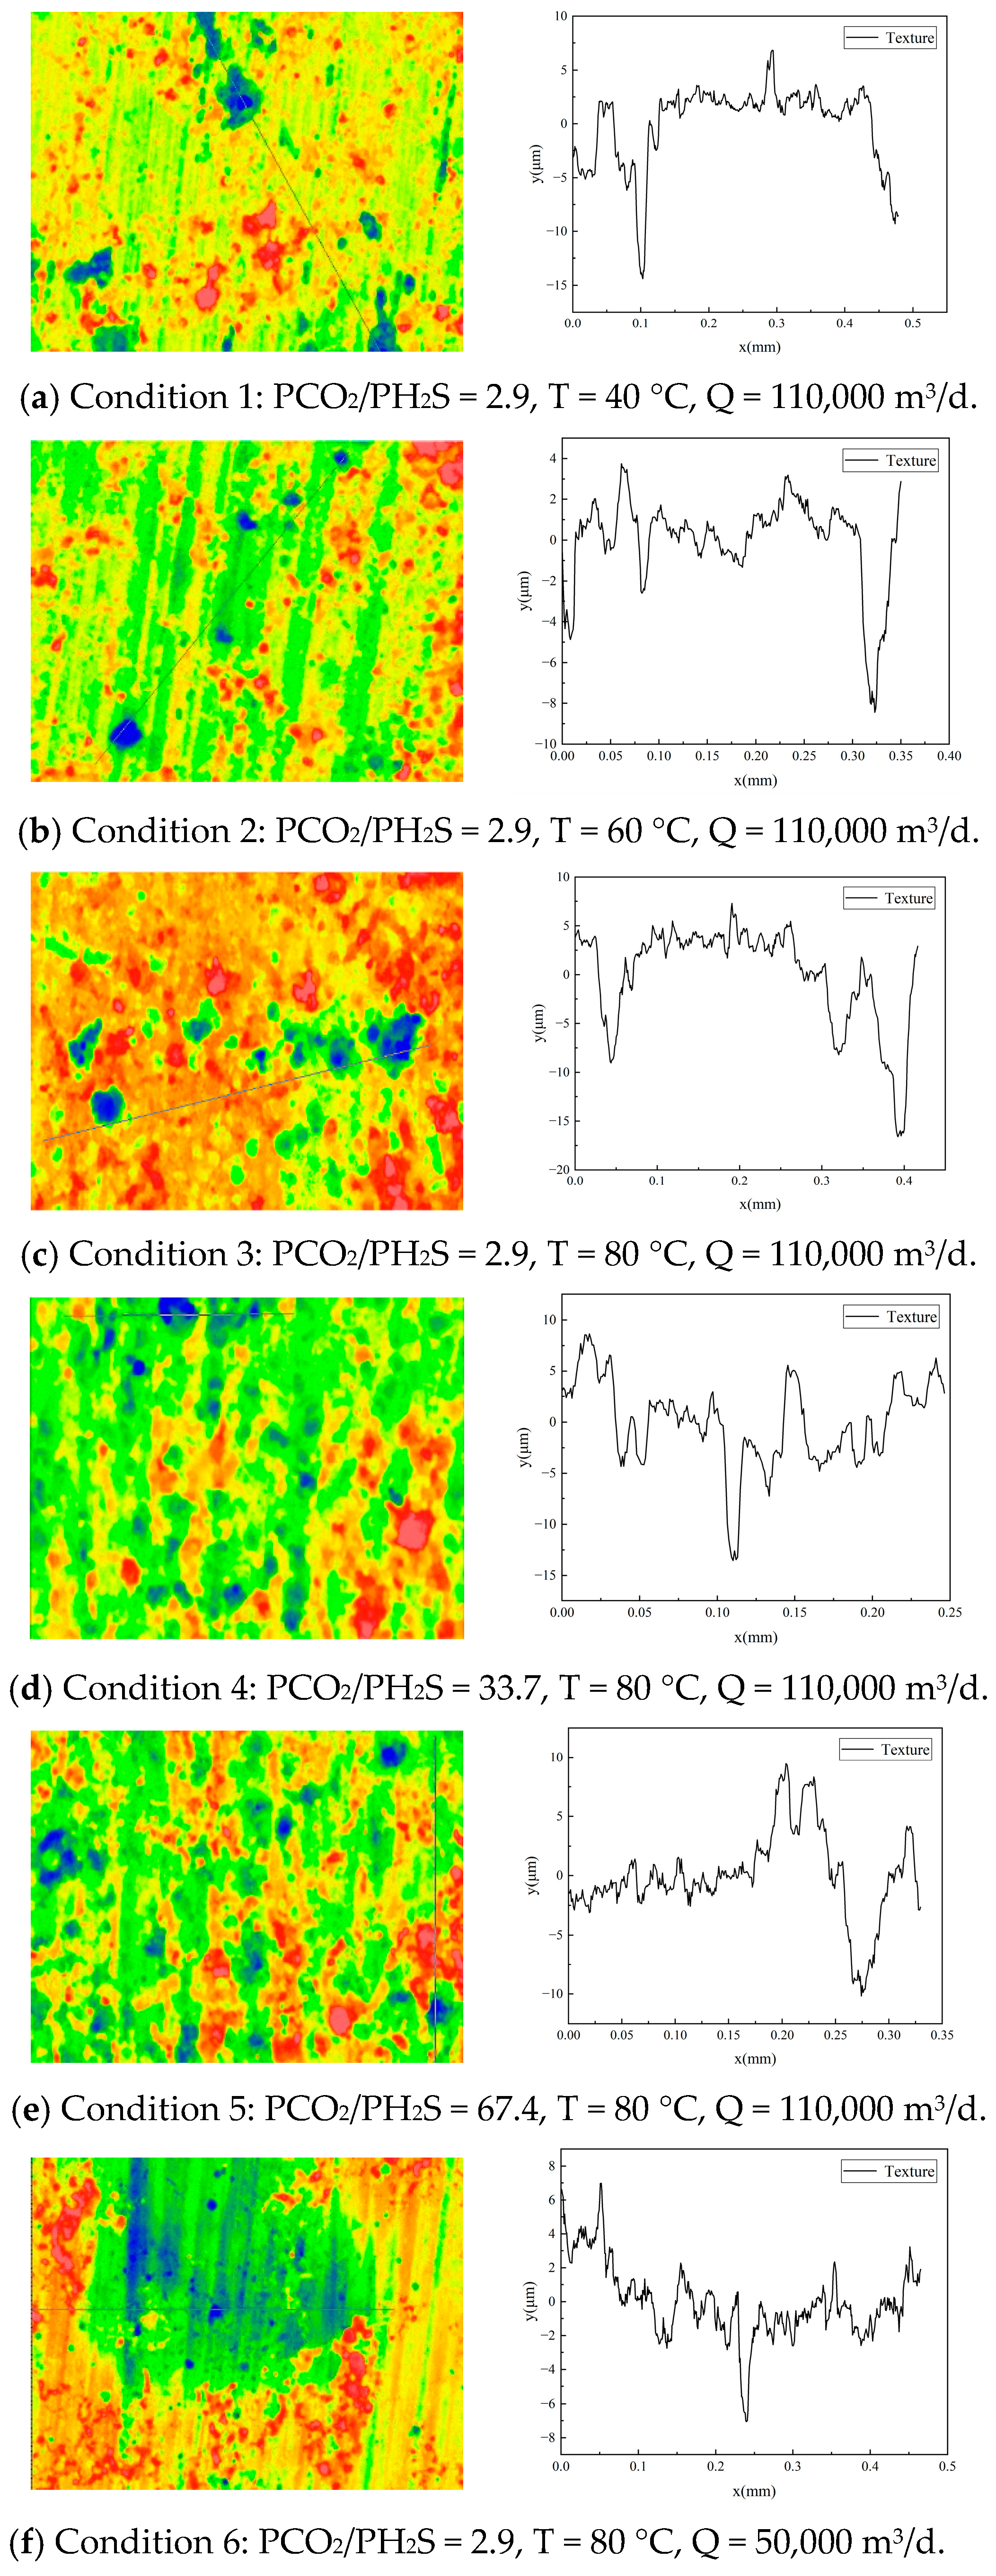
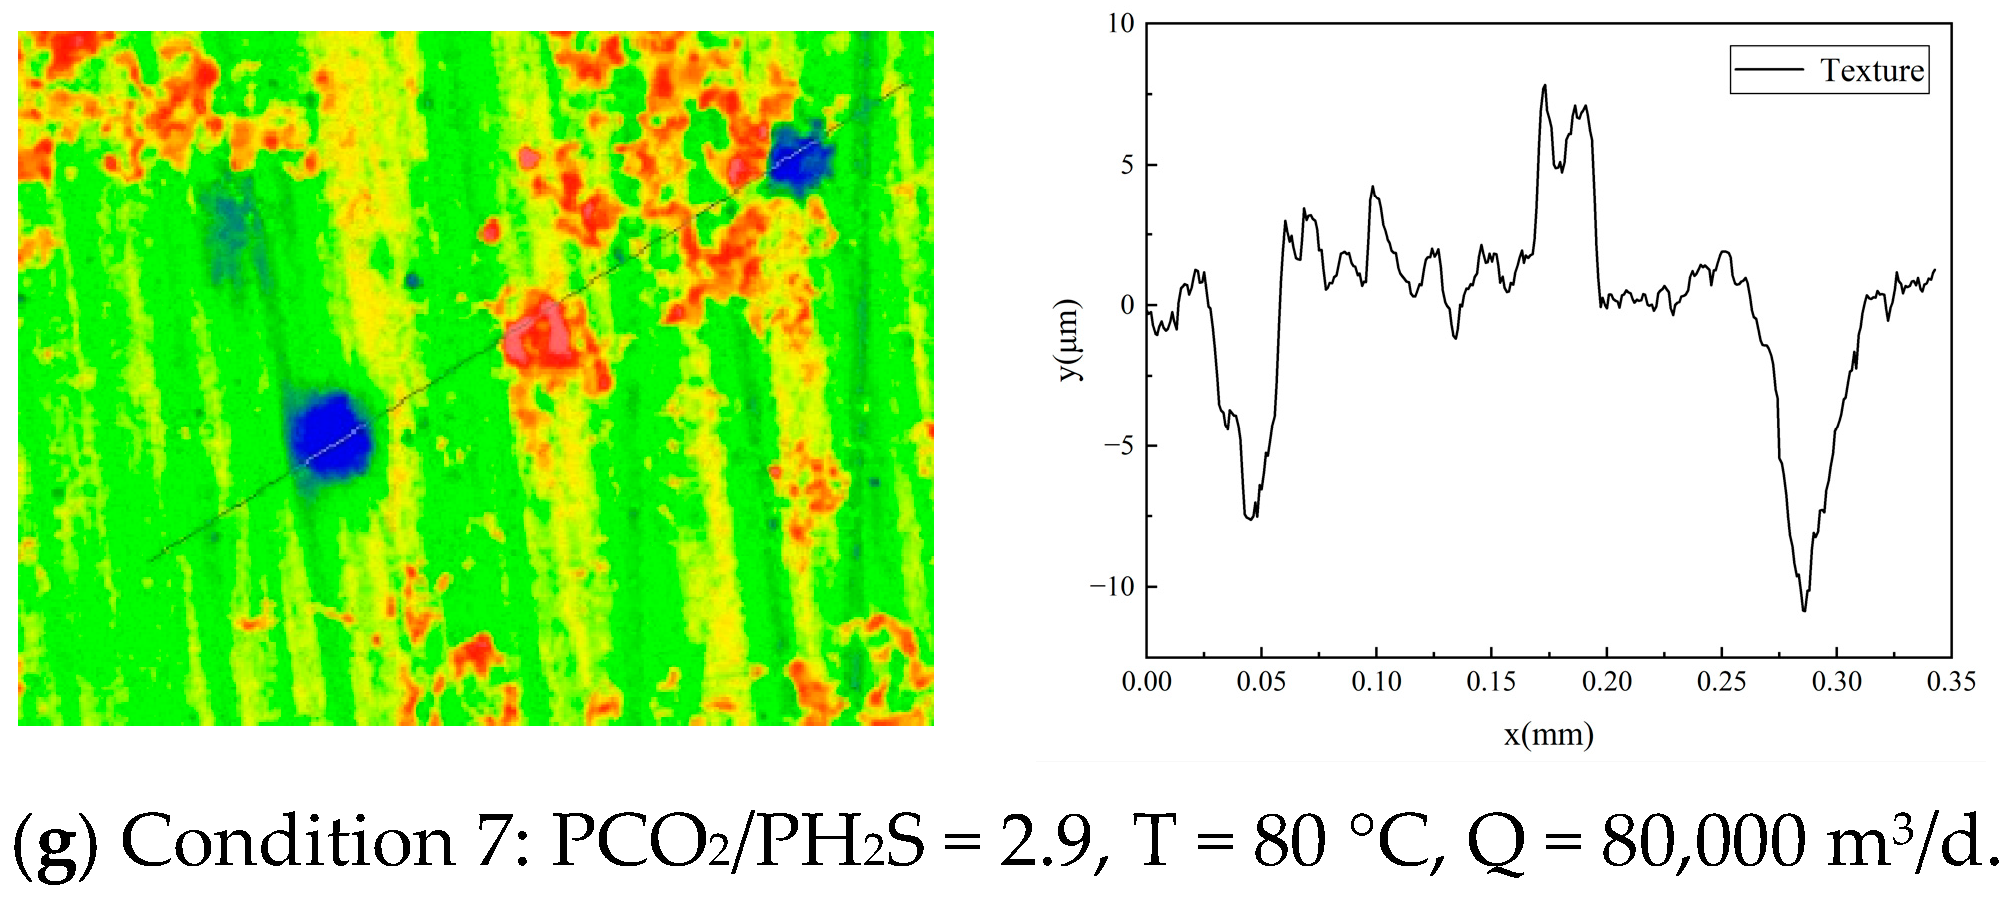
To quantitatively evaluate the severity of localized pitting corrosion, confocal laser scanning microscopy (CLSM) was employed to reconstruct the three-dimensional (3D) topography and measure pit depths on the cleaned coupon surfaces. The 3D pitting morphologies and corresponding depth profile curves for N80 steel under seven different operational conditions are presented in Figure 7. The 3D morphology images are represented as pseudo-color height maps, wherein blue regions represent pit bottoms (negative depth), green-to-yellow regions denote the substrate surface, and red regions indicate surface protrusions (e.g., residual corrosion products or substrate deformation).

3.5.1. Effect of Temperature on Pitting Characteristics

Under a constant partial pressure ratio (PCO2/PH2S = 2.9) and flow rate (110,000 m3/d), the influence of temperature on pitting morphology is shown in Figure 7a–c.
At 40 °C (Figure 7a), the corroded coupon surface exhibited numerous pits with varying depths. The pit mouths were predominantly irregularly polygonal, with some pits interconnected. The depth profile analysis revealed a maximum pitting depth of 11.35 μm and pit mouth diameters of 40–60 μm, yielding a depth-to-diameter ratio of 0.19–0.28, characteristic of shallow dish-shaped pits. The surface roughness (Ra) was approximately 2.8 μm.
When the temperature was increased to 60 °C (Figure 7b), the surface morphology changed significantly. The number of pits decreased markedly, whereas their distribution became more uniform. A tendency toward hemispherical pit morphology with relatively smooth edge contours was observed. The maximum pitting depth decreased to 8.02 μm, corresponding to a reduction of approximately 29% compared to that at 40 °C and representing the minimum value in this experimental series. Pit mouth diameters ranged from 35 to 50 μm, with depth-to-diameter ratios of 0.16–0.23. Surface roughness also decreased to 2.1 μm, indicating relatively uniform corrosion at this temperature.
At an elevated temperature of 80 °C (Figure 7c), the surface exhibited few but exceptionally deep isolated pits. The 3D morphology revealed that some pits displayed distinct funnel-shaped structures with sharp bottoms. The depth profile curve showed a maximum pitting depth of 18.41 μm—2.3 times that at 60 °C—with pit mouth diameters ranging from approximately 50 to 80 μm. The corresponding depth-to-diameter ratio increased to 0.23–0.37, characteristic of typical deep, narrow-type pits. Surface roughness increased to 3.6 μm. Notably, annular corrosion product deposits were visible surrounding the pits, suggesting substantial electrochemical activity differences between the pit initiation sites and the adjacent areas.

3.5.2. Effect of Partial Pressure Ratio on Pitting Characteristics

At a constant temperature (80 °C) and flow rate (110,000 m3/d), the effect of varying PCO2/PH2S ratios on pitting characteristics is shown in Figure 7c–e.
At a low PCO2/PH2S ratio of 2.9 (Figure 7c), consistent with the earlier observation, the surface exhibited a few deep isolated pits, with a maximum depth of 18.41 μm.
When the PCO2/PH2S ratio increased to 3.7 (Figure 7d), the number of pits increased significantly, whereas the average depth decreased. The 3D morphology revealed numerous shallow, wide dish-shaped pits. Local interconnection began to occur between pits, forming irregular groove-like corrosion zones. The maximum pitting depth was 14.38 μm, which corresponds to an approximately 22% reduction from the value observed at a PCO2/PH2S ratio of 2.9. The pit mouth diameters broadened to a range of 60–100 μm, whereas the depth-to-diameter ratios diminished to 0.14–0.24. Surface roughness was approximately 3.2 μm.
At a high PCO2/PH2S ratio of 67.4 (Figure 7e), the surface morphology exhibited typical uniform dissolution characteristics. Although pits remained observable, their depths decreased significantly, while the distribution density increased substantially, resulting in the formation of micro-pitting arrays. The maximum pitting depth further decreased to 10.00 μm, which corresponds to an approximately 46% reduction from the value observed at a PCO2/PH2S ratio of 2.9. The pit mouth diameters decreased to a range of 30–50 μm, while the depth-to-diameter ratios decreased to approximately 0.20–0.33. Surface roughness decreased to 2.5 μm, accompanied by relatively uniform overall undulations. This morphological feature is in good agreement with XRD results, which reveal FeCO3 as the dominant phase and a porous scale structure. Together, these observations indicate a transition from localized pitting to uniform general corrosion under high CO2 concentration.

3.5.3. Effect of Flow Rate on Pitting Characteristics

At a constant temperature (80 °C) and PCO2/PH2S ratio (2.9), the influence of different flow rates on pitting characteristics is illustrated in Figure 7c,f,g.
At a low-flow rate of 50,000 m3/d (Figure 7f), the surface was relatively smooth, with minimal overall undulation. Pits were extremely scarce, with only small-area, shallow pits observable at localized sites. Depth profile analysis revealed a maximum pitting depth of only 7.05 μm, with pit mouth diameters ranging from approximately 25 to 40 μm and depth-to-diameter ratios of approximately 0.18–0.28. Surface roughness was approximately 1.8 μm, which was the lowest recorded across all experimental conditions. Notably, despite the shallow nature of the pits, the pitting rate calculated from the maximum pit depth (0.858 mm/y) still indicated a certain degree of localized corrosion tendency.
When the flow rate increased to 80,000 m3/d (Figure 7g), both the number and depth of pits increased significantly. The 3D morphology revealed that the pits were predominantly elliptical, with the major axis aligned with the fluid flow direction, indicating a clear directional erosion effect of fluid scouring. The maximum pitting depth increased to 13.75 μm, with major axis diameters ranging from 80 to 120 μm, minor axis diameters from 40 to 60 μm, and major-to-minor axis ratios of approximately 1.5–2.0. Surface roughness increased to 3.1 μm.
Under high-flow conditions (110,000 m3/d, Figure 7c), pitting characteristics reached their most severe state. As previously described, the maximum pitting depth was 18.41 μm, and pits exhibited a distinct “comet-tail morphology” along the flow direction, characterized by steep upstream pit walls and elongated shallow grooves extending downstream. This morphology demonstrates that fluid scouring played a crucial role in pit propagation. The surface roughness reached 3.6 μm. Furthermore, under high flow velocity, pit bottom morphology became sharper, accompanied by a marked increase in depth-to-diameter ratios, confirming the hydrodynamic acceleration effect on the depth development of localized corrosion.

3.5.4. Correlation Between Pit Depth and Corrosion Rate

Table 8 summarizes the maximum pitting depths and corresponding pitting rates under the seven operational conditions. The data indicate a strong positive correlation between maximum pitting depth and pitting rate calculated from weight loss (Pearson correlation coefficient r = 0.89, p < 0.01), confirming the reliability of 3D morphology measurements. Notably, under similar pitting rates, pit morphological features (depth-to-diameter ratio, distribution density) were significantly influenced by environmental parameters: high temperature and high flow velocity tended to form deep, narrow, isolated pits, whereas high partial pressure ratios resulted in shallow, dense micro-pitting arrays.
Combining the 3D morphological analysis results, the pitting characteristics of N80 steel in H2S/CO2 coexisting environments were governed by the synergistic regulation of temperature, H2S/CO2 partial pressure ratio, and flow rate. High temperature and high flow velocity promoted the depth development of deep pits, whereas a high H2S/CO2 partial pressure ratio shifted the corrosion mode from a localized concentrated attack toward uniform general dissolution. These quantified geometric characteristics provide direct experimental evidence to support a subsequent mechanistic analysis of pitting corrosion.

4. Discussion

4.1. Competitive Growth Mechanism of Corrosion Scales

In corrosive environments where H2S and CO2 coexist, the phase composition and microstructure of corrosion scales formed on N80 steel surfaces are determined by the competitive deposition process between FeS and FeCO3. This competition is governed not only by the thermodynamic stability of the two compounds but also by their reaction kinetics and by significant modulation by environmental parameters such as temperature, PH2S/PCO2 ratio and flow rate.

4.1.1. Thermodynamic Driving Force Analysis

From a thermodynamic equilibrium perspective, the formation tendency of FeS and FeCO3 can be evaluated through their solubility product constants (Ksp). In aqueous systems, the precipitation reactions and solubility product constants (at 25 °C) for the two compounds are as follows:
F e S :   F e 2 + + S 2 F e S                 K s p F e S = 6.3 × 10 18
F e C O 3 :   F e 2 + + C O 3 2 = F e C O 3                     K s p F e C O 3 = 3.2 × 10 11
The solubility product constant of FeS is approximately seven orders of magnitude lower than that of FeCO3. Consequently, FeS is more readily supersaturated and preferentially precipitated at the same F e 2 + concentration, even when the S2− concentration is far below that of C O 3 2 . This thermodynamic advantage accounts for the predominance of FeS as the primary phase in XRD analysis under low partial pressure ratio conditions (PCO2/PH2S = 2.9), despite H2S content (0.89%) being markedly lower than the CO2 content (2.56%).
However, thermodynamic stability merely indicates the feasibility of precipitation; the actual film formation process also depends on the ion supply rate and nucleation kinetics. Under experimental conditions, the dissolution and dissociation processes of H2S and CO2 in aqueous media proceed via the following distinct pathways:
H 2 S H + + H S 2 H + + S 2 p K a 1 = 7.0 ,   p K a 2 = 14.0
C O 2 + H 2 O H 2 C O 3 H + + H C O 3 2 H + + C O 3 2   p K a 1 = 6.35 ,   p K a 2 = 10.33
Since the first dissociation constant of H2S ( p K a 1 = 7.0) is comparable to that of carbonic acid derived from CO2 ( p K a 1 = 6.35), both acidic gases can effectively lower the solution pH and thereby promote the anodic dissolution of Fe. However, the ferrophilicity of S 2 is far stronger than that of C O 3 2 , and this difference in chemical affinity further reinforces the preferential deposition tendency of FeS. Research by Sun et al. [25] also confirmed that in CO2/H2S coexisting systems, FeS can rapidly form films on steel surfaces and inhibit FeCO3 precipitation when the H2S partial pressure exceeds 0.001 MPa.

4.1.2. Effect of Temperature on Film Formation Kinetics

Although FeS is thermodynamically favorable, temperature has been identified as a key factor that modulates the kinetic equilibrium of two-phase competition. This modulation gives rise to an anomalous peak in the uniform corrosion rate at 60 °C (Figure 1a).
At the relatively low temperature of 40 °C, overall reaction kinetics are slow. Although FeS nucleates preferentially, the crystal growth rate is limited, resulting in thin product films (as seen in the thin compact regions of Figure 3a). Due to incomplete film coverage, locally exposed substrate metal continues to dissolve, maintaining corrosion rates at a moderate level (0.509 mm/y). Furthermore, the relatively high solubility of FeCO3 at low temperatures hinders its substantial deposition. EDS data reveal a sulfur content at 14.19% and a C content at 15.08%, indicating that the two phases essentially coexist.
At 60 °C, a critical transition occurs. Although CO2 solubility decreases with rising temperature (Henry’s Law), the accelerated hydration and dissociation of carbonic acid promote C O 3 2 generation. This temperature represents a competitive equilibrium point in the film formation kinetics of FeS and FeCO3: FeS deposition increases but remains insufficient for a compact film, while FeCO3 deposition approaches that of FeS. EDS data show minimum S content (12.27%) and increased O content (30.58%), indicating a greater proportion of porous FeCO3. XRD (Figure 6a) confirms the weakened FeS peaks and relatively strengthened FeCO3 peaks. Due to the porous structure and poor adhesion of FeCO3 at this temperature (Figure 3b), an effective diffusion barrier is lacking, allowing corrosive media to continuously penetrate to the substrate. Consequently, the uniform corrosion rate reaches its maximum (0.567 mm/y).
At 80 °C, FeS deposition kinetics achieves absolute dominance. The elevated temperature accelerates H2S dissociation and S 2 mass transfer to the steel surface while enhancing FeS crystal growth rate and crystallinity. EDS data show S content surging to 29.66% (2.4 times that at 60 °C), and XRD patterns (Figure 6a) reveal significantly intensified FeS characteristic peaks. The resulting FeS product film is compact and thick (Figure 3c), effectively blocking diffusion of corrosive media. Consequently, the uniform corrosion rate decreases to 0.506 mm/y, similar to that at 40 °C. This behavior can be described as a “passivation effect”, wherein the compact FeS film functions analogously to a protective oxide film. This finding is consistent with the 60% reduction in corrosion rate at 180 °Cobserved by Gao et al. [33] for S135 and G105 steels, further confirming the protective nature of FeS films at elevated temperatures.

4.1.3. Control of Phase Composition Evolution by Partial Pressure Ratio

Changes in the CO2/H2S partial pressure ratio essentially alter the concentration ratio of S 2 to C O 3 2 in solution, thereby determining the ultimate outcome of two-phase competition. According to the law of mass action for precipitation reactions, when [Fe2+] is constant, the ratio of supersaturation for the two phases can be expressed as:
S u p e r s a t u r a t i o n F e S S u p e r s a t u r a t i o n F e C O 3 = S 2 K S p F e S C O 3 2 K S p F e C O 3 S 2 C O 3 2 × 5 × 10 6
This relationship reveals that even when the S2− concentration is only one-millionth of that of C O 3 2 , the supersaturation of FeS can remain comparable to that of FeCO3 [28,44]. However, raising the H2S/CO2 ratio from 2.9 to 67.4 increases the absolute of C O 3 2 concentration approximately 23-fold. Consequently, despite the thermodynamic preference for FeS, the high deposition flux of FeCO3 significantly increases its proportion in the product film.
At a H2S/CO2 ratio of 2.9 (H2S-dominated), S 2 preferentially reacts with Fe2+, rapidly forming an initial FeS nucleation layer on the substrate surface. Subsequent FeS crystals grow epitaxially on this layer, using it as a foundation to form a compact protective film. FeCO3 can only deposit in small amounts within pores or cracks of the FeS film, existing as a minor phase, consistent with the dominance of FeS peaks in the XRD patterns.
When the H2S/CO2 ratio increases to 33.7 and 67.4 (with CO2 gradually dominating), large amounts of C O 3 2 accumulate in the diffusion layer, accelerating FeCO3 nucleation rates. Since FeCO3 exhibits rapid crystal growth but loose grain packing (agglomerated structure in Figure 4c), resulting in a product film that is thick yet poorly compact. Concurrently, the high CO2 concentration lowers the solution pH (due to CO2 hydrolysis generating H+), and this acidic environment inhibits the effective dissociation of S2−—according to the H2S dissociation equilibrium, S2− concentration decreases at low pH—thereby further weakening FeS formation. Both EDS and XRD results confirm that the S content drops dramatically (to 7.24%) at high PH2S/PCO2 ratios, with FeCO3 becoming the primary phase. The porous FeCO3 film fails to provide effective protection, leading to continuous uniform dissolution of the substrate, and the corrosion rate increases monotonically with the PH2S/PCO2 ratio (Figure 1b).

4.1.4. Integrated Model of Film Formation Mechanism

Integrating the above analysis, the corrosion product film formation process can be summarized by the following three-stage competitive model:
Initial nucleation stage: Due to its extremely low solubility product and high chemical affinity, FeS nucleates preferentially on the substrate surface, forming a discontinuous initial grain layer.
Competitive growth stage: The relative growth rates of FeS and FeCO3 depend on the temperature and PH2S/PCO2 ratio. At low or moderate temperatures, accelerated FeCO3 growth may inhibit FeS densification; at high temperatures, FeS growth achieves absolute dominance.
Film stabilization/destruction stage: Compact FeS films provide protection, reducing corrosion rates, whereas porous FeCO3 films are susceptible to fluid erosion, leading to accelerated corrosion.
This model successfully explains all observed experimental phenomena: the corrosion peak at 60 °C (attributed to film failure due to competitive equilibrium), corrosion mitigation at high temperature (FeS passivation), and accelerated corrosion at high PH2S/PCO2 ratios (FeCO3 dominance combined with poor protectiveness).

4.2. Mechanism of Pitting Initiation and Propagation

The experimental results revealed an important yet seemingly contradictory phenomenon: under conditions with low uniform corrosion rates (e.g., a high temperature of 80 °C and a low PH2S/PCO2 ratio of 2.9), the pitting corrosion rate reached its maximum value (2.240 mm/y, Figure 1a). Simultaneously, higher S content in the corrosion product film corresponded to greater pitting depth (Figure 7, Table 8). This phenomenon appears to contradict the traditional view that “FeS films provide protective effects.” In-depth analysis indicates that this “coexistence of protection and destruction” dual characteristic originates from the unique semiconductor electronic structure of FeS and the galvanic corrosion effect it induces in heterogeneous product films.

4.2.1. Semiconductor Properties and Electrical Conductivity of FeS

FeS, particularly its low-temperature polymorph mackinawite, is a typical n-type semiconductor material with electronic conductivity far exceeding that of the insulating FeCO3. According to solid-state electronic theory, the bandgap energy (Eg) of FeS is approximately 0.6–1.0 eV, enabling considerable carrier concentration at room temperature, with an electrical conductivity ranging from 10−2 to 10−1 S/cm [45]. In contrast, FeCO3, as an ionic compound, has a bandgap energy exceeding 5 eV and conductivity below 10–9 S/cm, classifying it as an electrical insulator [46].
This conductivity difference, spanning seven to eight orders of magnitude, creates a typical “mixed potential corrosion system” when FeS and FeCO3 coexist in the product film with the underlying metal substrate. Owing to its electronic conductivity, FeS can function as an effective cathodic region participating in electrochemical reactions, supporting the following reduction reactions:
At the FeS surface (cathode):
2 H + + 2 e H 2  
C O 2 + 2 H + + 2 e C O + H 2 O
Meanwhile, substrate regions covered by FeCO3, as well as bare metal exposed at film defects, serve as anodic regions where oxidative dissolution occurs:
At   the   bare   substrate   ( anode ) :   Fe F e 2 + + 2 e

4.2.2. “Large Cathode–Small Anode” Galvanic Corrosion Model

When FeS dominates the corrosion product film (e.g., S content reaching 29.66% at an 80 °C H2S/CO2 ratio of 2.9), a typical “large cathode–small anode” galvanic couple forms between the large-area conductive FeS film and small-area exposed substrate (or metal beneath the porous FeCO3 film). The observations from our study are similar to those reported by other researchers [47,48]. According to electrochemical kinetic principles, in a galvanic corrosion system, the cathodic and anodic currents must be equal:
I c a t h o d e = I a n o d e
i c a t h o d e × A c a t h o d e = i a n o d e × A a n o d e
where i represents current density and A represents reaction area. Since Acathode Aanode (FeS film area far exceeds exposed substrate area), to maintain charge conservation, the current density at the anodic region must increase dramatically:
i a n o d e = i c a t h o d e × A c a t h o d e A a n o d e
This anodic current density concentration effect causes local metal to dissolve at extremely high rates, forming deep and narrow pits. According to Faraday’s law, anodic current density is proportional to the metal dissolution rate:
Corrosion   rate i a n o d e A c a t h o d e A a n o d e
This mechanism provides a strong explanation for the observed phenomenon. These results directly link higher FeS content (and thus a larger cathodic area) to higher pitting rates (Figure 7, Table 8). For instance, at 80 °C and a H2S/CO2 ratio of 2.9, sulfur content peaked at 29.66%, and the maximum pitting depth also reached its highest value (18.41 μm). Conversely, at a ratio of 67.4, the sulfur content decreased to 7.24%, and the pitting depth correspondingly dropped to 10.00 μm.

4.2.3. Role of Product Film Heterogeneity in Promoting Pitting Initiation

Pitting initiation requires not only a galvanic driving force but also local defects or heterogeneous regions in the product film to serve as anodic active sites. These include several typical defects observed in experiments, such as:
(1)
Cracks and pores: As shown in Figure 3a, the product film at 40 °C exhibited obvious crack patterns that directly exposed the underlying substrate metal, serving as preferential sites for anodic dissolution.
(2)
FeS/FeCO3 biphasic interfaces: XRD and EDS results indicated that product films under most conditions consisted of mixed FeS and FeCO3. Owing to lattice mismatch and stress concentration, interfaces between the two phases readily developed microcracks or gaps, thereby forming localized occluded zones.
(3)
Mechanical erosion defects: Under high-flow conditions (110,000 m3/d), porous FeCO3 was preferentially eroded by fluid flow (Figure 5c, EDS showing S content rising to 32.67%). At erosion sites, the underlying substrate appeared to be directly exposed to corrosive media, while the surrounding compact FeS film acted as a large cathode, driving rapid local dissolution. Three-dimensional morphology revealed that pits under high-flow conditions exhibited a “comet-tail” morphology (Figure 7c), providing direct evidence of directional expansion by fluid erosion.
Once pitting was initiated, an autocatalytic acceleration mechanism developed within the pit:
F e 2 + + H 2 O F e ( O H ) + + H +
The H+ generated by Fe2+ hydrolysis further reduced the pH at the pit bottom (to approximately 3–4), establishing an acidic occluded cell. This acidic environment accelerated anodic dissolution while suppressing FeS redeposition at the pit bottom—due to extremely low S2− concentration at low pH—thereby promoting rapid pit propagation in depth. This mechanism accounts for the deep, narrow, “funnel-shaped” morphology of pits observed at 80 °C (Figure 7c), with depth-to-diameter ratios reaching 0.37.
While the bulk pH was not measured (field pH ≈ 6), Fe2+ hydrolysis (Equation (17)) produces local acidification within pits, which is expected to dominate the corrosion process regardless of minor bulk pH changes. Direct pH measurement is recommended for future studies.

4.2.4. Temperature Modulation on Pitting Galvanic Effect

Temperature effects on pitting behavior can be understood from two perspectives:
(1)
Alteration of film compactness: As previously discussed, at 60 °C, the product film was in a “competitive equilibrium” state characterized by low FeS content (12.27%) and a discontinuous distribution, while porous FeCO3 dominated. Although local FeS/substrate galvanic couples existed, the discontinuous FeS film limited its effective cathodic area, resulting in a weak galvanic effect and consequently the lowest pitting rate (0.976 mm/y). Under these conditions, corrosion proceeded primarily via uniform dissolution.
(2)
Electrochemical reaction kinetics: Temperature is well known to accelerate electrochemical reaction kinetics. At 80 °C, the rates of both cathodic reduction (Equations (10) and (11)) and anodic oxidation (Equation (12)) are therefore expected to be higher than at lower temperatures. This temperature-accelerated kinetics would, according to the Tafel relationship, enable a higher anodic current density under a given galvanic driving force, providing a plausible explanation for the increased pitting rate. Additionally, the enhanced diffusion of Fe2+ and mass transfer of H+ at elevated temperature would be expected to intensify the autocatalytic process within pits, and these temperature-dependent effects are consistent with the observed maximum pitting depth at 80 °C.

4.2.5. Suppression of Galvanic Effect by Partial Pressure Ratio

As the PCO2/PH2S ratio increased, the pitting rate exhibited a declining trend (from 2.240 to 1.217 mm/y), highly correlated with decreasing FeS content. At a ratio of 67.4, the product film consisted primarily of insulating FeCO3 (S content only 7.24%), with residual FeS distributed as isolated islands, incapable of forming large-area continuous cathodic regions. Under these conditions, electrochemical activity across the substrate surface became relatively uniform, with corrosion proceeding primarily as general active dissolution. The local galvanic driving force was substantially weakened, resulting in shallower but more densely distributed pits, forming “micro-pitting arrays” (Figure 7e).
This phenomenon is consistent with the EIS findings of Parakala [37]: in high-CO2/low-H2S systems, the absence of a conductive FeS film significantly increases charge transfer resistance, weakening localized corrosion tendency and shifting corrosion mode from pitting to uniform corrosion.

4.2.6. Integrated Pitting Mechanism Model

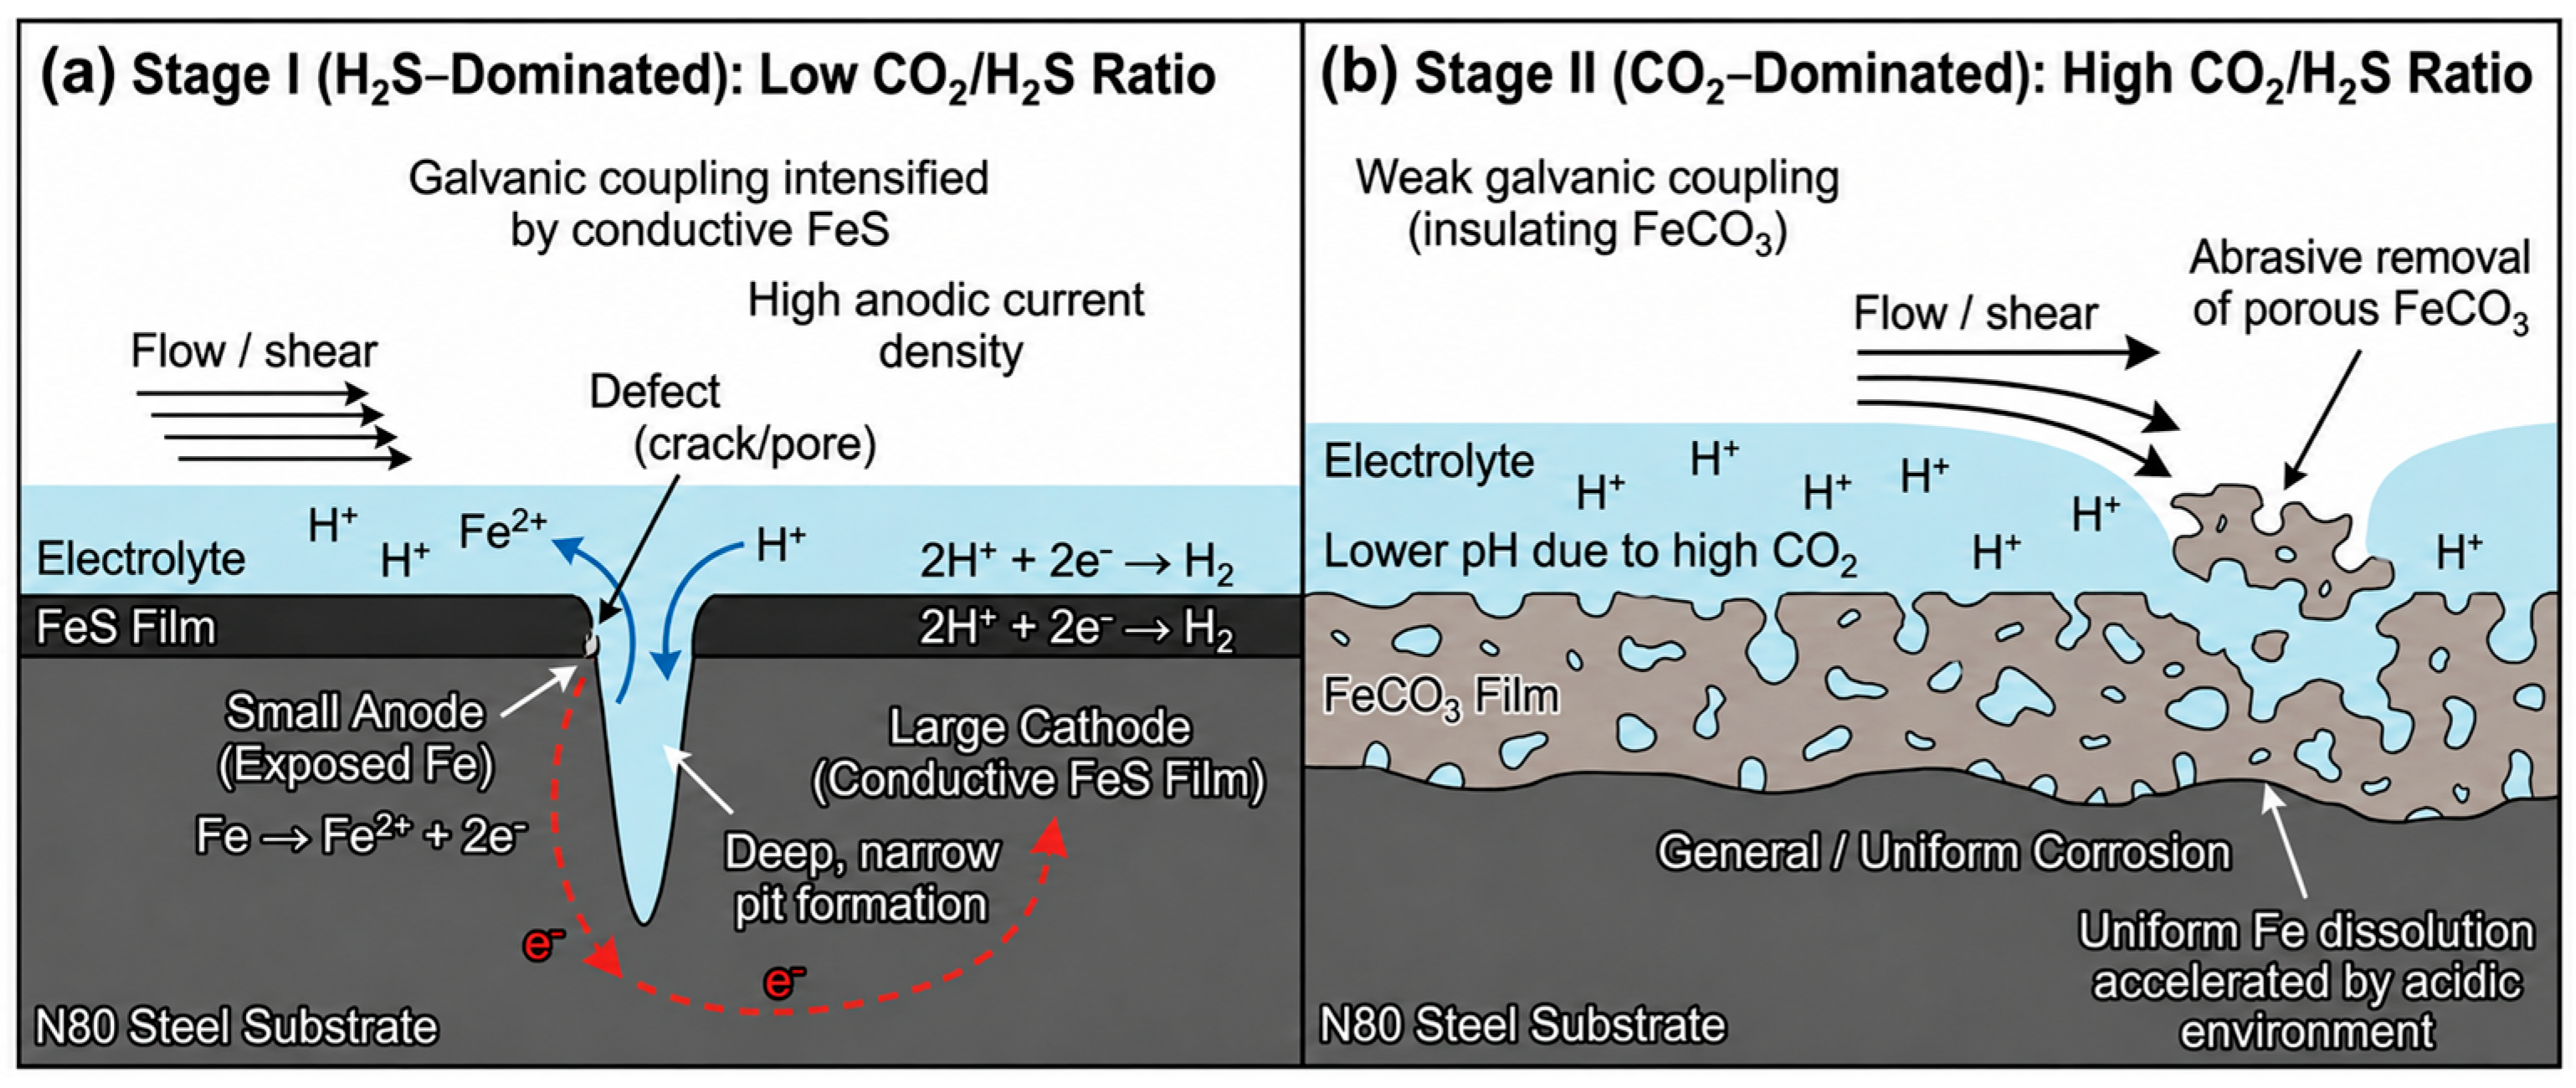
Drawing upon the semiconductor properties of FeS, galvanic corrosion driving mechanisms, the influence of product film heterogeneity, and the regulatory effects of temperature and CO2/H2S partial pressure ratios in the H2S/CO2 coexistence system, the dynamic evolution of the N80 steel corrosion mode transition and the full process mechanism of pitting initiation and propagation for N80 steel under H2S/CO2 conditions in CCUS-EGR gas production wells can be systematically illustrated via schematic diagrams (Figure 8).
Based on the transformation laws of the aforementioned corrosion mechanisms, the pitting mechanism of N80 steel in H2S/CO2 coexisting environments can be summarized as the following process:
Initiation stage: Compact FeS in the product film forms micro-galvanic couples with porous FeCO3 or film defects, initiating dissolution at anodic active sites.
Propagation stage: Large-area FeS cathodes provide sustained high current, driving rapid anodic dissolution, while fluid erosion accelerates removal of porous products, thereby expanding the exposed anodic area.
Deepening stage: A local acidic environments is created by Fe2+ hydrolysis within pits, which inhibits FeS redeposition and establishes an autocatalytic cycle, thereby driving rapid pit propagation in depth.
This model reveals a significant engineering implication: in CCUS-EGR gas production wells, although FeS films can reduce uniform corrosion rates, galvanic pitting induced by their electrical conductivity may pose a more severe failure risk. Therefore, wellbore integrity management should prioritize monitoring and mitigation of localized pitting over a sole focus on general corrosion rates.

4.3. Effect of Flow Velocity on Product Film Integrity

Grey relational analysis revealed that the influence weight of the fluid flow rate on the pitting corrosion rate (γ = 0.892) significantly exceeded that on uniform corrosion (γ = 0.600), indicating that hydrodynamic conditions play a decisive role in localized corrosion. The effect of flow velocity on corrosion behavior arises from two coupled mechanisms: enhanced mass transfer, which accelerates corrosive species transport to the metal surface, and mechanical shear stress, which physically erodes the corrosion product film.

4.3.1. Hydrodynamic Parameters and Wall Shear Stress

In the rotating coupon system of the high-temperature high-pressure autoclave, the wall shear stress ( τ W ) exerted by the fluid on coupon surfaces can be estimated through the following relationship:
τ W = 1 2 ρ C f u 2
where ρ is the fluid density (approximately 800 kg/m3, considering densification under high pressure), u is the characteristic velocity (proportional to daily gas production), and C f is the friction coefficient (for turbulent flow, C f ≈ 0.005−0.01). Under the experimental conditions, increasing flow rate from 50,000 to 110,000 m3/d raised the corresponding linear velocity from approximately 0.8 to 1.8 m/s (simplified calculation based on wellbore geometry), and the wall shear stress increased from about 2.5 Pa to 13 Pa—a more than fivefold increase.
Furthermore, changes in the Reynolds number (Re) marked transitions in the flow regime. Under experimental temperature and pressure, fluid kinematic viscosity was approximately ν ≈ 1.5 × 10⁻⁶ ν ≈ 1.5 × 10⁻⁶ m2/s, and the Reynolds number can be expressed as:
R e = u d v
where d is the characteristic dimension (coupon size approximately 30 mm). Calculations indicated that Re increased from approximately 16,000 to 36,000 under experimental conditions, remaining within the fully turbulent regime, with fluid fluctuations enhancing the impact effects on the product film.

4.3.2. Selective Erosion Mechanism of Product Film

EDS and XRD analysis results demonstrated that increasing flow velocity drastically altered the chemical composition of corrosion product films: S content rose from 16.61% (50,000 m3/d) to 32.67% (110,000 m3/d), whereas O content decreased from 41.54% to 16.33% (Table 7). This phenomenon revealed a selective erosion effect of the fluid on the product film.
The mechanical properties of FeS and FeCO3 phases differ significantly. According to literature reports, mackinawite-type FeS exhibits a microhardness of approximately 2–3 GPa with relatively high cohesive strength and strong adhesion to the substrate. In contrast, FeCO3 (siderite) has a microhardness of only 1–1.5 GPa. Owing to its rapid precipitation characteristics, FeCO3 grains stack loosely with weak interlayer bonding. When wall shear stress exceeds the critical detachment stress of the FeCO3 film, loose carbonate crystals undergo mechanical erosion.
SEM observations provide direct support for this mechanism. Under low flow velocity (50,000 m3/d), the product film surface exhibited abundant loose FeCO3 agglomerates (Figure 5a), with a large thickness but a loosely packed structure. When the flow velocity was increased to 110,000 m3/d, these loose regions were substantially reduced (Figure 5c), and the product film became more compact, yet thinner. XRD analysis revealed a marked increase in FeS peak intensity, while FeCO3 peaks weakened correspondingly (Figure 6c). These observations suggest that under high flow velocity, mechanically weaker FeCO3 was preferentially removed, whereas the structurally compact FeS was retained owing to its high adhesion, leading to a relative enrichment of FeS in the product film.

4.3.3. Non-Monotonic Effect of Flow Velocity on Uniform Corrosion

The uniform corrosion rate exhibited a non-monotonic “rise-then-fall” trend with increasing flow rate: from 0.513 mm/y at 50,000 m3/d to 0.559 mm/y at 80,000 m3/d, then decreasing to 0.506 mm/y at 110,000 m3/d (Figure 1c). This behavior arises from the competitive influence of flow velocity on two opposing processes.
In the moderate-flow-velocity stage (50,000–80,000 m3/d), erosion of loose FeCO3 dominated. As the FeCO3 removal rate exceeded the FeS deposition rate, more substrate surface became exposed (or covered only by thin FeS films), facilitating corrosive media contact and increasing the uniform corrosion rate. SEM revealed that at 80,000 m3/d, the product film exhibited localized loose characteristics (Figure 5b), with an EDS S content at 23.02%—intermediate between low and high flow velocities.
However, during the high-flow-velocity stage (110,000 m3/d), increasing velocity simultaneously enhanced the mass transfer supply of reactant. According to boundary layer theory, the relationship between mass transfer coefficient (km) and velocity can be expressed as:
k m u 0.8
High flow velocity not only accelerated FeCO3 erosion but also significantly enhanced the transport of H2S to the substrate surface. Under H2S-dominated, low-PCO2/PH2S-ratio (2.9) conditions, sufficient H2S supply promoted rapid regeneration of FeS. Once loose FeCO3 was removed, the exposed substrate could react rapidly with transported H2S to generate new, compact FeS layers that filled defects. EDS data showed that the sulfur content reached its maximum (32.67%) at 110,000 m3/d, indicating an enhanced FeS deposition rate under high flow velocity. This “erosion–repair” dynamic equilibrium ultimately led to a decrease in the uniform corrosion rate at a high flow velocity.
This mechanism bears conceptual similarity to the phenomenon described by Schmitt et al. [49,50] in CO2 corrosion research, that “protective FeCO3 films break down at high flow velocity, but even higher velocities can promote rapid film regeneration”. However, in the present study, the protective phase is FeS rather than FeCO3, reflecting the unique characteristics of H2S-containing systems.

4.3.4. Monotonic Promotion of Pitting by Flow Velocity

In stark contrast to the non-monotonic behavior of uniform corrosion, the pitting rate exhibited a monotonically increasing trend with flow rate. Specifically, it rose from 0.858 mm/y at 50,000 m3/d to 2.240 mm/y at 110,000 m3/d—an increase of 161% (Figure 1c, Table 8). Three-dimensional morphology analysis further revealed that high flow velocity not only increased pitting depth but also altered the geometric morphology of the pits.
Erosion-driven expansion of the anodic exposure area.
As previously discussed, fluid erosion preferentially removed loose FeCO3, exposing the underlying metal substrate. In heterogeneous regions of the product film, selective FeCO3 erosion directly exposed the underlying substrate exposure, creating anodic active sites for galvanic corrosion. Higher flow velocity enlarged the erosion areas and reduced the anode/cathode area ratios (Aanode/Acathode). According to Equation (15), this increase in anodic current density resulted in faster pitting rates.
SEM observations revealed that erosion marks and residual FeS film fragments were often visible around pits under high flow velocity (Figure 5c), indicating a close correlation between pitting initiation and mechanical film damage.
Flow-directional erosion effect.
Three-dimensional morphology revealed that pits under high flow velocity exhibited distinct elliptical or “comet-tail” morphology, with major axes aligned with the fluid flow direction (Figure 7c,g). This directional characteristic provides direct evidence of accelerated dissolution at the downstream side of pit openings due to fluid scouring. Once pits form, the internal flow field undergoes modification, generating local turbulent eddies that enhance the removal of corrosion products (e.g., Fe2+) from pits to the bulk solution and facilitate the replenishment of fresh corrosive media, thereby establishing a positive feedback acceleration mechanism.
According to erosion–corrosion theory, the pit propagation rate can be expressed as:
d d e p t h d t = k c h e m + k m e c h · τ W n
where k c h e m represents the contribution of pure electrochemical dissolution, k m e c h is the mechanical erosion coefficient, and n typically ranges from 1.5 to 2.0. This equation indicates that shear stress exerts a nonlinear enhancement effect on pitting depth, explaining the dramatic increase in pitting depth under high flow velocity (from 7.05 μm to 18.41 μm).
Enhanced mass transfer within pits and autocatalytic acceleration.
High flow velocity not only affects surface films but also accelerates pitting propagation by enhancing mass transfer within pits. Under static or low-flow conditions, Fe2+ accumulation reduces concentration gradients, thereby limiting anodic dissolution. Under high-flow conditions, however, pulsating flow and turbulent eddies periodically remove accumulated corrosion products from pits, sustaining high concentration gradients and anodic reactions. Meanwhile, fresh H+ and CO2 are continuously replenished in pit bottoms, maintaining a low-pH acidic environment (Equation (17)) and inhibiting FeS redeposition, thereby promoting irreversible depth-wise propagation.
This mechanism is supported by the depth-to-diameter ratio data: at 110,000 m3/d, the ratio reached 0.37 (Table 8)—substantially higher than the 0.18–0.28 observed under low flow velocities—indicating that high flow velocity promoted depth-wise rather than lateral pit growth.

4.3.5. Engineering Implications of Flow Velocity Effects

The differential effects of flow velocity on corrosion behavior provide important guidance for operational management of CCUS-EGR gas production wells:
Production optimization: During the initial production stages dominated by H2S (low PCO2/PH2S ratio), maintaining the gas production at a moderate level (around 80,000 m3/d) may help balance productivity and corrosion control, thereby avoiding the severe pitting regime associated with high flow velocities.
Pitting monitoring: For high-production wells, wellbore integrity management should prioritize the monitoring of localized corrosion. Techniques such as ultrasonic thickness measurement and eddy current testing are recommended for regular inspection of pitting depth.
Corrosion inhibitor design: Based on the experimental findings, it is proposed that effective corrosion inhibitors for high-flow wells should be designed with dual functions: enhancing the mechanical strength (erosion resistance) of the product film to prevent its selective removal, and inhibiting the autocatalytic process within pits (suppressing Fe2+ hydrolysis). These proposed design principles, however, require further experimental validation.
In summary, flow velocity alters the phase composition of the product film (FeS enrichment) through selective erosion, producing complex non-monotonic effects on uniform corrosion while monotonically promoting pitting. Consequently, localized corrosion becomes the primary threat in high-production wells.

5. Conclusions

Through systematic high-temperature high-pressure corrosion simulation experiments, multi-scale microstructural characterization, and grey relational statistical analysis, this study elucidates the corrosion evolution patterns and mechanisms of N80 steel in dynamic H2S/CO2 coexisting environments relevant to CCUS-EGR production wellbores:
Differentiated identification of dominant factors: Grey relational analysis quantitatively confirmed that the CO2/H2S partial pressure ratio exerted the strongest influence on uniform corrosion, whereas flow rate and temperature dominated pitting behavior. This indicates that uniform and pitting corrosion are governed by distinct physicochemical processes, providing a quantitative basis for stratified protection strategies.
Non-monotonic modulation effect of temperature: Under H2S-dominated conditions, the uniform corrosion rate exhibited a rise-then-fall trend with increasing temperature, peaking at 60 °C, whereas the pitting rate followed the opposite trend, maximizing at 80 °C. This anomaly arises from the temperature-dependent competitive film formation kinetics of FeS and FeCO3. At 60 °C, the two phases reach competitive equilibrium, resulting in minimum film compactness. At 80 °C, preferential FeS deposition forms a compact protective film but simultaneously triggers severe localized galvanic corrosion.
Phase transition in corrosion mechanisms: As the PCO2/PH2S ratio increased, the corrosion product film transformed from sulfide-dominated to carbonate-dominated. Correspondingly, the corrosion mode shifted from “low uniform corrosion–high pitting” to “high uniform corrosion–low pitting”: the uniform corrosion rate increased, whereas the pitting rate decreased. This transition arises from the poor protectiveness of porous FeCO3 films and the suppression of the galvanic corrosion driving force due to the absence of conductive FeS films.
Galvanic pitting mechanism induced by FeS semiconductor properties: The electrical conductivity of compact FeS films enables them to function as large-area cathodes, forming “large cathode–small anode” galvanic couples with small exposed anodic sites at film defects or beneath porous FeCO3 films. This configuration concentrates anodic current density, driving the rapid propagation of deep, narrow pits. Experiments quantitatively validated that higher S content in the corrosion product film correlates with greater pitting depth.
Selective erosion and dual effects of flow velocity: Fluid shear stress can selectively erode FeS and FeCO3, enriching S content. Flow velocity exhibited non-monotonic effects on uniform corrosion while monotonically promoting pitting. This contrasting behavior results from mechanical erosion expanding the anodic area, flow-directional erosion opening pit mouths, and enhanced mass transfer driving irreversible autocatalytic processes within pits.
Engineering application implications: During CCUS-EGR processes, as injected CO2 breaks through and the CO2 content in produced gas gradually increases, the wellbore corrosion threat progressively shifts from localized deep pitting to general uniform corrosion. However, during the transition period where H2S is still present, the heterogeneity of mixed FeS/FeCO3 films creates a “coexistence of protection and destruction.” In this regime, targeted monitoring of localized pitting is recommended, using techniques such as ultrasonic thickness measurement and eddy current testing. For high-production wells, particular attention should be paid to deep, narrow pits induced by fluid erosion, as these may become parts of the dominant wellbore failure mode.
This study established quantitative mechanistic models for competitive film growth and galvanic pitting in H2S/CO2 coexisting environments, revealing corrosion evolution throughout the CCUS-EGR lifecycle. These findings provide a theoretical and data-driven foundation for material selection, corrosion monitoring, and protection strategy optimization in CCUS-EGR pilot wells in Southwest China. Future research should focus on the influence of corrosion inhibitors on FeS/FeCO3 biphasic film stability and corrosion behavior under direct supercritical CO2 conditions, thereby facilitating the large-scale industrial implementation of CCUS-EGR.

Author Contributions

Conceptualization, Q.P.; methodology, J.X., H.L. and X.S.; formal analysis, Q.Q.; investigation, X.Z. and X.S.; resources, Y.Q.; data curation, J.F.; software, Z.F.; writing—original draft preparation, X.Z.; writing—review and editing, Y.W.; supervision, H.L.; project administration, X.S.; Funding acquisition, H.L. All authors have read and agreed to the published version of the manuscript.

Funding

This research received no external funding.

Data Availability Statement

The authors declare that no copyrighted figures have been used in this manuscript. The original contributions presented in this study are included in the article. Further inquiries can be directed to the corresponding author.

Acknowledgments

We thank Jin Pang of Chongqing University of Science and Technology for his contribution to the practical recommendations and development of this research experiment.

Conflicts of Interest

Authors Qiang Pu, Ji Xu, Qifeng Qin, Yong Qing, and Juan Fu were employed by the company PetroChina Southwest Oil & Gas Field Company, while author Zhiwen Fan was employed by Chongqing Shale Gas Exploration and Development Company Limited. The remaining authors declare that the research was conducted in the absence of any commercial or financial relationships that could be construed as a potential conflict of interest. The PetroChina Southwest Oil & Gas Field Company and Chongqing Shale Gas Exploration and Development Company Limited had no role in the design of the study; in the collection, analyses, or interpretation of data; in the writing of the manuscript; or in the decision to publish the results.

References

  1. Arias, P.; Bellouin, N.; Coppola, E.; Jones, R.; Krinner, G.; Marotzke, J.; Naik, V.; Palmer, M.; Plattner, G.K.; Rogelj, J.; et al. Climate Change 2021: The Physical Science Basis; Contribution of Working Group I to the Sixth Assessment Report of the Intergovernmental Panel on Climate Change; Technical summary; IPCC: Geneva, Switzerland, 2021. [Google Scholar]
  2. Obergassel, W.; Arens, C.; Hermwille, L.; Kreibich, N.; Mersmann, F.; Ott, H.E.; Wang-Helmreich, H. Phoenix from the Ashes: An Analysis of the Paris Agreement to the United Nations Framework Convention on Climate Change; Part 1; Wuppertal Institute: Wuppertal, Germany, 2015. [Google Scholar]
  3. Bouckaert, S.; Pales, A.F.; McGlade, C.; Remme, U.; Wanner, B.; Varro, L.; D’Ambrosio, D.; Spencer, T. Net Zero by 2050: A Roadmap for the Global Energy Sector; IEA: Paris, France, 2021. [Google Scholar]
  4. Barlow, H.; Shahi, S.S.M.; Loughrey, M. State of the Art: CCS Technologies 2023; Global CCS Institute: Brussels, Belgium, 2023; pp. 1–121. [Google Scholar]
  5. Bui, M.; Adjiman, C.S.; Bardow, A.; Anthony, E.J.; Boston, A.; Brown, S.; Fennell, P.S.; Fuss, S.; Galindo, A.; Hackett, L.A.; et al. Carbon capture and storage (CCS): The way forward. Energy Environ. Sci. 2018, 11, 1062–1176. [Google Scholar] [CrossRef]
  6. Oldenburg, C.M. Carbon dioxide as cushion gas for natural gas storage. Energy Fuels 2003, 17, 240–246. [Google Scholar] [CrossRef]
  7. Kühn, M.; Tesmer, M.; Pilz, P.; Meyer, R.; Reinicke, K.; Förster, A.; Kolditz, O.; Schäfer, D. CLEAN: Project overview on CO2 large-scale enhanced gas recovery in the Altmark natural gas field (Germany). Environ. Earth Sci. 2012, 67, 311–321. [Google Scholar] [CrossRef]
  8. Pooladi-Darvish, M.; Hong, H.; Theys, S.; Stocker, R.; Bachu, S.; Dashtgard, S. CO2 injection for enhanced gas recovery and geological storage of CO2 in the Long Coulee Glauconite F Pool, Alberta. In Proceedings of the SPE Annual Technical Conference and Exhibition, Denver, CO, USA, 21–24 September 2008. SPE-115789-MS. [Google Scholar]
  9. Van der Meer, L.G.H.; Kreft, E.; Geel, C.; Hartman, J. K12-B: A test site for CO2 storage and enhanced gas recovery. In Proceedings of the SPE Europec Featured at EAGE Conference and Exhibition, Madrid, Spain, 13–16 June 2005. SPE-94128-MS. [Google Scholar]
  10. Yong, R. Development status, advantages and challenges of CCUS/CCS in PetroChina Southwest Oil & Gas Field Company. Nat. Gas Ind. 2024, 44, 11–24. [Google Scholar]
  11. Kharaka, Y.K.; Cole, D.R.; Hovorka, S.D.; Gunter, W.D.; Knauss, K.G.; Freifeld, B.M. Gas–water–rock interactions in Frio Formation following CO2 injection: Implications for the storage of greenhouse gases in sedimentary basins. Geology 2006, 34, 577–580. [Google Scholar] [CrossRef]
  12. He, X.X.; Gan, X.F.; Yang, C.C.; Jin, Y.Q.; Zhao, Z.H.; Cao, C.; Zhang, L.H.; Zhao, Y.L. Latest progress of CO2-EGR pilot test in the Wolonghe Gas Field of the Sichuan Basin. Nat. Gas Ind. 2025, 45, 19–32. [Google Scholar]
  13. Smith, S.N.; Joosten, M.W. Corrosion of carbon steel by H2S in CO2-containing oilfield environments. In Proceedings of the CORROSION 2006, San Diego, CA, USA, 12–16 March 2006; pp. 1–26. [Google Scholar]
  14. Shoesmith, D.W.; Taylor, P.; Bailey, M.G.; Ikeda, B. Electrochemical behaviour of iron in alkaline sulphide solutions. Electrochim. Acta 1978, 23, 903–916. [Google Scholar] [CrossRef]
  15. Ma, H.; Cheng, X.; Li, G.; Chen, S.; Quan, Z.; Zhao, S.; Niu, L. The influence of hydrogen sulfide on corrosion of iron under different conditions. Corros. Sci. 2000, 42, 1669–1683. [Google Scholar] [CrossRef]
  16. Zheng, Y.; Brown, B.; Nesic, S. Electrochemical study and modeling of H2S corrosion of mild steel. In Proceedings of the CORROSION 2013, Orlando, FL, USA, 17–21 March 2013; pp. 1–22. [Google Scholar]
  17. Dugstad, A. Fundamental aspects of CO2 metal loss corrosion: Part I: Mechanism. In Proceedings of the CORROSION 2006, San Diego, CA, USA, 12–16 March 2006; pp. 1–18. [Google Scholar]
  18. Sun, W.; Nešić, S. Kinetics of corrosion layer formation: Part 1—Iron carbonate layers in carbon dioxide corrosion. Corrosion 2008, 64, 334–346. [Google Scholar] [CrossRef]
  19. Sun, W.; Nešić, S. A mechanistic model of uniform hydrogen sulfide/carbon dioxide corrosion of mild steel. Corrosion 2009, 65, 291–307. [Google Scholar] [CrossRef]
  20. Hua, Y.; Barker, R.; Neville, A. Comparison of corrosion behaviour for X-65 carbon steel in supercritical CO2-saturated water and water-saturated/unsaturated supercritical CO2. J. Supercrit. Fluids 2015, 97, 224–237. [Google Scholar] [CrossRef]
  21. Kermani, M.B.; Morshed, A. Carbon dioxide corrosion in oil and gas production: A compendium. Corrosion 2003, 59. [Google Scholar] [CrossRef]
  22. Nešić, S. Key issues related to modelling of internal corrosion of oil and gas pipelines—A review. Corros. Sci. 2007, 49, 4308–4338. [Google Scholar] [CrossRef]
  23. Nyborg, R. Overview of CO2 corrosion models for wells and pipelines. In Proceedings of the NACE International Annual Conference, Denver, CO, USA, 7–12 April 2002; pp. 1–16. [Google Scholar]
  24. Choi, Y.S.; Nesic, S.; Ling, S. Effect of H2S on the CO2 corrosion of carbon steel in acidic solutions. Electrochim. Acta 2011, 56, 1752–1760. [Google Scholar] [CrossRef]
  25. Sun, W.; Nesic, S.; Papavinasam, S. Kinetics of iron sulfide and mixed iron sulfide/carbonate scale precipitation in CO2/H2S corrosion. In Proceedings of the CORROSION 2006, San Diego, CA, USA, 12–16 March 2006; pp. 1–26. [Google Scholar]
  26. Ning, J.; Zheng, Y.; Young, D.; Brown, B.; Nesic, S. A thermodynamic study of hydrogen sulfide corrosion of mild steel. In Proceedings of the CORROSION 2013, Orlando, FL, USA, 17–21 March 2013; pp. 1–21. [Google Scholar]
  27. Pots, B.; John, R.C.; Rippon, I.J.; Simon Thomas, M.J.; Kapusta, S.D.; Girgis, M.M.; Whitham, T. Improvements on de Waard–Milliams corrosion prediction and applications to corrosion management. In Proceedings of the CORROSION 2002, Denver, CO, USA, 7–12 April 2002; pp. 1–19. [Google Scholar]
  28. Sun, W.; Nesic, S.; Woollam, R.C. The effect of temperature and ionic strength on the solubility of iron carbonate (FeCO3). Corros. Sci. 2009, 51, 1630–1639. [Google Scholar] [CrossRef]
  29. Qiu, Z.; Xiong, C.; Chang, Z.; Zhao, Z.; Zhao, C.; Ye, Z. Major corrosion factors in the CO2 and H2S coexistent environment and the anti-corrosion method: Taking Tazhong 1 gas field, Tarim Basin, as an example. Pet. Explor. Dev. 2012, 39, 238–242. [Google Scholar] [CrossRef]
  30. Zhu, S.; Liu, H.; Bai, Q.; Wang, Y.; Li, X. Dynamic corrosion behavior of P110 steel in simulated oil field CO2/H2S environment. Chem. Eng. Oil Gas 2009, 38, 65–68. [Google Scholar]
  31. Liu, W.; Zhang, N.; Zhang, Z.; Ding, S.; Ren, C.; Lin, Z.; Gou, D.; Li, L. Corrosion behavior and mechanism of oil casing steel of different materials in CO2/H2S coexistence environment. Surf. Technol. 2025, 54, 37–45. [Google Scholar]
  32. Lai, Y.; Miao, J. Study on the corrosion of specific materials under conditions with high coexistence of hydrogen sulfide and carbon dioxide. Green Pet. Petrochem. 2025, 10, 50–55. [Google Scholar]
  33. Gao, K.; Shang, S.; Zhang, Z.; Wang, Y.; Yang, Y.; Li, J. Effect of temperature on corrosion behavior of S135 steel and G105 steel in CO2/H2S coexisting system. Mater. Mech. Eng. 2023, 47, 24–30. [Google Scholar]
  34. Song, P. Research on Corrosion Behavior of 80S Steel and N80 Steel in CO2/H2S Coexistent Environment. Master’s Thesis, Xi’an Shiyou University, Xi’an, China, 2023. [Google Scholar]
  35. Song, C.; Song, X.; Chen, Q.; Li, K.; Jia, H.; Li, G. Corrosion behavior and mechanism of 20 steel under CO2/H2S coexisted environment in oil and gas field. Mater. Mech. Eng. 2023, 47, 60–65. [Google Scholar]
  36. Kakooei, S.; Ismail, M.C.; Ariwahjoedi, B. Mechanisms of microbiologically influenced corrosion: A review. World Appl. Sci. J. 2012, 17, 524. [Google Scholar]
  37. Parakala, S.R. EIS Investigation of Carbon Dioxide and Hydrogen Sulfide Corrosion Under Film Forming Conditions. Ph.D. Thesis, Ohio University, Athens, OH, USA, 2005. [Google Scholar]
  38. Sherar, B.W.A.; Power, I.M.; Keech, P.G.; Mitlin, S.; Southam, G.; Shoesmith, D. Characterizing the effect of carbon steel exposure in sulfide containing solutions to microbially induced corrosion. Corros. Sci. 2011, 53, 955–960. [Google Scholar] [CrossRef]
  39. Hodgkiess, T.; Neville, A.; Shrestha, S. Electrochemical and mechanical interactions during erosion–corrosion of a high-velocity oxy-fuel coating and a stainless steel. Wear 1999, 233, 623–634. [Google Scholar] [CrossRef]
  40. Barker, R.; Burkle, D.; Charpentier, T.; Thompson, H.; Neville, A. A review of iron carbonate (FeCO3) formation in the oil and gas industry. Corros. Sci. 2018, 142, 312–341. [Google Scholar] [CrossRef]
  41. Pessu, F.; Barker, R.; Neville, A. The influence of pH on localized corrosion behavior of X65 carbon steel in CO2-saturated brines. Corrosion 2015, 71, 1452–1466. [Google Scholar] [CrossRef] [PubMed]
  42. Fu, C.; Zheng, J.; Zhao, J.; Xu, W. Application of grey relational analysis for corrosion failure of oil tubes. Corros. Sci. 2001, 43, 881–889. [Google Scholar] [CrossRef]
  43. Tu, Y.; Xie, C.; Liu, C.; Li, J. Application of grey correlation analysis method in reservoir evaluation of Qingdong SA. Nat. Gas Geosci. 2012, 23, 381–386. [Google Scholar]
  44. Rickard, D. Reaction pathways in the Fe-S system below 100 °C. Chem. Geol. 2000, 167, 267–293. [Google Scholar]
  45. Liu, C.C. Experimental Study on the Electrical Conductivity of FeS-Bearing Olivine at High Temperature and Pressure. Ph.D. Thesis, University of Chinese Academy of Sciences, Beijing, China, 2019. [Google Scholar]
  46. Ming, X.; Wang, X.L.; Du, F.; Chen, G.; Wang, C.Z.; Yin, J.W. First-principles study of the high-pressure phase transition and properties of siderite FeCO3. Acta Phys. Sin. 2012, 61, 097102. [Google Scholar] [CrossRef]
  47. Bai, P. Crystal Evolution of Corrosion Products of Carbon Steel in H2S Environments and Its Influence Mechanism on Corrosion Behavior. Ph.D. Thesis, China University of Petroleum (Beijing), Beijing, China, 2017. [Google Scholar]
  48. Mercier-Bion, F.; Li, J.; Lotz, H.; Tortech, L.; Neff, D.; Dillmann, P. Electrical properties of iron corrosion layers formed in anoxic environments at the nanometer scale. Corros. Sci. 2018, 137, 98–110. [Google Scholar] [CrossRef]
  49. Stack, M.M.; Abdulrahman, G.H. Mapping erosion-corrosion of carbon steel in oil exploration conditions: Some new approaches to characterizing mechanisms and synergies. Tribol. Int. 2010, 43, 1268–1277. [Google Scholar] [CrossRef]
  50. Schmitt, G.; Bosch, C.; Mueller, M.; Siegmund, G. A Probabilistic Model for Flow Induced Localized Corrosion. In Proceedings of the CORROSION 2000, Orlando, FL, USA, 26–31 March 2000. Paper No. C2000-00049. [Google Scholar]
Figure 1. Uniform and pitting corrosion rates of N80 under different production conditions.
Processes 14 01552 g001
Figure 2. Uniform vs. pitting corrosion: grey relational grade comparison.
Processes 14 01552 g002
Figure 3. SEM profile before and after removing corrosion product of N80 under PCO2/PH2S = 2.9, flow rate of 110,000 m3/d.
Processes 14 01552 g003
Figure 4. SEM morphology of N80 under different partial pressure ratios at T = 80 °C, flow rate of 110,000 m3/d before and after removing corrosion product.
Processes 14 01552 g004
Figure 5. SEM morphologies of N80 steel before and after corrosion product removal under different flow rates (T = 80 °C, PCO2/PH2S = 2.9).
Processes 14 01552 g005
Figure 6. XRD analysis of corrosion products on N80 steel under varying conditions.
Processes 14 01552 g006aProcesses 14 01552 g006b
Figure 7. Three-dimensional pitting morphology and depth profile curves of N80 steel under different operating conditions. Colors indicate the relative height (from blue = low to red = high).
Processes 14 01552 g007aProcesses 14 01552 g007b
Figure 8. Schematic illustration of corrosion mechanism transition for N80 steel under dynamically evolving H2S/CO2 environments during CCUS-EGR.
Processes 14 01552 g008
Table 1. Chemical composition of N80 carbon steel (wt.%).
ElementCMnSiMoCrVPSCuNiFe
Content0.341.450.200.180.150.110.020.0150.0080.03Balance
Table 2. Chemical composition of the simulated formation water.
Chemical ComponentConcentration (mg/L)
NaCl9.945
NaHCO3400.68
Na2SO4142.00
CaCl25.55
NaBr3.09
MgCl2·6H2O2.03
Table 3. Experimental matrix for grey relational analysis.
CaseTemp (°C)PCO2/PH2SFlow Rate
(m3/d)
Uniform CR
(mm/y)
Standard Deviations of UniformPitting CR
(mm/y)
Standard Deviations of Pitting
1402.9110,0000.5090.01251.7350.1001
2602.9110,0000.5670.00510.9760.0365
3802.9110,0000.5060.00822.2400.0890
48033.7110,0000.9740.04161.7510.0802
58067.4110,0001.0420.06381.2170.0605
6802.950,0000.5130.010.8580.0212
7802.980,0000.5590.00811.6730.0272
Note: The standard deviations (SD) in Table 3, derived from triplicate tests, indicate good repeatability. Close values (e.g., uniform corrosion rates of 0.509 vs. 0.506 mm/y) are within experimental error and are not interpreted as mechanistically different.
Table 4. Grey relational grades of environmental factors on corrosion rates.
Corrosion TypeTemperaturePCO2/PH2SFlow RateRanking of Dominant Factors
Uniform Corrosion0.6500.8800.600Ratio > Temp. > Flow
Pitting Corrosion0.8580.6260.892Flow > Temp. > Ratio
Table 5. EDS elemental composition of corrosion scales at different temperatures (at.%). (PCO2/PH2S = 2.9, flow rate of 110,000 m3/d.)
Temp. (°C)COSFeSiMnCaCrKNa
4015.0837.4314.1931.550.450.30-0.140.270.59
6012.3930.5812.2743.300.221.06-0.18--
8013.8620.4129.6635.70-0.160.21---
Table 6. EDS elemental composition of corrosion scales at different partial pressure ratios (at.%) (T = 80 °C, flow rate of 110,000 m3/d).
PCO2/PH2SCOSFeSiMnCaCrKNa
2.913.8620.4129.6635.70-0.160.21---
33.714.1822.1026.9135.420.180.12-0.110.230.75
67.412.3948.077.2431.540.140.440.090.09--
Table 7. EDS elemental composition of corrosion scales at different flow rates (at.%). (T = 80 °C, PCO2/PH2S = 2.9.)
Flow Rate (m3/d)COSFeSiMnCaCrMg
50,00010.7941.5416.6129.940.130.230.660.100.13
80,00016.1335.6423.0223.40-0.251.22-0.35
110,00013.6216.3332.6736.640.16-0.390.19-
Table 8. Comparison of maximum pitting depth and pitting rate under different conditions.
CaseTemp.
(°C)
PCO2/PH2SFlow
(m3/d)
Max. Depth
(μm)
Pitting Rate
(mm/y)
Pit Morphology
1402.9110,00014.261.735Irregular, shallow dish
2602.9110,0008.020.976Hemispherical
3802.9110,00018.412.240Funnel-shaped, deep
48033.7110,00014.381.751Shallow, wide dish
58067.4110,00010.001.217Micro-pitting arrays
6802.950,0007.050.858Small-area, shallow
7802.980,00013.751.673Elliptical, flow-aligned
Disclaimer/Publisher’s Note: The statements, opinions and data contained in all publications are solely those of the individual author(s) and contributor(s) and not of MDPI and/or the editor(s). MDPI and/or the editor(s) disclaim responsibility for any injury to people or property resulting from any ideas, methods, instructions or products referred to in the content.