


Abstract
High-pressure water injection (HPWI) refers to injecting water into the formation under conditions where the injection pressure is higher than or close to the formation fracture pressure. This technique can effectively improve the water absorption capacity of low-permeability reservoirs and maintain the formation pressure above the bubble point. It is a key technology for solving the problem of “difficult injection and difficult recovery” in low-permeability reservoirs, thereby achieving increased injection and enhanced production. However, due to the lack of a unified understanding of the mechanisms of dynamic micro-fractures and the mechanism of pore volume expansion and permeability enhancement during HPWI, the technology has not been widely promoted and applied. Based on an in-depth analysis of the mechanism of high-pressure water injection and by building a geological model for an actual oilfield development block, the “compaction–expansion” theory of rocks is used to characterize the variation in reservoir properties with pore pressure. This model is used to simulate the reservoir’s pore volume expansion and permeability enhancement effects during high-pressure water injection. The research results show the following: (1) HPWI can increase the effective distance of injected water by changing the permeability of the affected area. (2) During HPWI, the effective areas in the reservoir are divided into three regions: the enhanced-permeability zone (EPZ), the swept zone without permeability enhancement, and the unswept zone. Moreover, the EPZ expands significantly with higher injection pressure, rate, and volume. However, the degree of reservoir heterogeneity will significantly affect the effect of HPWI. (3) Simulation of two production modes—“HPWI–well soaking–oil production” and “simultaneous HPWI and oil production”—shows that under the first production mode, the degree of uniformity of the production wells’ response is higher. However, in the production wells in the EPZ, after a certain stage, an overall water flooding phenomenon occurs. In the second mode, the production wells in the water channeling direction show an alternating and rapid water-flooding phenomenon, while the production wells in the non-water channeling areas are hardly affected. Meanwhile, for local production wells with poor effectiveness of high-pressure water injection, hydraulic fracturing can be used as a pilot or remedial measure to achieve pressure-induced effectiveness and improve the sweep efficiency of the injected water. The results of this study explain the mechanisms of volume expansion and permeability enhancement during high-pressure water injection, providing guiding significance for the on-site application and promotion of high-pressure water injection technology in low-permeability reservoirs.
1. Introduction
With the continuous growth of global energy demand and the increasing depletion of conventional oil and gas resources, unconventional oil and gas resources have gradually become an important source of replacement production capacity. According to statistics, the proportion of global low-permeability oil and gas resources in the total oil and gas resources is significant. In China, the proportion of low-permeability crude oil reserves has exceeded 65% [1,2,3,4]. Therefore, the efficient development of low-permeability oil and gas reservoirs has become an important strategic direction for ensuring energy security. However, compared with conventional oil and gas reservoirs, low-permeability reservoirs exhibit significant reservoir heterogeneity, complex non-linear seepage mechanisms, and strong reservoir sensitivity and other characteristics. These factors together pose severe technical challenges during their development process and have become major engineering and technical problems in the field of oil and gas field development [5,6,7]. In view of these problems, Chinese and foreign scholars have proposed HPWI technology. At present, this technology has been successfully applied in multiple low-permeability reservoir blocks and has achieved good on-site application effects [8].
High-pressure water injection (HPWI) is a process of continuous water injection under high pressure. It can expand the pores around the injection well and connect micro-fractures, thereby improving the seepage channels, quickly replenishing the formation energy, and significantly enhancing the oil displacement effect. Among them, the dynamic opening and closing of the injection fracture are the key links to the HPWI technology [9]. Micro-fractures usually refer to cracks with a length of less than 50.00 mm and can be observed under a microscope or a scanning electron microscope. When the deviatoric stress is relatively small and does not reach the level of the rupture of the entire rock but meets the conditions for the rupture of local rock, micro-fractures will form [10,11]. The effective connection and expansion of micro-fractures contribute to improving the seepage capacity of the reservoir and, at the same time, provide a favorable space for the advancement of the oil displacement front [12].
From the characteristics of HPWI and the on-site implementation effect, Ma et al. studied the selection method of high-pressure injection wells from the perspective of geology, reservoir, and engineering integration [13]. Cheng et al. [14] clarified the feasibility of injecting water into tight oil formations under the condition of reservoir fracturing around injection wells through simulation and targeted on-site tests. This method can increase permeability and promote pressure propagation, but there is a risk of rapid water breakthrough. Yang et al. [15] studied the field effect of HPWI and found that the injection capacity under HPWI was significantly improved, and the injection effect after restoring the conventional waterflood was also enhanced. The microseismic monitoring results showed that HPWI generated microfracture zones that expanded uniformly. The corresponding oil wells showed obvious responses, and the HPWI effect was better in reservoirs with relatively high permeability. Ma et al. [13] proposed that under the conditions of HPWI with large displacement and large liquid volume, there are three major problems during on-site production: crossflow in high-permeability layers, obvious effectiveness directionality, and rapid decline in the pressure and production of some oil wells, accompanied by a rapid rise in water cut. Generally speaking, the on-site application effect of HPWI is good, with obvious oil and production increases [16]. However, there are still problems of poor effectiveness or water channeling. There is an urgent need to improve the mechanistic understanding of HPWI and optimize decision-making methods.
In terms of mechanism research, Lei et al. [17] carried out high-multiple water injection experiments and found that high-multiple water injection expanded the oil-swept area and changed the wettability, accelerating the early-stage oil recovery rate. However, affected by multiple factors, the increase in the later stage was relatively small. Yang et al. [18] showed, through the experimental results of core water injection, that when attempting to increase oil production by raising the water injection pressure, it is necessary to evaluate the heterogeneity of reservoir rocks. Sun et al. [19] carried out a true triaxial stepped injection rate water injection expansion experiment and found that after the injection pressure exceeded the minimum principal stress, the slope decreased significantly with the increase in the injection rate. Moreover, through CT scanning, it was found that there were complex expansion zones with shear fractures or tensile fractures in the core. Yang et al. [18] showed, through the experimental results of core water injection, that when attempting to increase oil production by raising the water injection pressure, it is necessary to evaluate the heterogeneity of reservoir rocks. Sun et al. [20] carried out a true triaxial stepped injection rate water injection expansion experiment and found that after the injection pressure exceeded the minimum principal stress, the slope decreased significantly with the increase in the injection rate [21]. Moreover, through CT scanning, it was found that there were complex expansion zones with shear fractures or tensile fractures in the core. Zhang et al. [22] carried out HPWI experiments through a flat plate model. The results showed that a large-scale permeability-increasing area was formed after HPWI. Core observation revealed that through-going and branched fractures were well developed in the near-wellbore area, and there was a large range of local damage in other areas. The experiments also indicated that double-wing macroscopic fractures were likely to form under high viscosity and high displacement, while a complex fracture network was more likely to form with low viscosity and low displacement injection. These studies have all shown that under the water injection conditions that are close to the fracture pressure, the rock is in a micro-fracture state without generating the macroscopic main fractures, which are mainly controlled by shear and tensile micro-cracks. The micro-crack network generated during the HPWI process is the key to improving the efficiency and production of this technology.
In terms of numerical simulation, Dewan R et al. [23] used the Eclipse water balance model (Langenberg black oil model) and applied a three-dimensional simulation setup to analyze mechanisms such as oil–gas contact, pressure control, and production response. This is suitable for initially understanding the water injection pressure maintenance strategy. Cui et al. [24,25,26] conducted research on the dynamics of HPWI fractures of the double-wing long-slit type. They carried out numerical simulation solutions by combining the oil–water seepage theory, the dynamic expansion of fractures, and the time-varying permeability model. Considering various factors such as the threshold pressure gradient, stress sensitivity, and reservoir heterogeneity, they fitted the pressure changes during HPWI. Moreover, they divided HPWI into five stages: the initial fracture initiation stage, the fracture propagation stage, the linear flow stage, the transition flow stage, and the boundary-controlled flow stage. Ma et al. [27] simulated and calculated the elastic and plastic volume expansion and permeability enhancement phenomena during the HPWI process, using the ABAQUS 2024 finite element software based on the geomechanical conditions. Guo et al. [16] established a coupled hydro-mechanical-damage (H-M-D) mathematical model of fluid–solid interaction, based on the non-linear seepage model, Biot’s linear elasticity theory, and the continuous damage model, and carried out a numerical simulation of the integrated HPWI of “pressurization-soaking-production”. Zhan et al. [28] achieved historical fitting by constructing a numerical model and introduced a “dilation-recompaction” geomechanical model to explain the evolution behavior of reservoir porosity and permeability, thereby enhancing the accuracy of the simulation. At present, there are numerous simulation methods for HPWI, but most of them are based on their own understanding of the mechanism of HPWI, and the simulation ideas are mostly borrowed from other measures such as hydraulic fracturing, volume fracturing, and capacity expansion and increased injection. The adaptability of these simulation methods to HPWI still needs to be verified.
In summary, the HPWI process in low-permeability reservoirs involves multiple influencing factors such as reservoir stress sensitivity, heterogeneity, rock failure criteria, fracture dynamic behavior, and non-Darcy flow. It is still in the initial implementation stage, with unclear action mechanisms and unknown influence patterns. Field practices often draw on the implementation experience of conventional waterflood and hydraulic fracturing, lacking sufficient theoretical support [29,30]. Therefore, based on the relevant research on HPWI, carried out by our predecessors, this paper has sorted out a set of theoretical ideas for enhancing the efficiency of HPWI, and has proposed a method to simulate the process of enhancing the efficiency of HPWI through the CMG reservoir simulation software. The simulation results show a good fitting effect with the actual production trend. The key innovations of this paper lie in the following: ① the combination of the compaction–expansion process with the continuous damage mechanics of rocks and specific failure criteria (tensile, shear) and ② the consideration of the influence of reservoir heterogeneity and the directional effect of compaction–expansion in actual reservoirs.
2. Mechanism and Model
2.1. Analysis of the Action Mechanism of HPWI
2.1.1. The Growth and Development Process of Micro-Fractures During HPWI
HPWI involves injecting water into the formation at a high pressure and large flow rate. Based on the stress sensitivity of the reservoir and the principle of rock damage and failure, the rocks around the injection wells will experience pore volume expansion, series connection of non-connected pore-throat channels, and shear and tensile damage between rock particles. The reservoir can absorb a large amount of injected water and displace crude oil to the corresponding oil wells for production to the surface.
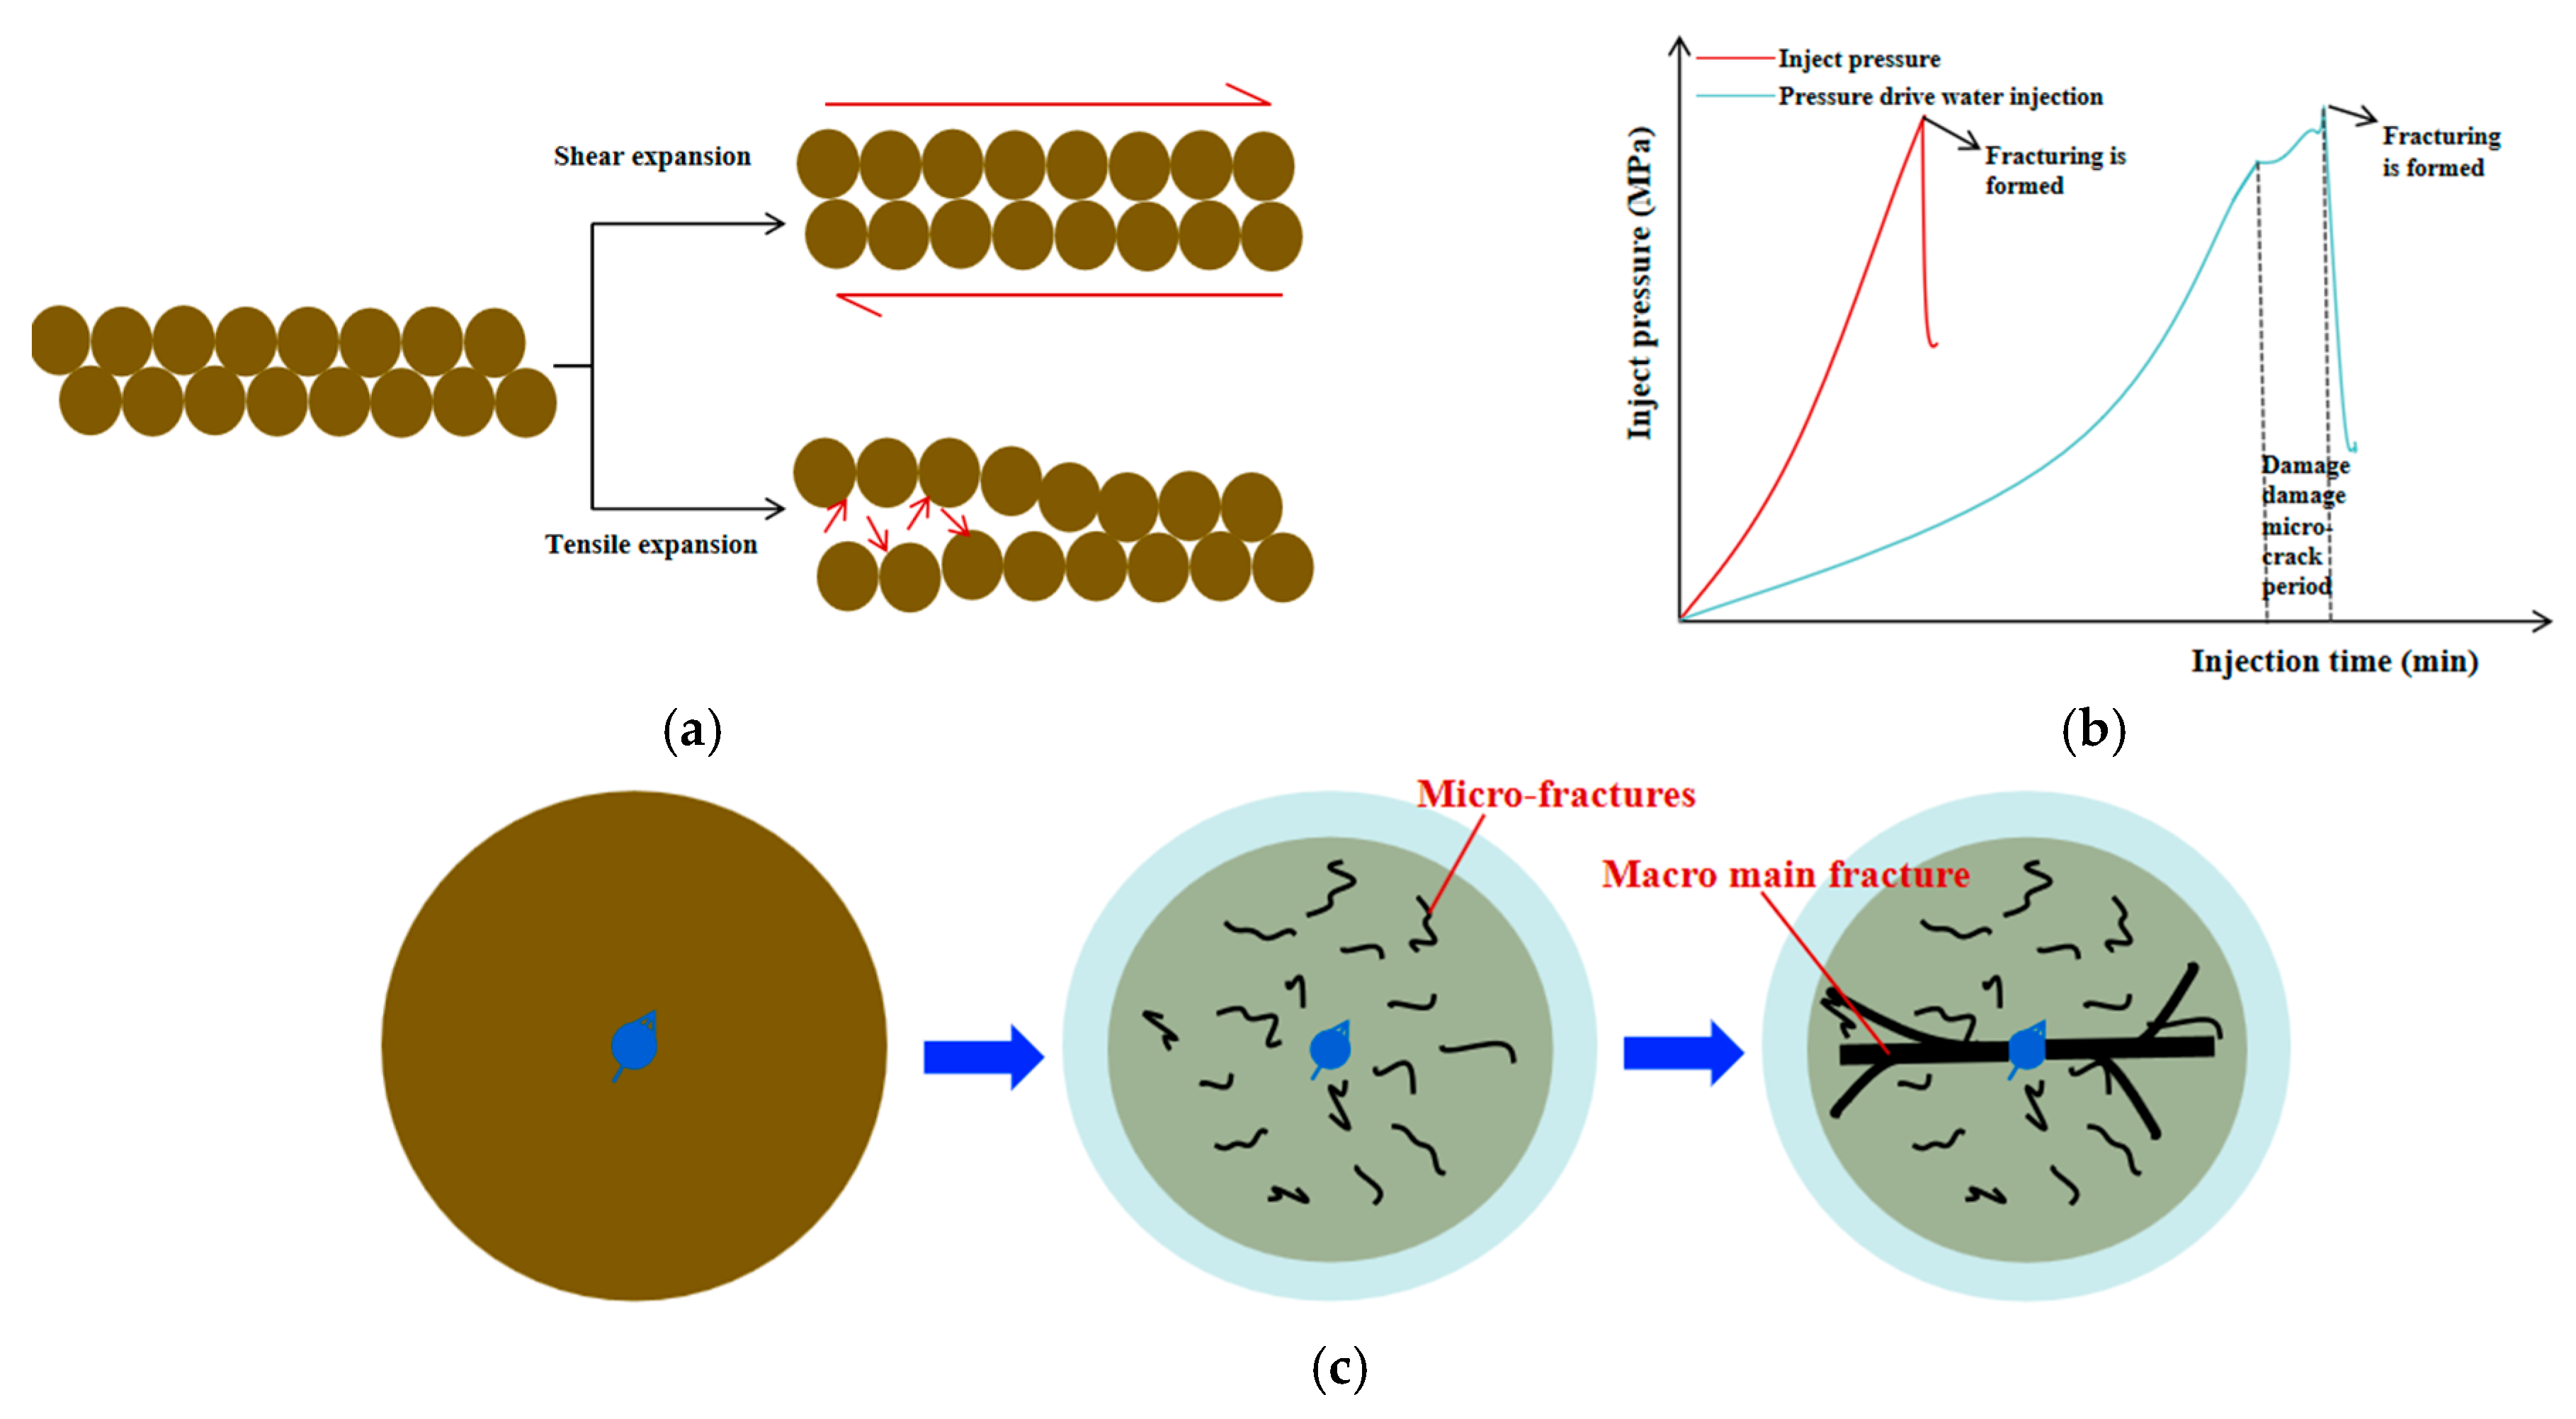
Different from the hydraulic fracturing technology, the injection displacement corresponding to HPWI is small and the fluid viscosity is low. The injected water can more easily penetrate into the weak planes of the rock, increasing the pore pressure of the formation, and causing shear slip or tensile expansion of the weak planes of the reservoir rock (Figure 1a) to form micro-fractures. Therefore, before the formation is fractured to form large cracks by HPWI, there is an obvious period of microcrack growth and development (Figure 1b). During the stage of micro-fracture growth and development, the formation can absorb a large amount of injected water and achieve a relatively uniform oil displacement effect. As the pressure of the injected water increases further, larger main fractures and branch fractures will form in the formation (Figure 1c), thus leading to the phenomenon of water channeling [4]. Therefore, during the field application of HPWI, it is necessary to combine indoor simulation experiments to control the water-injection pressure within a certain range. This ensures the formation of a large number of damaged micro-fractures in the formation, improves the reservoir seepage capacity, achieves the effect of uniform displacement of injected water, and avoids the formation of larger main fractures and branch fractures [31]. Here, the larger main fractures refer to the fractures that can connect between the injection and production wells and cause water channeling problems; micro-fractures are formed by the irregular and non-connected weak surface slip and tension around injection wells and are mainly used to uniformly absorb a large amount of low-viscosity injected water.
Figure 1.
Process of HPWI. (a) Microscopic mechanisms of shear dilation and tensile dilation; (b) pressure responses of hydraulic fracturing and HPWI; (c) development process of damaged fractures during HPWI.
2.1.2. The Stress Damage Sensitivity Characteristics of Reservoir Permeability
Low-permeability oil reservoirs exhibit significant stress sensitivity, especially during HPWI. The elastic deformation and damage deformation of the reservoir matrix particles lead to the formation of micro-fractures, which cause the enlargement of pore throats and an increase in permeability. All these changes can be attributed to the stress sensitivity of the reservoir permeability. When the heterogeneity of the formation is relatively strong, HPWI is more likely to cause the development of micro-fractures in the natural weak planes of the high-permeability areas. When the pressure is lower than the macroscopic fracture pressure of the formation, HPWI makes the micro-fractures around the injection well widely and dispersedly distributed, ensuring that the injected water advances forward in a radially uniform manner. Therefore, this paper uses the stress sensitivity degree of reservoir matrix permeability to measure the damage effect of HPWI and adopts the equivalent continuous medium to characterize micro-fractures, taking into account the permeability change relationship between micro-fractures and the matrix.
The stress sensitivity of matrix permeability can be expressed by the following exponential model:
where K1 is the current matrix permeability, mD; K0 is the initial matrix permeability, mD; β is the stress sensitivity coefficient, Pa−1; and P is the effective stress, Pa.
At present, the initiation and propagation of micro-fractures are characterized by the damage mechanics model [24]. D is the total damage factor of the reservoir rock and K2 is the comprehensive average permeability of the reservoir rock after being damaged. The specific calculation equations are shown in (2) and (3), below [25]:
where D is the total damage factor of the reservoir rock; P < 0 indicates that the rock is in a tensile state, and P ≥ 0 indicates that the rock is in a compressive state, Pa; KM is the permeability of the undamaged rock, mD; KD is the permeability of the damaged rock, mD; is the plastic volumetric strain, %; Ds is the damage factor caused by shear micro-fractures, Dt is the damage factor caused by tensile micro-fractures, and Dh is the isotropic compressive damage factor caused by pore collapse.
It can be seen from the equations that the comprehensive average permeability, K2, has an additional damage stress sensitivity, KD, after the damage of the reservoir matrix and its corresponding exponential multiple on the basis of the matrix permeability, KM. The growth rate of the permeability, K2, is much greater than that of KM.
It is worth noting that the micro-fracture type of damage only exists within a certain pressure range. When the effective stress increases to a certain value and reaches the formation conditions for overall rupture, large macroscopic fractures will develop between the injection and production wells. These fractures exhibit stronger seepage capacity and form water channeling. The effect of this type of fracture on HPWI is often difficult to predict effectively. Therefore, this paper focuses on the study of effectiveness, mainly based on the extensive and decentralized micro-fracture damage network formed during HPWI.
It should be noted that the equivalent continuous medium model adopted in this paper is mainly used to describe the widely developed dispersed micro-fracture networks during high-pressure water injection, rather than to simulate the macroscopic main fractures that may cause water channeling. This model assumes that micro-fractures are uniformly distributed within the grid scale in a statistical sense and represents their permeability-enhancement effect through damage factors and an increase in permeability. However, the dynamic expansion behavior, fluid–solid coupling effect, and control role on fluid channeling of large-length and high-conductivity macroscopic fractures (such as double-wing fractures spanning injection and production wells) are not fully reflected in this model. Therefore, this model is more suitable for studying the expansion and permeability enhancement process dominated by micro-fractures when the injection pressure is controlled within a certain range, and it is not applicable to simulating the water channeling dynamics after the formation of macroscopic fractures.
2.1.3. Analysis of the Effective Distance Under the Action of the Threshold Pressure Gradient
In low-permeability oil reservoirs, the pore throats are tiny, and the permeability of the reservoir rocks is poor. Affected by the boundary layer of crude oil, the seepage characteristics no longer conform to Darcy’s law. They exhibit obvious non-linear seepage characteristics, and there is an additional pressure drop of the threshold pressure gradient. Oil and water wells must overcome the threshold pressure gradient to establish an effective displacement.
The threshold pressure gradient is mainly affected by reservoir permeability and crude oil viscosity, and is generally expressed as follows:
where λ is the threshold pressure gradient, MPa/m; k is the average formation permeability, 10−3 μm2; is porosity, %; and μ is the viscosity of formation crude oil, mPa·s. The values of A and n (regression coefficients) for different reservoirs can be obtained by fitting the measured core threshold pressure gradient data.
In order to establish an effective displacement relationship between the injection and production wells, the limit effective distance of the injection wells is calculated under a specific threshold pressure gradient. The limit effective distance of injection wells is deduced through the non-Darcy seepage equation, as shown in Equation (5) below:
where L is the limit effective distance of the injection well, m; Pe is the supply-side pressure, MPa; Pw is the production-side pressure, MPa.
If there is a lack of effective data to calculate the threshold pressure gradient, λ, the limit-effective well-spacing of the injection wells can be calculated according to empirical Equation (6):
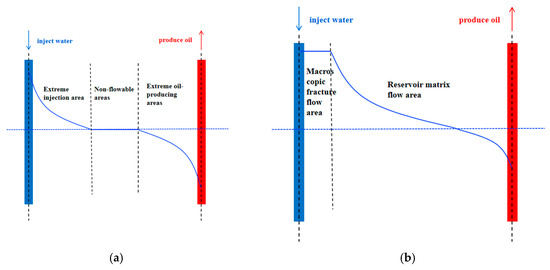
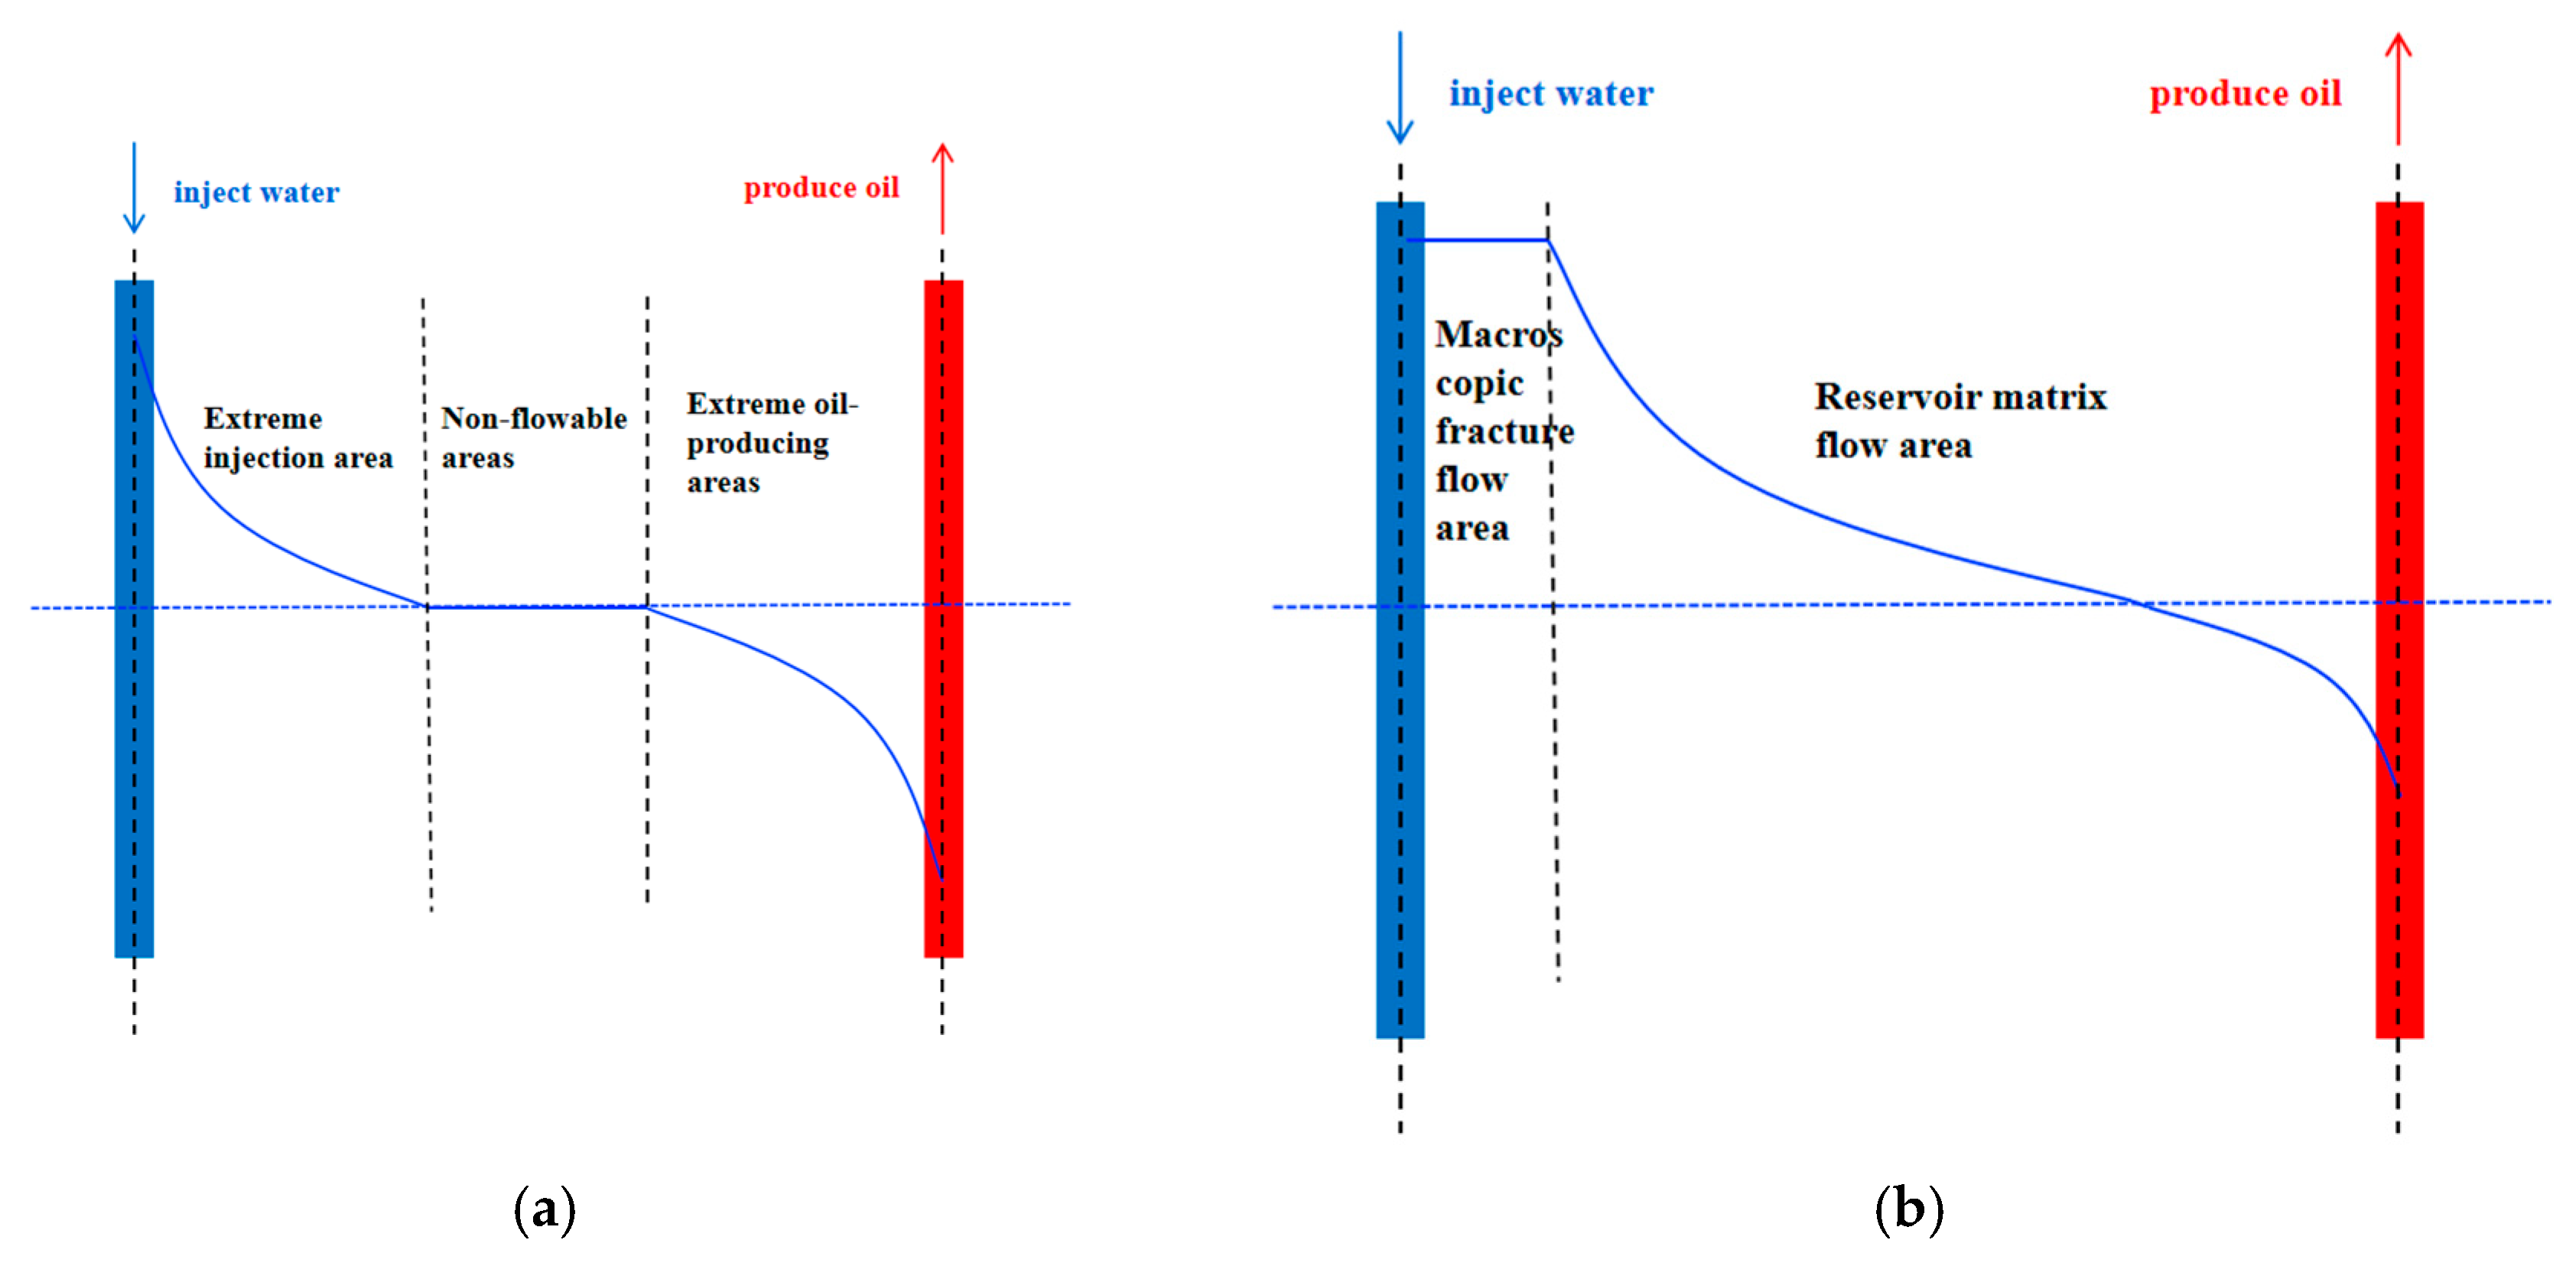
Compared with the conventional waterflood, HPWI has a very good effect in overcoming the problem of the threshold pressure gradient. On the one hand, the high water injection pressure provides a greater water injection pressure difference. On the other hand, the generation of micro-fractures around the injection well improves the permeability of the reservoir matrix and reduces the threshold pressure gradient. According to Equations (5) and (6), HPWI can achieve a larger limit for well spacing. Moreover, with the formation of macroscopic fractures during HPWI, the pressure conduction when the injected water flows along the macroscopic fractures can be approximately regarded as lossless. The effective well spacing that needs to overcome the flow resistance is shortened, and it is easier to see the effect between the injection and production wells, as shown in Figure 2. However, at this time, attention should also be paid to the occurrence of water-channeling problems caused by the excessive extension of large macroscopic fractures. The extreme injection area refers to the area where the injected fluid (such as water, gas, or other fluids) propagates in the formation when the fluid is injected, which may lead to a significant increase in pressure or a change in the fluid flow pattern. The non-flow area refers to the part where there is almost no flow, due to extremely low permeability or insufficient pressure difference. The macroscopic fracture flow area generally refers to the high-permeability flow unit, composed of an open fracture network that can be directly observed and can significantly transmit fluids. The fracture zone refers to the damaged rock area around the main fracture, which contains micro-fractures and broken rocks, but it may not necessarily be the main flow channel.
Figure 2.
Schematic diagram of injection and production, considering the threshold pressure gradient. (a) Conventional waterflood and (b) HPWI.
2.2. Model Establishment for the Effectiveness Analysis of HPWI
2.2.1. Introduction to the Background of the Research Block
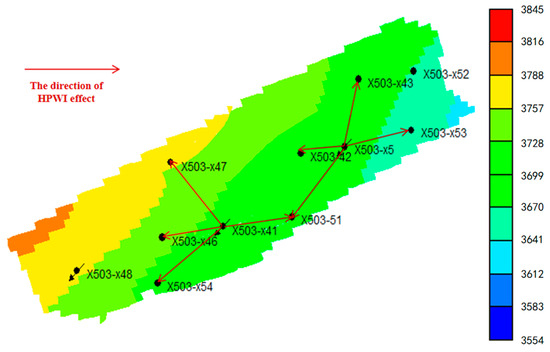
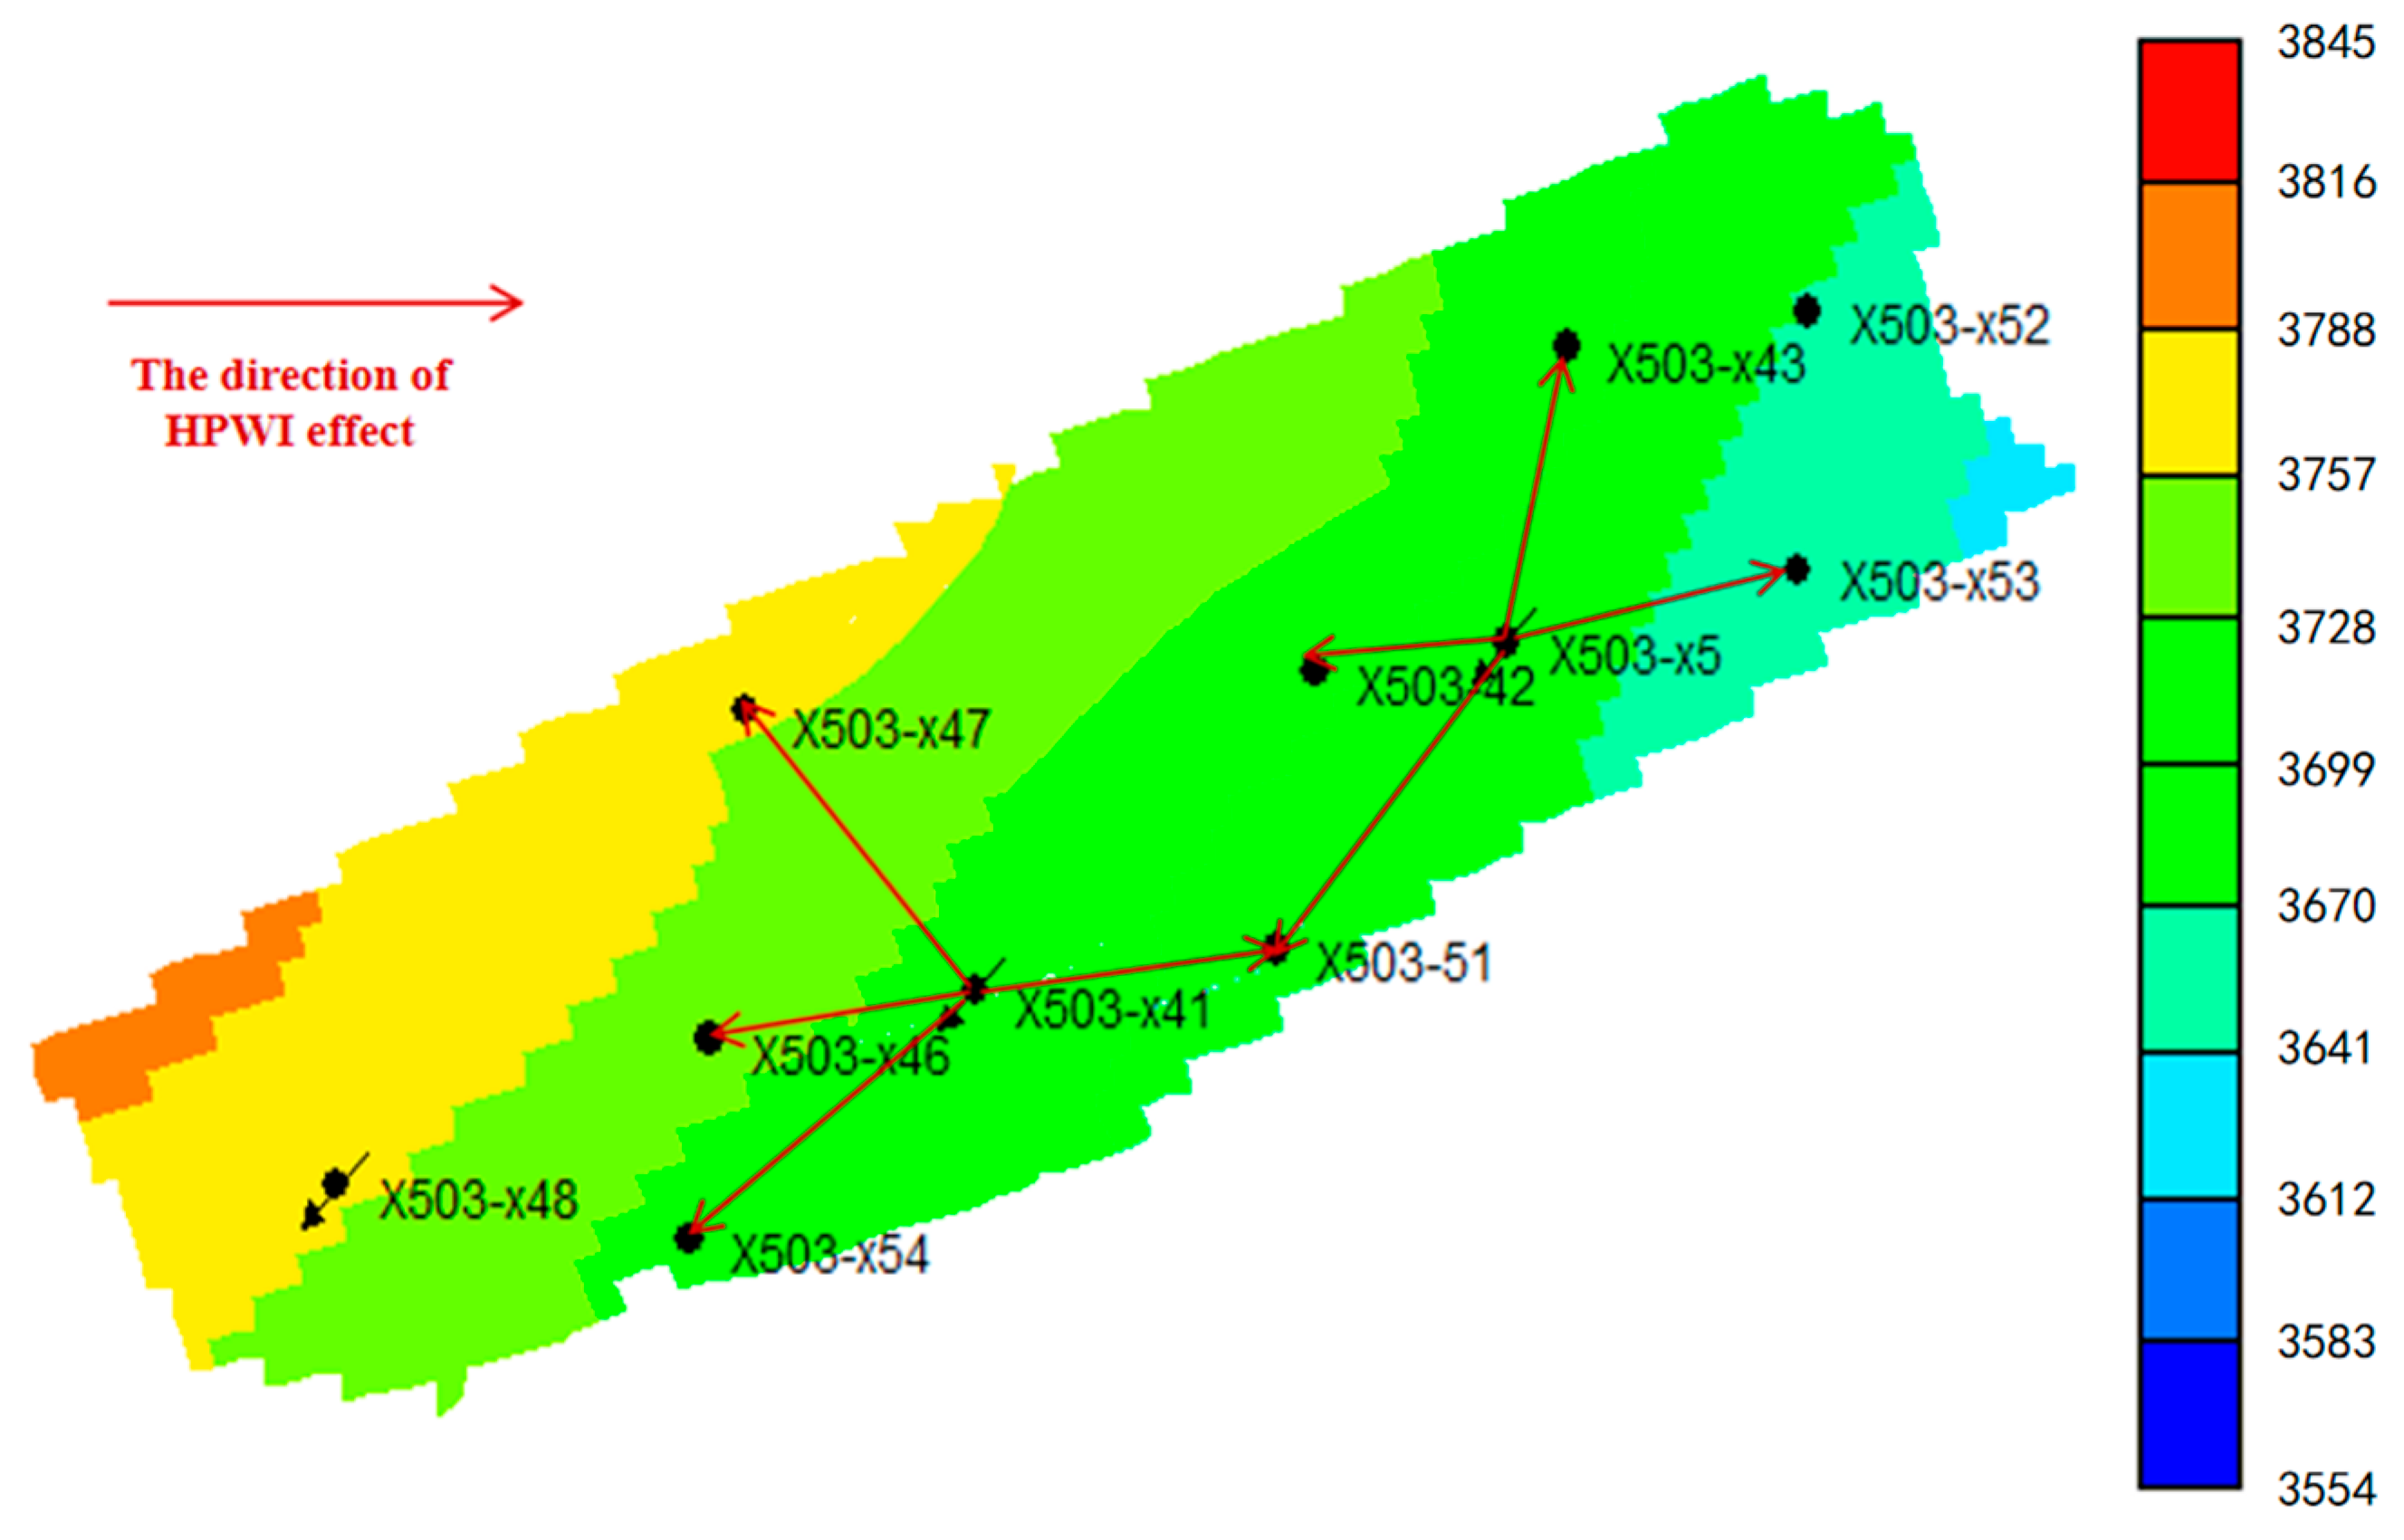
Study block A is located in S Oilfield and belongs to a medium-porosity and low-permeability reservoir. In the early production stage, it was produced by elastic drive, relying on formation energy. Due to the poor physical properties, such as reservoir porosity and permeability, when water injection development is carried out after the formation energy decreases, there is a problem that water cannot be injected. The well pattern distribution of the block is shown in Figure 3. Among them, Well X5 and Well X41 were converted into high-pressure injection wells after the depletion of two oil wells in the early development stage.
Figure 3.
Well pattern distribution in the study block.
The injection well X5 corresponds to four offset producers: namely, wells X53, X51, X43, and 42. The production mode of HPWI for this well group is as follows: (1) Initially, all four production wells were shut in to suspend production. The X5 injection well then carried out a high-pressure water injection at a rate of 800–1000 m3/day and an injection pressure of 30–40 MPa for a duration of one month, after which the production wells were reopened. (2) The casing pressure of production well 42 had always been nearly equal to that of the X5 injection well. This indicated a fully watered-out condition; consequently, well 42 was shut for the abandonment of production. (3) The remaining three production wells, Well X53, Well X51, and Well X43, were opened in sequence, according to the speed of the pressure response. Within a certain effective time, all three production wells showed an increase in oil production and a low water cut phenomenon. Moreover, Well X51 had undergone hydraulic fracturing treatment before production, which was after HPWI. (4) Upon completion of the high-pressure injection stage, Well X5 had cumulatively injected 1.5 × 10⁴ m3 of water into the formation. During this stage, the three production wells achieved a combined incremental oil production of 3722 t. (5) In terms of cumulative incremental oil output, the ranking from highest to lowest was X51 > X53 > X52. Prior to reaching full water-out, the hydraulically fractured X51 demonstrated superior production gains compared with the other two wells.
For injection well X41, the responding producers include wells X47, X51, X46, and X54. One year after x41 started HPWI, Well X5 also began HPWI. The high-pressure injection production pattern for this well group was as follows: (1) When the X41 well began injection, wells X47 and X51 were producing, while wells X46 and X54 were shut in. After a period of high-pressure injection, the latter two wells were brought online sequentially. (2) During the high-pressure injection period, the water cut of Well X51 rose sharply after one month of production. Well X46, once reopened, remained at a 100% water cut throughout. In contrast, wells X47 and X54 exhibited certain reductions in water cut and achieved noticeable increases in oil production. (3) By the end of the injection stage, the X41 well had cumulatively injected 4.8 × 10⁴ m3 of water into the formation, resulting in an incremental oil production of 2588 t. (4) The cumulative oil production increments of the four oil wells from high to low are x54 > x47 > 51 > x46, indicating that the oil wells in the non-water channeling direction have better oil production increment effects. Overall, the oil production increment effect is not as good as that of the x5 well group.
Based on the performance of the two HPWI well groups in this block and the block’s production characteristics, a mathematical model was established using the CMG 2022 numerical simulation software, and a numerical simulation study on the mechanism of HPWI and its effectiveness was carried out.
2.2.2. Parameter Settings of the Numerical Simulation Model
Because HPWI could cause severe damage to the formation, the conventional water-flooding numerical simulation approach was not applicable for this study. Based on the currently adopted numerical simulation techniques for high-pressure injection, a “compaction–expansion” dynamic porosity and permeability model was configured to reflect the reservoir’s stress sensitivity and to analyze the production response under a high-pressure injection. Through the “compaction–expansion” numerical settings, the simulation reproduced the evolution of formation porosity around the injection well: from the initial stage of elastic expansion to the subsequent plastic failure and generation of micro-fractures, and finally to the depressurization stage after the high-pressure injection ceased, during which the micro-fractures progressively closed.
To focus on the micro-fracture seepage mechanism, in this simulation, the injection pressure is controlled within a range that is lower than the overall fracture pressure of the formation (specifically, the bottom-hole flowing pressure is set to ≤70 MPa) to avoid triggering the formation of macroscopic main fractures in the simulation. The determination of this pressure threshold refers to the field fracturing test data of the research block and the previous core fracture experiments to ensure that the simulation conditions match the actual ‘micro-fracture stage’ of the high-pressure water injection. Under this pressure constraint, the model characterizes the opening and closing behavior of micro-fractures through the ‘compaction–expansion’ mechanism, thus better fitting the action mechanism of the high-pressure water injection, which is mainly dominated by permeability enhancement, rather than fracture creation.
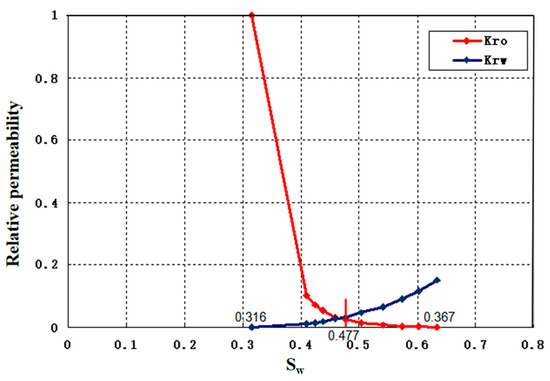
The numerical simulation software CMG was used for modeling and simulation research. The model size is 1000 m × 1000 m × 10 m, with a step size of a rectangular coordinate grid of 20 × 20 × 10. The operation model is the black oil model. The basic information of the simulated reservoir is shown in Table 1, below. The relative permeability variation laws of the oil–water two phases are shown in Figure 4.
Table 1.
Basic information for model settings.
Figure 4.
Relative permeability curve.
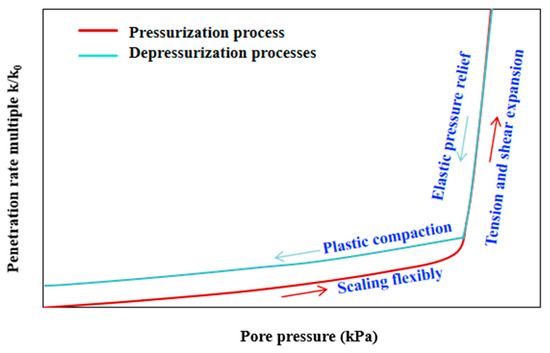
Based on the stress sensitivity characteristics of the matrix permeability in low-permeability reservoirs and the comprehensive average permeability under the continuous damage model, it is known that as the effective stress on the rock skeleton keeps changing, the rock pores undergo a relatively stable elastic deformation and a more significant damage deformation. The curve of the comprehensive average permeability of reservoir rocks varying with pore pressure under the continuous damage model is shown in Figure 5. This paper does not consider other types of in situ stress and it regards the pore pressure as being effective stress. It only compares the variation in pore pressure with the rock fracture pressure [17]. According to Section 2.2.1, when HPWI occurs, rock particles undergo shear dilation and tensile dilation under the action of pore pressure. In general, the tensile dilatancy area could elastically recover, whereas shear deformation altered the intergranular spacing of the particle layers, making it difficult to fully restore to the original state upon closure, thereby causing a certain degree of irreversible reservoir permeability damage. In this study, the process was simplified as an initial elastic depressurization stage, followed by a plastic compaction stage.
Figure 5.
The curve of the variation law of the ratio of the comprehensive average permeability after damage to the initial permeability with pore pressure (in the “compaction–expansion” process).
In this study, the pore pressure, Pp, is equivalent to the effective stress, P, that drives rock deformation and damage (i.e., P = Pp). This simplification is mainly based on the fact that the model focuses on evaluating the overall wellbore expansion and permeability enhancement effect, and there is a lack of complete in situ stress data (such as the magnitude and direction of the minimum horizontal principal stress σh,min). It should be noted that this simplification ignores the direct influence of tectonic stress in Biot’s effective stress principle (σ’ = σ − αPp), and it may not accurately reflect the initial poroelastic response and the directional control of fractures/expansion. However, it still has rationality and practicality in characterizing the volume effect and permeability evolution driven by the average pressure.
3. Simulated Content
3.1. Simulation of the Effect of HPWI Under the Threshold Pressure Gradient
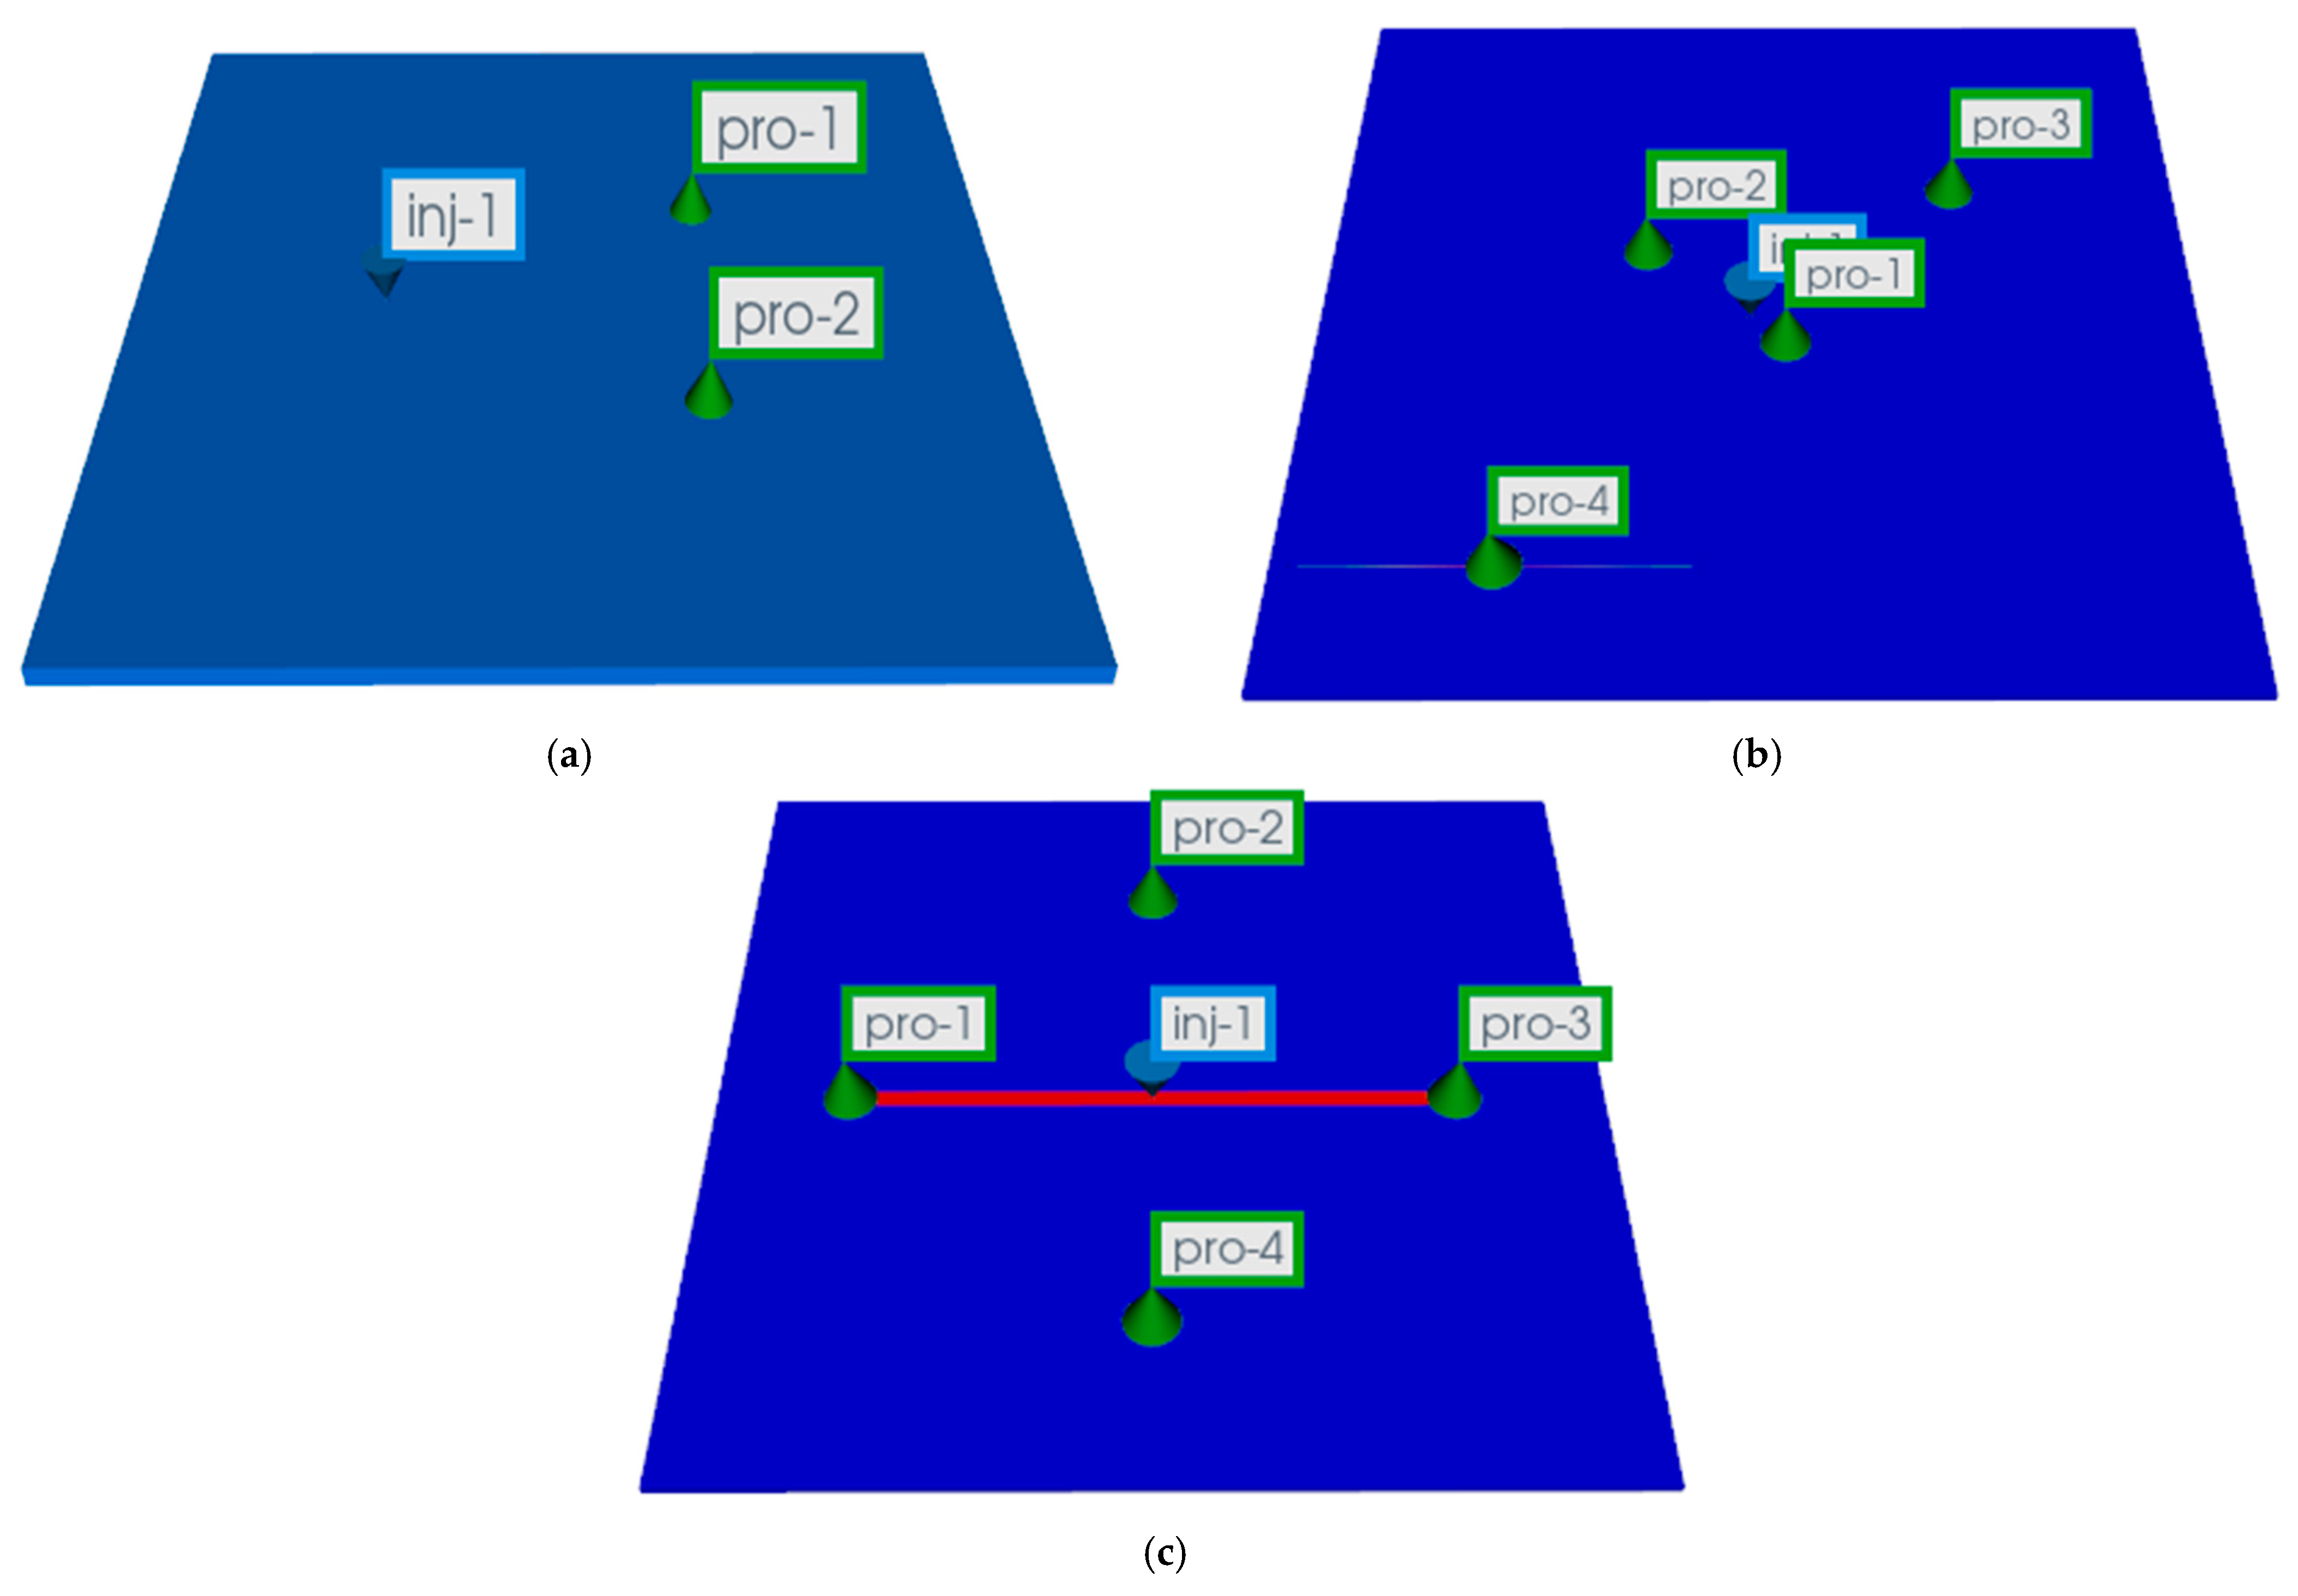
Under the condition of non-Darcy flow in low-permeability reservoirs, due to the influence of the threshold pressure gradient, there is a phenomenon of “injection difficulties and production challenges”. Based on the target block, the process of this phenomenon is described and the mechanism of overcoming the threshold pressure gradient by HPWI were simulated. A geological model representing a medium-porosity, low-permeability reservoir with properties that are similar to those of the target injection well was constructed. The threshold pressure gradient was calculated by using an empirical formula from the Shengli Oilfield. A well pattern model of one injector and two producers was set up (Figure 6a), corresponding to the situation where Well X48 could not inject water during the early conventional waterflood and the corresponding oil wells X54 and X46 did not respond. Starting from an initial reservoir pressure of 40 MPa, the injector was set to operate at a constant bottom-hole pressure of 50 MPa for water injection, while the producers operated at a constant bottom-hole pressure of 22 MPa. Water injection was initiated after one year of constant pressure production.
For the case of conventional waterflood in low-permeability reservoirs, four production simulation scenarios were set up for comparative analysis: (1) considering the threshold pressure gradient and water injection development, (2) considering the threshold pressure gradient and natural production, (3) not considering the threshold pressure gradient and water injection development, and (4) not considering the threshold pressure gradient and natural production.
The effect of HPWI is studied on the basis of the existence of the threshold pressure gradient. Since this paper does not simulate the seepage mechanism of low flow resistance inside macroscopic fractures, the effective well spacing between the injection and production wells has not been shortened. Therefore, HPWI mainly overcomes the threshold pressure gradient from two aspects: increasing the pressure difference and permeability. The specific permeability enhancement process can be referred to with the compaction and expansion table set in the previous mechanism section. The bottom-hole pressure was set at 64 MPa for production.
3.2. Simulation of Volume Expansion and Permeability Enhancement Under HPWI
After HPWI, there are obvious differences among the pressure propagation speed, the fluid front speed, and the fracture network front speed. Therefore, according to the effectiveness of the reservoir, the area around the well can be divided into the rock EPZ, the swept zone without permeability enhancement, and the unswept effective zone. Under the condition of a fixed injection rate of 200 m3/d for nine months, simulations were carried for high-pressure water injection, considering permeability enhancement around the wellbore and high-pressure water injection with constant wellbore physical properties. A regular five-spot well pattern was used for production, with production wells operating at the current reservoir pressure of 22 MPa under constant bottom-hole pressure conditions. The simulation reproduced the initial state prior to the high-pressure injection, in which production wells were unable to produce due to an insufficient liquid supply. The incremental production characteristics under the two injection scenarios were compared. The capacity expansion and permeability enhancement effects of HPWI are affected by various factors. Differences in the effects of HPWI can be caused by factors such as the displacement, total volume, and injection pressure in the construction design; the stress field and heterogeneity of the reservoir; the rock failure conditions; and the properties of the fluid.
3.3. Simulation of Production Effects Under HPWI
There are two HPWI strategies in the target block: “HPWI–well soaking–oil production” and “simultaneous HPWI and oil production”. Simulations are carried out for the two working conditions, respectively. The well event settings refer to the actual well opening and closing situations, fitting the historical production trend on site, and analyzing the reasons for different production effects.
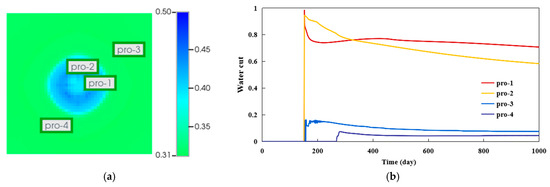
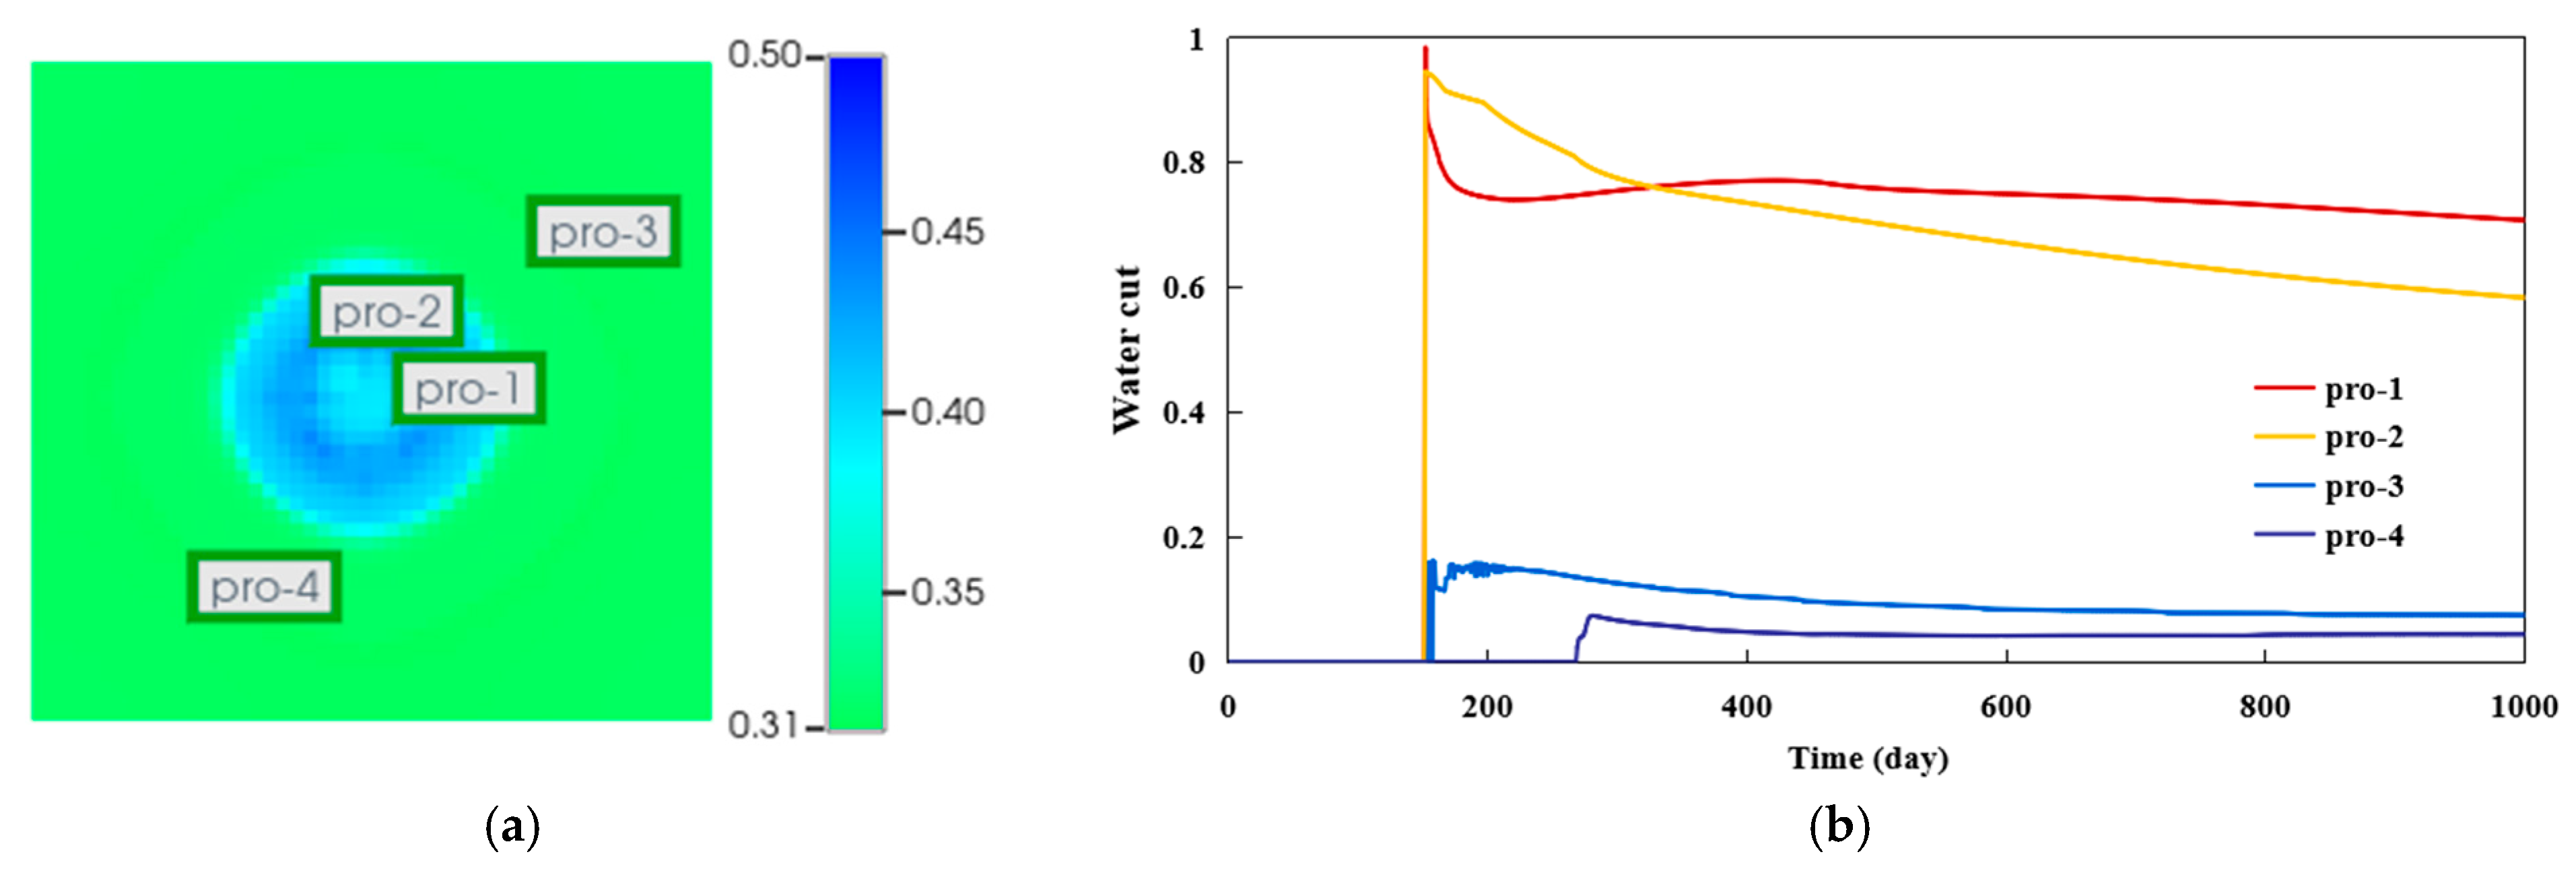
For the HPWI and production scheme of “HPWI in water wells–simultaneous well soaking–subsequent oil production in oil wells”, the actual injection volume of Well X5 is used for parameter setting. Based on the actual field production conditions, this study mainly focuses on the different production response characteristics of oil wells in the X5 well group during HPWI and the stimulation effects induced by hydraulic fracturing. An irregular five-spot well pattern is arranged, as shown in Figure 6b, so that production wells in different high-pressure injection regions can be put into operation. The corresponding areas include the following: the EPZ (pro-1), the swept zone (pro-2), the near-response zone (pro-3), and the far-response zone (pro-4). The production performances of wells located in the rock EPZ, the swept zone without permeability enhancement, and the unswept but affected zone were analyzed. In addition, well pro-4 in the far-affected zone was fractured prior to production, and its performances with and without fracturing were compared.
For the HPWI and production “simultaneous HPWI and oil production” scheme, the field injection rate of Well X41 was consistently maintained at approximately 300 m3/d. Therefore, the injection rate was directly set to 300 m3/d in the study. The oil well was characterized by water channeling in the direction of the main flow line. Based on this, a simulation of production effectiveness was carried out. A five-spot well pattern with one injector and four producers was set up, as shown in Figure 6c. HPWI and production were carried out simultaneously, with a 200 mD high-permeability streak representing the main flow lines that originally existed in the reservoir or formed due to long-term production. The production effects of oil wells in the direction of the main flow line and those in the non-main flow line direction were observed.
Figure 6.
Model settings for different simulation scenarios. (a) Three-dimensional well pattern model for studying the threshold pressure gradient; (b) three-dimensional well pattern model (including fracturing) for studying “HPWI–well soaking–oil production”; (c) three-dimensional well pattern model for studying “simultaneous HPWI and oil production”.
4. Simulation Results
4.1. Analysis of the Simulation Results of the Threshold Pressure Gradient
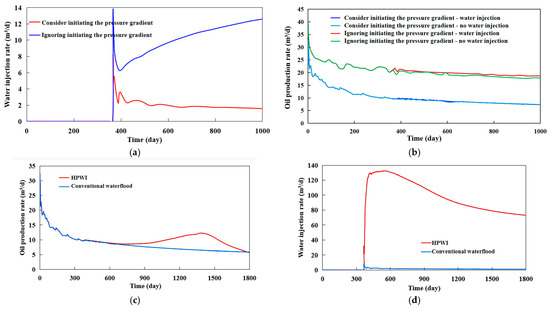
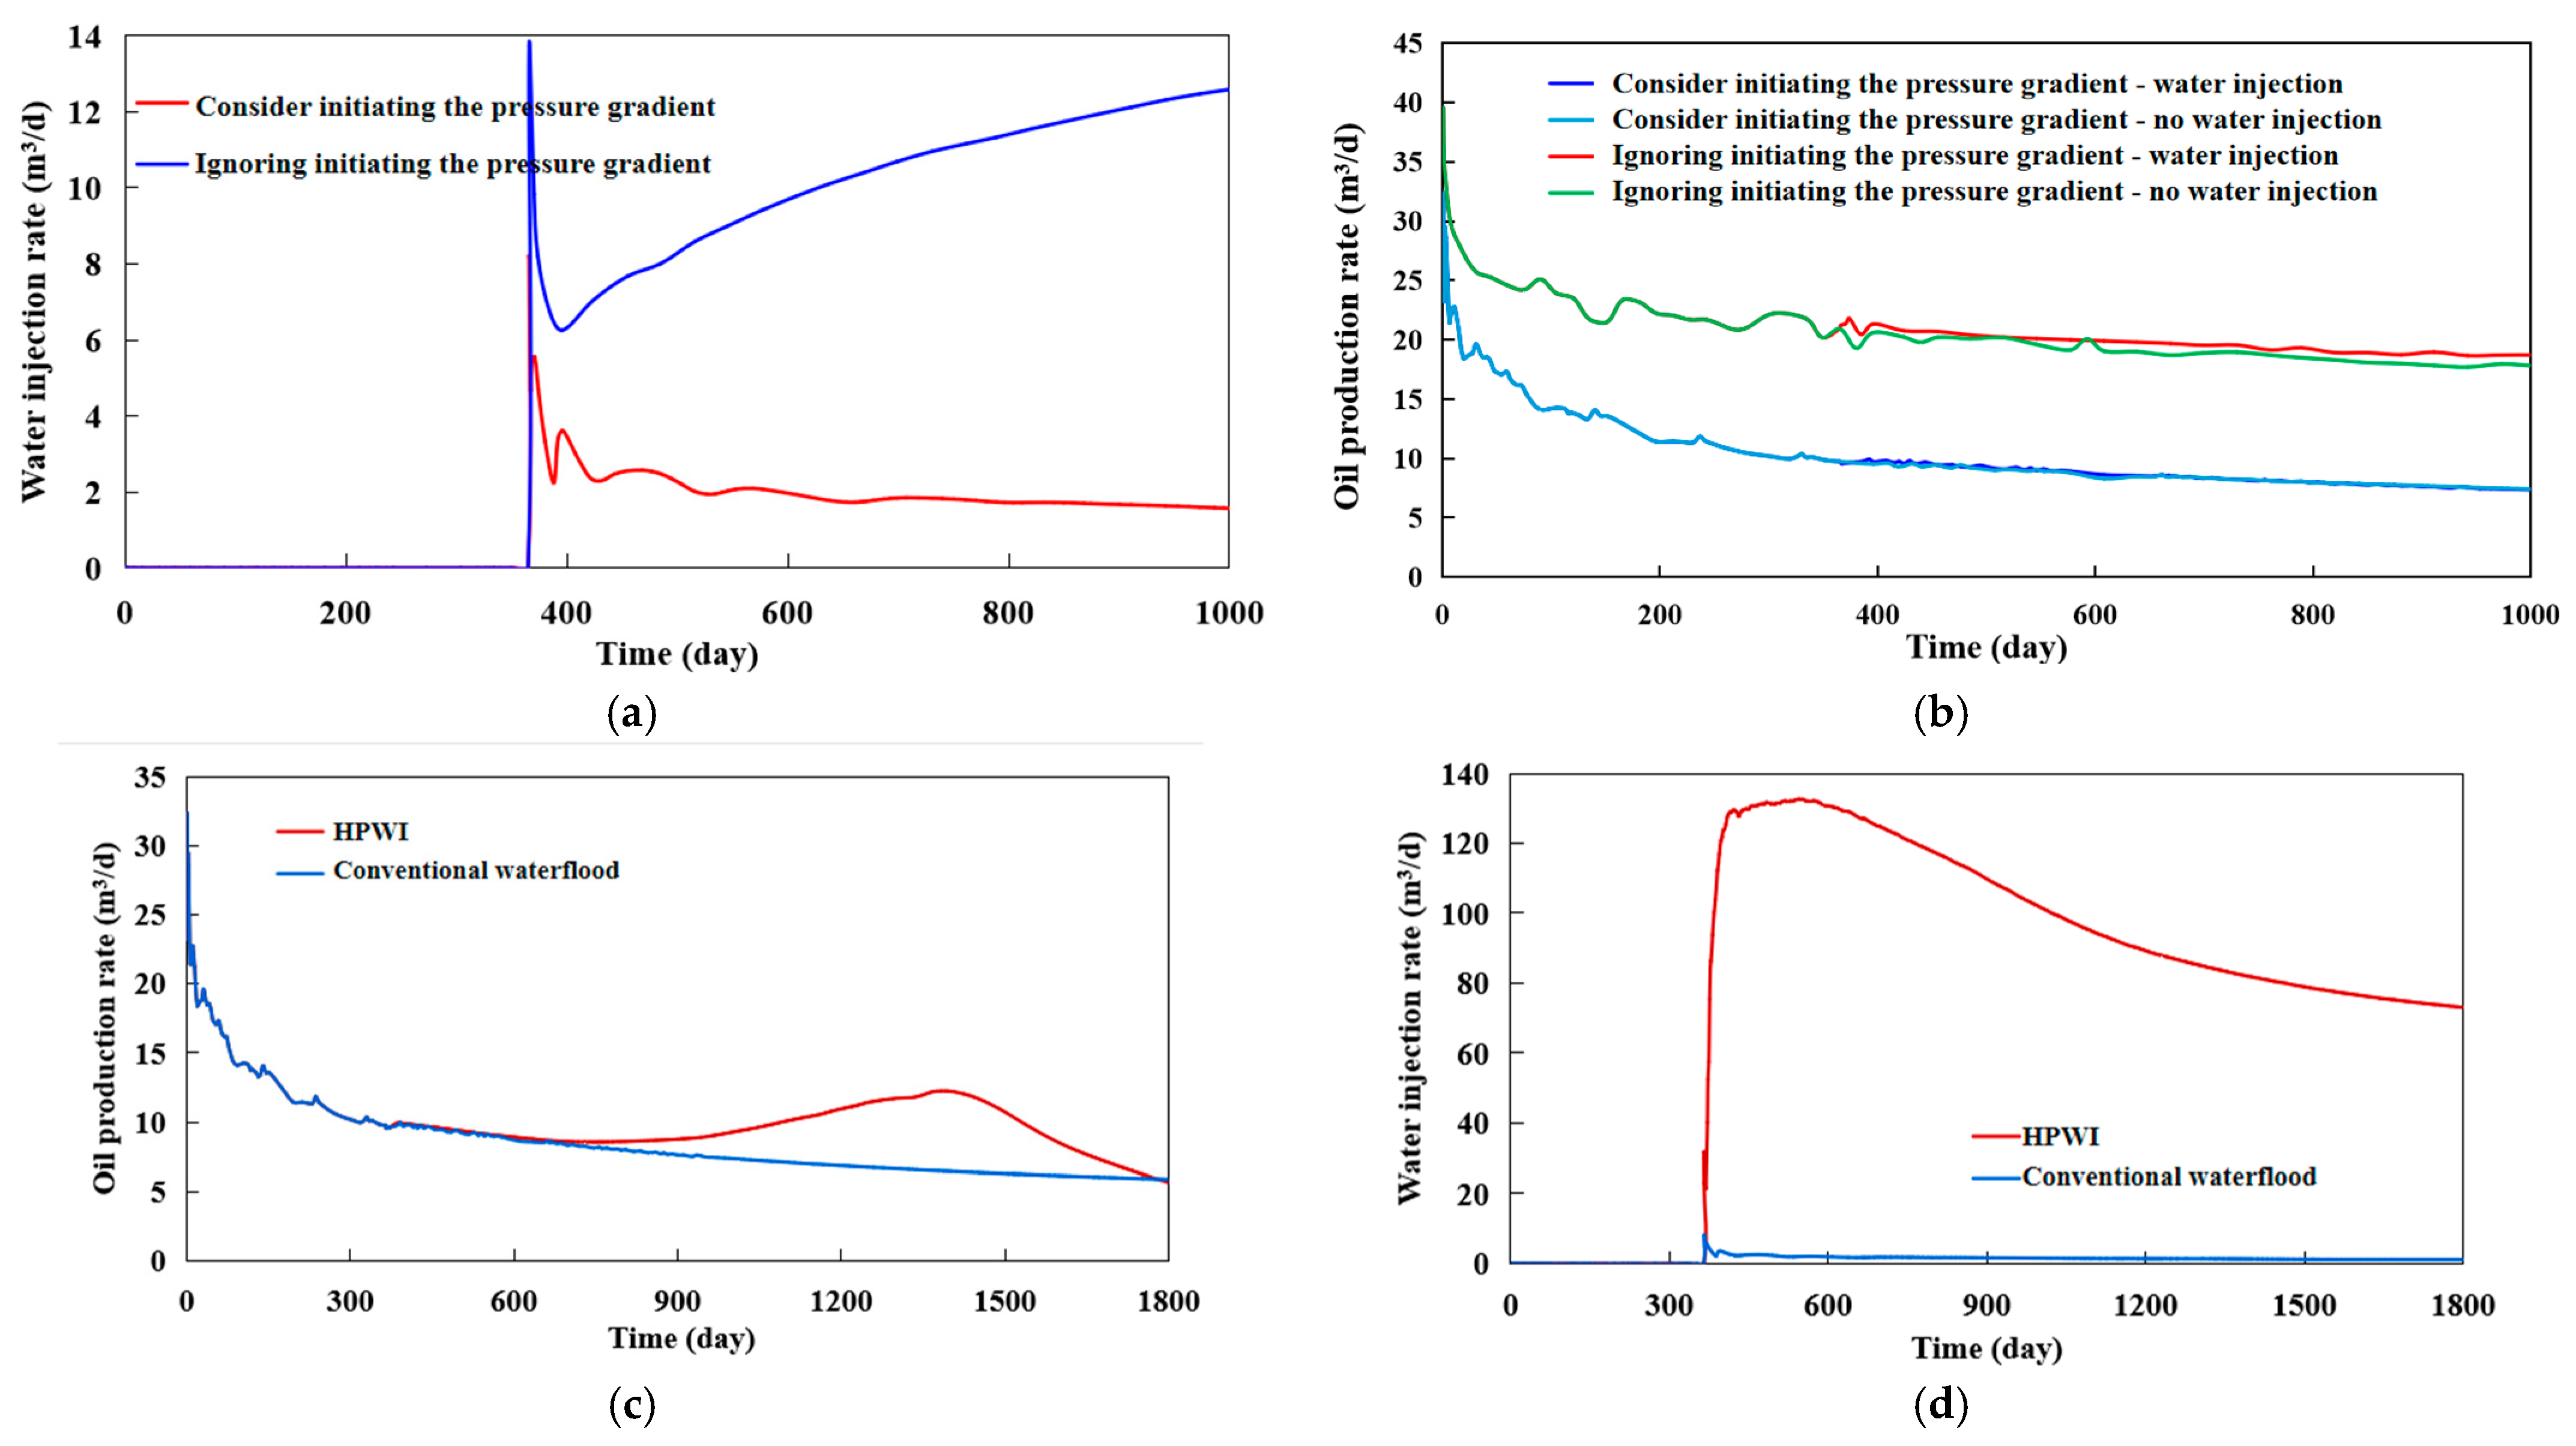
Comparing the effects of water injection and oil production with and without the threshold pressure gradient is shown in Figure 7a,b. When the threshold pressure gradient is not considered, the water injection effect is remarkable, and the corresponding oil wells can be significantly affected. When considering the threshold pressure gradient affected by the boundary effect it generates, the injection capacity of the water well continuously decreases to 1–2 m3/d, and the corresponding oil well basically shows no effect. The water injection and oil production effects of HPWI and the conventional waterflood are compared, as shown in Figure 7c,d. When HPWI was carried out, the injection pressure increased by 14 MPa, and the daily injection volume rose to 100 m3/d. Moreover, the liquid production and oil output of the corresponding oil wells were effectively enhanced, indicating that HPWI has a good effect in overcoming the threshold pressure gradient. By conducting stratified HPWI, the low-permeability and high-start-up-pressure small layers were reformed, and the utilization of poor-quality reservoirs was improved.
Figure 7.
Simulation results of threshold pressure gradient. (a) Comparison of water injection effects with and without threshold pressure gradient; (b) comparison of oil production effects with and without threshold pressure gradient; (c) comparison of water injection effects between HPWI and conventional waterflood; and (d) comparison of oil production effects between HPWI and conventional waterflood.
4.2. Analysis of Simulation Results for Pore Volume Expansion and Permeability
4.2.1. Comparison Between Conventional Waterflood and HPWI
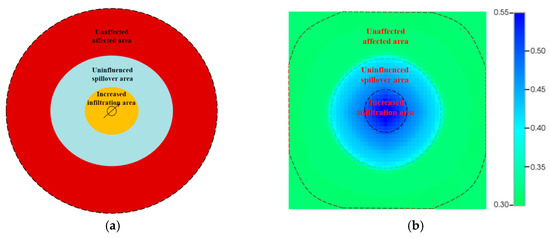
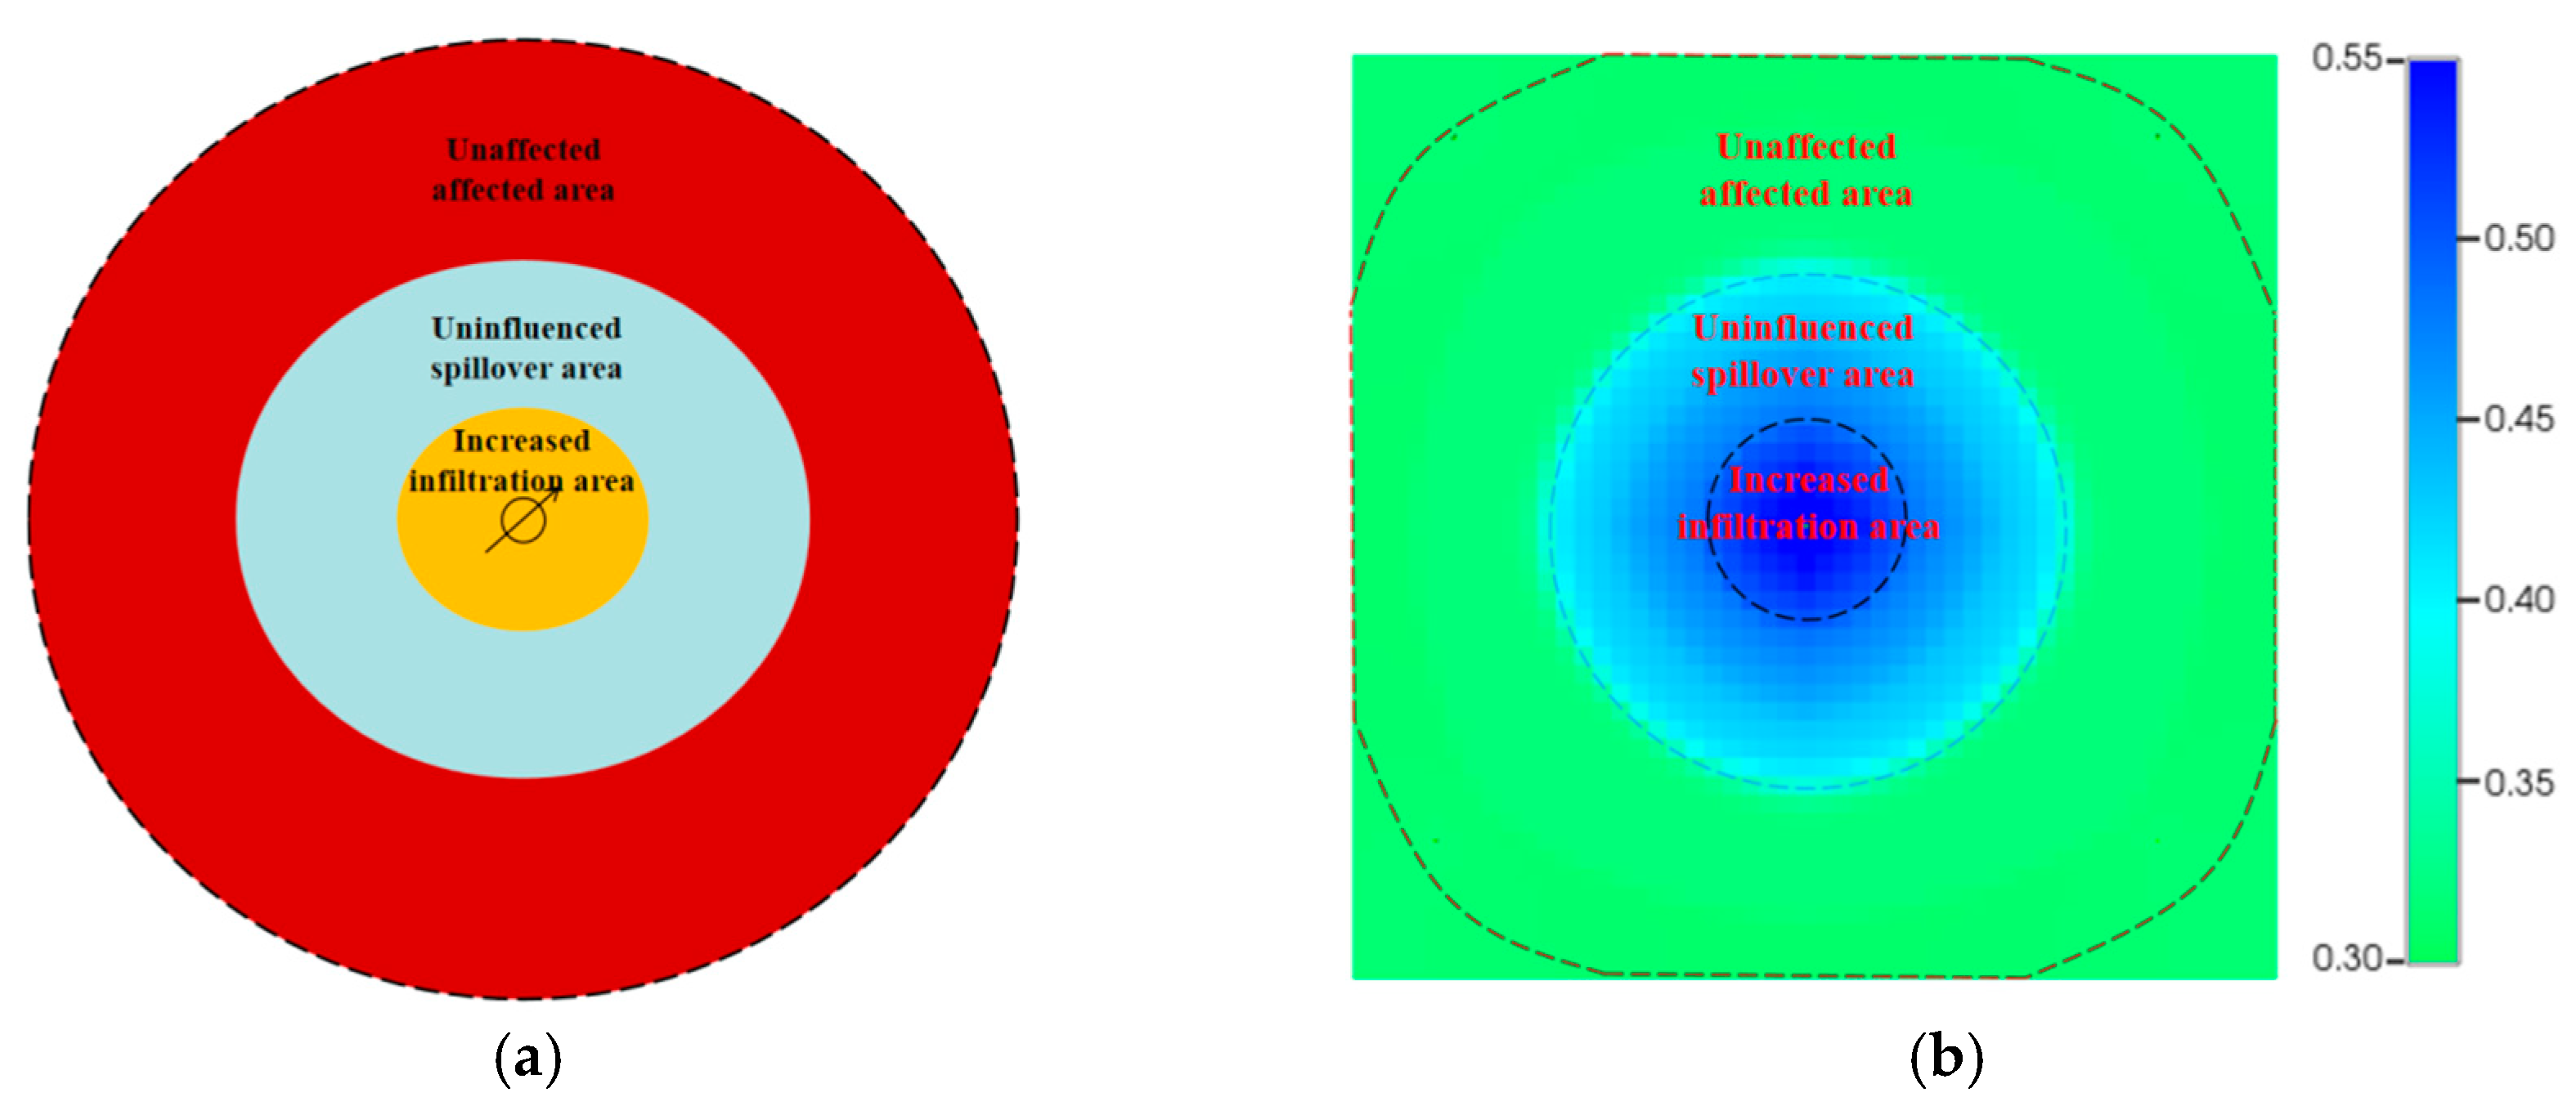
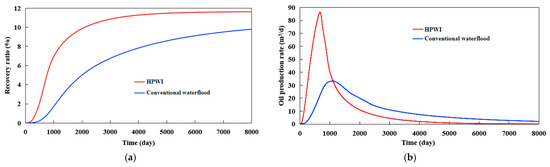
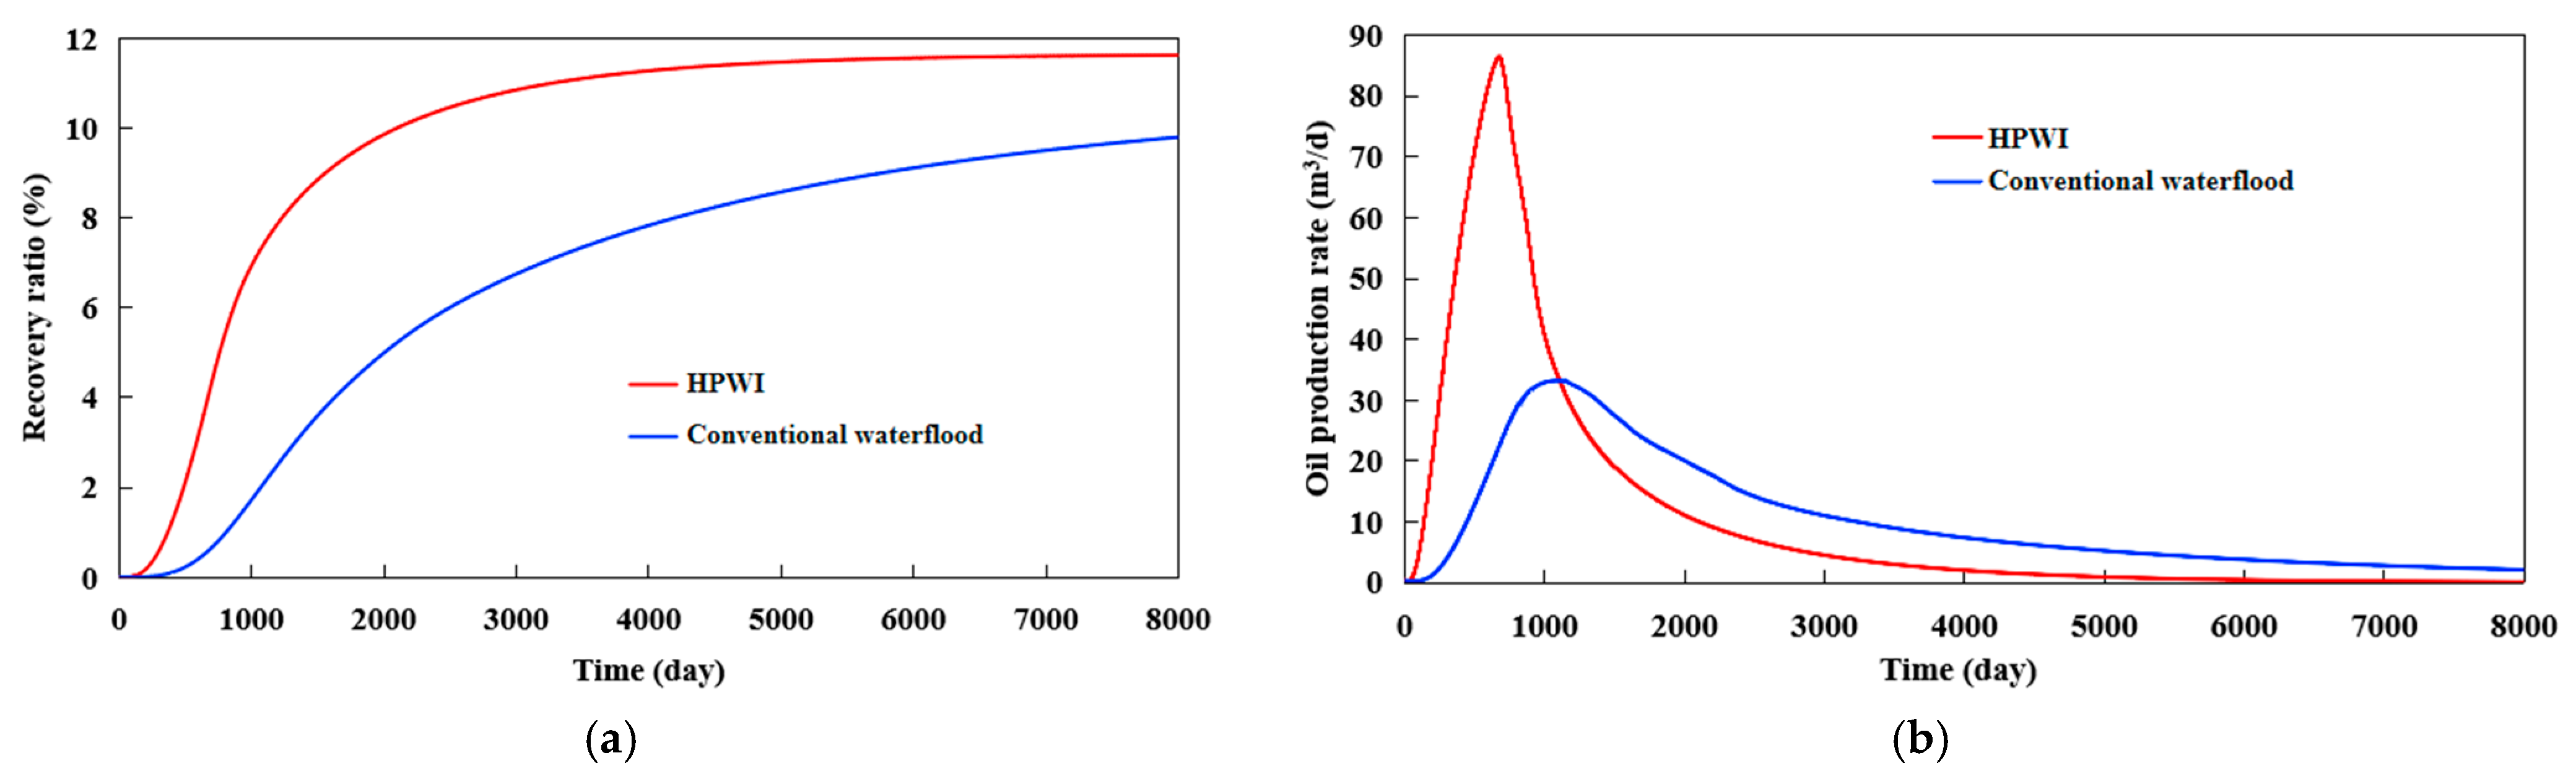
The characteristics of dynamic reservoir zoning formed during the HPWI process were revealed through numerical simulation studies, as shown in Figure 8. Research shows that under the condition of HPWI, three characteristic regions, namely the EPZ, the swept zone without permeability enhancement, and the non-affected zone, are successively developed in the near-wellbore area. With the continuous implementation of HPWI, the expansion and permeability enhancement zone around the wellbore gradually increases. Compared with the conventional waterflood, without considering the high-pressure permeability-enhancement effect of rocks, the water distribution during the high-pressure water injection shows a more uniform characteristic. Initially, the injected water is evenly distributed within the EPZ and then spreads outward. In contrast, the conventional waterflood spreads gradually from the inside to the outside. Overall, the high-pressure water injection displaces the crude oil in a more uniform manner, thereby increasing the swept volume of the injected water. As shown in Figure 9a, the ultimate recovery rate of HPWI is 11.63%, which is 1.83% higher than that of the conventional water injection with the same injection volume. Since it is difficult for the conventional water injection to achieve the same injection volume as HPWI under actual reservoir conditions (mainly limited by the lack of the enhanced diversion capacity effect in the permeability-increased zone), the actual production increase effect may be more significant. The analysis of production performance characteristics (Figure 9b) further shows that high-pressure injection wells exhibit the typical production pattern of “rapid response–rapid decline”. This phenomenon is closely related to the instantaneous diversion advantage formed in the permeability-increased zone and the subsequent pressure decline.
Figure 8.
Zoning of the effective range of HPWI. (a) Schematic diagram of the effective zoning of HPWI and (b) zoning of the simulation results of HPWI.
Figure 9.
Comparison of production effects between HPWI and conventional waterflood. (a) Comparison of recovery factor and (b) comparison of oil production.
4.2.2. The Influence of Injection Parameters on the Infiltration Zone
To deeply explore the influence laws of different injection parameters on the enhanced permeability area during the HPWI process, this study conducted systematic experimental research from three aspects: injection rate, total injection volume, and injection pressure.
- (1)
- Influence of injection rate on the evolution of the EPZ (with a fixed total volume): The injection rates were set at 200 m3/d, 300 m3/d, 500 m3/d, 1000 m3/d, and 2000 m3/d, with the total injection volume fixed at 30,000 m3. As shown in Figure 10a, as the injection rate increases, the scope of the EPZ also gradually expands. However, as the injection rate continues to rise, its expansion rate shows a decreasing trend, indicating that under the condition of a certain total injection volume, the expansion of the EPZ is restricted and tends to be stable, maintaining within a relatively fixed area range.
- (2)
- Influence of the total injection volume on the evolution of the EPZ (at a constant injection rate): Continuously inject at an injection rate of 200 m3/d and record the permeability-increased situations when the total volumes reach 20,000 m3, 30,000 m3, 50,000 m3, and 100,000 m3. Figure 10b shows that the EPZ expands with the increase in the total injection volume. Moreover, when the pressure propagates to the model boundary, the permeability-increasing rate accelerates significantly. It indicates that under the condition of a closed boundary, there is no significant upper limit for the EPZ, while a constant pressure boundary will restrict its expansion threshold.
- (3)
- The influence of injection pressure on the evolution of the EPZ (constant total injection volume condition): The bottom-hole pressure was set at 62 MPa, 63 MPa, 64 MPa, 65 MPa, 70 MPa, and 80 MPa, with a fixed total injection volume of 30,000 m3. As shown in Figure 10c, no obvious enhanced permeability zone was observed when the injection pressure was 62 MPa. When the injection pressure rose to 63 MPa, the EPZ began to form and continued to expand as the pressure increased further. Ultimately, the steady-state range of the enhanced permeability zone was still significantly influenced by the total injection volume and it remained stable at higher injection volumes.
Figure 10.
Simulation results of the influence of different injection conditions on the enhanced permeability area. (a) Injection rate; (b) total injection volume; and (c) injection pressure.
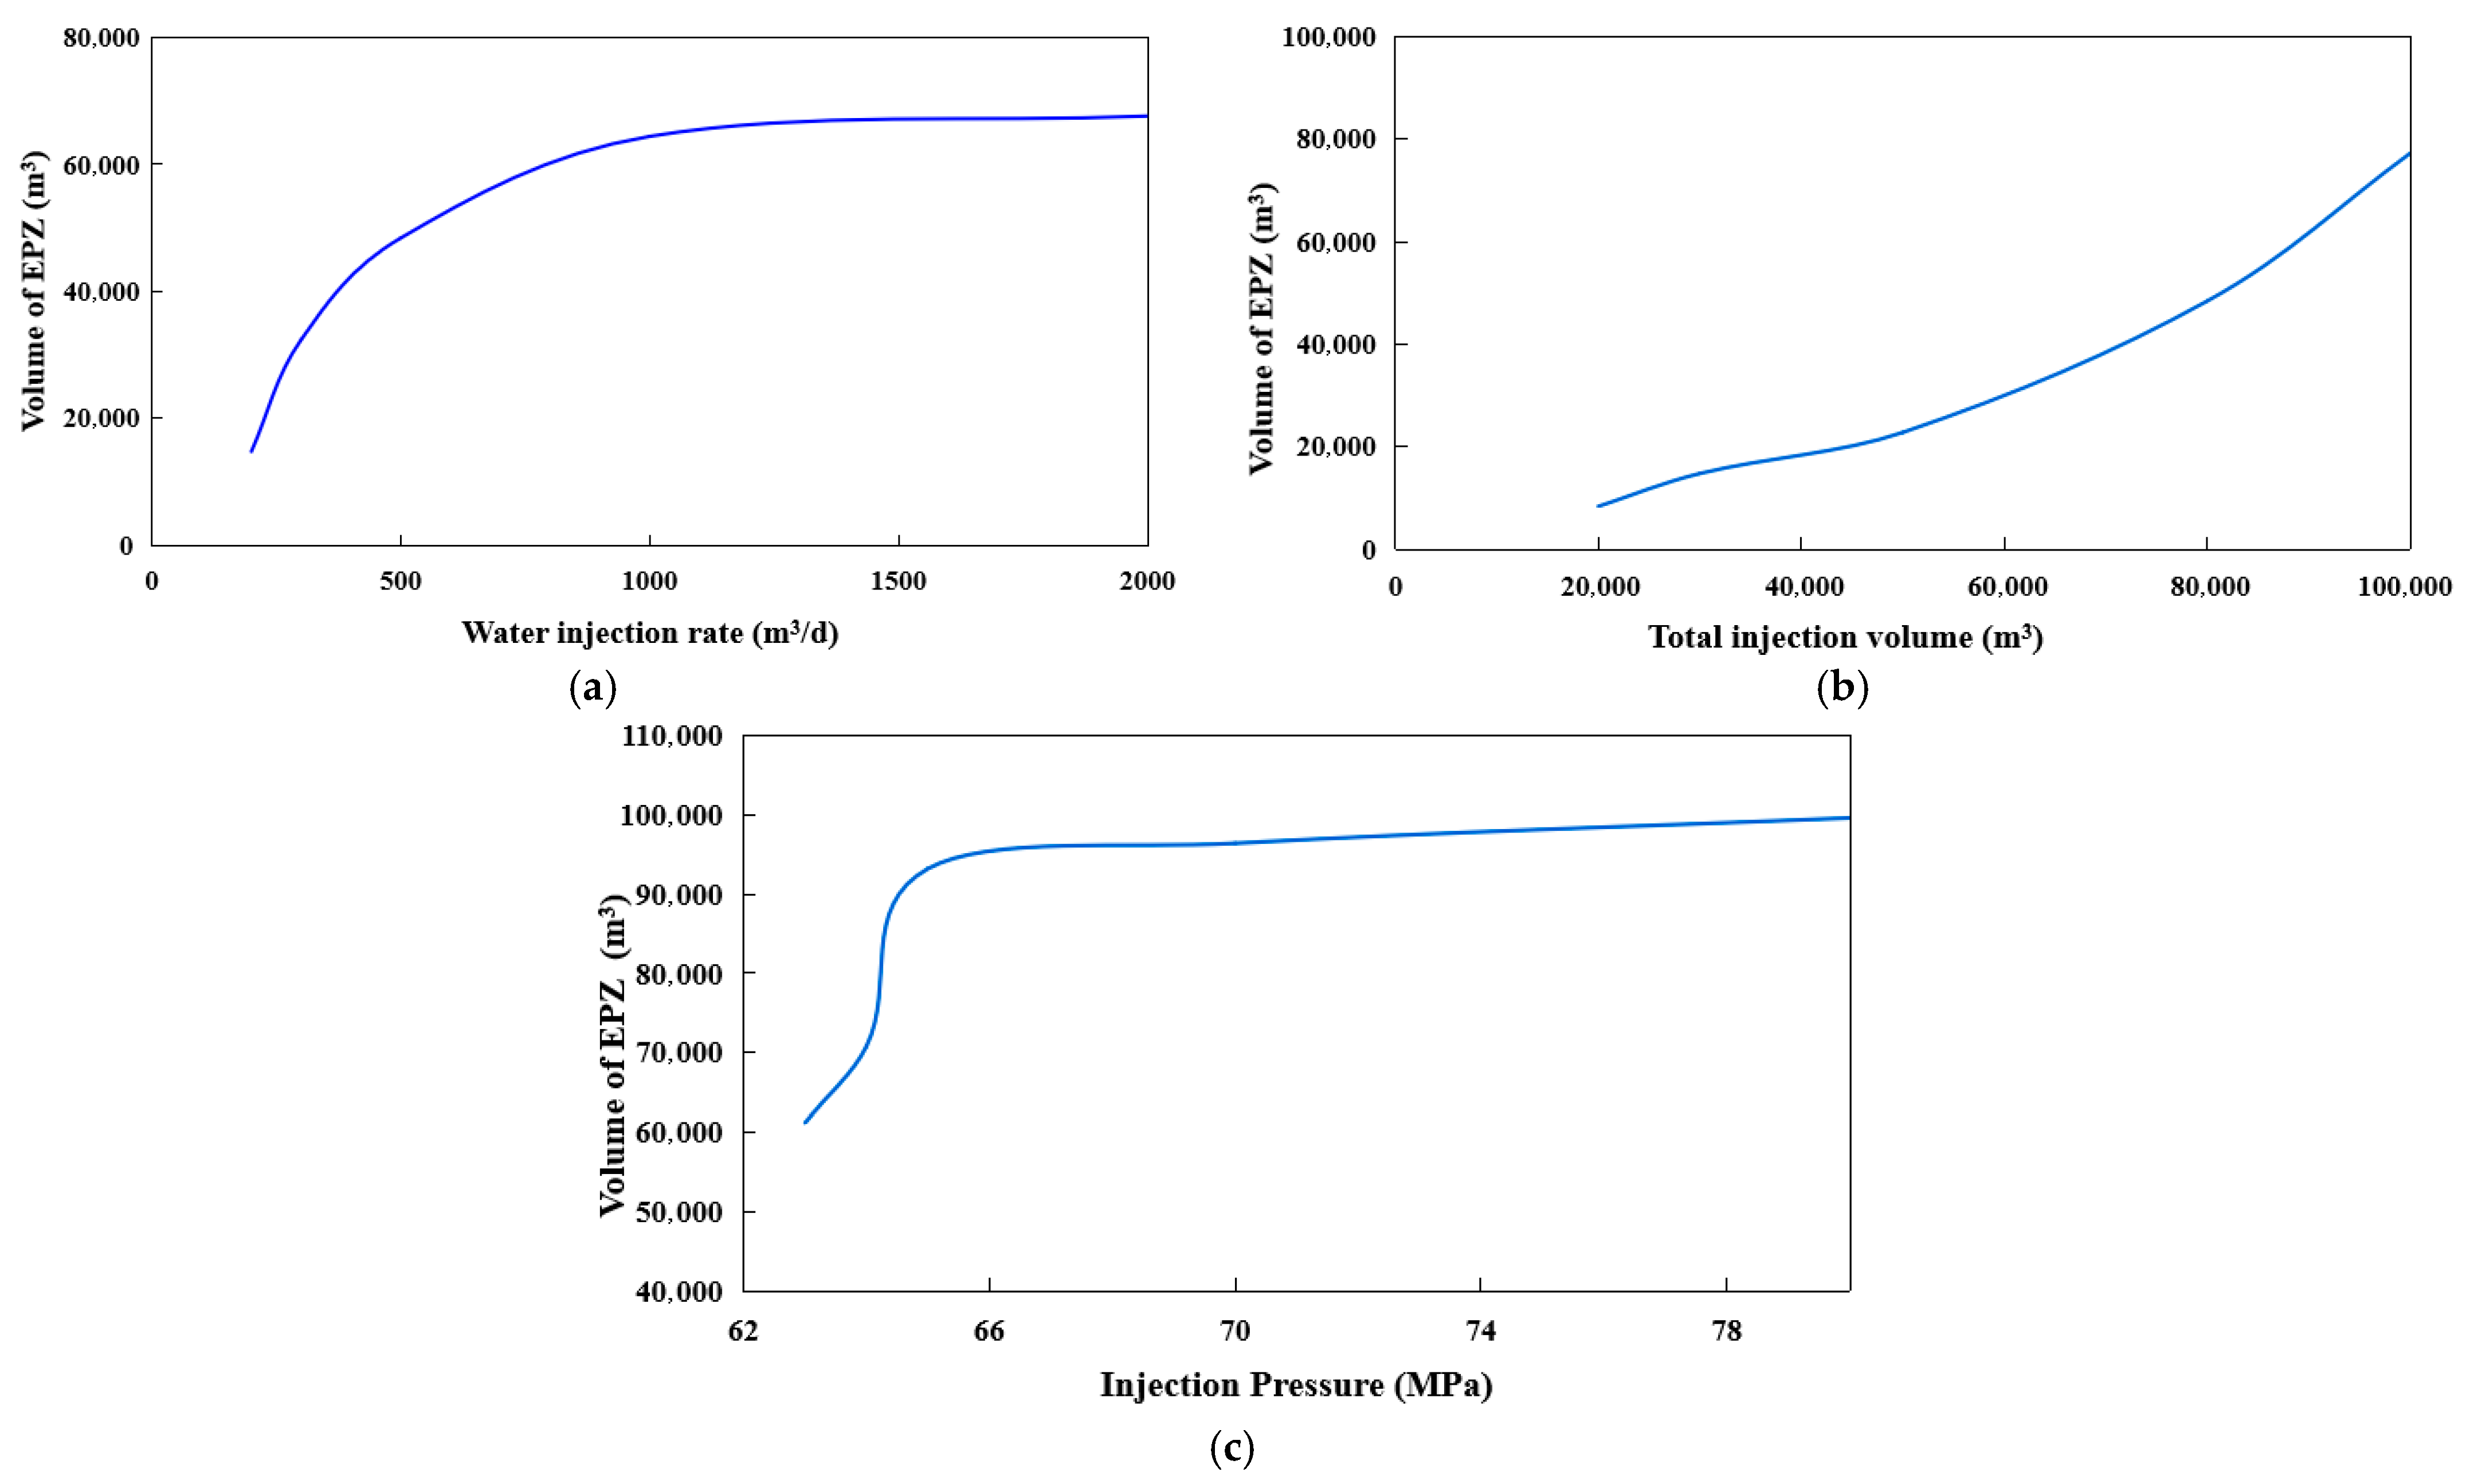
In summary, under a fixed total volume, increasing the injection rate can accelerate the process, but it is difficult to infinitely expand the volume of enhanced permeability. Under a fixed injection rate, increasing the total volume can continuously expand the enhanced permeability area and is significantly affected by the boundary conditions. There is a fracture initiation threshold for the injection pressure. After crossing this threshold, the enhanced permeability response is significant. However, the final steady-state scale is still jointly determined by the energy input (total volume) and boundary conditions. These laws can provide a quantitative basis for the optimization of the HPWI parameters and the evaluation of the boundary sensitivity.
4.2.3. The Influence of Heterogeneity on the EPZ
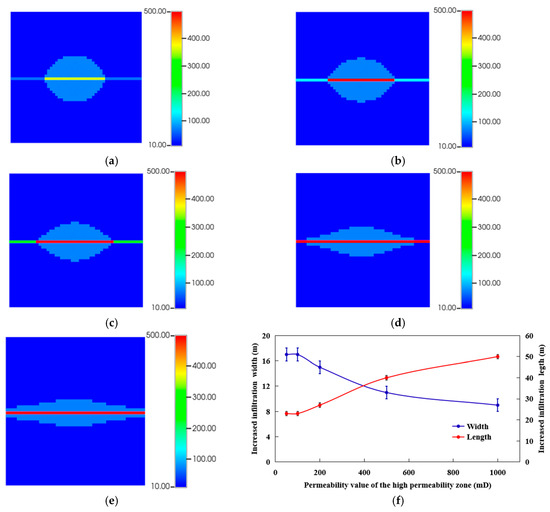
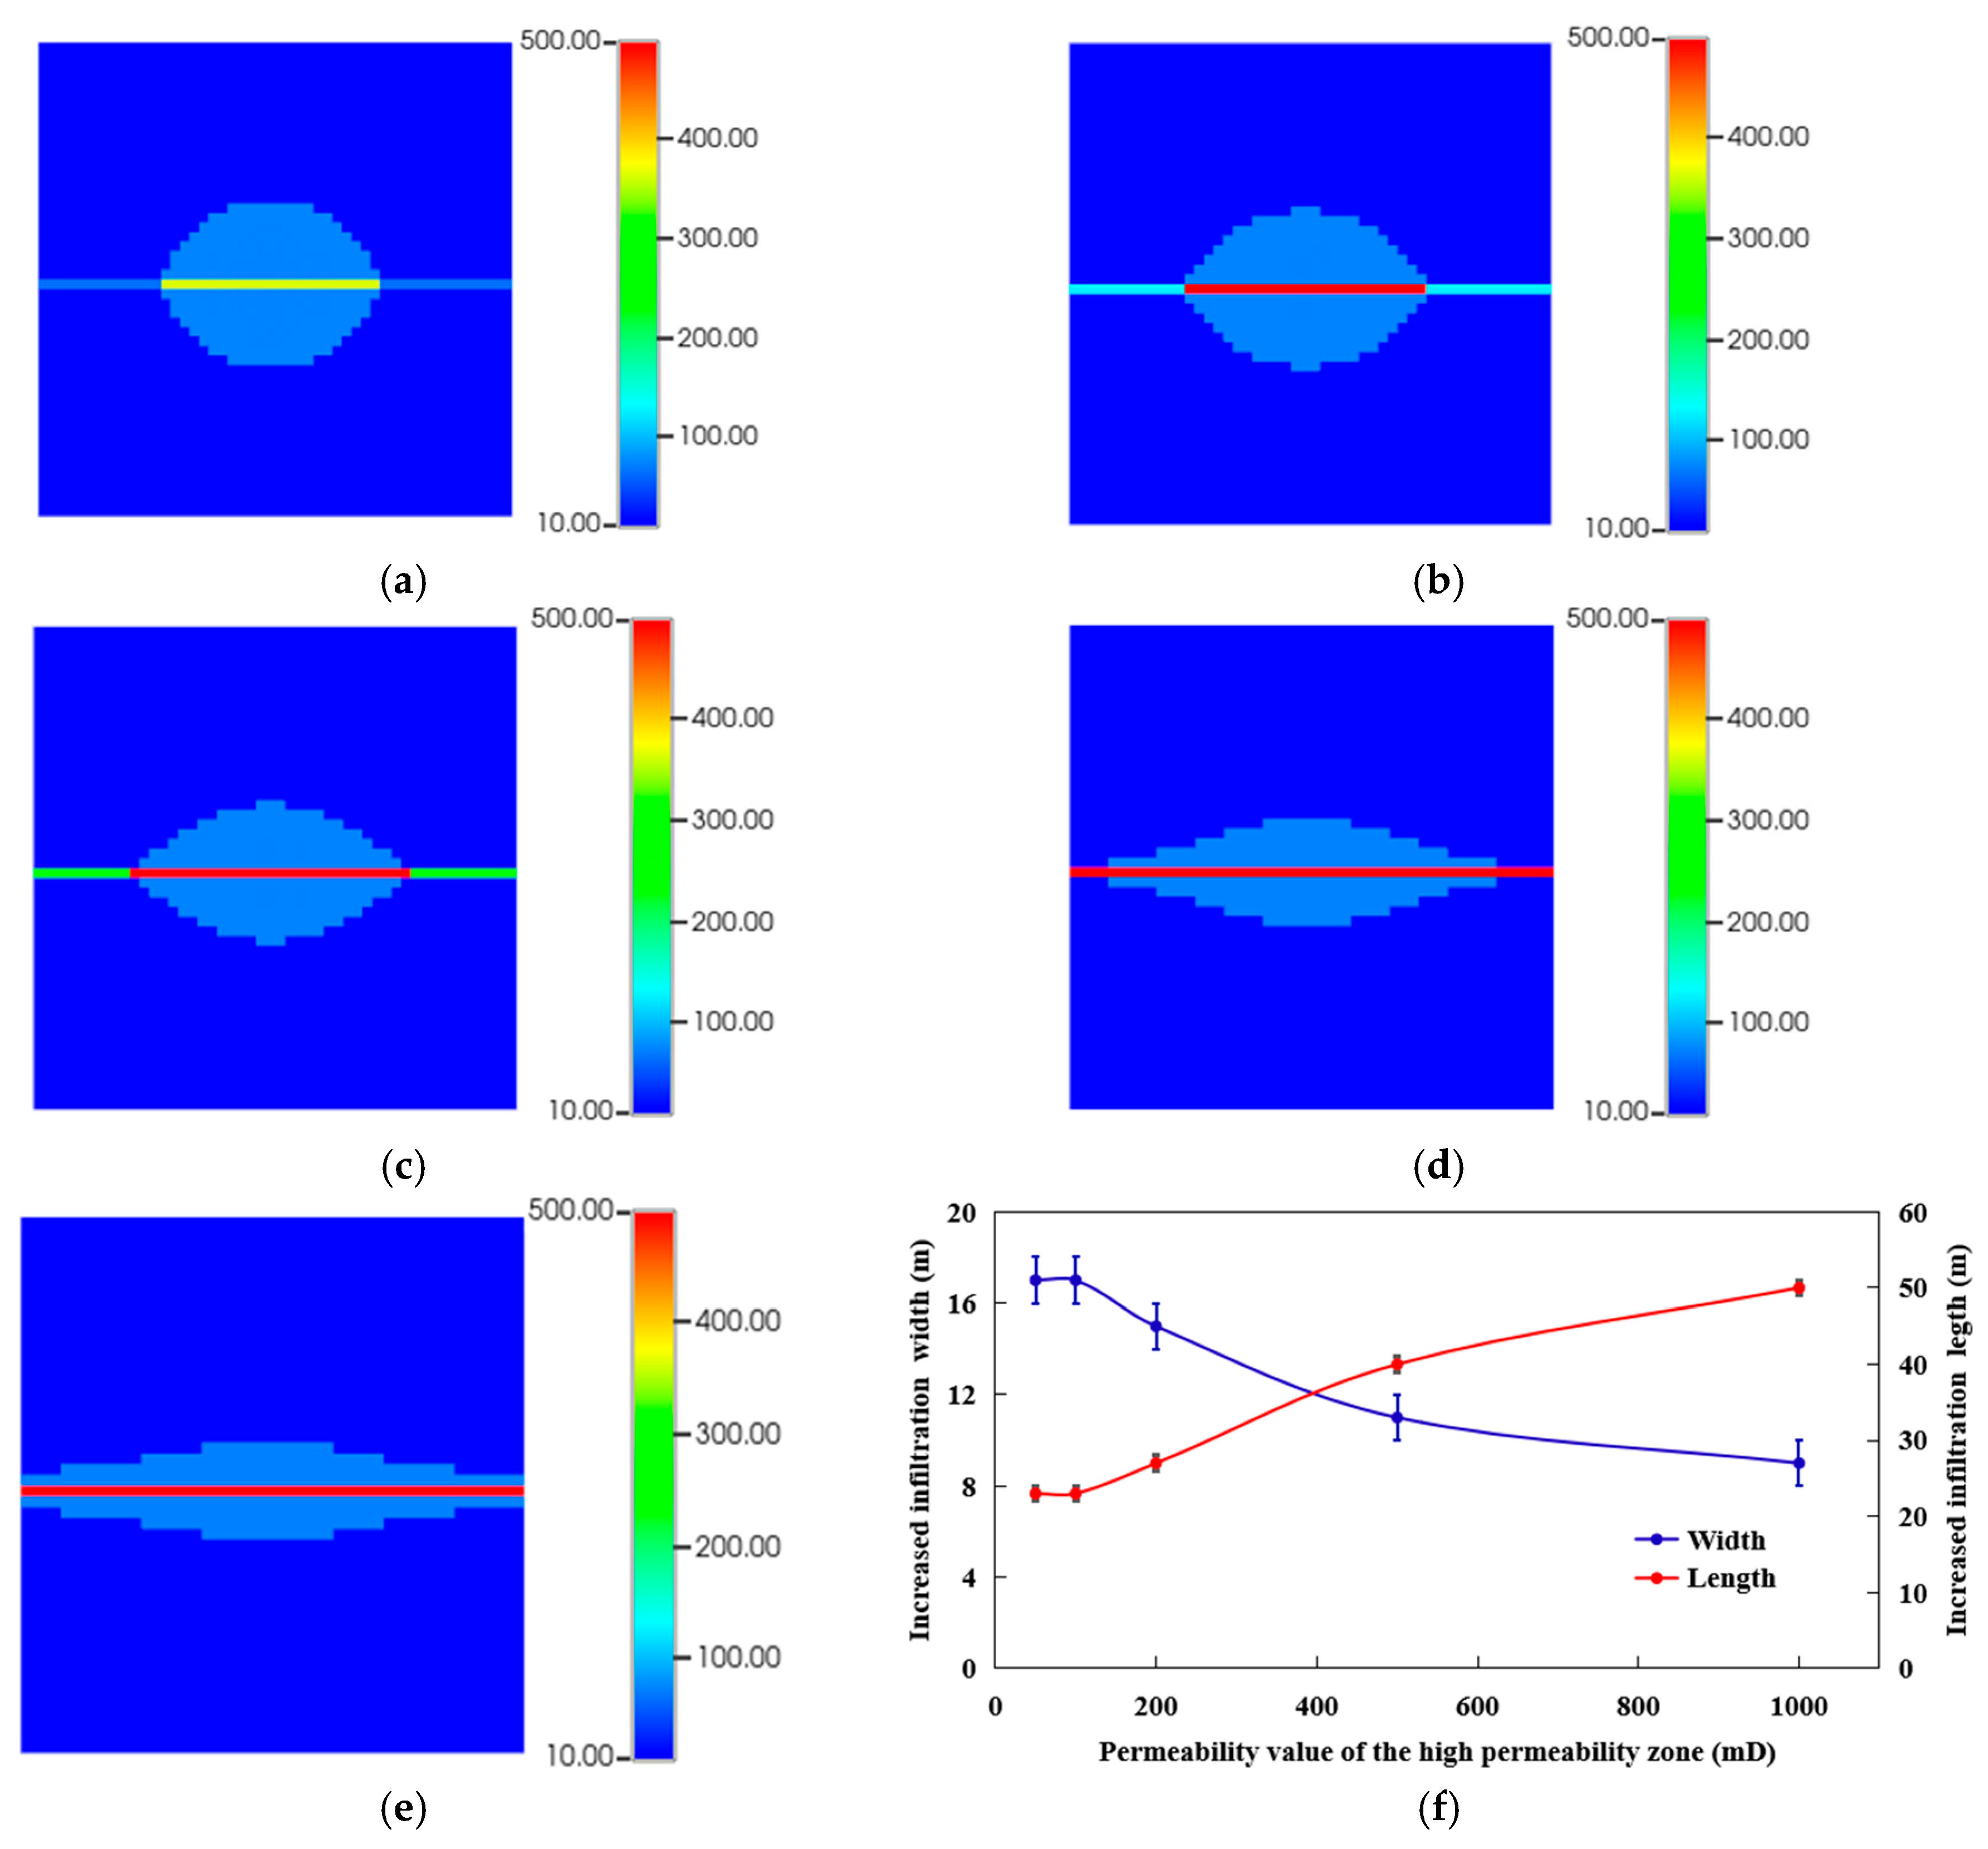
In order to study the influence of formation heterogeneity on the effect of HPWI, five high-permeability streaks with permeabilities of 50 mD, 100 mD, 200 mD, 500 mD, and 1000 mD were set up along the horizontal direction. The injection rate was 1000 m3/d and the cumulative injection volume was 30,000 m3. The simulation results of HPWI in high-permeability streaks with varying permeabilities are presented in Figure 11. With increasing heterogeneity of the high-permeability streak, the stimulated failure zone tends to migrate along the high-permeability direction, exhibiting an elongated length and a reduced width. Owing to the finite extent of the high-permeability region and the limitations of the injection conditions, the dimensional changes in both the length and width of the EPZ are subject to the upper bounds and cannot expand indefinitely. These findings indicate that in contrast to the hydraulic fracturing processes that are primarily governed by stress fields, HPWI operations are more susceptible to reservoir heterogeneity factors. The uniformity of the damaged area is expressed by the aspect ratio, which is the ratio of the horizontal width to the vertical length. As the permeability of the high-permeability zone increases, the uniformity decreases.
Figure 11.
Simulation results of HPWI in high-permeability streaks with different permeabilities. If there are multiple panels, they should be listed as follows: (a) 50 mD; (b) 100 mD; (c) permeability is 200 mD; (d) 500 mD; (e) 1000 mD; and (f) the morphological change in the EPZ with the permeability of the high-permeability streak.
4.3. Analysis of the Simulation Results of Production Effectiveness
4.3.1. Simulation of Production Effects Under “HPWI–Well Soaking–Oil Production”
After HPWI, the production well pattern was adjusted to ensure an even distribution of wells across three zones: the EPZ, the swept zone without permeability enhancement, and the unswept zone, as shown in Figure 12a. The production performance of the production wells is shown in Figure 12b. It can be observed that when the pro-1 well in the EPZ was opened, the water cut was almost 100%. During production, due to the improved seepage conditions within the enhanced permeability zone and possibly the short soaking time, which led to uneven pressure diffusion, the well pro-1 had a large liquid production rate under constant pressure, with a rapid decline in production and a rapid decrease in water cut to a stable value. The pro-2 well in the swept zone had a high water cut when it was opened, and as the well location moved outward, the water cut decreased. After a period of production, it stabilized at a water cut lower than the stable water cut value in the EPZ. The two production wells in the affected zone maintained low water cut production, but the specific oil increment effect still needs to be comprehensively analyzed in combination with the pressure response.
Figure 12.
Well pattern layout and production performance of production wells. (a) Well pattern layout of production wells and (b) changes in water cut of production wells in different areas.
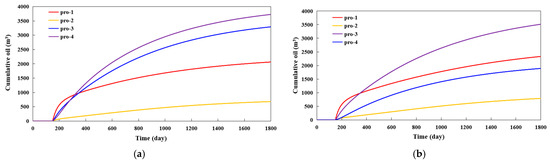
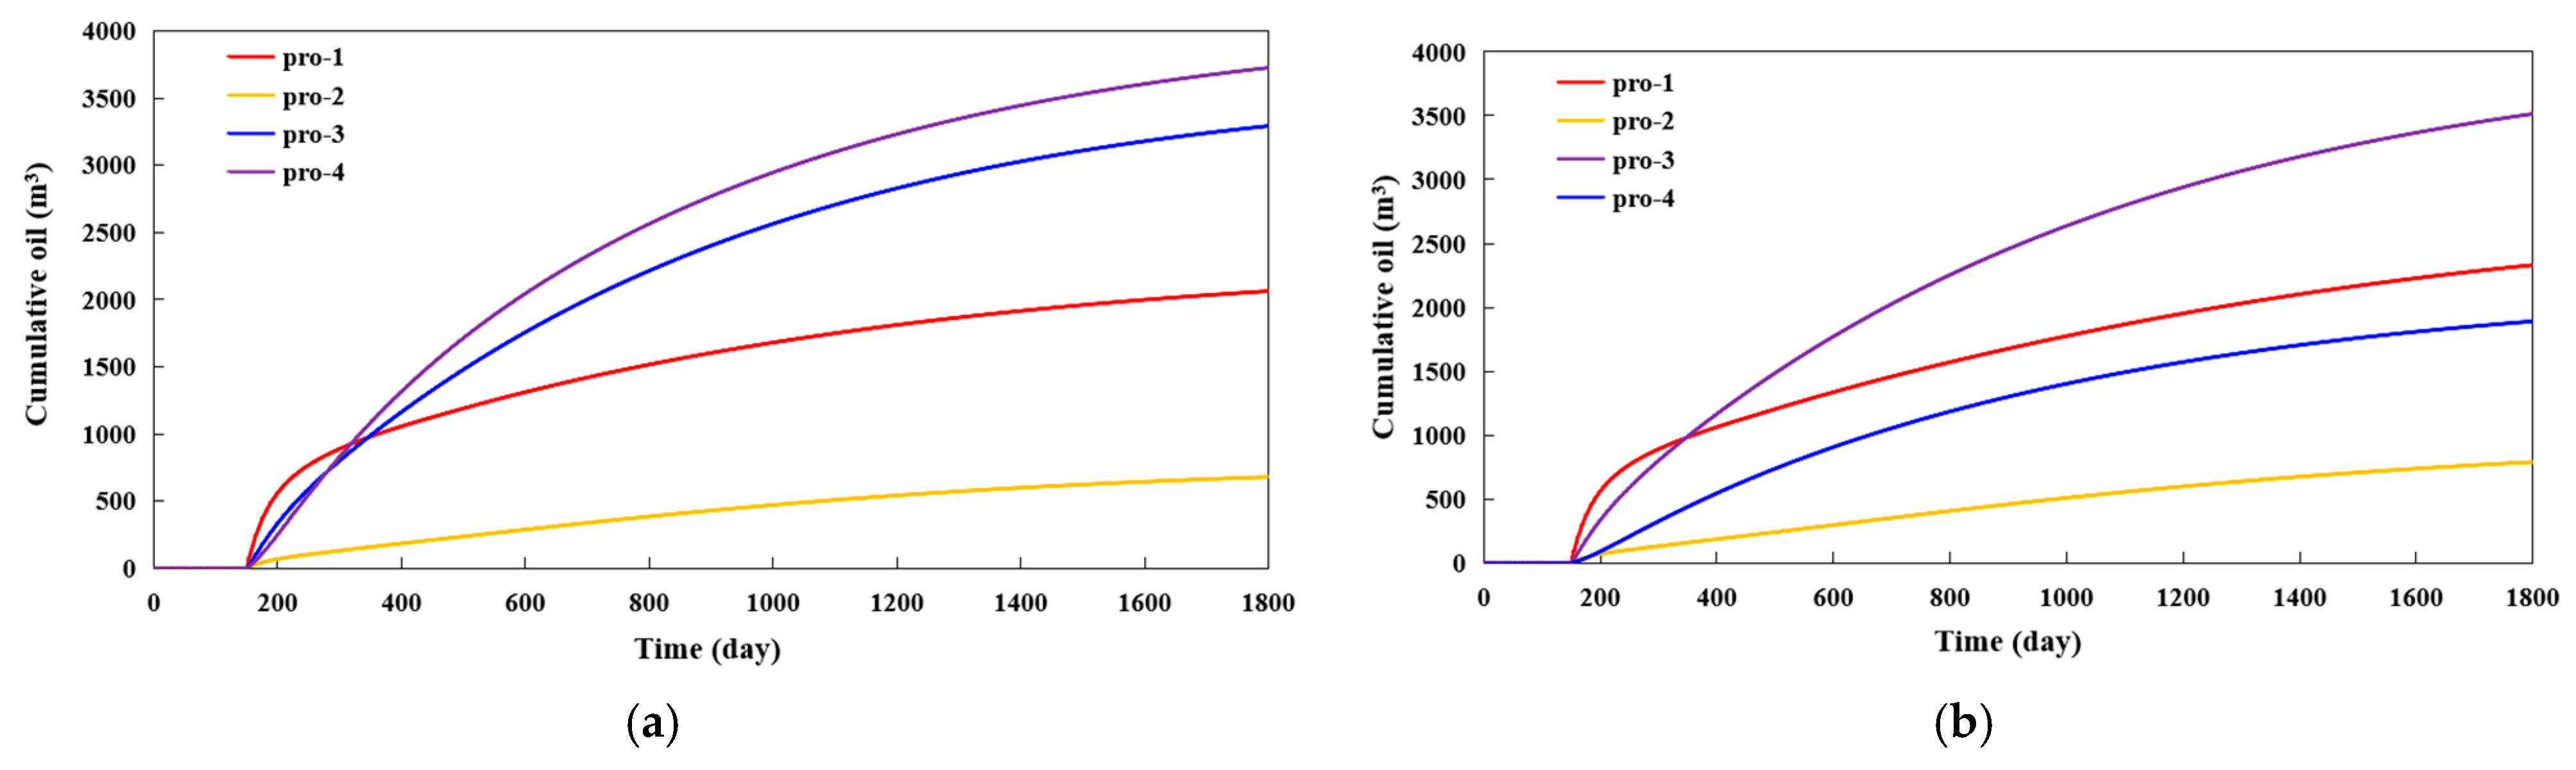
The simulation results show that before fracturing (Figure 13a), the cumulative oil increment is pro-3 > pro-1 > pro-4 > pro-2. The oil increment of production wells is not only influenced by a single factor but is jointly determined by the pressure response and the extent of the water-flow sweep. Under constant pressure production, production wells with a good pressure response have high liquid production after opening, such as pro-1. Production wells with a small water-flow sweep have low water cut after opening, such as pro-3 and pro-4. All these factors combined lead to the oil increment results shown in the simulation. After pro-4 underwent hydraulic fracturing (Figure 13b), the oil increment was pro-4 > pro-3 > pro-1 > pro-2, indicating that there is a good pressure response effect in the fracturing of production wells, which solves the problem of low liquid production in low-water-cut oil wells.
Figure 13.
Comparison of the oil production increase effects of each production well before and after the fracturing of well pro-4 in the remote affected suburban area. (a) Before fracturing and (b) after fracturing.
4.3.2. Simulation of Production Effects Under “Simultaneous HPWI and Oil Production”
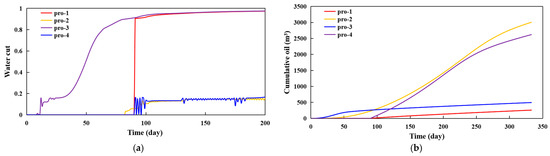
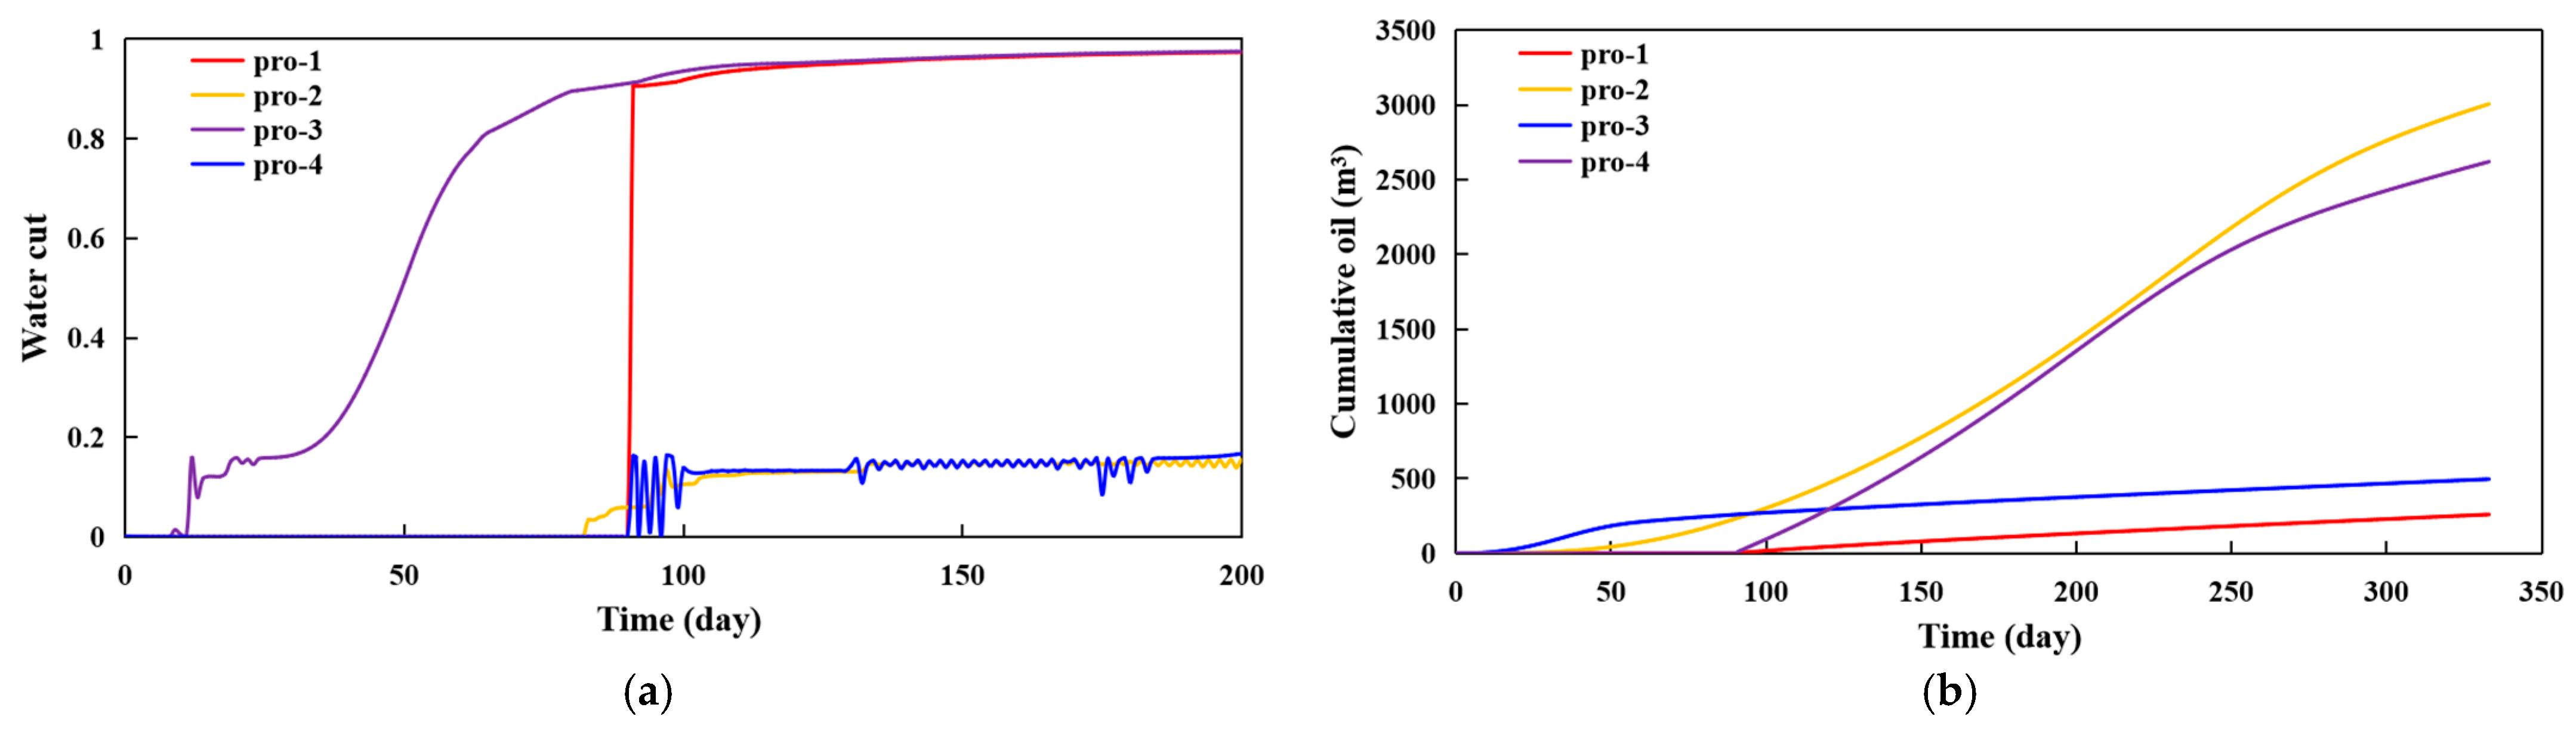
The production effect simulation of “simultaneous HPWI and oil production” is shown in Figure 14a. The production well pro-3, which is always in production on the main flow line, experiences a rapid increase in water cut as HPWI proceeds. Another production well pro-1, on the main flow line, shows full water after being opened for a period of time during the water injection. However, the production wells that are not on the main flow line can maintain low water cut production for a certain period of time. Figure 14b shows that the oil increment of the production wells that are not on the main flow line is much greater than that of the water-channeling wells in the main flow line direction. This production trend is similar to the actual production dynamics on site, indicating that the main flow line area with better physical properties in the reservoir has a significantly increased risk of water channeling under HPWI conditions. Therefore, in HPWI fields, the production wells in this direction should be given priority for prevention and control.
Figure 14.
Simulation results for the production effect of “HPWI in water wells–simultaneous well soaking–subsequent oil production in oil wells”. (a) Water cut and (b) cumulative oil production.
Under this production mode, a low-pressure zone generally exists around producing wells during production. Under this production mode, when the production well is in production, there is a low-pressure area around the well. After the injected water enters the formation, it is prone to flowing towards the low-pressure area. The influence of the dominant flow path between the injection well and the production well will be greatly increased, and the waterfront is more likely to break through directly along the dominant flow path. Relevant simulations have found that for the understanding of conventional water injection, when the reservoir physical properties change little, shutting down the well can effectively change the streamline direction and prevent water channeling in the affected wells. However, for HPWI, the time-varying physical properties around the well need to be considered. Under the condition of no production pressure difference when the well is shut down, it is easy to cause a pressure buildup, which promotes the effect of permeability enhancement. Moreover, the propagation of pressure is easily affected by permeability. To a certain extent, continuous HPWI without shutting down the well can also inhibit the expansion of HPWI fractures. There should be a boundary between shutting down the well and not shutting down the well to determine the specific measures, which are related to conditions such as the production pressure difference in the production well and the rock properties.
This study shows that the production dynamics of the enhanced permeability zone (EPZ) formed by high-pressure water injection is characterized by ‘rapid response–rapid decline’. The ‘plastic compaction’ model used in the simulation implies that the permeability enhancement effect will partially decay after the injection stops. The actual duration of the permeability enhancement effect is crucial for formulating the optimal ‘injection–soaking–production’ cycle period on site, which directly affects the effect and economy of increasing and stabilizing production. This duration is controlled by multiple factors, such as reservoir geomechanical properties, fluid physical properties, and the operating systems of the surrounding production wells. Its quantitative prediction and optimization will be the focus of subsequent research and the design of on-site application schemes.
5. Conclusions
HPWI technology utilizes high-pressure, large-rate water injection to create a network of micro-fractures around the wellbore by leveraging reservoir stress sensitivity and rock damage mechanisms. This process enhances the seepage capacity of low-permeability reservoirs, overcomes the threshold pressure gradient, and achieves efficient oil displacement. Based on numerical simulation, this paper studies the pore-volume expansion and permeability enhancement mechanisms of HPWI, its dynamic partitioning characteristics, and the corresponding production performance. The main conclusions are as follows:
- (1)
- Before the formation of macroscopic fractures, HPWI has an obvious micro-fracture stage. The equivalent permeability enhancement induced by micro-fractures makes the injected water spread more evenly, which is superior to the “inward-to-outward” advancement of the conventional waterflood. The existence of the threshold pressure gradient in low-permeability reservoirs is one of the main reasons for the problems of “injection difficulties and production challenges” in reservoirs. HPWI overcomes the threshold pressure gradient from two aspects—increasing the injection-production pressure difference and improving the seepage conditions—and has a good oil production increase effect. For the affected wells that still show poor results after a high-pressure water injection, hydraulic fracturing can be used to solve the problem that an effective displacement channel cannot be established between the injection and production wells due to the strong reservoir heterogeneity.
- (2)
- Under a fixed total injection volume, increasing the injection rate accelerates the development of the EPZ, albeit with diminishing marginal gains. In contrast, continuous increases in the cumulative injected volume enable sustained EPZ expansion. Once the propagation front reaches its boundary, the expansion rate accelerates. A distinct fracture-initiation pressure threshold exists, beyond which permeability enhancement proceeds rapidly. Reservoir heterogeneity exerts a pronounced influence on HPWI performance: high-permeability streaks preferentially channel EPZ growth along dominant flow paths and constrain its lateral spread. Compared with hydraulic fracturing, HPWI is more sensitive to the spatial distribution of permeability.
- (3)
- Under the same total injection volume, HPWI achieves approximately 1.83% higher recovery compared with the conventional waterflood. Its production profile exhibits a “fast start–rapid decline” trend, which is consistent with the transient advantage in conductivity and subsequent pressure depletion. In the “HPWI in water wells–simultaneous well soaking–subsequent oil production in oil wells” mode, the increased oil production is jointly controlled by the pressure effectiveness and the swept efficiency. Hydraulic fracturing of far-offset producers can significantly enhance the pressure response and mitigate the contradiction of low water cut and low liquid production. In the “simultaneous HPWI and oil production” mode, excessive fracture extension can be suppressed. However, the risk of water channeling along the dominant flow paths is high, while incremental oil is more pronounced in non-dominant directions.
Author Contributions
Writing—original draft, H.X.; writing—review and editing, Y.W.; conceptualization, J.W.; methodology, Y.X. and Y.L.; validation, P.C. and H.Z.; formal analysis, J.L. (Jianan Li); investigation, Y.S.; visualization, J.L. (Jianyu Li); supervision, J.W.; project administration, J.W.; interpretation of data, J.W.; funding acquisition, H.X. All authors have read and agreed to the published version of the manuscript.
Funding
This research was funded by the National Natural Science Foundation of China (No: 52274028) and the Open Fund of Hubei Key Laboratory of Oil and Gas Drilling and Production Engineering (Yangtze University) (No. YQZC202401).
Data Availability Statement
The original contributions presented in this study are included in the article. Further inquiries can be directed to the corresponding author.
Conflicts of Interest
Authors Yugong Wang, Yang Xu, Yong Li, Ping Chen, Hongjiang Zou, Jianan Li, and Yuwei Sun were employed by the Technology & Engineering Research Institute of Chuanqing Drilling Engineering Company. The remaining authors declare that the research was conducted in the absence of any commercial or financial relationships that could be construed as a potential conflict of interest.
Nomenclature
| HPWI | High-pressure water injection |
| EPZ | The enhanced-permeability zone |
| H-M-D | Hydro-mechanical-damage |
References
- Kong, D.; Peng, Y.; Zhou, Z.; Peng, H.; Chen, Z. Pore-scale mechanism of coupled pressure-driven flow and spontaneous imbibition in porous media during high-pressure water injection processes. Capillarity 2024, 13, 29–36. [Google Scholar] [CrossRef] [Scilit]
- Chen, L.; Jia, C.; Zhang, R.; Yue, P.; Jiang, X.; Wang, J.; Su, Z.; Xiao, Y.; Lv, Y. High-pressure capacity expansion and water injection mechanism and indicator curve model for fractured-vuggy carbonate reservoirs. Petroleum 2024, 10, 511–519. [Google Scholar] [CrossRef] [Scilit]
- Liu, H.; Ju, B. Research on the Mechanism and Prediction Model of Pressure Drive Recovery in Low-Permeability Oil Reservoirs. Energies 2024, 17, 5253. [Google Scholar] [CrossRef] [Scilit]
- Wu, J.; Ansari, U. From CO2 Sequestration to Hydrogen Storage: Further Utilization of Depleted Gas Reservoirs. Reserv. Sci. 2025, 1, 19–35. [Google Scholar] [CrossRef] [Scilit]
- Chen, B.; Li, M.; Zhang, J.; Ma, W.; Wang, Y.; Pan, T.; Liu, X. Experimental Investigation into the Impact of a Viscosity Reducer on the Crude Oil Recovery Rate in a Low-Permeability Reservoir. Fluid Dyn. Mater. Process. 2025, 21, 1459–1471. [Google Scholar] [CrossRef] [Scilit]
- Abdullahi, M.B.; Abdulkadir, U.; Aliyu, A.M.; Shehu, B.U. Optimization of Intermittent Gas Lift Surface Injection Pressure in High Water Cut Oil Well. In Proceedings of the SPE Nigeria Annual International Conference and Exhibition, Virtual, 11–13 August 2020. [Google Scholar] [CrossRef] [Scilit]
- Liu, Z.; Wang, S.; Zhao, H.; Wang, L.; Li, W.; Geng, Y.; Tao, S.; Zhang, G.; Chen, M. Effect of random natural fractures on hydraulic fracture propagation geometry in fractured carbonate rocks. Rock Mech. Rock Eng. 2018, 51, 491–511. [Google Scholar] [CrossRef] [Scilit]
- Zhu, W.; Gao, Y.; Wang, Y.; Liu, P.; Liu, Y. The injection capacity evaluation of high-pressure water injection in low permeability reservoir: Numerical and case study. Front. Earth Sci. 2024, 12, 1411451. [Google Scholar] [CrossRef] [Scilit]
- Li, N.; Zhu, S.; Li, Y.; Zhao, J.; Long, B.; Chen, F.; Wang, E.; Feng, W.; Hu, Y.; Wang, S.; et al. Fracturing-flooding technology for low permeability reservoirs: A review. Petroleum 2024, 10, 202–215. [Google Scholar] [CrossRef] [Scilit]
- Li, C.; Zhao, L.; Liu, B.; Chen, Q.; Lu, C.; Kong, Y. Research status, significance and development trend of microfractures. Nat. Gas Geosci. 2020, 31, 402–416. [Google Scholar] [CrossRef]
- Wang, Y.; Cheng, S.; Feng, N.; Xu, J.; Qin, J.; He, Y.; Yu, H. Semi-analytical modeling for water injection well in tight reservoir considering the variation of waterflood-Induced fracture properties–Case studies in Changqing Oilfield, China. J. Pet. Sci. Eng. 2017, 159, 740–753. [Google Scholar] [CrossRef] [Scilit]
- Wang, F.; Xu, H.; Liu, Y.; Meng, X.; Liu, L. Non-linear seepage model of hydraulic fracturing assisted oil displacement coupled with effects of high-pressure reduced adsorption: A case study of low and medium permeability reservoirs in Daqing Oilfield, NE China. Pet. Explor. Dev. 2024, 51, 1564–1573. [Google Scholar] [CrossRef] [Scilit]
- Ma, X.; Li, H.; Luo, H.; Nie, S.; Gao, S.; Zhang, Q.; Yuan, F.; Ai, W. Research on well selection method for high-pressure water injection in fractured-vuggy carbonate reservoirs in Tahe oilfield. J. Pet. Sci. Eng. 2022, 214, 110477. [Google Scholar] [CrossRef] [Scilit]
- Cheng, L.; Wang, D.; Cao, R.; Xia, R. The influence of hydraulic fractures on oil recovery by water flooding processes in tight oil reservoirs: An experimental and numerical approach. J. Pet. Sci. Eng. 2020, 185, 106572. [Google Scholar] [CrossRef] [Scilit]
- Yang, Y.; Zhang, S.; Cao, X.; Lv, Q.; Wang, J.; Liu, H.; Yu, C.; Sun, H. Practice and understanding of pressure drive development technology for low-permeability reservoirs in Shengli Oilfield. Pet. Geol. Recovery Effic. 2023, 30, 61–71. [Google Scholar] [CrossRef]
- Guo, J.; Lu, C.; Ma, L. Engineering scheme optimization and field application of fracturing-flooding for low-permeability reservoirs in Shengli Oilfield. Pet. Geol. Oilfield Dev. Daqing 2024, 43, 204–214. [Google Scholar] [CrossRef]
- Lei, X.; Zhao, C.; Zhang, Q.; Wang, P.; Xiong, R. Effect of high-multiple water injection on rock pore structure and oil displacement efficiency. Energy Geosci. 2024, 5, 100137. [Google Scholar] [CrossRef] [Scilit]
- Yang, Y.; Xiao, W.; Bernabe, Y.; Xie, Q.; Wang, J.; He, Y.; Li, M.; Chen, M.; Ren, J.; Zhao, J.; et al. Effect of pore structure and injection pressure on waterflooding in tight oil sandstone cores using NMR technique and pore network simulation. J. Pet. Sci. Eng. 2022, 217, 110886. [Google Scholar] [CrossRef] [Scilit]
- Sun, L.; Xu, B.; Xiong, P.; Yang, J. Rock dilation stimulation technique for production wells in unconsolidated sandstone reservoirs and its application. Pet. Geol. Oilfield Dev. Daqing 2024, 43, 98–105. [Google Scholar] [CrossRef]
- Sun, Q.; Zhang, Y.; Yu, C.; Sun, Z.; Cao, H.; Yang, L. Experimental study on fracture initiation and propagation characteristics caused by pressure drive in low-permeability sandstone reservoirs. Pet. Geol. Recovery Effic. 2024, 31, 160–167. [Google Scholar] [CrossRef]
- Zhang, Y.; Long, A.; Zang, A.; Zhao, Y. Pore-scale damage evolution in sandstone induced by fluid infiltration under various stress conditions. Int. J. Rock Mech. Min. Sci. 2025, 193, 106181. [Google Scholar] [CrossRef] [Scilit]
- Zhang, Y.; Sun, Q.; Yu, C.; Sun, Z.; Bei, J. Fracture distribution characteristics and influencing factors of fracturing-flooding in low permeability reservoir. Pet. Geol. Oilfield Dev. Daqing 2025, 44, 86–92. [Google Scholar] [CrossRef]
- Dewan, R.; Kumar, A.; Rahmani, M.K.I.; Bhatia, S.; Ahmed, M.E. Simulation and Modelling of Water Injection for Reservoir Pressure Maintenance. Comput. Mater. Contin. 2022, 72, 5761–5776. [Google Scholar] [CrossRef] [Scilit]
- Cui, C.; Wang, J.; Wu, Z.; Li, J.; Li, J.; Qian, Y. Analysis of unsteady pressure characteristics of fracturing-flooding water injection wells in low-permeability heterogeneous reservoirs. Acta Pet. Sin. 2025, 46, 938–952. [Google Scholar] [CrossRef]
- Cui, C.; Li, H.; Wu, Z.; Zhang, C.; Li, H.; Zhang, Y.; Zheng, W. Analysis of pressures in water injection wells considering fracture influence induced by pressure-drive water injection. Reserv. Eval. Dev. 2023, 13, 686–694. [Google Scholar] [CrossRef]
- Cha, L.; Feng, Q.; Wang, S.; Xu, S.; Liu, G.; Huang, W. Numerical Simulation of Fracture-flooding with Virtual Element Method in a Continuous Damage Model. Chin. J. Comput. Phys. 2023, 40, 81–90. [Google Scholar] [CrossRef]
- Ma, Z.; Shao, X.; Li, G.; Tang, L.; Yang, P.; Yang, B.; Chen, D.; Zhuang, D.; Zhang, H. Application of dilatant pressure flooding technology in low permeability reservoir in Bonan Oilfield. Unconv. Oil Gas 2023, 10, 58–66. [Google Scholar] [CrossRef]
- Zhan, J.; Fan, C.; Ma, X.; Zheng, Z.; Su, Z.; Niu, Z. High-Precision Numerical Simulation on the Cyclic High-Pressure Water Slug Injection in a Low-Permeability Reservoir. Geofluids 2021, 2021, 3507426. [Google Scholar] [CrossRef] [Scilit]
- Hamdoon, A.; Mohammed, M.A.A.; Elraies, K.A. A review of Chan plot application and recent advanced models for diagnosing excessive water production. Rud. Geološko Naft. Zb. 2024, 39, 149–163. [Google Scholar] [CrossRef] [Scilit]
- Wang, Y.; Cheng, S.; Feng, N.; He, Y.; Yu, H. The physical process and pressure-transient analysis considering fractures excessive extension in water injection wells. J. Pet. Sci. Eng. 2017, 151, 439–454. [Google Scholar] [CrossRef] [Scilit]
- Cao, H.; Zhang, G.; Li, S.; Wang, W.; Xie, P.; Sun, W.; Li, S. A hydraulic fracture extension model for fracturing and enhanced oil recovery considering the influence of the fracture process zone and its application. Rock Soil Mech. 2025, 46, 798–810. [Google Scholar] [CrossRef] [Scilit]

Disclaimer/Publisher’s Note: The statements, opinions and data contained in all publications are solely those of the individual author(s) and contributor(s) and not of MDPI and/or the editor(s). MDPI and/or the editor(s) disclaim responsibility for any injury to people or property resulting from any ideas, methods, instructions or products referred to in the content. |
© 2025 by the authors. Licensee MDPI, Basel, Switzerland. This article is an open access article distributed under the terms and conditions of the Creative Commons Attribution (CC BY) license.