Article

Fermentation Kinetics Beyond Viability: A Fitness-Based Framework for Microbial Modeling

by
Pablo Javier Ruarte
1,2,*,
María Carla Groff
1,2,3,
María Nadia Pantano
1,2,
Silvia Cristina Vergara
2,3,
María José Leiva Alaniz
2,3,
María Victoria Mestre
2,3,
Yolanda Paola Maturano
2,3 and
Gustavo Juan Eduardo Scaglia
1,2
1
Instituto de Ingeniería Química, Facultad de Ingeniería, Universidad Nacional de San Juan (IIQ-FI-UNSJ), Av. San Martín 1109 (O), San Juan 5400, Argentina
2
Consejo Nacional de Investigaciones Científicas y Tecnológicas (CONICET), Godoy Cruz 2290, Ciudad Autónoma de Buenos Aires C1425FQB, Argentina
3
Instituto de Biotecnología, Facultad de Ingeniería, Universidad Nacional de San Juan (IBT-FI-UNSJ), Av. San Martín 1109 (O), San Juan 5400, Argentina
*
Author to whom correspondence should be addressed.
Processes 2025, 13(9), 3018; https://doi.org/10.3390/pr13093018 (registering DOI)
Submission received: 14 August 2025 / Revised: 12 September 2025 / Accepted: 17 September 2025 / Published: 21 September 2025

Abstract

Traditional fermentation models often oversimplify kinetics by treating microbial populations as physiologically homogeneous. To address this, we introduce a novel framework that explicitly incorporates cellular fitness by distinguishing the metabolically active subpopulation (“productive cells”) responsible for biosynthesis. This approach integrates established growth models (First Order Plus Dead Time and Logistic) with a modified Luedeking–Piret model (MALP), which introduces a new differential equation to dynamically quantify productive cells. This modeling study relies exclusively on experimental data available in the literature; no new experimental work was conducted. Validated against four diverse fermentation systems from published datasets, the MALP model demonstrated superior predictive accuracy, achieving coefficients of determination (R2 > 0.97) for metabolite kinetics. Sensitivity analysis identified time-delay and maintenance-associated parameters as dominant factors governing system behavior. The key contribution of this work is a mechanistic equation that universally captures the real-world dynamics of metabolite production, providing a more realistic and robust framework for modeling heterogeneous bioprocesses.

1. Introduction

Microbial fermentation remains a cornerstone of industrial biotechnology due to its capacity to produce valuable metabolites such as ethanol, organic acids, higher alcohols, pigments, and exopolysaccharides, among others [1,2]. These products are central to multiple industries including food, pharmaceuticals, and bioenergy. However, the predictive capacity of traditional fermentation models is often limited. This is primarily because these models are built on population-averaged parameters that assume microbial homogeneity, thereby overlooking the intrinsic physiological heterogeneity within microbial populations [3,4]. Recent studies have emphasized that phenotypic diversity, including differences in metabolic activity, stress tolerance, and biosynthetic potential, can significantly affect fermentation performance [5,6]. Such diversity is not merely stochastic. Genomic and transcriptomic studies have identified adaptive mechanisms including single nucleotide polymorphisms (SNPs), copy number variations (CNVs), and stress-induced regulatory changes that enhance tolerance to inhibitors like acetic and formic acid [7]. Additionally, non-conventional yeasts such as Lachancea thermotolerans exhibit anthropization-driven metabolic specialization during wine fermentation, diverging significantly from industrial S. cerevisiae strains [8]. These findings underscore that microbial populations are far from uniform and that functional diversity must be acknowledged to truly understand fermentation dynamics.
Despite this biological complexity, classical kinetic models continue to treat microbial populations as homogeneous entities, failing to account for the contributions of distinct physiological subpopulations to biomass growth and metabolite synthesis [9]. To address this limitation, hybrid modeling approaches, integrating mechanistic kinetics, in situ spectrofluorescence, and machine learning, have emerged as promising tools for capturing nonlinear dynamics under industrial conditions [10,11]. Most of the available fermentation models have been developed under optimal laboratory conditions and are tailored to industrial S. cerevisiae strains. These models frequently fail to incorporate the specific physiological responses of autochthonous, probiotic, or non-industrial yeasts under real-world processing conditions. Several recent studies have demonstrated that physiological adaptation to environmental factors, such as temperature shifts, osmotic stress, nutrient limitation, or toxic inhibitors, leads to distinct metabolic reprogramming that generalist models are unable to predict accurately [12,13,14]. This divergence in metabolic behavior not only limits model predictability but also impairs the rational design and optimization of fermentation processes. Indeed, native and non-conventional strains display a broad range of metabolic phenotypes—particularly in sugar utilization profiles, redox balancing, and ethanol tolerance—that challenge assumptions of homogeneity in classical kinetic approaches [4,15].
Central to addressing these modeling challenges is the emerging concept of cellular fitness, a multidimensional construct that includes not only cell viability but also biosynthetic activity, stress resistance, and dynamic metabolic adaptability at the single-cell level [16,17]. Non-genetic factors such as epigenetic noise, resource partitioning, and transcriptional variability further exacerbate functional heterogeneity during fermentation [18,19]. Nevertheless, most current kinetic frameworks fail to incorporate these layers of complexity, resulting in oversimplified representations of biomass and product formation. This simplification becomes especially limiting when modeling native or probiotic strains, where only a fraction of viable cells may be metabolically active and contribute to product formation [20]. As a result, there is a growing need for kinetic frameworks that incorporate physiological heterogeneity as a core modeling principle.
In this study, the main purpose is to introduce a novel modeling framework that integrates cellular fitness as a dynamic parameter. Biomass growth is described using both First Order Plus Dead Time (FOPDT) and Logistic models, while metabolite synthesis is captured via a Metabolically Active Luedeking–Piret Model (MALP), which is the modeling approach proposed in this study. This formulation distinguishes between active, quiescent, and merely viable cells, enabling more accurate prediction of fermentation kinetics in heterogeneous populations. The MALP model was developed using laboratory-scale data from an autochthonous S. cerevisiae strain with probiotic potential [21] and was subsequently applied to literature-reported biomass–product datasets from various fermentation systems [22,23,24,25]. Ultimately, this work aims to bridge the gap between cellular physiology and bioprocess modeling, offering a reliable predictive tool for optimizing fermentations involving non-industrial yeast strains under non-ideal conditions [26,27].
It is important to note that this study is a mathematical modeling effort designed to develop and validate a novel kinetic framework. All experimental data used for model development, parameter estimation, and validation were obtained from previously published studies [13,23,24,25]. No new laboratory experiments were conducted specifically for this manuscript. This approach allows for the rigorous testing of the proposed MALP model across a wide range of fermentation conditions and microbial systems.

2. Materials and Methods

The methodological approach for applying the MALP (Metabolically Active) model is summarized in the workflow shown in Figure 1.
To build upon the innovative mathematical approach based on cellular fitness obtained from our experimental data [21], other studies involving diverse fermentation kinetics were selected to compare and contextualize the kinetic behavior of various fermentative systems. This selection was based on the following:
-
The availability of well-characterized kinetic profiles for biomass and product, which enabled a critical and exhaustive evaluation of the model proposed in the present work.
-
The type of substrate and microorganisms used, prioritizing systems employing complex substrates and mixed microbial cultures.
-
The application of traditional mathematical models that do not account for cellular fitness.
Once the studies were selected, the experimental data extracted from those articles were mathematically modeled using the strategy described in the present work (see Section 2.1).
The most important aspects of the selected studies, as well as the criteria used for model comparison and validation, are described below:
Case Study 1. Ref. [13] investigated the fermentation kinetics of Lactobacillus plantarum CCFM1050 in wolfberry pulp supplemented with galacto-oligosaccharides. The process was carried out at 30 °C for 72 h, monitoring biomass growth, lactic acid production, and sugar consumption. A logistic model and a modified Luedeking–Piret equation were applied, revealing that acid synthesis was both growth-associated and independent of growth. The study also reported enhanced antioxidant activity and changes in volatile compounds after fermentation, highlighting the physiological complexity of the viable cell population throughout the process.
Case Study 2. Ref. [24] conducted a study on brewing yeast strains to assess how cell size and metabolic activity affect flavor development and stability in beer. The researchers classified yeast strains into groups based on average cell volume and monitored the production of esters, ethanol, and other volatiles during beer fermentation. Despite similar viable counts across strains, significant differences in metabolite synthesis were observed, indicating that not all viable cells equally contributed to product formation. This highlights the physiological heterogeneity within the population, which aligns with the premise of the model proposed in the present work. Ethanol levels were higher in strains with larger cell size and higher metabolic rates, even though their viability profiles were comparable.
Case Study 3. Ref. [23] investigated the fermentative behavior of three S. cerevisiae strains under oxygen-limited and lipid-depleted synthetic media, focusing on cell viability, membrane integrity, lipid composition, and ethanol production. Their findings revealed that differences in fatty acid saturation ratios—particularly C16/TFA (the ratio of C16 saturated fatty acids, mainly palmitic acid, to total fatty acids) and UFA/TFA (the proportion of unsaturated fatty acids to total fatty acids)—significantly affected ethanol tolerance and cell survival. Despite a marked decrease in culturable cell numbers during fermentation, strain M25 maintained ethanol production, indicating the presence of a viable but non-culturable (VBNC) subpopulation. This observation supports the premise of the present model, which distinguishes between total viable cells and the functionally active fraction responsible for metabolite synthesis, thus capturing the physiological heterogeneity inherent to yeast fermentations under stress conditions.
Case Study 4. Ref. [25] studied the modeling of batch kefir fermentation kinetics using the Logistic model to describe biomass growth and a first-order model for substrate consumption in a kefir-based fermentation system using sucrose as carbon source. The model was fitted to experimental data obtained from fermentations at 20 °C and 30 °C in 1 L bioreactors. Despite the simplicity of the kinetic approach, the authors noted a lag between biomass accumulation and product formation, especially for ethanol and carbon dioxide, suggesting the presence of a physiologically delayed or decoupled fraction within the microbial community.
The data compiled from these works allowed for the evaluation of the predictive capacity of the MALP model when applied to heterogeneous systems involving viable yet physiologically distinct microbial populations.

2.1. Mathematical Modeling

2.1.1. Microbial Growth

Microbial growth modeling was carried out by integrating two complementary approaches: the Logistic model, commonly used in bioprocess studies to describe sigmoidal growth, and the FOPDT model, widely applied in process engineering to capture dynamic delays. This combined modeling framework enables a more accurate and mechanistic representation of microbial kinetics, capturing both the nonlinear growth profile and time lags inherent to fermentation systems. By explicitly distinguishing between total, viable, and dead cell populations, the formulation enhances interpretability and achieves closer alignment with experimental data from complex fermentation environments.
Model 1: First Order Plus Dead Time
To describe microbial dynamics during fermentation, a FOPDT model was applied to both total cells (x1) and dead cells (x2). This formulation captures the physiological lag phases and saturation behavior typically observed in cell populations. In this framework, x1 is described by a FOPDT structure with a time constant (TL) and a delayed driving term (x1 max), representing the maximum attainable biomass:
T L   x ˙ 1 +   x 1   =   x 1   m a x   t     t L ,             x 1 ( 0 ) =   x 1   0  
where the function x 1   m a x   t     t L is defined by the following:
x 1   m a x   t     t L = x 1   0                                                     i f   t <   t L   x 1   m a x                                           i f   t   t L
where
T L is the system time constant for total cells [h];
x ˙ 1 is the total biomass growth rate [CFU/mL h];
x 1 is the current condition for total cells [CFU/mL];
x 1   m a x is the maximum total cell population [CFU/mL];
x 1 ( 0 ) is the initial condition for total cells [CFU/mL].
t L is the delay time for total cells [h].
T D is the system time constant for dead cells [h];
The initial conditions ensure that the simulation starts with the initial total cell count: x1 (0) = x1 0.
  • Equation for DeadCells
The dead cell population (x2) also follows a FOPDT formulation, activated after a delay (tD) and scaled by a gain coefficient (K1) relative to the total cell population (x1(t)), as shown in Equation (2):
T D     x ˙ 2 +   x 2   =   U 2   t     t D ,                         x 2 ( 0 ) =   x 2   0
where the input function U 2   t     t D is defined by:
U 2 t t D = x 2   0                                             i f   t <   t D   K 1   x 1 ( t )                             i f   t   t D
where
x ˙ 2 is the accumulation rate of dead cells [cells/mL.h];
x 2 is the current condition for dead cells [cells/mL];
x 2 ( 0 ) is the initial condition for dead cells [cells/mL].
The initial condition corresponds to the starting number of dead cells: x2(0) = x2 0.
The input function U2 (ttD) represents the delayed contribution to the dead cell population. For more details, see [21].
  • Viable Cells
The viable cell population is computed as the difference between the total cells (x1) and the dead cells (x2). This relationship allows for the simulation of the viable cell trajectory over time, as shown in Figure 2. In this way, yeast production kinetics have been modeled using a linear model with two state variables [21].
x v = x 1 x 2
This modeling framework was previously proposed and applied to describe the behavior of native S. cerevisiae strains under non-ideal fermentation conditions [21].
Model 2: Logistic Growth Model
  • Equation for Total Cells
x ˙ 1 = μ 1 x 1 1 x 1 x 1   m a x ( t t L )
In Equation (4), the term in parentheses ensures that x1 remains at x1 0 for t < tL. For t > tL, x1 tends toward xmax.
Where
μ 1 is the specific growth rate of total cells [1/h].
x 1   m a x ( t   t L ) : A delayed maximum viable cell population is added to this model, allowing for a better fit to the experimental data. This term ensures that growth slows as x1 approaches its delayed maximum.
  • Equation for Dead Cells
The following equation models the gradual accumulation of dead cells in the system:
x ˙ 2 =   μ 2 x 2 1     x 2 U 2   ( t   t D )
In Equation (5), the term U2 (ttD) ensures that x2 remains at x2 0 for t < tD. For t > tD, x2 tends toward a fraction of x1. For more details, see [21].
Where
μ 2 is the specific death rate of dead cells [1/h].
As in Equation (2), a delay term is added to improve the fit U2 (ttD).
  • Viable Cells
The viable cell population xv is calculated from Equation (3).

2.1.2. Metabolite Synthesis

The original Luedeking–Piret (LP) model correlates product formation with total cell population (x1). Subsequent improvements by our team [21] introduced viable cells (xv) as the active biomass component. This work advances the framework further by incorporating productive cells (xP), the metabolically active subpopulation directly responsible for biosynthesis. While both Logistic and FOPDT models effectively describe xv dynamics, accurate process modeling requires a hierarchical resolution coupled with product kinetics, as xP—not total or even viable biomass—determines actual production rates. This refinement captures intrinsic biological heterogeneity while maintaining the LP model’s mathematical tractability.
In this work, a MALP model focused on productive cells is proposed for modeling product formation. This modeling approach has not been previously reported in the literature, although in previous works by our team [28], we introduced a delay time between the onset of exponential cell growth and the onset of metabolite growth, considering total cells. Therefore, in the present work, the MALP model considers two critical phenomena:
(1)
Only physiologically competent cells contribute to metabolite production, i.e., the productive cells (7);
(2)
In turn, physiological activity varies over time, meaning that not all productive cells participate equally or simultaneously in metabolite synthesis.
The MALP model proposed in the present work is mathematically described below:
T   x ˙ P +   x P = K 2   m a x   v i a b l e
P ˙ = Y P X   x ˙ P + m P   x P
0 < K 2 1         s i n c e     x P   x v  
where
  • P ˙ is the product formation rate [g/mL.h];
  • x ˙ P is the productive cell rate [CFU/mL.h];
  • Y P X is the growth-associated product yield coefficient [gproduct/CFU];
  • m P is the maintenance-associated product formation coefficient [gproduct/CFU.h];
  • m a x   ( v i a b l e ) is the maximum viable cell population [CFU/mL];
  • K 2 is a constant bounded within a biologically meaningful range;
  • T is the system time constant cells xp [h].
This refined MALP framework, while significantly enhancing biological realism, introduces the critical parameter K2, defining the maximum potential fraction of viable cells that can be metabolically active at a given time. It is important to note that K2 is not a static constant but is a dynamic variable governed by prevailing process conditions such as substrate concentration (S), dissolved oxygen (DO), pH, or metabolite inhibition. For instance, to explicitly model the limitation of any physicochemical parameter on physiological activity, the saturation term from Monod kinetics could be incorporated directly into the driving function of Equation (6), transforming it into:
K 2 = K i   i i + K i    
where Ki represents the half-saturation constant for the transition to a productive metabolic state. Since K2 is a function of various factors (K2 = f(S(t), O2(t), pH(t), …)), the subscript “i” can represent S, O2, pH, or any other variable to be evaluated in the system. While a comprehensive quantification of K2 is highly process-specific and falls beyond the scope of this initial model formulation.
This novel formulation addresses a key limitation of traditional fermentation kinetics (as illustrated in Figure 3), which typically assumes that metabolite generation is directly proportional to biomass growth or total biomass, without adding complexity to the mathematical calculation. The introduction of the differential Equation (6), which describes the dynamics of the specific subpopulation of cells actively involved in metabolite production, is the novelty of this approach.

2.2. Sensitivity Analysis

A local sensitivity analysis was performed by perturbing each model parameter individually by ±10% from its nominal (calibrated) value, while keeping all other parameters constant. Parameters that produced minimal variations in the model error were interpreted as either well-estimated or suitable for being fixed during the calibration process. The classification of parameter sensitivity followed the criterion proposed in [29]. Additionally, the relative influence of each parameter variation on model output was weighted using a Pareto-based ranking method, allowing for a visual and quantitative assessment of the most impactful parameters [30].
All calculations and graphical representations were performed using MATLAB® R2016b (The MathWorks Inc., Natick, MA, USA), ensuring reproducibility and numerical consistency across analyses.

2.3. Data Analysis

Model parameters were estimated using a hybrid optimization strategy developed by our research group, which integrates Monte Carlo sampling with genetic algorithms. This combined approach enables an extensive and effective exploration of the parameter space by harnessing the stochastic nature of Monte Carlo simulations along with the adaptive search properties of evolutionary algorithms. A detailed description of this methodology can be found in references [31,32]. The optimization problem was formulated as the identification of the parameter set that maximizes the objective function, defined as the coefficient of determination R2. An R2 value close to 100% indicates that the regression model provides an excellent fit to the data, explaining a substantial proportion of the variance in the dependent variable. In contrast, an R2 value near zero suggests that the model exhibits poor fit and is insufficient for accurate predictions. This approach ensures the best possible agreement between model predictions and experimental data.
The same strategy was consistently applied to all models and case studies discussed in subsequent sections.
Subsequently, the precision and reliability of the developed mathematical models were evaluated using standard statistical performance metrics, including the coefficient of determination (R2), Lack of Fit (LOF), Mean Squared Error (MSE), the F-statistic, and associated p-values. These indicators collectively assess both the quality of fit to experimental data and the model’s predictive performance.

3. Results and Discussion

3.1. Model Performance and Fitting Accuracy

The MALP model was developed using laboratory-scale data from beer fermentation with autochthonous S. cerevisiae strains exhibiting probiotic potential. It was subsequently applied to four case studies involving microbial fermentation systems previously reported in the literature, each characterized by distinct degrees of physiological heterogeneity and kinetic complexity. The experimental datasets were retrieved from Case Studies 1–4 and included time-series measurements of biomass and metabolite concentrations.
In all cases, the MALP model, through explicit consideration of the metabolically active subpopulation of viable cells, exhibited enhanced predictive performance compared to traditional Luedeking–Piret model that rely solely on total biomass as the driving variable for product formation.

3.2. Interpretation of the Productive Cell Dynamics

A key feature of the model is its ability to decouple total viability from metabolic contribution through the introduction of a differential equation describing the productive cell population, defined as the fraction of viable cells that are actively involved in product synthesis. This approach makes it possible to identify physiological delays and asynchronous activity within the cell population, which were evident in the experimental datasets analyzed. For instance, in Case Study 1 on L. plantarum fermentation of wolfberry pulp, acid production persisted even as viable cell counts plateaued, suggesting sustained metabolic activity in a limited subset of cells. Similarly, in Case Study 2, strains with nearly identical viability profiles displayed significant differences in ethanol output, highlighting the influence of factors such as cell size, metabolic status, and stress response on product yield. In a related context, Case Study 3 reported that fermentations carried out under lipid-limiting and hypoxic conditions showed yeast strains with similar biomass dynamics could still yield markedly different amounts of ethanol. These discrepancies were attributed to strain-dependent physiological traits, particularly their capacity to modulate membrane lipid composition during early growth phases.
By fitting the MALP model to these data, we observed that product formation could be accurately described by a dual contribution: one term associated with the growth rate of the productive cell, yP/X, and another linked to a maintenance-like term, mp, representing non-growth-associated synthesis. This dual mechanism proved especially relevant in the kefir-based system, where product accumulation lagged behind biomass growth.
Such findings reinforce the importance of modeling product formation based on metabolically active subpopulations, rather than relying solely on total cell counts. A key contribution of this work lies in the explicit formulation of this phenomenon through a novel differential equation, enabling the quantitative representation of physiological heterogeneity within the viable population. To the best of our knowledge, no previous models have introduced this level of detail regarding the metabolically active fraction in microbial fermentation systems. By incorporating this equation, the model gains the ability to reproduce complex activity patterns, such as delayed or asynchronous product formation, that are frequently observed in experiments but remain poorly explained by traditional viability-based frameworks.

3.3. Impact of Model Structure on Predictive Insight

The introduction of Equation (6), which dynamically defines the productive cell population (xp) as a subset of viable cells (xv) based on their physiological state, provides a mechanistic explanation for a key metabolic phenomenon: not all viable cells contribute equally to product formation. Instead, only a fraction of cells (xp) is metabolically active and responsible for biosynthesis, while others may be latent or engaged in maintenance. Equation (7) extends this concept through a product formation framework where synthesis rates are explicitly linked to the active subpopulation (xp) rather than total biomass.
Despite this biological realism, mathematical formulation remains simple and familiar to process engineers, as it builds on conventional product-formation kinetics while introducing the critical xp/xv distinction. By explicitly decoupling observable biomass from productive capacity, the model offers deeper insight into microbial behavior without introducing unnecessary complexity. This approach aligns with experimental observations of metabolic heterogeneity.

3.4. Analysis of Models Adjustments

To contextualize the advantages of the MALP model developed in this study, its performance was compared with that of previously published models using similar experimental systems. In all cases, our model demonstrated a higher coefficient of determination (R2) for both biomass and metabolite formation, supporting its superior predictive capacity.

3.4.1. Kinetic Modeling of Biomass Growth

In Case Study 1, a Logistic model was applied to describe the fermentation of L. plantarum in wolfberry pulp. The reported R2 for biomass fitting was 94%, reflecting good, but not optimal, model adherence. Similarly, Case Study 2 investigated ethanol production in brewing yeasts and presented comparative kinetic behaviors among strains categorized by cell size. Although precise R2 values were not disclosed, the study acknowledged considerable variance between metabolite production and viable cell counts, suggesting limitations in model fidelity when viability is treated uniformly.
In Case Study 4 on batch kefir fermentation, a logistic function was used to model kefir grain growth, yielding an R2 of 96.70%. This value reflects a strong fit; however, the model did not account for physiological heterogeneity within the cell population, nor did it establish an explicit relationship between cell growth and product formation. These omissions limit the model’s ability to capture the dynamic interactions between microbial activity and metabolite synthesis observed in complex fermentation systems.
Similarly, Case Study 3 investigated the adaptation of S. cerevisiae under lipid-limiting conditions. While fermentative activity was assessed, no kinetic modeling or regression-based validation was reported. Instead, the results highlighted the physiological basis of viability loss and reduced fermentative efficiency, reinforcing the need for models that account for functional subpopulations within microbial communities.
In contrast, the model proposed in the present study, by explicitly incorporating a dynamic subpopulation of metabolically active cells within the viable population, achieved R2 values exceeding 97% for all variables across multiple case studies. Furthermore, the Lack of Fit tests yielded non-significant results (p > 0.05), confirming the statistical adequacy of the model. These results validate that incorporating physiological heterogeneity into the modeling structure significantly enhances the accuracy of kinetic descriptions, particularly in fermentation systems involving non-industrial or probiotic strains.
The microbial growth kinetics, X(t), corresponding to the four evaluated fermentation systems are illustrated in Figure 4, where both the experimental data and the fitted curves using the Logistic and FOPDT models are shown:
The profile of Figure 4a shows a rapid exponential phase, a clearly defined stationary phase, and a subsequent decline in biomass, indicating cellular decay. The model demonstrates excellent agreement with the experimental curve, with an R2 value of 99.13%.
In Figure 4b the Logistic model accurately reproduces the sigmoidal growth pattern and captures the post-peak decline in cell density. The fit yielded a coefficient of determination of 98.39%, indicating strong predictive performance throughout the full fermentation period.
The curve of Figure 4c reflects a prolonged growth phase followed by a mild decline, consistent with the experimental data. The R2 value of 97.53% supports the reliability of the model in capturing the observed dynamics across the entire process duration.
In Figure 4d the experimental data exhibit a fast exponential phase within the first 5 h, followed by a short stationary phase and a noticeable decline in biomass, consistent with nutrient limitation and ethanol accumulation. The model closely replicates the overall trend of the fermentation process, achieving a coefficient of determination R2 of 97.50%, which confirms its robustness in capturing both the expansion and decay phases observed in wine fermentations.
To illustrate the versatility and performance of the proposed modeling framework, Table 1 summarizes the estimated parameters and statistical indicators obtained for different fermentation systems, each fitted using either Logistic or FOPDT structures.
The comparative analysis in Table 1 reveals that the proposed modeling framework demonstrates strong predictive performance across physiologically diverse fermentation systems. Notably, high coefficients of determination (R2 values ranging from 97.50% to 99.13%) and low MSE values indicate a good fit between experimental data and model predictions. The F-statistic and associated p-values further support the statistical validity of the models.
In systems modeled with the FOPDT structure (Ethanol, Kefir, and Beer), longer delay times (e.g., tD and TD) suggest more complex kinetic behaviors likely influenced by microbial consortia or adaptation phases. Conversely, the Logistic models (Lactic Acid and Ethanol Wine) exhibit shorter lag phases and simpler growth dynamics, which align with monoculture fermentations involving L. plantarum and S. cerevisiae. The consistently low Lack of Fit (LOF) values, particularly in beer and wine fermentations, further underscore the framework’s adaptability and its capacity to capture key bioprocess features across different substrates and microbial ecosystems.

3.4.2. Kinetic Modeling of Metabolite Production

Figure 5 shows the kinetics of metabolite formation, P(t), evaluated for four different fermentation processes using the MALP model. Experimental profiles are compared with model predictions that account for both growth-related and maintenance-associated synthesis, based on the dynamics of the metabolically active cell fraction. The proposed formulation accurately describes the observed production trends in each case, reflecting the temporal variation in metabolic activity within viable populations.
The application of the MALP model to four distinct fermentation systems demonstrated excellent predictive accuracy for primary metabolite production, as reflected by high coefficients of determination (R2 = 99.13–99.65%). Each system exhibited unique dynamic characteristics that were effectively captured by the proposed modeling framework.
In Case Study 1 (Figure 5a), the model reproduced lactic acid accumulation with an R2 of 99.16%. This aligns with the findings of Case Study 1, which reported a strong fit (R2 = 99.49%) for lactic acid production using a custom kinetic equation and highlighted a clear growth-associated synthesis behavior throughout the 72 h process.
In the wine fermentation kinetics (Figure 5b), the model achieved an R2 of 99.13%. Case Study 3 observed significant strain-dependent differences in ethanol yield and viability under identical fermentation conditions. The yeast strain L2056 produced the most ethanol, even as others (e.g., M25) displayed lower viability. This reinforces the model’s ability to decouple viable cell count from metabolic output, providing a more physiologically realistic framework for describing ethanol accumulation.
For kefir fermentation (Figure 5c), our model achieved an R2 of 97.12%, slightly below the 99.10% reported in Case Study 4. This difference reflects the modeling strategies: their Gompertz model fits only product data, while our approach integrates biomass dynamics by linking ethanol formation to the metabolically active cell population—enhancing physiological relevance despite added complexity.
Finally, in beer fermentation (Figure 5d), the generalized model achieved the highest performance (R2 = 99.65%). Although Case Study 2 did not report explicit model fits, it emphasized physiological variability among brewing yeast strains with similar viability but differing ethanol and ester production capacities. This supports the inclusion of metabolically active subpopulations in modeling approaches like the one proposed here.
The MALP model reliably predicts metabolite kinetics, as demonstrated by its ability to conduct the following:
  • Simultaneously capture growth-associated and non-growth-associated production phases.
  • Accurately represent system-specific behaviors (e.g., microbial consortia dynamics, strain variability).
  • Improve prediction accuracy by accounting for functional heterogeneity in viable cell populations.
The consistently high R2 values across diverse systems underscore the model’s reliability and potential utility for optimizing industrial fermentation processes and scaling up production strategies.
Table 2 provides a comparative summary of key parameters associated with product formation (yp/x and maintenance coefficient, mp), along with statistical performance indicators used to assess model accuracy across the four fermentation systems analyzed. Reported values include the Lack of Fit (LOF), MSE, F-statistic, p-values, and coefficient of determination (R2), offering a comprehensive overview of each model’s ability to represent the experimental data.

3.5. Local Sensitivity Analysis

The Pareto charts (Figure 6, Figure 7, Figure 8 and Figure 9), show how intuitive identification of the most influential parameters affecting the behavior of biomass and product formation models across the different fermentation systems. This procedure revealed a heterogeneous parameter response among the systems tested and allowed the identification of those parameters with the greatest influence on model performance.

3.5.1. Lactic Acid Fermentation

The left panel of the lactic acid Pareto chart reveals that the most influential parameters for biomass prediction are the delay in cell death (tD, 53.9%) and the maximum biomass capacity (x1max, 39.4%). These two variables jointly account for over 90% of the total sensitivity, indicating that biomass dynamics are predominantly influenced by physiological limitations and time-delayed decay mechanisms.
On the product side, the most critical parameter is the biomass-to-product yield coefficient (yp/x, 54.8%), followed distantly by x1max and other kinetic parameters such as mp and u1. This highlights that in lactic acid fermentation, product formation is strongly associated with the efficiency of biomass conversion rather than growth or delay-related effects.

3.5.2. Kefir Fermentation

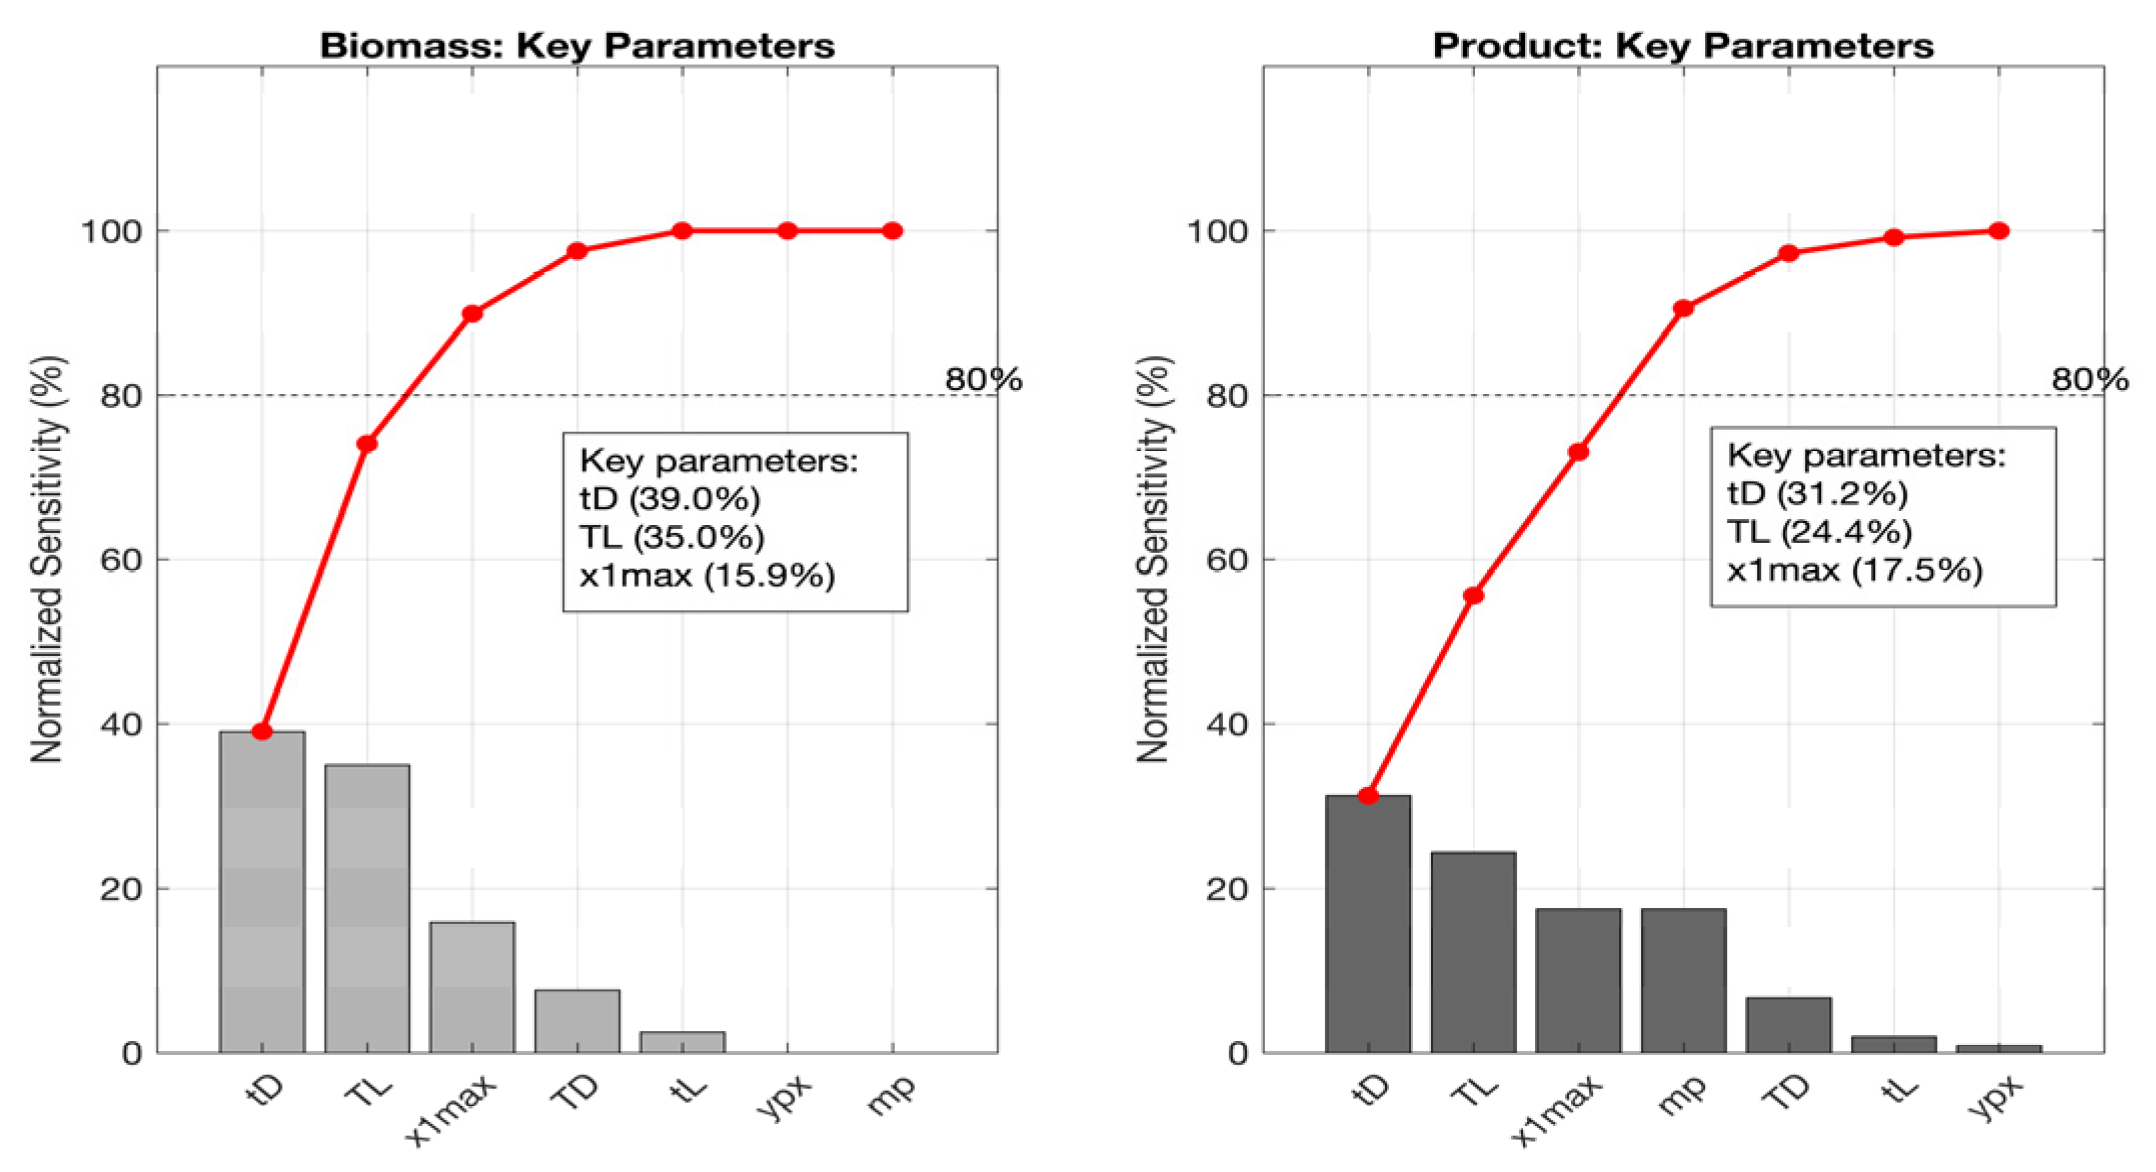
In the kefir system, the sensitivity profile is less dominated by growth rates and more shaped by delay-associated parameters, reflecting the physiological complexity of its mixed microbial consortium. For biomass prediction, the dominant contributors are the death delay (tD, 39.0%) and the life delay (tL, 35.0%), followed by the maximum biomass capacity (x1max, 15.9%). This indicates that time-dependent dynamics are essential to describe viable cell behavior.
In product formation, a similar pattern emerges tD (31.2%), tL (24.4%), and x1max (17.5%) are the top contributors. These findings suggest that product synthesis is tightly linked to the temporal regulation of viability and biomass saturation, rather than specific kinetic rates. This time-dependent sensitivity pattern highlights the need for delay-inclusive models when representing the behavior of complex microbial communities like kefir.

3.5.3. Wine Fermentation

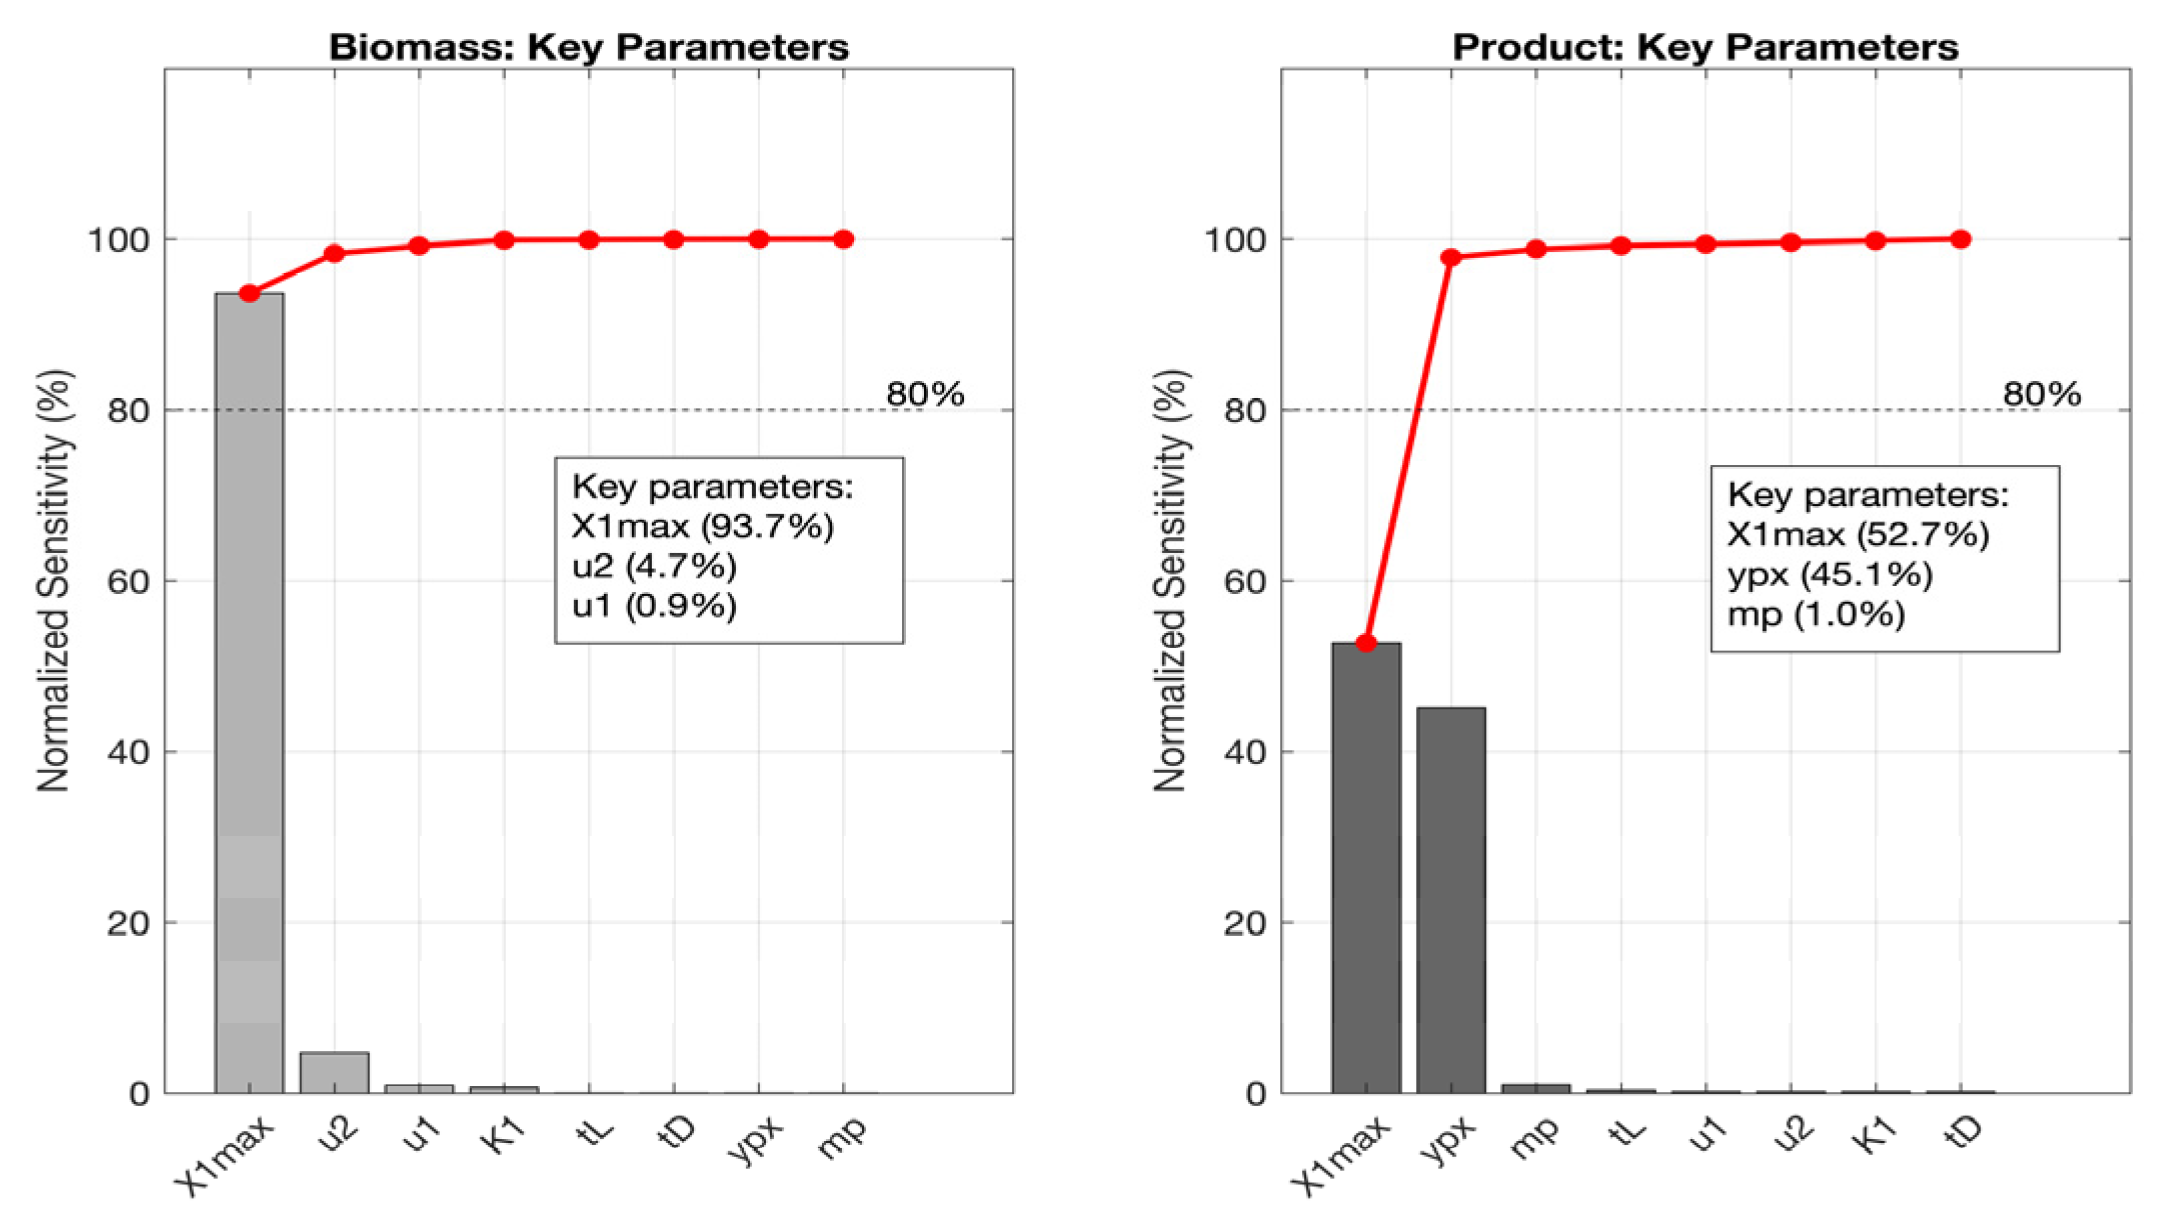
In wine fermentation, the biomass model is overwhelmingly sensitive to the x1max parameter (93.7%), reflecting the strong constraint imposed by the maximum viable cell concentration under this logistic growth regime. This makes x1max a critical control point for modeling yeast propagation in oenological environments. For product prediction, gain-related parameters were most relevant: yp/x (45.1%), x1max (92.7%), and mp (1.0%). The convergence of biomass and product sensitivity to x1max highlights the tight coupling between growth and metabolic activity in wine fermentation processes.

3.5.4. Beer Fermentation

In the beer system, sensitivity is more evenly distributed. Biomass formation was mainly affected by x1max (44.5%), followed by TD (27.9%) and TL (22.0%). These suggest that both growth rate and mortality timing are critical for modeling yeast propagation in brewing. For product formation, the model was most sensitive to the maintenance-associated production term mp (90%), followed by gain (80%) and death delay (60%). These results indicate that even low-intensity physiological processes such as maintenance metabolism significantly affect ethanol production in beer fermentation.

3.6. Simulations of Cellular Subpopulations Using the MALP Model

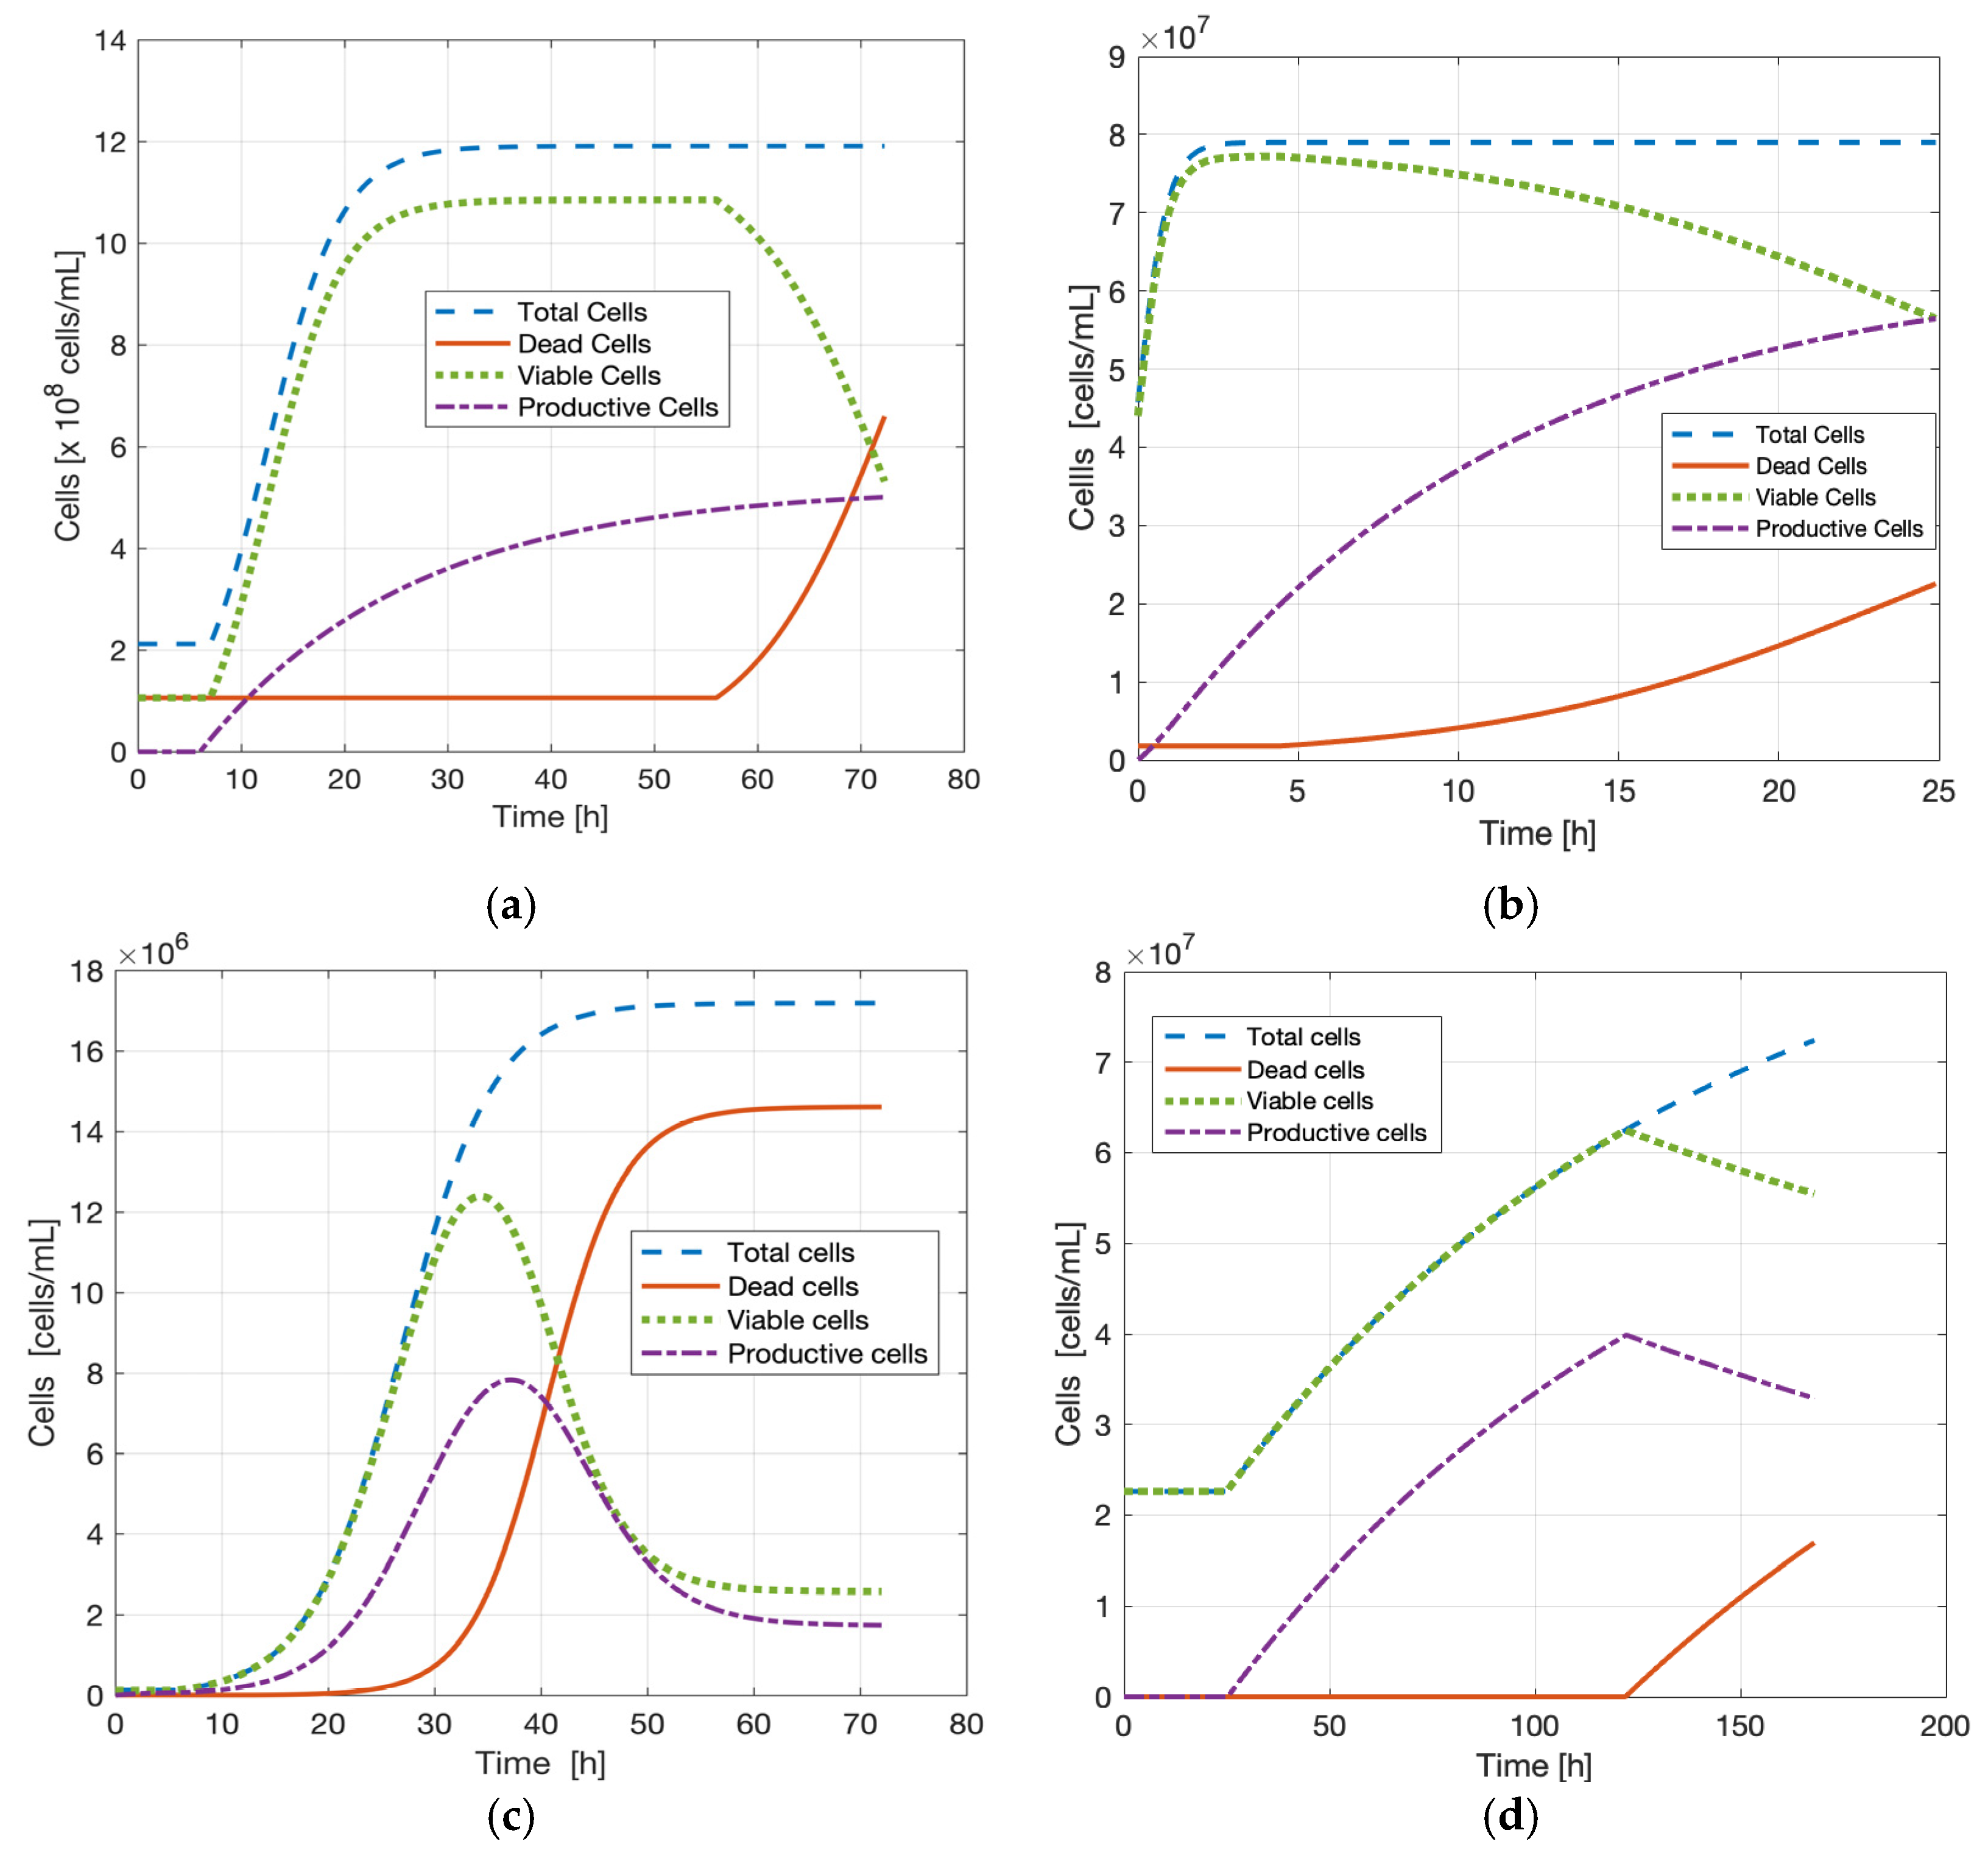
Based on the MALP model proposed in this study, simulations were carried out to describe the dynamics of all relevant cell populations: total cells, dead cells, viable cells, and productive cells, as shown in Figure 10:
This modeling approach allows for a more detailed understanding of microbial behavior during fermentation by distinguishing metabolically active (productive) cells from the rest of the viable population. While the dynamics of total, dead, and viable cells were evaluated based on typical growth and decay patterns, the productive cell population—introduced here as a novel state variable—aims to quantitatively capture a biologically observed phenomenon that, despite its empirical recognition, had not previously been formalized through a dedicated differential equation linked to cellular kinetics.

4. Conclusions

This study introduces the MALP model as a novel framework that decouples microbial viability from metabolic activity by explicitly defining a productive subpopulation. By doing so, the model resolves a long-standing conceptual gap in fermentation kinetics and provides a physiologically realistic representation of microbial function. Its versatility was confirmed through application to four distinct fermentation systems, each with specific kinetic and physiological challenges, underscoring the broad utility of the approach for both industrial and non-industrial strains. The MALP model thus offers immediate value for rational strain selection, process optimization, and predictive control of mixed microbial fermentations. Future research will focus on the direct experimental validation of productive cell fractions using flow cytometry with metabolic activity markers, enabling more accurate assessments of microbial fitness and strengthening the model’s predictive capacity for complex fermentation processes.

Author Contributions

Conceptualization, P.J.R.; Formal analysis, Y.P.M., M.C.G., and M.J.L.A.; Funding acquisition, Y.P.M.; Investigation, S.C.V.; Methodology, S.C.V., M.C.G., M.J.L.A. and M.N.P.; Software, P.J.R.; Supervision, G.J.E.S.; Validation, P.J.R. and G.J.E.S.; Visualization, M.V.M.; Writing—original draft, P.J.R., Y.P.M., S.C.V., M.C.G., M.J.L.A., M.N.P. and G.J.E.S.; Writing—review and editing, Y.P.M. and M.V.M. All authors have read and agreed to the published version of the manuscript.

Funding

This research was supported by PDTS National University of San Juan—Argentina and Agencia Nacional de Promoción Científica y Tecnológica (ANPCyT), grant number PICT 2019-02866.

Data Availability Statement

The original contributions presented in this study are included in the article. Further inquiries can be directed to the corresponding author.

Conflicts of Interest

The authors declare no conflicts of interest.

References

  1. Nigam, P.S. An Overview of Microorganisms’ Contribution and Performance in Alcohol Fermentation Processing a Variety of Substrates. Curr. Biotechnol. 2017, 6, 9–16. [Google Scholar] [CrossRef]
  2. Dimopoulou, M.; Dols-Lafargue, M. Exopolysaccharides Producing Lactic Acid Bacteria in Wine and Other Fermented Beverages: For Better or for Worse? Foods 2021, 10, 2204. [Google Scholar] [CrossRef]
  3. Delvigne, F.; Goffin, P. Microbial Heterogeneity Affects Bioprocess Robustness: Dynamic Single-Cell Analysis Contributes to Understanding of Microbial Populations. Biotechnol. J. 2014, 9, 61–72. [Google Scholar] [CrossRef]
  4. Moimenta, A.R.; Troitiño-jordedo, D.; Henriques, D.; Contreras-ruíz, A.; Minebois, R.; Morard, M. An Integrated Multiphase Dynamic Genome-Scale Model Explains Batch Fermentations Led by Species of the Saccharomyces Genus. mSystems 2025, 10, e01615-24. [Google Scholar] [CrossRef]
  5. Mu, X.; Zhang, F. Diverse Mechanisms of Bioproduction Heterogeneity in Fermentation and Their Control Strategies. J. Ind. Microbiol. Biotechnol. 2023, 50, kuad033. [Google Scholar] [CrossRef] [PubMed]
  6. Hartmann, F.S.; Udugama, I.A.; Seibold, G.M.; Sugiyama, H.; Gernaey, K.V. Digital Models in Biotechnology: Towards Multi-Scale Integration and Implementation. Biotechnol. Adv. 2022, 60, 108015. [Google Scholar] [CrossRef]
  7. My, R.; Gupte, A.P.; Bizzotto, E.; Frizzarin, M.; Antoniali, P.; Campanaro, S.; Favaro, L. Unveiling the Fitness of Saccharomyces Cerevisiae Strains for Lignocellulosic Bioethanol: A Genomic Exploration through Fermentation Stress Tests. New Biotechnol. 2025, 85, 63–74. [Google Scholar] [CrossRef] [PubMed]
  8. Vicente, J.; Benito, S.; Marquina, D.; Santos, A. Subpopulation-Specific Gene Expression in Lachancea Thermotolerans Uncovers Distinct Metabolic Adaptations to Wine Fermentation. Curr. Res. Food Sci. 2025, 10, 100954. [Google Scholar] [CrossRef] [PubMed]
  9. González-Figueredo, C.; Flores-Estrella, R.A.; Rojas-Rejón, O.A. Fermentation: Metabolism, Kinetic Models, and Bioprocessing; IntechOpen: Rijeka, Croatia, 2018; Volume 1. [Google Scholar]
  10. Nithya, A.; Misra, S.; Panigrahi, C.; Dalbhagat, C.G.; Mishra, H.N. Probiotic Potential of Fermented Foods and Their Role in Non-Communicable Diseases Management: An Understanding through Recent Clinical Evidences. Food Chem. Adv. 2023, 3, 100381. [Google Scholar] [CrossRef]
  11. Bai, F.; Cai, P.; Yao, L.; Shen, Y.; Li, Y.; Zhou, Y.J. Inducible Regulating Homologous Recombination Enables Precise Genome Editing in Pichia Pastoris without Perturbing Cellular Fitness. Trends Biotechnol. 2025, 43, 1385–1402. [Google Scholar] [CrossRef]
  12. Santos, M.F.; de Paula, S.C.S.E.; da Silva, L.M.; Filho, A.M.M.; Saraiva, S.H.; Teixeira, L.J.Q. Multi-Optimization of Operational Parameters for Malt Extract Production by Centrifugal Block Freeze Concentration. Innov. Food Sci. Emerg. Technol. 2023, 89, 103488. [Google Scholar] [CrossRef]
  13. Liu, H.; Li, N.; Wang, Y.; Cheng, T.; Yang, H.; Peng, Q. Study on Fermentation Kinetics, Antioxidant Activity and Flavor Characteristics of Lactobacillus plantarum CCFM1050 Fermented Wolfberry Pulp. Food Innov. Adv. 2024, 3, 126–134. [Google Scholar] [CrossRef]
  14. Mavrommati, M.; Economou, C.N.; Kallithraka, S.; Papanikolaou, S.; Aggelis, G. Simultaneous Improvement of Fructophilicity and Ethanol Tolerance of Saccharomyces cerevisiae Strains through a Single Adaptive Laboratory Evolution Strategy. Carbon Resour. Convers. 2024, 8, 100270. [Google Scholar] [CrossRef]
  15. Cao, K.-F.; Chen, Z.; Sun, Y.-G.; Huang, B.-H.; Shi, Q.; Mao, Y.; Wu, Y.-H.; Lu, Y.; Hu, H.-Y. Modeling and Optimization of Synergistic Ozone-Ultraviolet-Chlorine Process for Reclaimed Water Disinfection: From Laboratory Tests to Software Simulation. Water Res. 2023, 243, 120373. [Google Scholar] [CrossRef]
  16. Avery, S.V. Phenotypic Diversity and Fungal Fitness. Mycologist 2005, 19, 74–80. [Google Scholar] [CrossRef]
  17. Zacchetti, B.; Wösten, H.A.; Claessen, D. Multiscale Heterogeneity in Filamentous Microbes. Biotechnol. Adv. 2018, 36, 2138–2149. [Google Scholar] [CrossRef] [PubMed]
  18. Byrne, A.S.; Bissonnette, N.; Tahlan, K. Mechanisms and Implications of Phenotypic Switching in Bacterial Pathogens. Can. J. Microbiol. 2024, 71, 1–19. [Google Scholar] [CrossRef] [PubMed]
  19. Povolotsky, T.L.; Barazany, H.L.; Shacham, Y.; Kolodkin-Gal, I. Bacterial Epigenetics and Its Implication for Agriculture, Probiotics Development, and Biotechnology Design. Biotechnol. Adv. 2024, 75, 108414. [Google Scholar] [CrossRef]
  20. Müller, S.; Harms, H.; Bley, T. Origin and Analysis of Microbial Population Heterogeneity in Bioprocesses. Curr. Opin. Biotechnol. 2010, 21, 100–113. [Google Scholar] [CrossRef]
  21. Ruarte, P.J.; Leiva Alaniz, M.J.; Vergara, S.C.; Groff, M.C.; Pantano, M.N.; Mestre, M.V.; Scaglia, G.J.E.; Maturano, Y.P. Mathematical Modeling for Fermentation Systems: A Case Study in Probiotic Beer Production. Fermentation 2025, 11, 184. [Google Scholar] [CrossRef]
  22. Liu, Y.; Liu, Z.; Xiong, Z.; Geng, Y.; Cui, D.; Pavlostathis, S.G.; Chen, H.; Luo, Q.; Qiu, G.; Dong, Q.; et al. Synergistic Optimization of Baffles and Aeration to Improve the Light/Dark Cycle of Microalgae Photobioreactor for Enhanced Nitrogen Removal Performance: Computational Fluid Dynamics and Experimental Verification. Bioresour. Technol. 2024, 410, 131293. [Google Scholar] [CrossRef]
  23. Mannazzu, I.; Angelozzi, D.; Belviso, S.; Budroni, M.; Farris, G.A.; Goffrini, P.; Lodi, T.; Marzona, M.; Bardi, L. Behaviour of Saccharomyces cerevisiae Wine Strains during Adaptation to Unfavourable Conditions of Fermentation on Synthetic Medium: Cell Lipid Composition, Membrane Integrity, Viability and Fermentative Activity. Int. J. Food Microbiol. 2008, 121, 84–91. [Google Scholar] [CrossRef]
  24. Shimizu, C.; Araki, S.; Kuroda, H.; Takashio, M.; Shinotsuka, K. Yeast Cellular Size and Metabolism in Relation to the Flavor and Flavor Stability of Beer. J. Am. Soc. Brew. Chem. 2001, 59, 122–129. [Google Scholar] [CrossRef]
  25. Zajšek, K.; Goršek, A. Modelling of Batch Kefir Fermentation Kinetics for Ethanol Production by Mixed Natural Microflora. Food Bioprod. Process. 2010, 88, 55–60. [Google Scholar] [CrossRef]
  26. Wu, Z.; Sheintuch, M.; Xu, P. Population Dynamics of Engineered Microbes under Metabolic Stress and Reward in Batch and Continuous Reactors. Chem. Eng. J. 2024, 502, 158049. [Google Scholar] [CrossRef]
  27. González-Hernández, Y.; Perré, P. Building Blocks Needed for Mechanistic Modeling of Bioprocesses: A Critical Review Based on Protein Production by CHO Cells. Metab. Eng. Commun. 2024, 18, e00232. [Google Scholar] [CrossRef] [PubMed]
  28. Groff, M.C.; Scaglia, G.; Ortiz, O.A.; Noriega, S.E. Modification of the Luedeking and Piret Model with a Delay Time Parameter for Biotechnological Lactic Acid Production. Biotechnol. Lett. 2022, 44, 415–427. [Google Scholar] [CrossRef]
  29. Turon, V.; Baroukh, C.; Trably, E.; Latrille, E.; Fouilland, E.; Steyer, J.P. Use of Fermentative Metabolites for Heterotrophic Microalgae Growth: Yields and Kinetics. Bioresour. Technol. 2015, 175, 342–349. [Google Scholar] [CrossRef]
  30. Qiu, M.; Cao, P.; Cao, L.; Tan, Z.; Hou, C.; Wang, L.; Wang, J. Parameter Determination of the 2S2P1D Model and Havriliak–Negami Model Based on the Genetic Algorithm and Levenberg–Marquardt Optimization Algorithm. Polymers 2023, 15, 2540. [Google Scholar] [CrossRef]
  31. Fernández, C.; Pantano, N.; Godoy, S.; Serrano, E.; Scaglia, G. Optimización de Parámetros Utilizando Los Métodos de Monte Carlo y Algoritmos Evolutivos. Aplicación a Un Controlador de Seguimiento de Trayectoria En Sistemas No Lineales. Rev. Iberoam. Autom. Inform. Ind. 2018, 16, 89. [Google Scholar] [CrossRef]
  32. Scaglia, G.; Serrano, M.E.; Albertos, P. Linear Algebra Based Controllers; Springer International Publisher: Berlin/Heidelberg, Germany, 2020. [Google Scholar] [CrossRef]
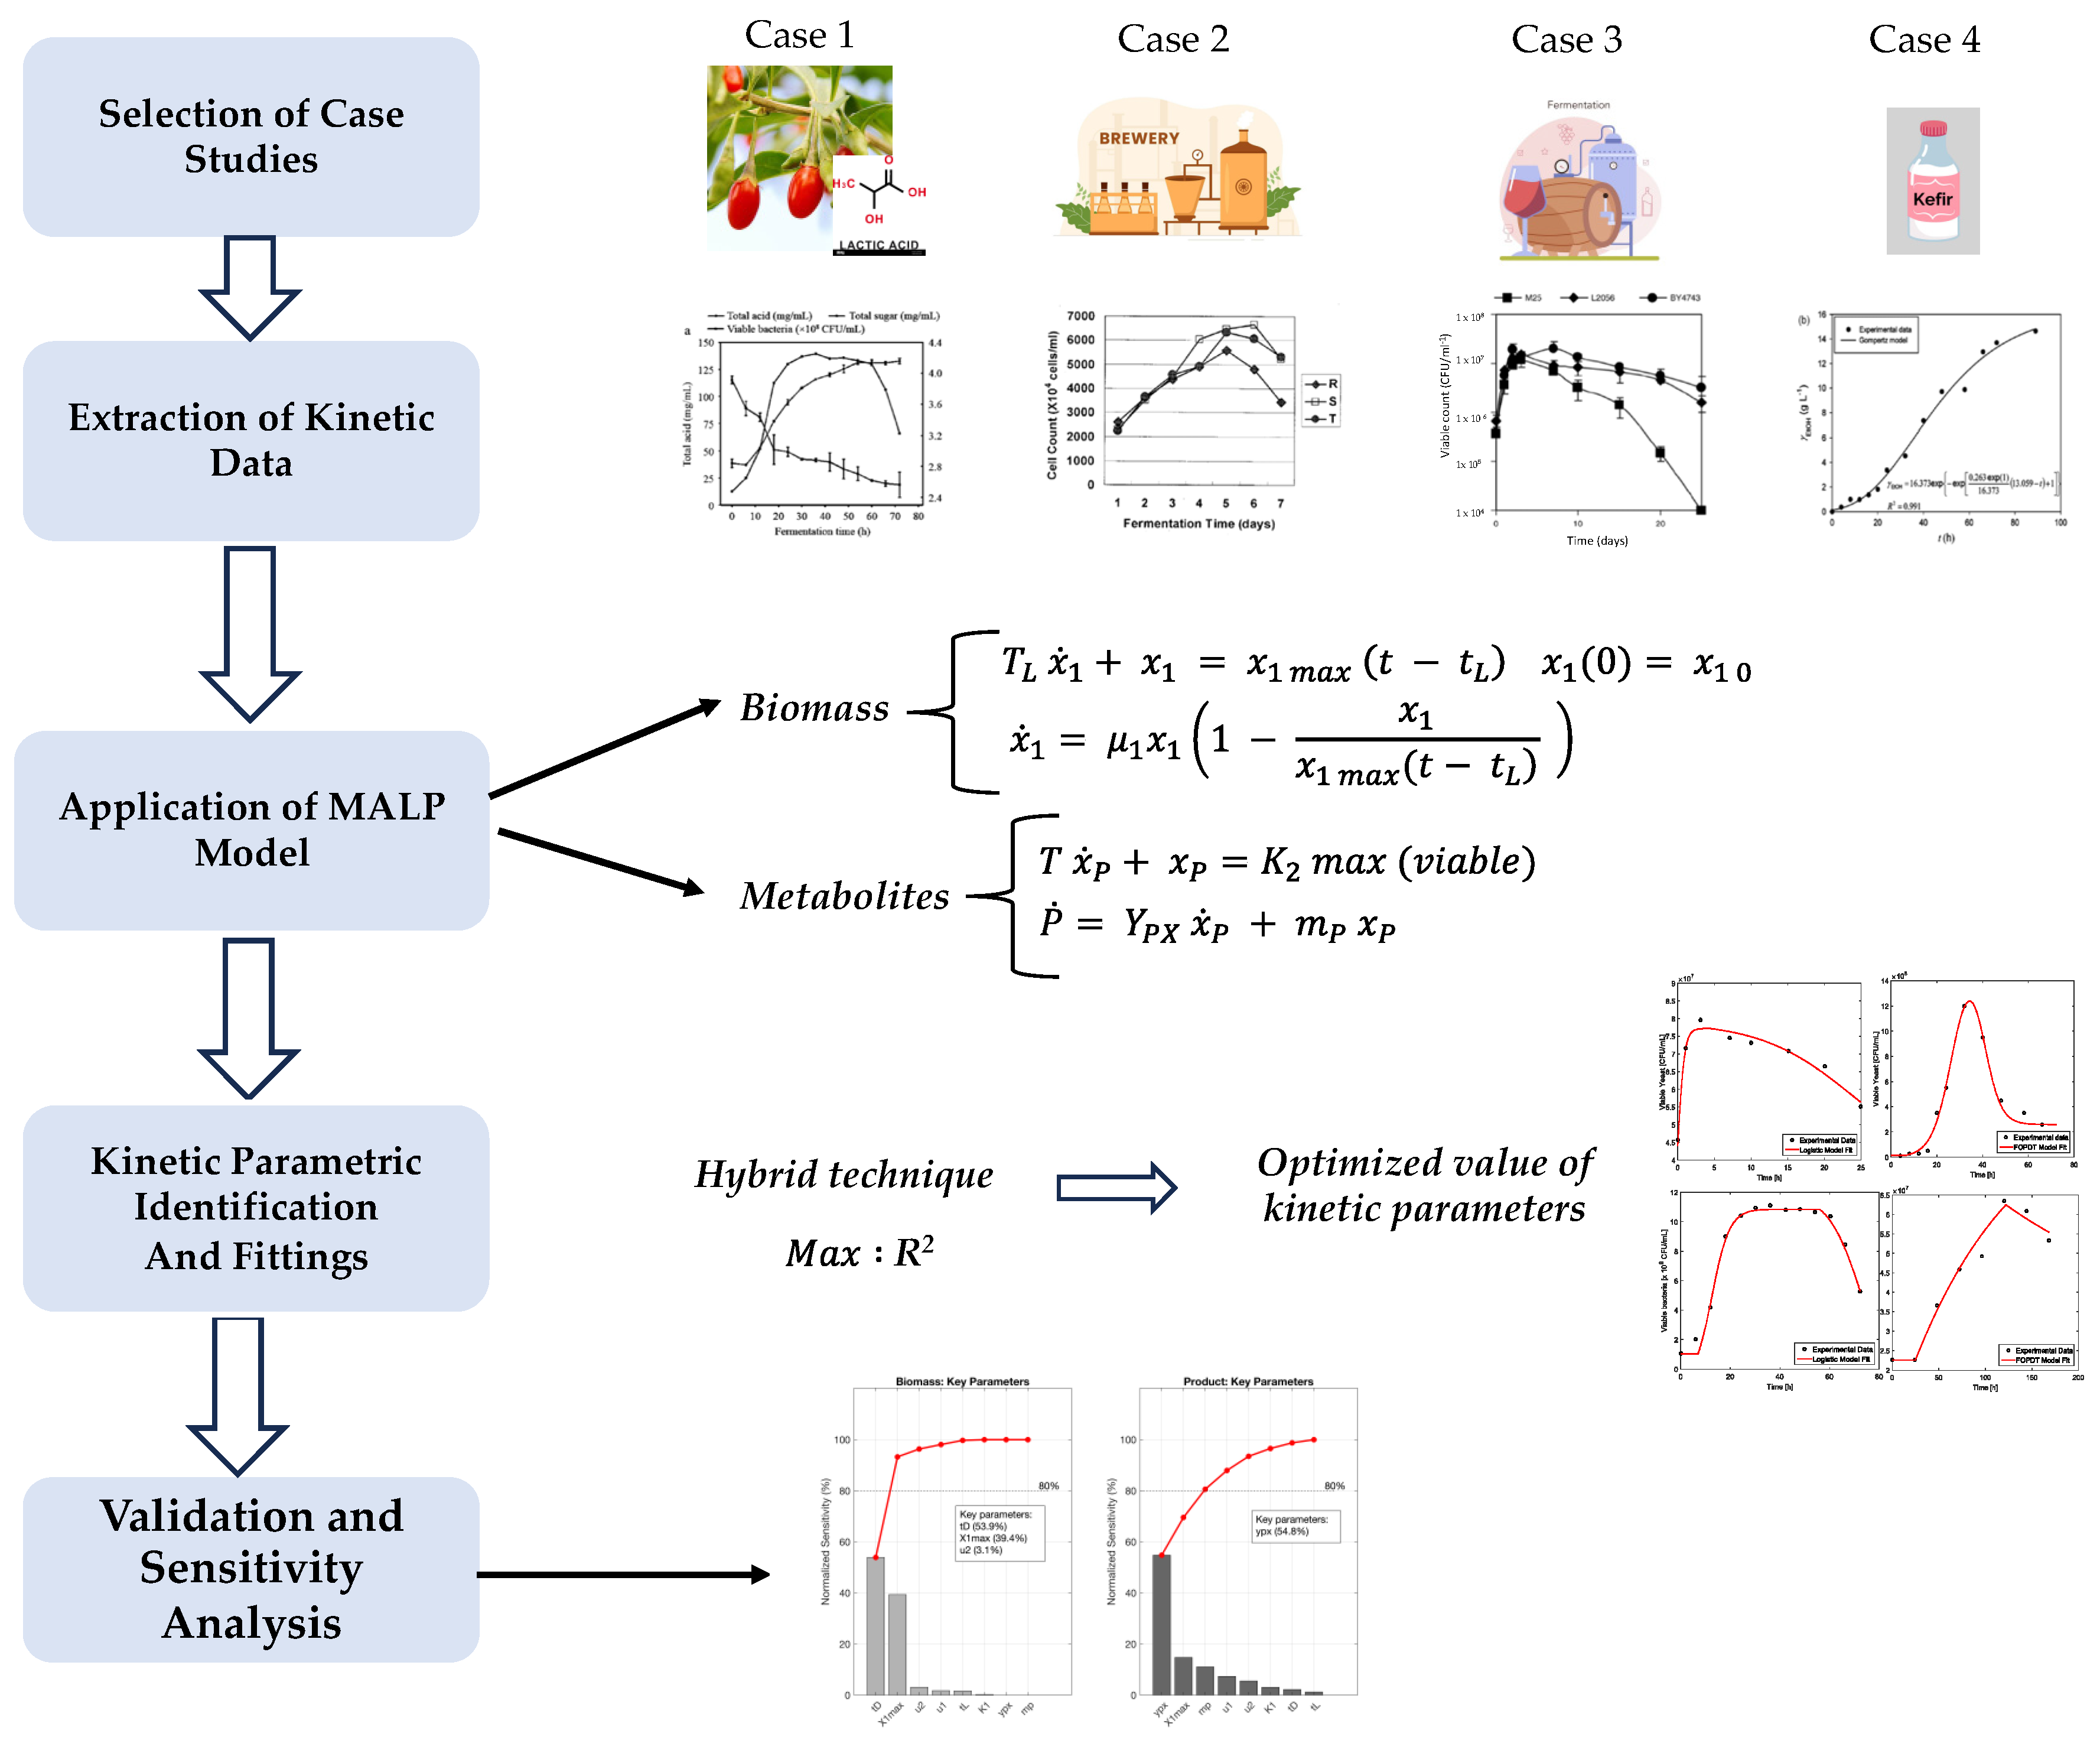
Figure 1. Methodological workflow for the study of population dynamics in fermentation systems.
Processes 13 03018 g001
Figure 2. Hierarchical structure of microbial populations in the proposed fitness-based model. The total cell population (x1) comprises both viable and dead cells. The viable cell population (xv) is a subset of total cells (xv = x1x2). Crucially, only a fraction of viable cells are metabolically active at any given time; this productive subpopulation (xP) is solely responsible for metabolite synthesis, decoupling biosynthetic output from total and viable biomass measurements.
Processes 13 03018 g002
Figure 3. Integrated framework for productive cell population modeling.
Processes 13 03018 g003
Figure 4. Time-course profiles of microbial biomass during four fermentation processes. (a) Logistic model fits lactic acid fermentation data. (b) Logistic model fitted to wine yeast growth. (c) FOPDT model applied to kefir yeast dynamics. (d) FOPDT model fitted to yeast biomass data in beer fermentation. Experimental points are shown in black; model simulations are indicated with red lines.
Processes 13 03018 g004
Figure 5. Experimental (black dots) and simulated (red lines) primary metabolite production using the MALP MODEL: (a) lactic acid fermentation, (b) ethanol in wine fermentation, (c) ethanol in kefir fermentation, and (d) ethanol in beer fermentation.
Processes 13 03018 g005
Figure 6. Local sensitivity analysis for the lactic acid fermentation model. The Pareto chart ranks model parameters based on their influence on predicting (left) biomass and (right) lactic acid production. Parameters beyond the 80% cumulative influence threshold (dashed line) are deemed most critical. Biomass dynamics are predominantly sensitive to the death delay time (tD) and maximum capacity (x1max), while product formation is primarily governed by the biomass-to-product yield coefficient (yp/x).
Processes 13 03018 g006
Figure 7. Local sensitivity analysis for the kefir fermentation model. The Pareto chart illustrates the influence of parameters on (left) biomass and (right) ethanol production. The sensitivity profile is dominated by time-delay parameters (tD, tL), reflecting the complex dynamics and physiological adaptation phases inherent to the mixed microbial consortium (lactic acid bacteria and yeasts) in kefir grains.
Processes 13 03018 g007
Figure 8. Local sensitivity analysis for the wine fermentation model. The Pareto chart shows parameter influence on (left) biomass and (right) ethanol production for S. cerevisiae. The model is overwhelmingly sensitive to the maximum attainable biomass (x1max), indicating that both growth and metabolic output are strongly constrained by the carrying capacity of the grape must environment, typical of monoculture wine fermentations.
Processes 13 03018 g008
Figure 9. Local sensitivity analysis for the beer fermentation model. The Pareto chart displays the relative influence of parameters on predicting (left) biomass and (right) ethanol production. In contrast to other systems, ethanol synthesis is most sensitive to the maintenance-associated production term (m~p~), highlighting the significance of non-growth-associated metabolism and physiological maintenance processes in brewing yeast fermentations.
Processes 13 03018 g009
Figure 10. Comparative simulation of cell population profiles (x1, x2, xv, xP) for the four fermentation systems studied using the MALP model. (a) Lactic acid fermentation, (b) wine fermentation, (c) kefir fermentation, and (d) beer fermentation.
Processes 13 03018 g010
Table 1. Comparison of model parameters and statistical indicators for different fermentation systems fitted using Logistic and FOPDT models.
Fermentation System
Parameters Lactic Acid [13]Lactic Wine [23]Ethanol Kefir [25]Ethanol Beer [24]
L. plantarumS. cerevisiae Wine Strain/Grape MustKefir Microbial Consortium/SUCROSES. cerevisiae Brewing Strain/Wort
Logistic Logistic FOPDTFOPDT
tL7 h0 h11.9 h115 h
TL--14.9 h25 h
tD56 h4.4 h33.1 h122 h
TD--21.2 h140 h
μ10.281.94--
μ20.1460.161--
X1,max1.19 × 1087.9 × 1073.05 × 1077 × 107
K10.950.52--
LOF1.180.010.10.08
MSE0.090.0010.00820.01
F-statistic1.361.3511.2001.37
p-value0.31010.3620.38930.355
R299.13%97.50%98.39%97.53%
Table 2. Product formation parameters and statistical metrics for four fermentation systems.
Fermentation System
Parameters Lactic Acid [13]Ethanol Wine [23]Ethanol Kefir [25]Ethanol Beer [24]
L. plantarumS. cerevisiae Wine Strain/Grape MustKefir Microbial Consortium/SucroseS. cerevisiae Brewing Strain/Wort
Logistic Logistic FOPDTFOPDT
yp/x15.331.25 × 10−66.0 × 10−82.8 × 10−7
mp0.001781.10 × 10−83.93 × 10−84.98 × 10−9
LOF126.750.6510.4112.08
MSE9.758.4410.74351.51
F-statistic1.21.5341.4264.63
p-value0.38510.34440.2740.0422
R299.16%99.13%97.12%99.65%
Disclaimer/Publisher’s Note: The statements, opinions and data contained in all publications are solely those of the individual author(s) and contributor(s) and not of MDPI and/or the editor(s). MDPI and/or the editor(s) disclaim responsibility for any injury to people or property resulting from any ideas, methods, instructions or products referred to in the content.